CHARACTERISTICS OF EMERGENCY DEPARTMENT ATTENDANCES IN FOUR IRISH TEACHING HOSPITALS Samantha Smith Working Paper No. 26 Research Programme on “Health Services, Health Inequalities and Health and Social Gain” This programme is supported by the Health Research Board, and is being carried out by researchers at the Economic and Social Research Institute, University College Dublin and the University of Ulster. • Working Papers are not for publication and should not be quoted without the prior permission of the author(s) • Economic & Social Research Institute, Whitaker Square, Sir John Rogersons Quay, Dublin 2 and Health Policy & Management, 36 Fenian Street,Trinity College, Dublin 2. Correspondence to: Samantha Smith . Email: [email protected]
Transcript
CHARACTERISTICS OF EMERGENCY DEPARTMENT ATTENDANCES IN FOUR IRISH
TEACHING HOSPITALS
Samantha Smith
Working Paper No. 26
Research Programme on “Health Services, Health Inequalities and Health and Social
Gain”
This programme is supported by the Health Research Board, and is being carried out by
researchers at the Economic and Social Research Institute, University College Dublin and the University of Ulster. •
Working Papers are not for publication and should not be quoted without the prior permission of the author(s) • Economic & Social Research Institute, Whitaker Square, Sir John Rogersons Quay, Dublin 2 and Health Policy & Management, 36 Fenian Street,Trinity College, Dublin 2. Correspondence to: Samantha Smith . Email: [email protected]
Characteristics of emergency department attendances in four Irish teaching hospitals
1. Introduction This paper focuses on the characteristics of emergency department attendances in four large
teaching hospitals in the Dublin area. The objectives are to investigate key factors influencing
the decisions that are made at different stages of an episode of emergency care.
Emergency department utilisation is attracting much attention in the Irish health system. In
recent years overcrowding at emergency departments throughout the country has sparked
widespread media and popular reaction. There is concern in Ireland with the increasing
proportion of inpatient admissions originating from the emergency department. This has
implications for elective procedures in acute hospitals. There is evidence that elective procedures
for surgical patients are being cancelled to make room for emergency medical patients (DOHC,
2002). Inter-linkages between emergency and primary care are also attracting more attention,
particularly in the context of the national primary care strategy (DOHC, 2001) and developments
in out-of-hours general practitioner (GP) services.
Despite this widespread interest, there is an important lack of baseline information on the
characteristics of patients who use emergency department services in the country (Comhairle na
nOspidéal, 2002). In response to this problem, a separate paper has provided an up to date profile
of emergency department patients in the Dublin area. The paper identifies key factors associated
with emergency department (ED) utilisation. These include: males, older age groups; retirement;
home duties; unemployment and health care entitlement status.
The profile gives a first indication of what factors might be contributing to some of the observed
challenges in emergency care and provides focus for further analysis. This paper takes the next
step to look at the role of these factors within the ED. Once the decision has been taken to seek
emergency care, the patient can choose whether to self refer or to be referred by a GP. The level
of urgency of the presenting complaint can also vary. In the ED, there are a number of ways in
which a patient can be treated and discharged. The patient can also choose how many times to
visit for health care.
These decisions can be interpreted as a series of steps and ideally they could be modelled as a set
of sequential choices, from the initial choice of health care provider (emergency versus primary
care) through to discharge destination. To achieve this, the model requires a set of equations
where at least one independent covariate is unique to each equation. In the data available for this
study the number of covariates is limited and this sort of structural analysis is not feasible.
As the next best alternative, some of these choices can be modelled separately and tentative
linkages between the steps can be investigated. Available data permit assessment of the
following steps in a patient’s episode of emergency care: source of referral; level of urgency;
discharge patterns; frequency of attendance. Individual models investigate key characteristics
that influence each of these steps, with particular focus on the characteristics that are known to
influence higher emergency department utilisation.
Section 2 presents background information on how emergency department care has been
modelled in the literature. The previous paper identified interesting variations in ED utilisation
by health care entitlement status. To inform further discussion of the role of entitlement status in
ED utilisation, Section 3 outlines the financial incentives facing the different entitlement
categories. Section 4 introduces the data, and Section 5 outlines the econometric models. Results
are presented in Section 6. Discussion and conclusions are given in Sections 7 and 8.
2. Background Literature This section introduces background literature, where available, to each of the steps in the ED
process that will be investigated in the analysis below. Emergency care in Ireland is delivered in
public hospital emergency departments. In 2000, there were 40 emergency departments in
Ireland1.
Attendance at an ED can be interpreted as one step in a sequential process of health care
utilisation (Cunningham et al., 1995). The first step involves a decision on whether or not to seek
medical care (a contact decision). Conditional on this first step, the second involves a decision on
where to go to receive the care required (a location decision). A third step could refer to the
number of times in a specified period that medical attention will be sought (a frequency
decision). Other ‘steps’ that will be looked at in this paper include the urgency of the presenting
complaint which a patient presents with, and the choice of discharge destination made on behalf
of (e.g. admission) or by (e.g. self-discharge) the patient.
There are many examples in the literature of analyses using this type of sequential decision
making process. Cunningham et al. (1995) estimated the probability of having any non-urgent
outpatient visit as a first step, and second estimated the probability of that visit taking place in an
ED. In the Irish setting, Nolan and Nolan (2004) have modelled demand for GP care using a two-
step process, estimating first the factors influencing the likelihood of seeking primary care, and
second the factors influencing the number of GP visits once a first visit has been made. The
focus of the paper on emergency department utilisation was at the initial contact stage,
identifying key characteristics of those who make contact with emergency services in Ireland,
specifically in the Dublin area.
The location decision is a reminder that modelling demand for GP care or for emergency care on
its own provides only part of the story. There are many cases where patients choose to present at
an ED but could have been adequately treated by a GP. Others may use a GP as the first port of
call but find themselves referred on to the ED as the more appropriate location for their care. In
Ireland, data are not yet available to investigate demand for emergency and primary care within 1 More recently, Vhi Healthcare opened the first private minor injury unit in Dublin and others are in the pipeline.
the one sequential framework. However, existing data sources do permit some partial analysis of
the factors influencing the different steps in the decision process.
To model the location decision would require descriptive data on choice of care considerations
by both GP and ED users. Instead, data are available on observed behaviours and these can be
linked to assumptions about underlying choices. The dataset on ED attendances identifies the
referral source for each patient. These data include the full sample of those who chose to attend
the ED as their first option, but only a sub-sample of those who chose to attend a GP as their first
option (i.e. those who were referred on to the ED). The full sample of those choosing their GP
first would also need to include those who were not subsequently referred to the ED. Although
incomplete, the data do permit investigation of factors influencing whether an individual chose to
attend the ED or the GP first. This is the focus of Model 1.
The decision to seek medical attention and the choice of health care provider is linked with the
level of urgency of the complaint. Cases where there is little or no scope for choice refer to
serious emergencies where immediate care is required (e.g. cardiac arrest). For less immediate
needs, there may be more time to choose. Patients attending an ED for minor, non-urgent visits
attract considerable attention in the literature. Such visits are considered inappropriate for
emergency care leading to unnecessary overcrowding and inefficient use of resources. The
urgency of complaint is the focus of Model 2.
Estimates of the proportion of ED attendances that are inappropriate range from 6% to over 85%.
This is partly due to differences in study populations, study designs and conflicting views on the
definition of an inappropriate ED visit (Lowy et al., 1994). Several studies have defined an
inappropriate/non-urgent visit on the basis of clinical diagnosis yet this overlooks other relevant
factors (Lowy et al., 1994). A complaint may be diagnosed as treatable in a general practice
setting but the facilities needed to reach that diagnosis, however minor the condition, may not be
available in general practice (e.g. ankle sprain which may have needed an x-ray for diagnosis).
The patient’s own perspective on what constitutes an urgent medical problem is a crucial
determinant in health-seeking behaviour (Padgett and Brodsky, 1992). Patient perceptions of the
proper role of an ED, and accessibility and quality of GP services (both real and perceived) are
other important factors (Lowy et al., 1994).
Given the variations in definition, common characteristics of inappropriate ED patients are
difficult to identify from the literature. High risk factors that have been identified in a range of
studies (mainly from the US) include poor socioeconomic status (low income, low educational
attainment), younger age groups, and minority racial status (Walsh, 1990; Cunningham et al.,
1995; Phelps et al., 2000). There is conflicting evidence on the role of medical insurance. Some
studies have found that individuals without insurance are more likely to use the ED for non-
emergency care, others have found the opposite, and others have found no difference (Weber et
al., 2005).
Availability of alternative sources of care is assumed to have important implications for
inappropriate use of emergency care but this is not a straightforward relationship (Weber et al.,
2005). Studies from the US have shown that the majority of non-urgent patients attend the ED
during normal working hours (9am-5pm) when alternative primary care providers are more
readily available (Northington et al., 2005). Increased access and availability of alternative
sources of care have not been found to automatically trigger reductions in inappropriate use of
emergency care (e.g. Krakau and Hassler, 1999). Rather it is regular use of these alternatives that
is important. Gill et al. (2000) found that having continuity with a specific alternative provider
was significantly associated with decreased likelihood of ED utilisation. This has implications
for policy, suggesting that providing patients with a primary care service is not enough in itself
and there is need to promote continuity with that service. Rask et al. (1998) also note that the
benefits of continuous care with a primary care provider include the diversion of patients away
from the ED.
Inappropriate ED users compete for emergency resources with other patients who have greater
need for acute hospital care (Lowy et al., 1994). Use of technologically sophisticated and input-
demanding emergency services for treatment of an increasing number of less complex and less
severely ill patients is technically inefficient (Puig-Junoy et al., 1998). The cost of treatment in
an ED has been found to be higher than in general practice for the same presenting complaint.
ED staff tend to use more resources than do GPs for comparable non-acute cases (Lowy et al.,
1994; Murphy et al., 1996). From a patient perspective, ED consultation may not be appropriate
to their needs. ED doctors are less likely than GPs to discuss social and work-related topics, use
a less ‘patient-centred’ approach, and spend less time listening to patients (Lowy et al., 1994).
Murphy (1998) outlines three strategies used by health services around the world to respond to
the perceived problems of inappropriate ED attendances. These include strategies to decrease the
number of patients attending EDs (e.g. introducing copayments); measures to refer inappropriate
patients to other health care providers; and improvements in triage to provide care more
appropriate to the needs of the patients attending. Murphy concludes that the first strategy has
not worked as the demand for emergency care has continued to expand, and efforts to refer
inappropriate patients have been shown to be unsafe. The third strategy offers more potential for
improving the match between patients and services. “Rather than vainly attempting to make the
patients more appropriate to the service, future initiatives should concentrate on making the A&E
[Accident and Emergency] service more appropriate to the patient” (Murphy, 1998: 36).
Discharge destination provides additional information on the nature of health problems with
which people present to the ED. Inpatient admission from the ED has been used as an indicator
of acuity in studies investigating appropriate and inappropriate ED utilisation (e.g. Cunningham
et al., 1995). In Ireland, there is growing concern with increased pressures to admit patients from
emergency departments (DOHC, 2002). This has implications for elective procedures in acute
hospitals. There is evidence that elective procedures for surgical patients are being cancelled to
make room for emergency medical patients (DOHC, 2002). While there is no official standard
for the rate of admissions from an emergency department, displacement of predictable and
planned procedures with an increasing proportion of unpredictable and unplanned admissions is
a source of inefficiency in a hospital.
Factors influencing the rate of admissions from emergency departments are not fully understood
in the Irish context. National reports propose a range of factors that are likely to be involved but
more detailed analysis is not available. Walsh et al. (2004) highlight the high proportion of
elderly in inpatient admissions from Dublin based emergency departments. There is anecdotal
evidence that the ED is seen as the main route through which a patient can secure an inpatient
bed. Thus, GPs and other health professionals may choose to refer their patient to the ED who
should otherwise have been admitted electively (DOHC, 2002). Dunne (1997) suggested that
some GPs refer patients to the ED in an effort to by-pass long outpatient waiting lists. These are
complex issues and are difficult to uncover from available data. However, a useful first step is to
provide a baseline profile of factors influencing the likelihood of being admitted from an ED.
This is the focus of Model 3.
Less attention has been given in the literature to the practice of self-discharging from emergency
departments. This may be another indicator of less urgent cases, or a sign of overcrowding and
inefficiency in the emergency department. The degree to which patients are self-discharging, and
factors associated with this practice, are the focus of Model 4.
Finally, the frequency with which patients are visiting EDs provides additional information on
how people are using emergency services and for what reasons. Several studies have shown that
a relatively small number of emergency department patients are responsible for a
disproportionate number of ED visits (Blank et al., 2005). In a Swedish setting, Hansagi et al.
(2001) estimated that 4% of ED patients accounted for 18% of the total number of ED visits.
Studies from a range of countries (including France, Ireland, UK, Sweden, US, Canada) have
identified consistently similar profiles for frequent users of emergency services (Byrne et al.,
2003). These patients tend to be males, from poor socioeconomic backgrounds, with
psychosocial problems, and who experience significantly increased morbidity and mortality (e.g.
Byrne et al., 2003; Lang et al., 1997; Blank et al., 2005; Griswold et al., 2005). Alcohol and drug
problems are also common factors for these patients (Lynch and Greaves, 2000). Byrne et al.
(2003) found that these ED patients are also likely to be relatively intensive users of other
alternative sources of health care. The authors concluded that it is not the case that these frequent
attenders are using the ED because of lack of access to alternative primary care services.
Frequent attenders are believed to place a disproportionate burden on ED services. Lynch and
Greaves (2000) observed a small group of regular attenders representing less than 2% of total
attendances to an ED accounting for much greater amounts of doctors’ and nurses’ time relative
to other ED patients. The profile of frequent attenders in Ireland and their relative burden on ED
services is based on data from the 1990s and from single site hospitals. The focus of Model 5 is
to provide a more robust profile of regular ED attenders.
3. Entitlement incentives In the literature on ED utilisation, evidence on the influence of insurance has been mixed. In
Ireland, private health insurance does not provide the full picture of medical coverage for the
population and it is more appropriate to focus on entitlement.
There are two broad categories of eligibility for public health services. Category One are eligible
for free access to public health services, including primary care, public hospital inpatient and
outpatient care, and other community health services. Category Two are eligible to receive
public hospital services at nominal charges and are provided with assistance towards the cost of
medicines2 but are required to pay privately for primary care. Eligibility for the two categories is
determined primarily on the basis of income. Category One eligibility is granted to persons
earning an income below a specified threshold level. A medical card is issued to these persons,
covering the individuals and their dependents. Since 2001, all people aged 70 years and over are
also entitled to a medical card, regardless of income (Government of Ireland, 2001).
Many people in Category Two purchase supplementary private health insurance and a small
proportion in Category One also hold private health insurance as well as a medical card. Private
health insurance secures consultant provided care and other hotel benefits (e.g. private or semi-
private room) in the acute hospital system. An increasing range of insurance schemes also
provide assistance towards primary care.
Thus the population can be categorised into four entitlement groups: medical card holders;
privately insured; individuals with both medical card and private health insurance (‘duplicate
cover’); individuals with neither medical card nor private health insurance (‘no additional
cover’)3. In 2004, over 28% of the population held a medical card, 50% had private health
insurance and just over 24% had no additional cover. A small proportion (3%) held duplicate
cover from private health insurance and a medical card (NESF, 2002; Amárach Consulting,
2 The Drug Refund scheme reimburses payments above €85 per month. The Long Term Illness Scheme fully reimburses drug payments for specified long term illnesses. 3 For ease of presentation the four groups are referred to in the text as follows: medical card holders, privately insured, duplicate cover (or med card/privately insured), no additional cover (or non-covered).
There are a priori reasons why entitlement might influence the ways in which individuals make
use of emergency services in Ireland. Table 1 outlines the financial incentive structures facing
each of the four entitlement categories for accessing health services in the Irish system.
Table 1 Financial costs of key health services by entitlement category Alternatives
Entitlement Emergency dept. GP Private1 Specialists Inpatient care
Medical card FREE unconditional FREE CHARGE FREE unconditional
CHARGE variable CHARGE CHARGE variable (public or private)
1Access to public specialists is based on a referral process. 2The terms fixed and variable in the table refer to fixed/variable across providers. 3Assumes that private health insurance does not cover primary care. This applies to the majority of private insurance policies although would need to be revised in future years.
In the initial choice to seek care, medical card holders (with and without private health
insurance) face no charges except in the case of private specialist care, where referral is usually
required. Controlling for all other factors (i.e. health status, socio-economic status etc.), the
financial incentives are in favour of higher health care utilisation by medical card holders relative
to non medical card holders.4
Individuals with private health insurance face fewer charges for secondary health care (specialist
and inpatient care) relative to those with no additional cover. As these sources of care usually
require referral, cetaris paribus, the financial incentives suggest very little difference between
the privately insured and those with no additional cover in the initial choice to seek care.
4 Individuals who hold duplicate cover from private health insurance and a medical card tend to be from the group aged 70 and older who became eligible for a medical card in 2001 without means testing. Thus these individuals have seen an effective reduction in the cost of health services. Dynamic analysis might show an increase in health care utilisation by this group since 2001.
If the decision is made to seek care, financial incentives may influence the next choice on where
to go. The focus of this discussion is on the choice between emergency and primary care5. This
first assumes that there is time for choice (i.e. not an immediate emergency), and that there are
alternative sources of care in the area.
Medical card holders (with and without private health insurance) are financially indifferent
between emergency and GP care as both are free. For the non medical card holders (privately
insured and non covered), attendance at an ED is charged at a fixed rate (currently €60) for
anyone presenting without a medical card. This fee is waived if the patient has a referral letter
from a GP, or if the patient is subsequently admitted (whereupon they become liable for inpatient
fees where applicable). GP fees are charged for all non medical card holders at a market rate.
If the GP charge is equal to or close to that of the ED, in financial terms, the non medical card
holders will be indifferent between the two. Where the GP charge is lower than €60, the financial
incentives favour attending the GP first and vice versa. Published estimates of GP charges range
from €35 to €36 (Indecon, 2003). However, anecdotal estimates are much higher than these. GP
out-of-hours co-operatives in the Dublin area charge €50 per visit suggesting this is closer to the
average GP charge for Dublin. This indicates that the gap between GP charges and the ED
charge is not large. Controlling for all other factors, individuals with private health insurance or
with no additional cover are likely to be financially indifferent between emergency and primary
care.
5 Individuals may refer themselves directly to private consultant specialists. The financial incentives for choosing between primary care and private consultant care, or between emergency care and private consultant care, vary by entitlement group. However, direct referral to consultant care is not understood to be common practice in Ireland and is not the focus of this paper.
4. Data Data on ED attendances have been collected from four hospitals located in Dublin. These are
large teaching hospitals whose inpatient bed capacity range from 471 to 753 (Health Service
Executive, 2007). The four hospitals were purposively chosen to ensure representation of the
different demographic and socio-economic profiles of local areas within Dublin.
The adult emergency departments in these hospitals each receive more than 30,000 new
attendances per year and mainly cater for patients aged 15 and over6.
Following registration at reception, patients (including those who are referred by a GP) are
assessed by a triage nurse and treated thereafter in accordance with the level of urgency of the
complaint. The four hospitals operate the Manchester Triage Scale which rates the urgency of a
case on a five-point likert scale from 1 (immediate) to five (non urgent) (Manchester Triage
Group, 1997).
The ED dataset includes all attendances to the emergency departments during the calendar year
2004. Table 2 outlines the demographic, administrative and clinical variables available for each
observation. There are some variations in availability of specific variables. Entitlement was
routinely collected in 2004 in two out of the four hospitals. Marital status was collected in three
out of the four hospitals.
6 Public information on the websites of adult and paediatric hospitals indicates a cut-off age of under 15 for paediatric cases. This is further confirmed in the emergency department patient level data where less than 3% of patients are aged under 15 in all four hospitals.
Table 2 Data collected from four Dublin teaching hospitals (all attendances Jan-Dec 2004) Variable Hospital 1 Hospital 2 Hospital 3 Hospital 4
Age Gender Marital Status Not available Occupation
Demographic
Area of Residence. Date and Time of Attendance Entitlement status Not available Not available Source of Referral Discharge Destination
Administrative
New/Return Distance from hospital (minutes)1
Presenting Complaint Clinical Triage Category 1 Estimated time taken to reach the ED from patients’ area of residence, based on data provided by the Small Area Health Research Unit (SAHRU).
Two levels of ED data are identified. Patient level data identify the demographic and socio-
economic characteristics of the patients attending the EDs during the year by removing duplicate
cases where a patient has attended more than once. Attendance level data allows identification of
the clinical and administrative details of each ED visit. The analysis in this paper is based on
attendance level data.
5. Econometric Models
Estimation sample The ED attendance level data from the four hospitals are combined into one dataset. To identify
important variations across hospitals, hospital identifiers are included as dummy variables in the
analyses. Five separate models are estimated using these data. To ensure consistency with the
analysis on utilisation in the previous paper, the estimation sample is restricted to patients who
report an area of residence within the respective catchment areas of the receiving hospitals, and
to new attendances. The small proportion of patients under the age of 15 is also excluded from
the analysis7. Observations with missing details on any of the covariates in the regression
equation are automatically omitted from the analysis. Thus there are small variations in the
sample size from one model to another depending on which independent covariates are included.
The full estimation sample size based on data from all four hospitals ranges from 81,667 to
88,198.
In each hospital, a small proportion of patients attended more than once during the year. To
control for clustering on individuals with more than one visit, the data are analysed as a panel,
with random effects. The time variable in the panel refers to the day of attendance8, numbered
from 1 (January 1st) to 366 (December 31st)9. The panel is unbalanced given that the majority of
patients attended only once in that time period.
Theoretical framework The models estimated using the above data are all investigating a particular aspect of health care
utilisation (e.g. urgency of complaint; mode of referral; frequency of attendance). In the health
services literature there is frequent reference to the works by Andersen et al. (Andersen and
Newman, 1973; Aday and Andersen, 1974) which provide a framework for investigating access
to and utilisation of health care services. This framework is used to guide the selection of the
independent covariates in each of the following models. Individual determinants of health care 7 These are adult emergency departments and patients younger than 15 attending these departments would not be representative of their age groups. 8 A small proportion of patients had more than one attendance within the same day. These are omitted to allow construction of the panel data set. 9 2004 was a leap year.
utilisation include predisposing, enabling and need factors (Andersen and Newman, 1973).
Predisposing factors describe the innate propensity of individuals to use services, prior to the
onset of illness (e.g. age, gender, religion etc.). Enabling factors refer to the resources that
individuals have available to them to use health care services (e.g. income, insurance coverage,
distance from health services). The need factor refers to the degree of ill health suffered by the
individual and is the most immediate cause of health service use. Access to health care is
influenced by characteristics of the health care system, including availability of health care
facilities and appropriate human resources (Aday and Andersen, 1974).
Model 1 Mode of referral The first model investigates factors influencing patients’ choice on mode of referral. Where
circumstances allow, patients can choose to self refer to the ED or to be referred by their GP. A
small proportion of cases are referred to the ED within the hospital system (e.g. by another
hospital, or within the host hospital). The focus in this paper is on factors motivating patient
actions, and thus referrals instigated by the hospital are not included in the analysis. Self referrals
include patients transported by ambulance to the department.
Discrete choice modelling is required for the binomial dependent variable, which takes on a
value of one for GP referral and zero for self referral. The logit is chosen as the link function.
The independent covariates include predisposing demographic characteristics, enabling factors
and need factors. Demographic covariates include gender (with males as the reference category),
age and marital status. To capture signs of non-linearity in the relationship with the dependent
variable, age is modelled as a categorical variable (with age 15-24 as the base category).
Enabling factors are proxied by employment status (employed as base category) and entitlement
status (medical card holders as base category). To capture health need, triage level is included.
Triage 2 (very urgent) is selected as the reference category10. To investigate the influence of
frequent attendance on choice of referral mode, dummy variables for the visit number are
included (first/only visit as the base category).
10 Triage 1 refers to immediate cases and patients with all other levels of triage are more likely to be referred by a GP relative to this category. It is thus more informative to use Triage 2 as a reference category.
To capture information on the characteristics of the health care system, hospital dummies are
included to control for context (Hospital 1 as base category). A dummy variable indicating the
average distance (measured in terms of minutes) of the patient is also included. GP services are
more readily available during normal working hours and to control for this, a dummy variable is
included, indicating if the patient attended after 6pm Monday to Friday, or during the
weekends/bank holidays.
The data are analysed in a panel logit model, the definition of the panel is outlined above. Two
sets of results are presented. The first set is based on the full estimation sample which includes
all four hospitals. The second set is based on the estimation sample including hospitals 3 and 4.
The latter model includes the independent covariates on entitlement and marital status, these are
not available in the full estimation sample.
Model 2 Triage level Patients attending for minor, non-urgent visits attract considerable attention in the literature.
While there is no standard definition for an inappropriate visit, triage level is frequently used as a
key indicator of appropriate/inappropriate utilisation (along with information on patient
perceptions, contact with other primary care providers etc.). There is consistency in the approach
adopted in modelling factors related to triage. Triage scales (with four or five levels) are
typically aggregated into two categories, urgent and non-urgent (e.g. Grumbach et al., 1993;
Shah et al., 1996; Phelps et al., 2000). Levels 2 to 3 in a five point scale (very urgent, urgent) are
labelled urgent and levels 4 and 5 (standard, not urgent) are labelled non-urgent.
Model 2 investigates the factors influencing the level of urgency of patients’ presenting
complaints at the emergency departments. The standard dichotomy of urgent/non-urgent is
applied to the five point triage scale11. Thus the dependent variable is a binomial variable which
takes a value of zero for an urgent visit and a value of one for a non-urgent visit. The
independent covariates are selected in line with the theoretical framework and are the same as in
11 The alternative is to model triage as an ordered variable (e.g. using an ordered logit model). Using this approach, the results are not very different to the binomial approach. For ease of presentation and for consistency with the literature, the results from the binomial model are outlined.
Model 1. As for Model 1, the data are analysed in a panel logit and two sets of results are
presented (full sample of four hospitals and restricted sample of hospitals 3 and 4 only).
Model 3 Admission Once a patient is registered in the emergency department it is reasonable to assume that from this
point forward their progression through the emergency system will be largely determined by
medical need and by the medical profession. However, given the growing concerns with the high
rate of inpatient admissions from emergency departments in Ireland, the characteristics
associated with admitted attendees require attention. The purpose of Model 3 is to identify
factors influencing the likelihood of inpatient admission for emergency department attendees.
The dependent variable is dichotomous which takes a value of one if the patient is admitted and
zero otherwise. The independent covariates are the same as for Model 1 with an additional
dummy to indicate how the patient was referred (self referred as the base category). The data are
analysed in a panel logit and two sets of results are presented (full sample and restricted sample).
Model 4 Self-discharge Descriptive data indicate that even after registration, some patients take matters into their own
hands and decide to leave the department before the episode of care is concluded. In Hospital 3,
over 22% of attendances result in patients discharging themselves prematurely. Self-discharging
is inefficient, wasting hospital administrative and medical resources, and patients’ resources (e.g.
time foregone, travel costs etc.). It is important to identify the factors associated with this
behaviour to improve the efficiency with which emergency department services are used. Model
4 investigates the characteristics associated with patients who self-discharge.
The dependent variable is binomial which takes a value of one if the patient self discharges and
zero otherwise. The independent covariates and model estimation methods are the same as in
Model 3. Two sets of results are presented. Self-discharges are not separately identified in
Hospital 2 and thus the full estimation sample includes Hospitals 1, 3 and 4. The restricted
sample includes Hospitals 3 and 4 as before.
Model 5 Frequent attendance Within the literature on inappropriate ED utilisation, there is some specific focus on the small
proportion of patients who attend EDs on a regular basis. There is no agreed standard definition
of a regular ED attender and definitions range from two or more visits per year to more than 10
visits per year (Lynch and Greaves, 2000). There is some consensus to define attendees with 4 to
11 visits per year as regular attenders and those with more than 12 visits per year as heavy users
of emergency services (Byrne et al., 2003). Model 5 investigates the factors influencing regular
attendance of emergency services. Patients are grouped according the number of visits,
separating those with four or more visits from those with 1 to 3 visits in the year.
The dependent variable is dichotomous taking a value of one if the patient has four or more visits
during the year and zero otherwise12. The independent covariates and model estimation methods
are the same as in Models 3 and 4, with an additional dummy to mark the discharge destination
of the patients (inpatient admission as the base category). Two sets of results are presented (full
sample of four hospitals and restricted sample of hospitals 3 and 4 only).
Each of the models performs well in terms of classifying positive outcomes, and has been
checked for signs of heteroscedasticity. A general to specific modelling approach has been used,
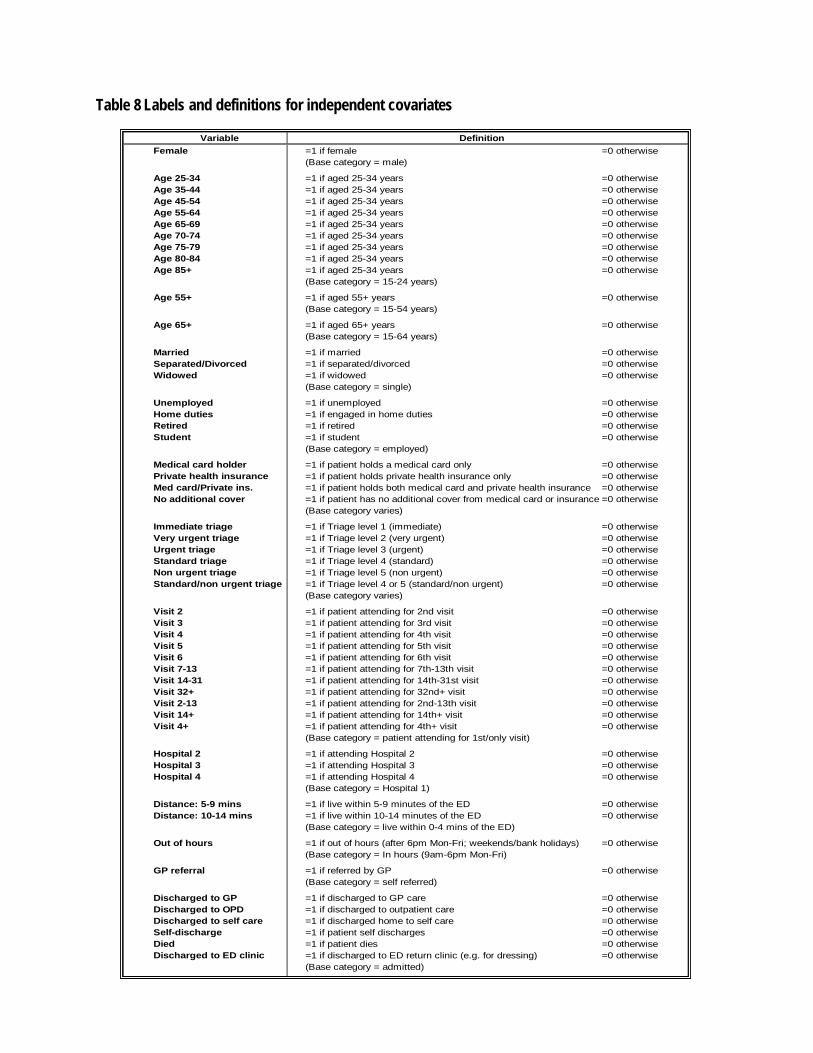
and the results presented here are for the final most parsimonious models. Variable labels and
definitions are presented in Table 8. Descriptive data on the five dependent variables are
presented in Table 9.
12 The alternative would be to model the frequency of visits as a continuous dependent variable. However the skewed nature of the variable causes difficulties for ordinary least squares and the discrete modeling approach is favourable in this case.
6. Results Results are presented for each model in Tables 3 to 7. The majority of the patterns in the odds
ratios are consistent across the models based on the full and restricted samples unless otherwise
referred to in the text.
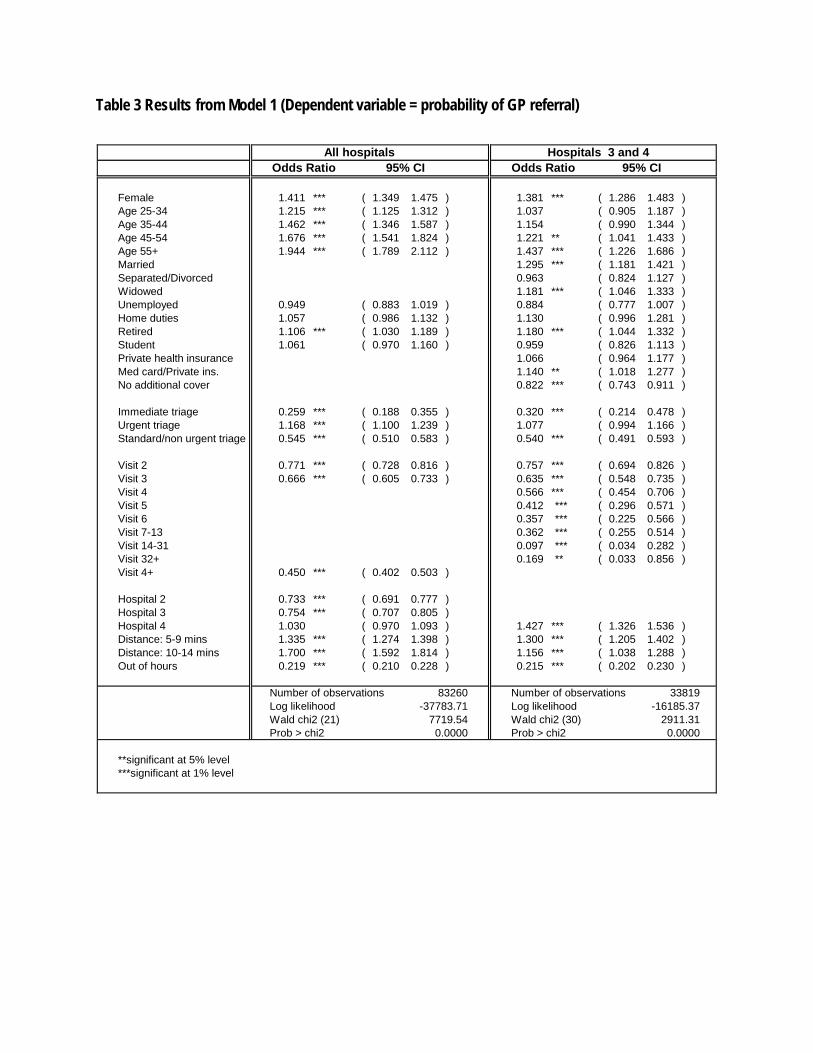
Model 1 Mode of Referral Model 1 investigates factors influencing the likelihood of being referred by a GP rather than self-
referring to the ED. Overall, the majority of cases in an ED are self referrals. For the full sample
including all four hospitals, almost 79% of attendances are self-referrals. Table 3 presents the
two sets of results for Model 1. Odds ratios indicate the odds on the patient being referred by
their GP rather than being self-referred.
The demographic predisposing factors have significant impacts on the referral choice. The odds
of being referred by a GP are higher for females relative to males. The odds of GP referral
increase with age. Patients aged 55 and older are significantly more likely to be GP referrals
relative to younger age groups. There are also some significant differences in marital status.
Relative to single people, individuals who are married and who are widowed are more likely to
be GP referrals.
The socio-economic enabling factors have less significance in their impact on referral choice
after controlling for the other covariates in the model. The most significant result is in
entitlement status, indicated in the results for the restricted sample of hospitals 3 and 4.
Individuals with no additional cover are significantly less likely to be referred by a GP relative to
the base category of medical card holders. Changing the base category further shows that the
group with no additional cover are significantly less likely to be GP referrals relative to all of the
other entitlement groups (i.e. privately insured, duplicate cover). In employment status, there is
some significant variation. The odds of GP referral are significantly higher for retired individuals
relative to employed individuals.
The urgency of the presenting complaint, used to proxy health need, shows significant variation
in the mode of referral. Relative to the base category of very urgent cases, the odds of GP referral
are significantly lower both for cases with immediate needs for medical attention (Triage 1) and
for cases of standard and non urgent needs for attention (Triage 4 and 5). There is no significant
difference between the urgent and the very urgent cases in the mode of referral.
Health system characteristics also have significant impacts on the referral choice. The odds of
GP referral vary across the four hospital sites. Relative to Hospital 1, attendances at Hospitals 2
and 3 are significantly less likely to be GP referrals while attendances at Hospital 4 are not
significantly different. Distance from the hospital is important. Relative to individuals living
within 4 minutes of the nearest ED, those living further away are more likely to be referred by a
GP. Time of day is very significant. Attendances after 6pm on weekdays, or at any time on
weekends (and bank holidays), are much less likely to be referred by a GP.
Finally, the odds of GP referral progressively decline with the number of visits made by an
individual to the ED. The odds of GP referral for attendances with four or more visits are much
lower relative to the base category of those with one visit/first visit during the year.
Table 3 Results from Model 1 (Dependent variable = probability of GP referral)
Number of observations Number of observationsLog likelihood Log likelihoodWald chi2 (31) Wald chi2 (35)Prob > chi2 Prob > chi2
**significant at 5% level***significant at 1% level
1021.730.0000
All hospitals Hospitals 3 and 4Odds Ratio 95% CI Odds Ratio 95% CI
81667 32965-6979.84-16687.51
1664.330.0000
7. Discussion
Mode of referral Although the majority of patients in the sample were self-referred, results from Model 1
identified specific factors linked to GP referral. The demographic and socio-economic
characteristics of GP referrals are consistent with the findings from the primary care literature on
the profiles of individuals who are more likely to use GP services (i.e. females, older age groups,
retired individuals, medical card holders, privately insured). This suggests that there is a
tendency for those who are more regular users of primary care to use this source of care as their
first port of call in the location choice on where to seek care.
The tendency for individuals without cover to be less likely to be referred by a GP, even after
controlling for the level of urgency of the complaint, is consistent with the factors influencing
GP utilisation. However, this finding is interesting in light of the financial incentives for
choosing between primary and emergency care. Privately insured individuals and those with no
additional cover face the same set of financial incentives yet they each respond differently to the
location choice. Although employment status has been controlled for, it is likely that entitlement
status is also capturing differences in socio-economic status and this may be driving the observed
behaviours. The results suggest that the more wealthy privately insured individuals are better
able to afford GP fees.
Yet this is still puzzling given the €60 charge that applies to an ED visit for all those without a
medical card or a letter of referral. However, two factors are important here. First, there is a risk
that one GP visit might lead to further visits, where additional charges would apply. By going
directly to a higher level of care in the ED (with more equipment, staff resources etc.), this risk is
reduced and minimises the visit charges. Individuals with no cover, who are relatively more
economically vulnerable, may be more conscious of this risk. Second, it is possible that rather
than responding to actual price structures, the public responds to their own
perceptions/knowledge of what the price structure is. The costs associated with a GP visit might
be more prominent in the public mind than the charge attached to an ED attendance. There is
some evidence for this. An unpublished survey of attitudes on ED utilisation found that 27% of
those who had visited an emergency department in the past six months chose to use the ED
rather than visiting a GP because the former was cheaper (Red C, 2004). Although the charges
are levied on all people who are liable, in practice, the collection rate may be low. In Hospital 3,
an audit of ED fee payment found that 51% of fees payable were collected at the time of
attendance. Of the remaining 49% who were invoiced by post, just 2% of these had actually been
paid six months later.
GP referrals are also more likely to attend the ED for urgent or very urgent complaints relative to
self-referred patients. This finding provides some evidence of the gatekeeping role that GPs play
in the health system. However the fact that over 25% of the total sample of patients are referred
by their GP with non-urgent complaints (Triage 4 and 5) indicates that other factors may be at
play in GP referral decisions.
Not surprisingly, the odds of being a GP referral are much lower outside of normal working
hours (i.e. after 6pm Monday to Friday, and at weekends). This is the case even in the restricted
sample for Hospitals 3 and 4 which in the year 2004 were better served by out-of-hours GP co-
operatives relative to Hospitals 1 and 2. The out-of-hours GP services operating in Dublin
provide more limited hours of services than in the rest of the country. Further research is needed
to investigate more closely the impact of the different models of co-ops on emergency
departments throughout the country.
Proximity is also important in the location choice. Individuals living within 4 minutes of the ED
are more likely to refer themselves directly to the department. GP referrals are more likely to
come from areas more than 4 minutes away from the ED. The results suggest that people in need
of care have a tendency to go to the nearest available health service provider.
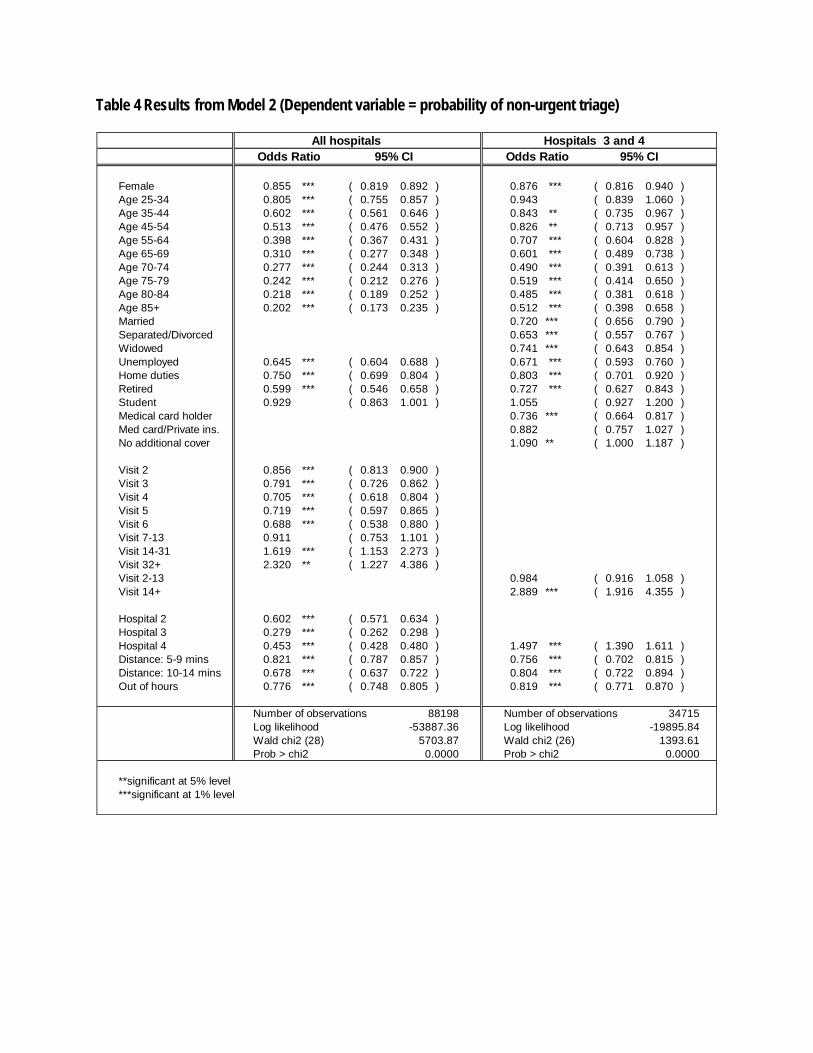
Triage level Results from Model 2 show that the majority of ED cases are in need of urgent medical attention
and less than 40% are in the less urgent categories. Many of the studies on non-urgent ED
utilisation in the literature have been able to control for health status and other factors known to
influence the utilisation choice (e.g. preferences for emergency versus primary care; availability
of regular source of alternative care etc.). These data are not available in this study and thus
strong conclusions about inappropriate utilisation of these four EDs are not made.
However, there are specific factors that are associated with the less urgent cases and these can be
compared with the literature. Males are more likely than females to present for non-urgent
complaints. Younger age groups are more likely to be non-urgent cases and this is consistent
with other studies (e.g. Cunningham et al., 1995). Unemployed, those engaged in home duties,
and retired individuals are less likely to be non-urgent attenders relative to employed individuals.
The result for unemployment is interesting as poor socio-economic status has been identified as a
trigger of non-urgent ED utilisation in other studies. Medical card holders (with and without
private health insurance) are less likely to be non-urgent relative to privately insured individuals
and those with no cover13. Socio-economic status is closely linked with deprivation and health
status. Thus the relationships between the socio-economic indicators and urgency in this study
could in fact be capturing health status effects that have not otherwise been controlled for.
Non-urgent utilisation of emergency services has also been linked in the literature to lack of
continuity of care with a primary provider. As indicated by Nolan & Nolan (2004) medical card
holders are likely to visit their GP more often relative to non medical card holders, suggesting
that this group has greater continuity of care with primary providers relative to the other groups.
This could further explain the observed differences in non-urgent utilisation of emergency
services across the entitlement groups. Relative to individuals with no cover, privately insured
individuals have more frequent contact with primary care providers, and the odds on non-urgent
visits for the privately insured are in fact lower (although only marginally) than for individuals
with no cover.
Inpatient admission Consistent with national estimates of inpatient admissions from emergency departments, almost
a quarter of all ED attendances in the sample were admitted. It is assumed that decisions on
whether or not to admit a patient are driven more by medical professionals and health need rather
13 Although the difference between individuals with duplicate cover and privately insured individuals is not statistically significant.
than by patient level characteristics or choices. It is therefore interesting that a range of patient
level factors are found to be significantly associated with the likelihood of admission.
Very urgent cases are more likely to be admitted relative to less urgent cases14. Thus triage acts
as a valid indicator of severity and health status.
The influence of age on admission rates that has been already highlighted in the Irish literature is
apparent from this analysis. Even after controlling for triage level, older age groups are much
more likely to be admitted. This suggests that even for less acute complaints, older people
present with more complex health problems that require more extensive medical attention than is
needed for younger patients.
It is likely that socio-economic factors are also picking up on health status variations.
Unemployed individuals and medical card holders are both more likely to be admitted, in line
with assumptions of higher deprivation and poorer health status amongst these groups.
GP referrals are more likely to be urgent cases and are thus more likely to require admission.
This is certainly evidence that GPs are referring cases that are relatively serious and require
advanced medical attention in the form of inpatient care. Yet this does not automatically imply
that all GP referrals are appropriate for emergency department care. Even after controlling for
triage, GP referrals are more likely to be admitted relative to self-referred cases. As indicated
above, this suggests that GPs may be referring patients to the ED as a route to an inpatient bed in
the system.
Self-discharge In contrast to those who are admitted, patients who discharge themselves are more likely to be
from the younger age groups and to have lower levels of triage.
14 Patients with immediate need for medical attention represent a small proportion of patients and their discharge outcome tends be divided between deaths and inpatient admissions.
However, controlling for age and triage, individuals who are unemployed and those who hold a
medical card are more likely to self-discharge. Yet these factors are also important indicators of
inpatient admission. Patients who self-discharge may return at a later stage for the same
complaint if care from an alternative provider is not sought in the meantime. Dynamic analysis
could investigate factors involved in the patterns of attendance and re-attendance by self-
dischargers to further understand this process. It is possible that following self-discharge on the
first visit, the untreated patient then re-attends with a more acute presenting complaint and is
admitted on the subsequent visit.
The influence of entitlement on self-discharging is also interesting in relation to availability of
alternative sources of care. In the choice between waiting for care within the emergency
department and seeking care elsewhere, medical card holders have easier financial access (i.e.
free) to alternative primary care relative to the privately insured and those without cover.
Medical card holders thus have less incentive to wait for long periods of time at the ED relative
to the other entitlement groups and the results support this hypothesis.
There is further support for the gatekeeping role of GPs as patients who are GP referred are less
likely to discharge themselves.
Frequent attendance The profile of frequent attenders in the four hospitals is consistent with available Irish and
international literature. Factors associated with frequent attendance (defined as 4 or more visits
in a year) include males, unemployment and medical card entitlement. The latter two are
indicators of poorer socio-economic background and also of lower health status. The relatively
intensive use of primary care by medical card holders is also consistent with the findings from
Byrne et al. (2003) that frequent ED users are also likely to be regular users of other alternative
sources of care. Ease of access is clearly linked to frequency as patients living within 4 minutes
of the EDs are more likely to attend more than 3 times in the year.
Triage is not a strong predictor of frequency when all other covariates are included in the model.
This is possibly due to the non linear relationship between triage and number of visits that is
indicated in Model 2. For individuals who are medium users of the ED, the likelihood of the
complaint being urgent is greater relative to individuals on their first or only visit. However for
heavy users of the ED, the urgency of the complaint declines as the number of visits extends
beyond 14. Frequent attenders are also more likely to self-discharge than to be admitted. These
factors further point to the need for some dynamic analysis of these data to better understand the
way in which frequent attenders are using the emergency departments.
Model linkages As noted earlier, the ideal way to analyse emergency department utilisation would be as a set of
sequential steps from the decision to seek care through to decisions on discharge. This would
give a dynamic picture of key characteristics influencing the different pathways through the
emergency system that different groups may be taking. Instead these different steps have been
analysed as separate stages in line with available data.
It is important not to over-interpret the findings but it is possible to identify some interesting
trends in the data that can serve to inform current concerns in emergency care in Ireland.
Older age, unemployment, medical card entitlement, and individuals with no additional
entitlement are factors associated with relatively high use of emergency services in the Dublin
area (Smith, 2007). These are also linked to particular patterns of emergency department use.
Controlling for all other factors, older aged individuals are more likely to be referred by their GP,
to present with relatively urgent complaints, and to be admitted. Concerns with the burden of
older age groups on emergency services have already been noted in the Irish literature. These
concerns are supported by this analysis and emphasises the need to expand facilities appropriate
to the needs of the elderly and to examine further the referral patterns by GPs.
Unemployed individuals are more likely to refer to the emergency department with urgent
complaints relative to employed individuals. These individuals are also more likely than
employed individuals to be admitted. Relative to all other occupation categories, the unemployed
are more likely to discharge themselves from the department and to attend frequently during the
year. These patterns hold when all other covariates are controlled in the models. This group of
individuals clearly have high health needs and are attending the ED with conditions that are
urgent and require admission. However, the strong associations of this group with frequency of
attendance and self-discharging suggests that their needs are not being met in the most effective
and efficient way. Dynamic analysis could help to understand in more depth the ways in which
this group is using the ED and to identify how their needs could be more appropriately met.
Medical card holders are more likely to be referred by their GP, to present with more urgent
complaints, and to be admitted. However they are also more likely than the other entitlement
groups to self-discharge and to attend frequently15. The relative intensity with which medical
card holders make use of primary care in Ireland has been well documented. This analysis shows
that this intensive use extends to the emergency department also, although health status has not
been controlled for as comprehensively as in the primary care literature.
Individuals with no additional cover also have high ED utilisation rates but the analysis in this
paper indicates that these individuals are using the emergency department in different ways to
the medical card holders. The non-covered attend for less urgent complaints, are less likely to be
admitted and attend less frequently relative to medical card holders. They are also less likely to
self-discharge relative to medical card holders. These patterns suggest that while the health needs
of this group are clearly lower relative to medical card holders, their access to primary care is
restricted leading to relatively high utilisation of emergency services for non urgent reasons. The
patterns of utilisation are similar for non-covered to those of the privately insured. However the
latter are more likely to be referred by their GP and have lower utilisation rates relative to the
non-covered (Smith, 2007). This suggests that while the health needs of these two groups may be
similar, the privately insured are making more use of primary care services while the non-
covered are making more use of emergency care services. This is despite the fact that both
groups face the same financial incentives for primary and emergency care. The results support
the suggestion that the charges attached to emergency care are not perceived to be as much of an
access barrier as they can be for primary care.
15 The similarities in the results for the unemployed and the medical card categories are likely to reflect common socio-economic and health status indicating a degree of multicollinearity in the models.
Finally, there are important differences across the hospital sites in the burden and source of cases
received. Hospital 3 is distinctive in terms of a significantly higher proportion of urgent cases
relative to the other hospitals. This triage burden is consistent with the high level of deprivation
in the surrounding catchment population. The odds of self-discharging are also significantly
greater in this hospital. It is possible that these two observations are linked. The burden of urgent
cases on available resources (staff, equipment etc.) could be triggering long delays which may be
contributing to higher rates of self-discharge by patients unable or unwilling to wait. However, in
data published by the Health Services Executive on waiting times, there are no consistent trends
for higher waiting times in Hospital 1 relative to the others in the sample. The variations across
the hospitals are thus difficult to entangle but nevertheless indicate the importance of using more
than one site to get a more robust picture of the ways in which emergency department services
are being used.
8. Conclusions Analysis in this paper has focused on different stages within an emergency department visit.
While this analysis does not provide direct answers to the key questions and challenges about
emergency care in Ireland, it provides some evidence to inform the debates. First, characteristics
that are linked to relatively high use of emergency services in the Dublin area are also linked to
particular patterns of use within the emergency department system. Second, gatekeeping by GPs
is evident, but there are also signs that some patients may be referred to the ED as a route to an
inpatient bed (e.g. older patients). Third, important distinctions between regular primary care and
emergency care users are suggested by the analysis on referral source.
Further analysis is warranted to exploit the dynamic information in the data, to identify patterns
of use for frequent attenders from one visit to the next. The analysis of discharge in this paper
has focused on admissions and self-discharges. Patients can also be referred onwards to a GP, to
an outpatient appointment or to other care providers. Future work could explore these other
discharge patterns.
Overall, the advantage of using four hospitals has been to allow a more robust picture of what
happens in an emergency department in Dublin from referral through to discharge and frequency
KRAKAU, I. & HASSLER, E. (1999) Provision for Clinic Patients in the ED Produces More Nonemergency Visits. American Journal of Emergency Medicine, 17, 18-20. LANG, T., DAVIDO, A., DIAKITÉ, B., AGAY, E., VIEL, J. F. & FLICOTEAUX, B. (1997) Using the Hospital Emergency Department as a Regular Source of Care. European Journal of Epidemiology, 13, 223-228. LOWY, A., KOHLER, B. & NICHOLL, J. (1994) Attendance at Accident and Emergency Departments: Unnecessary or Inappropriate? Journal of Public Health Medicine, 16, 134-140. LYNCH, R. M. & GREAVES, I. (2000) Regular Attenders to the Accident and Emergency Department. Emergency Medicine Journal, 17, 351-354. MANCHESTER TRIAGE GROUP (1997) Emergency Triage, BMJ Publishing Group. MURPHY, A. W. (1998) 'Inappropriate' Attenders at Accident and Emergency Departments II: Health Service Responses. Family Practice, 15, 33-37. MURPHY, A. W., BURY, G., PLUNKETT, P. K., GIBNEY, D., SMITH, M., MULLAN, E. & JOHNSON, Z. (1996) Randomised Controlled Trial of General Practitioner Versus Usual Medical Care in an Urban Accident and Emergency Department: Process, Outcome, and Comparative Cost. British Medical Journal, 312, 1135-1142. NESF (2002) Equity of Access to Hospital Care. Forum Report No. 25. Dublin, National Economic and Social Forum. NOLAN, A. & NOLAN, B. (2004) A Cross-Sectional Analysis of the Utilisation of GP Services in Ireland: 1987-2001. Working Paper No. 1, Research Programme on "Health Services, Health Inequalities and Health and Social Gain", Economic and Social Research Institute. NORTHINGTON, W. E., BRICE, J. H. & ZOU, B. (2005) Use of an Emergency Department by Nonurgent Patients. American Journal of Emergency Medicine, 23, 131-137. PADGETT, D. K. & BRODSKY, B. (1992) Psychosocial Factors Influencing Non-Urgent Use of the Emergency Room: A Review of the Literature and Recommendations for Research and Improved Service Delivery. Social Science and Medicine, 35, 1189-1197. PCRS (2005) National Shared Services Primary Care Reimbursement Service: Statistical Analysis of Claims and Payments 2005, Health Service Executive, Dublin. PHELPS, K., TAYLOR, C., KIMMEL, S., NAGEL, R., KLEIN, W. & PUCZYNSKI, S. (2000) Factors Associated with Emergency Department Utilization for Nonurgent Pediatric Problems. Archives of Family Medicine, 9, 1086-1092. PUIG-JUNOY, J., SAEZ, M. & MARTINEZ-GARCIA, E. (1998) Why to Patients Prefer Hospital Emergency Visits? A Nested Multinomial Logit Analysis for Patient-Initiated Contacts. Health Care Management Science, 1, 39-52. RASK, K. J., WILLIAMS, M. V., MCNAGNY, S. E., PARKER, R. M. & BAKER, D. W. (1998) Ambulatory Health Care Use by Patients in a Public Hospital Emergency Department. Journal of General Internal Medicine, 13, 614-620. RED C (2004) Opinion poll on A&E services in Ireland, Unpublished poll by Red C Market Research for the Centre for Insurance Studies, University College Dublin. SHAH, N., SHAH, M. & BEHBEHANI, J. (1996) Predictors of Non-Urgent Utilization of Hospital Emergency Services in Kuwait. Social Science and Medicine, 42, 1313-1323. SMITH, S. (2007) Emergency Department Utilisation in Four Irish Teaching Hospitals. Working Paper No. 25, Research Programme on "Health Services, Health Inequalities and Health and Social Gain", Economic and Social Research Institute.
WALSH, J., COAKLEY, D., MURPHY, C., COAKLEY, J., BOYLE, E. & JOHNSON, H. (2004) Demographic Profile of the Elderly Population in Dublin Accident and Emergency Hospital Catchment Areas. Irish Medical Journal, 97, 84-85. WALSH, M. (1990) Patient's Choice: GP or A&E Department? Nursing Standard, 5, 28-31. WEBER, E. J., SHOWSTACK, J. A., HUNT, K. A., COLBY, D. C. & CALLAHAM, M. L. (2005) Does Lack of a Usual Source of Care or Health Insurance Increase the Likelihood of an Emergency Department Visit? Results of a National Population-Based Study. Annals of Emergency Medicine, 45, 4-12.
Table 8 Labels and definitions for independent covariates
VariableFemale =1 if female =0 otherwise
(Base category = male)
Age 25-34 =1 if aged 25-34 years =0 otherwiseAge 35-44 =1 if aged 25-34 years =0 otherwiseAge 45-54 =1 if aged 25-34 years =0 otherwiseAge 55-64 =1 if aged 25-34 years =0 otherwiseAge 65-69 =1 if aged 25-34 years =0 otherwiseAge 70-74 =1 if aged 25-34 years =0 otherwiseAge 75-79 =1 if aged 25-34 years =0 otherwiseAge 80-84 =1 if aged 25-34 years =0 otherwiseAge 85+ =1 if aged 25-34 years =0 otherwise
(Base category = 15-24 years)
Age 55+ =1 if aged 55+ years =0 otherwise(Base category = 15-54 years)
Age 65+ =1 if aged 65+ years =0 otherwise(Base category = 15-64 years)
Married =1 if married =0 otherwiseSeparated/Divorced =1 if separated/divorced =0 otherwiseWidowed =1 if widowed =0 otherwise
(Base category = single)
Unemployed =1 if unemployed =0 otherwiseHome duties =1 if engaged in home duties =0 otherwiseRetired =1 if retired =0 otherwiseStudent =1 if student =0 otherwise
(Base category = employed)
Medical card holder =1 if patient holds a medical card only =0 otherwisePrivate health insurance =1 if patient holds private health insurance only =0 otherwiseMed card/Private ins. =1 if patient holds both medical card and private health insurance =0 otherwiseNo additional cover =1 if patient has no additional cover from medical card or insurance =0 otherwise
(Base category varies)
Immediate triage =1 if Triage level 1 (immediate) =0 otherwiseVery urgent triage =1 if Triage level 2 (very urgent) =0 otherwiseUrgent triage =1 if Triage level 3 (urgent) =0 otherwiseStandard triage =1 if Triage level 4 (standard) =0 otherwiseNon urgent triage =1 if Triage level 5 (non urgent) =0 otherwiseStandard/non urgent triage =1 if Triage level 4 or 5 (standard/non urgent) =0 otherwise
(Base category varies)
Visit 2 =1 if patient attending for 2nd visit =0 otherwiseVisit 3 =1 if patient attending for 3rd visit =0 otherwiseVisit 4 =1 if patient attending for 4th visit =0 otherwiseVisit 5 =1 if patient attending for 5th visit =0 otherwiseVisit 6 =1 if patient attending for 6th visit =0 otherwiseVisit 7-13 =1 if patient attending for 7th-13th visit =0 otherwiseVisit 14-31 =1 if patient attending for 14th-31st visit =0 otherwiseVisit 32+ =1 if patient attending for 32nd+ visit =0 otherwiseVisit 2-13 =1 if patient attending for 2nd-13th visit =0 otherwiseVisit 14+ =1 if patient attending for 14th+ visit =0 otherwiseVisit 4+ =1 if patient attending for 4th+ visit =0 otherwise
(Base category = patient attending for 1st/only visit)
Hospital 2 =1 if attending Hospital 2 =0 otherwiseHospital 3 =1 if attending Hospital 3 =0 otherwiseHospital 4 =1 if attending Hospital 4 =0 otherwise
(Base category = Hospital 1)
Distance: 5-9 mins =1 if live within 5-9 minutes of the ED =0 otherwiseDistance: 10-14 mins =1 if live within 10-14 minutes of the ED =0 otherwise
(Base category = live within 0-4 mins of the ED)
Out of hours =1 if out of hours (after 6pm Mon-Fri; weekends/bank holidays) =0 otherwise(Base category = In hours (9am-6pm Mon-Fri)
GP referral =1 if referred by GP =0 otherwise(Base category = self referred)
Discharged to GP =1 if discharged to GP care =0 otherwiseDischarged to OPD =1 if discharged to outpatient care =0 otherwiseDischarged to self care =1 if discharged home to self care =0 otherwiseSelf-discharge =1 if patient self discharges =0 otherwiseDied =1 if patient dies =0 otherwiseDischarged to ED clinic =1 if discharged to ED return clinic (e.g. for dressing) =0 otherwise
(Base category = admitted)
Definition
Table 9 Descriptive statistics for the five dependent variables in the logit models, by hospital (2004)