A novel magnetically stabilized gliding arc reactor coupled with a counterflow burner was developed to study
nonthermal plasma enhancement of ignition and extinction phenomena. The results showed that the new coupled
plasma-flame systemprovides awell-definedplatform for understanding of the basicmechanismof the plasma-flame
interaction. It was shown thatwith a plasma discharge of the airstream, up to a 220% increase in the extinction strain
rate was possible at low power inputs for air and methane diluted with nitrogen. Measurements of temperature
profiles via planar Rayleigh scattering thermometry and OH number density profiles via planar laser-induced
fluorescence (calibrated with absorption) were taken to quantify various effects. Detailed numerical simulations at
elevated air temperatures and radical addition were performed for comparison with experimentally obtained
results. Results of the extinction experiments initially suggested that the enhancement effect was predominantly
thermal for our particular setup of experiments. However, in ignition experiments specifically for hydrogen,
temperature measurements conducted for hydrogen–air mixtures suggested the contribution of active species to
justify the extent of the enhancement effect. Further comparison with numerical simulations also provides an insight
into the participation of species other than radicals in the enhancement effect.
Nomenclature
a = strain rate of the counterflow flameB = magnetic fieldCd = drag coefficientD = specific diameter of the magnetic gliding arc
deviced = approximate diameter of the arcdcorr = corrected diameter of the arcdmeas = measured diameter of the arcE = electric fieldEn = excitation state energyFa = ampere force per unit arc lengthFd = drag forcef = arc rotation frequencyG0, G1, Gref = identified peaks from an OH spectrumInmref
, Inm = reference and calculated intensityI = plasma currenti, j = indices representing the two nozzle streamsj = plasma current densityL = distance between counterflow nozzlesQ = volumetric flow ratet = exposure time period of high-speed camera
u = gas velocityvd = drift velocityZ�Tref�, Z�T� = partition functions� = gas density
I. Introduction
W ITH the ever-increasing want and need for practical high-speed air-breathing propulsion devices comes themajor issue
of designing a supersonic combustion system. Depending upon theMach number, the residence times in the combustor of a scramjetmay be on the order of the reaction time. This is not as much of anissue for fuels such as hydrogen because of their rapid ignition andreaction times, but it does become a significant issue for hydrocarbonfuels because of their longer ignition delay times. Specifically, thetwomost critical problems in scramjet development arise in the formof ignition and flame stabilization in the supersonic combustor.
Over the course of the last few decades, much research has beenfocused on supersonic combustion development and has brought ourunderstanding a long way closer to a tangible and reliable system.Many solutions have been realized in this regard, ranging frompassive cavity flame holders [1–5] to energy addition via precom-bustors [6–8] and plasma [9–17], to combat the aforementionedproblems in supersonic flow systems. Cavities or ramped cavitiesprovide a subsonic region for flame stabilization as well as enhancedmixing, but do not add any energy to the system, setting an upperlimit on the extent of enhancement. By adding energy to the flow viaa precombustor, especially in conjunction with a cavity, the flamebecomes more stable with increased flammability limits. Here, theelevated temperatures and radical pools produced during thecombustion have proven to be an effective means of decreasing theignition time and increasing the flame stabilization. Unfortunately,this method is constrained by the requirement of an additionalcombustion chamber and, more importantly, by the flammabilitylimits of the fuel–air mixture in the precombustor, especially forhydrocarbon fuels. In this regard, plasma-based ignition is apromising technology because it is not constrained as much by theflammability limits of amixture, as is the casewith a precombustor orcavity flame holding design. To address this issue, plasma has been
put forth in many configurations ranging from plasma torches [9,10]to high-voltage nanosecond discharges [11,12].
To determine the best kind of plasma system to be applied toignition and combustion applications, we need to classify the variouspossibilities of electrically generated plasma discharge configura-tions into types that may be effective for the enhancement process.Plasmas are broadly classified into two categories, namely, thermal(or equilibrium) and nonthermal (or nonequilibrium). Thermalplasmas include arc discharges, plasma torches, and radio frequencyinductively coupled plasmas. The stepwise processes of ionizationand dissociation take place via large amounts of energy or heataddition. Because of this heat addition, the gas temperatures are veryhigh (5000–50,000 K), with electron temperatures of the same orderand energy input in all degrees of freedom. Also, it is unnecessary tohave such a high increase in gas temperature from the point of viewofignition. This results in poor chemical reaction selectivity of theignition process. In addition, there would be either large powerrequirements or localized activation, such as with a plasma jet (e.g.,only penetrating into a small portion of a transverse supersonic flow).Furthermore, to scale up a thermal plasma discharge, much higherspecific power inputs are required.
Nonequilibrium plasmas have been traditionally generated in lowpressures, such as direct-current glow, corona, radio frequency,microwave, and nanosecond high-voltage discharges. Unlikethermal plasmas, they have high chemical selectivity and are capableof homogeneous activation. The primary means of dissociation andionization is direct electron impact from high-energy (speed)electrons accelerated by a large electric field. However,homogeneous activation leads to power requirements that canbecome extremely high, sometimes in excess of several MJ=m3.Also, the gas temperatures typically achieved are either roomtemperature or too low from an ignition assistance point of view.
Therefore, an ideal plasma discharge should have intermediatetemperatures between the temperatures of thermal and nonthermalplasma. The temperatures should be high enough for the ignition of amixture, have activation benefits of a homogeneous discharge,provide high levels of chemical reaction selectivity, have highelectron temperatures, and have high plasma densities with lowpower requirements [16]. The discharge that aptly suits thisdescription is the gliding arc (GA). The GA is a unique nonthermalplasma that has a relatively high plasma density, power and operatingpressure in comparison with other nonequilibrium discharges, a highelectron temperature (>1 eV), relatively low gas temperatures(<3000 K), and good chemical selectivity in comparison withthermal discharges. High-temperature electrons are more efficient atproducing ions, radicals, and excited and dissociated molecules thanthose in equilibrium plasma (<1 eV), and the gas temperatures arestill high enough to accelerate the interaction between neutralspecies. Also, the GA is known for its simplicity of design andapplicability.
After establishing the GA as best suited for the parameters soughtfor our system, the next step is to understand under what conditionsand to what extent there will be thermal and nonthermal effects. It isvery clear and has been shown many times over that radical additionwill shorten the ignition time. But what is not yet clear is to whatextent the radicals can enhance a system, specifically from the flamestabilization and burning rate perspective. This question of“nonthermal enhancement” has long been debated [9,10].Furthermore, is it possible to enhance a flame using plasma in away that can not be explained by traditional combustion chemistry?To even begin to answer these questions, a system has to bedeveloped to provide an ideal or, at a minimum, simplified platformto study the plasma–flame interaction. This can be a daunting taskbecause of the complexity of the interaction between the plasmadischarge, flowfield, and flame.
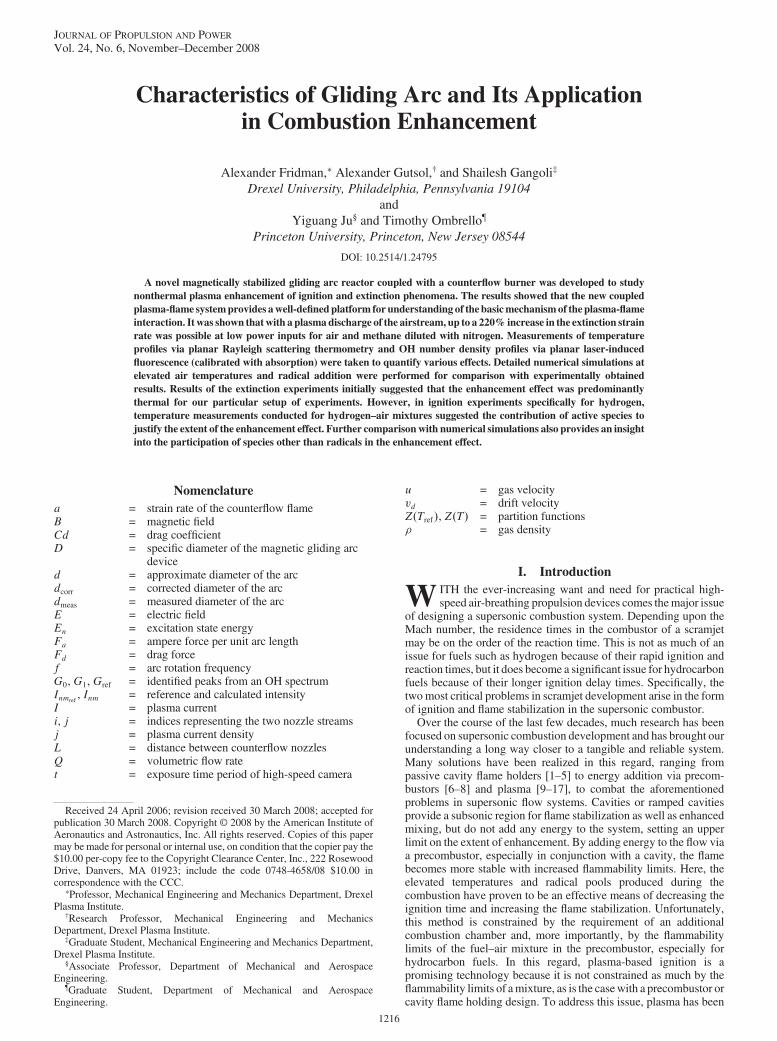
The GA plasma discharge, which has been chosen as the basis ofourwork, has its roots in a traditionalflat gliding arc system, as can beseen in Fig. 1. The arc is initiated at the shortest gap between the twoelectrodes, after which it elongates by transverse gas flow. Within ashort time (microseconds), the arc current reaches its maximumvalue whereas the voltage drops to almost zero. As the gas flow
pushes the arc, its voltage increases and the current starts to decrease.The elongating arc demands more power to sustain itself, until itreaches the maximum that the power supply can provide. However,due to continuous gas flow, the length of the arc continues to growbut the power supplied by the source is insufficient to balance theenergy losses to the surrounding gas. If the power supply is capableof providing sufficiently high voltage, the arc changes its ionizationmechanism to a nonthermal one, that is, stepwise to direct. Becauseof instability, the arc cools down and finally extinguishes, markingthe end of one cycle. The next cycle of the arc evolution begins as thevoltage in the gap reaches its breakdown value and initiates at theshortest gap once again. The transition is attributed to a continuousincrease in the electric field until extinction, causing electrons to gainenergy during transition, coupled with convective cooling of the gasin the plasma arc. Figure 2 shows the increase in electricfield after thepoint of transition. From the perspective of using plasma for anignition enhancement study, the traditional flat GAs pose a problembecause of the requirement of high-flow rates of transverse gas toobtain more-or-less uniformity of the discharge and also the inabilityto stabilize the nonthermal portion of the discharge.
The goal of this research was to develop an ideal and simplifiedGA plasma discharge and to integrate it with a counterflow burner(known for its ease of study) to secure a more fundamentalunderstanding of the interaction between species generated bynonequilibrium plasma and diffusion flames. This was accomplishedby first designing a magnetically stabilized nonequilibrium glidingarc plasma (MGA) discharge system. The design, development, anddiagnostics of this system are discussed further in this paper. This
Fig. 1 Traditional flat gliding arc (arrow points in the direction of
airflow).
FRIDMAN ET AL. 1217
MGA system was then integrated with a counterflow burner,providing a simple platform to study the plasma–flame interaction. Adetailed analysis of the MGA and the flame was performed. Thisincluded optical spectroscopy of the MGA and experimental studiesof the extinction behavior, laser diagnostics for flame temperaturesvia planar Rayleigh scattering, and OH number densities via OHplanar laser-induced fluorescence (PLIF) for counterflow diffusionflames. These results were then compared with numericalcomputations using detailed chemistry to validate the measurementsand clarify the roles of thermal and nonthermal effects innonequilibrium-plasma-assisted combustion.
II. Design and Development of Magnetic Gliding Arc
A. Principle
As discussed earlier, one of the key problems with theemployment of traditional GAs for purposes of combustion studies isthat the nonequilibrium portion of the discharge extinguishes rapidlyafter transition. However, recently it was found that, during thegliding arc cycle, the arc can be stabilized well past the transitionfrom the thermal equilibrium to the nonequilibrium regime beforeextinction [17]. This was an extremely important result, as it openedup the possibility of stabilization of a strongly nonequilibriumgliding arc discharge. One of the technical solutions to achieve thiswas to drive and elongate the arc using a force other than transversegas flow.
We used the concept of Lorentz force, wherein amoving charge inamagnetic field is subjected to a force. The direction ofmotion of thecharge due to this force is determined by the well-known right-handrule: if you orient your right-hand palm open, such that the fingersdetermine the direction of magnetic field and the thumb pointstoward the direction of motion of the charge, then the palm faces thedirection of force experienced. In dc discharges such as the MGA,there is no switching of polarity between electrodes. The directionsof motion (between electrodes) of negatively and positively chargedspecies are opposite. However, they experience a force in thesame direction due to their charge (transversely). This inherentlyfacilitates the motion of the arc as a single unit. We extend this tothe concept of ampere force, wherein the applied magnetic fieldwas normal to the length of the current-carrying “plasma arcconductor,” causing it to move. The plasma arc can be stabilizednear extinction in the nonequilibrium regime for an indefinite amountof time.
B. Construction
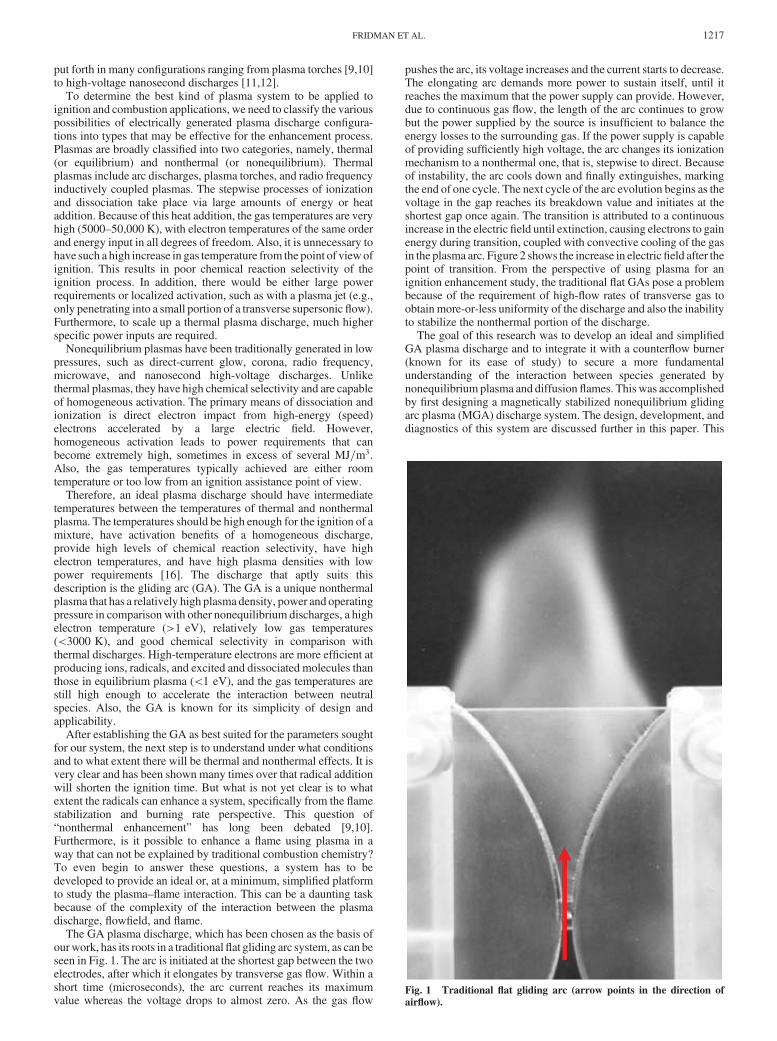
The MGA apparatus, as seen in Fig. 3, is composed of stainlesssteel inner and outer electrodes, which serve as the cathode (highvoltage) and anode (grounded), respectively. A wire is fixed to thecathode that is kept separated from the outer anode by approximately2 mm at the smallest gap (point 1 in Fig. 4). The spiral wire gets
progressively closer to the cathode (inner electrode) to which it isattached, at the largest gap between the two electrodes. In addition,there is a magnetic field in the discharge region produced by anexternal donut-shaped permanent ceramic magnet, as seen in Fig. 3(Adams Magnetic, Inc.). The direction of the magnetic fielddetermines the direction of the rotation of the arc (in this case,counterclockwise to follow the wire when looking down upon thesystem, as in Fig. 4). Themagneticfield strength aswell as the plasmacurrent determines the frequency of rotation discussed later in thispaper.
C. Magnetic Field Strength
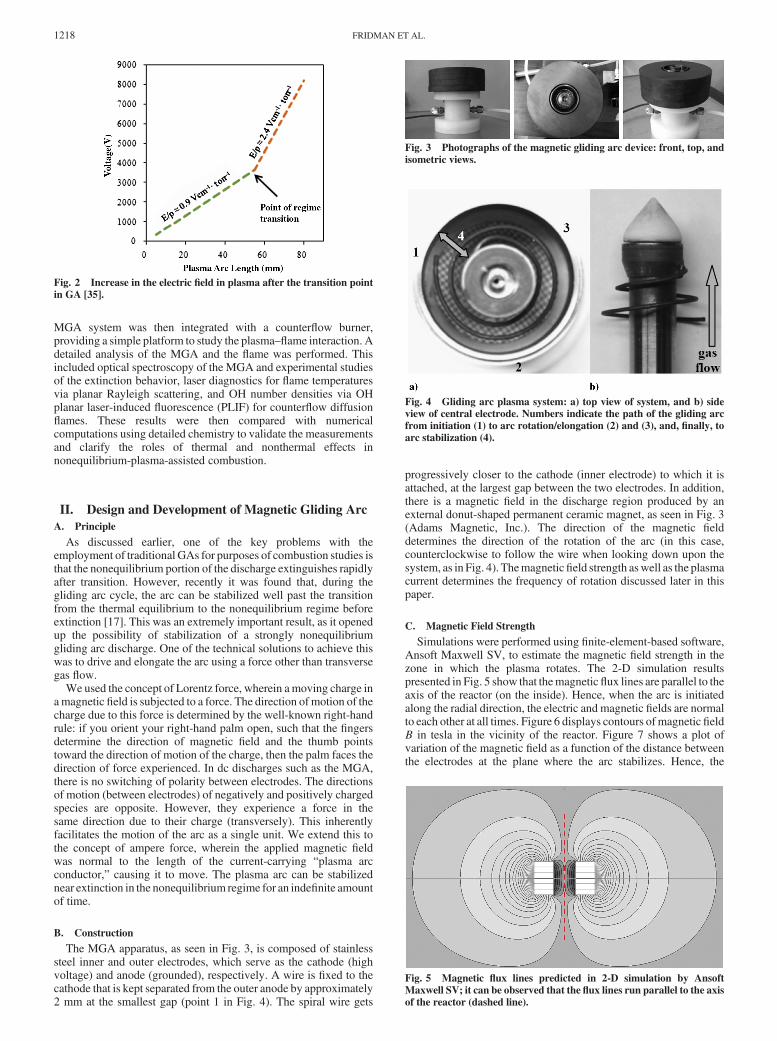
Simulations were performed using finite-element-based software,Ansoft Maxwell SV, to estimate the magnetic field strength in thezone in which the plasma rotates. The 2-D simulation resultspresented in Fig. 5 show that themagneticflux lines are parallel to theaxis of the reactor (on the inside). Hence, when the arc is initiatedalong the radial direction, the electric and magnetic fields are normalto each other at all times. Figure 6 displays contours of magnetic fieldB in tesla in the vicinity of the reactor. Figure 7 shows a plot ofvariation of the magnetic field as a function of the distance betweenthe electrodes at the plane where the arc stabilizes. Hence, the
Fig. 3 Photographs of the magnetic gliding arc device: front, top, and
isometric views.
Fig. 4 Gliding arc plasma system: a) top view of system, and b) sideview of central electrode. Numbers indicate the path of the gliding arc
from initiation (1) to arc rotation/elongation (2) and (3), and, finally, to
arc stabilization (4).
Fig. 2 Increase in the electric field in plasma after the transition point
in GA [35].
Fig. 5 Magnetic flux lines predicted in 2-D simulation by Ansoft
Maxwell SV; it can be observed that the flux lines run parallel to the axis
of the reactor (dashed line).
1218 FRIDMAN ET AL.
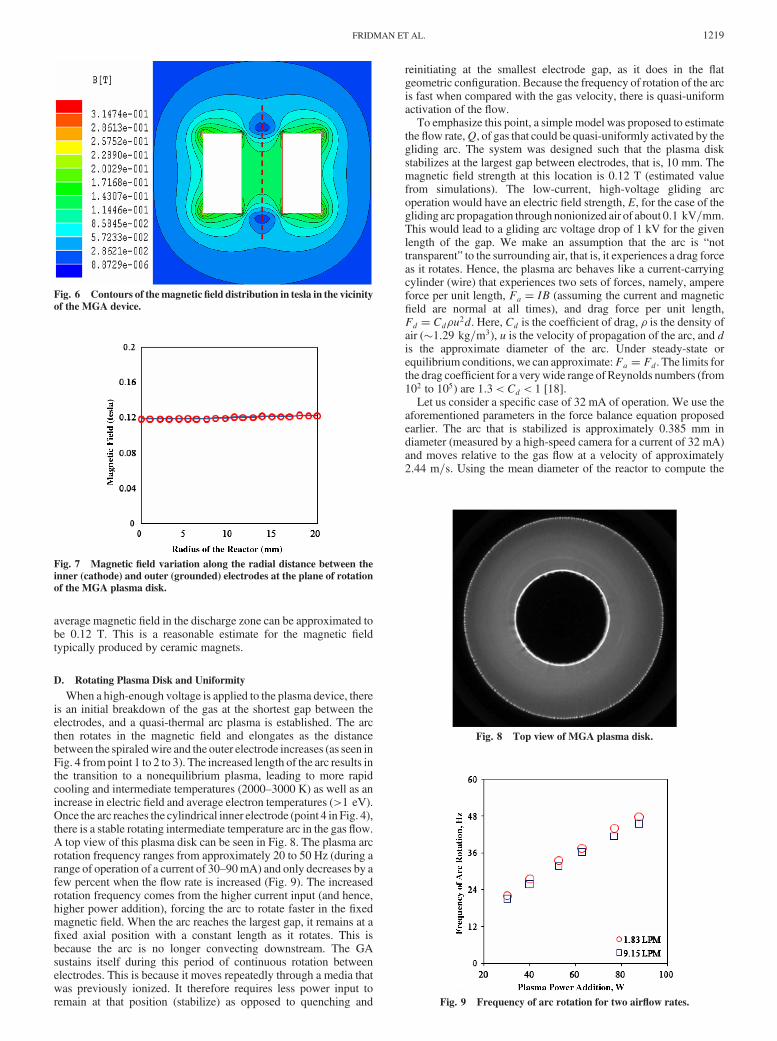
average magnetic field in the discharge zone can be approximated tobe 0.12 T. This is a reasonable estimate for the magnetic fieldtypically produced by ceramic magnets.
D. Rotating Plasma Disk and Uniformity
When a high-enough voltage is applied to the plasma device, thereis an initial breakdown of the gas at the shortest gap between theelectrodes, and a quasi-thermal arc plasma is established. The arcthen rotates in the magnetic field and elongates as the distancebetween the spiraledwire and the outer electrode increases (as seen inFig. 4 from point 1 to 2 to 3). The increased length of the arc results inthe transition to a nonequilibrium plasma, leading to more rapidcooling and intermediate temperatures (2000–3000 K) as well as anincrease in electric field and average electron temperatures (>1 eV).Once the arc reaches the cylindrical inner electrode (point 4 in Fig. 4),there is a stable rotating intermediate temperature arc in the gas flow.A top view of this plasma disk can be seen in Fig. 8. The plasma arcrotation frequency ranges from approximately 20 to 50 Hz (during arange of operation of a current of 30–90mA) and only decreases by afew percent when the flow rate is increased (Fig. 9). The increasedrotation frequency comes from the higher current input (and hence,higher power addition), forcing the arc to rotate faster in the fixedmagnetic field. When the arc reaches the largest gap, it remains at afixed axial position with a constant length as it rotates. This isbecause the arc is no longer convecting downstream. The GAsustains itself during this period of continuous rotation betweenelectrodes. This is because it moves repeatedly through a media thatwas previously ionized. It therefore requires less power input toremain at that position (stabilize) as opposed to quenching and
reinitiating at the smallest electrode gap, as it does in the flatgeometric configuration. Because the frequency of rotation of the arcis fast when compared with the gas velocity, there is quasi-uniformactivation of the flow.
To emphasize this point, a simple model was proposed to estimatethe flow rate,Q, of gas that could be quasi-uniformly activated by thegliding arc. The system was designed such that the plasma diskstabilizes at the largest gap between electrodes, that is, 10 mm. Themagnetic field strength at this location is 0.12 T (estimated valuefrom simulations). The low-current, high-voltage gliding arcoperation would have an electric field strength, E, for the case of thegliding arc propagation through nonionized air of about0:1 kV=mm.This would lead to a gliding arc voltage drop of 1 kV for the givenlength of the gap. We make an assumption that the arc is “nottransparent” to the surrounding air, that is, it experiences a drag forceas it rotates. Hence, the plasma arc behaves like a current-carryingcylinder (wire) that experiences two sets of forces, namely, ampereforce per unit length, Fa � IB (assuming the current and magneticfield are normal at all times), and drag force per unit length,Fd � Cd�u2d. Here, Cd is the coefficient of drag, � is the density ofair (�1:29 kg=m3), u is the velocity of propagation of the arc, and dis the approximate diameter of the arc. Under steady-state orequilibrium conditions, we can approximate:Fa � Fd. The limits forthe drag coefficient for a verywide range of Reynolds numbers (from102 to 105) are 1:3<Cd < 1 [18].
Let us consider a specific case of 32 mA of operation. We use theaforementioned parameters in the force balance equation proposedearlier. The arc that is stabilized is approximately 0.385 mm indiameter (measured by a high-speed camera for a current of 32 mA)and moves relative to the gas flow at a velocity of approximately2:44 m=s. Using the mean diameter of the reactor to compute the
Fig. 7 Magnetic field variation along the radial distance between the
inner (cathode) and outer (grounded) electrodes at the plane of rotationof the MGA plasma disk.
Fig. 8 Top view of MGA plasma disk.
Fig. 9 Frequency of arc rotation for two airflow rates.
Fig. 6 Contours of themagnetic field distribution in tesla in the vicinity
of the MGA device.
FRIDMAN ET AL. 1219
circumference covered during one rotation, we can estimatethe average rotation frequency of the arc is�u=��D�, whereD is themean diameter (�3:2 cm) of the reactor that the arc sees.The corresponding average rotation frequency value is �2:44=���0:032� � 24 Hz. This value matches up reasonably well withexperimental value reported in Fig. 9 for approximately 37 W(�32 mA). This means that at a 32 mA current, the arc will appear atthe same location 24 times in a second.Hence, theflowwill be treatedfor sure if it passes the diameter of the arc within (�1=24 s) 0.041 s,and so the velocity of airflow that will be treated uniformly by thedischarge is approximately d=�, which upon calculation gives us0:94 cm=s. This corresponds to a flow rate, Q, of 10:7 cm3=s or600 standard cm3=min.
E. Power Supply
The electrical circuit typically used for gliding arc discharges [16]is shown in Fig. 10. As discussed earlier, the quasi-thermal regimeexists (due to restriction of current by external resistance) as long asthe power supply is capable of providing enough energy tocompensate for losses to its surroundings during arc elongation. Thetransition to nonthermal regime happens at a critical point, when thepower drop in plasma is equivalent to that dropped on the externalresistance. In order words, this happens when the plasma resistancenearly equals the external resistance [17].
A power supply was custom made (Quinta, Ltd.) to efficientlysupply the needs of the gliding arc system stabilized by the magneticfield. It was designed to produce a magnetically stabilized arc withthe capability of restricting current whilemaintaining smooth currentregulation. This was accomplished by minimizing the active energylosses with the use of a reactive capacitive resistance that imitates theresistive voltage at all times. Tominimize the output electric capacityand to provide the voltage-current characteristic of the power supply(which is close to the resistive voltage-current characteristics),changing the frequency of the high-voltage converter allowedvariation of the virtual resistance. After the output rectifier, there wasunidirectional voltage and current with a very high frequency of theresidual pulsation. The plasma arc behavior was then the same as thatfor the plasma arc at a constant current and voltage because of thelimited time response of the gliding arc. This ensures that it operatedmore or less in the nonthermal regime. Also, during operation, thecurrent can be reduced manually (causing a corresponding increasein voltage) to lower values than were possible before it extinguishesand restarts again (i.e., instability sets in).
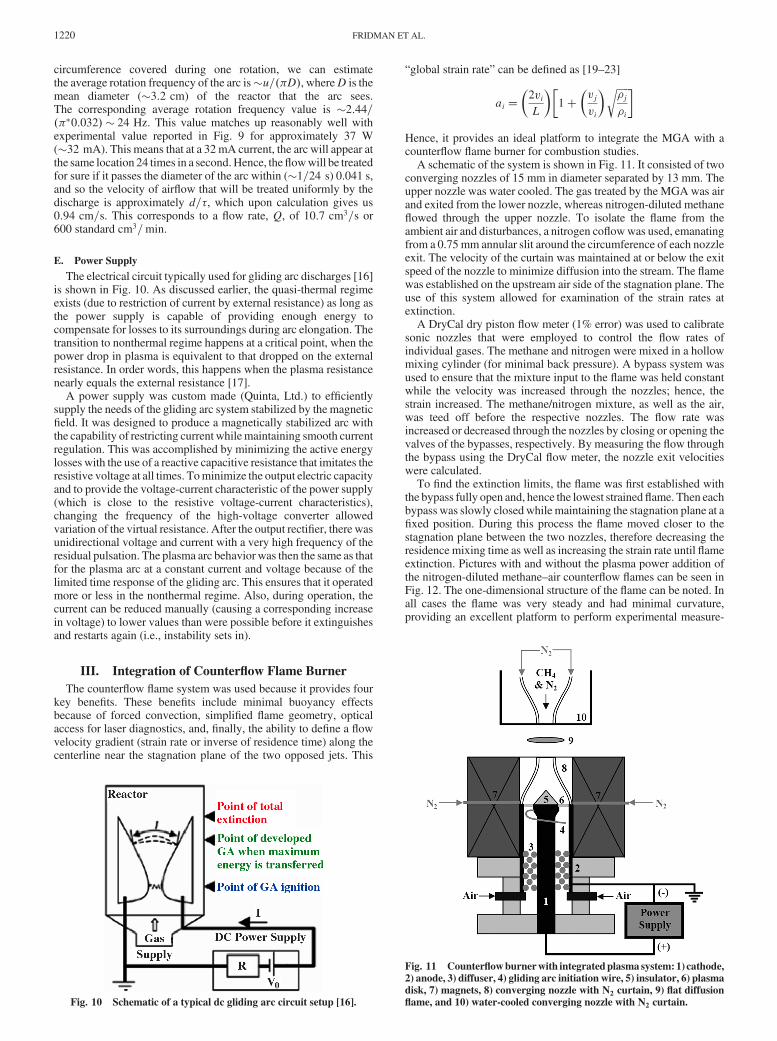
III. Integration of Counterflow Flame Burner
The counterflow flame system was used because it provides fourkey benefits. These benefits include minimal buoyancy effectsbecause of forced convection, simplified flame geometry, opticalaccess for laser diagnostics, and, finally, the ability to define a flowvelocity gradient (strain rate or inverse of residence time) along thecenterline near the stagnation plane of the two opposed jets. This
“global strain rate” can be defined as [19–23]
ai ��2viL
��1�
�vjvi
� ������j�i
r �
Hence, it provides an ideal platform to integrate the MGA with acounterflow flame burner for combustion studies.
A schematic of the system is shown in Fig. 11. It consisted of twoconverging nozzles of 15 mm in diameter separated by 13 mm. Theupper nozzle was water cooled. The gas treated by the MGAwas airand exited from the lower nozzle, whereas nitrogen-diluted methaneflowed through the upper nozzle. To isolate the flame from theambient air and disturbances, a nitrogen coflowwas used, emanatingfrom a 0.75 mm annular slit around the circumference of each nozzleexit. The velocity of the curtain was maintained at or below the exitspeed of the nozzle to minimize diffusion into the stream. The flamewas established on the upstream air side of the stagnation plane. Theuse of this system allowed for examination of the strain rates atextinction.
A DryCal dry piston flow meter (1% error) was used to calibratesonic nozzles that were employed to control the flow rates ofindividual gases. The methane and nitrogen were mixed in a hollowmixing cylinder (for minimal back pressure). A bypass system wasused to ensure that the mixture input to the flame was held constantwhile the velocity was increased through the nozzles; hence, thestrain increased. The methane/nitrogen mixture, as well as the air,was teed off before the respective nozzles. The flow rate wasincreased or decreased through the nozzles by closing or opening thevalves of the bypasses, respectively. By measuring the flow throughthe bypass using the DryCal flow meter, the nozzle exit velocitieswere calculated.
To find the extinction limits, the flame was first established withthe bypass fully open and, hence the lowest strainedflame. Then eachbypass was slowly closedwhile maintaining the stagnation plane at afixed position. During this process the flame moved closer to thestagnation plane between the two nozzles, therefore decreasing theresidence mixing time as well as increasing the strain rate until flameextinction. Pictures with and without the plasma power addition ofthe nitrogen-diluted methane–air counterflow flames can be seen inFig. 12. The one-dimensional structure of the flame can be noted. Inall cases the flame was very steady and had minimal curvature,providing an excellent platform to perform experimental measure-
Fig. 10 Schematic of a typical dc gliding arc circuit setup [16].
flame, and 10) water-cooled converging nozzle with N2 curtain.
1220 FRIDMAN ET AL.
ments via laser diagnostics. These results were computationallyreproducible. There was also a noticeable difference in luminositybetween the flame with (Fig. 12a) and without (Fig. 12b) plasmaactivation of the airstream. The flame with plasma activation of theair had a larger luminous zone with a distinct white and orangecoloring as compared with the typical bright blue of the nonactivatedflame. This indicated that there was an effect of the MGA on thediffusion flame.
IV. Description of Diagnostic Systems
A. Plasma Diagnostic System
For optical emission spectroscopy from the air plasma, an ActonResearch SpectraPro 500i scanning monochromator was used. Theentrance slit to the monochromator was placed a few inches awayfrom the discharge, facing the discharge. Spatially averagedemission spectra of the discharge were taken in a range of 200–450 nm. A Roper Scientific model 7430CCD camera was mountedonto the exit slit to digitally acquire the spectra at a resolution ofapproximately 0.6 nm, with typical acquisition times for the charge-coupled device (CCD) images being 1–5 s. When the discharge wasnot in operation, a background noise spectrum was obtained. Thiswas then subtracted from the experimental data to improve theaccuracy of the results. A low-pressure mercury lamp was used todetermine the slit (apparatus) function and calibrate thespectrometer.
For estimations of the current density, an imaging systemwas usedand consisted of a Nikon D70 SLR camera with a Sony CCD-typesensor. The sensor, sized 23:7 mm � 15:5 mm (Nikon DX), wasused to capture images at a resolution of 3008 � 2000 pixels (�6megapixels). The shutter speeds available ranged from 30 to 1/8000 s, which could be used to capture instantaneous arc images.These images were used to determine the approximate widths of thechannels at various zones in the plasma discharge.
B. Rayleigh Scattering and OH Planar Laser-Induced Fluorescence
for Flame
To obtain a detailed view of the structure of the MGA-activatedcounterflow diffusion flames, measurements of the temperatureprofiles and OH distributions were performed via planar Rayleighscattering and OH PLIF, respectively. A schematic of the systemsused can be seen in Fig. 13. A frequency-doubled, injection-seededNd:YAG laser (Quanta-Ray GCR-4) with an output ofapproximately 450 mJ per pulse was used. For OH measurements,the OH was excited via a Lumonics HD-300 dye laser pumped withthe aforementioned Nd:YAG laser (Fig. 13). The scattering wasimaged with a Princeton Instruments PIMAX intensified CCDcamera (one with a photocathode optimized for the visible spectrumfor Rayleigh scattering and one for the UV spectrum for OHfluorescence). For Rayleigh scattering, a Nikon 105mm, f/2.8 macrolens was used whereas, for OH PLIF, a Nikon UVNikkor 105 mm f/4.5 lens was used along with UG-11 andWG-295 Schott glass filtersto isolate fluorescence from the A-X(0,0) and A-X(1,1) bands andblock background scattering. Both cameras employed a 512 by512 pixel array that was binned to improve the framing rate.
To calibrate the Rayleigh scattering signal, images of thescattering intensity were taken of clean, particle-free air (at a knowntemperature) that was directed through the lower nozzle. To calibratethe intensity seen from theOHPLIF to an absolute number density ofOH, measurements were first taken of a known system with theequivalent experimental arrangement. A detailed description of theplanar Rayleigh scattering and OH PLIF system operation andcalibration has been described in Ombrello et al. [24].
V. Results and Discussion
A. Plasma Characterization
The flat GA has been thoroughly studied over the years for itstransition from the thermal to nonthermal regime. However, theMGA is a relatively new discharge that needs to be studied tocharacterize its nonequilibriumnature. Optical diagnostic techniqueswere employed to estimate average rotational and vibrationaltemperatures in the MGA using OH and N2 emission spectraobtained from the discharge.
1. OH Spectrum for Rotational Temperature
A spatially averaged optical spectrum was obtained from theMGA plasma disk operating at approximately 32 mA, 37 W atnormal pressure in air [25]. The experimental spectrum, as seen inFig. 14, had three major lines,G0,G1, andGref , that were of the mostimportance in the temperature range from 1000 to 4000 K. This isbecause the reference peak,Gref , is the strongest group of unresolvedlines and G0 and G1 are highly sensitive to temperature variation inthis range. For temperatures above 4000 K, their sensitivity is
Fig. 14 OH spectrum obtained both experimentally (at �80 W) and
theoretically for different temperatures varying from 1000 to 6000 K.
Fig. 12 Photographs of methane–air counterflow diffusion flames at a
strain rate of 298:5 s�1: a) no plasma power addition, and b) 60 W of
plasma power addition.
FRIDMAN ET AL. 1221
relatively low [26]. Hence, the ratios of these peaks are bestconsidered for diagnostic analysis. A theoretical spectrum was thengenerated using the technique specified in de Izarra [26] and Pellerinet al. [27] by collecting data pertaining to the OH spectrum as studiedby Dieke and Crosswhite [28] in the paper of de Izarra [26], whereinweak transitions were neglected and a set of delta functionscorresponding to the strong transitions were generated from thefollowing relation:
Inm � Inmref
Z�Tref�Z�T� e
�En��Tref�T��T�Tref �
where Inm is the intensity of the OH transitions (in nanometers) andoccurs at a specific wavelength, En is the energy of the initial state,and Tref is the temperature at which the reference intensities Inmref
were obtained. The parameterswere taken from the fundamental datafound in de Izarra [26]. There, the ratio of the partition functions,Z�Tref�=Z�T�, was assumed to be unity. By using different values oftemperature, T, the corresponding normalized intensities werecomputed. Delta functions corresponding to each transition werethen convolutedwith an apparatus function (i.e., impulse response ofthe optical device) obtained by employing sharp lines emitted by alow-pressure mercury lamp. Figure 14 shows a theoretical plot fortemperatures in 500 K increments for the range of 1000–6000 K andtheir comparisonwith thosemeasured in the experiments. The bestfitof the ratios ofG0 andG1 to Gref yielded a rotational temperature of2350 150 K, as shown in Fig. 15. The rotational temperatureresults obtained from this theoretical analysis were compared withSpectrum Analyzer software to identify peaks and computerotational and vibrational temperatures.∗∗ The results obtained fromSpectrum Analyzer software are more refined when larger numbersof correctly identified lines are used. The results obtained (Fig. 16)agreed with our calculations, giving an average OH rotationaltemperature of �2360 400 K. The vibrational temperaturecomputed (Fig. 17) was found to be �3500 600 K.
2. The N2 Spectrum for Rotational and Vibrational Temperatures
A spatially averaged N2 spectrum was obtained from the MGAplasma disk operating at approximately 37 W at normal pressure inair. Using the SpecAir [29] code, the experimental and theoreticalplots were compared and, using best fit analysis, the N2 rotationaltemperature obtained was �3000 K. This result was in agreementwith the investigations pertaining to gliding arcs reported previously[30,31]. Figure 18 shows thefit of theoretical and experimental plots,with the best fit obtained for a vibrational temperature of �4000 K.
The discrepancy between the spatially averaged temperaturesmeasured using different species (i.e., OH andN2 in our case) can bespecifically explained by the fact that the measurements wereconductedwithout spatial resolution and that themaximum radiationof different radicals could come from different parts of the dischargewith different temperatures. For example, in the study of the glidingarc in air using optical methods [32], molecular spectra of OH andN�2 band heads at 306.3 and 391.4 nm, respectively, were used. Theyproposed the plasma column to be divided into two regions, onebeing the core in which the intensity ofN�2 lines are observed and theother being the outer “flame” in which the radiation from OH istypical of the surrounding excited molecular region.
A spatially resolved spectrum was also obtained to determine theN2 rotational temperature in the cathode spot (CS) region (shown inFig. 19) for 32 mA, 37W conditions and was found to be�1610 K.
Fig. 15 The ratios of G0=Gref and G1=Gref peaks as a function of OH
rotational temperature in theMGA. The comparison of the theoreticallygenerated plot with the experimental result yields a temperature of
∗∗Data available online at http://www.physics.muni.cz/~zdenek/span/[retrieved 3 September 2008].
1222 FRIDMAN ET AL.
A spatially resolved OH spectrum could not be obtained for thepresent experimental setup because the microscope used restrictedour measurements to�360 nm and above. However, it is within thescope of our future work with the use of UV lenses.
3. Electric Field in MGA Plasma Arc
The snapshots in Fig. 19 show the gliding arc structure at differentoperating conditions: 35 (Fig. 19a), 102 (Fig. 19b), and 158 mA(Fig. 19c). For characterization of the plasma, we split the plasmainto two zones, namely, 1) cathode spot or negative glow, and2) plasma channel or positive column (PC). It was possible to noticethat the CS width increased with current, thus keeping the currentdensity nearly constant (covered in Sec. V.A.5 in this paper). This istypical for nonthermal atmospheric pressure glow discharge whereinthe normal current density remains constant [33,34]. However, it isimportant to resolve the electric field in these zones, as it wasexpected to have a significant voltage drop in the CS.
The typical value for voltage drops in the CS of glow dischargesoperating in air with iron electrodes is �260 V [34]. Using visualquantification from high-speed camera arc images, the approximatethickness of the cathode layer (Fig. 19a) is estimated to be�0:03 cm.Hence, the electric field E� 8000 V=cm and the reduced electricfield E=n� 175 Td (1 Td� 10�17 V:cm2) using a spatiallyresolved CS temperature of T � 1600 K.
It follows that the voltage drop in the PC� �1150 � 260 V��890 V. Again, imaging analysis yielded a length of the PC to beapproximately 1.5 cm. Hence, the electric field E� 593 V=cm andreduced electric field E=n� 17–23 Td, using spatially averagedT � 2200–3000 K.
The electric field can be used as a parameter for the comparison ofour discharge with nonthermal glow discharges for which thereduced electric field values typically are in the range of�3–30 V=cm=torr [34]. Using the calculated effective pressureparameters as discussed, we estimate reduced electric field values offor our conditions of �6–8 V=cm=torr in the plasma column of thedischarge, which is within the range of nonthermal discharges. Also,previous investigations [35] for conventional GA reveal that it ispossible to have a nonthermal regime at reduced electric fields as lowas 2:4 V=cm=torr.
4. Average Electron Energy Estimations
Using the parameters of the system, such as the geometry, andassuming that the electric field is uniform through the PC, thereduced electric field range obtained was for the CS and the PCregions (computed earlier, above). A Boltzmann equation solver,BOLSIG, was employed to calculate the average electron energy vsthe reduced electric field for air, that is, 80% N2 and 20% O2.
†† Theresults obtained gave �4:75 eV for the CS region and�1:03–1:06 eV for the PC region at atmospheric pressure air
conditions. These high electron temperature estimates relative to therotational gas temperature (energies �0:13–0:25 eV) suggest thetwo-temperature (nonequilibrium) nature of the MGA.
5. Current Density Estimations
FromFig. 19, it can be noted that therewas a change in thewidth ofthe plasma column with an increase in current/power on the arc.Considering the arc to have a cylindrical structure, we assume thatthis width corresponded to the diameter of the gliding arc. By usingthese diameters and quantifying them based on the length per pixelfrom known dimensions, we obtain approximate cross-sectionalareas of the arc column. In Sec. II.D, the frequency of arc rotationwith current was presented. Using these results and the diameters/widths of the arc obtained by visual inspection and quantification at a1=8000 s exposure time, we needed to incorporate a diametricalcorrection based on the frequency of arc rotation. These wereapproximated by the following relation:
d� dmeas � �Dft
wheredwas the corrected diameter of the arc,dmeaswas themeasureddiameter of the arc, D was the diametrical position in the device atwhich the measurement was taken, f was the frequency of arcrotation, and t was the exposure time. As mentioned earlier, for thenonthermal characterization of plasma, we consider the arc to bedivided into CS zone and PC (rest of the arc) zone. Figure 20 showsplasma current density (A=cm2) results obtained by dividing thevalue of current with the cross-sectional area, calculated by theaforementioned assumptions. In low-pressure nonthermal plasmasfor air at room temperature and iron electrodes, the typical currentdensity is �300 �A=cm2=torr2 [33,34].
In low-pressure nonthermal plasma, the ratio of electric field E tothe pressure of operationp, that is,E=p, or the ratio of electricfield tothe gas number density n, that is, E=n, governs various plasmaparameters. It is also sometimes known as the reduced electric field(REF). This scaling is applicable only if the gas temperature is roomtemperature, which is in the case of low-pressure nonthermalplasmas. However, in the case of atmospheric nonthermal plasmas,the gas temperature is typically higher than room temperature, inwhich case a scaling needs to be incorporated. The REF parameter isscaled based on effective pressure, Peff � Patm�Troom=Tactual�, wherePeff is the effective pressure,Patm is the atmospheric pressure,Troom isthe room temperature, and Tactual is the gas temperature of the plasmaunder consideration. The scaling is favorably formulated so as topreserve its initial values at room temperature.
Using this result for our conditions, that is, T � 1600 K (fromspatially resolved diagnostic results for the CS zone) and scaling thepressure using the number density, the effective pressure ofPeff � 760 torr��300=1600 K� � 141:6 torr, and operating at32 mA, 37 W conditions, we got a current density of �6 A=cm2,which is reasonably close to our experimentally estimated value inthe CS zone �4:7 A=cm2. Also, from spatially averaged rotational
Fig. 19 Photographs taken by a high-speed camera capturing a single
magnetically driven arc in motion. The two main regions of the
discharge, namely the CS and PC, can be clearly seen.
Fig. 20 Estimated MGA plasma current density in the CS and PC.
††Data about the Kinema Research & Software BOLSIG, BoltzmannEquation Solver available online www.kinema.com [retrieved 3 Septem-ber 2008]
FRIDMAN ET AL. 1223
temperature values of T � 2200–3000 K, the current densityestimate in the PC zone was �6:9 A=cm2. As the current wasincreased, the temperature was expected to increase as well, whichdecreased the Peff value, thereby decreasing the expected currentdensity from literature estimations. Thiswas observed in the CS data.However, in the PCdata, an increase in current densitywas observed,which possibly could be compared with the property of contractionof nonthermal glow discharge with an increase in current.
6. Electron Density Estimations
The electron density in the PC could approximately be estimatedfrom the current density, j, and the electron drift velocity, vd, fromthe relation j=�e vd�. From the aforementioned estimations, thecurrent density in the PC for I � 32 mA is �6:9 A=cm2.Using T � 2200–3000 K, we applied a corresponding E=n�17 Td–23 Td into BOLSIG to compute the electron drift velocity of��2–3:7� � 107 cm=s and thereby the electron density of��2:2 � 1:2� � 1012 1=cm3, respectively; this gave an ionizationdegree of ��6:22 � 4:5� � 10�7. These results are reasonablyconsistent with previous estimations in gliding arcs [30,31].
B. Diagnostics and Measurements of Interaction Between Plasma
Species and Diffusion Flame
Experimental measurements of the extinction limits, planarRayleigh scattering for temperature profiles, OH PLIF for absoluteOH number density, and numerical computations with radicaladdition were performed to quantify the combustion characteristics.Numerical computationswere performed using amodified version ofthe PREMIX code [36] for both potential and plug flow boundaryconditions and using the detailed chemical mechanism of GRI-3.0[37].‡‡ Temperatures were measured just downstream of the exit ofthe nozzles via Rayleigh scattering thermometry and were used asinputs into the numerical computation. This was repeated for each ofthe various flow, concentration, and plasma power conditions.
1. Extinction Measurements
The extinction limits for the counterflow flames were observedwith and without plasma power addition. The strain rates for bothsituations were increased, causing the flame to move toward thestagnation plane, continuously increasing the heat loss anddecreasing the residence time for reaction completion, eventuallyleading to extinction. The measured values for the strain rates atextinction can be seen in Fig. 21 for three different combinations ofnitrogen-diluted methane–air counterflow diffusion flames forvarious levels of plasma power. The extinction limits with no plasmapower addition agree well with values reported by Puri and Seshadri[19] and Bundy et al. [23]. It was observed that, by using only 78 Wof plasma power input, there was a�220% increase in the extinctionstrain rate. This power input was less than 6% of the flame power,defined as themaximumpower that could be obtained from the givenamount of fuel in the mixture. These results showed that there was asignificant extinction limit enhancement by using the MGAactivation of the air. However, the reasons for this effect are notapparent as of now.
In the quest to obtain an explanation for the enhancement, theresults for the extinction strain rates were then compared with that ofthe numerical computation. The results shown in Fig. 22 describe themaximumvelocities (proportional to the strain rates) achieved beforeextinction of the flame. Because the input to the computation wasonly elevated temperatures (obtained from theRayleigh scattering, tobe described in Sec. V.B.2) to mimic the plasma, and both theexperiment and computation extinction results were in goodagreement, this gave an indication that the effect of thenonequilibrium plasma on the flame was predominately thermal,within the scope of current measurements.
2. Rayleigh Scattering Intensity Ratio and Temperature Profiles
Toobtain a detailed look at the structure of theflame enhancement,quantitative measurements of the temperature distribution werefound and compared with the numerical simulations. PlanarRayleigh scattering thermometry was performed on the counterflowflame for various strain rates to accomplish this. The laser sheet waspassed through the diameter of the disk-shaped counterflow flamebetween the nozzles of the burner. Two sample images can be seen inFig. 23, in which Fig. 23a shows no plasma power addition andFig. 23b shows approximately 33 W of plasma power addition. Thebackground has been subtracted and the air reference divided intoeach image. The intensity observedwas a function of scattering crosssections and number density distributions between the nozzles. Theflame was located in the darkest region of these images (transition
Fig. 21 Effects of plasma power addition on the strain rates at
extinction for different levels of nitrogen dilution.
Fig. 22 Comparison of nozzle exit velocities at extinction.
Fig. 23 Rayleigh scattering images at a strain rate of 98:6 s�1: a) noplasma power addition, and b) 33 W of plasma power addition.
‡‡Data available online at http://www.me.berkeley.edu/gri_mech/[retrieved 3 September 2008].
1224 FRIDMAN ET AL.
from dark to light depicts descending values of temperature andincreased scattering). The nitrogen-diluted methane mixture isentering thefield of view from the top of the images and the air (MGAside) from the bottom of the images. The one-dimensional flamestructure along the flow direction was observed even with the use ofthe MGA. This result greatly simplified the coupling between theflowfield and the plasma–flame interaction. By comparing the twoimages, it was possible to differentiate them based on the extent ofdarkness, indicative of less scattering and higher temperatures. It canbe observed that the region below the flame in Fig. 23b (plasma on) isdarker than in Fig. 23a (plasma off). In each case, an averagedtemperature from a 10-pixel-wide “stripe” was taken from eachimage. These measured temperatures at the boundaries (justdownstreamof the nozzles) were then used as boundary conditions inthe numerical computation.
The intensity observed by the intensified charge-coupled device(ICCD) camera was a function of both the scattering cross section,because of the distribution of different species, and the numberdensity change between the two nozzles. By simply referencingthose intensities to the intensity of air at room temperature, ratioswere found. These measurements were then compared with those ofthe numerical computation, and the results can be seen in Fig. 24 forboth the plasma power off (to justify the use of the code for ourapplication) and on. It can be seen that there was reasonably goodagreement between the experiment and computation (the oscillationsobserved can be attributed to the absorptive filters used to “clip” thesheet to reduce scattering off the burner surfaces). Once again, theagreement between the experimental and computational resultssuggest that the enhancement via the MGA was predominatelythermal, within the scope of current measurements.
Because the temperatures, and hence the concentrations ofspecies, change between the nozzles due to the presence of the flame,the scattering cross sections and number densities also change.However, number densities can be estimated from temperature,whereas the scattering cross sections cannot. The scattering crosssections need to be known at each point along the profile as areference to derive the temperature. Therefore, the speciesconcentrations associated with specific temperatures and axialpositions from the numerical computation were used to convertscattering signal to temperature. Using refractory data fromGardineret al. [38], the variation in scattering cross sections gave accuratetemperature profiles from the Rayleigh scattering. The temperatureprofiles found from the Rayleigh scattering were then comparedwiththe results of the numerical computation at the same inputtemperatures and flow conditions to further validate the use of thenumerical computation for our specific application. Figure 25 showsthe temperature profile comparisons of the experimental results viaRayleigh scattering and the numerical computation using the GRI-3.0mechanism. The profiles, once again, are in good agreement. Thisfurther shows that the effect of the MGA on the flame waspredominately thermal, within the scope of current measurements.
To investigate further and confirm that the enhancement of theflame via the MGA was dominated by thermal effects, OH PLIFmeasurements were performed. The OH number density wasmeasured for different plasma powers and strain rates and referencedto a Hencken burner flame, as described in a previous work byOmbrello et al. [24], to find the absolute OH number density.Figure 26 shows the results from the OH PLIF measurements whencompared with the computation with and without plasma poweraddition. The plots show reasonably good agreement (within theuncertainty range of the measurement 15%) between theexperiment and the computation, therefore once again showing thatthe effect of the MGA on the flame was predominately thermal.
4. Radical Addition
Because the enhancement of the strain rates at extinction via theMGA were observed to be predominately thermal, it would bereasonable to calculate the lifetime of the radicals produced by theplasma discharge in the airstream to see if they reach the flame. Forthis, because the plasma is only activating dry air, it can be assumedthat the radicals produced in the flame will only consist of oxygenand nitrogen. As an example, the effect of oxygen atom addition atthe air side boundary on theflame structurewill be shown (once againmimicking the plasma), because the nitrogen atom addition plays asimilar role. Oxygen atom concentrations from 0.01 to 1% wereadded at the air (plasma) side boundary. The temperaturewas fixed at400 K at this boundary to ensure that low-temperature chemistry didnot come into play.Also, the velocities at the boundarieswere similarto those used in the experiment for a flame that is highly strained andnear extinction, for which radical addition may be important. A plotof the temperature profiles and oxygen atom concentrationdistributions between the nozzles can be seen in Fig. 27. It is shown
Fig. 24 Comparison of Rayleigh scattering intensity ratio profiles with0, 30, and 60Wof plasma power addition at strain rates of 87.1, 98.6, and
298:5 s�1, respectively.
Fig. 25 Comparison of temperature profiles with 0, 33, and 60 W of
plasma power addition at strain rates of 87.1, 98.6, and 298:5 s�1,respectively.
Fig. 26 Comparison of OH number density (cm�3) distributions with0, 48, and 78 W of plasma power addition at strain rates of 83.3, 127.7,
and 183:0 s�1, respectively.
FRIDMAN ET AL. 1225
that there was no significant effect until almost 1% oxygen atomaddition. The MGA plasma disk is located almost 4 cm upstream ofthis boundary, which is the production site for oxygen atoms.However, because we do not observe any nonthermal enhancementin our results thus far, it can be construed that these radicalsrecombine well before they reach the flame, producing only elevatedair temperatures. The radical-induced nonthermal effects on theburning rate of diffusion flames are very limited at low airtemperatures because the radical lifetime is too short to affect thechain branching reaction path. Figure 28 shows computationalsimulations of oxygen atom radical lifetimes as a function oftemperatures and pressures of operation.
C. Plasma-Induced Ignition Enhancement of Hydrogen
1. Measurements of Ignition Points for H2–Air Flame
To observe nonthermal contributions from active species,especially radicals and ions, the previous results suggested that it wasnecessary for us to go to elevated temperatures or reduced pressures.The first step was to simply consider elevated temperatures. For this,ignition experiments were performed using a preheater and theMGAon the upstream air side of the counterflow burner. This systemwould allow for increased radical lifetimes, suppressing their rapidrate of recombination. By simply adding a preheater to the currentcounterflow system upstream of theMGAplasma disk, the apparatuscould be transformed into an ignition system that was able to provideelevated temperatures. The combination of the gliding arc, elevatedtemperatures, and the precondition of no flame, before ignition,would allow for an ideal platform to observe the effect of ignitionenhancement. Our experimental data using MGA activation of the
airstream, starting with hydrogen as the fuel, could simply becompared with those of the published data on counterflow hydrogendiffusion flame ignition via heated air. Thus, any differences seenbetween the heated air ignition and the heated air plus gliding arcactivation ignition would be nonthermal.
To accomplish all of this, a silicon carbide heater was placedupstream of the gliding arc plasma discharge device, effectivelyraising the air temperature to allow for the ignition of hydrogen. TheMGA was turned on and the heater power, and hence the airtemperature, was raised until the hydrogen diffusion flame ignited.The temperature of the hot airstream was measured with a 0.005-in.-diam type r thermocouple axially located between the two jets of thecounterflow burner, where the flame would be established. Thetemperature readings from the thermocouple were corrected forradiation. The results of the ignition temperatures using the preheaterand MGA compared with the published data using only a preheater[39] can be seen in Fig. 29. The ignition temperatures obtained aresignificantly lower than those of just heated air, implying that there ismore than just a thermal effect. This can possibly be due to theelevated temperatures leading to longer radical lifetimes. Themechanism of this enhancement needs to be investigated further but,at a minimum, these results offer up the observation of possiblenonthermal effects using an ideal system for the plasma–flameinteraction.
2. Autoignition Enhancement of H2–Air Mixtures
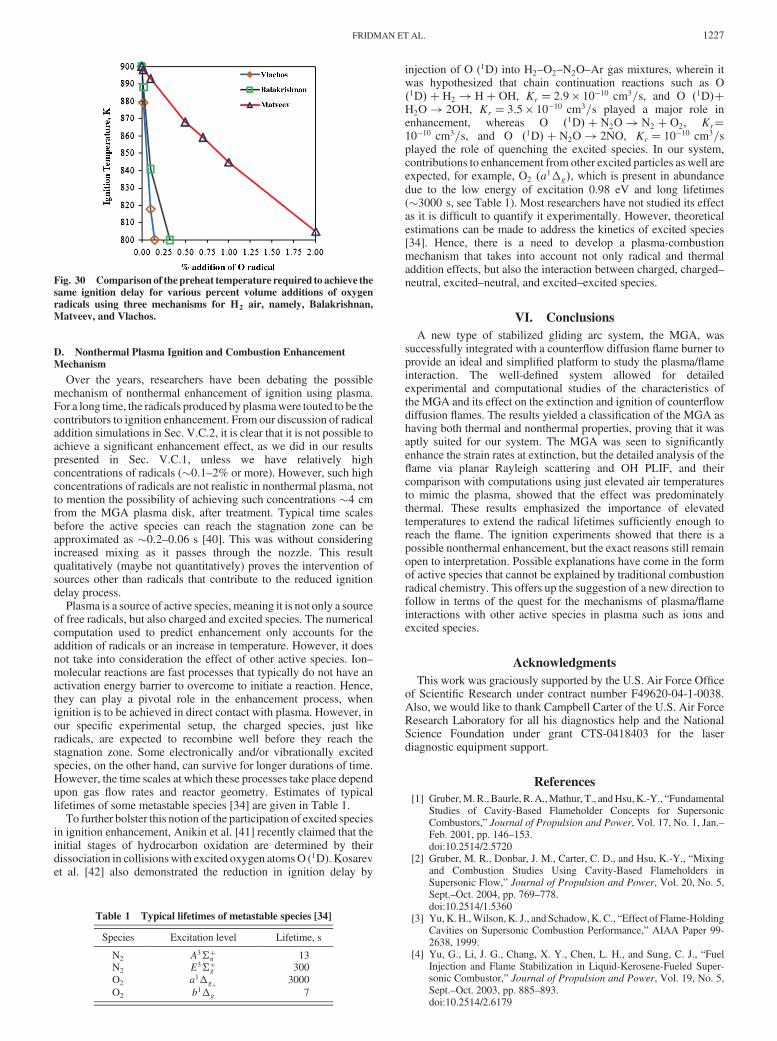
To understand these result better, kinetic computations for theignition of H2–air stoichiometric mixtures were conducted usingthree different mechanisms, namely, Balakrishnan, Matveev andVlachos, available and simulated in Chemical Workbench.§§ Theignition time delays for preheated H2–air mixtures at 900 K werefound to be �115, 80, and 3 ms, respectively, for the threeaforementioned mechanisms. Atomic oxygen radicals (that areexpected to be generated from dry air, as discussed earlier) were thenadded to the incoming charge to observe the radical enhancementeffect, if any. When a reduction in delay time was observed for aparticular amount of addition of O radicals, the preheat temperaturewas reduced such that the ignition occurred after the same time delayas it did without radical addition. Hence, it was possible to arrive at aradical concentration that was required to cause the sameenhancement effect with the preheat temperature of 800K. Figure 30shows that about 0.1–2% by volume atomic oxygen addition isrequired to cause a 100 K reduction in required preheat. Such a highconcentration of radicals is not reasonable even inside nonthermalplasma and especially not after a significant residence time beyondthe confines of the plasma.
Fig. 27 Computed temperature and oxygen atom distributionsbetween the nozzles of the counterflow system with the oxygen atom
addition.
Fig. 28 Oxygen radical lifetimes in air for typical residence times in theMGA counterflow burner system. It is seen that increasing the
temperature or reducing the pressure can help the radicals survive until
they reach the flame.
Fig. 29 Comparison of ignition temperatures of counterflow hydrogen
diffusion flames using preheater with preheater and gliding arc
activation of the airstream.
§§Data about Chemical Workbench Software, Kinetic Technologies,KINTECH, Ver. 3.3, available online at www.kintech.ru [retrieved3 September 2008].
1226 FRIDMAN ET AL.
D. Nonthermal Plasma Ignition and Combustion Enhancement
Mechanism
Over the years, researchers have been debating the possiblemechanism of nonthermal enhancement of ignition using plasma.For a long time, the radicals produced by plasmawere touted to be thecontributors to ignition enhancement. From our discussion of radicaladdition simulations in Sec. V.C.2, it is clear that it is not possible toachieve a significant enhancement effect, as we did in our resultspresented in Sec. V.C.1, unless we have relatively highconcentrations of radicals (�0:1–2% or more). However, such highconcentrations of radicals are not realistic in nonthermal plasma, notto mention the possibility of achieving such concentrations �4 cmfrom the MGA plasma disk, after treatment. Typical time scalesbefore the active species can reach the stagnation zone can beapproximated as �0:2–0:06 s [40]. This was without consideringincreased mixing as it passes through the nozzle. This resultqualitatively (maybe not quantitatively) proves the intervention ofsources other than radicals that contribute to the reduced ignitiondelay process.
Plasma is a source of active species, meaning it is not only a sourceof free radicals, but also charged and excited species. The numericalcomputation used to predict enhancement only accounts for theaddition of radicals or an increase in temperature. However, it doesnot take into consideration the effect of other active species. Ion–molecular reactions are fast processes that typically do not have anactivation energy barrier to overcome to initiate a reaction. Hence,they can play a pivotal role in the enhancement process, whenignition is to be achieved in direct contact with plasma. However, inour specific experimental setup, the charged species, just likeradicals, are expected to recombine well before they reach thestagnation zone. Some electronically and/or vibrationally excitedspecies, on the other hand, can survive for longer durations of time.However, the time scales at which these processes take place dependupon gas flow rates and reactor geometry. Estimates of typicallifetimes of some metastable species [34] are given in Table 1.
To further bolster this notion of the participation of excited speciesin ignition enhancement, Anikin et al. [41] recently claimed that theinitial stages of hydrocarbon oxidation are determined by theirdissociation in collisionswith excited oxygen atomsO (1D). Kosarevet al. [42] also demonstrated the reduction in ignition delay by
injection of O (1D) into H2–O2–N2O–Ar gas mixtures, wherein itwas hypothesized that chain continuation reactions such as O�1D� � H2 ! H� OH, Kr � 2:9 � 10�10 cm3=s, and O �1D��H2O! 2OH, Kr � 3:5 � 10�10 cm3=s played a major role inenhancement, whereas O �1D� � N2O! N2 � O2, Kr�10�10 cm3=s, and O �1D� � N2O! 2NO, Kr � 10�10 cm3=splayed the role of quenching the excited species. In our system,contributions to enhancement from other excited particles as well areexpected, for example, O2 �a1�g�, which is present in abundancedue to the low energy of excitation 0.98 eV and long lifetimes(�3000 s, see Table 1). Most researchers have not studied its effectas it is difficult to quantify it experimentally. However, theoreticalestimations can be made to address the kinetics of excited species[34]. Hence, there is a need to develop a plasma-combustionmechanism that takes into account not only radical and thermaladdition effects, but also the interaction between charged, charged–neutral, excited–neutral, and excited–excited species.
VI. Conclusions
A new type of stabilized gliding arc system, the MGA, wassuccessfully integrated with a counterflow diffusion flame burner toprovide an ideal and simplified platform to study the plasma/flameinteraction. The well-defined system allowed for detailedexperimental and computational studies of the characteristics ofthe MGA and its effect on the extinction and ignition of counterflowdiffusion flames. The results yielded a classification of the MGA ashaving both thermal and nonthermal properties, proving that it wasaptly suited for our system. The MGA was seen to significantlyenhance the strain rates at extinction, but the detailed analysis of theflame via planar Rayleigh scattering and OH PLIF, and theircomparison with computations using just elevated air temperaturesto mimic the plasma, showed that the effect was predominatelythermal. These results emphasized the importance of elevatedtemperatures to extend the radical lifetimes sufficiently enough toreach the flame. The ignition experiments showed that there is apossible nonthermal enhancement, but the exact reasons still remainopen to interpretation. Possible explanations have come in the formof active species that cannot be explained by traditional combustionradical chemistry. This offers up the suggestion of a new direction tofollow in terms of the quest for the mechanisms of plasma/flameinteractions with other active species in plasma such as ions andexcited species.
Acknowledgments
This work was graciously supported by the U.S. Air Force Officeof Scientific Research under contract number F49620-04-1-0038.Also, we would like to thank Campbell Carter of the U.S. Air ForceResearch Laboratory for all his diagnostics help and the NationalScience Foundation under grant CTS-0418403 for the laserdiagnostic equipment support.
References
[1] Gruber,M.R., Baurle, R.A.,Mathur, T., andHsu,K.-Y., “FundamentalStudies of Cavity-Based Flameholder Concepts for SupersonicCombustors,” Journal of Propulsion and Power, Vol. 17, No. 1, Jan.–Feb. 2001, pp. 146–153.doi:10.2514/2.5720
[2] Gruber, M. R., Donbar, J. M., Carter, C. D., and Hsu, K.-Y., “Mixingand Combustion Studies Using Cavity-Based Flameholders inSupersonic Flow,” Journal of Propulsion and Power, Vol. 20, No. 5,Sept.–Oct. 2004, pp. 769–778.doi:10.2514/1.5360
[3] Yu,K.H.,Wilson, K. J., and Schadow,K. C., “Effect of Flame-HoldingCavities on Supersonic Combustion Performance,” AIAA Paper 99-2638, 1999.
[4] Yu, G., Li, J. G., Chang, X. Y., Chen, L. H., and Sung, C. J., “FuelInjection and Flame Stabilization in Liquid-Kerosene-Fueled Super-sonic Combustor,” Journal of Propulsion and Power, Vol. 19, No. 5,Sept.–Oct. 2003, pp. 885–893.doi:10.2514/2.6179
Fig. 30 Comparison of the preheat temperature required to achieve the
same ignition delay for various percent volume additions of oxygen
radicals using three mechanisms for H2 air, namely, Balakrishnan,
Matveev, and Vlachos.
Table 1 Typical lifetimes of metastable species [34]
[5] Yu, G., Li, J. G., Zhang, X. Y., Chen, L. H., Han, B., and Sung, C. J.,“Experimental Investigation on Flameholding Mechanism andCombustion Performance in Hydrogen-Fueled Supersonic Combus-tors,” Combustion Science and Technology, Vol. 174, No. 3,March 2002, pp. 1–27.doi:10.1080/713712992
[6] Guerra, R., Waidmann, W., and Laible, C., “An ExperimentalInvestigation of the Combustion of a Hydrogen Jet Injected Parallel in aSupersonic Air Stream,” AIAA Paper 91-5102, Dec. 1991.
[7] Ju, Y., and Niioka, T., “Ignition Simulation of Methane/HydrogenMixtures in a Supersonic Mixing Layer,” Combustion and Flame,Vol. 102, No. 4, Sept. 1995, pp. 462–470.doi:10.1016/0010-2180(95)00047-A
[8] Tabejamaat, S., Ju, Y., and Niioka, T., “Numerical Simulation ofSecondary Combustion of Hydrogen Injected from Preburner intoSupersonic Airflow,” AIAA Journal, Vol. 35, No. 9, Sept. 1997,pp. 1441–1447.doi:10.2514/2.266
[9] Takita, K., “Ignition and Flame-Holding by Oxygen, Nitrogen andArgon Plasma Torches in Supersonic Airflow,” Combustion and
Flame, Vol. 128, No. 3, Feb. 2002, pp. 301–313.doi:10.1016/S0010-2180(01)00354-6
[10] Takita, K., Moriwaki, A., Kitagawa, T., and Masuya, G., “Ignition ofH2 and CH4 in High Temperature Airflow by Plasma Torch,”Combustion and Flame, Vol. 132, No. 4, March 2003, pp. 679–689.doi:10.1016/S0010-2180(02)00518-7
[11] Bozhenkov, S. M., Starikovskaia, S. M., and Starikovskii, A. Y.,“Nanosecond Gas Discharge Ignition of H2- and CH4 ContainingMixtures,” Combustion and Flame, Vol. 133, Nos. 1–2, April 2003,pp. 133–146.doi:10.1016/S0010-2180(02)00564-3
[12] Starikovskaia, S. M., Kukaev, E. N., Kuksin, A. Y., Nudnova, M. M.,and Starikovskii, A. Y., “Analysis of the Spatial Uniformity of theCombustion of Gaseous Mixture Initiated by Nanosecond Discharge,”Combustion and Flame, Vol. 139, No. 3, Nov. 2004, pp. 177–187.doi:10.1016/j.combustflame.2004.07.005
[13] Chintala, N., Meyer, R., Hicks, A., Bystricky, B., Rich, J. W., Lempert,W. R., and Adamovich, I. V., “Non-Thermal Ignition of PremixedHydrocarbon-Air and CO-Air Flows by Non-Equilibrium RF Plasma,”AIAA Paper 2004-0835, Jan. 2004.
[14] Sullivan, D., Zaidi, S. H., Macheret, S. O., Ju, Y., and Miles, R. B.,“Microwave Techniques for the Combustion Enhancement of LaminarFlames,” AIAA Paper 2004-3713, July 2004.
[15] Zaidi, S., Macheret, S., Vasilyak, L., Miles, R., and Ju, Y., “IncreasedSpeed of Premixed Laminar Flames in aMicrowave Resonator,”AIAA2004-2721, 2004.
[16] Kalra, C., Gutsol, A., and Fridman, A., “Gliding Arc Discharges as aSource of Intermediate Plasma for Methane Partial Oxidation,” IEEETransactions on Plasma Science, Vol. 33, No. 1, Feb. 2005, pp. 32–41.doi:10.1109/TPS.2004.842321
[17] Kuznetsova, I. V., Kalashnikov, A. F., Gutsol, A. F., Fridman, A. A.,and Kennedy, L. A., “Effect of ‘Overshooting’ in the TransitionalRegimes of the Low-Current Gliding Arc Discharge,” Journal of
Applied Physics, Vol. 92, No. 8, Oct. 2002, pp. 4231–4237.doi:10.1063/1.1505682
[18] White, F.,Viscous Fluid Flow, McGraw–Hill, NewYork, 1974, p. 207.[19] Puri, I. K., and Seshadri, K., “Extinction of Diffusion Flames Burning
DilutedMethane andDiluted Propane in Diluted Air,”Combustion andFlame, Vol. 65, No. 2, Aug. 1986, pp. 137–150.doi:10.1016/0010-2180(86)90015-5
[20] Maruta, K., Yoshida,M., Guo, H., Ju, Y., andNiioka, T., “Extinction ofLow-Stretched Diffusion Flame in Microgravity,” Combustion and
Flame, Vol. 112, Nos. 1–2, Jan. 1998, pp. 181–187.doi:10.1016/S0010-2180(97)81766-X
[21] Seiser, R., Seshadri, K., Piskernik, E., and Linan, A., “Ignition in theViscous Layer Between Counterflowing Streams: Asymptotic Theorywith Comparison to Experiments,” Combustion and Flame, Vol. 122,No. 3, Aug. 2000, pp. 339–349.doi:10.1016/S0010-2180(00)00139-5
[22] Humer, S., Seiser, R., and Seshadri, K., “Non-Premixed and PremixedExtinction and Autoignition of C2H4, C2H6, C3H6, C3H8,”Proceedings of the Combustion Institute, Vol. 29, No. 2, 2002,pp. 1597–1604.doi:10.1016/S1540-7489(02)80196-1..
[23] Bundy, M., Hammins, A., and Lee, K. Y., “Suppression Limits of LowStrain Rate Non-Premixed Methane Flames,” Combustion and Flame,Vol. 133, No. 3, May 2003, pp. 299–310.doi:10.1016/S0010-2180(03)00012-9
[24] Ombrello, T., Qin, X., Ju, Y., Gutsol, A., Fridman, A., and Carter, C.,
[25] Gangoli, S., Gutsol, A., and Fridman, A., “Rotating Non-EquilibriumGliding Arc (MGA) Plasma Disc for Enhancement in Ignition andCombustion of Hydrocarbon Fuels,” 17th International Symposium of
Plasma Chemistry, Aug. 2005, pp. 1042, 1043.[26] de Izarra, C., “UV OH Spectrum Used as a Molecular Pyrometer,”
Journal of Physics D: Applied Physics, Vol. 33, No. 14, July 2000,pp. 1697–1704.doi:10.1088/0022-3727/33/14/309
[27] Pellerin, S., Cormier, J.M., Richard, F.,Musiol, K., andChapelle, J., “ASpectroscopic Diagnostics Technique Using UV OH Band Spectrum,”Journal of Physics D: Applied Physics, Vol. 29, No. 3, 1996, pp. 726–739.doi:10.1088/0022-3727/29/3/034
[28] Dieke, G. H., and Crosswhite, H. M., “The Ultraviolet Bands of OH,Fundamental Data,” Journal of Quantitative Spectroscopic RadiationTransfer, Vol. 2, No. 2, 1962, pp. 97–199.doi:10.1016/0022-4073(62)90061-4
[29] Laux, C. O., Spence, T. G., Kruger, C. H., and Zare, R. N., “OpticalDiagnostics of Atmospheric Pressure Air Plasmas,” Plasma Sources
Science and Technology , Vol. 12, May 2003, pp. 125–138.doi:10.1088/0963-0252/12/2/301
[30] Ozlem, M. Y., Saveliev, A. V., Porshnev, P. I., Fridman, A., andKennedy, L. A., “Non-Equilibrium Effects in Gilding Arc Discharge,”2nd International Symposium on Heat & Mass Transfer, 1999.
[31] Fridman, A., Nester, S., Kennedy, L. A., Saveliev, A., and Mutaf-Yardimci,O.M., “GlidingArcGasDischarge,”Progress inEnergy andCombustion Science, Vol. 25, No. 2, April 1998, pp. 211–231.doi:10.1016/S0360-1285(98)00021-5
[32] Richard, F., Cormier, J., Pellerin, S., and Chapelle, J., “Physical Studyof a Gliding Arc Discharge,” Journal of Applied Physics, Vol. 79,March 1996, pp. 2245–2250.doi:10.1063/1.361188
[33] Staack, D., Farouk, B., Gutsol, A., and Fridman, A., “Characterizationof a DC Atmospheric Pressure Normal Glow Discharge,” Plasma
Sources Science and Technology , Vol. 14, No. 4, Nov. 2005, pp. 700–711.doi:10.1088/0963-0252/14/4/009
[34] Fridman, A., and Kennedy, L. A., Plasma Physics and Engineering,Taylor and Francis, Philadelphia, PA/London, 2004.
[35] Yardimci, O. M., Saveliev, A. V., Porshnev, P. I., Fridman, A. A., andKennedy, L. A., “Non-Equilibrium Effects in Gliding Arc Discharges,”Annals of the New York Academy of Sciences, Vol. 891, edited by P.Fauchais, J. van der Mullen, and J. Heberlein, 1999, pp. 304–308.doi:10.1111/j.1749-6632.1999.tb08777.x
[36] Ju, Y., Guo, H., Maruta, K., and Liu, F., “On the Extinction Limit andFlammability Limit ofNon-Adiabatic StretchedMethane-Air PremixedFlames,” Journal of Fluid Mechanics, Vol. 342, 1997, pp. 315–334.doi:10.1017/S0022112097005636
[37] Frenklach, M., Bowman, T., Smith, G., and Gardiner, B., “GRI-MechHomepage,” Gas Research Institute, Chicago, 1994.
[38] Gardiner, W. C., Jr., Hidaka, Y., and Tanzawa, T., “Refractivity ofCombustion Gases,” Combustion and Flame, Vol. 40, Feb. 1981,pp. 213–219.doi:10.1016/0010-2180(81)90124-3
[39] Fotache, C. G., Kreutz, T. G., Zhu, D. L., and Law, C. K., “AnExperimental Study of Ignition in Nonpremixed CounterflowingHydrogen Versus Heated Air,” Combustion Science and Technology,Vol. 109, No. 1–6, Nov. 1995, pp. 373–393.doi:10.1080/00102209508951910
[40] Ombrello, T., Qin, X., Ju, Y., Gangoli, S., Gutsol, A., and Fridman, A.,“Non-Equilibrium Plasma Discharge: Characterization and Effect onIgnition,” AIAA Paper 2006-1214, Jan. 2006.
[41] Anikin, N. B., Starikovskaia, S.M., and Starikovskii, A. Y., “Oxidationof C1-C10Hydrocarbons in Stoichiometric and LeanMixtureswithAirand Oxygen Under the Action of Nanosecond Discharge,” 43rd AIAA
Aerospace Sciences Meeting and Exhibit, AIAA Paper 2005-0601,Jan. 2005.
[42] Kosarev, I. N., Kukaev, E.N., Starikovskaia, S.M., and Starikovskii, A.Yu., “Comparison of the Efficiency of Nanosecond Gas Discharge andLaser Flash-Photolysis in Initiation of Combustion,” 17th InternationalSymposium on Plasma Chemistry, Aug. 2005, ISPC_sstar.pdf