24
CORNERSTONE RESEARCH Characteristics of U.S. Natural Gas Transactions Insights from FERC Form 552 Submissions As of May 16, 2016 Economic and Financial Consulting and Expert Testimony

CORNERSTONE RESEARCH
Characteristics of U.S. Natural Gas Transactions
Insights from FERC Form 552 Submissions
As of May 16, 2016
Economic and Financial Consulting and Expert Testimony

Characteristics of U.S. Natural Gas Transactions—Insights from FERC Form 552 Submissions | Page i
TABLE OF CONTENTS
Data Analysis .............................................................................................................................................................................................. i Executive Summary ................................................................................................................................................................................... 1 Trends in Natural Gas Production and Consumption ................................................................................................................................. 2
Figure 1: U.S. Natural Gas Marketed Production and Natural Gas Price ..................................................................................... 2 Figure 2: U.S. Lower 48 Liquefied Natural Gas Export Facilities ................................................................................................... 3
Market Volume ........................................................................................................................................................................................... 4 Figure 3: Form 552 Total Volume ................................................................................................................................................. 4
Increase in Production, Decrease in Trading: What the Exchanges Say ................................................................................................... 5 Figure 4: ICE and CME Natural Gas Trading ............................................................................................................................... 5
Prioprietary Classification of Market Participants ....................................................................................................................................... 6 Natural Gas Market Participants ......................................................................................................................................................... 6
Figure 5: Form 552 Transaction Volume by Company Category ................................................................................................. 6 Figure 6: Form 552 Purchase and Sale Volume by Company Category ...................................................................................... 7 Figure 7: Top 20 Companies by Total Form 552 Volume ............................................................................................................. 8
Transaction Types ............................................................................................................................................................................... 9 Figure 8: Form 552 Transaction Volume by Transaction Type .................................................................................................... 9
Volume and Depth of Reporting to Price-Index Publishers ............................................................................................................... 10 Figure 9: Form 552 Volumes Potentially Reported to Indices versus Transaction Volumes Priced Based on Indices ............... 10 Figure 10: Reportable Form 552 Volume by Reporting versus Non-reporting Companies ........................................................ 11 Figure 11: Reporting-Eligible Transaction Form 552 Volume by Company Type Excluding Non-reporting Companies ............ 12 Figure 12: Percentage of Reporting-Eligible Form 552 Volume Potentially Reported by Company Category ........................... 13 Figure 13: Reported Form 552 Volume by Index Net Buyers and Index Net Sellers.................................................................. 14
Glossary ................................................................................................................................................................................................... 15 Appendices ............................................................................................................................................................................................... 17
Appendix 1: Background on the Energy Policy Act of 2005, Form 552 Submissions, and Cornerstone Research’s Proprietary Analysis ...................................................................................................................................................................................... 17
Appendix 2: Data Submitted to FERC ............................................................................................................................................... 18 Endnotes .................................................................................................................................................................................................. 19
DATA ANALYSIS
The Federal Energy Regulatory Commission (FERC) receives and compiles the most comprehensive information on trading activity and pricing methods in the U.S. natural gas trading markets. The information, collected from market participants’ FERC Form 552 submissions, provides a database of trading activity that spans both physical and financial trading by a range of companies, from producers to end users.
By supplementing the data with proprietary classifications of market participants, Cornerstone Research adds deeper insight into market activities and characteristics across the various types of participants. See Appendix 1 for additional information.

Characteristics of U.S. Natural Gas Transactions—Insights from FERC Form 552 Submissions | Page 1 EXECUTIVE SUMMARY
The year 2015 saw an increase in the amount of natural gas traded in the United States as measured by Form 552 submissions for the first time in four years. Overall trading volume rose by 4.1 percent from the prior year, while the natural gas volume potentially1 reported to price index publishers decreased by 4 percent.
U.S. natural gas production increased by 5 percent and is projected to continue increasing due to shale gas and tight oil. U.S. production is expected to outstrip U.S. consumption, and the prospects for liquefied natural gas (LNG) exports continue to drive the market.
• The trading activity reported in the Form 552 submissions totaled 123,829 tBtu transacted by 680 respondents. The number of respondents increased by 24 from the prior year.2 (page 4)
• Aggregate trading of natural gas contracts on the two main futures exchanges decreased. CME Group Inc.’s (CME’s) natural gas products volume rose by 2.4 percent, and Intercontinental Exchange Inc. (ICE) experienced a decline in volume of 3.8 percent. (page 5)
• The U.S. natural gas industry remains unconcentrated, with a large number of diverse participants. (pages 6–8)
• The volume potentially reported to price-index publishers decreased for the fourth consecutive year. (page 10)
• In 2015, the base of transactions used to set the price indices continued to shrink relative to the volume of transactions that relied on the indices. (page 10)
• Of the 680 Form 552 respondents in 2015, 111 (16 percent) reported transaction information to the price-index publishers for at least one affiliate. While the majority of Form 552 respondents did not report, the reporting companies tended to be larger than average. (page 11)
• For the first time, companies chose not to report more than half (50.7 percent) of the reportable fixed-price volume. (page 11)
• Reporting to price-index publishers was inconsistent across industry segments in 2015. (page 13)
• The volume of these reported transactions indicates that, on average, a molecule of natural gas was traded through approximately 2.4 transactions from production to consumption.3
“The volume of natural gas potentially reported to price indices has decreased every year since 2011.”
Greg Leonard Vice President Cornerstone Research
Characteristics of U.S. Natural Gas Transactions—Insights from FERC Form 552 Submissions | Page 2 TRENDS IN NATURAL GAS PRODUCTION AND CONSUMPTION
The U.S. Energy Information Administration (EIA) predicts natural gas production will increase annually from 2015 to 2040, with consumption also increasing but at a slower pace.4,5 Currently, the United States both imports and exports natural gas depending on the proximity to North American supplies, with the largest portion of U.S. imports originating from Canada by pipeline. According to EIA projections, the United States will change from a current net importer of gas to a net exporter of gas by 2018.6,7
U.S. natural gas production has been increasing since 2006.
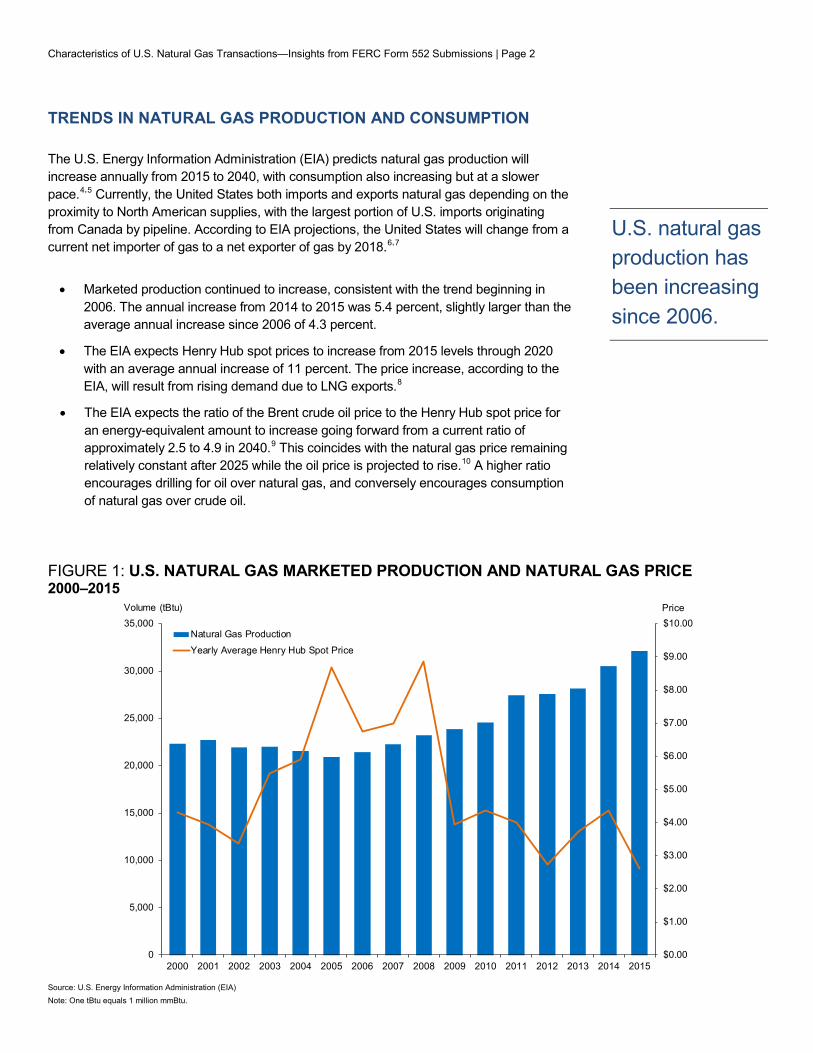
• Marketed production continued to increase, consistent with the trend beginning in 2006. The annual increase from 2014 to 2015 was 5.4 percent, slightly larger than the average annual increase since 2006 of 4.3 percent.
• The EIA expects Henry Hub spot prices to increase from 2015 levels through 2020 with an average annual increase of 11 percent. The price increase, according to the EIA, will result from rising demand due to LNG exports.8
• The EIA expects the ratio of the Brent crude oil price to the Henry Hub spot price for an energy-equivalent amount to increase going forward from a current ratio of approximately 2.5 to 4.9 in 2040.9 This coincides with the natural gas price remaining relatively constant after 2025 while the oil price is projected to rise.10 A higher ratio encourages drilling for oil over natural gas, and conversely encourages consumption of natural gas over crude oil.
FIGURE 1: U.S. NATURAL GAS MARKETED PRODUCTION AND NATURAL GAS PRICE 2000–2015
Source: U.S. Energy Information Administration (EIA) Note: One tBtu equals 1 million mmBtu.
$0.00
$1.00
$2.00
$3.00
$4.00
$5.00
$6.00
$7.00
$8.00
$9.00
$10.00
0
5,000
10,000
15,000
20,000
25,000
30,000
35,000
2000 2001 2002 2003 2004 2005 2006 2007 2008 2009 2010 2011 2012 2013 2014 2015
Natural Gas Production
Yearly Average Henry Hub Spot Price
Volume (tBtu) Price

Characteristics of U.S. Natural Gas Transactions—Insights from FERC Form 552 Submissions | Page 3
TRENDS IN NATURAL GAS PRODUCTION AND CONSUMPTION continued
U.S. natural gas production is projected to outstrip domestic consumption, and the prospects for LNG exports continue to drive the market. Historically, the United States has exported natural gas via pipeline to Canada and Mexico, with a small amount of LNG exports to Japan.11 The rapid increase in U.S. supply and export facility approvals from the U.S. government is gradually making the prospect of a viable LNG export industry a reality.12
The rapid increase in U.S. supply and export facility approvals of LNG is driving prospects for the U.S. export market.
• The major hubs for export, which require liquefaction plants to cool LNG tonegative 260 degrees Fahrenheit before shipping, are located mainly on the GulfCoast. The Gulf Coast is attractive due to the existing pipeline network.13
• A major investor in the LNG export business is Cheniere Energy, which has sixdifferent liquefaction units at its Sabine Pass Liquefaction Project in Louisiana. Thetotal approved export capacity from FERC is 4.31 tBtu/d.14
• Cheniere Energy has also invested in a Corpus Christi, Texas, terminal expected tobegin service in 2018. The terminal will be receiving natural gas via a natural gaspipeline from the Marcellus area.15 The total Form 552 transaction volume reported byCheniere Energy increased from 3.6 to 4.5 tBtu from 2014 to 2015.
• The first shipment of LNG from the Lower 48 states occurred in February 2016, fromLouisiana to Brazil.16 During the first half of 2016, 13 LNG cargoes were shipped fromSabine Pass to various countries including Argentina, Brazil, Chile, Dubai, India,Kuwait, Portugal, and Spain. Cheniere Energy stated that it expects to ship up to halfof its LNG exports to Europe.17
FIGURE 2: U.S. LOWER 48 LIQUEFIED NATURAL GAS EXPORT FACILITIES
Source: http://www.eia.gov/todayinenergy/detail.cfm?id=25232
Characteristics of U.S. Natural Gas Transactions—Insights from FERC Form 552 Submissions | Page 4
MARKET VOLUME
Both the number and total volume of Form 552 submissions increased from 2014 to 2015, reversing the trend in recent years.
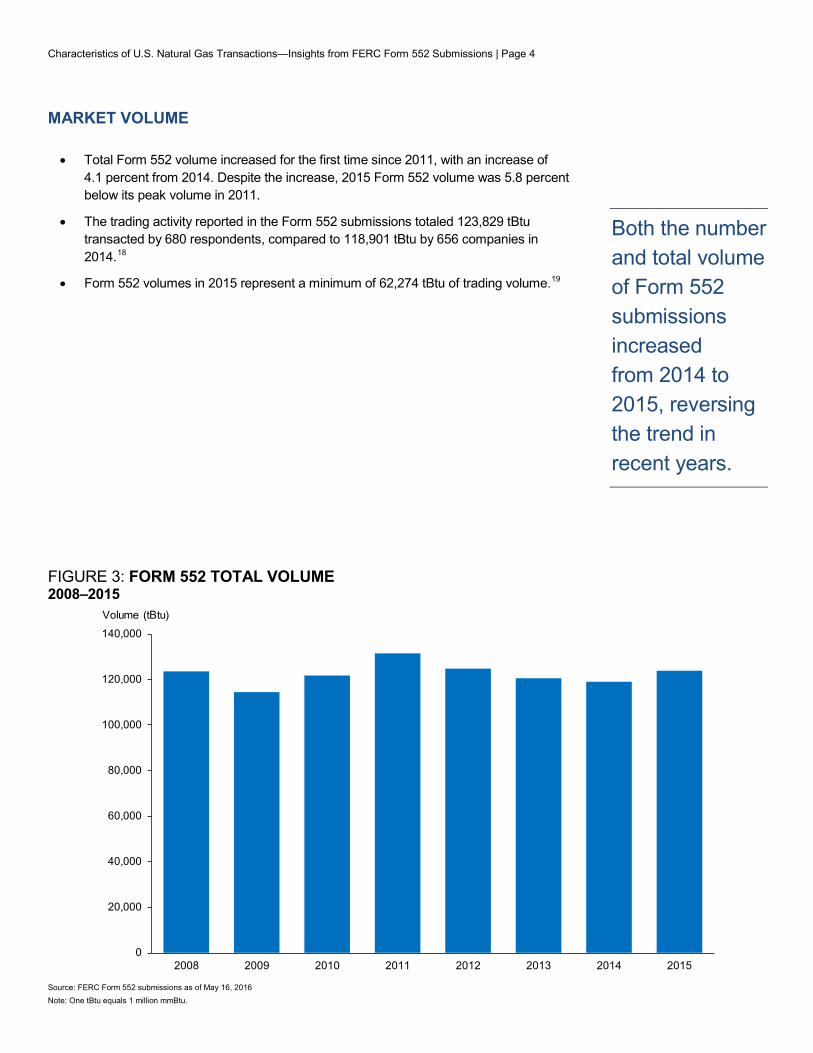
• Total Form 552 volume increased for the first time since 2011, with an increase of4.1 percent from 2014. Despite the increase, 2015 Form 552 volume was 5.8 percentbelow its peak volume in 2011.
• The trading activity reported in the Form 552 submissions totaled 123,829 tBtutransacted by 680 respondents, compared to 118,901 tBtu by 656 companies in2014.18
• Form 552 volumes in 2015 represent a minimum of 62,274 tBtu of trading volume.19
FIGURE 3: FORM 552 TOTAL VOLUME 2008–2015
Source: FERC Form 552 submissions as of May 16, 2016 Note: One tBtu equals 1 million mmBtu.
0
20,000
40,000
60,000
80,000
100,000
120,000
140,000
2008 2009 2010 2011 2012 2013 2014 2015
Volume (tBtu)
Characteristics of U.S. Natural Gas Transactions—Insights from FERC Form 552 Submissions | Page 5 INCREASE IN PRODUCTION, DECREASE IN TRADING: WHAT THE EXCHANGES SAY
Natural gas production and FERC volume increased, while the number of contracts traded on the ICE and CME decreased in aggregate.
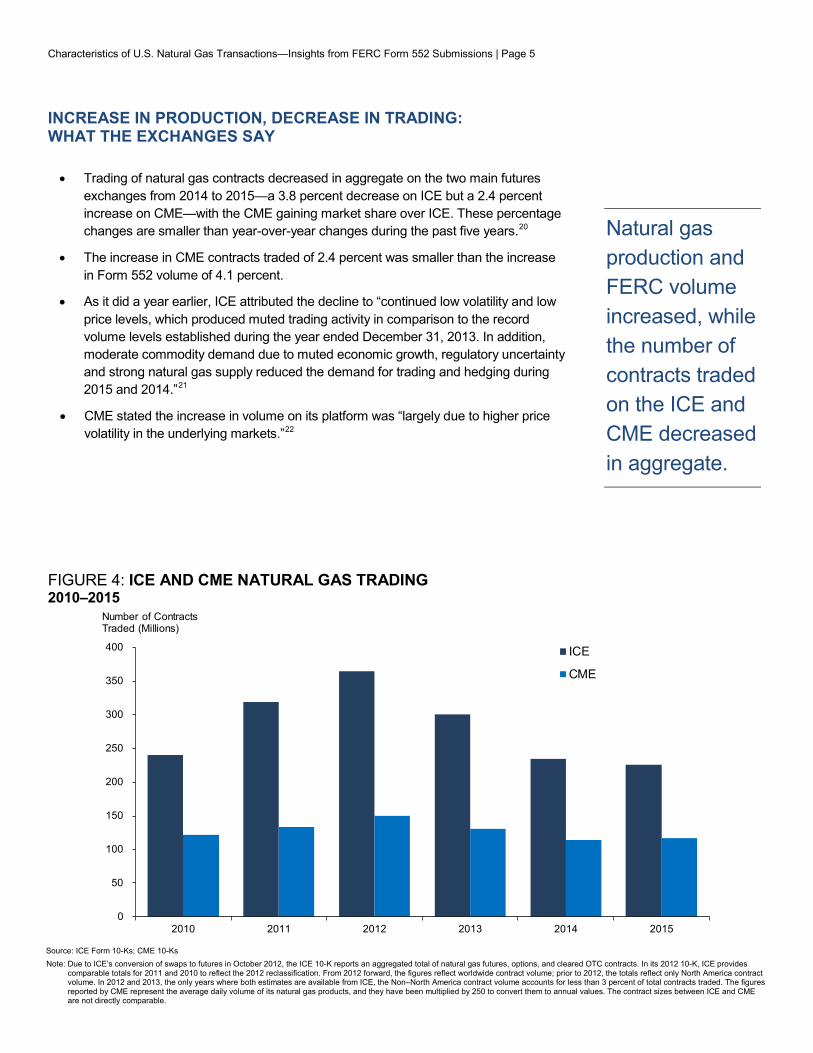
• Trading of natural gas contracts decreased in aggregate on the two main futures exchanges from 2014 to 2015—a 3.8 percent decrease on ICE but a 2.4 percent increase on CME—with the CME gaining market share over ICE. These percentage changes are smaller than year-over-year changes during the past five years.20
• The increase in CME contracts traded of 2.4 percent was smaller than the increase in Form 552 volume of 4.1 percent.
• As it did a year earlier, ICE attributed the decline to “continued low volatility and low price levels, which produced muted trading activity in comparison to the record volume levels established during the year ended December 31, 2013. In addition, moderate commodity demand due to muted economic growth, regulatory uncertainty and strong natural gas supply reduced the demand for trading and hedging during 2015 and 2014.”21
• CME stated the increase in volume on its platform was “largely due to higher price volatility in the underlying markets.”22
FIGURE 4: ICE AND CME NATURAL GAS TRADING 2010–2015
Source: ICE Form 10-Ks; CME 10-Ks Note: Due to ICE’s conversion of swaps to futures in October 2012, the ICE 10-K reports an aggregated total of natural gas futures, options, and cleared OTC contracts. In its 2012 10-K, ICE provides
comparable totals for 2011 and 2010 to reflect the 2012 reclassification. From 2012 forward, the figures reflect worldwide contract volume; prior to 2012, the totals reflect only North America contract volume. In 2012 and 2013, the only years where both estimates are available from ICE, the Non–North America contract volume accounts for less than 3 percent of total contracts traded. The figures reported by CME represent the average daily volume of its natural gas products, and they have been multiplied by 250 to convert them to annual values. The contract sizes between ICE and CME are not directly comparable.
0
50
100
150
200
250
300
350
400
2010 2011 2012 2013 2014 2015
ICE
CME
Number of Contracts Traded (Millions)

Characteristics of U.S. Natural Gas Transactions—Insights from FERC Form 552 Submissions | Page 6 PRIOPRIETARY CLASSIFICATION OF MARKET PARTICIPANTS
Cornerstone Research supplements the FERC Form 552 data with proprietary research that classifies the respondent companies by industry segments. The companies are classified by their primary natural gas business activity, yielding a unique overview of the natural gas market.
Large integrated companies and traders represent a decreasing share of the market.
NATURAL GAS MARKET PARTICIPANTS
• Large integrated-upstream and integrated-downstream companies and traders or wholesale marketers accounted for approximately 66 percent of Form 552 natural gas volume.
• In contrast, industrial or commercial consumers and chemical consumers accounted for only about 3 percent of the Form 552 volume.
• These percentages have remained relatively consistent over the past six years. However, the share of volume for large integrated companies and traders or wholesale marketers has decreased steadily since 2012, from 72 percent to 66 percent.
FIGURE 5: FORM 552 TRANSACTION VOLUME BY COMPANY CATEGORY 2015
Source: FERC Form 552 submissions as of May 16, 2016 Note: Percentages may not add up to 100 due to rounding.
Trader or Wholesale Marketer37.11%
Integrated-Upstream16.92%
Integrated-Downstream12.20%
Producer11.69%
Electric Generator7.58%
LDC6.95%
Transporter4.14%
Industrial or Commercial Consumer
2.45% Chemical Consumer0.96%
Characteristics of U.S. Natural Gas Transactions—Insights from FERC Form 552 Submissions | Page 7 NATURAL GAS MARKET PARTICIPANTS continued
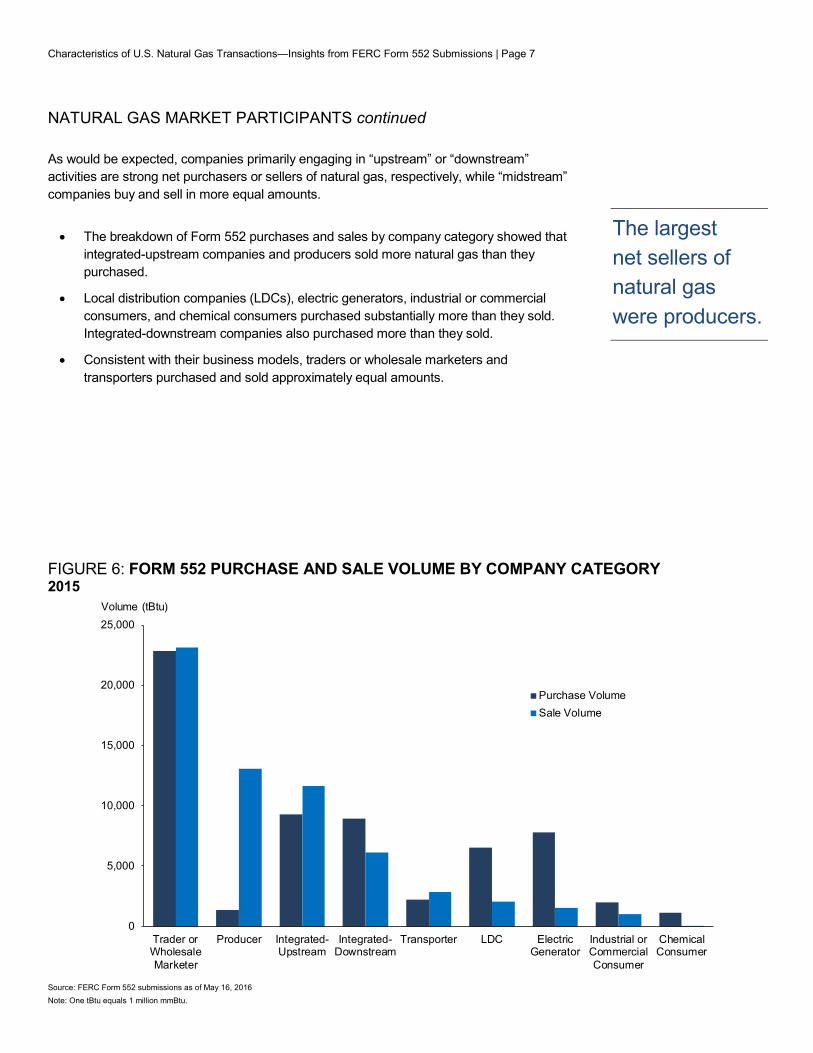
As would be expected, companies primarily engaging in “upstream” or “downstream” activities are strong net purchasers or sellers of natural gas, respectively, while “midstream” companies buy and sell in more equal amounts.
The largest net sellers of natural gas were producers.
• The breakdown of Form 552 purchases and sales by company category showed that integrated-upstream companies and producers sold more natural gas than they purchased.
• Local distribution companies (LDCs), electric generators, industrial or commercial consumers, and chemical consumers purchased substantially more than they sold. Integrated-downstream companies also purchased more than they sold.
• Consistent with their business models, traders or wholesale marketers and transporters purchased and sold approximately equal amounts.
FIGURE 6: FORM 552 PURCHASE AND SALE VOLUME BY COMPANY CATEGORY 2015
Source: FERC Form 552 submissions as of May 16, 2016 Note: One tBtu equals 1 million mmBtu.
0
5,000
10,000
15,000
20,000
25,000
Trader orWholesaleMarketer
Producer Integrated-Upstream
Integrated-Downstream
Transporter LDC ElectricGenerator
Industrial orCommercialConsumer
ChemicalConsumer
Purchase VolumeSale Volume
Volume (tBtu)

Characteristics of U.S. Natural Gas Transactions—Insights from FERC Form 552 Submissions | Page 8 NATURAL GAS MARKET PARTICIPANTS continued
A large number of diverse participants comprise the U.S. natural gas industry. Of those, the 20 companies with the largest total transaction volume tend to be consistent from year to year—17 of the top 20 companies in 2015 were also among the leading companies in 2014. In the prior two years, 18 of the 20 top companies ranked among the top 20 companies again in the following year.
The top 20 U.S. natural gas companies by volume have remained largely consistent in an unconcentrated industry.
• The top 20 companies accounted for 53,623 tBtu out of 123,829 tBtu, or slightly over 43 percent of volume reported on Form 552 submissions. This share of volume is consistent with the two prior years, although it is below the average of 47 percent from 2011 to 2012. The results suggest that the overall increase in trading volumes did not affect market concentration.
• BP Energy Company had the largest physical volumes for the eighth consecutive year at 8,772 tBtu. Its volume was almost double the second-largest trader’s volume and represented an increase of approximately 3 percent from 2014.
• Three companies fell from the top 20 companies by volume: J.P. Morgan Ventures Energy Corporation fell from 12 to 44; Occidental Energy Marketing Inc. fell from 18 to 24; and DCP Midstream LLC fell from 20 to 30. Exelon Generation Company LLC, Iberdrola Energy Services LLC, and South Jersey Resources Group LLC entered the list of the top 20 companies. Iberdrola Energy Services LLC was 19 in 2013.
FIGURE 7: TOP 20 COMPANIES BY TOTAL FORM 552 VOLUME 2015 (Sorted by Total Volume, in tBtu)
Source: FERC Form 552 submissions as of May 16, 2016 Note: 1. Numbers may not add up to totals due to rounding. One tBtu equals 1 million mmBtu. 2. Volume Reportable to Indices includes the sum of fixed-price next-month purchases and sales, fixed-price next-day purchases and sales, and physical-basis-transaction volume reported on Form 552.
Company Name
Any Affiliates Report to Index
PublishersTotal BuyVolume
Total Sale Volume
NetVolume
Total Transaction
Volume
Volume Reportable to Indices
BP Energy Company Y 4,294 4,479 -185 8,772 2,058Shell Energy North America (US) L.P. Y 2,169 2,278 -109 4,446 844Macquarie Energy LLC Y 2,259 2,153 105 4,412 1,230Tenaska Marketing Ventures Y 2,170 1,966 205 4,136 1,056AGL Resources INC N 2,153 1,974 180 4,127 708ConocoPhillips Company Y 1,650 2,042 -392 3,691 686J. Aron & Company Y 1,231 1,230 0 2,461 913Chevron U.S.A. Inc. Y 1,064 1,309 -245 2,373 373Pacific Summit Energy LLC N 1,079 1,091 -12 2,170 352BG Energy Merchants LLC Y 1,067 1,048 19 2,115 839EDF Trading North America LLC N 1,068 1,031 37 2,098 431Natural Gas Exchange Inc. N 785 785 0 1,571 765CenterPoint Energy Inc. N 878 618 260 1,495 84Chesapeake Energy Corporation N 122 1,353 -1,231 1,475 110Exelon Generation Company LLC N 944 519 426 1,463 579Twin Eagle Resource Management LLC N 763 669 94 1,432 230Anadarko Petroleum Corporation Y 169 1,216 -1,047 1,385 134Enterprise Products Partners L.P. N 730 631 99 1,360 114Iberdrola Energy Services LLC N 677 682 -5 1,358 223South Jersey Resources Group LLC Y 673 610 63 1,283 210
Top 20 Companies by Total Volume 25,942 27,681 -1,738 53,623 11,937All Other Companies 36,331 33,874 2,457 70,206 13,862
Total for All Companies 62,274 61,555 719 123,829 25,798
2

Characteristics of U.S. Natural Gas Transactions—Insights from FERC Form 552 Submissions | Page 9 TRANSACTION TYPES
Since 2013, the percent of index-priced Form 552 transactions has increased each year, compared to fixed-price transactions which have declined. From 2012 to 2015, index-price transactions increased from 72 percent to 79 percent.
In 2015, the percent of transactions based on the monthly index was nearly identical to 2014.
• As in 2014, transactions that reference the monthly index were the most prevalent among index-priced transactions. The monthly index was used in 46 percent of all Form 552 transactions in 2015.
• Combining fixed-price and index-priced transactions covered by Form 552, transactions were split relatively equally between next-month transactions (49 percent) and next-day transactions (44 percent).23
• Price triggers were the least prevalent transaction type, comprising only 1 percent of Form 552 transactions.
• Form 552 data do not cover all transactions in the OTC market, since Form 552 excludes certain types of non-index-price transactions (see Appendix 2).
FIGURE 8: FORM 552 TRANSACTION VOLUME BY TRANSACTION TYPE 2015
Source: FERC Form 552 submissions as of May 16, 2016 Note: Percentages may not add up to 100 due to rounding.
Fixed-Price Next Month3.0%
Fixed-Price Next Day11.9%
Price Triggers1.0%
Index Next Month45.6%
Index Next Day32.4%
Physical Basis6.0%

Characteristics of U.S. Natural Gas Transactions—Insights from FERC Form 552 Submissions | Page 10 VOLUME AND DEPTH OF REPORTING TO PRICE-INDEX PUBLISHERS
In Order 704, FERC commented that understanding the relative sizes of the volume of index-price transactions and reporting-eligible, fixed-price transactions was a core purpose of mandating the Form 552 submissions.24
The volume of transactions dependent on the indices reached its highest point since the inception of this report.25
• In 2015, the volume of transactions dependent on indices was more than 7.5 times larger than the volume of transactions potentially reported to the indices. The increase in this ratio resulted from a 6 percent increase in the volume of index-priced transactions and a 4 percent decrease in the volume potentially reportable to indices.
• Overall, the increase in this ratio is consistent with the trend since 2008 of year-over-year increases, with the exception of 2010. The year 2015 witnessed both the largest volume of index-priced transactions and the lowest volume potentially reported to indices since the inception of Form 552 reporting.
FIGURE 9: FORM 552 VOLUMES POTENTIALLY REPORTED TO INDICES VERSUS TRANSACTION VOLUMES PRICED BASED ON INDICES 2008–2015
Source: FERC Form 552 submissions as of May 16, 2016 Note: Reportable volume is the sum of fixed-price next-month purchases and sales, fixed-price next-day purchases and sales, and physical-basis-transaction volume reported on Form 552. Companies that did not enter information regarding their price reporting were assumed to not report. One tBtu equals 1 million mmBtu.
0
20,000
40,000
60,000
80,000
100,000
120,000
2008 2009 2010 2011 2012 2013 2014 2015
Volume Potentially Reported to IndicesIndex-Price Transaction Volume
Volume (tBtu)
Ratio of Index-Price Volume to Volume Potentially Reported to Indices
3.56 4.114.31
4.314.71 5.77 6.98
7.65

Characteristics of U.S. Natural Gas Transactions—Insights from FERC Form 552 Submissions | Page 11 VOLUME AND DEPTH OF REPORTING TO PRICE-INDEX PUBLISHERS continued
The data collected from Form 552 submissions provide information on which companies had volume eligible to be reported (i.e., fixed-price transactions), and whether they reported that volume to the indices.
For the first time, more than half of the reportable volume was not reported.
• The percentage of reportable fixed-price volume transacted by non-reporting companies increased slightly from 2014 to 2015 (from 49.3 percent to 50.7 percent). This was the first time that companies that chose not to report fixed-price volume to the indices had a higher percentage of fixed-price volume than companies that chose to report.
• Of the 680 respondents in 2015, only 111 (16 percent) reported transaction information to the price-index publishers for at least one affiliate. The 111 reporting companies accounted for just under half of the reporting-eligible, fixed-price volume in 2015, down from over 60 percent in 2008.
FIGURE 10: REPORTABLE FORM 552 VOLUME BY REPORTING VERSUS NON-REPORTING COMPANIES 2008–2015
Source: FERC Form 552 submissions as of May 16, 2016 Note: Reportable volume is the sum of fixed-price next-month purchases and sales, fixed-price next-day purchases and sales, and physical-basis-transaction volume reported on Form 552. Companies that did not enter information regarding their price reporting were assumed to not report. Percentages may not add up to 100 due to rounding.
62.1% 57.8% 56.2% 58.8% 55.8%50.4% 50.7% 49.3%
37.9% 42.2% 43.8% 41.2% 44.2%49.6% 49.3% 50.7%
2008 2009 2010 2011 2012 2013 2014 2015
Non-reporting Reporting

Characteristics of U.S. Natural Gas Transactions—Insights from FERC Form 552 Submissions | Page 12 VOLUME AND DEPTH OF REPORTING TO PRICE-INDEX PUBLISHERS continued
Traders or wholesale marketers and integrated- upstream firms accounted for most of the potentially reported volume in 2015.
• Traders or wholesale marketers and integrated-upstream companies accounted for approximately 74 percent26 of the volume potentially reported to price indices.
• Similar to 2014, half of the top 20 FERC-reporting companies in 2015 reported to index publishers. These 10 accounted for 66 percent27 of the reporting-eligible volume at reporting companies.
FIGURE 11: REPORTING-ELIGIBLE TRANSACTION FORM 552 VOLUME BY COMPANY TYPE EXCLUDING NON-REPORTING COMPANIES 2015
Source: FERC Form 552 submissions as of May 16, 2016 Note: Industrial or commercial consumer and chemical consumer companies reported less than 0.20 percent of reportable volume and are not included.
Trader or Wholesale Marketer42.7%
Integrated-Upstream31.7%
Integrated-Downstream7.0%
LDC7.0%
Producer6.6%
ElectricGenerator
4.2%Transporter
0.8%

Characteristics of U.S. Natural Gas Transactions—Insights from FERC Form 552 Submissions | Page 13 VOLUME AND DEPTH OF REPORTING TO PRICE-INDEX PUBLISHERS continued
Among the industry segments, the proportion of reported volume varies widely, although the fraction of volume that each industry reported in 2015 was similar to the fraction reported in 2014.
Since 2011, integrated-upstream firms have reported the highest percent of transactions among all industry segments.
• Integrated-upstream companies reported 88 percent of fixed-price transaction volume, while integrated-downstream companies reported only 37 percent of fixed-price transaction volume.
• Traders or wholesale marketers, LDCs, producers, and integrated-downstream companies all reported between 35 percent and 50 percent of fixed-price transaction volume to indices.
• Chemical consumers and industrial or commercial consumers reported less than 5 percent of their fixed-price transaction volume to indices.
FIGURE 12: PERCENTAGE OF REPORTING-ELIGIBLE FORM 552 VOLUME POTENTIALLY REPORTED BY COMPANY CATEGORY 2015
Source: FERC Form 552 submissions as of May 16, 2016 Note: Of the 680 respondents in 2015, 111 indicated they reported transaction information to price-index publishers for themselves or at least one affiliate.
0%
10%
20%
30%
40%
50%
60%
70%
80%
90%
100%
Integrated-Upstream
Trader orWholesaleMarketer
LDC Producer Integrated-Downstream
ElectricGenerator
Transporter Industrial orCommercialConsumer
ChemicalConsumer
Percentage of Volume Reported

Characteristics of U.S. Natural Gas Transactions—Insights from FERC Form 552 Submissions | Page 14 VOLUME AND DEPTH OF REPORTING TO PRICE-INDEX PUBLISHERS continued
The disparity between industry segments reporting transaction information to the price-index publishers may cause concern that the basis for the price indices might arise predominantly from segments that have either long or short exposure to the published indices.
The difference in transaction volume reported between net buyers and net sellers was less than 1 percent.
• Net buyers reported 36.0 percent of transactions, while net sellers reported 36.3 percent in 2015.
• Neutral parties reported 27.7 percent of transactions, with neutral defined as a difference between buying and selling volumes of 1 percent or less.
• Overall, volume was approximately evenly distributed between the categories of net buyers, net sellers, and neutral firms.28
FIGURE 13: REPORTED FORM 552 VOLUME BY INDEX NET BUYERS AND INDEX NET SELLERS 2015
Source: FERC Form 552 submissions as of May 16, 2016 Note: Reportable volume to price-index publishers is the sum of fixed-price next-month purchases and sales, fixed-price next-day purchases and sales, and physical-basis-transaction volume reported on Form 552. Index-price transactions include index-price next-month purchases and sales, index-price next-day purchases and sales, and trigger agreements. Index net buyers are identified as companies that purchase more index-price transactions than they sell. Percentages may not add up to 100 due to rounding.
Index Net Buyer36.0%
Neutral27.7%
Index Net Seller36.3%

Characteristics of U.S. Natural Gas Transactions—Insights from FERC Form 552 Submissions | Page 15 GLOSSARY
Btu: A British thermal unit (Btu) is the amount of heat energy needed to raise the temperature of one pound of water by one degree Fahrenheit. Millions of this unit are written as mmBtu, and trillions as tBtu.
Brent crude: “A blended crude stream produced in the North Sea region which serves as a reference or ‘marker’ for pricing a number of other crude streams.” https://www.eia.gov/dnav/pet/TblDefs/pet_pri_spt_tbldef2.asp.
CME Group Inc. (CME): A “diverse derivatives marketplace. . . . The company provides a marketplace for buyers and sellers, bringing together individuals, companies and institutions that need to manage risk or that want to profit by accepting risk.” http://www.cmegroup.com/company/history/.
Downstream: “A term used in the petroleum industry referring to the refining, transportation and marketing side of the business.” http://www.energy.ca.gov/glossary/glossary-d.html.
EIA: U.S. Energy Information Administration. “EIA provides a wide range of information and data products covering energy production, stocks, demand, imports, exports, and prices; and prepares analyses and special reports on topics of current interest.” http://www.eia.gov/about/.
FERC Form 552: Annual Report of Natural Gas Transactions. “FERC Form No. 552 collects transactional information from natural gas market participants. The filing of this information is necessary to provide information regarding physical natural gas transactions that use an index and transactions that contribute to, or may contribute to gas price indices. This form is considered to be a non-confidential public use form.” https://www.ferc.gov/docs-filing/forms/form-552/form-552.pdf.
Fixed price: “A ‘Physical Natural Gas Transaction’ price determined by agreement between buyer and seller and not benchmarked to any other source of information.” https://www.ferc.gov/docs-filing/forms/form-552/form-552.pdf.
Fixed-price, next-day transaction: “[D]elivery of natural gas pursuant to a transaction executed prior to NAESB [North American Energy Standards Board] nomination deadline (11:30 am Central Prevailing Time) on one day for uniform physical delivery over the next pipeline day.” https://www.ferc.gov/docs-filing/forms/form-552/form-552.pdf.
Fixed-price, next-month transaction: “[D]elivery of natural gas pursuant to a transaction executed during the last five (5) business days of one month (bidweek) for uniform physical delivery over the next month.” https://www.ferc.gov/docs-filing/forms/form-552/form-552.pdf.
Henry Hub: A principal natural gas trading hub in North America, with connections to nine interstate and four intrastate pipelines. Henry Hub serves as the delivery point for the U.S. natural gas futures contract traded on the New York Mercantile Exchange (NYMEX). https://www.theice.com/publicdocs/ICE_NatGas_Brochure.pdf; http://www.cmegroup.com/trading/energy/natural-gas/natural-gas_contract_specifications.html.
Intercontinental Exchange Inc. (ICE): A “network of regulated exchanges and clearinghouses for financial and commodity markets.” https://www.intercontinentalexchange.com/about/overview.
Index price: “A price obtained from an industry publication, which is intended to represent an average price of gas delivered to a specific point on the pipeline at or during a specified period of time.” http://www.uniongas.com/storage-and-transportation/resources/additional-info/glossary.
Liquefied natural gas (LNG): Natural gas (primarily methane) that has been liquefied by reducing its temperature to negative 260 degrees Fahrenheit at atmospheric pressure. http://www.eia.gov/tools/glossary/index.cfm?id=L.

Characteristics of U.S. Natural Gas Transactions—Insights from FERC Form 552 Submissions | Page 16 GLOSSARY continued
Local distribution company (LDC): “A legal entity engaged primarily in the retail sale and/or delivery of natural gas through a distribution system that includes main lines (that is, pipelines designed to carry large volumes of gas, usually located under roads or other major right-of-ways) and laterals (that is, pipelines of smaller diameter that connect the end user to the mainline). Since [the] structuring of the gas industry, the sale of gas and/or delivery arrangements may be handled by other agents, such as producers, brokers, and marketers that are referred to as ‘non-LDC.’” http://www.eia.gov/tools/glossary/index.cfm?id=L.
Midstream: Activity involving “pipelines, processing plants and storage facilities.” http://www.ferc.gov/market-oversight/guide/energy-primer.pdf.
Physical-basis transactions: “[T]ransactions in which the basis value is negotiated on one of the first three days of bidweek and the price is set by the final closing value of the near-month NYMEX Natural Gas Futures contract plus or minus the negotiated basis. These transactions are for uniform physical delivery over the next month.” https://www.ferc.gov/docs-filing/forms/form-552/form-552.pdf.
Price trigger: According to FERC Form 552, a trigger agreement is “a NYMEX trigger transaction that is contingent upon a futures contract that trades on an exchange, resulting in an automatic physical trade at an agreed upon price.” https://www.ferc.gov/docs-filing/forms/form-552/form-552.pdf.
Tight gas: “Tight gas refers to natural gas reservoirs locked in extraordinarily impermeable, hard rock, making the underground formation extremely ‘tight.’” http://www.rigzone.com/training/insight.asp?insight_id=346.
Tight oil: “Oil produced from petroleum-bearing formations with low permeability such as the Eagle Ford, the Bakken, and other formations that must be hydraulically fractured to produce oil at commercial rates.” http://www.eia.gov/tools/glossary/index.cfm?id=T.
Upstream: “A term used in the petroleum industry referring to the exploration and production side of the business.” http://www.energy.ca.gov/glossary/glossary-u.html.

Characteristics of U.S. Natural Gas Transactions—Insights from FERC Form 552 Submissions | Page 17 APPENDICES
APPENDIX 1: BACKGROUND ON THE ENERGY POLICY ACT OF 2005, FORM 552 SUBMISSIONS, AND CORNERSTONE RESEARCH’S PROPRIETARY ANALYSIS
In 2005, Congress passed the Energy Policy Act of 2005 (EPAct 2005), which authorized FERC to “facilitate price transparency in markets for the sale or transportation of physical natural gas in interstate commerce” (§ 316). The EPAct 2005 allowed FERC to issue rules to “provide for the dissemination, on a timely basis, of information about the availability and prices of natural gas sold at wholesale and in interstate commerce to the Commission, State commissions, buyers and sellers of wholesale natural gas, and the public” (§ 316). After an extensive rule-making process, FERC issued Order 704-A, which established reporting requirements.
In the summer of 2009, FERC received the first round of Form 552 submissions covering 2008 natural gas transactions from more than 1,121 respondents. On June 17, 2010, FERC issued Order 704-C, which provides for slightly revised reporting rules that ease some reporting requirements.29 For 2014 natural gas transactions, Form 552 submissions covered 656 firms.
The data contained on the Form 552 submissions, described more fully in Appendix 2, provide a unique view into the size and nature of the physical natural gas market. First, these forms quantify the number of trade participants and trade volumes of firms that report to the price-index publishers. Second, the data provide insight into the relative proportion of fixed-price and index-price transactions. Third, while FERC did not request information on all natural gas transactions, the data yield an outline of the size of the physical natural gas market, especially at the trading and wholesale levels.
Cornerstone Research supplements the FERC Form 552 data with proprietary research that classifies the respondent companies by industry segments. These industry segments are producer, transporter, electric generator, industrial or commercial consumer, chemical consumer, trader or wholesale marketer, LDC, integrated-downstream, and integrated-upstream.30 The latter two categories capture companies that span multiple industry segments.31

Characteristics of U.S. Natural Gas Transactions—Insights from FERC Form 552 Submissions | Page 18 APPENDICES continued
APPENDIX 2: DATA SUBMITTED TO FERC
Order 704-C requires natural gas market participants with purchases or sales of physical “reportable” natural gas of at least 2.2 tBtu in the prior calendar year to report these activities on Form 552. Specifically, these market participants must submit volumes of physical natural gas transactions that “are only those transactions that refer to an index, or that contribute to, or could contribute to the formation of a gas index during the calendar year.”32 Order 704-A (p. 9) further clarifies that the transactions that could be reported to an index publisher means any “bilateral, arms-length, fixed-price physical natural gas transactions between nonaffiliated companies at all trading locations.”
Order 704-C excludes any transaction that does not depend on a published price index or that could not be reported to an index-price publisher. The criteria for reporting to an index-price publisher specifically exclude transactions for balance-of-month supply, intraday trades consummated after the pipeline nomination deadline, monthly fixed-price transactions conducted prior to bidweek, fixed-price transactions for terms longer than one month, and fixed-price transactions including other services or features (such as volume flexibility) that would render them ineligible for price reporting. Further, Order 704-C excludes transactions by affiliates from the submission requirement.
While respondents aggregate their reported transaction volumes across locations and for the entire calendar year, they must submit purchase and sale volumes separately for each of the following types of transactions: fixed price for next-day delivery, index price referencing next-day indices, fixed price for next-month delivery, index price referencing next-month indices, transactions with price triggers,33 and physical-basis transactions.34 In addition to volumes of physical transactions, market participants are required to state whether or not they report transaction information to the price-index publishers.

Characteristics of U.S. Natural Gas Transactions—Insights from FERC Form 552 Submissions | Page 19 ENDNOTES 1 The phrase “potentially reported” is used because a company may state on Form 552 that it reports to index publishers but not all of its
subsidiaries, affiliates, or locations report. In addition, not all fixed-priced transactions have a corresponding published index to be reported for.
2 680 respondents correspond to 678 companies. One company, American Electric Power Service Corporation, has three subsidiaries (Southwestern Electric Power Company, Appalachian Power Company, and Public Service Company of Oklahoma), all of which separately report, causing there to be two more respondents than companies. “American Electric Power 2014 Annual Report,” https://www.aep.com/investors/FinancialFilingsAndReports/AnnualReportsProxies/docs/14annrep/2015_Official_Appendix_A.pdf.
3 Calculated as minimum trading volume of 61,555 tBtu from Figure 7 divided by 25,959 tBtu EIA natural gas delivered to consumers. EIA, “U.S. Natural Gas Consumption by End Use,” http://www.eia.gov/dnav/ng/NG_CONS_SUM_DCU_NUS_A.htm. Converted to trillion Btu (tBtu) from million cubic feet (MMcf). 1 cubic foot = 1,037 Btu, the annual Total Consumption conversion factor in the EIA time series “Approximate Heat Content of Natural Gas (Btu per Cubic Foot),” https://www.eia.gov/dnav/ng/ng_cons_heat_dcu_nus_a.htm.
4 EIA, “Annual Energy Outlook 2016 Early Release,” May 17, 2016, p. 52, http://www.eia.gov/forecasts/aeo/er/pdf/0383er(2016).pdf. 5 The EIA predicts natural gas production will increase annually by an average of 1.8 percent from 2015 to 2040, with consumption
increasing at only 0.9 percent a year. 6 “Most Natural Gas Production Growth Is Expected to Come from Shale Gas and Tight Oil Plays,” U.S. Energy Information Administration,
June 7, 2016, http://www.eia.gov/todayinenergy/detail.cfm?id=26552. 7 By 2040, net exports should reach an estimated 18 percent of total production. This increase in U.S. production results from development
of shale gas, tight oil, tight gas, and offshore natural gas resources, with shale gas and tight oil share projected to increase from 50 percent of U.S. production in 2015 to 69 percent in 2040. However, offshore natural gas production is expected to decline through 2026 until new discoveries offset declines in legacy fields.
8 EIA, “Annual Energy Outlook 2016 Early Release,” May 17, 2016, p. 51, http://www.eia.gov/forecasts/aeo/er/pdf/0383er(2016).pdf. 9 Ibid., p. 51. 10 Ibid., p. 51. 11 EIA, “Kenai, AK Liquefied Natural Gas Exports to Japan,” https://www.eia.gov/dnav/ng/hist/na1288_yena-nja_2A.htm, accessed July 8,
2016. 12 “Growth in Domestic Natural Gas Production Leads to Development of LNG Export Terminals,” U.S. Energy Information Administration,
March 4, 2016, http://www.eia.gov/todayinenergy/detail.cfm?id=25232. 13 Ibid. 14 Ibid. 15 “NGPL and Cheniere to Deliver Gas to Corpus Christi Liquefaction Project,” Shale Gas International, September 10, 2015,
http://www.shalegas.international/2015/09/10/ngpl-and-cheniere-to-deliver-gas-to-corpus-christi-liquefaction-project/. 16 “First U.S. LNG Shipment Departs . . . for Brazil,” Oilprice.com, February 25, 2016, http://oilprice.com/Energy/Natural-Gas/First-US-LNG-
Shipment-Departsfor-Brazil.html. 17 “Second US LNG cargo heads to Europe, set to reach Spain July 22: sources,” Platts.com, July 5, 2016, http://www.platts.com/latest-
news/natural-gas/london/second-us-lng-cargo-heads-to-europe-set-to-reach-21888018 18 There were 671 companies that submitted a Form 552 with nonzero volumes and nine companies that submitted a Form 552 with zero
volume, for a total of 680 companies. 19 To the extent that both parties to a transaction submit a Form 552, the total submitted volume will be double the volume of that
transaction. For example, a trade for 10,000 mmBtu between two companies, each submitting a Form 552, will add 20,000 mmBtu to the total volume. Relatedly, the minimum volume represented by Form 552 is the maximum of the buy and sale totals shown in Figure 7. Adding the buy and sale volume can double count transactions if both the buyer and seller file a Form 552. Conversely, estimating volume with only sales or only purchases may underrepresent the volume of transactions represented by Form 552, since some transactions involve market participants that do not submit a Form 552.
20 The figures reported by CME represent the average daily volume of its natural gas products, and they have been multiplied by 250 to convert them to annual values. CME reports the total number of contracts, and the volume represented by each contract may vary in size. See CME Form 10-Ks.
21 ICE 2014 10-K, p. 44. 22 CME 2015 10-K, p. 40. 23 Calculated based on Figure 8, index next month plus fixed-price next month: 45.6 percent + 3.0 percent = 48.6 percent; index next day
plus fixed-price next day: 32.4 percent + 11.9 percent = 44.3 percent. 24 Order 704 (p. 4) states that Form 552 submissions should be used “to determine important volumetric relationships between (a) the fixed
price, day-ahead or month-ahead transactions that form price indices; and (b) transactions that use price indices. Without the most basic information about these volumetric relationships, the Commission has been hampered in its oversight and its ability to assess the adequacy of price-forming transactions.”
25 Calculated based on Figure 9, volume potentially reported to index publishers divided by the volume of index-price transactions: 97,240 ÷ 12,714 = 7.65.
Characteristics of U.S. Natural Gas Transactions—Insights from FERC Form 552 Submissions | Page 20
ENDNOTES continued
26 Calculated based on Figure 11, integrated-upstream plus traders or wholesale marketers: 31.7 percent + 42.7 percent = 74.4 percent. 27 Calculated based on Figures 7 and 9, top 20 companies with volume reportable to indices and an affiliate that reports to index publishers
divided by total volume potentially reported to index publishers: 8,341 ÷ 12,715 = 65.6 percent. From Figure 7, 10 of the top 20 companies have any affiliates that report to index publishers, which totals 8,341. From Figure 8, the 2015 volume potentially reported to indices represented by the smaller blue bar totals 12,715.
28 Companies that had an index purchase and sale volume of between 49 percent and 51 percent were considered to be neutral. 29 Among other minor revisions, Order 704-C exempts transactions involving unprocessed natural gas as well as cash-out and imbalance
transactions. Further, for 2009, companies that hold blanket marketing certificates but do not meet the minimum transaction volume threshold are no longer required to file a Form 552. For 2008, more than 300 companies filed a Form 552 and did not report any transaction volume. For 2009, only 16 companies filed a Form 552 without reporting transaction volumes.
30 The categorization process is necessarily judgmental and was based on company websites and financial filings. Companies were categorized as closely as possible to their most significant natural gas market activity.
31 Since these integrated companies typically have a focus at either the industry segment that is upstream (such as production, gathering, or processing) or downstream (such as electric generation, marketing to wholesale users, or industrial consumption), two categories were created to allow for investigation of any differences between these types of companies.
32 FERC Form 552 (2009 version). Note that Form 552 covers only physical natural gas transactions. Financial transactions, such as swaps and options, are excluded, as are futures contracts, whether or not they are taken to physical delivery.
33 FERC includes NYMEX plus contracts among trigger contracts. In these contracts, the price is typically set at a specified index value as a default. The buyer, however, has the option to fix (or trigger) the price at any given point in time based on the prevailing market prices.
Typically, the buyer can fix the price at the prevailing NYMEX price for the delivery month plus a predetermined premium. When they are triggered, these contracts become fixed-price trades. Thus, while trigger contracts are initially dependent on an index price, they often shed this dependence and give the buyer the price certainty of a fixed-price transaction.
34 Physical-basis transactions are physical transactions that have prices set as a predetermined amount plus the NYMEX settlement price. The price-index publishers state that they incorporate physical-basis transactions into their price assessments.

Characteristics of U.S. Natural Gas Transactions—Insights from FERC Form 552 Submissions ABOUT THE AUTHORS
Greg Leonard
Ph.D., University of Rochester; M.A., University of Rochester; B.A., University of Texas at Austin
Greg Leonard, a vice president in the firm’s Washington, DC office, heads Cornerstone Research’s energy and commodities practice. He has 15 years of experience consulting to clients in complex commercial litigation and regulatory proceedings involving energy, commodities, finance, antitrust, and intellectual property. In the energy and commodity markets, Dr. Leonard has extensive experience in analyzing market manipulation claims, analyzing trading patterns and strategies, valuing trading businesses and portfolios, valuing alleged breaches of contract, evaluating risk management practices, and analyzing the price impacts of alleged wrongful conduct. Dr. Leonard has led consulting projects involving the trading of natural gas, natural gas liquids, liquefied natural gas, crude oil, refined products, agricultural products, electric power, and electric generation capacity on futures exchanges as well as in the OTC market. On behalf of clients, he has appeared before the enforcement staffs of the U.S. Commodity Futures Trading Commission, the Federal Energy Regulatory Commission, the Federal Bureau of Investigation, and the U.S. Department of Justice.
Nicole M. Moran
Ph.D., University of Illinois at Urbana–Champaign; B.S., University of Wisconsin
Nicole Moran is a manager in the energy and commodities practice in Cornerstone Research’s Washington, DC office. She provides financial and economic analysis in complex commercial litigation and regulatory proceedings and supports experts in preparing for deposition and trial testimony. Her experience spans several industries including energy, agriculture, FX, consumer lending, and electronics; her case experience includes arbitration, regulatory investigations, market manipulation, antitrust, consumer finance, and financial institutions. Dr. Moran’s emphasis has been on derivative markets for both exchange-traded and OTC products that involve trading activity, order book data, and evaluation of market design intricacies that affect market participant behavior. Prior to joining Cornerstone Research, Dr. Moran was a research economist at the U.S. Commodity Futures Trading Commission, where she conducted statistical and econometric analyses on derivative markets and agricultural futures. Her research has been published in leading journals, including the Journal of Futures and the Journal of Agricultural and Applied Economics.
ABOUT CORNERSTONE RESEARCH
Cornerstone Research provides economic and financial consulting and expert testimony in all phases of complex litigation and regulatory proceedings. The firm works with an extensive network of prominent faculty and industry practitioners to identify the best-qualified expert for each assignment. Cornerstone Research has earned a reputation for consistent high quality and effectiveness by delivering rigorous, state-of-the-art analysis for over 25 years. The firm has 600 staff and offices in Boston, Chicago, London, Los Angeles, New York, San Francisco, Silicon Valley, and Washington.
The views expressed in this report are solely those of the authors, who are responsible for the content, and do not necessarily represent the views of Cornerstone Research.

Boston617.927.3000
Chicago312.345.7300
London+44.20.3655.0900
Los Angeles213.553.2500
New York212.605.5000
San Francisco415.229.8100
Silicon Valley650.853.1660
Washington202.912.8900
www.cornerstone.com
© 2016 by Cornerstone Research, Inc. All Rights Reserved. Cornerstone Research is a registered service mark of Cornerstone Research, Inc. C logo and design is a registered trademark of Cornerstone Research, Inc.
Many publications quote, cite, or reproduce data, charts, or tables from Cornerstone Research reports. The authors request that you reference Cornerstone Research in any reprint of the figures or findings. Please direct any questions to:
Greg Leonard 202.912.8921 [email protected]
Nicole M. Moran 202.912.8963 [email protected]


