Page 1
1
Nádia S. Guerra Correia
Characterization and analysis of the biotechnological potential of a
Chlorococcum strain isolated at the microalgae production unit – ALGAFARM
Master Dissertation in Biodiversity and Plant Biotechnology, supervised by Professor Doutor Leonel Pereira and
Doutora Joana Laranjeira da Silva, presented at the Department of Life Sciences of the Faculty of Sciences and
Technology of the University of Coimbra
June of 2018
10 µm
Page 2
Front cover: Chlorococcum strain isolated at
ALGAFARM facilities. Light microscope photograph
by Nádia S. Guerra Correia.
Page 3
Nádia S. Guerra Correia
Characterization and analysis of the
biotechnological potential of a
Chlorococcum strain isolated at the
microalgae production unit –
ALGAFARM
Master Dissertation in Biodiversity and Plant Biotechnology,
supervised by Professor Doutor Leonel Pereira and Doutora Joana
Laranjeira da Silva, presented at the Department of Life Sciences of
the Faculty of Sciences and Technology of the University of
Coimbra for the obtaintion of Master Degree.
Supervisor: Professor Doutor Leonel Pereira
Co-Supervisor: Doutora Joana Laranjeira da Silva
Coimbra, June of 2018
Page 5
“Science is not only a disciple of reason but, also, one of romance and passion.”
Stephen Hawking
Page 7
vii
Acknowledgements
It has been such an adventure!
I could not have done all this work without the best people around me. I owe them an
eternal “thank you”!
From the beginning, I would like to acknowledge to all my Master Professors. From
them I learned and I made my choices based on that knowledge.
I would like to specially acknowledge my supervisor from University of Coimbra,
Professor Dr. Leonel Pereira, for giving advice and for sharing his passion for algae every
time we talked.
A special acknowledgement for Professor Dr.ª Fátima Santos for being so available
and helpful with the identification of the strain. Her knowledge is terrific!
To my supervisor from ALGAFARM, Dr.ª Joana Laranjeira da Silva, I have no words
to describe how grateful I am. It was an amazing experience that allowed me to grow in
many ways. Thank you for always working in order to give us the best opportunities, for
always wanting the best for us and for open us so many doors.
I am also very happy for having met my colleagues and friends from ALGAFARM
UI&D department. “Good people make good places”. A special acknowledgement for
Joana Teles, Pedro Quelhas and Imma Gifune, for all the patient and help in the most
difficult moments.
Joana Galante and Bernardo Carvalho, thank you for all the endless laughs and for
the enrichment of my musical knowledge!! I will miss all the productive and non-
productive conversations! You’re in my heart.
I would like to give a special acknowledgement also for the ALGAFARM UPM team.
I’ve gained much knowledge in the lab and I am very thankful for the job opportunity! I
couldn’t ask for more!
To all the CCMAR team, who was unstoppable during the time we’ve stayed in UAlg,
a huge acknowledgment. In particular to Professor Dr. João Varela and Hugo Pereira for
being relentless in helping during the most difficult time and for sharing their endless
knowledge! I am very grateful.
My close friends and family were always very supportive, and despite of not being
present all the times, they know that I am very thankful to them, for all the concern and
interest in my work. You’re like stars, despite I can’t always see you, I know that you’re
always there.
Page 8
viii
Above all, I would like to thank my mother, which allowed me to be where I stand
today.
A special caress to my boyfriend, Micael Leal, for all the patient, understanding and
support. You're like a warm light of a sunset.
Page 9
ix
Abstract
Currently, global warming, caused by the increase of greenhouse gases in the
atmosphere, it is a serious concern among scientist. Beyond the direct atmospheric
changes, the agricultural productions are also being affected and that are expected
reductions in food production.
The increasing world’s population and expanding economy leads to increasing
demand on alternative sources of food as well as environmental friendly sources of
biofuels.
Microalgae can be used to enhance the nutritional value of food and as supplement of
conventional animal feed, positively affecting the health and growth of humans and
animals.
Beyond, microalgae can efficiently use CO2, being responsible for more than 40 % of
global carbon fixation. In this context, microalgal cultures can be considered one of the
main biological CO2 fixation process for the mitigation of CO2 levels at the atmosphere
and, consequently, the global warming.
As the work was developed at ALGAFARM (microalgae production company), the
isolated strain was evaluated according to the needs for being suitable for the company.
Medium with 10 mM of nitrate and 1 mM of nitrate were tested. For high biomass
concentration and improved biochemical composition for food and feed, the 10 mM of
nitrate medium is more suitable.
The strain of Chlorococcum was evaluated in scale-up reactors until industrial scale
10000 L PBR. The best volumetric productivities, maximum and global, were obtained
in the pilot scale 2500 L PBR with 0.153 g.L-1.day-1 and 0.098 g.L-1.day-1, respectively.
However, the best areal productivities, maximum and global, were reached in industrial
scale 10000 L PBR with 36.559 g.m-2.day-1 and 17.419 g.m-2.day-1, respectively.
Chlorococcum better biochemical composition was obtained in the pilot scale 2500 L
PBR with 55.72 % of protein content, 18.35 % of total lipids content (where 74.70 % are
PUFAs), 17.71 % of carbohydrates and 7.61 % of ashes and reaching values of 4.02 % of
total chlorophyll and 1.09 % of total carotenoids content (where 71.01 % is lutein and
16.57 % is β-carotene).
Chlorococcum strain isolated in the ALGAFARM facilities showed to have a great
potential for feed and food applications since it reached high values of proteins content
and it also contain relevant amount of polyunsaturated fatty acids.
Page 10
x
This strain, without growth optimization, easily reached high values of total
chlorophyll, which can be used as natural food colorant. It is also suitable for application
in nutraceutical and pharmaceutical industries since showed a total carotenoids content
of more than 1 % of biomass dry weight, mainly constituted by lutein (5.374 mg.g-1) and
β-carotene (1.247 mg.g-1).
Despite of Chlorococcum sp. was reported in the literature to have the capacity to
produce astaxanthin, this pigment was not found as component of total carotenoids
content, since its production was not induced.
The isolated Chlorococcum was evaluated traditional microscopic observation and by
molecular analysis to identify the specie. However, any homology was found. The results
do not exclude the possibility of this strain could be a new specie, not yet identified.
Although, it do now allows to be 100 % sure of it and more analysis is need.
Keywords: Microalgae, Chlorococcum sp., Biochemical composition, Molecular
identification, Large-scale production.
Page 11
xi
Resumo
Atualmente, o aquecimento global, causado pelo aumento dos gases do efeito de
estufa na atmosfera, é uma preocupação séria entre os cientistas. Para além das alterações
diretas na atmosfera, as produções agrícolas também estão a ser afetadas, sendo esperadas
reduções na produção de alimento.
O aumento da população mundial e a expansão da economia levam ao aumento da
procura por fontes alternativas de alimento, bem como por fontes de biocombustíveis
amigas do ambiente.
As microalgas podem ser utilizadas para aumentar o valor nutricional dos alimentos
e como suplemento das rações de animais convencionais, afetando positivamente a saúde
e o crescimento de ambos, humanos.
Para além disso, as microalgas conseguem utilizar de forma eficiente o CO2, sendo
responsáveis por mais de 40 % da fixação global de carbono. Neste contexto, as culturas
de microalgas podem ser consideradas como um dos principais processos biológicos de
fixação de CO2 para a mitigação dos níveis de CO2 na atmosfera e, consequentemente,
atenuação do aquecimento global.
Como o trabalho foi desenvolvido na ALGAFARM (empresa de produção de
microalgas), a estirpe isolada foi avaliada de acordo com a necessidade de se adequar à
empresa. Foi testado meio com 10 mM de nitrato e 1 mM de nitrato. Para maiores
concentrações de biomassa e composição bioquímica melhorada para alimentação
humana e animal, o meio com 10 mM de nitrato é o mais adequado.
A estirpe de Chlorococcum foi avaliada em scale-up de reatores até ao PBR de escala
industrial de 10000 L. As melhores produtividades volumétricas, máxima e global, foram
obtidas no PBR de escala piloto de 2500 L com 0,153 g.L-1.dia-1 e 0,098 g.L-1.dia-1,
respetivamente. No entanto, as melhores produtividades areais, máxima e global, foram
conseguidas pelo PBR de escala industrial de 10000 L com 36,559 g.m-2.dia-1 e 17,419
g.m-2.dia-1, respetivamente.
A melhor composição bioquímica do Chlorococcum foi obtida no PBR de escala
piloto de 2500 L com 55,72 % de conteúdo de proteína, 18,35 % de conteúdo de lípidos
totais (onde 74,70 % são PUFAs), 17,71 % de hidratos de carbono e 7,61 % de cinzas e
atingindo valores de 4,02 % de clorofila total e 1,09 % de conteúdo de carotenóides totais
(onde 71,01 % é luteína e 16,57 % é β-caroteno).
Page 12
xii
O Chlorococcum isolado nas instalações da ALGAFARM mostrou ter grande
potencial para alimentação animal e humana uma vez que atingiu valores elevados de
proteína e, também, porque contém uma quantidade relevante de ácidos gordos
polinsaturados.
Esta estirpe, sem otimização do crescimento, atingiu facilmente valores elevados de
clorofila total, que pode ser utilizada como corante alimentar natural. Também é adequada
para aplicação nas indústrias nutracêutica e farmacêutica uma vez que mostrou um
conteúdo de carotenóides totais de mais de 1 % do peso seco da biomassa,
maioritariamente constituído por luteína (5.374 mg.g-1) e β-caroteno (1.247 mg.g-1).
Apesar do Chlorococcum sp. ter sido reportado na literatura como tendo a capacidade
de produzir astaxantina, este pigmento não foi encontrado como componente no conteúdo
de carotenóides totais, uma vez que a sua produção não foi induzida.
O Chlorococcum isolado foi avaliado por microscopia eletrónica tradicional e por
análise molecular com o objetivo de identificar a espécie. No entanto, não foi encontrada
homologia. Estes resultados não excluem a possibilidade desta estirpe poder ser uma nova
espécie, ainda não identificada. No entanto, não permite ter 100 % de certeza e são
necessárias mais análises.
Palavras-chave: Microalgas, Chlorococcum sp., Composição bioquímica,
Identificação molecular, Produção em larga-escala.
Page 13
xiii
Index of Contents
Acknowledgements ........................................................................................................ vii
Abstract ............................................................................................................................ ix
Resumo ............................................................................................................................ xi
List of Tables .................................................................................................................. xv
List of Figures ................................................................................................................ xvi
List of Abbreviation ..................................................................................................... xvii
1. Introduction ............................................................................................................. 19
1.1. Dissertation outline .............................................................................................. 19
1.2. Contextualization ................................................................................................. 19
1.3. Company Secil | Algafarm .................................................................................. 21
1.4. Research aims ...................................................................................................... 22
2. State of the Art ........................................................................................................ 22
2.1. Microalgae Biology and Growth Conditions ...................................................... 22
2.2. Microalgae Identification .................................................................................... 24
2.3. Chlorococcum sp. ................................................................................................ 24
2.4. Cultivation Systems ............................................................................................. 26
2.4.1. Large-scale biomass production ...................................................................... 27
2.5. Added-value compounds and market .................................................................. 28
2.5.1. Feed and Food application ............................................................................... 29
2.5.2. Environmental applications ............................................................................. 33
3. Materials and Methods ............................................................................................ 36
3.1. Microalgae strain and culture medium ................................................................ 36
3.2. Scale-up of the cultures for industrial production ............................................... 36
3.3. Growth assessment .............................................................................................. 37
3.4. Biochemical composition .................................................................................... 38
Page 14
xiv
4. Results and Discussion ............................................................................................ 44
4.1. Effect of nitrate concentration on growth and biochemical composition ............ 44
4.2. Chlorococcum sp. growth on large-scale photobioreactors................................. 47
4.3. Biochemical composition of biomass grown in PBR .......................................... 50
4.4. Molecular identification of Chlorococcum sp. .................................................... 55
Conclusions .................................................................................................................... 57
References ...................................................................................................................... 58
Page 15
xv
List of Tables
Table 1 - Influence of temperature on carotenoid content (% total carotenoids, w/w) of
Chlorococcum sp. (Adapted from Liu & Lee, 2000). .................................................... 25
Table 2- Table 1 - Influence of pH on carotenoid content (% total carotenoids, w/w) of
Chlorococcum sp. (Adapted from Liu & Lee, 2000). .................................................... 25
Table 3 - Comparative data on biological value (BV), digestibility coefficient (DC), net
protein utilization (NPU) and protein efficiency ratio (PER) of different microalgae,
casein and egg (based on Becker, 2007). ....................................................................... 30
Table 4 - Particularly interesting microalgal PUFAs (Adapted from Spolaore et al., 2006)
........................................................................................................................................ 32
Table 5 - Mastermix composition. .................................................................................. 42
Table 6 - PCR Program settings. .................................................................................... 42
Table 7- Values of productivities and specific growth rate of 5 L laboratorial air-lifts at
10 mM and 1 mM of NO3- cultivation. ........................................................................... 47
Table 8 - Values of volumetric and areal productivities of scale-up and industrial reactors.
........................................................................................................................................ 49
Table 9 - Values of specific growth rats and photosynthetic efficiency on scale-up and
industrial reactors. .......................................................................................................... 50
Table 10 - Values of protein, total lipids, carbohydrates and ashes from 2500 L PBR and
10000 L PBR. ................................................................................................................. 50
Table 11 - FAME composition of Chlorococcum sp. on 2500 L PBR and 10000 L PBR.
........................................................................................................................................ 52
Table 12 - Values of total chlorophyll and total carotenoids content by spectrophotometry
on 2500 L PBR and 10000 L PBR. ................................................................................ 53
Table 13 - Values of carotenoid composition by HPLC on 2500 L PBR and 10000 L PBR.
........................................................................................................................................ 54
Page 16
xvi
List of Figures
Figure 1 - Aerial view of ALGAFARM facilities and SECIL facilities (From Magazine
Pontos de Vista, 2017). ................................................................................................... 22
Figure 2 - Astaxanthin possible pathways in Chlorococcum sp. (Adapted from Liu & Lee,
1999). .............................................................................................................................. 26
Figure 3 - Applications of microalgae (Adapted from Chew et al., 2017). .................... 29
Figure 4 -Transesterification reaction for biodiesel production (Adapted from Hoekman
et al., 2012). .................................................................................................................... 34
Figure 5 - Pictures from ALGAFARM unit: laboratory air-lifts 5 L (A); GWP 125 L (B);
PBR 2500L (C); PBR 10000L (D and E). ...................................................................... 36
Figure 6 - A: Ceramic cup with biomass; B: Furnace with the samples inside; C: Ceramic
cups with resulting ashes. ............................................................................................... 39
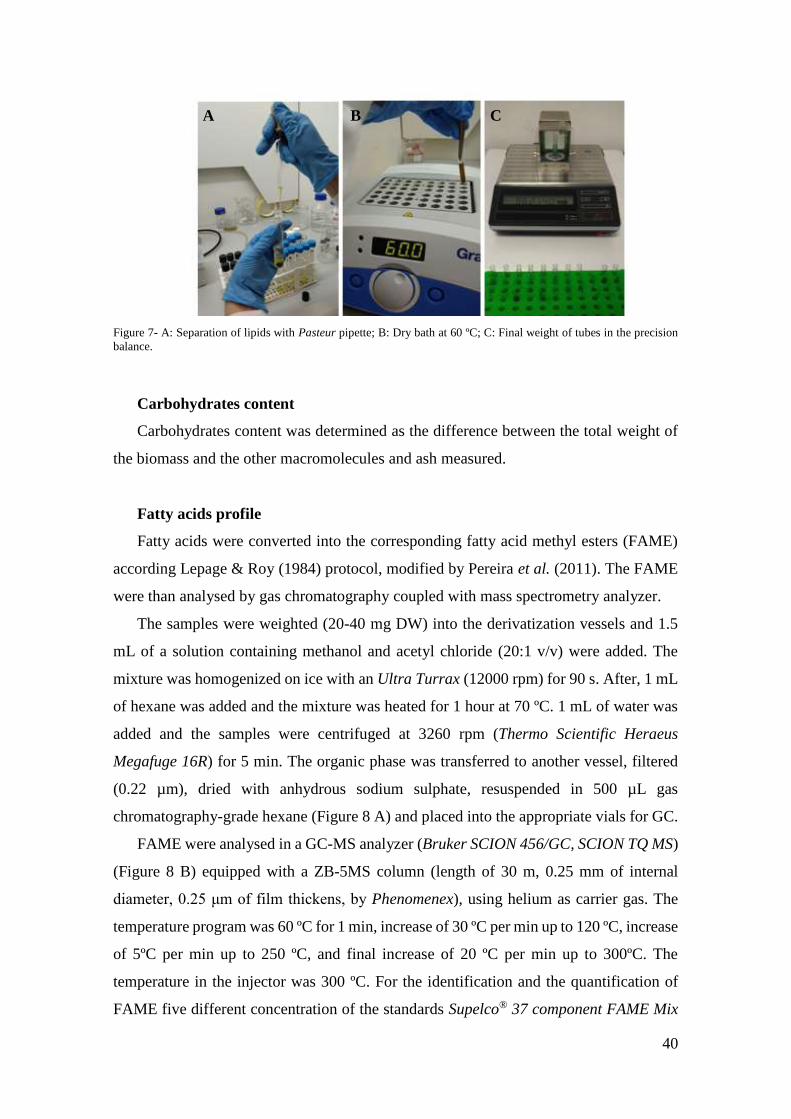
Figure 7- A: Separation of lipids with Pasteur pipette; B: Dry bath at 60 ºC; C: Final
weight of tubes in the precision balance. ........................................................................ 40
Figure 8 -A: Resuspension of dried sample with hexane; B: Injection of a vial sample at
the GC-MS analyzer. ...................................................................................................... 41
Figure 9- A: NanoDrop®; B: HITACHI 3130xl, Genetic Analyzers. ............................. 43
Figure 10 - Curve growth (■) of Chlorococcum cultivated at 1 mM of NO3- and evolution
of total chlorophyll (▲), total carotenoids (∆) , protein (●) and lipid (○) content during
the growth. ...................................................................................................................... 45
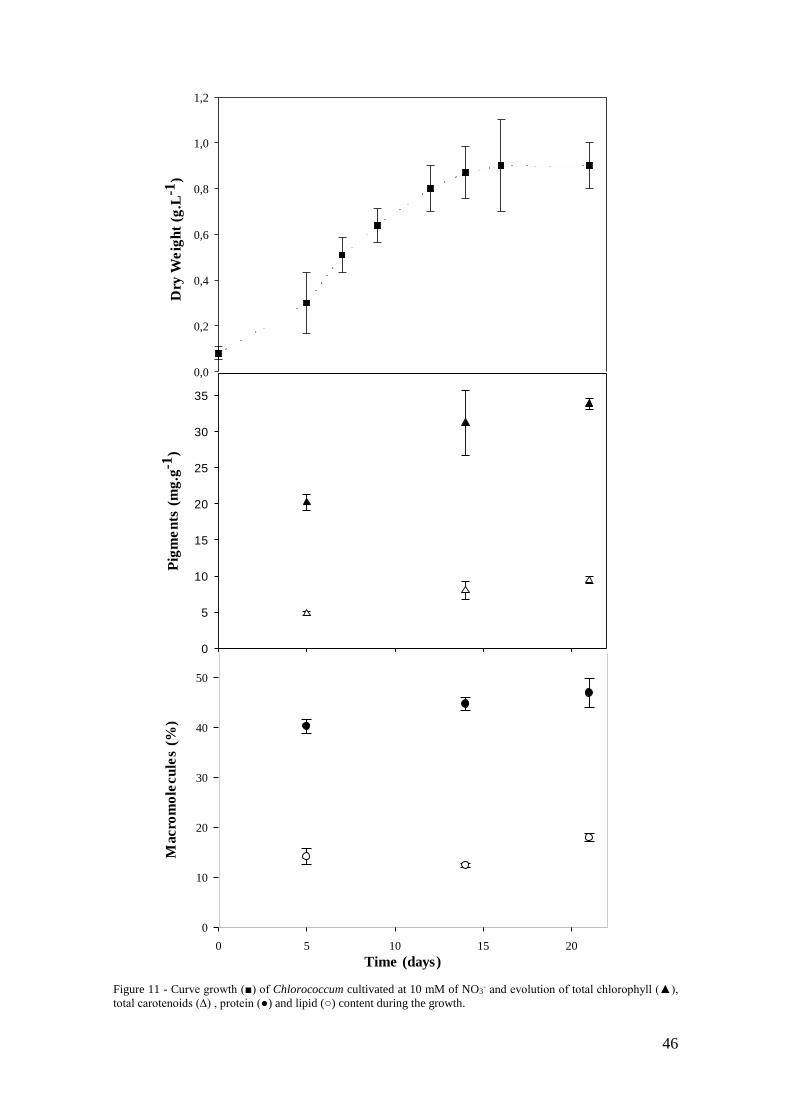
Figure 11 - Curve growth (■) of Chlorococcum cultivated at 10 mM of NO3- and
evolution of total chlorophyll (▲), total carotenoids (∆) , protein (●) and lipid (○) content
during the growth. .......................................................................................................... 46
Figure 12 - Growth curves of scale-up: reactors 125 L GWP (●), 250 L GWP (○), pilot
2500 L PBR (▼) and industrial 10000 L PBR (∆)......................................................... 48
Figure 13 - Diagram obtained from molecular analysis of the isolated strain of
Chlorococcum (0030CN) with Maximum-likelihood (ML). .......................................... 56
Page 17
xvii
List of Abbreviation
AA Arachidonic acid
AMD Age-Related Macular Degeneration
ANOVA Analysis of variance
APCER Associação Portuguesa de Certificação
BIO Biologic
BV Biological value
CO2 Carbon dioxide
DC Digestibility coefficient
DHA Docosahexaenoic acid
DNA Deoxyribonucleic acid
DW Dry weight
EPA Eicosapentaenoic acid (C20:5 ω-3)
EtOH Ethanol
FAME Fatty acid methyl esters
FAO Food and Agriculture Organization
GHG Greenhouse gases
GLA Octadecatrienoic / Gamma linolenic acid
(C18:3 ω-6)
GS-MS Gas Chromatography-Mass spectrometry
Gt Gigatonne
GWP Green wall panel
ha Hectare
Kg Kilogram
ISO International Organization for Standardization
ITS Internal transcribed spacer
LDPE Low-density polyethylene
LA Octadecadienoic / Linoleic acid
(C18:2 ω-6)
m3 Cubic meter
MUFA Monounsaturated fatty acids
N Nitrogen
Page 18
xviii
NaAc Sodium acetate
NCBI National Center for Biotechnology Information
NH4+ Ammonium
NO3- Nitrate
NPU Net protein utilization
OHSAS Occupational Health and Safety Assessment Series
O2 Oxygen
P Phosphorous
PBR Photobioreactor
PER Protein efficiency ratio
pH potential of Hydrogen
PUFA Polyunsaturated fatty acids
P-value Significance value
rbcL Ribulose-Bisphosphate Carboxylase gene
RNA Ribonucleic acid
rRNA Ribosomal ribonucleic acid
rpm Rotations per minute
S Sulphur
SD Standard deviation
SDA Saturated fatty acids
SEM Scanning Electron Microscope
TAG Triacylglycerol
TEM Transmission Electron Microscope
ω Omega
Page 19
19
1. Introduction
1.1. Dissertation outline
The present work is organized into five distinct chapters. First, the current
environmental problems are discussed and the microalgae cultivations are proposed as an
alternative to solve those problems. The company producing microalgae, where all the
work has been developed, is presented and the main intended objectives of this thesis are
explained.
In the second chapter, the state of the art is reported, focusing on microalgae
cultivation methods, added value products obtained from these microorganisms, market,
and factors that influence their production. The specie of microalga adopted in this study,
Chlorococcum sp., is introduced.
The third chapter illustrates the material specifications and methods used in
microalgae production, control, and biomass analysis, as well as a statistical analysis for
the data treatment.
The fourth chapter discusses the results obtained from the microalgae growth and the
biomass analysis, focused on the biotechnological potential of Chlorococcum sp., in
different growth conditions, in different scale bioreactors and their influence on the
biochemical composition and protein, pigment and lipid yields.
The fifth and last chapter ends the dissertation with some general conclusions and
future prospects.
1.2. Contextualization
Nowadays, the threat of climate change is debated with great concern by scientists
from various fields. Global warming is mainly caused by the increase of the greenhouse
gases (GHG) in the atmosphere, particularly the carbon dioxide (CO2) (Bhola et al., 2013;
Rasul et al., 2017). This phenomenon will promote future changes in decisive factors that
support life on the Earth as known today. They are expected: species extinction, changes
in the amount and distribution of the precipitation, glacial melting and rise of the ocean
level (Pires et al., 2012).
Besides, the reduction in food production is another critical theme because the climate
changes affects the agricultural production, and it cause areal reductions in
geographically underprivileged fields (Altieri & Nicholls, 2013). Moreover, agricultural
land suffers the soil deterioration due to the extensive manipulation, synthetic chemical
Page 20
20
fertilizers and pesticides, which contributes to environmental degradation and harms
human and animal health (Mostafa, 2012).
According to FAO (Food and Agriculture Organization), 33 % of global soil suffers
from moderate to high degradation, by contrast it will be required to increase food
production of about 60 % until 2050 to satisfy population necessities (FAO & ITPS,
2015).
It is important to implement new and more sustainable production strategies, which
can satisfy mankind need and avoid or mitigate these environmental issues (Altieri &
Nicholls, 2013).
The increasing world’s population and the predictions of an insufficient protein
supply led to the research of new alternative and unconventional protein sources. Algal
biomass appeared as a good candidate for this purpose since its cells are able to synthesize
all the essential aminoacids and their cultivation do not compete for arable land since they
can grow in bioreactors (Spolaore et al., 2006; Gouveia et al., 2015).
Microalgae can be used to enhance the nutritional value of food and as supplement or
substitute of conventional animal feed sources, from aquaculture to farm animals. Their
chemical composition was already reported to positively affect the health and the growth
of humans and animals (Spolaore et al., 2006; Guedes & Malcata, 2012).
On another level, the increasing population and expanding economy leads to
increasing demand of fossil fuel. Nevertheless, fuels supplies are finite and expected to
decline over the next few decades (Borowitzka & Moheimani, 2013; Hannon et al., 2014).
The replacement of conventional fuels requires: sufficient feedstock, competitive
costs and to match standard specification of fuel quality (Harun et al., 2010). Based on
these requirements, microalgae have potential to be used as a raw material for biodiesel
production, but it’s fundamentally important the selection of the highly productive, oil-
rich algal strains to achieve a cost-effective biofuel (Harun et al., 2010; Hannon et al.,
2014).
Beyond all these benefits, microalgae can efficiently use CO2, being responsible for
more than 40 % of global carbon fixation. The aquatic environment is the greatest active
reservoir of carbon in the planet (38.000 Gt compared with 748 Gt in the atmosphere). In
this context, microalgal cultures can be considered on the main the main biological CO2
fixation process for the mitigation of the CO2 levels released from industry, and,
consequently, the global warming (Pires et al., 2012).
Page 21
21
1.3. Company SECIL | ALGAFARM
The activity of this dissertation was carried out at ALGAFARM, the unit of
microalgae production of the company Cimentos Maceira e Pataias (CMP), SECIL
Group, which is a leading cement producer in Portugal, located in Pataias, Alcobaça.
Founded in Portugal, SECIL also operates internationally in Angola, Tunisia,
Lebanon, Cape Verde, The Netherlands and Brazil and produces an annual output of
cement of 9 million tons (SECIL, 2018).
The main GHG resulting of the cement production is CO2 from calcination of
carbonates from raw material (60 % of emissions) and combustion of fuel in the ovens
(40% of emissions). However, in the last years, SECIL has been improving the thermal
and electrical efficiency and co-processing alternative fuels to reduce CO2 emissions. In
addition, the company is investing in innovative technologies for carbon sequestration
with recourse to microalgal cultures in the facilities of ALGAFARM (SECIL, 2018).
ALGAFARM become operational in 2013 with the main goal of contributing to the
carbon capture from the cement plant and it is the largest industrial unity of microalgae
production in Europe. The plant has a total volume of 1300 m3, occupies more than 1 ha
ground area and is able to produce 100 t of dried biomass per year (Fonseca et al., 2016).
The production unit operates in closed photobioreactors (PBR) in autotrophic
conditions, but the process for dark heterotrophic fermentation, in 200 L and 5000 L
reactors, has been recently established for Chlorella vulgaris (Chlorophyta). The
heterotrophic fermentation is aimed to reduce the scale-up time, which is a constringent
factor in microalgae production. Then, ALGAFARM mixotrophic cultivation are
established, when PBR are inoculated with heterotrophic inoculum of C. vulgaris. From
this process results a premium quality biomass with biochemical composition higher than
autotrophic cultivated C. vulgaris (Fonseca et al., 2016; Silva et al., 2017).
The next strategy, in the near future, goes through the construction of raceways to
produce biomass with lower costs (Silva et al., 2017).
The company’s mission is to bring the best of microalgae biomass in the different
market field such as human food, dietary supplements, animal nutrition, cosmetics and
biofertilizers (SECIL, 2018). ALGAFARM is currently working with Chlorella vulgaris,
Chlorella vulgaris BIO, Nannochloropsis oceanica (Ochrophyta), Phaeodactylum
tricornutum (Bacillariophyta), Tetraselmis chuii and Scenedesmus sp. (Chlorophyta) and
the quality of the final products are ensured by APCER: ISO 22000, ISO 9001, ISO 14001
and OHSAS 18001 (Allmicroalgae, 2018).
Page 22
22
Figure 1 - Aerial view of ALGAFARM facilities and SECIL facilities (From Magazine Pontos de Vista, 2017).
1.4. Research aims
The main goal of this dissertation was the assessment of the biotechnological potential
of a Chlorococcum sp. (Chlorophyta) isolated in ALGAFARM unit. The attention was
focused on the content of protein, lipids, carbohydrates and pigments as well as the
productivity as key parameter to define the microalgal strain applications and their
reference market.
Biomolecular tests were also performed in order to identify the specie of the
autochthon Chlorococcum adopted.
2. State of the Art
2.1. Microalgae Biology and Growth Conditions
Microalgae are an extremely heterogeneous group of photosynthetic organisms and
the main producers of marine biomass. They are usually individual unicellular
microorganisms (2-200 µm) but they can be organized in colony with little or no cell
differentiation (Olaizola, 2003; Mutanda et al., 2010). Some algae are derived from a
Page 23
23
eukaryotic ancestor that acquired a photosynthetic cyanobacterium in a single
endosymbiotic event, resulting in green algae, red algae and glaucophytes. In other algae,
a secondary endosymbiotic event has occurred whereby a red or green alga was taken up
by a eukaryotic ancestor (Sasso et al., 2012).
Eukaryotic microalgae are used to be compared to primitive plants and can be either
autotrophic, heterotrophic or mixotrophic. Autotrophic microalgae require only inorganic
compounds such as CO2, nitrogen (N), sulphur (S), phosphorous (P) and light as an
energy source for their growth and development. There are several forms of N which can
be metabolized by algae such as ammonia, nitrate or urea. However, it is important to
note that the form of N provided, can affect the cell composition, including the lipid
content and fatty acid composition, as well as the growth rate and the culture stability
(Borowitzka & Moheimani, 2013). Mixotrophic cultures are able to perform
photosynthesis and to catabolize exogenous organic nutrients (Pignolet et al., 2013).
The average elemental composition of freshwater algae is CH1.7O0.4N0.15P0.0094, but
the N content can change according to the environmental conditions and nutrient status
of the algae. In order to achieve maximum growth, these elements need to be supplied in
sufficient quantity, otherwise they will be a limiting factor to growth (Borowitzka &
Moheimani, 2013; Rasul et al., 2017).
Microalgae can rapidly generate biomass from solar energy and use the CO2 from
atmosphere, and as they have minimal resource requirements, they can grow in harsh
environments such as deserts, rocky areas, salt pans, brackish water or wastewaters and
do not compete for land or important resources like drinking waters (Mostafa, 2012;
Gouveia et al., 2015). They tolerate a wide range of pH, temperature, turbidity, O2, and
CO2 concentration (Mutanda et al., 2010; Barsanti & Gualtieri, 2014).
Generally, microalgae contain 40-70 % (w/w) of protein, 4-20 % (w/w) of lipids and
12-30 % (w/w) of carbohydrates. Although, when the cultures are in the stationary phase,
the composition of microalgae may significantly change, e.g. nitrate limitation leads
carbohydrate levels to double at the expense of protein (Guedes & Malcata, 2012; Ejike
et al., 2017).
Page 24
24
2.2. Microalgae Identification
Microalgae are traditionally classified according to morphological and cytological
characteristics of vegetative stages in their life cycle by means of microscope-based
techniques. However, several studies have shown that the morphology could vary under
different environmental conditions, which led to uncertain identification at the specie
level (Darienko et al., 2015) For more specific identification, conventional light
microscopy has been extended to include fluorescence microscopy, phase-contrast
microscopy, transmission electron microscopy (TEM) and scanning electron microscopy
(SEM) (Bhola et al., 2013). Anyway, as microscopy it is time-consuming and it requires
significant experience in technical and taxonomic skills, molecular-based techniques
have been adopted. Molecular identification enables rapid and precise monitoring,
identification and quantification of microalgal species. The analysis of DNA regions for
phylogenetic purposes include mitochondria genes, ribosomal RNA genes (rRNA),
internal transcribed sequences (ITS), plastid genes (rbcL) and microsatellite DNA
sequences. Then, a comparison with known 18S rRNA gene sequences collected in
standard database (such as NCBI) is carried out. The specie is identified if a match of at
least 90 % occurs (Bhola et al., 2013; Bellinger & Sigee, 2015).
2.3. Chlorococcum sp.
Cells of the genus Chlorococcum belong to the Chlorophyta phylum,
Chlamydomonadales order and Chlorococcaceae family. They live as solitary vegetative
cells or in temporary groups of indefinite form. The reproduction is mainly asexual, by
zoospores (or aplanospores in case of water stress) or sexual, by isogametes, when the
environmental conditions are not propitious such as light or nitrogen limitation
(Watanabe & Lewis, 2017). Chlorococcum genus is distinguished from other spherical,
zoospore-producing algae by three attributes (Bold & Parker, 1962):
i. a hollow, parietal chromatophore (chloroplast) with or without an open
surface;
ii. one or more pyrenoids;
iii. biflagellate zoospores which do not become spherical upon cessation of
motility but retain an ovoid, ellipsoid shape for some days.
This genus is cosmopolitan. It has been isolated from hot springs in Central Asian and
also in soils of Antarctica. This microalga can be collected from aquatic and aerial
environments and also from soil and rocky areas (Watanabe & Lewis, 2017).
Page 25
25
In the context of carbon sequestration, the genus Chlorococcum, Chlorella,
Scenedesmus (Chlorophyta) and Euglena (Euglenozoa) (Bhola et al., 2013) have been
recognized as the most efficient. Indeed, their cultures can reach high density cultures, up
to 84 g.L-1 by using a flat-panel photobioreactor. Moreover, Chlorococcum littorale
possess a high CO2 tolerance (up to 65 % of CO2), which make it an interesting candidate
for the CO2 biofixation (Ota et al., 2015).
Chlorococcum sp. has been reported as a potential source for biodiesel production
since its lipid content reaches concentrations higher than 20 % (Prabakaran et al., 2018).
Usually algal oil containing saturated and polynsaturated fatty acids are used as feedstock
for biodiesel production. Chlorococcum humicola oil contain around 95,4 % of C14-18
fatty acids (Santhoshkumar et al., 2016; Shankar et al., 2017).
Due to its relative fast growth rate, ease of cultivation in outdoor systems, and high
tolerance to extreme pH and high temperature, Chlorococcum sp. is considered a
promising comercial source of ketocarotenoids.
Lipid fraction of green vegetative cells, in some cases, consists mostly of lutein (75–
80 %) (Lorenz & Cysewski, 2000) and the carotenoid composition changes as function
of temperature and pH of the culture (Table 1 and 2) (Liu & Lee, 2000):
Table 1 - Influence of temperature on carotenoid content (% total carotenoids, w/w) of Chlorococcum sp. (Adapted
from Liu & Lee, 2000).
Carotenoid 20 °C 25 °C 30 °C 35 °C
β-Carotene 25.3 14.5 6.79 5.21
Astaxanthin 6.8 7.9 9.51 11.6
Total Carotenoids 4.4 6.5 7.2 8.4
Table 2- Table 1 - Influence of pH on carotenoid content (% total carotenoids, w/w) of Chlorococcum sp. (Adapted
from Liu & Lee, 2000).
Carotenoid pH 5 pH 6 pH 7 pH 8 pH 9
β-Carotene 12.4 10.4 8.30 6.20 13.4
Astaxanthin 3.52 6.80 7.90 9.51 5.80
Total Carotenoids 3.82 2.05 5.50 2.42 1.77
Page 26
26
One of the most important carotenoid produced by microalgae is the astaxanthin. In
Chlorococcum sp., astaxanthin is synthesized from β-carotene by pathways which differ
from other astaxanthin-producing
microorganisms. In Haematococcus lacustris
(formerly H. pluvialis) (Chlorophyta),
astaxanthin esters are the main ketocarotenoid
while Chlorococcum cells could accumulate
not only astaxanthin, but also large amounts of
adonixanthin and canthaxanthin as well as
astaxanthin. It suggests that the conversion of
β-carotene to adonixanthin or canthaxanthin
represents a very rapid reaction and both
canthaxanthin and adonixanthin can be the
reaction intermediate for the astaxanthin
synthesis from β-carotene (Figure 2) (Liu &
Lee, 1999; Yuan et al., 2002).
A thorough understanding of the regulation
and pathway of carotenogenesis would allow us
to develop defined bioprocess for the
production of the desired carotenoid
modulating the temperature (Liu & Lee, 2000).
Although the industrial applications of
Chlorococcum sp. are focused on lipids for biodiesel, biofixation of CO2 and carotenoids
for cosmetic and pharmaceutic industries, the protein content is also becoming relevant
for food or feed industries (Chew et al., 2017).
2.4. Cultivation Systems
The nutritional value of microalgae fluctuates with environmental factors, the
harvesting treatment and the method of drying the cells (Spolaore et al., 2006). Some
environmental factors can be controlled by adopting closed culture systems.
There are several reactor configurations that provided successful mass cultivation of
microalgae. The selection of the suitable culture systems should take into account the
efficiency of light utilization, the control of temperature, the hydrodynamic stress on
cells, the ability to maintain axenic cultures and the feasibility of scale-up. Two major
Figure 2 - Astaxanthin possible pathways in
Chlorococcum sp. (Adapted from Liu & Lee, 1999).
Page 27
27
classes of culture system are currently adopted for large-scale culture: closed
photobioreactors (PBRs) and open ponds (Guedes & Malcata, 2012). Each of these
system present some advantages and drawbacks and their selection should consider the
selected microalgal strain and the main target product.
2.4.1. Large-scale biomass production
Open ponds
Open ponds can have different shapes and forms, and different agitation system. The
location in which the pond is situated, the algal strain and the amount of light for
photosynthesis are the main factors for the selection. The types that are currently used in
the research and the industry are: raceways ponds, circular ponds tanks and shallow big
ponds. This type of cultivation is limited by low light availability, temperature
fluctuation, increase in the pH and dissolved oxygen concentration and exposure to
contamination, thus, only some algal strains are able to grow in the ponds (Olaizola, 2003;
Harun et al., 2010; Rasul et al., 2017). However, the costs of construction and operations
of this cultivation are lower than the closed systems (Harun et al., 2010; Guedes &
Malcata, 2012).
Photobioreactors
Closed systems, mainly known as photobioreactors, gives a better control of the
culture parameters, minimize of water evaporation, reduce of the contaminations by
predators and competitive algal weeds and allows higher productivity (Rasul et al., 2017).
A typical photobioreactor is essentially a four-phase system, consisting of: solid
microalgal cells, a liquid growth medium, a gaseous phase and incident light radiance.
There are several options of closed systems but the mainly used include tubular, flat plate
and fermenter types (Guedes & Malcata, 2012).
Tubular photobioreactors are made with transparent materials and placed outdoor to
use sunlight irradiation. Improved sunlight exploitation derive from their large surface
area per volume unit (Guedes & Malcata, 2012).
The flat plate, also known as green wall panel, is a vertical plate photobioreactor
mixed by air bubbling. It ensures high irradiance on the surface area and high biomass
productivity. Moreover, the use of thin, transparent, cheap and flexible materials (like
LDPE) reduce the construction costs with respect to the tubular photobioreactors (Rasul
et al., 2017).
Page 28
28
Fermenters are controlled bioreactor, operating in indoor, generally used for bacterial
and yeast growth. They have been proved to be competitive tools also for the
heterotrophic microalgal growth. Indeed, the heterotrophic growth in fermenter allows
the achievement of biomass concentration up to 200 g.L-1. This concentrated biomass can
be used as inoculum of large scale PBRs reducing the time for the scale-up, which is a
crucial factor for industry (Silva et al., 2017).
2.5. Added-value compounds and market
The first use of microalgae by humans, dates back 2000 years to the Chinese, who
used Nostoc to survive during famine, but large-scale culture only started in the early
1960’s in Japan with the culture of Chlorella. By 1980 there were 46 large-scale factories
in Asia producing more than 1000 Kg of microalgae per month. In 1986 started the
commercial production of Dunaliella salina (Chlorophyta) as a source of β-carotene and,
more recently, began the production of Haematococcus pluvialis as a source of
astaxanthin. Thus, the microalgal biotechnology industry has grown and diversified
significantly. Nowadays, the microalgal biomass market produces about 5000 tons of dry
matter per year (Spolaore et al., 2006).
Between 1965 and 2006 almost 18.500 new compounds isolated from marine sources
have been discovered, but their value is still limited if compared with almost 97 % of all
existing marine compounds that have not yet been isolated (Guedes et al., 2011b).
Microalgae, that covers the majority of the marine environment and are responsible for
over half the primary production at the base of the food chain, remain largely unexplored
and may represent an opportunity to discover novel metabolites and produce them at
lower costs (Guschima & Harwood, 2006; Guedes et al., 2011b).
Currently, there is a great interest in microalgae as sources of renewable energy,
biofuels and as a range of feedstocks such as for feed (Borowitzka & Moheimani, 2013;
Zhu, 2015; Rastogi et al., 2017) bioplastics, biofertilizers, biofuels and wastewater
treatment (Gouveia et al., 2015). Rather, the most profitable microalgae components find
application in the cosmetic and pharmaceutical field and as high-value food and feed
additives. These microalgae compounds include: minerals, vitamins, pigments,
antioxidants, polyunsaturated fatty acids (PUFAs), proteins and polysaccharides (Harun
et al., 2010; Bhola, 2013).
The accumulation of high value metabolites is associated to secondary pathway of
microalgal metabolism. The induction of secondary metabolism is influenced by
Page 29
29
environmental conditions or developmental stages (Mostafa, 2012). The controlled
induction of secondary metabolism is particularly interesting in biotechnology industry
since it makes possible to increase the production of the desired valuable metabolite
(Guedes et al., 2011a).
Figure 3 - Applications of microalgae (Adapted from Chew et al., 2017).
2.5.1. Feed and Food application
Protein
Proteins are the main constituents of microalgae and one of the important products of
microalgae biorefineries (Chew et al., 2017). Peptides are very interesting for functional
food application due to their demonstrated biological activities in human health
conditions such as hypertension, oxidative stress, cancer, diabetes, inflammation, and
immune disorders. These peptides exist as part of microalgae proteins and remain inactive
until they are released by enzymatic hydrolysis via gastrointestinal protease action. The
use of protein-derived bioactive peptides as functional ingredients in foods is a rapidly
developing area of food innovation (Ejike et al., 2017).
Microalgal proteins are also appreciated as additive to feed for a wide variety of
animals ranging from fish (aquaculture) to pets and farm animals (Spolaore et al., 2006).
Microalgae can synthesize all 22 amino acids and they can be considered
unconventional sources of essential amino acids for human nutrition. The amino acid
Extraction of
fatty acids &
Purification
Microalgae
biomass
cultivation
Cell disruption,
Product extraction
and separation
Fertilizer /
nutrients
Fermentation
Oleochemistry
Transesterification
Sunlight, nutrients, CO2
Oil fraction
Protein
fraction
Carbohydrate
fraction Minerals
Chemicals
Value-added products
(e.g. omega fatty acid)
Biodiesel
Feed
Biogas
Value-added products
(e.g. amino-acids)
Fuels and chemicals
(e.g. ethanol, butanol)
Value-added products
(e.g. iodine)
Page 30
30
composition of microalgal proteins is rather similar between species and it is affected by
the growth phase and the light irradiance (Guedes & Malcata, 2012).
Moreover, chemical analyses and nutritional studies demonstrated that these algal
proteins have high quality, comparable to conventional vegetable proteins, but lower
biological values and digestibility if compared to casein and egg protein (Table 3)
(Becker, 2007; Ejike et al., 2017).
Table 3 - Comparative data on biological value (BV), digestibility coefficient (DC), net protein utilization (NPU) and
protein efficiency ratio (PER) of different microalgae, casein and egg (based on Becker, 2007).
Product BV DC NPU PER
Casein 87.8 95.1 83.4 2.50
Egg Protein 94.7 94.2 89.1 -
Scenedesmus obliquus 71.9 77.1 55.5 1.20
Chlorella sp. 52.9 59.4 31.4 0.84
Even so, the consumption of alternative protein is growing rapidly and extracted
protein from other sources such microalgae would cover up to 50 % market of the total
alternative protein by 2054 (Khanra et al., 2018).
Carbohydrates
In microalgae, carbohydrates can be found mainly in the form of starch, glucose and
other polysaccharides. Their high digestibility encourages the use of dried whole
microalgae in foods or feeds without restriction (Spolaore et al., 2006). Moreover, as the
microalgae-based carbohydrates consist mainly of cellulose and starch without the lignin
component characterizing vegetal sources, they also find application as readily available
carbon sources for the fermentation industry aimed at biobutanol and bioethanol
productions (Chew et al., 2017).
Specific microalgal polysaccharides are able to modulate the immune system and
inflammatory reactions with significant application as sources of biologically active and
natural therapeutic agents (Chew et al., 2017).
Lipids
Microalgae produce significant amounts of lipids in natural conditions, but this lipid
accumulation decreases when cultivation conditions are optimized to increase biomass
Page 31
31
content. The lipids accumulation is generaly associated to reduced growth rate then, the
traditional approach for microalgae lipid production is based on two main steps: first,
microalgae biomass production (growth phase) and second, lipid accumulation induced
by nitrogen starvation (stress phase) (Shankar et al., 2017).
Microalgae are mainly composed by polar lipids such as phospholipids and
glycolipids, which are confined to cell organelle membranes, and neutral storage lipids,
such as monoglycerides, diglycerides, triglycerides, free fatty acids, hydrocarbons, and
pigments, which can be found mainly in vacuoles of the cell (Pignolet et al., 2013).
In recent years, the fatty acids compositions of microalgae attracted considerable
interest among researchers and new and high value application emerged beyond biodiesel
production (Spolaore et al., 2006; Mostafa, 2012). The microalgae adopted for fuel
purpose have been diatoms, green algae, golden brown, prymnesiophytes and
eustigmatophytes (Pires et al., 2012).
Their fatty acids composition varies according to the species and their environmental
conditions (Mutanda et al., 2010). PUFAs are of the utmost importance for human
metabolism. They are the major components of cell membrane phospholipids and may
also be present in cellular storage oils (Pereira, et al., 2012). Within them, some of the
Omega-3 (3) and Omega-6 (6) families are of particular interest for human and animal
nutrition. The functional sources of 3 in microalgae are normally eicosapentanoic acid
(EPA) and docosahexaenoic acid (DHA). These fatty acids are manly obtained from fish
oil, however, microalgae are self-producing 3 and the production process is simple and
economic (Harun et al., 2010).
Most of the microalgal species exhibit considerable percentage of EPA (7 to 34 %),
however, chlorophytes are, in general, deficient in both C20 and C22 PUFAs, only some
species have small amounts of EPA (up to 3.2 %) (Guedes & Malcata, 2012).
These PUFAs have many health benefits. EPA has been used in clinical purposes,
such as the treatment of coronary heart disease and inflammatory diseases. DHA helps
the cancer therapy, maintaining lower the level of cholesterol so that it boosts the immune
system and detoxifies the body (Harun et al., 2010; Mostafa, 2012).
The applications of the polyunsaturated fatty acids include also the addition to infant
formulas and nutritional supplements (Table 4). Moreover, they are very appreciated in
aquaculture feed, where the ratios of DHA, EPA and arachidonic acid (AA) fulfil relevant
importance (Spolaore et al., 2006; Guedes & Malcata, 2012).
Page 32
32
Table 4 - Particularly interesting microalgal PUFAs (Adapted from Spolaore et al., 2006)
PUFA Structure Potential application
Gamma Linolenic acid
(GLA) 18:3 6, 9, 12
Infant formulas
Nutritional supplements
Arachidonic acid (AA) 20:4 6, 9, 12, 15 Infant formulas
Nutritional supplements
Eicosapentaenoic acid
(EPA) 20:5 3, 6, 9, 12, 15
Nutritional supplements
Aquaculture
Docosahexaenoic acid
(DHA) 22:6 3, 6, 9, 12, 15, 18
Infant formulas
Nutritional supplements
Aquaculture
Pigments
Pigments from microalgae have their most important use as natural food colorant, as
additive for animal feed and in cosmetic and nutraceutical industries (Campo et al., 2007).
Natural colorant has increasing demand in the last decades due to the raising attention of
the consumers towards natural and healthy food additives. In particular, chlorophyll, due
to its strong green colour, is used as natural in specific food formulation. Green algae
cultured under optimum condition were reported to contain about 4% dry weight of
chlorophyll (Harun et al., 2010). Yellow, orange, and red carotenoids are also used in
food products, but especially in cosmetics (Campo et al., 2007).
The hydrocarbon carotenoids are named carotenes, whereas oxygenated derivatives
are known as xanthophylls. All xanthophylls synthesized by higher plants (e.g.,
violaxanthin, zeaxanthin, neoxanthin and lutein), can also be synthesized by green
microalgae. However, these have additional xanthophylls, (e.g., astaxanthin and
canthaxanthin). In xanthophylls, oxygen can be present as OH groups (as in lutein), as
oxi-groups (as in canthaxanthin), or in a combination of both (as in astaxanthin) (Guedes
et al., 2011a; Campo et al., 2007).
Primary carotenoids, such as xanthophylls, are essential for the cells survival since
they are structural and functional components of the photosynthetic apparatus. Secondary
carotenoids, such as carotenes, are those produced at higher level by microalgae, after
exposure to specific environmental stimuli, via carotenogenesis (Guedes et al., 2011a).
A limited number of carotenoids, particularly β-carotene, astaxanthin, lutein,
zeaxanthin, canthaxanthin and lycopene, are used commercially. However, the
Page 33
33
competition with the less expensive synthetic form of the pigments, is still a critical issue
(Spolaore et al., 2006; Mostafa, 2012).
The effects of carotenoids on human health are, in general, associated with their
antioxidant properties and, consequently, with the reduction of cancer risk (Mostafa,
2012). Other pigments, such as β-carotene, has a very important nutritional use due to the
ability to act as provitamin A, so that increase the vitamin A production in the organism.
β-carotene can also be used as a colouring agent with estimated market size of 10 tons to
100 tons per year and selling value of ca.750 €1 per Kg (Mostafa, 2012; Spolaore et al.,
2006).
Lutein is largely consumed as food colorant, reaching sales amount up to 129.000.000
€1 at US (Fernández-Sevilla et al., 2010), and as feed additives in aquaculture. Together
with zeaxanthin, they are the essential component of the pigment present in the macula
lutea in the eye retina and eye lens (Mostafa, 2012). In the eastern world there are a high
percentage of people with ADM (Age-Related Macular Degeneration) disease and the
recommended intake of lutein is 6 mg daily. Hereupon, the most feasible application of
microalgae as lutein producers is for pharmaceutical or nutritional products for
aquaculture (Fernández-Sevilla et al., 2010).
Natural astaxanthin is the most expensive carotenoid, with an average price ca. 2,050
€1 per Kg and its uses mostly concern aquaculture. Currently, this pigment is produced
by H. pluvialis and its concentration can reach 1.5 % to 3 % of the biomass dry weight
(Lorenz & Cysewski, 2000).
2.5.2. Environmental applications
CO2 biofixation
Microalgae have higher photosynthetic efficiency, higher O2 production rates and 10
times greater CO2 fixation efficiency than terrestrial plants, whereby they are the most
profitable option for CO2 mitigation (Mostafa, 2012; Borowitzka & Moheimani, 2013).
The increased CO2 fixation can be attributed to the co-localisation of their photosynthetic
apparatus and light capturing pigments within a single cell, allowing rapid energy use for
biomass generation (Bhola, 2013).
1 Conversion factor at 18th June 2018: 1 USD = 0.863668 EUR
Page 34
34
As shown in equation below, during photosynthesis, CO2 is converted from its
oxidized state to the reduced form such as carbohydrates (CH2O)n, by means of the light
energy (Barsanti & Gualtieri, 2014):
nCO2 + nH2O + light (CH2O)n + nO2
CO2 mitigation strategies globally implemented can be divided in physical and
biological techniques. However, only the biological fixation appears to be an economical
and environmentally sustainable technology. Microalgae are recognized as leading
biological techniques for the capture of CO2 from atmosphere, power plants, industrial
flue gas and from soluble carbonate (Bhola et al., 2013; Rasul et al., 2017).
The levels of CO2 in the atmosphere are generally low (approximately 0.036 %) when
compared to industrial emissions, characterized by higher concentrations (within 3-30
%). Despite CO2 is an effective supplement to stimulate microalgal growth, at high
concentrations (above 5-10 %), microalgal growth can be prevented. This is generally
attributed to the acidification of the culture due to the dissolved CO2. After all, effective
CO2 fixation in microalgae biomass can be reached (1 Kg of dry algal biomass can fix
about 1.83 Kg of CO2), if hyper CO2-tolerant strains are isolated and selected (Brennan
& Owende, 2010; Bhola, 2013).
Biofuel
Biodiesel is a renewable fuel consisting of fatty acid methyl esters (FAME), generally
produced by transesterification of vegetable oils or animal fats in order to achieve
viscosity and flow properties close to that of fossil fuels (Figure 4) (Harun et al. 2010;
Hoekman et al., 2012).
Figure 4 -Transesterification reaction for biodiesel production (Adapted from Hoekman et al., 2012).
Conventional feedstocks for biodiesel production include rapeseed oil, sugarcane,
soybean, sunflower, palm, and peanut oils, called the first generation of biofuels (Pinzi et
al., 2013). However, due to their impact on global food markets and on food security,
mainly because of the use of arable lands, the production of biodiesel instead of food and
CH2-OOC-R1 R1-COO-R’
CH-OOC-R2 + 3R’OH R2-COO-R’ +
CH4-OOC-R3 R3-COO-R’
CH2-OH
CH-OH
CH2-OH
Catalyst
TAG Alcohol Alkyl-ester Glycerol
(Biodiesel)
Page 35
35
the associated increasing on food prices, questions were raised about their potential to
replace fossil fuels (Brennan & Owende, 2010).
Thereby, has emerged the necessity to overcome this improper situation, and the
second generation of biofuels has arisen. They were intended to produce fuels from
agricultural residues and wood processing waste, although, the technology for conversion
cellulosic materials was not well developed and expensive.
At the moment, have been exploited the third generation of biofuels, through
microalgae, which can grow in wastewaters, do not competing for arable land and
minimising associated environmental impacts and yet have higher yields (Brennan &
Owende, 2010; Pinzi et al., 2013; ENMC, 2018).
The fatty acid profile of biodiesel is dependent on the parent oil and the most common
fatty esters are derived from palmitic (C16:0) acid, stearic (C18:0) acid, oleic (C18:1)
acid, linoleic (C18:2) acid and linolenic (C18:3) acid (Pinzi et al., 2013).
Microalgae rich in lipid and carbohydrate are considered as potential sources for
renewable energy production, but it’s fundamentally important to select the highly
productive, oil-rich algal strains to achieve a cost-effective biofuel, otherwise its use it is
not viable (Harun et al., 2010; Mutanda et al., 2010; Hannon et al., 2014; Rasul et al.,
2017).
In conclusion, microalgae have been widely recognized as a cornerstone for the
bioeconomy and biorefinery development. In Europe, macro and microalgae were
recognized by SET-PLAN (Strategic Energy Technological Plan) as a key value chain
for advanced biomaterials production. Portugal, as a coastal country, has excellent
edaphoclimatic conditions and a great potential for microalgae culturing in a sustainable
way. Hereupon, the partnership with fisheries and aquacultures could contribute to the
development of the coastal communities as well as rural areas, for natural and sustainable
feed and food production (Gouveia et al., 2015).
Page 36
36
3. Materials and Methods
3.1. Microalgae strain and culture medium
All the culture experiments described in the present work were performed in the
facilities of CMP/ALGAFARM (Secil Group, Portugal), between the 05th of January and
the 25th of May 2018. The biochemical characterization of the produced biomass was
performed at the MarBiotech group of the Centre of Marine Sciences (University of
Algarve) between the 21st and 30th of May 2017.
The microalgal strain used in this work, Chlorococcum sp., was obtained from
ALGAFARM culture collection and it was previously isolated as a contaminant of a
Chlorella vulgaris culture.
The culture medium was Guillard’s F/2 medium, adjusted to the local water
composition and further supplemented with iron (25 µM) (Watanabe, 2005).
3.2. Scale-up of the cultures for industrial production
The culture system used in this study are reported in the Figure 5, in the order of size:
A) 5 L air-lift; B) 125 L Green Wall Panel; C) 2500 L Photobioreactor; D, E) 10000 L
Photobioreactor.
Figure 5 - Pictures from ALGAFARM unit: laboratory air-lifts 5 L (A); GWP 125 L (B); PBR 2500L (C); PBR 10000L
(D and E).
A B
C D E
Page 37
37
Microalgae cultures were grown at 5 L laboratory air-lift reactors. In these reactors,
compressed air was continuously injected by means of 0.2 μm filters in order to sterilize
it. The CO2 was manually injected to maintain pH values between 7.5 and 8. These
reactors were placed under continuous light irradiance (24/24 h) of 6410 lux and at
temperature of 24 ºC.
Two 5 L reactors were used as the pre-inoculum for the outdoor 125 L Green Wall
Panel (GWP). Then, the latter was used as inoculum for the 250 L GWP. The aeration
system of the GWP was analogous to the 5 L air-lift and the sterilization of the air inlet
was carried out with 0.2 μm filters as well. The temperature of the GWP was maintained
below 28 ºC by a sprinkler-like irrigation system. The pH values were maintained
between 7.5 and 8 by the manually controlling the pulses of CO2.
Two 250 L GWP were used to inoculate a 2500 L tubular PBR and about 80 % of this
PBR was used as an inoculum to start a 10000 L PBR. The tubular PBRs were kept under
the same aforementioned conditions except for the pH assessment. The pH was controlled
by automated system where the pH was measured in real time and activated the CO2
injection to keep the pH between 7.5 and 8 (for the 2500 L PBR) and between 6 and 6.5
(for the 10000 L PBR). The choice of lower pH in the larger scale PBRs was aimed to
prevent virus contaminations.
The experiments in the laboratory air-lifts and the GWP were performed in triplicate
at the same time. The PBR triplicates were performed one after the other.
3.3. Growth assessment
Microalgal growth was measured by the dry weight of biomass (DW). In brief, a
known volume of culture was filtered by dried glass microfiber filters (0.7 μm, VWR).
Than dried and weighted using Kern DBS moisture analyzer. The DW of the biomass is the
difference between the weight of the filter, after culture filtration, and the weight of the filter.
The biomass concentration (X) was calculated as ratio between the weight of the biomass and
the volume of sample filtered.
The volumetric biomass productivity (P) was calculated as the ratio between cell
concentration at two different culture time (X1 and X2, g.L-1) and the corresponding time
range (t1 and t2, day) as shown in equation 1:
𝑃 (𝑔. 𝐿−1. 𝑑𝑎𝑦−1) =𝑋2−𝑋1
𝑡2−𝑡1 (1)
Page 38
38
The areal biomass productivity (Pa) was calculated as the product of the volumetric
biomass productivity (P, g.L-1day-1) and the volume of the PBR (V, L) divided by the
irradiated area of PBR (A, m2) as shown in equation 2:
𝑃𝑎(𝑔. 𝑚−2. 𝑑𝑎𝑦−1) = 𝑃 × 𝑉. 𝐴 (2)
The specific growth rate of culture (μ, day-1) was determined according to the
equation 3:
µ (𝑑𝑎𝑦−1) =ln (𝑁2 𝑁1)⁄
𝑡2−𝑡1 (3)
Where, X2 and X1 refers to biomass concentration (g.L-1) at the times t2 and t1 (days).
The photosynthetic efficiency was determined as the ratio between the higher heating
value (HHV) and the sun irradiation that reached the reactor. The outside temperature and
solar radiation were measured using a meteorological station (RM Young) and an Apogee
Logan UT SP-110 pyranometer. The HHV was calculated according to a previous
correlation reported by Callejón-Ferre et al. (2011), shown in equation 4:
𝐻𝐻𝑉 (𝑘𝐽. 𝑔−1) = −3.393 + 0.507. 𝐶 − 0.341. 𝐻 + 0.067. 𝑁 (4)
Where, C is the percentage of carbon, H the percentage of hydrogen and N the
percentage of nitrogen.
3.4. Biochemical composition
Elemental Analysis (CHN)
Elemental analysis of C, H and N was performed by Vario el III (Vario EL, Elementar
Analyser System, GmbH, Hanau, Germany). Lyophilized biomass (5-10 mg) was weighed
in specific aluminium caps, according to the procedure provided by the manufacturer.
Total protein was estimated by multiplying the N content for the standard conversion
factor 6.25 (Nunez & Quigg, 2015). The analysis was made in duplicates.
Page 39
39
Ash Content
Total ash was determined by the weight difference before and after combustion of the
biomass. In brief, biomass was weighed and placed in small ceramic cups and treated for
8 h at 550 °C using a furnace (J. P. Selecta, Sel horn R9-L). Figure 6 A, C and C show
the steps of the procedure explained. The experiment was performed in two replicates.
Figure 6 - A: Ceramic cup with biomass; B: Furnace with the samples inside; C: Ceramic cups with resulting ashes.
Total Lipids determination
Total lipid content was determined following the Bligh & Dyer method (1959) with
some modifications by Pereira et al. (2011). Lyophilized biomass was weighed in glass
tubes, and 1 mL of chloroform, 2 mL of methanol and 0.8 mL of distilled water (1:2:0.8,
v:v:v) were added. The sample was homogenized with an IKA Ultra-Turrax disperser
(IKA-Werke GmbH, Staufen, Germany) on ice for 60 s.
Thereafter, 1 mL of chloroform was added and the mixture was again homogenized
for 30 s. Finally, 1 mL of distilled water was added and homogenized for 30 s.
Afterwards, the mixture was centrifuged at 2000 g for 10 min to allow the phase
separation. The organic phase (lower layer) was transferred into a clean tube with a
Pasteur pipette (Figure 7 A). Then 0.7 mL of the organic phase were pipetted to a pre-
weighed tube and dried at 60 °C to evaporate the chloroform (Figure 7 B). The final
weight of the tube was measured by the precision balance (Figure 7 C).
The difference between the final weight of the tubes with dried samples and the initial
one, represent the mass of lipids extracted. This assay was performed in duplicate.
A B C
Page 40
40
Figure 7- A: Separation of lipids with Pasteur pipette; B: Dry bath at 60 ºC; C: Final weight of tubes in the precision
balance.
Carbohydrates content
Carbohydrates content was determined as the difference between the total weight of
the biomass and the other macromolecules and ash measured.
Fatty acids profile
Fatty acids were converted into the corresponding fatty acid methyl esters (FAME)
according Lepage & Roy (1984) protocol, modified by Pereira et al. (2011). The FAME
were than analysed by gas chromatography coupled with mass spectrometry analyzer.
The samples were weighted (20-40 mg DW) into the derivatization vessels and 1.5
mL of a solution containing methanol and acetyl chloride (20:1 v/v) were added. The
mixture was homogenized on ice with an Ultra Turrax (12000 rpm) for 90 s. After, 1 mL
of hexane was added and the mixture was heated for 1 hour at 70 ºC. 1 mL of water was
added and the samples were centrifuged at 3260 rpm (Thermo Scientific Heraeus
Megafuge 16R) for 5 min. The organic phase was transferred to another vessel, filtered
(0.22 µm), dried with anhydrous sodium sulphate, resuspended in 500 µL gas
chromatography-grade hexane (Figure 8 A) and placed into the appropriate vials for GC.
FAME were analysed in a GC-MS analyzer (Bruker SCION 456/GC, SCION TQ MS)
(Figure 8 B) equipped with a ZB-5MS column (length of 30 m, 0.25 mm of internal
diameter, 0.25 μm of film thickens, by Phenomenex), using helium as carrier gas. The
temperature program was 60 ºC for 1 min, increase of 30 ºC per min up to 120 ºC, increase
of 5ºC per min up to 250 ºC, and final increase of 20 ºC per min up to 300ºC. The
temperature in the injector was 300 ºC. For the identification and the quantification of
FAME five different concentration of the standards Supelco® 37 component FAME Mix
A B C
Page 41
41
(Sigma-Aldrich, Sintra, Portugal) were analysed in order to establish 37 different
calibration curves for each of the standard. The analysis were performed in duplicates.
Figure 8 -A: Resuspension of dried sample with hexane; B: Injection of a vial sample at the GC-MS analyzer.
Pigments Content
For the pigments extraction, 10 mg biomass were weighed in a glass tube and 1.5 mL
of glass beads and added 6 mL of 100 % acetone were added and homogenized by vortex
(Velp Scientifica Classic Advanced) for 10 min. Then, the sample was centrifuged
(HERMLE Z300) at 3500 rpm for 10 min. These steps were repeated until the pellet lost
all the colour.
The extracted pigment, recovered in the supernatant, was analyzed by Genesys 10S
UV-VIS spectrophotometer in scanning spectrum (from 380 nm until 700 nm) and the
data were analyzed by a specific intern data processing software from ALGAFARM unit.
For the characterization of total carotenoids by HPLC, the extract was completely
dried under nitrogen flow, resuspended in HPLC grade methanol and filtered (0.22 µm)
into brown HPCL vial. The separation and chromatographic analysis of pigments were
performed by Merck Hitachi LaCrom Elite HPLC (Darmstadt, Germany) equipped with
a diode-array detector, as described by Young et al. (1997), using a RP-18 column and a
flow rate of 1 mL.min-1. The mobile phase consisted of ethyl acetate as solvent A and 9:1
(v/v) acetonitrile:water as solvent B. The gradient programme applied was: 0–16 min, 0–
60 % A; 16–30 min, 60 % A; and 30–35 min 100 % A. The injection volume was 100
mL. Pigment detection was carried out at 450 nm.
All the analysis were performed in duplicates.
A B
Page 42
42
3.5. Molecular identification
For the DNA extraction, approximately 20-40 mg of wet biomass were placed into a
1.5 mL Eppendorf tube and the short protocol of the E.Z.N.A.® Plant DNA kit (Omega
Bio-Tek, Norcross, GA) was performed according to the manufacturer’s guidelines. The
obtained DNA was amplified by PCR with the primers 18SUnivFor (5’-
ACCTGGTTGATCCTGCCAGT - 3’) and 18SUnivRev (5’ –
TCAGCCTTGCGACCATAC – 3’).
For the PCR analysis, Mastermix was prepared with the composition in Table 5:
Table 5 - Mastermix composition.
Ingredients µL
MilliQ water 13.3
5x colorless GoTaq Flexi buffer 5
MgCl2 solution (25 mM) 2
Primer 18SUnivF (10 µM) 1
Primer 18SUnivR (10 µM) 1
dNTPs (10 mM) 0.5
GoTaq G2 Flexi DNA polymerase 0.2
Total 23
Thereon, 2 µL DNA were added to 23 µL of Mastermix and the PCR program was
run following the cycle settings showed in Table 6:
Table 6 - PCR Program settings.
Program step Time Temperature Number of cycles
Initial denaturation 5 min 94 °C 1
Denaturation 30 s 95 °C
35 Annealing 30 s 55 °C
Elongation 1 min 72 °C
Final elongation 10 min 72 °C 1
Hold ∞ 10 °C -
The PCR product was separated by agarose gel electrophoresis. The agarose gel (1
%) was prepared in 1x TAE buffer. 5 µL PCR product were added with 1 µL gel red
(1:500 dilution) and 2 µL of green loading dye. The sample was loaded on the gel, as well
Page 43
43
as 6 µL of EZ Vision ladder (marker of molecular weight). The electrophoresis was run
at 90 V for 30 min. Then, the gel was observed under UV to evaluate PCR product length
and their purity.
For the purification step, 20 µL of the PCR product were transferred to 1.5 mL
Eppendorf tube. 10 µL NaAc (3M) and 125 µL EtOH (100 %) were added. The sample
was centrifuged at maximum speed for 15 min and the supernatant was discarded. Then,
125 µL EtOH (70 %) was added to the pellet and again centrifuged at maximum speed
during 15 min.
The resulting pellet was dried at 50 °C, resuspended in 20 µL MQ water and the
concentration of DNA was measured on NanoDrop® ND-1000 (Thermo Scientific)
(Figure 9 A).
For the sequencing analysis, 5 µL of the purified PCR product were mixed with the
primers and analyzed by Applied Biosystems HITACHI 3130xl, Genetic Analyzers (Figure
9 B). The obtained sequence was compared with the GenBank database using BLASTn
(https://blast.ncbi.nlm.nih.gov). The sequences were aligned and visually inspected using
CLC Sequence Viewer (v. 7.6.1, Quiagen) and curated with Gblocks v. 0.91b software
The results are the average of at least two replicates. Phylogenetic analysis was
performed using Maximum-likelihood (ML).
Figure 9- A: NanoDrop®; B: HITACHI 3130xl, Genetic Analyzers.
Statistical Analysis
Analyses of linear regression, t student and multivariable statistic tests were carried out
using the software SPSS 25.0. Levene’s test was used to test for homogeneity of variance
with significance level of 0.05. When three or more conditions were analyzed ANOVA was
performed with the multiple comparison of Tukey-HSD. For the comparison of groups of
independent results, a t-student test was used. A confidence level ≥ 95% was set. For each
test, triplicate mean and standard deviation were determined.
A B
Page 44
44
4. Results and Discussion
4.1. Effect of nitrate concentration on growth and biochemical
composition
Nitrogen (N) is an important constituent of biomass and it is commonly provided in
the form of nitrate (NO3-) or ammonium (NH4
+) to microalgal cultures (Richmond, 2004).
N availability affects the cell growth and biomass composition, including the lipid content
and fatty acid profile (Borowitzka & Moheimani, 2013).
In this study, Chlorococcum sp. was cultivated in laboratory 5 L air-lifts at 1 mM
NO3- and 10 mM NO3
-. The growth lasted 21 days. The microalgal growth, pigments,
proteins and lipids content are reported in the Figure 10 and 11, for the two conditions
respectively.
In agreement with the literature, the availability of N influenced the cell growth and
the biomass composition (Borowitzka & Moheimani, 2013). There is statistical
significance (p<0.05) between the biomass dry weight between the two conditions.
Cultures grown at 10 mM of NO3- (Figure 11) have shown higher biomass concentration
(1 g.L-1). In the first 8 days, the growth curves between the two conditions are comparable
because nitrogen is available in both culture medium. However, the growth of the
microalgae drastically decreases around 10th day for test at 1mM of NO3- (Figure 10). N
was completely consumed and the N-depletion limited the growth.
In the cultures cultivated at 1 mM NO3-, chlorophyll content drastically decreased
during the growth, especially after the N-depletion (p<0.05). The same trend was
registered for total lipid content (p<0.05). Total carotenoids and protein only registered
values, with statistical difference (p<0.05), between exponential and stationary growth
phases. In particular, carotenoids content decreased from 4 to 2 mg.g-1 and the proteins
decreased from 20 % to 10 %, from exponential to stationary growth phase.
In contrast, in cultures cultivated with higher NO3- concentration (10 mM), the
content of total chlorophyll increased with the increase of biomass growth between
latency and exponential phases (p<0.05), while not statistical differences (p≥0.05) were
registered between the exponential and stationary phase. The same results were registered
for protein content. These results are extremely important for industrial cultivation since
it allows to conclude that for chlorophyll and protein production (most demanded
products by ALGFARM clients), there is no need of growing a culture of Chlorococcum
beyond the exponential phase.
Page 45
45
Dry
Weig
ht
(g.L
-1)
0,0
0,1
0,2
0,3
0,4
0,5
0,6
Pig
men
ts (
mg
.g-1
)
0
2
4
6
8
10
12
14
16
18
Time (days)
0 5 10 15 20
Ma
cro
mo
lecu
les
(%)
0
20
40
60
80
Figure 10 - Curve growth (■) of Chlorococcum cultivated at 1 mM of NO3- and evolution of total chlorophyll (▲),
total carotenoids (∆) , protein (●) and lipid (○) content during the growth.
Page 46
46
Dry
We
igh
t (g
.L-1
)
0,0
0,2
0,4
0,6
0,8
1,0
1,2
Pig
me
nts
(m
g.g
-1)
0
5
10
15
20
25
30
35
Time (days)
0 5 10 15 20
Macro
mo
lecu
les (
%)
0
10
20
30
40
50
Figure 11 - Curve growth (■) of Chlorococcum cultivated at 10 mM of NO3- and evolution of total chlorophyll (▲),
total carotenoids (∆) , protein (●) and lipid (○) content during the growth.
Page 47
47
Total carotenoid content increase along the growth phases with statistical differences
(p<0.05), reaching a maximum in the stationary phase (Figure 11). The total lipids only
shown an increasing value (p<0.05) between the exponential and stationary phase, due to
the beginning of nitrogen depletion which stimulate the storage of energy in the form of
lipids.
The two growth conditions were also compared in terms of the specific growth rates
and the biomass productivity (maximum and global). The values are shown in Table 7:
Table 7- Values of productivities and specific growth rate of 5 L laboratorial air-lifts at 10 mM and 1 mM of NO3-
cultivation.
Available
N (mM)
Maximum volumetric
productivity
(g.L-1.day-1)
Global volumetric
productivity
(g.L-1.day-1)
Specific growth
rate
(day-1)
10 0.078 ± 0.011 0.039 ± 0.004 0.152 ± 0.092
1 0.050 ± 0.017 0.016 ± 0.006 0.133 ± 0.070
Only for the global volumetric productivity were registered values with statistical
significant differences (p<0.05) between the two conditions. However, the cultures
cultivated with 10 mM NO3- showed best performance regarding the growth rate and the
productivities, as expected (Borowitzka & Moheimani, 2013; Rasul et al., 2017). As said
before, the effect of the growth stages and the nitrogen depletion, on the growth and
biomolecules accumulation, was already reported in the literature. Anyway, the present
study is focused on a new isolated Chlorococcum specie and the physiological response
to the environmental conditions needed to be confirmed before to start the real scale-up
test.
4.2. Chlorococcum sp. growth on large-scale photobioreactors
The culture of Chlorococcum sp. was implemented from the laboratory scale to the
large scale in outdoor conditions. The 5 L air-lifts of cultures gown at 10 mM of NO3-
were used as inoculum for the 125 L GWP reactors, then scaled up to 250 L GWP
reactors, after to the 2500L PBR. The final step reached the industrial scale 10000L PBR.
The growth curves of Chlorococcum sp., in the different culture system mentioned, are
shown in Figure 12:
Page 48
48
Time (days)
0 5 10 15 20
Dry
Weig
ht
(g.L
-1)
0,0
0,5
1,0
1,5
2,0
2,5
Figure 12 - Growth curves of scale-up: reactors 125 L GWP (●), 250 L GWP (○), pilot 2500 L PBR (▼) and industrial
10000 L PBR (∆).
The experiments were carried out at different time periods, under different
temperatures and light irradiance conditions. The 125 L GWP triplicates were cultivated
during the winter, between January and February. The average of temperature was about
13.9 °C and of light irradiance was around 173 W.m-2. These were the worst growth
conditions registered and might explain the lowest biomass concentration among the
reactors. However, the 250 L GWP triplicates grown under similar conditions (13.6 °C
and 190 W.m-2) and the biomass concentration among the growth was higher, although
with no statistical significant difference (p≥0.05).
The 2500 L PBR triplicates grown one after the other, from March to May. The
average of temperature was 17.7 °C and of light irradiance was about 225 W.m-2. These
results might explain the highest biomass concentration since the reactor grown under
best climacteric conditions. Although, without statistical significant difference (p≥0.05)
from 250 L GWP.
The first triplicate of industrial 10000 L PBR grown during May and the other two,
at the same time, from May to June. This reactor were cultivated under the highest light
irradiance (about 260 W.m-2) and average of temperature 15.5 °C. Despite the good
climacteric conditions, it registered biomass concentration values lower than the pilot
reactor until day 10, without statistical significant difference (p≥0.05). It was not possible
to compare beyond 10 days of growth since this last experiment was carried out at the
Page 49
49
production unit instead of the investigation unit, and the reactors can only be used at the
times that are not being cultivated with cultures to commercialize. However, it was
expected lower biomass concentration in comparison with the pilot 2500 L reactor since
it is known from the company that the industrial reactors always use less light irradiation
due to their height, which shade the lower tubes.
Additionally, the biomass productivities, specific growth rates and photosynthetic
efficiency were calculated and the final values are shown in Table 8:
Table 8 - Values of volumetric and areal productivities of scale-up and industrial reactors.
Reactor
Volumetric Productivity
(g.L-1.day-1) Areal Productivity
(g.m-2.day-1)
Maximum Global Maximum Global
GWP 125 L 0.133 ± 0.029 0.040 ± 0.006 6.238 ± 0.675 3.175 ± 0.479
GWP 250 L 0.217 ± 0.018 0.070 ± 0.006 18.417 ± 1.503 5.937 ± 0.500
PBR 2500 L 0.153 ± 0.020 0.098 ± 0.007 16.250 ± 1.768 9.762 ± 0.673
PBR 10000 L 0.113 ± 0.005 0.054 ± 0.008 36.559 ± 1.521 17.419 ± 2.737
The higher overall volumetric productivity was obtained in the 2500 L PBR (p<0.05)
despite the maximum volumetric productivity was reached by 250 L GWP (p<0.05).
However, when the areal productivity was analyzed, the most productive reactor was
industrial 10000 L PBR (which registered the lowest volumetric productivity). The 10000
L PBR reached a maximum value of 36.559 g.m-2.day-1 with statistically differences from
the other reactors (p<0.05). These results are explained due to the geometry of reactors.
Despite of industrial PBR uses less amount of the light irradiance that receives, as
explained before, it affects negatively the volumetric productivity (which means that exist
less biomass per litter), but because it is a greatly bigger reactor, the amount of biomass
which is produced per area is also quite higher than within a pilot scale reactor. So, after
all, it is better to grow microalgae at the industrial PBR due the highest amount of biomass
collected at the end of the cultivation.
The specific growth rates and the photosynthetic efficiencies of Chlorococcum within
the different reactors were calculated and the results are shown in Table 9:
Page 50
50
Table 9 - Values of specific growth rats and photosynthetic efficiency on scale-up and industrial reactors.
Reactor Specific growth rate
(day-1)
Photosynthetic efficiency
(%)
GWP 125 L 0.143 ± 0.007 0.406 ± 0.021
GWP 250 L 0.159 ± 0.003 0.735 ± 0.024
PBR 2500 L 0.126 ± 0.043 1.337 ± 0.127
PBR 10000 L 0.132 ± 0.048 1.399 ± 0.766
The growth of the cultures was faster in the 250 L GWP with specific growth rate of
0.159 day-1, without statistic significant differences (p≥0.05). Despite registered the faster
growth, the 250 L GWP shown low values of photosynthetic efficiency. This paradox has
two main reasons: the first one, is the low light irradiance available during the cultivation
period and the second one is the fact that the Green Wall Panel easily allows the fixation
of biomass on the wall due to the worse aeration system, which gives less agitation,
decreasing the absorbance of light.
The photosynthetic efficiency was higher in the 10000 L PBR, reaching values of
1.399 % with statistical significant differences from the 125 L and 250 L GWP reactors
(p<0.05). This value was due to the good climacteric condition and sunlight exposure of
the industrial PBR. There was no statistical significant difference in respect to the 2500
L PBR (p≥0.05). It could be expected more photosynthetic efficiency from industrial
scale 10000 L PBR since the photic area is substantially higher. However, the values are
similar to the pilot scale 2500 L PBR because all the tubes in this last one are exposed to
the sunlight irradiation and in the industrial PBR the light cannot reach the lowest tubes.
4.3. Biochemical composition of biomass grown in PBR
The biochemical composition of the biomass, harvested from the pilot scale 2500 L
PBR and the industrial 10000 L PBR, were characterized and the results are shown in the
Table 10:
Table 10 - Values of protein, total lipids, carbohydrates and ashes from 2500 L PBR and 10000 L PBR.
Reactor
Protein %
Total Lipids %
Carbohydrates %
Ashes %
PBR 2500 L 55.72 ± 2.846 18.35 ± 0.475 17.71 ± 3.730 7.61 ± 2.475
PBR 10000 L 46.71 ± 4.988 31.64 ± 4.640 5.76 ± 3.775 13.44 ± 0.346
Page 51
51
Scientific studies reported that microalgae can reach 70 % of protein, 20% of lipid
and 30 % of carbohydrates (Guedes & Malcata, 2012). In particular, for Chlorococcum
sp. the content of lipids can reach values higher than 20 % (Prabakaran et al., 2018).
The results of this study showed that proteins are the main component of
Chlorococcum cells in both pilot and industrial scale PBR. The 2500 L PBR reached the
highest protein content of 55,72 %. These results are comparable to that obtained in
ALGAFARM for Chlorella vulgaris (55 % of protein) (Algae by Allma, 2018). The
production of Chlorella and its protein content was optimized by the time, then it could
be possible to increase the proteins content of Chlorococcum by medium adjustment or
optimization of the growth conditions. The increase of the proteins content is a very
important issue for companies involved in food and feed production, and Chlorococcum
showed high potential in this context.
The lower value of protein measured for the 10000 L PBR was probably due to the
stress conditions, characterizing that culture. Indeed, lower light irradiance were
measured in that days with resulting lower photosynthetic efficiency (Table 9).
Although an increase on carbohydrates were expected, when proteins decrease (Ejike
et al., 2017), the content of carbohydrates was lower than in 2500 L PBR. On the contrary,
the ashes content, during stress conditions, was reported increase for saline cultures.
Then, more tests and in deep analysis of the metabolic pathways are needed to explain
this behaviour in the industrial cultivation of this Chlorococcum.
The lipids content, in the largest culture, also increased up to 31.64 % with respect to
the 2500 L PBR (18.35 %). The increased lipid content also suggests the existence of
stress conditions.
The analysis of the fatty acid profile of this microalgal strain was carried for the
biomass harvested in the two different PBRs. The fatty acid profile is a relevant factor
influencing the food and feed applications of the whole microalgal biomass. Indeed, lipid
fraction enriched in polyunsaturated fatty acids are characterized by higher market
demand and high market value.
The fatty acids methyl esters (FAME) were analyzed by GC-MS and the results are
shown in the Table 11:
Page 52
52
Table 11 - FAME composition of Chlorococcum sp. on 2500 L PBR and 10000 L PBR.
FAME % of Total FAME
2500 L PBR 10000 L PBR
C14:0 0.76 ± 0.094 2.88 ± 0.872
C16:4 -3 23.65 ± 2.201 21.94 ± 1.872
C16:3 -3 4.15 ± 0.399 2.75 ± 0.467
C16:2 -6 0.73 ± 0.079 0.90 ± 0.043
C16:1 2.59 ± 0.231 2.70 ± 0.587
C16:0 15.24 ± 1.603 18.82 ± 0.505
C18:4 -3 8.61 ± 1.150 19.29 ± 0.727
C18:3 -3 31.40 ± 2.800 27.58 ± 1.183
C18:3 -6 3.22 ± 1.258 3.21 ± 0.693
C18:2 -6 2.94 ± 0.781 3.73 ± 0.529
C18:1 5.34 ± 0.335 6.27 ± 0.759
C18:0 1.37 ± 0.559 2.71 ± 1.058
SFA 17.37 ± 2.415 23.92 ± 3.544
MUFA 7.93 ± 0.042 8.97 ± 1.356
PUFA 74.70 ± 2.456 64.30 ± 5.000
The main fatty acids produced in both reactors were C16:43, C16:0, C18:43 and
C18:33 (Table11). The functional sources of 3 in microalgae are normally
eicosapentanoic acid (EPA, C20) and docosahexaenoic acid (DHA, C22), however
Chlorophytes are, in general, deficient in both C20 and C22 PUFAs. Chlorococcum sp.
(belonging to Chlorophytes) has interesting 3 fatty acids with lower carbon number, but
with still significant applications in human and animal nutrition (Harun et al., 2010;
Guedes & Malcata, 2012).
The ratios of saturated fatty acids (SFAs), monounsaturated fatty acids (MUFAs) and
polyunsaturated fatty acids (PUFAs) are similar between the reactors. Chlorococcum sp.
has demonstrated to be rich in PUFAs, with 74.70 % of total fatty acids in the pilot scale
2500 L PBR.
Fatty esters are derived from palmitic (C16:0) acid, stearic (C18:0) acid, oleic (C18:1)
acid, linoleic (C18:2) acid and linolenic (C18:3) acid (Pinzi et al., 2013). Despite of
Chlorococcum fatty acids profile showed this components, the total lipids content it is not
Page 53
53
high enough to consider this strain, since have been reported lipid contents as high as 85
% in certain microalgal strains (Rawat et al., 2013).
The total chlorophyll and total carotenoids were analyzed by spectrophotometry for
the pilot scale 2500 L PBR and for the industrial scale 10000 L PBR and the results are
shown at Table 12:
Table 12 - Values of total chlorophyll and total carotenoids content by spectrophotometry on 2500 L PBR and 10000
L PBR.
Reactor
Total Chlorophyll mg.g-1 DW
Total Carotenoids mg.g-1 DW
PBR 2 500L 40.24 ± 7.941 10.87 ± 1.241
PBR 10 000L 25.81 ± 0.716 5.95 ± 1.365
For both chlorophyll and carotenoid content, the pilot scale 2500 L PBR reached the
highest contents. Chlorophyll is one of the crucial factors indicative of healthy conditions
of the culture.
Chlorophyll content of c.a. 4 % of dry weight is a great result for green algae (Harun
et al., 2010). In comparison, this Chlorococcum strain is able to easily achieve higher
values of total chlorophyll than the optimized Chlorella vulgaris produced at
ALGAFARM unit, which reach values of c.a. 2-3 % (Allmicroalgae, 2018).
With growth optimization, it could be possible reaching higher values of this pigment
in Chlorococcum strain.
Also the total carotenoids value, of more than 1 % of DW, is higher than the current
optimized produced Chlorella vulgaris, which cannot reach 1 % of DW (Allmicroalgae,
2018).
The reduced pigment content in industrial scale 10000 L PBR is probably due to the
stress conditions or the change in the pH value (Liu & Lee, 2000) from the pilot reactor
(7.5 - 8) to the industrial reactor (6 - 6.5).
To analyse the composition of total carotenoids, HPLC was performed and the results
are shown in the Table 13:
Page 54
54
Table 13 - Values of carotenoid composition by HPLC on 2500 L PBR and 10000 L PBR.
In both pilot and industrial scale reactors, lutein is the main component of total
carotenoids, reaching values of more than 70 % of the total carotenoids. In the 2500L
PBR, lutein reach 5.374 mg.g-1, which is similar to the values of several microalgae that
have been reported as lutein producers such as Scenedesmus almeriensis and Muriellopsis
sp. (Chlorophyta). These strains achieve lutein content of 4 to 6 mg.g-1 in large-scale
outdoor cultivation (Fernández-Sevilla et al., 2010).
Since lutein is used as food dyes and as feed additives in aquaculture (Mostafa, 2012),
Chlorococcum might be a good source for these applications. Also, it could be used for
pharmaceutical and nutraceutical needs as treatment for people with AMD disease
(Fernández-Sevilla et al., 2010).
β-carotene is the second most abundant carotenoid in both tests and it is very
important due to its ability to act as provitamin A (Mostafa, 2012). However,
Chlorococcum has a low β-carotene content if compared to the main producer Dunaliella
salina (11-21 mg.g-1) (Tinoco et al., 2015).
Astaxanthin was not found as component if the carotenoids despite some species of
Chlorococcum have the capacity to produce this pigment (Yuan et al., 2002). However,
in the present work, Chlorococcum was cultivated under proximate optimal conditions
and the production of astaxanthin was not induced.
Carotenoids
PBR 2 500L PBR 10 000L
mg.g-1 % Total
carotenoids mg.g-1
% Total
carotenoids
Neoxanthin 0.63 ± 0.187 8.11 ± 1.303 0.14 ± 0.005 4.02 ± 0.004
Violaxanthin 0.33 ± 0.074 4.32 ± 0.338 0.13 ± 0.008 3.87 ± 0.104
Lutein 5.37 ± 0.780 71.01 ± 1.255 2.49 ± 0.086 73.27 ± 0.216
β-carotene 1.25 ± 0.138 16.57 ± 1.262 0.64 ± 0.028 18.84 ± 0.116
Page 55
55
4.4. Molecular identification of Chlorococcum sp.
A molecular analysis was performed to identify the specie of Chlorococcum used in
the present work. The strain was identified as Chlorococcum 0030CN (ALGAFARM
collection identification).
In order to help on this specie identification, the knowledge and experience of
Professor Fátima Santos (foundress of seaweed collection of University of Coimbra) in
microalgae taxonomy were required. The results of her analysis suggested similarity with
Chlorococcum minutum.
The results of the molecular analysis were organized in the diagram reported in the
Figure 13. It is possible to confirm that there is an identity of 100% with Chlorococcum
sp. but no homology is shown between the presented specie and the reported species. It
is possible to observe that this strain has similarities with C. aquaticum and C. minutum,
however, it is separated from them with branch value of 0.89.
This result does not exclude that the adopted strain could be a new specie, not yet
identified. Another possibility is that the 18S rRNA gene is not sufficient to distinguish
between Chlorococcum species. Further genes or ITS (internal transcribed spacer) must
be tested in order to obtain more specific information about this strain (Bhola et al., 2013;
Bellinger & Sigee, 2015).
Morphology characters are also important to distinguish between Chlorococcum sp.
and further analysis should be carried out, such as the shapes of vegetative cells, the
thickness of the cell walls in old cultures, the size of cells in old cultures, and the stigma
morphology of zoospores (Kawasaki et al., 2015).
In addition, until now, Chlorococcum were classified mainly based on the
morphology. Complete molecular analysis of the existing species could also notice that
this strain belong to a specie which was misclassified (Kawasaki et al., 2015).
Page 56
56
Figure 13 –Diagram obtained from molecular analysis of the isolated strain of Chlorococcum (0030CN) with
Maximum-likelihood (ML).
Spongio
coccu
m tetra
sporu
m K
M02
0135
Chlo
roco
ccum
min
utu
m G
Q12
2365
Ra
dio
spha
era n
egeven
sis KM
02
013
4
Chara
cium
acu
min
atu
m K
R6
07
49
2
Fascicu
loch
loris b
old
ii KM
0201
22
Fascicu
loch
loris b
old
ii KY
08
647
8
Ch
loro
coccu
m citrifo
rme K
M020100.1
Ch
loro
coccu
m o
leofa
ciens U
41176
Ch
loro
coccu
m o
leofa
ciens K
R607491
Ch
loro
coccu
m sp
haco
sum
KM
020102
Ch
loro
coccu
m sp
haco
sum
JN968580
Ch
loro
coccu
m m
icrostig
matu
m A
B983616
Ch
loro
coccu
m p
erfora
ta K
R607484
Ch
loro
coccu
m ro
bustu
m A
Y122332
Ch
loro
coccu
m ru
gosu
m A
B983621
Ch
loro
coccu
m m
inutu
m JN
968585
Ch
loro
coccu
m m
inutu
m K
M020099
Ch
loro
coccu
m m
inutu
m K
R607490
Ch
loro
coccu
m a
qu
aticu
m A
B983622
Ch
loro
coccu
m a
qu
aticu
m K
T961379
Ch
loro
coccu
m sp
. 003
0C
N
Ch
loro
coccu
m ellip
soid
eum
U70586
Ch
loro
coccu
m ellip
soid
eum
KC
794692
Ch
loro
coccu
m n
ivale A
B983623
0.0
5
0.9
5
0.8
9
0.9
9
0.8
7 0.9
8
0.7
5
1
1
1
0.7
6
0.8
9
0.9
6
1
0.6
7
1
0.8
8
0.8
2
Page 57
57
Conclusions
The Chlorococcum strain isolated in the ALGAFARM unit showed a great
potential for feed and food applications, since it has plenty of protein and it also contain
relevant amount of PUFAs. Chlorophyll and lutein content also find very interesting
applications as natural food colorant, in nutraceutical and pharmaceutical industries.
Then, Chlorococcum sp. biomass could be a promising environmental friendly alternative
to the current consumer products.
The use of medium with 10 mM of nitrate was demonstrated to be more suitable
for high biomass concentration and improved biochemical composition for food and feed
applications (rich in protein, chlorophyll and total carotenoids). The industrial 10000 L
PBR was less productive in terms of volumetric biomass productivity, although it reached
highest areal productivity. The biochemical composition of Chlorococcum sp. was, in
general, better in the pilot 2500 L PBR then in the larger PBR. Then, additional tests are
needed for optimizing the growth and the biochemical composition of Chlorococcum in
large scale culture system.
Interesting future perspectives about Chlorococcum sp. also regards astaxanthin
production. Astaxanthin is synthesized from carotene by a pathway which differ from
other astaxanthin-producing microorganisms. Then, further studies are needed to assess
the potential of Chlorococcum sp. To accumulate astaxanthin and the optimization of the
induction step should be carried out.
Moreover, the environmental application of Chlorococcum species as regard the
CO2 fixation is also a key issue for ALGAFARM company and there are literature data
that refers some Chlorococcum species as good candidate for CO2 fixation.
Finally, cost-effective cultivation of the autochthone Chlorococcum sp. could be
reached by using open ponds culture system, which ALGAFARM is currently investing.
This strain would be suitable for open culture because of its robustness and autochthone
origins.
In addition, analyses of settling velocity suggest advantages in using
Chlorococcum sp. since it has relatively big cells that would naturally precipitate when
the agitation is stopped. In that way, harvesting costs could be reduced.
A polyphasic approach, including molecular phylogenetic, molecular structure
and morphological comparison could allow an effective identification of Chlorococcum
specie.
Page 58
58
References
Algae by Allma. (25/05/2018). Obtained from Allmicroalgae: www.algaebyallma.com
Allmicroalgae - Natural Products. (24/05/2018). Obtained from Allmocrialgae:
www.allmicroalgae.com
Altieri, M. A., & Nicholls, C. I. (2013). The adaptation and mitigation potential of
traditional. Climatic Change, 140, 33-45.
Barsanti, L., & Gualtieri, P. (2014). ALGAE ANATOMY, BIOCHEMISTRY, AND
BIOTECHNOLOGY. Pisa, Italy: CRC Press.
Becker, E. W. (2007). Micro-algae as a source of protein. Biotechnology Advances, 25,
207-210.
Bellinger, E. G., & Sigee, D. C. (2015). Freshwater Algae. Identification, Enumeration
and Use as Bioindicators. United Kingdom: WILEY Blackwell.
Bhola, V., Swalaha, F., Ranjith Kumar, R., Singh, M., & Bux, F. (2013). Overview of the
potential of microalgae for CO2 sequestration. International Journal of
Environmental Science and Technology, 11, 2103-2118.
Bold, H. C., & Parker, B. C. (1962). Some Supplementary Attributes in the Classification.
Archiv für Mikrobiologie, 42, 267-288.
Borowitzka, M., & Moheimani, N. (2013). Sustainable biofuels from algae. Mitig Adapt
Strateg Glob Change, 18, 13–25.
Brennan, L., Owende, & Philip. (2010). Biofuels from microalgae—A review of
technologies for production, processing, and extractions of biofuels and co-
products. Renewable and Sustainable Energy Reviews, 14, 557-577.
Callejón-Ferre, A.; Velázquez-Martiní B.M Lopez-Martínez J. A.; Manzano-Agugliaro
F. (2011). Greenhouse crop residues: Energy potential and models for the
prediction of their higher heating value. Renewable and Sustainable Energy
Reviews,, 15, 948-955.
Campo, J. A., García-González, M., & Guerrero, M. G. (2007). Outdoor cultivation of
microalgae for carotenoid production: current state and perspectives. Applied
Microbiology and Biotechnology, 74, 1163-1174.
Chew, K. W., Yap, J. Y., Show, P. L., Suan, N. H., Juan, J. C., Ling, T. C., Chang, J.-S.
(2017). Microalgae biorefinery: High value products perspectives. Bioresource
Technology, 229, 53-62.
Page 59
59
Darienko, T., Gustavs, L., Eggert, A., Wolf, W., & Pröschold, T. (2015). Evaluating the
Species Boundaries of Green Microalgae (Coccomyxa, Trebouxiophyceae,
Chlorophyta) Using Integrative Taxonomy and DNA Barcoding with Further
Implications for the Species Identification in Environmental Samples. PLOS -
Public Library of Science.
Ejike, C. E., A.Collins, S., Balasuriya, N., K.Swanson, A., Mason, B., & Udenigwe, C.
C. (2017). Prospects of microalgae proteins in producing peptide-based functional
foods for promoting cardiovascular health. Trends in Food Science & Technology,
59, 30-36.
ENMC. (26/05/2018). Entidade Nacional para o Mercadp de Combustíveis. Obtained
from ENMC: http://www.enmc.pt
FAO, & ITPS. (2015). Status of the World’s Soil Resources (SWSR). Food and
Agriculture Organization of the United Nations (FAO), Intergovernmental
Technical Panel on Soils (ITPS). Rome, Italy: FAO.
Fernández-Sevilla, J. M., Fernández, F. G., & Grima, E. M. (2010). Biotechnological
production of lutein and its applications. Applied Microbiology and
Biotechnology, 86, 27-40.
Fonseca, D. B., Guerra, L. T., Santos, E. T., Mendonça, S. H., Silva, J. G., Costa, L. A.,
& Navalho, J. C. (2016). ALGAFARM. A Case Study of Industrial Chlorella
Production. Em S. P. Slocombe, & J. R. Benemann, Microalgal Production for
Biomass and High-Value Products (pp. 295-309). CRC Press.
Gouveia, L., Reis, A., Moura, P., Oliveira, C., & Gírio, F. (2015). Microalgae for biofuels:
the Portuguese experience. Watch Letter 32, 10.
Guedes, A. C., & Malcata, F. X. (2012). Nutritional value and uses of microalgae in. Em
D. Z. (Ed), Aquaculture (pp. 59-78). InTech.
Guedes, A. C., Amaro, H. M., & Malcata, F. X. (2011a). Microalgae as Sources of
Carotenoids. Marina Drugs, 9(4), 625-644.
Guedes, A. C., Amaro, H. M., & Malcata, F. X. (2011b). Microalgae As Sources of High
Added-Value Compounds - A Brief Review of Recent Work. Biotechnology
Progress, 597-613.
Guschima, I. A., & Harwood, J. L. (2006). Lipids and lipid metabolism in eukaryotic
algae. Progress in Lipid Research, 45, 160-186.
Hannon, M., Gimpel, J., Tran, M., Rasala, B., & Mayfield, S. (2014). Biofuels from algae:
challenges and potential. Biofuels, 1:5, 763-784.
Page 60
60
Harun, R., Singh, M., Forde, G. M., & Danquah, M. K. (2010). Bioprocess engineering
of microalgae to produce a variety of consumer products. Renewable and
Sustainable Energy Reviews, 14, 1037-1047.
Hoekman, S. K., Broch, A., Robbins, C., Ceniceros, E., & Natarajan, M. (2012). Review
of biodiesel composition, properties, and specifications. Renewable and
Sustainable Energy Reviews, 16, 143-169.
Kawasaki, Y., Nakada, T., & Tomita, M. (2015). Taxonomic Revision of Oil-Producing
Green Algae, Chlorococcum oleofaciens (Volvovales, Chlorophyceae), and its
Relatives. Journal Phycology, 51, 1000-1016.
Khanra, S., Mondal, M., Halder, G., Tiwari, O. N., Gayen, K., & Bhowmick, T. K. (2018).
Downstream processing of microalgae for pigments, protein and carbohydrate in
industrial application: A review. Food and Bioproducts Processing, 110, 60-84.
Lepage, G. & Roy, CC. (1984). Improved recovery of fatty acid through direct
transesterification without prior extraction or purification. Journal of Lipid
Research, 25, 1391-1396.
Liu, B.-H., & Lee, Y.-K. (1999). Composition and biosynthetic pathways of carotenoids
in the astaxanthin-producing green alga Chlorococcum sp. Biotechnology Letters,
21, 1007-1010.
Liu, B.-H., & Lee, Y.-K. (2000). Secondary carotenoids formation by the green alga
Chlorococcum sp. Journal of Applied Phycology, 12, 301-307.
Lorenz, R. T., & Cysewski, G. R. (2000). Commercial potential for Haematococcus
microalgae as a natural source of astaxanthin. Trends in Biotechnology, 18, 160-
167.
Microalgas: benefícios naturais. (23/04/2017). Obtained from Pontos de Vista:
http://pontosdevista.pt/2017/04/23/microalgas-beneficios-naturais/
Mostafa, S. S. (2012). Microalgal Biotechnology: Prospects and Applications. Plant
Science, InTech. 275-314.
Mutanda, T., Ramesh, D., Karthikeyan, S., Kumari, S., Anandraj, A., & Bux, F. (2010).
Bioprospecting for hyper-lipid producing microalgal strains for sustainable
biofuel production. Bioresource Technology, 102, 57-70.
Nunez, M. & Quigg A. (2015). Changes in growth and composition of the marine
microalgae Phaeodactylum tricornutum and Nannochloropsis salina in response
to changing sodium bicarbonate concentrations. Journal of Applied Phycology,
28, 2123-2138.
Page 61
61
Olaizola, M. (2003). Commercial development of microalgal biotechnology: from the test
tube to the marketplace. Biomolecular Engineering, 20, 459-466.
Ota, M., Takenaka, M., Sato, Y., Smith Jr., R. L., & Inomata, H. (2015). Effects of light
intensity and temperature on photoautotrophic growth of a green microalga,
Chlorococcum littorale. Biotechnology Reports, 7, 24-29.
Pereira, H. B. (2011). Microplate-based high throughput screening procedure for the
isolation of lipid-rich marine microalgae. Biotechnology for Biofuels, 4, 61.
Pereira, H., Barreira, L., Figueiredo, F., Custódio, L., Vizetto-Duarte, C., Polo, C.,
Varela, J. (2012). Polyunsaturated fatty acids of marine macroalgae: potential for
nutritional and pharmaceutical applications. Marine drugs, 10, 1920-1935.
Pignolet, O., Jubeau, S., Vaca-Garcia, C., & Michaud, P. (2013). Highly valuable
microalgae: biochemical and topological aspects. Journal of Industrial
Microbiology and Biotechnology, 40, 781-796.
Pinzi, S., Rounce, P., Herreros, J. M., Tsolakis, A., & Dorado, M. P. (2013). The effect
of biodiesel fatty acid composition on combustion and diesel engine exhaust
emissions. Fuel, 104, 170-182.
Pires, J., Alvim-Ferraz, M., Martins, F., & Simões, M. (2012). Carbon dioxide capture
from flue gases using microalgae: Engineering aspects and biorefinery concept.
Renewable and Sustainable Energy Reviews, 3044-3051.
Prabakaran, P., Pradeepa, V., Selvakumar, G., & Ravindran, A. D. (2018). Efficacy of
Enzymatic Transesterification of Chlorococcum sp. Algal Oils for Biodiesel
Production. 1-9.
Rastogi, R. P., Madamwar, D., & Pandey, A. (2017). ALGAL GREEN CHEMISTRY.
Recent Progress in Biotechnology. Elsevier.
Rasul, M. G., Azad, A. K., & Sharma, S. C. (2017). Clean Energy for Sustainable
Development. Comparisons and Contrasts of New Approaches. Queensland,
Australia: Elsevier.
Rawat, I., Kumar, R. R., & Bux, T. F. (2013). Biodiesel from microalgae: A critical
evaluation from laboratory to large scale production. Applied Energy, 103, 444-
467.
Santhoshkumar, K., Prasanthkumar, S., & Ray, J. G. (2016). Chlorococcum humicola
(Nageli) Rabenhorst as a Renewable Source of Bioproducts and Biofuel . Journal
of Plant Studies, 5, 48-57.
Page 62
62
Sasso, S., Pohnert, G., Lohr, M., Mittag, M., & Hertweck, C. (2012). Microalgae in the
postgenomic era: a blooming reservoir for new natural products. FEMS
Microbiology Reviews, 36, 761-785.
SECIL, G. (09/05/2018). SECIL. Obtained from http://www.secil-group.com/
Shankar, M., Chhotaray, P. K., Agrawal, A., Gardas, R. L., Tamilarasan, K., & Rajesh,
M. (2017). Protic ionic liquid-assisted cell disruption and lipid extraction from
fresh water Chlorella and Chlorococcum microalgae. Algal Research, 25, 228-
236.
Silva, J. L., Marques, A., Barros, A., Campos, J., Mendonça, S. H., & Gomes, R. (2017).
ALGAFARM: Cultivo de microalgas à escala industrial. TecnoAlimentar, 12, 56-
58.
Spolaore, P., Joannis-Cassan, C., Duran, E., & Isambert, A. (2006). Commercial
Applications of Microalgae. Journal of Bioscience and Bioengineering, 101, 87-
96.
Tinoco, N. A., Teixeira, C. M., & Rezende, C. M. (2015). O Género Dunaliella:
Biotecnologia e Aplicações. Revista Virtual de Química, 7, 1421-1440.
Watanabe, M. M. (2005). Freshwater Culture Media. Em R. A. Andersen, Algal Culturing
Techniques (p. 507). Elsevier.
Watanabe, S., & Lewis, L. (2017). Phylogenetic interpretation of light and electron
microscopic features of selected members of the phylogroup Moewusinia
(Chlorophyceae), with new generic taxonomy. Phycologia, 56 (3), 329-353.
Young, A. O. (1997). Methods for carotenoid analysis. New York: (Pessarakli, M., editor.
Yuan, J.-P., Chen, F., Liu, X., & Li, X.-Z. (2002). Carotenoid composition in the green
microalga Chlorococcum. Food Chemistry, 76, 319-325.
Zhu, L. (2015). Biorefinery as a promising approach to promote microalgae industry: An
innovative framework. Renewable and Sustainable Energy Reviews, 41, 1376-
7384.