ORIGINAL PAPER Characterization and evaluation of coral reefs around Yap Proper, Federated States of Micronesia Peter Houk • David Benavente • Vanessa Fread Received: 27 July 2011 / Accepted: 26 April 2012 / Published online: 1 June 2012 Ó Springer Science+Business Media B.V. 2012 Abstract This study addresses the coupled themes of science and conservation by characterizing and evaluating the coral reefs around Yap, Federated States of Micronesia. Reef types, and the inherent environmental regimes they constitute, were found to be good predictors of distinct modern assemblages, with minimally overlapping species occur- rences. Corals from inner and channel reefs were twice as large and assemblages were half as diverse compared with outer reefs, while food-fish were both larger and more diverse on outer and channel reefs compared with inner. While distinctions were predictable, the magnitude of ecological change along a gradient of inner, channel, to outer reefs was higher than expected, suggesting that human influences are quantifiable. Therefore, an evaluation process was conducted to determine the spatial trends in reef ‘condition’, defined within by ecological metrics. ‘Condition’ was highest for reefs associated with a priori defined high conservation value for varying reasons: successful fisheries man- agement, critical habitat determination, and high resiliency potential. Regression analyses highlighted that a two-variable model which interactively incorporated proxies to fishing and pollution, as well as a proxy for hydrodynamic flushing potential, explained 40 % of the variance in ‘condition’. Collectively, the results are used to evaluate the current status of reef assemblages, and to point out future conservation priorities. Keywords Yap Á Coral-reef assemblages Á Conservation Á Fish assemblages Á Marine conservation areas Á Status P. Houk (&) Pacific Marine Resources Institute, Saipan, MP 96950, Northern Mariana Islands e-mail: [email protected]D. Benavente Commonwealth of the Northern Mariana Islands Coastal Resources Management Office, Saipan, MP 96950, Northern Mariana Islands V. Fread Yap Community Action Program, Colonia, Yap, FM 96943, Federated States of Micronesia 123 Biodivers Conserv (2012) 21:2045–2059 DOI 10.1007/s10531-012-0296-0
Transcript
ORI GIN AL PA PER
Characterization and evaluation of coral reefs aroundYap Proper, Federated States of Micronesia
Peter Houk • David Benavente • Vanessa Fread
Received: 27 July 2011 / Accepted: 26 April 2012 / Published online: 1 June 2012� Springer Science+Business Media B.V. 2012
Abstract This study addresses the coupled themes of science and conservation by
characterizing and evaluating the coral reefs around Yap, Federated States of Micronesia.
Reef types, and the inherent environmental regimes they constitute, were found to be good
predictors of distinct modern assemblages, with minimally overlapping species occur-
rences. Corals from inner and channel reefs were twice as large and assemblages were half
as diverse compared with outer reefs, while food-fish were both larger and more diverse on
outer and channel reefs compared with inner. While distinctions were predictable, the
magnitude of ecological change along a gradient of inner, channel, to outer reefs was
higher than expected, suggesting that human influences are quantifiable. Therefore, an
evaluation process was conducted to determine the spatial trends in reef ‘condition’,
defined within by ecological metrics. ‘Condition’ was highest for reefs associated with
a priori defined high conservation value for varying reasons: successful fisheries man-
agement, critical habitat determination, and high resiliency potential. Regression analyses
highlighted that a two-variable model which interactively incorporated proxies to fishing
and pollution, as well as a proxy for hydrodynamic flushing potential, explained 40 % of
the variance in ‘condition’. Collectively, the results are used to evaluate the current status
of reef assemblages, and to point out future conservation priorities.
The numerous islands that comprise the Federated States of Micronesia (FSM) contain
coral-reef resources that are of global significance in terms of their biological diversity and
value, yet they remain among the most poorly documented despite their heavy economic
and subsistence use (Johannes 1978; Houk et al. 2011). Accordingly, a common challenge
for improving local monitoring and management programs is to first understand the status
and distribution of coral-reef resources upon which predictive relationships between
environmental drivers and ecological patterns can be developed (Houk and van Woesik
2010; Zvuloni et al. 2010; Pittman and Brown 2011). Initial efforts to characterize FSM
reefs consisted of rapid ecological assessments that were mainly focused upon docu-
menting biological diversity across the region (Turak and DeVantier 2005; Donaldson
et al. 2006; Allen 2007; Houk and Starmer 2007). While these studies identified areas of
unique and high richness for marine protected area consideration, species checklists and
qualitative datasets are limited with respect to their repeatability, and thus, ability to assess
change through time. As the region moves forward in defining and assessing conservation
goals, quantitative relationships are imperative for determining rates of change and
acceptable thresholds (Nichols and Williams 2006; Houk et al. 2010). Through efforts such
as the present study, regional monitoring programs continue to improve their quantitative
baseline; however, one additional challenge that remains is translating the ensuing science
for its practical use.
Numerous studies have defined ecological criteria of coral-reef assemblages upon which
‘condition’, ‘conservation value’, or ‘health’ was interpreted (Houk et al. 2005; Rodgers
et al. 2010; Oliver et al. 2011). While many indicators clearly exist (Jameson et al. 2001;
Cooper et al. 2009), the greatest attention has been afforded to metrics describing benthic,
coral, and fish assemblages due to their tangibility, sensitivity to human influences (Fab-
ricius et al. 2005), low-cost-and-capacity sampling, and translation into monetary value
(Cesar and van Beukering 2004; Brander et al. 2007). However, the doctrine pertaining to
their practical integration and overall evaluation remains lacking, and somewhat confusing.
For instance, similarly collected coral and fish assemblage data have been used to rec-
ommend protected area networks that are focused upon critical habitat for reef-fish pro-
tection (Mumby 2006), areas of high biological richness (Roberts et al. 2002), and
aggregation centers of apex predators (Heithaus et al. 2008). Clearly the perspective and
analytical approach taken can drive management recommendations, yet, what approach is
most relevant for ecosystem-based conservation needs?
Here, we build upon the coupled themes of coral-reef ecology and conservation by pro-
viding a characterization and evaluation of the reef habitats surrounding Yap Proper, FSM. Yap
is one of the few places in Micronesia where traditional marine tenure remains; however,
improving fishing technology, growing infrastructure on land, and more reliance upon a cash
economy represent threats that are not encompassed by traditional forms of management
(Johannes 1978; Kronen and Tafileichig 2008). Indeed, declines in Yap’s fishery status through
time have been attributed to the mixing of ‘new’ technology and ‘traditional’ management
(Graham 1992; Houk et al. 2011). In order to improve upon this situation, governmental and
non-governmental organizations are rooted in enhancing the communities’ knowledge of their
coral-reef ecosystems, yet transferrable science remains limited. Thus, the goals of the present
study include translating the scientific knowledge generated into compelling insight, taking an
objective and repeatable approach for future applicability.
We begin by examining modern assemblages with respect to major habitat classifica-
tions. Existing rapid ecological assessments suggested that wave exposure, and/or major
2046 Biodivers Conserv (2012) 21:2045–2059
123
reef types, best predicted the distribution of coral and fish assemblages, as well as species
richness patterns (Allen 2007; Houk and Starmer 2007). Here, we formally determine
habitat preferences, and quantify the nature and magnitude of ecological separation across
reef types. We next examine several key attributes of the coral and fish assemblages,
including diversity and abundance trends, differential resistance/recovery from Acanth-aster planci predation, and unique species occurrences. These site-attributes were initially
defined in the REA assessments to indicated the presence of ‘high conservation value’
reefs, a term we incorporate here to indicate reefs that are under successful management, as
well as those that are associated with favorable environmental settings that promote
ecosystem resiliency, or represent critical habitat for species of special concern (Mumby
2006; Nystrom 2006; Graham et al. 2011). To examine the broader utility of this definition,
we defined a univariate index of ‘condition’ by integrating several, sufficiently uncorre-
lated metrics of the modern assemblages, and determine its ability to predict previously
defined high conservation value reefs. Building upon encouraging results, exploratory
regression models were constructed to examine a gradient of human influences and
environmental regimes that predict the condition of reefs across Yap.
Methods
Location and survey design
Yap is the westernmost state of the FSM, encompassing Yap Proper, the main island, and
14 outlying atolls (Fig. 1). Yap Proper has the lowest human population among the four
FSM main islands, with 7,400 residents spread over 10 municipalities (Yap Branch Sta-
tistics Office 2002). Quantitative coral, fish, and macroinvertebrate data were collected at
15 stations previously established as part of a rapid ecological assessment (Houk and
Starmer 2007). Representative sites were selected in each of three defined reef types: (1)
inner reefs, also termed ‘blue holes’, which are isolated deep water zones within the lagoon
system (sites 8, 14, 17, and 19, Fig. 1), (2) channel reefs where flushing and tidal
exchanges are maximal (sites 1, 2, 4, 5, 12, and 13), and (3) outer reefs along the barrier
complex (sites 3, 6, 11, 15, and 16). Surveys were conducted at the 5 m depth contour for
inner and channel reefs situated in calm waters, and at the 8 m contour for outer exposed
reefs. Employing single-depth investigations maximized our spatial extent of study, while
focusing upon the reef zones that resided under minimal environmental control due to light
limitation and wave energy (Sheppard 1982; Yentsch et al. 2002; Cooper et al. 2009). For
wave-sheltered channel and inner reefs, light levels rapidly decrease due to higher par-
ticulate matter and plankton growth in the productive waters adjacent to land. In contrast,
wave-energy is the strongest driver of shallow assemblages on outer reefs, and the 8 m
contour was selected to balance the influence of wave energy and light limitation.
Survey methods
Coral assemblages were investigated using a standard quadrat-based technique, similarly
used by Houk and Starmer (2007). Eight, 1 m2 quadrates were haphazardly tossed on the
coral reef substrate while swimming between two GPS-identified survey points that
marked each station, spaced *300 m apart. All coral colonies whose center-point resided
inside the quadrat were identified and measured. Coral taxonomy followed Veron (2000).
Abundances, population densities, and geometric diameters were calculated assuming
Biodivers Conserv (2012) 21:2045–2059 2047
123
colonies were circular in nature. These methods provided measurements of 80–240 col-
onies per site, with a mean of 157, and total of 2,364. Diversity and evenness metrics were
calculated using species-level data, while multivariate analyses used groupings of func-
tional similar species complexes (e.g., Favia favus, F. matthaii, and F. speciosa) to provide
representative weighting for functionally-similar coral groups. Finally, quadrat data from
2007 were incorporated to examine the nature and extent of recovery from Acanthasterplanci disturbance along Yap’s southwestern coastline.
Fig. 1 A map of Micronesia (inset) and Yap Proper with survey stations indicated by numbers. Circle sizeindicates relative coral-reef ‘condition’ scores (‘‘Methods and Results’’ sections). The star refers to theorigin of a recent Acanthaster planci outbreak, as defined by peak starfish densities (‘‘Results’’ section)
2048 Biodivers Conserv (2012) 21:2045–2059
123
Fish assemblages were surveyed using twelve stationary-point-counts (SPC’s) spaced at
equal intervals between the identified survey points (Bohnsack and Bannerot 1986). During
each SPC the observer recorded the name and size of all food-fish within a 5 m circular
diameter for a period of 3 min. Species identifications were made for the majority fish,
with two notable exceptions being small-bodied acanthurids and scarids which were
mainly grouped. Length estimates were converted to biomass using documented conver-
sion coefficients (www.fishbase.org). These methods provided measurements of 90–551
individual fish per site, with a mean of 248, and total of 3,725. Prior to some analyses, this
study distinguished between large-and-small bodied species for most fish families, which
were defined by a reported reproductive size threshold of 25 cm. Size at maturity estimates
were collected using the fishbase life history interactive tool (www.fishbase.org). Similarly
noted above, diversity estimates used the highest taxonomic resolution available, while
multivariate analyses used groupings of functional similar species complexes.
Macroinvertebrate abundances were estimated from five replicate 5-min swims con-
ducted between the two established survey points. Counts were made while following the
depth contours noted above.
Data analyses
Coral and fish assemblages were first assessed to determine habitat preferences using a
standard, multivariate approach. Data were aggregated at the site-level by taking the means
of functionally-similar species complexes from replicate quadrat, or SPC, observations.
Bray-Curtis similarity coefficients were calculated between each pair of sites, and resultant
relationships were visualized in non-metric, multi-dimensional scaling plots (MDS,
Anderson et al. 2008). Significance was assessed from PERMANOVA tests that are
analogous to ANOVA’s, but conformed to meet multivariate requirements (Anderson et al.
2008). PERMANOVA tests are evaluated based upon a pseudo F-statistic, and subsequent
t-statistics defining post hoc comparisons among groups. Vector overlays highlight corals
and fishes that had the greatest influence on data dispersion, based upon Spearmen cor-
relation coefficients (P [ 0.5) with the axes.
Univariate comparisons of numeric density, percent coverage, and biomass were next
conducted for several taxa to better describe coral and fish habitat partitioning. If
assumptions of normality and heterogeneity were met with or without transformations,
standard ANOVA and post hoc tests were used, else non-parametric testing was conducted
(Kruskal–Wallis rank tests). In the case of food-fish abundances, specific examination of
two species of concern, the Napoleon wrasse (Cheilinus undulatus) and the bumphead
parrotfish (Bolbometopon muricatum), were conducted to determine if habitat preferences
existed for varying life stages. In order to assess the present distribution trends in
Acanthaster planci densities, non-parametric testing was conducted to examine spatial
differences, as data were strongly non-normal due to the absence of predator starfish at
many sites. Finally, in order to evaluate change in coral colony-size distribution between
2007 and the present, Kolmogorov–Smirnov (K–S) tests were preferably used as they
investigate differences between two sets of cumulative frequency data.
Coral-reef ecosystem condition
The premise behind developing a single measure of coral-reef ecosystem condition was to
provide a comprehendible, repeatable, and rational integration of the data. Our goal was to
incorporate the maximum number of ecological metrics known to be sensitive to localized
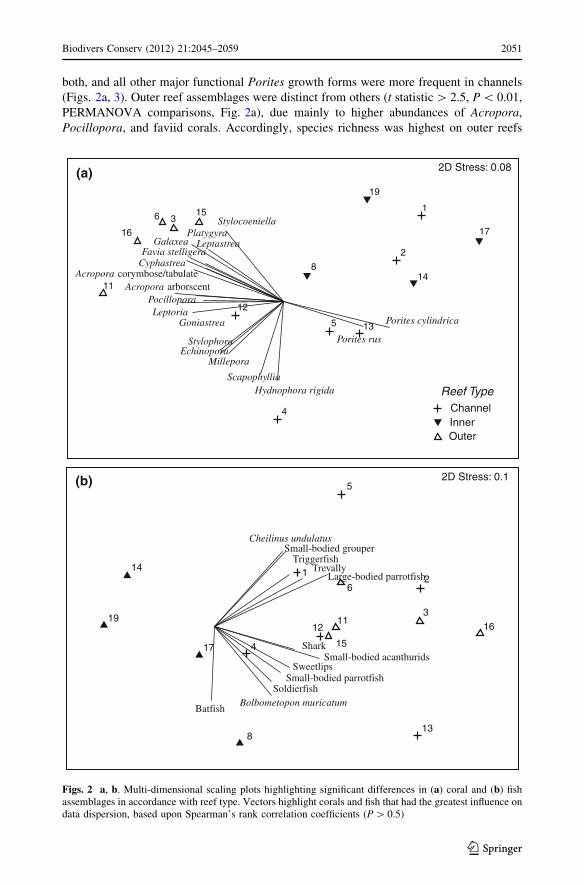
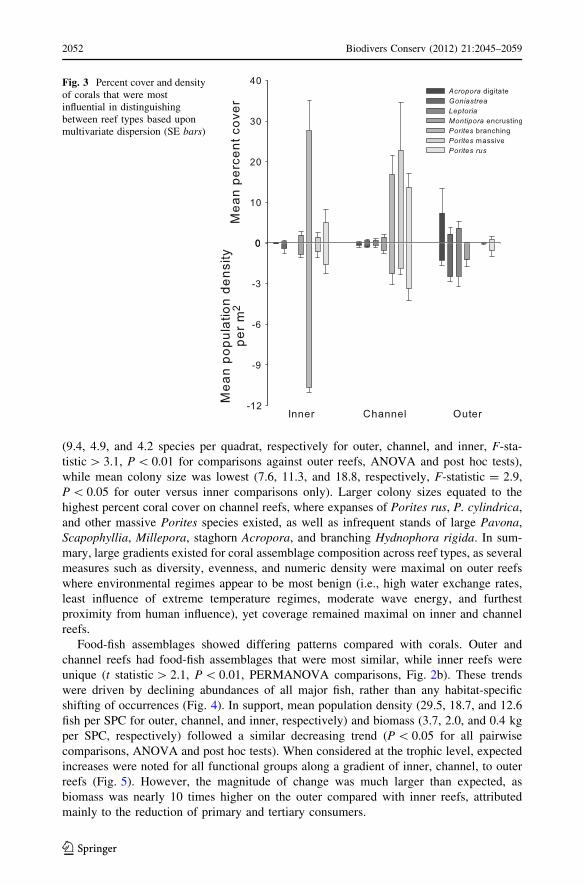
both, and all other major functional Porites growth forms were more frequent in channels
(Figs. 2a, 3). Outer reef assemblages were distinct from others (t statistic [ 2.5, P \ 0.01,
PERMANOVA comparisons, Fig. 2a), due mainly to higher abundances of Acropora,
Pocillopora, and faviid corals. Accordingly, species richness was highest on outer reefs
Reef TypeChannelInnerOuter
1
11
12
13
14
15
16 17
19
2
3
4
5
6
8
Acropora arborscentAcropora corymbose/tabulate
Cyphastrea
Echinopora
Favia stelligeraGalaxea
Goniastrea
Hydnophora rigida
Leptastrea
Leptoria
Millepora
Platygyra
Pocillopora
Porites cylindrica
Porites rus
Scapophyllia
Stylocoeniella
Stylophora
2D Stress: 0.08
1
1112
13
2
4
5
14
17
19
8
15
16
3
6
BatfishBolbometopon muricatum
Cheilinus undulatus
Large-bodied parrotfish
SharkSmall-bodied acanthurids
Small-bodied grouper
Small-bodied parrotfishSoldierfish
Sweetlips
TrevallyTriggerfish
2D Stress: 0.1
(a)
(b)
Figs. 2 a, b. Multi-dimensional scaling plots highlighting significant differences in (a) coral and (b) fishassemblages in accordance with reef type. Vectors highlight corals and fish that had the greatest influence ondata dispersion, based upon Spearman’s rank correlation coefficients (P [ 0.5)
Biodivers Conserv (2012) 21:2045–2059 2051
123
(9.4, 4.9, and 4.2 species per quadrat, respectively for outer, channel, and inner, F-sta-
tistic [ 3.1, P \ 0.01 for comparisons against outer reefs, ANOVA and post hoc tests),
while mean colony size was lowest (7.6, 11.3, and 18.8, respectively, F-statistic = 2.9,
P \ 0.05 for outer versus inner comparisons only). Larger colony sizes equated to the
highest percent coral cover on channel reefs, where expanses of Porites rus, P. cylindrica,
and other massive Porites species existed, as well as infrequent stands of large Pavona,
Scapophyllia, Millepora, staghorn Acropora, and branching Hydnophora rigida. In sum-
mary, large gradients existed for coral assemblage composition across reef types, as several
measures such as diversity, evenness, and numeric density were maximal on outer reefs
where environmental regimes appear to be most benign (i.e., high water exchange rates,
least influence of extreme temperature regimes, moderate wave energy, and furthest
proximity from human influence), yet coverage remained maximal on inner and channel
reefs.
Food-fish assemblages showed differing patterns compared with corals. Outer and
channel reefs had food-fish assemblages that were most similar, while inner reefs were
unique (t statistic [ 2.1, P \ 0.01, PERMANOVA comparisons, Fig. 2b). These trends
were driven by declining abundances of all major fish, rather than any habitat-specific
shifting of occurrences (Fig. 4). In support, mean population density (29.5, 18.7, and 12.6
fish per SPC for outer, channel, and inner, respectively) and biomass (3.7, 2.0, and 0.4 kg
per SPC, respectively) followed a similar decreasing trend (P \ 0.05 for all pairwise
comparisons, ANOVA and post hoc tests). When considered at the trophic level, expected
increases were noted for all functional groups along a gradient of inner, channel, to outer
reefs (Fig. 5). However, the magnitude of change was much larger than expected, as
biomass was nearly 10 times higher on the outer compared with inner reefs, attributed
mainly to the reduction of primary and tertiary consumers.
Fig. 3 Percent cover and densityof corals that were mostinfluential in distinguishingbetween reef types based uponmultivariate dispersion (SE bars)
2052 Biodivers Conserv (2012) 21:2045–2059
123
Closer examination of two species of special concern revealed contrasting findings. For
the Napoleon wrasse, Cheilinus undulatus, densities of juvenile fish were significantly
greater on inner reefs (P \ 0.05, Kruskal–Wallis), especially at site 17 (P \ 0.05, post hoc
Fig. 4 Biomass and density of fish that were most influential in distinguishing between reef types basedupon multivariate dispersion (SE bars)
Fig. 5 Biomass of fish by trophic level for inner, channel, and outer reefs (SE bars). Stacked bars representmean primary, secondary (benthivores), secondary (planktivores), and tertiary consumer abundance
Biodivers Conserv (2012) 21:2045–2059 2053
123
comparisons), with a mean of nearly one fish per replicate SPC (Fig. 6). However, biomass
appeared to be highest on channel and outer reefs (P = 0.06, Kruskal–Wallis). For the
bumphead parrotfish, Bolbometopon muricatum, no trends in population densities were
noted, however biomass appeared to be higher at among channel reefs (P = 0.08, Kruskal–
Wallis).
Finally, local observations of high and fluctuating Acanthaster planci densities have
been observed since 2009 (sites 16–11, pers. obs. VF). The present macroinvertebrate
surveys found high predator starfish densities at the southwestern tip of Yap compared with
elsewhere (mean of 7.8/5-min swim, site 16; mean of 0–0.6/5-min swim, all other sites;
P \ 0.001, Kruskal–Wallis). Despite the high density, and potentially representing a
source population for the southwestern coastline, the outer reef at Yap’s southern point
(site 16) showed no significant changes in coral cover or assemblage heterogeneity since
2007, suggesting high resistance and/or recovery. Also notable, there were no starfish
recorded in the no-take, Nimpal marine conservation area (MCA) (site 13) that is centrally
located along this coastline. Here, a significant increase in mean colony size since 2007
(P \ 0.01, K–S tests, Fig. 7), a non-significant change in assemblage heterogeneity, and
high fish biomass were reported (Table 1).
Estimates of coral-reef condition (i.e., ecological metrics) were comparatively higher
for sites attributed with high conservation value (t statistic = 2.95, P = 0.01), although
individual metrics varied (Table 1). The inner reef where maximal Napoleon wrasse
densities existed held high coral assemblage heterogeneity with many large colonies, high
fish richness, and moderate levels of other metrics. The outer reef with high resistance/
recovery had the highest fish biomass, along with relatively high values for all other
metrics. The channel reef with successful MCA establishment also had high fish biomass
and coral coverage, but relatively low coral richness and fish evenness, potentially due to
natural characteristics.
Predictors of condition
Given the sensitivity of condition estimates in identifying reefs of high conservation value,
predictive regression models were built to explore relationships across Yap. A two variable
Fig. 6 Biomass and density of Cheilinus undulatus at individual sites. Inner reefs held significantly higherdensities of small fish, and site 17 had highest densities, while biomass appear to be greater on channel andouter reefs
2054 Biodivers Conserv (2012) 21:2045–2059
123
model that included one interactive term describing proxies to fishing and pollution
(slope = -0.12 ± 0.04), as well as second term for a proxy to hydrodynamic flushing rate
(slope = 0.78 ± 0.41), explained 40 % of the variance associated with condition estimates
(P = 0.04). In summary, this analysis predicts that sites closest to population centers and
urbanized/barren land, with poor flushing potential, consistently had the lowest condition
(Fig. 1).
Discussion
This study reports predictable distributions of fish and coral resources around Yap that
were driven by both natural environmental regimes and human influences. While several
metrics such as coral diversity, evenness, and fish biomass are well known to decrease
along a gradient of environmental selectivity (i.e., from outer reefs with maximal flushing,
minimal temperature extremes and turbidity variation, to inner reefs with minimal flushing,
influential tidal regimes, temperature extremes, and higher turbidity; Gust et al. 2001;
Lecchini et al. 2003; DeVantier et al. 2006; Houk and Starmer 2010), the magnitude of this
gradient has received less attention. In comparison to a remote coral reef ecosystem in the
central Pacific where fish biomass was *2.5 times higher on outer compared with inner
atoll reefs (Friedlander et al. 2010), this study disproportionally reports four times higher
(a)
(b)
Fig. 7 Coral colony size comparisons between 2007 and 2011 for (a) sites along the southwestern coastline(16, 15, 12, and 11, Fig. 1) where high Acanthaster planci populations were noted, and (b) the Nimpal MCAfishery closure (site 13) where no starfish were observed
Biodivers Conserv (2012) 21:2045–2059 2055
123
biomass on channel compared with inner reefs, and eight times higher biomass on outer
reefs.
The disproportional reduction of all major fish groups moving from outer to inner reefs
intuitively suggests that implications for coral assemblages might exist, assuming that top
down influences in the marine food web are influential (Estes et al. 2011). However,
limited evidence exists from remote reef areas to provide a similar context. While com-
parisons between ‘pristine’ and more disturbed reef ecosystems continue to improve our
understanding of shifting coral assemblages (Sandin et al. 2008), limited research exists to
provide details into the magnitude of naturally-occurring gradients under varying human
influences. Here, we noted an expected increase in Porites (and heterotrophic species)
dominance moving from exposed outer reefs to protected, channel/inner reefs, yet the
multivariate analysis indicated distinctive, minimally-overlapping species occurrences. We
hypothesize that while reef types serve as proxies for environmental separation, through
time, the magnitude of coral species overlap between reef types has been decreasing with
human influence. In support, Fabricius (2005) summarized that reduced species richness,
increased dominance by tolerant species, and reduced evenness of coral assemblages
becomes evident along a gradient of terrestrial influence, suggestive of enhanced assem-
blage separation through time.
Table 1 Mean values of the ecological metrics used to evaluate coral-reef condition. Metrics were stan-dardized to provide equal weighting, a constant value was added to make all numbers positive integers, andthe overall mean is reported under ‘‘condition’’ (within each reef type). In order to compare condition acrossall sites, values were standardized with respect to their reef type. See ‘‘Methods’’ section for further details
Site Coral
species
richness
(per m2)
Coral
multivariate
dissimilarity
Percent
coral
cover
Coral
skewness
and
kurtosis
Fish
biomass
(kg per
SPC)
Fish
evenness
Condition
(standardized
within each reef
type)
Condition
(standardized
across all reef
types)
Inner reefs
8 6.5 38.7 54.8 (5.0) (31.0) 0.7 1.0 2.36 1.98
14 3.9 39.9 50.2 (4.4) (24.5) 0.3 0.9 2.25 1.53
17 2.1 53.0 43.0 (2.5) (6.4) 0.5 1.1 2.71 3.4
19 4.1 37.0 54.6 (3.8) (16.5) 0.3 0.5 2.14 1.09
Channel reefs
1 2.6 33.3 65.1 (4.1) (18.0) 1.1 1.1 2.63 0.47
2 4.4 72.2 45.1 (3.3) (12.7) 3.6 1.3 3.26 2.27
4 5.3 51.0 61.0 (3.5) (14.2) 0.8 1.0 2.86 1.13
5 7.3 81.8 74.2 (4.5) (24.4) 1.6 1.2 3.32 2.44
12 5.8 104.5 78.2 (3.6) (18.5) 1.5 1.2 3.58 3.17
13 3.9 102.3 79.6 (4.3) (22.7) 3.1 1.0 3.35 2.52
Outer reefs
3 9.6 12.4 65.9 (3.6) (15.9) 5.3 1.1 3.44 2.26
6 9.5 16.8 69.1 (4.5) (30.3) 1.4 0.9 2.7 0.81
11 8.1 54.6 66.8 (4.0) (19.8) 2.0 1.2 3.31 2.01
15 10.6 14.7 66.4 (3.9) (23.3) 1.7 1.0 3.02 1.44
16 9.1 26.9 75.2 (3.4) (16.0) 8.4 1.4 4.06 3.48
2056 Biodivers Conserv (2012) 21:2045–2059
123
Concomitant to observed fish and coral assemblage trends, this study also reported
that proxies to fishing and pollution were significant predictors of reef condition, indi-
cating that despite a small human population of 7,400, or 74 individuals km-2, human
footprints are evident. In fact, regression analyses highlighted that localized stressors
acted synergistically in predicting coral-reef condition (i.e., the best-fit model contained
a single, interactive term for proxies to fishing pressure and pollution). Yet, further
insight into their partial influence is desirable because management strategies for pol-
lution and fishing differ. Building longer-term and larger-scaled datasets across gradients
of water quality and fish assemblages that tract the ecological responses of reef assem-
blages through time represents a useful means towards predicting the likely outcomes of
management scenarios, and incorporating gradient analyses into long-term monitoring
frameworks is one ideal approach (Houk et al. 2010; Wilson et al. 2010; McClanahan
et al. 2011).
While distilling complex ecological knowledge into a single, condition metric might be
regarded as overly simplistic, more complex approaches towards evaluating reef status
should substantially improve our prediction of patterns to be preferentially considered
(Balasubramanian 1997). The Nimpal MCA is one form of management that benefitted
from the spatial interpretation of condition. High conservation value noted in 2007 was
mainly due to strong community-based support for management, as ecologically, insight
based mainly upon species richness data showed that non-unique assemblages existed
(Allen 2007; Houk and Starmer 2007). However, 4 years later, after formalizing their no-
take MCA, condition is now second highest among channel reefs despite having the
smallest habitat size. Thus, due to a strong social acceptance, this reef has exceeded its
natural ecological expectations, relative to human influences that currently exist, and
confirms the importance of including social factors into conservation planning (Walmsley
and White 2003). Beyond increasing fish populations, growing evidence supports that
conservation of numerous key ecological functions inside fisheries closures. Here, the
negative influences from predator starfish activity along Yap’s southwestern coastline
appeared diminished within the MCA, corroborating similar reports from closures else-
where along the Great Barrier Reef (McCook et al. 2010).
Finally, identifying where and why resiliency exists is a central focus for resource
management (Wooldridge et al. 2005; Hughes et al. 2010). We ironically purport that high
recovery and predator starfish abundance at the southern tip of Yap (site 16) may be a
consequence of the same local hydrodynamic process. Circulation eddies are known to
form in the lee of exposed islands and have been documented to benefit recruitment and
settlement (Black et al. 1995; Mace and Morgan 2006; Burgess et al. 2007). Thus, the high
recovery noted here may be aided by the favorable oceanographic and physical setting that
exists.
We conclude that a simple, thoughtful approach, combining several robust measures
coral and fish populations provided a useful snapshot of Yap’s coral reefs. Through time,
quantitative trends can improve the basis for balancing resource integrity and sustainability
with socioeconomic needs.
Acknowledgments Financial support for this project provided by the National Oceanic and AtmosphericAdministration, general coral reef conservation program, award NA05NMF4631049. The authors aregrateful to the staff of the Yap Community Action Program and the numerous community representativesthat assisted with logistics and fieldwork. Two anonymous reviewers and the topic editor provided con-structive input that greatly benefitted our manuscript.
Biodivers Conserv (2012) 21:2045–2059 2057
123
References
Allen GR (2007) Reef fishes of Yap, Federated States of Micronesia. Technical report submitted to YapCommunity Action Program. Yap State, FSM
Anderson M, Gorley R, Clarke K (2008) PERMANOVA ? for PRIMER: guide to software and statisticalmethods. PRIMER-E, Plymouth, UK
Bak RPM, Meesters EH (1998) Coral population structure: the hidden information of colony size-frequencydistributions. Mar Ecol Prog Ser 162:301–306
Balasubramanian V (1997) Statistical inference, Occam’s Razor, and statistical mechanics on the space ofprobability distributions. Neural Comput 9:349–368
Black K, Moran P, Burrage D et al (1995) Association of low-frequency currents and crown-of-thorn starfishoutbreaks. Mar Ecol Prog Ser 125:185–194
Bohnsack JA, Bannerot SP (1986) A stationary visual census technique for quantitatively assessing com-munity structure of coral reef fishes. National Oceanic and Atmospheric Administration TechnicalReport NMFS 41. Washington
Brander LM, Van Beukering P, Cesar HSJ (2007) The recreational value of coral reefs: a meta-analysis.Ecol Econ 63:209–218
Burgess SC, Kingsford MJ, Black KP (2007) Influence of tidal eddies and wind on the distribution ofpresettlement fishes around One Tree Island, Great Barrier Reef. Mar Ecol Prog Ser 341:233–242
Cesar HSJ, van Beukering P (2004) Economic valuation of the coral reefs of Hawai’i. Pac Sci 58:231–242Cooper T, Gilmour J, Fabricius K (2009) Bioindicators of changes in water quality on coral reefs: review
and recommendations for monitoring programmes. Coral Reefs 28:589–606DeVantier L, De’Ath G, Turak E, Done T, Fabricius K (2006) Species richness and community structure of
reef-building corals on the nearshore Great Barrier Reef. Coral Reefs 25:329–340Donaldson T, Maragos J, Luckymis M et al (2006) Coral and fish surveys at Kosrae Island, July–August
2006, Federated States of Micronesia. Technical report submitted to The Nature Conservancy, GuamElmqvist T, Folke C, Nystrom M et al (2003) Response diversity, ecosystem change, and resilience. Front
Ecol Environ 1:488–494Estes JA, Terborgh J, Brashares JS et al (2011) Trophic downgrading of planet earth. Science 333:301–306Fabricius KE (2005) Effects of terrestrial runoff on the ecology of corals and coral reefs: review and
synthesis. Mar Pollut Bull 50:125–146Friedlander AM, Sandin SA, DeMartini EE, Sala E (2010) Spatial patterns of the structure of reef fish
assemblages at a pristine atoll in the central Pacific. Mar Ecol Prog Ser 410:219–231Graham T (1992) The application of traditional rights-based fishing systems to contemporary problems in
fisheries management. A focus on the Pacific basin. Thesis, Oregon State UniversityGraham NAJ, Nash KL, Kool JT (2011) Coral reef recovery dynamics in a changing world: Coral Reefs (in
press). doi:10.1007/s00338-010-0717-zGust N, Choat JH, McCormick MI (2001) Spatial variability in reef fish distribution, abundance, size and
biomass: a multi-scale analysis. Mar Ecol Prog Ser 214:237–251Heithaus MR, Frid A, Wirsing AJ et al (2008) Predicting ecological consequences of marine top predator
declines. Trends Ecol Evol 23:202–210Houk P, Starmer J (2007) Rapid ecological assessment for Yap, Ngulu, and Ulithi, Yap State, Federated
States of Micronesia. Quantitative assessments of coral-reef assemblages and macroinvertebrateabundances. Technical report submitted to Yap Action Community Program, Yap, FSM
Houk P, Starmer J (2010) Constraints on the diversity and distribution of coral-reef assemblages in thevolcanic Northern Mariana Islands. Coral Reefs 29:59–70
Houk P, van Woesik R (2010) Coral assemblages and reef growth in the Commonwealth of the NorthernMariana Islands (Western Pacific Ocean). Mar Ecol 31:318–329
Houk P, Didonato G, Iguel J et al (2005) Assessing the effects of non-point source pollution on AmericanSamoa’s coral reef communities. Environ Mon Assess 107:11–27
Houk P, Musburger C, Wiles P (2010) Water quality and herbivory interactively drive coral-reef recoverypatterns in American Samoa. PLoS ONE 5:e13913
Houk P, Rhodes K, Cuetos-Bueno J et al (2011) Commercial coral-reef fisheries across Micronesia: a needfor improving management. Coral Reefs (in press). doi:10.1007/s00338-011-0826-3
Hughes TP, Graham NAJ, Jackson JBC et al (2010) Rising to the challenge of sustaining coral reefresilience. Trends Ecol Evolut 25:633–642
Jameson SC, Erdmann MV, Karr JR et al (2001) Charting a course toward diagnostic monitoring: acontinuing review of coral reef attributes and a research strategy for creating coral reef indexes ofbiotic integrity. Bull Mar Sci 69:701–744
Johannes R (1978) Traditional marine conservation methods in Oceania and their demise. Ann Rev EcolSystem 9:349–364
Kronen M, Tafileichig A (2008) Traditional rights and management of Yap’s coastal fisheries and the role offisherwomen. SPC Women Fish Inform Bull 18:21–25
Lecchini D, Adjeroud M, Pratchett MS, Cadoret L, Galzin R (2003) Spatial structure of coral reef fishcommunities in the Ryuku Islands, southern Japan. Oceanol Acta 26:537–547
Mace AJ, Morgan SG (2006) Larval accumulation in the lee of a small headland: implications for the designof marine reserves. Mar Ecol Prog Ser 318:19–29
McClanahan T, Ateweberhan M, Omukoto MJ (2008) Long-term changes in coral colony size distributionson Kenyan reefs under different management regimes and across the 1998 bleaching event. Mar Biol153:755–768
McClanahan TR, Graham NAJ, Muthiga NA et al (2011) Critical thresholds and tangible targets forecosystem-based management of coral reef fisheries. Proc Natl Acad Sci (in press). doi:10.1073/pnas.1106861108
McCook LJ, Ayling T, Cappo M et al (2010) Adaptive management of the Great Barrier Reef: a globallysignificant demonstration of the benefits of networks of marine reserves. Proc Nat Acad Sci107:18278–18285
Mumby PJ (2006) Connectivity of reef fish between mangroves and coral reefs: algorithms for the design ofmarine reserves at seascape scales. Biol Conserv 128:215–222
Nichols JD, Williams BK (2006) Monitoring for conservation. Trends Ecol Evol 21:668–673Nystrom M (2006) Redundancy and response diversity of functional groups: implications for the resilience
of coral reefs. Ambio 35:30–35Oliver L, Lehrter J, Fisher W (2011) Relating landscape development intensity to coral reef condition in the
watersheds of St. Croix, US Virgin Islands. Mar Ecol Prog Ser 427:293–302Pittman SJ, Brown KA (2011) Multi-Scale approach for predicting fish species distributions across coral reef
seascapes. PLoS ONE 6:e20583Roberts CM et al (2002) Marine biodiversity hotspots and conservation priorities for tropical reefs. Science
295:1280Rodgers KS, Jokiel PL, Bird CE et al (2010) Quantifying the condition of Hawaiian coral reefs. Aquat
Conserv 20:93–105Rosenfeld JS (2002) Functional redundancy in ecology and conservation. Oikos 98:156–162Sandin SA, Smith JE, DeMartini EE, Dinsdale EA, Donner SD, Friedlander AM, Konotchick T, Malay M,
Maragos JE, Obura D (2008) Baselines and degradation of coral reefs in the northern Line Islands.PLoS ONE 3:e1548
Sheppard CRC (1982) Coral populations on reef slopes and their major controls. Mar Biol 7:83–115Turak E, DeVantier L (2005) Reef-building corals and Coral Communities of Pohnpei, Federated States of
Micronesia: rapid ecological assessment of biodiversity and status. Technical report submitted to TheNature Conservancy Micronesia Program, Guam
Veron JEN (2000) Corals of the world. Australian Institute of Marine Science, TownsvilleWalmsley S, White A (2003) Influence of social, management and enforcement factors on the long-term
ecological effects of marine sanctuaries. Environ Conserv 30:388–407Wilson SK, Fisher R, Pratchett MS, Graham NAJ, Dulvy NK, Turner RA, Cakacaka A, Polunin NVC (2010)
Habitat degradation and fishing effects on the size structure of coral reef fish communities. Ecol App20:442–451
Wooldridge S, Done T, Berkelmans R et al (2005) Precursors for resilience in coral communities in awarming climate: a belief network approach. Mar Ecol Prog Ser 295:157–169
Yap Branch Statistics Office (2002) Yap State census report: 2000 FSM census of population and housing.Division of Statistics, Department of Economic Affairs, Colonia, Yap, Federated States of Micronesia
Yentsch CS, Yentsch CM, Cullen JJ et al (2002) Sunlight and water transparency: cornerstones in coralresearch. J Exp Mar Biol Ecol 268:171–183
Zvuloni A, van Woesik R, Loya Y (2010) Diversity partitioning of stony corals across multiple spatial scalesaround Zanzibar Island, Tanzania. Plos ONE 5:e9941