Acta Geodyn. Geomater., Vol. 16, No. 1 (193), 71–83, 2019 DOI: 10.13168/AGG.2019.0006 journal homepage: https://www.irsm.cas.cz/acta ORIGINAL PAPER CHARACTERIZATION AND FINITE ELEMENT ANALYSIS OF LIME AND POLYMER TREATED ULTRA-SOFT CLAY SOILS USING THE ELECTRICAL RESISTIVITY AND MINIATURE PENETROMETER METHODS Aram M. RAHEEM 1) * and Cumaraswamy VIPULANANDAN 2) 1) Civil Engineering Department, University of Kirkuk, Kirkuk, Iraq 2) Civil and Environmental Engineering Department, University of Houston, TX, *Corresponding author‘s e-mail: [email protected]ABSTRACT The characterization of ultra-soft soil behavior is one of the most difficult challenges since the water content in such soils is very high. Hence, nondestructive or special measurement is required. Therefore, the behavior of untreated and treated ultra-soft soil was characterized using both miniature penetrometer and electrical methods. The ultra-soft soil was prepared with 2 % to 10 % bentonite. The soil with 10 % bentonite was treated with 2 % to 10 % lime and with 1 % to 10 % polymer separately. The pH, CIGMAT miniature penetrometer, and electrical resistivity combined with the measured shear strength from the modified vane shear device were used to characterize the ultra-soft soils. The CIGMAT miniature penetrometer penetration varied linearly with the shear strength of the untreated and treated soft soils with 10 % bentonite. Relative electrical resistivity decreased by 246 % when the bentonite content was increased from 2 % to 10 % in the ultra-soft soil. The addition of 10 % of the lime to the ultra-soft soil with 10 % of bentonite content decreased the relative electrical resistivity by 171 %. The addition of 10 % of the polymer to the ultra-soft soil with 10 % of bentonite content reduced the relative electrical resistivity by 545 %. Power law, linear and hyperbolic models were used to predict the shear strength-electrical resistivity relationship for the untreated, lime-treated and polymer-treated ultra-soft soils respectively. The CIGMAT miniature penetrometer was modeled using 3-D axisymmetric finite element method, which predicted the penetration of CIGMAT penetrometer that agreed well with the experimental results of the ultra-soft soils. ARTICLE INFO Article history: Received 12 May 2018 Accepted 22 January 2019 Available online 1 February 2019 Keywords: Shear strength Ultra-soft soil Electrical resistivity CIGMAT miniature penetrometer Polymer Lime pH FEM Mohr-Coulomb model (cone penetration) and vane shear testing (Nader et al., 2015). To better quantify the soil properties, penetrometers with different sizes and shapes have been used. Generally, cone, ball, and T-bar penetrometers are widely used. The cone penetration method has been used extensively to correlate cone penetration tests (CPTs) with different soil properties such as shear strength, sensitivity, grain size distribution, and consolidation history (Rad and Lunne, 1986; Low et al., 2010). However, the minimum measured undrained shear strength was 230 kPa with the CPT used at different locations all around the world (De Jong et al., 2011). Ball penetration and T-bar penetrometers were primarily used for centrifugal tests (Stewart and Randolph, 2001). Recently, the use of full-flow penetrometers to quantify the undrained shear strength and sensitivity of the clays has become more popular (De Jong et al., 2011). Moreover, it was indicated that the full-flow penetrometers have higher projected areas of the tip and less influenced by overburden pressure in comparison to cone penetrometers, therefore; they have been used in very soft soils (Stewart and Randolph, 2001). However, the minimum measured 1. INTRODUCTION Due to a lack of land in the coastal cities, ground improvement has to be done to increase the availability of land for various applications (Bo et al., 2010; Anggraini et al., 2015). Also, because of the difficulty in obtaining undisturbed soil samples of ultra-soft soils in the coastal areas or deep seawater, in situ testing are becoming more popular (Lunne, 2001; Hasan and Samadhiya, 2016). In the deep water, seabed testings have to be done to characterize the soft soil within penetration about 3 m to 5 m as required (Hawkins and Markus, 1998). Several methods such as Vane Shear Test (VST), Cone Penetration Test (CPT) and T-Bar method are being used for the downhole testing. The vane shear test has been used widely in offshore site investigations, especially in the Gulf of Mexico (Johnson et al., 1988; Young et al., 1988) while T-bar can be considered as a modified cone penetration device and both have been used for soft soil characterization (Teh and Houlsby, 1991). The potential of determining the soil profile near the top level of the seabed has given light penetrometer uniqueness over other typical methods of field-testing such as standard penetration method Cite this article as: Raheem AM, Vipulanandan C: Characterization and finite element analysis of lime and polymer treated ultra-soft clay soils using the electrical resistivity and miniature penetrometer methods. Acta Geodyn. Geomater., 15, No. 1 (193), 71– 83, 2019. DOI: 10.13168/AGG.2019.0006
The characterization of ultra-soft soil behavior is one of the most difficult challenges since thewater content in such soils is very high. Hence, nondestructive or special measurement isrequired. Therefore, the behavior of untreated and treated ultra-soft soil was characterized usingboth miniature penetrometer and electrical methods. The ultra-soft soil was prepared with 2 % to10 % bentonite. The soil with 10 % bentonite was treated with 2 % to 10 % lime and with 1 % to10 % polymer separately. The pH, CIGMAT miniature penetrometer, and electrical resistivitycombined with the measured shear strength from the modified vane shear device were used tocharacterize the ultra-soft soils. The CIGMAT miniature penetrometer penetration varied linearlywith the shear strength of the untreated and treated soft soils with 10 % bentonite. Relativeelectrical resistivity decreased by 246 % when the bentonite content was increased from 2 % to10 % in the ultra-soft soil. The addition of 10 % of the lime to the ultra-soft soil with 10 % ofbentonite content decreased the relative electrical resistivity by 171 %. The addition of 10 % ofthe polymer to the ultra-soft soil with 10 % of bentonite content reduced the relative electricalresistivity by 545 %. Power law, linear and hyperbolic models were used to predict the shearstrength-electrical resistivity relationship for the untreated, lime-treated and polymer-treatedultra-soft soils respectively. The CIGMAT miniature penetrometer was modeled using 3-Daxisymmetric finite element method, which predicted the penetration of CIGMAT penetrometerthat agreed well with the experimental results of the ultra-soft soils.
ARTICLE INFO
Article history:
Received 12 May 2018 Accepted 22 January 2019 Available online 1 February 2019
Keywords: Shear strength Ultra-soft soil Electrical resistivity CIGMAT miniaturepenetrometer Polymer Lime pH FEM Mohr-Coulomb model
(cone penetration) and vane shear testing (Nader et al.,2015). To better quantify the soil properties,penetrometers with different sizes and shapes havebeen used. Generally, cone, ball, and T-barpenetrometers are widely used. The cone penetrationmethod has been used extensively to correlate conepenetration tests (CPTs) with different soil propertiessuch as shear strength, sensitivity, grain sizedistribution, and consolidation history (Rad andLunne, 1986; Low et al., 2010). However, theminimum measured undrained shear strength was230 kPa with the CPT used at different locations allaround the world (De Jong et al., 2011). Ballpenetration and T-bar penetrometers were primarilyused for centrifugal tests (Stewart and Randolph,2001). Recently, the use of full-flow penetrometers toquantify the undrained shear strength and sensitivityof the clays has become more popular (De Jong et al.,2011). Moreover, it was indicated that the full-flowpenetrometers have higher projected areas of the tipand less influenced by overburden pressure incomparison to cone penetrometers, therefore; theyhave been used in very soft soils (Stewart andRandolph, 2001). However, the minimum measured
1. INTRODUCTION
Due to a lack of land in the coastal cities, groundimprovement has to be done to increase theavailability of land for various applications (Bo et al.,2010; Anggraini et al., 2015). Also, because of thedifficulty in obtaining undisturbed soil samples ofultra-soft soils in the coastal areas or deep seawater, insitu testing are becoming more popular (Lunne, 2001;Hasan and Samadhiya, 2016). In the deep water,seabed testings have to be done to characterize the softsoil within penetration about 3 m to 5 m as required(Hawkins and Markus, 1998). Several methods suchas Vane Shear Test (VST), Cone Penetration Test(CPT) and T-Bar method are being used for thedownhole testing. The vane shear test has been usedwidely in offshore site investigations, especially in theGulf of Mexico (Johnson et al., 1988; Young et al.,1988) while T-bar can be considered as a modifiedcone penetration device and both have been used forsoft soil characterization (Teh and Houlsby, 1991).
The potential of determining the soil profile nearthe top level of the seabed has given lightpenetrometer uniqueness over other typical methodsof field-testing such as standard penetration method
Cite this article as: Raheem AM, Vipulanandan C: Characterization and finite element analysis of lime and polymer treated ultra-soft claysoils using the electrical resistivity and miniature penetrometer methods. Acta Geodyn. Geomater., 15, No. 1 (193), 71–83, 2019. DOI: 10.13168/AGG.2019.0006
A. M. Raheem and C. Vipulanandan
72
when the water content decreased from 98 % to 90 %as the bentonite content was increased from 2 % to10 % respectively. However, the shear strength andwater content were decreased from 0.17 kPa to0.15 kPa and from 88 % to 80 % as the lime contentwas increased from 2 % to 10 % respectively with anoptimum shear strength of 0.27 kPa. In addition, theshear strength was increased from 0.17 kPa to 6.8 kPaand the water content decreased from 90 % to 80 % asthe polymer content was increased from 0 % to 10 %respectively.
Electrical resistivity investigation methods testsoil properties by measuring the current and voltagebetween electrodes. Electrical resistivity methods,which were developed in the 1900s, have been usedfor the investigation of geological structures, under-ground spaces such as cavities, underground watercontamination, and salinity distribution of aquiferwater (Kaya and Fang, 1997). The electrical resistivitysurvey was first applied to the oil/gas exploration andprospecting of conductive or bodies, later it foundapplications in various engineering fields such asmining, agriculture, environment, archeology,hydrogeology and geotechnics (Siddiqui and Osman,2012). The idea of electrical resistivity measurementhas been applied in the subsurface rock investigation(Stadelhofen, 1991) where petroleum companies usedthis technique for oil inspection. In addition, theelectrical resistivity survey was used in compactedclay to obtain the hydraulic conductivity in compactedclay (Abu-Hassanein et al., 1996). Moreover, anarchaeological study has used an electrical resistivitymethod to obtain an equipotential map at theWilliamsburg in USA (Bevan, 2000). Attempts havetried to use direct current electrical resistivity toobserve the water content variations in the soil(Robain et al., 2003). It was shown that the soiladopted transitional electrical characteristics based onthe both chemical and physical properties such assalinity, texture and moisture content (Samouëlian etal., 2005).
The equivalent electrical circuit of the ultra-softsoil behavior had been used as shown in Figure 1(Vipulanandan and Prashanth, 2013; Raheem et al.,2017). The bulk capacitance of the material (Cb) wasneglected and the total impedance of the equivalentcircuit was represented as follows:
undrained shear strength were 8 kPa and 11 kPa withT-bar and ball penetrometers used respectively(Stewart and Randolph, 2001) while in the ultra-softsoil the undrained shear strength may have muchlower value and it could reach to 0.01 kPa(Vipulanandan and Raheem, 2015). Hence, a newpenetrometer with more accuracy is required toquantify the undrained shear strength of ultra-soft soil.
As early as 1939, Casagrande proposed anaverage shear strength of soil at the liquid limit as2.65 kPa taking into considering a large spread ofvalues depending on the apparatus used fordetermining the liquid limit (Casagrande, 1958).Norman (1958) stated that the shear strength at theliquid limit controlled by using an apparatus incompliance with the British standard ranged from0.8 kPa to 1.6 kPa whereas using an apparatus ofASTM standards, the strength varied from 1.1 kPa to2.3 kPa (Norman, 1958). Skempton and Northey(1952) described the value of shear strength at theliquid limit of four soils with very different values ofplasticity index as 0.7 kPa to 1.75 kPa (Skempton andNorthey, 1952). Youssef et al. (1965) found that thevalues of shear strength of clay at the liquid limit ofa large number of soils (liquid limit varied from 32 %to 190 %) ranged from 2.4 kPa to 1.3 kPa with a meanvalue of 1.7 kPa (Youseff et al., 1965). Other studies(Wroth and Wood, 1978; Nagaraj et al., 2012) haveindicated that the shearing strength of all fined grainedsoils at the liquid limit falls within a limited range ofabout 1.7 kPa to 2.0 kPa. Dredged nearshore materialsexhibit properties such as high water contents and lowshear strengths where the shear strength of mostclayey soils is less than 0.01 kPa (Bartos, 1977; DeMeyer and Mahlerbe, 1987).
Soft clay deposits are located in many coastalareas and they exhibit poor strength andcompressibility (Pourakbar et al., 2016). Various soilimprovement methods have been used for improvingthe shear strength of soft clays. These methods arebased on using lime, cement and fly ash stabilizationfor treating ultra-soft clay soils (Ali et al., 1992;Muntohar, 2004). Since the gravimetric water contentwas low in such untreated and treated soils, thesestudies have mainly tested the soils for compaction,unconfined compression strength, and Atterberglimits. However, the gravimetric water content inultra-soft soil is more than 90 %. Therefore, thesestudies cannot be used to represent the behavior ofultra-soft soil. Further information has been reportedin order to improve the soft ground by using soilcement column method (Hebib and Farrell, 2003).Very few studies have used polymer to improve softsoil properties (Raheem et al., 2017). Hence, studyingthe effect of polymer treatment on the ultra-soft soilshear strength is crucial. The variations of undrainedshear strength and water content (percentage of water)with bentonite, lime and polymer contents foruntreated and treated the ultra-soft soil were studiedby Raheem et al., 2017. It was shown that the shearstrength was increased from 0.01 kPa to 0.17 kPa
Fig. 1 The correspondace electrical circuitsimulating the ultra-soft soil condition.
CHARACTERIZATION AND FINITE ELEMENT ANALYSIS OF LIME AND POLYMER … .
73
ultra-soft soil were studied as shown in Figure 2(Raheem et al., 2017). The electrical impedance for2 % bentonite ultra soft soil reduced from 2.67 k.Ohmto 1.71 k.Ohm when the current frequency wasincreased from 0.02 kHz to 300 kHz. The electricalimpedance for 10 % bentonite ultra soft soil treatedwith lime reduced from 0.707 k.Ohm to 0.414 k.Ohmwhen the current frequency was increased from0.02 kHz to 300 kHz. The electrical impedance for10 % bentonite ultra soft soil treated with polymerreduced from 0.773 k.Ohm to 0.394 k.Ohm when thecurrent frequency was increased from 0.02 kHz to300 kHz. The model (Eq. 1) predictions were agreedwith the experimental data for untreated and treatedultra-soft soil as identified in Figure 2a-c. The usedbulk ultra-soft soil resistance and the contactcapacitance are summarized in Table 1.
Limited attempts have been made by researchersto explore the phenomenon of electrical resistivity insoils and its relationship with other soil properties;such as thermal resistivity, salinity, ground waterdistributions using four probe methods (Abu-Hassanein et al., 1996). There is no correlation in theliterature relating the electrical resistivity with ultra-soft soil shear strength.
2. OBJECTIVES
The overall objective of the study was toinvestigate methods to characterize ultra-soft soils sothe methods can be adopted in the field. The specificobjectives are as follows: 1. Investigate the correlation between shear strength,
water content and electrical resistivity (2 probemethod) of untreated and treated ultra-soft soil.
2. Study the shear strength versus penetrationrelationship for untreated and treated ultra-softsoils using the miniature CIGMAT penetrometer.
3. Model the observed behavior using the finiteelement method (FEM).
3. MATERIALS AND METHODS
In this study, the ultra-soft soil was preparedfrom a low percentage of bentonite and it was treatedwith the lime and polymer individually. All the soilsamples were prepared on weight basis. Extensivephysical, pH and electrical tests have been performedon untreated and treated soft soil to evaluate thebehavior of the ultra-soft soil with and withouttreatment.
3.1. SOIL
Ultra-soft soil samples were prepared inlaboratory by mixing different percentage ofcommercially Wyoming available bentonite (2 % to10 %) with water (90 % to 98 %) at the roomtemperature for almost 15 minutes until a homo-genous mixture was obtained. The required mixingtime is comparatively low since the soil samples arerelatively small. The soil slurry mixture was placed in
Fig. 2 Predicted and measured impedance frequencyrelationship (a) untreated ultra-soft soil, (b)10 % bentonite ultra-soft soil treated withlime and (c) 10 % bentonite ultra-soft soiltreated with polymer (Raheem et al., 2017).
2
2 2 2 2 2 2
2 2
1 1c c c
bc c c c
R R CZ R j
R C R C
ωω ω
= + −+ +
(1)
where Z is the impedance, Rb is ultra-soft soil (bulk)resistance, Rc is the contact resistance, ω is the angularfrequency of the alternative current (AC) signal usedfor the measurements and Cc is the contactcapacitance.
The variations of impedance spectroscopy versusfrequency for the untreated, lime and polymer treated
A. M. Raheem and C. Vipulanandan
74
Table 1 Impedance model parameters for untreated and treated ultra-soft soil.
In this study, individual samples were preparedby adding lime ranges from 2 % to 10 % to pre-prepared ultra-soft soil with 10 % bentonite content tostudy the short-term effectiveness of the lime onbentonite ultra-soft soil.
3.3. POLYMER
Polymer solution was prepared by mixing 15 %of water soluble acrylamide polymer with 0.5 % ofcatalyst, 0.5 % of activator and 84 % of water. Hence,the polymer solution had 15 % polymer dissolved init. The pH of the polymer solution was 10. Hence, if10 % of polymer solution content was used to treat thesoil (based on dry weight of soil) actual amount ofpolymer used was 1.5 %. In this study, differentsamples were prepared by adding polymer solutionranges from 1 % to 10 % to pre-prepared ultra-softsoil with 10 % bentonite content to study the influenceof the polymer on the behavior of ultra-soft soil.
3.4. PHYSICAL METHODS
(i) Vane shear The untreated and treated bentonite ultra-soft soil
with lime and polymer were tested using the modifiedvane shear device to measure the mud shear strength.Low shear strength measurement is one of the majorchallenges in the laboratory and field, however; themodified vane shear device (the blade height anddiameter were increased by four times the originaldimensions) measured the extreme low shear strengthof the untreated and treated bentonite ultra-soft soil.
(ii) Miniature CIGMAT penetrometer Based on the size and weight of the miniature
CIGMAT penetrometer, it can be used to measure theshear strength of ultra-soft soils. A schematic sketchof the miniature CIGMAT penetrometer is shown inFigure 3. The penetrometer made out of plastic witha diameter and height of 25 mm and 100 mmrespectively. The penetrometer is graduated with parts
Fig. 3 Schematic of the miniature CIGMATpenetrometer.
50 mm (dia.) x 100 mm (height) cylindrical plasticmold and wires were embedded in the mold forelectrical properties measurement. The prepared 10 %bentonite ultra-soft soil has acceptable shear strength,therefore; it was selected to be treated individuallywith lime and polymer.
3.2. LIME
In this study, hydrated lime was used to treat thesoil. When quicklime reacts with water, it transformsinto hydrated lime as follows:
CHARACTERIZATION AND FINITE ELEMENT ANALYSIS OF LIME AND POLYMER … .
75
R
R
Δρ Δρ
= (4)
3.7. FINITE ELEMENT MODELING
An elasto-plastic Mohr-Coulomb model wasselected to represent the non-linear behavior of ultra-soft soils in this study. Limiting states of stress aredescribed by means of the undrained shear strengthof the ultra-soft soil. The initial stresses in the caseof ultra-soft soil were generated using Jaky’sformula which gives the at rest earth pressurecoefficient Ko = 1- sinφ where φ is the friction angle interms of effective stress.
4. COMPARISON OF CORRELATIONS
PREDICATION
In order to determine the accuracy of thecorrelations developed in this study, both coefficientof determination (R2) and the root mean square error(RMSE) were used and defined in Eqs. (5) and (6) asfollows:
( )( )( ) ( )
2
2
2 2
i ii
i ii i
x x y yR
x x y y
− − = − −
(5)
( )2
1
n
i iiy x
RMSEN
=−
= (6)
where yi is the actual value; xi is the calculated valuefrom the model; y is the mean of actual values; x is
the mean of the predicted values and N is the numberof data points.
5. RESULTS AND DISCUSSION
5.1. MINIATURE CIGMAT PENETROMETER
Shear strength versus penetration
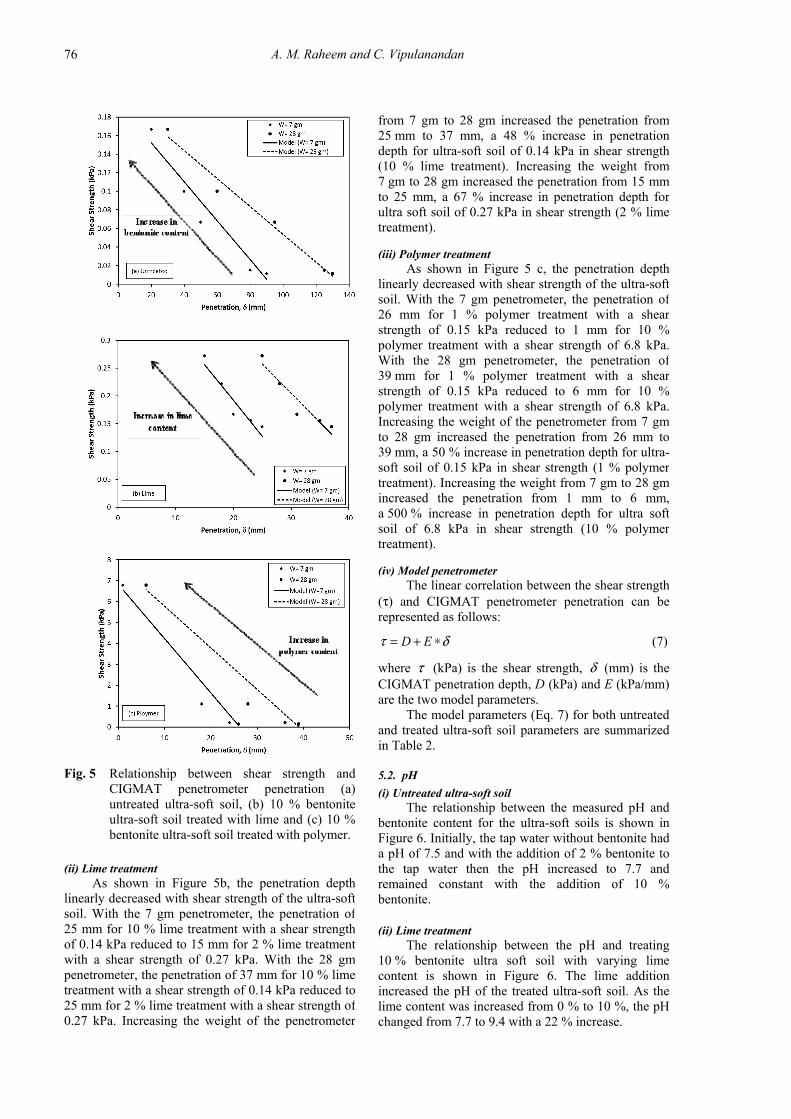
(i) Untreated ultra-soft soil As shown in Figure 5a, the penetration depth
linearly decreased with shear strength of the ultra-softsoil. With the 7 gm penetrometer, the penetration of80 mm for 2 % bentonite with a shear strength of0.02 kPa reduced to 20 mm for 10 % bentonite witha shear strength of 0.17 kPa. With the 28 gmpenetrometer, the penetration of 130 mm for 2 %bentonite with a shear strength of 0.02 kPa reduced to35 mm for 10 % bentonite with a shear strength of0.17 kPa. Increasing the weight of the penetrometerfrom 7 gm to 28 gm increased the penetration from80 mm to 130 mm, a 63 % increase in penetrationdepth for ultra-soft soil of 0.02 kPa in shear strength(2 % bentonite content). Increasing the weight from7 gm to 28 gm increased the penetration from 20 mmto 35 mm, a 75 % increase in penetration depth forultra soft soil of 0.17 kPa in shear strength (10 %bentonite content).
of millimeter to read the penetration accurately. Thetip has a triangular shape to facilitate the penetrationprocess.
3.5. pH METHOD
In this study, pH for both untreated and treatedbentonite ultra-soft soil was measured. pH probe wasimmersed in the untreated and treated ultra-soft soiland reading was taken after 5 minutes and all the testswere performed at room temperature. The pH can beused as an indication for chemical changes as differentmaterials are added to the ultra-soft soil. It isnecessary to perform pH measurement before andafter the treatment process since the pH method can beused as a non-destructive chemical monitoringtechnique.
3.6. ELECTRICAL RESISTIVITY
The untreated and treated ultra-soft soils wereprepared in a 50 mm (dia.) x 100 mm (height)cylindrical plastic molds with two embedded wires ineach mold to measure the electrical resistance usingthe AC measurement at the highest frequency of300 kHz for the ultra-soft soil with different bentonitecontents. Figure 4 shows the plastic moldconfiguration with the two embedded wires for theelectrical property measurement.
The resistivity of the ultra-soft soil wasmeasured using the conductivity meter and with themeasured bulk resistance (Rb) at high frequency,a calibration factor was quantified, which could beused for measuring the changes in the electricalresistivity for the ultra-soft soil.
The following relationship was used todetermine the calibration factor:
bR k ρ= ∗ (3)
where: Rb is the bulk resistance which was measuredusing the LCR device, r is the electrical resistivitywhich measured using the conductivity meter, k is thecalibration factor.
Hence, the change in the relative resistivity(Δρ/ρ) can be related to the change in the resistanceas follows:
Fig. 4 Plastic mold configuration.
A. M. Raheem and C. Vipulanandan
76
Fig. 5 Relationship between shear strength andCIGMAT penetrometer penetration (a)untreated ultra-soft soil, (b) 10 % bentoniteultra-soft soil treated with lime and (c) 10 %bentonite ultra-soft soil treated with polymer.
from 7 gm to 28 gm increased the penetration from25 mm to 37 mm, a 48 % increase in penetrationdepth for ultra-soft soil of 0.14 kPa in shear strength(10 % lime treatment). Increasing the weight from7 gm to 28 gm increased the penetration from 15 mmto 25 mm, a 67 % increase in penetration depth forultra soft soil of 0.27 kPa in shear strength (2 % limetreatment).
(iii) Polymer treatment
As shown in Figure 5 c, the penetration depthlinearly decreased with shear strength of the ultra-softsoil. With the 7 gm penetrometer, the penetration of26 mm for 1 % polymer treatment with a shearstrength of 0.15 kPa reduced to 1 mm for 10 %polymer treatment with a shear strength of 6.8 kPa.With the 28 gm penetrometer, the penetration of39 mm for 1 % polymer treatment with a shearstrength of 0.15 kPa reduced to 6 mm for 10 %polymer treatment with a shear strength of 6.8 kPa.Increasing the weight of the penetrometer from 7 gmto 28 gm increased the penetration from 26 mm to39 mm, a 50 % increase in penetration depth for ultra-soft soil of 0.15 kPa in shear strength (1 % polymertreatment). Increasing the weight from 7 gm to 28 gmincreased the penetration from 1 mm to 6 mm,a 500 % increase in penetration depth for ultra softsoil of 6.8 kPa in shear strength (10 % polymertreatment).
(iv) Model penetrometer
The linear correlation between the shear strength(τ) and CIGMAT penetrometer penetration can berepresented as follows:
D Eτ δ= + ∗ (7)
where τ (kPa) is the shear strength, δ (mm) is theCIGMAT penetration depth, D (kPa) and E (kPa/mm)are the two model parameters.
The model parameters (Eq. 7) for both untreatedand treated ultra-soft soil parameters are summarizedin Table 2.
5.2. pH
(i) Untreated ultra-soft soil The relationship between the measured pH and
bentonite content for the ultra-soft soils is shown inFigure 6. Initially, the tap water without bentonite hada pH of 7.5 and with the addition of 2 % bentonite tothe tap water then the pH increased to 7.7 andremained constant with the addition of 10 %bentonite.
(ii) Lime treatment
The relationship between the pH and treating10 % bentonite ultra soft soil with varying limecontent is shown in Figure 6. The lime additionincreased the pH of the treated ultra-soft soil. As thelime content was increased from 0 % to 10 %, the pHchanged from 7.7 to 9.4 with a 22 % increase.
(ii) Lime treatment As shown in Figure 5b, the penetration depth
linearly decreased with shear strength of the ultra-softsoil. With the 7 gm penetrometer, the penetration of25 mm for 10 % lime treatment with a shear strengthof 0.14 kPa reduced to 15 mm for 2 % lime treatmentwith a shear strength of 0.27 kPa. With the 28 gmpenetrometer, the penetration of 37 mm for 10 % limetreatment with a shear strength of 0.14 kPa reduced to25 mm for 2 % lime treatment with a shear strength of0.27 kPa. Increasing the weight of the penetrometer
CHARACTERIZATION AND FINITE ELEMENT ANALYSIS OF LIME AND POLYMER … .
77
Table 2 Correlation of shear strength parameters for untreated and treated ultra-soft soil.
CIGMAT penetrometer weight (gm) D (kPa) E (kPa/mm) R2 RMSE (kPa) Untreated ultra-soft soil
Fig. 6 Variation of pH with modifier content (limeand polymer) for 10 % bentonite ultra-soft soil(bars represent the standard deviation).
(iii) Polymer treatment
The relationship between the pH and treating10 % bentonite ultra soft soil with varying polymercontent is shown in Figure 6. The polymer additionincreased the pH of the treated ultra-soft soil. As thepolymer content was increased from 0 % to 10 %, thepH changed from 7.7 to 10.4 with a 3 5% increase.
5.3. ELECTRICAL RESISTIVITY
Electrical resistivity versus solid content (i) Untreated ultra-soft soil
The variation of the electrical resistivity withbentonite content for the untreated ultra-soft soil isshown in Figure 7a. In the untreated ultra-soft soil, theelectrical impedance decreased when the frequencywas increased. Thus, all the bulk resistance wasmeasured at high frequency (300 kHz). As thebentonite content was increased, the electricalresistivity decreased due to the increase in theconductivity of the medium. As the bentonite contentwas increased from 2 % to 10 %, the relative electricalresistivity (Δρ/ρ) decreased by 246 %.
(ii) Lime treatment The variation of the electrical resistivity with
lime content for the lime treated ultra-soft soil isshown in Figure 7b. As the lime content wasincreased, the electrical resistivity decreased due tothe increase in the conductivity of the medium. As thelime content was increased from 2 % to 10 %, therelative electrical resistivity (Δρ/ρ) decreased by171 %. In the lime treated ultra-soft soil, increasingthe lime content had decreased the impedance of thetreated ultra-soft soil since the lime had the tendencyto increase the conductivity of the media content.
(iii) Polymer treatment
The variation of the electrical resistivity withpolymer content for the polymer treated ultra-soft soilis shown in Figure 7c. As the polymer content wasincreased, the electrical resistivity decreased due tothe increase in the conductivity of the medium. As thepolymer content was increased from 1 % to 10 %, therelative electrical resistivity (Δρ/ρ) decreased by545 %. In the polymer treated ultra-soft soil,increasing the polymer content had decreased theimpedance of the treated ultra-soft soil due to theincrease in the conductivi ty of the medium withhigher polymer content.
(iv) Modeling
Based on the experimental results, a power lawmodel was developed to predict the relationshipbetween the electrical resistivity and solid content foruntreated and treated ultra-soft soil as follows:
( )nmρ β= ∗ (8)
where ρ (Ohm.m) is the electrical resistivity, β (%)represent the bentonite content in the ultra-soft soiland modifier content for the treated 10 % bentonitesoft soils, m & n are model parameters.
A. M. Raheem and C. Vipulanandan
78
Fig. 7 Variation of electrical resistivity withbentonite and modifier contents (a) untreatedultra-soft soil, (b) 10 % bentonite ultra-softsoil treated with lime and (c) 10 % bentoniteultra-soft soil treated with polymer(barsrepresent the standard deviation).
Fig. 8 Variation of the shear strength with electricalresistivity (a) untreated ultra-soft soil, (b)treated 10% bentonite ultra-soft soil with limeand (c) treated 10% bentonite ultra-soft soilwith polymer(bars represent the standarddeviation).
The proposed model predicted the experimentaldata very well (Figure 7a-c). The model parameters(Eq. 8) for the untreated and treated ultra-soft soils aresummarized in Table 3. This correlation can be usedas a nondestructive measurement to obtain the solidcontent in the ultra-soft soil where the solid ormodifier content depends on the model parameters (mand n).
Shear strength versus electrical resistivity
(i) Untreated ultra-soft soil The variation of the shear strength with electrical
resistivity for untreated ultra-soft soils are shown inFigure 8a. As the electrical resistivity decreased, theshear strength of the untreated ultra-soft soil isincreased. As the shear strength for the untreatedultra-soft soil was increased from 0.011 kPa to0.17 kPa, the relative electrical resistivity (Δρ/ρ)decreased by 59 %.
CHARACTERIZATION AND FINITE ELEMENT ANALYSIS OF LIME AND POLYMER … .
79
Fig. 9 Variation of gravimetric water content withelectrical resistivity (a) untreated ultra-softsoil, (b) 10% bentonite ultra-soft soil treatedwith lime and (c) 10% bentonite ultra-softsoil treated with polymer(bars represent thestandard deviation).
(ii) Lime treatment The variation of the shear strength with electrical
resistivity for the 10 % bentonite ultra-soft soil treatedwith lime is shown in Figure 8b. As the electricalresistivity increased, the shear strength for the limetreated soft soil is increased. As the shear strength forlime treated soft soil increased from 0.14 kPa to0.27 kPa, the relative electrical resistivity (Δρ/ρ)increased by 51 %.
(iii) Polymer treatment The variation of the shear strength with electrical
resistivity for the 10 % bentonite ultra-soft soil treatedwith polymer is shown in Figure 8c. As the shearstrength the increased, the electrical resistivity for thepolymer treated soft soil decreased. As the shearstrength of polymer treated soft soil increased from0.045 kPa to 6.8 kPa, the relative electrical resistivity(Δρ/ρ) decreased by 77 %.
(iv) Modeling Untreated ultra-soft soil
Based on the experimental results, a power lawmodel is proposed to predict the relationship betweenthe shear strength (τ) and electrical resistivity for theuntreated ultra-soft soil as follows:
( ) pQτ ρ= ∗ (9)
where ρ is the electrical resistivity and Q & P are thetwo model parameters.
The proposed model predicted the experimentaldata very well. The untreated ultra-soft soilparameters (Eq. 9) are summarized in Table 4.
Lime treatment
Based on the experimental results, a linear modelis proposed to predict the relationship between theshear strength and electrical resistivity for the limetreated ultra-soft soil as follows:
G Hτ ρ= + ∗ (10)
where ρ is the electrical resistivity, G & H are the twomodel parameters.
The proposed model predicted the experimentaldata very well. The model parameters (Eq. 10) aresummarized in Table 4.
Polymer treatment
Based on the experimental results, a hyperbolicmodel is proposed to predict the relationship betweenthe shear strength and electrical resistivity for thepolymer treated ultra-soft soil as follows:
( )( )
00
0v w
ρ ρτ τ
ρ ρ−
− =+ ∗ −
(11)
where τo and ρo are initial shear strength and electricalresistivity of ultra-soft soil before treatment, ρ is theelectrical resistivity and V & W are the two modelparameters.
The proposed model predicted the experimentaldata very well. The model parameters (Eq. 11) aresummarized in Table 5.
Water content versus electrical resistivity
(i) Untreated ultra-soft soil The variation of the gravimetric water content
(percentage of water) with electrical resistivity for theuntreated ultra-soft soil is shown in Figure 9a. As thegravimetric water content increased, the electricalresistivity for the untreated ultra-soft soil is increased.
A. M. Raheem and C. Vipulanandan
80
Table 4 Resistivity-shear model parameters for untreated and lime treated ultra-soft soil.
Resistivity Q P R2 RMSE (kPa) Untreated ultra-soft soil 3.200 -3.280 0.94 0.0137 Lime treated ultra-soft soil (10 % bentonite) G H R2 RMSE (kPa) -0.044 0.472 0.92 0.0134
Table 5 Resistivity-shear model parameters for polymer treated ultra-soft soil.
Resistivity ro (Ohm.m) V W R2 RMSE (kPa) Polymer treated ultra-soft soil (10 % bentonite) 0.4 -0.005 -0.146 0.99 0.1133
Table 6 Gravimetric water content-resistivity model parameters for untreated and treated ultra-soft soil.
Table 7 Values of soil parameters used in FEM analyses.
Parameter Untreated ultra-soft soil Treated ultra-soft soil Unit weight, g (kN/m3) 011 011.5 Elastic modulus (kN/m2) 100 300 Shear strength (kN/m2) 000.17 006.8 Poisson’s ratio m 000.45 000.45 At rest earth pressure coefficient Ko 000.82 000.82
W X YC ρ= + ∗ (12)
where W/C (%) is the gravimetric water content, ρ isthe electrical resistivity, X & Y are the two modelparameters.
The proposed model predicted the experimentaldata very well. The model parameters (Eq. 12) forboth untreated and treated ultra-soft soil aresummarized in Table 6. This correlation can be alsoused as a nondestructive measurement to obtain thewater content in the ultra-soft soil where the watercontent in the ultra-soft soil depends on the modelparameters (X and Y).
5.4. FINITE ELEMENT MODELING
CIGMAT miniature penetrometer Values of soil parameters used in this
investigation are summarized in Table 7. Finiteelement modeling (FEM) was executed on theCIGMAT penetrometer using the 3-D axisymmetricanalyses. The FEM used 545 elements of 15-nodedtriangular elements with 975 nodes having an averageelement size of 0.42 mm to provide sufficientaccuracy in stress evaluation. The meshes werechosen to match the corresponding prototypegeometries in the experimental model test. Also, therewas a full fixed at the base of the geometry andsmooth conditions at the vertical sides. Loading wasapplied in very small increments up to the total load.
Shear strength-penetration relationship.
As the gravimetric water content for untreated ultra-soft soil increased from 90 % to 98 %, the relativeelectrical resistivity (Δρ/ρ) increased by 145 %.
(ii) Lime treatment
The variation of the gravimetric water content(percentage of water) with electrical resistivity for the10 % bentonite ultra-soft soil treated with lime isshown in Figure 9b. As the gravimetric water contentfor the lime treated soft soil increased, the electricalresistivity also increased. As the gravimetric watercontent for the lime treated soft soil was increasedfrom 80 % to 88 %, the relative electrical resistivity(Δρ/ρ) increased by 71 %.
(iii) Polymer treatment
The variation of the gravimetric water content(percentage of water) with electrical resistivity for the10 % bentonite ultra-soft soil treated with polymer isshown in Figure 9c. As the gravimetric water contentfor the polymer treated soft soil increased, theelectrical resistivity also increased. As the gravimetricwater content for polymer treated soft soil wasincreased from 80 % to 90 %, the relative electricalresistivity (Δρ/ρ) increased by 540 %.
(iv) Modeling
Based on the experimental results, a linear modelis proposed to predict the relationship between thegravimetric water content (percentage of water) andthe electrical resistivity for untreated and treated ultra-soft soil as follows:
CHARACTERIZATION AND FINITE ELEMENT ANALYSIS OF LIME AND POLYMER … .
81
Fig. 10 Comparing the predicted (FEM) and experimental CIGMAT miniature penetrometer penetration (a)
untreated ultra-soft soil (b) 10 % bentonite ultra-soft soil treated with lime, and (c) 10 % bentonite ultra-soft soil treated with polymer.
28 gm CIGMAT penetrometers respectively. The R2
and RMSE for the treated ultra-soft soil with limewere 0.63 and 2.1 mm, 0.87 and 1.5 mm for 7 gm and28 gm CIGMAT penetrometer respectively. The R2
and RMSE for treating ultra-soft soil with polymerwere 0.96 and 1.9 mm, 0.95 and 2.9 mm for 7 gm and28 gm CIGMAT penetrometer respectively.
Finite element modeling of shear strength versusCIGMAT penetration for the untreated and treatedultra-soft soils with lime and polymer are shown inFigure 10a-c. The numerical modeling agreed with theexperimental data for untreated and treated ultra-softsoils. The R2 and RMSE for untreated ultra-soft soilwere 0.95 and 5.9 mm, 0.97 and 6.7 mm for 7 gm and
A. M. Raheem and C. Vipulanandan
82
Geotechnical and Geological Engineering, 10, No. 2,117–134. DOI: 10.1007/BF00881147
Anggraini, V., Asadi, A., Huat, B.B.K. and Nahazanan, H.:2015, Performance of chemically treated natural fibresand lime in soft soil for the utilisation as pile-supported earth platform. International Journal ofGeosynthetics and Ground Engineering, 1, 28. DOI 10.1007/s40891-015-0031-5
Bo, M.W., Choa, V. and Wong, K.S.: 2010, Constant rate ofloading test on ultra-soft soil. Geotechnical TestingJournal, 33, No. 3, 192–200.
Casagrande, A.: 1958, Notes on the design of the liquidlimit device. Geotechnique, 8(2), 84–91. DOI: 10.1680/geot.1958.8.2.84
De Meyer, C.P. and Mahlerbe, B.: 1987, Optimisation ofmaintenance dredging operations in maritime andestuarine areas. Terra et Aqua, 35, 25–39.
De Jong, J., Yafrate, N. and De Groot, D.: 2011, Evaluationof undrained shear strength using full-flowpenetrometers. Journal of Geotechnical andGeoenvironmental Engineering, 137, No. 1, 14–26.DOI: 10.1061/(ASCE)GT.1943-5606.0000393
Hasan, M. and Samadhiya, N.K.: 2016, Experimental andnumerical analysis of geosynthetic-reinforced floatinggranular piles in soft clays. International Journal ofGeosynthetics and Ground Engineering, 2, No. 3,Article Number 22. DOI 10.1007/s40891-016-0062-6
Hawkins, R.A. and Markus, A.: 1998, New development inoffshore geotechnical investigations. ProceedingInternational Conference Offshore Site Investigationsand Foundation Behavior, SUT, London, 259–276.
Hebib, S. and Farrell, E.R.: 2003, Some experiences on thestabilization of Irish peats. Canadian GeotechnicalJournal, 40, No. 1, 107–120. DOI: 10.1139/T02-091
Johnson, G.W., Hamilton, T.W., Ebelhar, R.J., Mueller, J.L.and Pelletier, J.H.: 1988, Comparison of in situ vane,cone penetrometer and laboratory test results for Gulfof Mexico deepwater clays. Vane Shear StrengthTesting of Soils, Field and Laboratory Studies, ASTMSTP 1014, 293–305. DOI: 10.1520/STP10337S
Kaya, A. and Fang, H.Y.: 1997, Identification ofcontaminated soils by dielectric constant and electricalconductivity. Journal of Environmental Engineering-ASCE, 123, No. 2, 169–177. DOI: 10.1061/(ASCE)0733-9372(1997)123:2(169)
Low, H.E., Lunne, T., Andersen, K.H., Sjursen, M.A., Li, X.and Randolph, M.F.: 2010, Estimation of intactundrained shear strength from penetration tests in softclays. Geotechnique, 60, No.11, 843–859. DOI: 10.1680/geot.9.P.017
Lunne, T.: 2001, In situ testing in offshore geotechnicalinvestigations. Proceeding International Conferenceon In Situ Measurement of Soil Properties and CaseHistories, Bali, 61–81.
Muntohar, A.S.: 2004, Uses of RHA to enhanced lime-stabilized clay soil. International Conference onGeotechnical Engineering, Sharjah, UAE, 356–357.
Nader, A., Fall, M. and Hache, R.: 2015, Characterization ofsensitive marine clays by using cone and ball
6. CONCLUSION
In this study, lime and polymer treated ultra-softsoils were characterized using both electricalresistivity and CIGMAT miniature penetrometer.Based on the experimental and analytical studies, thefollowing conclusions are advanced: 4. Miniature CIGMAT penetrometer can be used as
an in-situ instrument to measure the shearstrength of the ultra-soft soil since thepenetrometer penetration is linearly correlated tothe shear strength of the untreated and treatedultra-soft soils.
5. Untreated ultra-soft soil with different bentonitecontent was independent on pH. However, ultra-soft soil treated with lime or polymer was shownan increase in the pH as the treated agentincreased. For the treated ultra-soft soil, thepolymer has shown more increase in the pH incomparison with the lime.
6. The electrical resistivity for the untreated andtreated ultra-soft soils are nonlinearly functionand inversely dependent on the bentonite, limeand polymer content where the electricalresistivity can be used as a nondestructiveapproach to investigate the material type andcontent.
7. The electrical resistivity can be used to measurethe shear strength of the untreated and treatedultra-soft soils nondestructively. The untreatedultra-soft soil exhibited a nonlinear inverserelationship for the electrical resistivity with theshear strength. However, the lime-treated ultra-soft soil adopted a linear increase of the electricalresistivity with the shear strength. In contrary tothe lime treated ultra-soft soil, the polymer-treated ultra-soft soil maintained a nonlinearhyperbolic inverse relationship for the electricalresistivity with the shear strength.
8. The electrical resistivity can be used to evaluatethe gravimetric water content of the untreated andtreated ultra-soft soils indirectly. A linear inverserelationship for the electrical resistivity withgravimetric water content for both untreated andtreated ultra-soft soil is observed.
9. Miniature CIGMAT penetrometer penetrationsinto untreated and treated ultra-soft soils weremodelled using the finite element method (FEM).FEM prediction of penetration in various ultra-soft soils agreed well with the experimentalresults.
ACKNOWLEDGMENT
This study was supported by the Center forInnovative Grouting Materials and Technology(CIGMAT), University of Houston, Houston, Texas.
REFERENCES
Ali, F.H., Adnan, A. and Choy, C.K.: 1992, Geotechnicalproperties of a chemically stabilized soil fromMalaysia with rice husk ash as an additive.
CHARACTERIZATION AND FINITE ELEMENT ANALYSIS OF LIME AND POLYMER … .
83
Stewart, D. and Randolph, M.: 2001, A new siteinvestigation tool for the centrifuge. In Proceedings ofthe international conference modeling, Balkema Pub,The Netherlands, 531–538.
The, C.I. and Houlsby, G.T.: 1991, An analytical study ofthe cone penetration test in clay. Geotechnique, 41,No. 1, 17–34. DOI: 10.1680/geot.1991.41.1.17
Vipulanandan, C. and Prashanth, P.: 2013, Impedancespectroscopy characterization of a piezoresistivestructural polymer composite bulk sensor. Journal ofTesting and Evaluation, 41, No. 6, 898–904. DOI: 10.1520/JTE20120249
Vipulanandan, C., and Raheem, A.M.: 2015, Characterizingultra-soft soils and anchor-soil interaction fordeepwater applications, Proceedings of the Twenty-fifth International Ocean and Polar EngineeringConference Kona, Big Island, Hawaii, USA, June 21-26, 1048–1054.
Wroth, C.P. and Wood, D.M.: 1978, The correlation ofindex properties with some basic engineeringproperties of soils. Canadian Geotechnical Journal, 15,No. 2, 137–145. DOI: 10.1139/t78-014
Young, A.G., McClelland, B. and Quiros, G.W.: 1988, Insitu vane testing at sea, Vane shear Strength Testing ofSoils: Field and Laboratory Studies. ASTM STP 1014,46–67. DOI: 10.1520/STP10321S
Youseff, M.S, El Ramli, A.H. and El Demery, M.: 1965,Relationships between shear strength, consolidation,liquid limit, and plastic limit for remoulded clays.Proceedings 6th international conference on soilmechanics and foundation engineering, 1. Montreal,126–129.
penetrometers: example of clays in eastern Canada.Geotechnical and Geological Engineering, 33, No. 4,841–864. DOI: 10.1007/s10706-015-9864-x
Nagaraj Hone, B., Sridharan, A. and Mallikarjuna, H.M.:2012, Re-examination of undrained strength atAtterberg limits water contents. Geotechnical andGeological Engineering, 30, No. 4, 727–736. DOI:10.1007/s10706-011-9489-7
Norman, L.E.J.: 1958, A comparison of values of liquidlimit determined with apparatus having bases ofdifferent hardness. Géotechnique, 8(2), 79–83. DOI: 10.1680/geot.1958.8.2.79
Pourakbar, S., Huat, B.B.K., Asadi, A. and Fasihnikoutalab,M.H.: 2016, Model study of alkali-activated wastebinder for soil stabilization. International Journal ofGeosynthetics and Ground Engineering, 2, No. 4,Article number 35. DOI 10.1007/s40891-016-0075-1
Rad, N. and Lunne, T.: 1986, Correlations betweenpiezocone results and laboratory soil properties.Norwegian Geotechnical Institute, Oslo.
Raheem, A.M., Vipulanandan. C. and Joshaghani, M.S.:2017, Non-destructive experimental testing andmodeling of electrical impedance behavior ofuntreated and treated ultra-soft clayey soils. Journal ofRock Mechanics and Geotechnical Engineering, 9,No. 3, 543–550. DOI: 10.1016/j.jrmge.2017.02.001
Robain, H., Camerlynck, C., Bellier, C. and Tabbagh, A.:2003, Laboratory measurements of electricalresistivity versus water content on small soil cores.Geophysical Research Abstracts, 5, 03830.
Siddiqui, F.I. and Osman, S.: 2012, Integrating geo-electrical and geotechnical data for soilcharacterization. International Journal of AppliedPhysics and Mathematics, 2, No. 2, 104–106. DOI: 10.7763/IJAPM.2012.V2.63
Skemption, A.W. and Northey, R.D.: 1952, The sensitivityof clays. Geotechnique, 3, No. 1, 30–53. DOI: 10.1680/geot.1952.3.1.30