Characterization of Divalent Cation Localization in the Minor Groove of the AnTn
and TnAn DNA Sequence Elements by1H NMR Spectroscopy and Manganese(II)†
Nicholas V. Hud‡ and Juli Feigon*
Department of Chemistry and Biochemistry and Molecular Biology Institute, UniVersity of California, 405 Hilgard AVenue,Los Angeles, California 90095-1569
ReceiVed February 22, 2002; ReVised Manuscript ReceiVed May 29, 2002
ABSTRACT: The localization of Mn2+ in A-tract DNA has been studied by1H NMR spectroscopy using aseries of self-complementary dodecamer oligonucleotides that contain the sequence motifs AnTn and TnAn,wheren ) 2, 3, or 4. Mn2+ localization in the minor groove is observed for all the sequences that havebeen studied, with the position and degree of localization being highly sequence-dependent. The sitemost favored for Mn2+ localization in the minor groove is near the 5′-most ApA step for both the TnAn
and the AnTn series. For the TnAn series, this results in two closely spaced symmetry-related Mn2+
localization sites near the center of each duplex, while for the AnTn series, the two symmetry-related sitesare separated by as much as one half-helical turn. The degree of Mn2+ localization in the minor grooveof the TnAn series decreases substantially as the AT sequence element is shortened from T4A4 to T2A2.The AnTn series also exhibits length-dependent Mn2+ localization; however, the degree of minor grooveoccupancy by Mn2+ is significantly less than that observed for the TnAn series. For both AnTn and TnAn
sequences, the 3′-most AH2 resonance is the least broadened of the AH2 resonances. This is consistentwith the observation that the minor groove of A-tract DNA narrows in the 5′ to 3′ direction, apparentlybecoming too narrow after two base pairs for the entry of a fully hydrated divalent cation. The results thatare reported illustrate the delicate interplay that exists between DNA nucleotide sequence, minor groovewidth, and divalent cation localization. The proposed role of cation localization in helical axis bendingby A-tracts is also discussed.
During the past several years, experimental and theoreticalstudies have provided evidence that cation interaction withduplex DNA is a sequence-specific phenomenon (1-14).This has important implications for the origin of DNA struc-ture and function. For example, the sequence-specific local-ization of cations would necessarily result in a nonuniformdistribution of cations around duplex DNA polymers. Thismay in turn be the origin of local variations in DNA structure(e.g., groove narrowing and helical axis bending) (4-7, 15,16). Furthermore, protein binding to DNA is often coupledwith the release of cations from DNA (17). Thus, the se-quence-specific binding of some proteins to DNA could bepartially driven by the release of cations from specific DNAsequences. Despite the clear importance of DNA-cationinteractions, the sequence-specific nature of monovalent anddivalent cation binding to DNA is not fully characterized.
Divalent cation binding sites in the major groove arepresently the most extensively studied class of DNA-counterion interactions (14). Using the paramagnetic ionMn2+ as a resonance line broadening probe in solution state1H NMR spectroscopy experiments, Sletten and co-workers
found that Mn2+ binds in the major groove of duplex DNAat GpG, GpA, and GpT steps (1-3). Crystallographic studieshave also revealed divalent cations bound at these same steps,and at the ApG step as well (13, 18). The divalent cationbinding sites in the DNA major groove appear to beprincipally defined at the dinucleotide level, with an absoluterequirement for at least one guanine base (i.e., GpN or NpG).
In previous reports, we demonstrated that AT-rich se-quences can also localize monovalent and divalent cationsin a sequence-specific manner in theminor groove (5, 7).With respect to divalent cations, we found that Mn2+ islocalized in the minor groove of the sequence elements A4T4
and T4A4 in the dodecamer duplexes [d(GCA4T4GC)]2 and[d(CGT4A4CG)]2, respectively. Our initial motivation toexplore cation interaction with AT-rich sequences was toexperimentally test our hypothesis that cation interaction withDNA A-tracts (i.e., four to eight adenine or thymine residueswithout a 5′-TpA-3′ step) could be the origin of theanomalous structural properties associated with A-tract DNA(19-22). The sequences [d(GCA4T4GC)]2 and [d(CGT4A4-CG)]2 were selected for study because DNA polymerscontaining the sequence element A4T4 exhibit propertiesassociated with A-tracts, whereas those containing T4A4 donot (20, 23, 24).
Here we report a more in-depth analysis of Mn2+ localiza-tion in the minor groove of the sequence elements A4T4 andT4A4, along with the closely related sequence elements A3T3,T3A3, A2T2, and T2A2. All of these sequence elements are
† Supported by Grant GM48123 from the National Institutes ofHealth to J.F.
* To whom correspondence should be addressed. Telephone: (310)206-6922. Fax: (310) 825-0982. E-mail: [email protected].
‡ Present address: School of Chemistry and Biochemistry, GeorgiaInstitute of Technology, Atlanta, GA 30332. Telephone: (404) 385-1162. Fax: (404) 894-2295. E-mail: [email protected].
within dodecamer duplexes and flanked by G‚C base pairs.This study reveals that divalent cation localization in theminor groove of AT-rich sequences can be modulated bybase pair changes up to three residues away from the cationlocalization site, changes that likely affect both the widthand electrostatic potential of the minor groove. In contrastto the purely AT regions, no appreciable localization of Mn2+
in the minor groove is observed in the GC regions of theduplexes that have been studied. The results presented hereprovide a framework for understanding, and potentiallypredicting, divalent cation localization in the DNA minorgroove in the solution state.
MATERIALS AND METHODS
Sample Preparation.DNA oligonucleotides were synthe-sized using standard phosphoramidite chemistry on an Ap-plied Biosystems 392 automated DNA synthesizer. After de-protection in aqueous ammonium hydroxide, oligonucleotideswere purified of premature termination products by beingpassed over a 1 mcolumn of Sephadex G-25 resin (Sigma,St. Louis, MO). Following lyophilization, samples wereresuspended and brought to pH 6.0 by titration with 0.5 MNaOH. NMR samples were 450µL in volume, 2.0 mMoligonucleotide strand, and 50 mM NaCl in 99.999% D2O.
NMR Data Collection. All 1H spectra were acquired on aBruker DRX 500 instrument at 500 MHz and 283 K. Mn2+
titrations were performed by the addition of 1-4 µL ofMnCl2 stock solutions in D2O. Sample volumes weremaintained within approximately 2% of 450µL over theentire course of a titration by reducing the sample volume,when necessary, with limited drying under nitrogen gas. 1D1
1H spectra were collected with 8192 points and a sweep withof 5000 Hz. 2D NOESY spectra were collected with 2048points in F2 and 512 blocks inF1, with a sweep width of5000 Hz in both dimensions.
Data Analysis. Aromatic and deoxyribose protons wereassigned from 2D NOESY spectra using standard sequentialconnectivity assignment procedures (25). Line widths of mostAH2 proton resonances were determined by fitting a Lorent-zian line function to the 1D data processed with 16K pointsand no FID apodization. The linear dependence of AH2resonance line widths on the amount of added MnCl2, from0.25 to 3.0µM MnCl2, was used to determine the sensitivityof most AH2 resonances to line broadening by Mn2+ in unitsof hertz per micromolar (Hz/µM) MnCl2. Line widths forthe H1′ and H4′ proton resonances, and overlapped AH2resonances, as a function of the amount of added MnCl2 weredetermined in the direct dimension at half-height from cross-peaks of each resonance in 2D NOESY spectra processedwith 8192 points inF2 and 1024 points inF1. 2D spectraused for measurements of Mn2+-induced line broadeningwere from samples containing 0.7, 1.5, 3.0, and 5.0µMMnCl2. Line widths for resonances in the absence ofparamagnetic broadening were measured from a spectrumof each sample in the presence of 0.1 mM EDTA.
RESULTS
Mn2+ Broadening of T4A4 Minor GrooVe 1H Resonances.The aromatic regions of two 1D1H spectra from a MnCl2
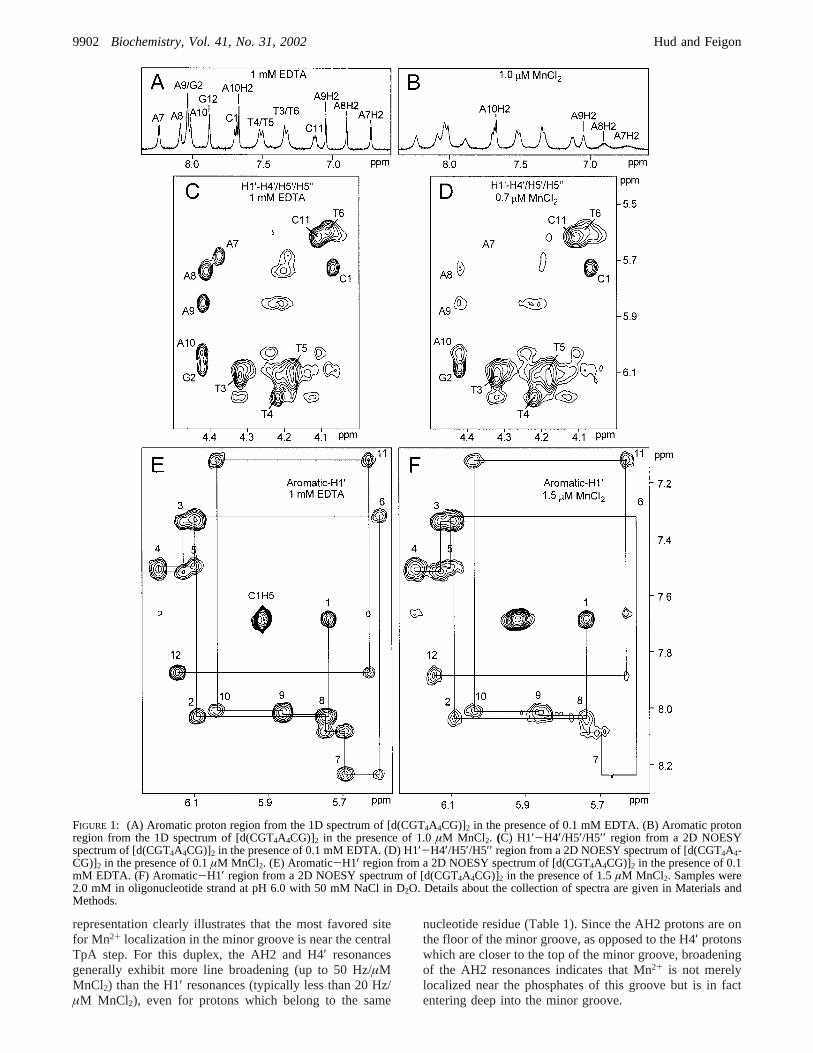
titration of the duplex [d(CGT4A4CG)]2 (T4A4) are presentedin Figure 1. A comparison of these two spectra reveals thatthe A7H2 proton ofT4A4 is the aromatic proton mostsensitive to resonance line broadening by Mn2+. The AH2proton is in the minor groove, while the other aromaticprotons (i.e., AH8, GH8, CH6, and TH6) are in the majorgroove. The dramatic line broadening of the A7H2 resonanceindicates thatT4A4 possesses a preferential site for Mn2+
localization in the minor groove. The differential broadeningof the four AH2 resonances ofT4A4 (i.e., A7H2, A8H2,A9H2, and A10H2) also indicates that Mn2+ localization isnot uniform over the length of the T4A4 sequence element(Figure 1A,B).
The deoxyribose H1′ and H4′ proton resonances provideadditional information concerning the localization of Mn2+
in the minor groove. These resonances are particularlyvaluable for monitoring Mn2+ localization in regions thatcontain only G‚C base pairs, since this base pair lacksnonexchangeable base protons in the minor groove. However,spectral overlap makes it difficult to extract resonance linebroadening information from 1D spectra for most H1′ andH4′ protons (and some AH2 resonances). Therefore, theresonance line broadening of these protons was determinedby the analysis of cross-peaks in 2D NOESY spectra (Figure1C-F). The nonuniform broadening exhibited by the H8/H6-H1′ and H1′-H4′ NOE cross-peaks also supports thepreferential localization of Mn2+ in the minor groove of theT4A4 duplex. We note that the H1′ resonances are less linebroadened by Mn2+ than the H4′ resonances; therefore, H4′resonance line widths were measured using H1′-H4′ cross-peaks. Likewise, the aromatic H8/H6 resonances are less linebroadened by Mn2+ than the H1′ resonances; therefore, theH8/H6-H1′ cross-peaks were used for the measurement ofH1′ line widths.
Broadening of theT4A4 AH2 resonances can be detectedfor a MnCl2 concentration more than 3 orders of magnitudelower than the oligonucleotide concentration, which indicatesthat Mn2+ is in fast exchange between the DNA duplexesand solution. Increasing the concentration of MnCl2 producesa linear increase in the line width of theT4A4 resonances(Figure 2). Thus, the change in line width of a protonresonance as a function of increased MnCl2 concentration isdirectly proportional to Mn2+ occupancy at the binding site.By measurement of the line width of the AH2, H1′, and H4′resonances at a number of different MnCl2 concentrations(from 0.3 to 5.0µM MnCl2), it is possible to compare therelative amount of line broadening in units of hertz permicromolar MnCl2 for proton resonances that exhibit a widerange of sensitivity to the presence of Mn2+, both for differentprotons within a single duplex and for corresponding protonsof different sequences (Table 1). No appreciable changes inchemical shift accompanied resonance line broadening byMnCl2 for any of the protons monitored in this study.
A model of theT4A4 duplex is shown in Figure 3 withvan der Waals radius spheres representing the AH2, H1′,and H4′ protons, with sphere color indicating the amount ofresonance line broadening by Mn2+ in Hz/µM MnCl2. This
Mn2+ Localization in the Minor Groove of A-Tract DNA Biochemistry, Vol. 41, No. 31, 20029901
representation clearly illustrates that the most favored sitefor Mn2+ localization in the minor groove is near the centralTpA step. For this duplex, the AH2 and H4′ resonancesgenerally exhibit more line broadening (up to 50 Hz/µMMnCl2) than the H1′ resonances (typically less than 20 Hz/µM MnCl2), even for protons which belong to the same
nucleotide residue (Table 1). Since the AH2 protons are onthe floor of the minor groove, as opposed to the H4′ protonswhich are closer to the top of the minor groove, broadeningof the AH2 resonances indicates that Mn2+ is not merelylocalized near the phosphates of this groove but is in factentering deep into the minor groove.
FIGURE 1: (A) Aromatic proton region from the 1D spectrum of [d(CGT4A4CG)]2 in the presence of 0.1 mM EDTA. (B) Aromatic protonregion from the 1D spectrum of [d(CGT4A4CG)]2 in the presence of 1.0µM MnCl2. (C) H1′-H4′/H5′/H5′′ region from a 2D NOESYspectrum of [d(CGT4A4CG)]2 in the presence of 0.1 mM EDTA. (D) H1′-H4′/H5′/H5′′ region from a 2D NOESY spectrum of [d(CGT4A4-CG)]2 in the presence of 0.1µM MnCl2. (E) Aromatic-H1′ region from a 2D NOESY spectrum of [d(CGT4A4CG)]2 in the presence of 0.1mM EDTA. (F) Aromatic-H1′ region from a 2D NOESY spectrum of [d(CGT4A4CG)]2 in the presence of 1.5µM MnCl2. Samples were2.0 mM in oligonucleotide strand at pH 6.0 with 50 mM NaCl in D2O. Details about the collection of spectra are given in Materials andMethods.
9902 Biochemistry, Vol. 41, No. 31, 2002 Hud and Feigon
The position of a cation binding site on a macromoleculecan, in principle, be precisely determined by comparing therelative resonance line broadening of three or more nucleiby a paramagnetic ion (26). However, this requires that thecontributions of dipolar and scalar coupling to resonance linebroadening by the paramagnetic ion be well understood. Thisis difficult for investigations that utilize Mn2+, since bothscalar and dipolar coupling can contribute to resonance linebroadening and their relative contributions can depend onseveral factors (27). Furthermore, the precise localization ofa cation binding site requires that nuclei used in thisdetermination be sufficiently isolated from the resonance linebroadening effects of paramagnetic ions bound at other sites,a criterion that is typically not satisfied for nucleic acids andis definitely not for the molecules of this study (vide infra).This notwithstanding, the resonance line broadenings of
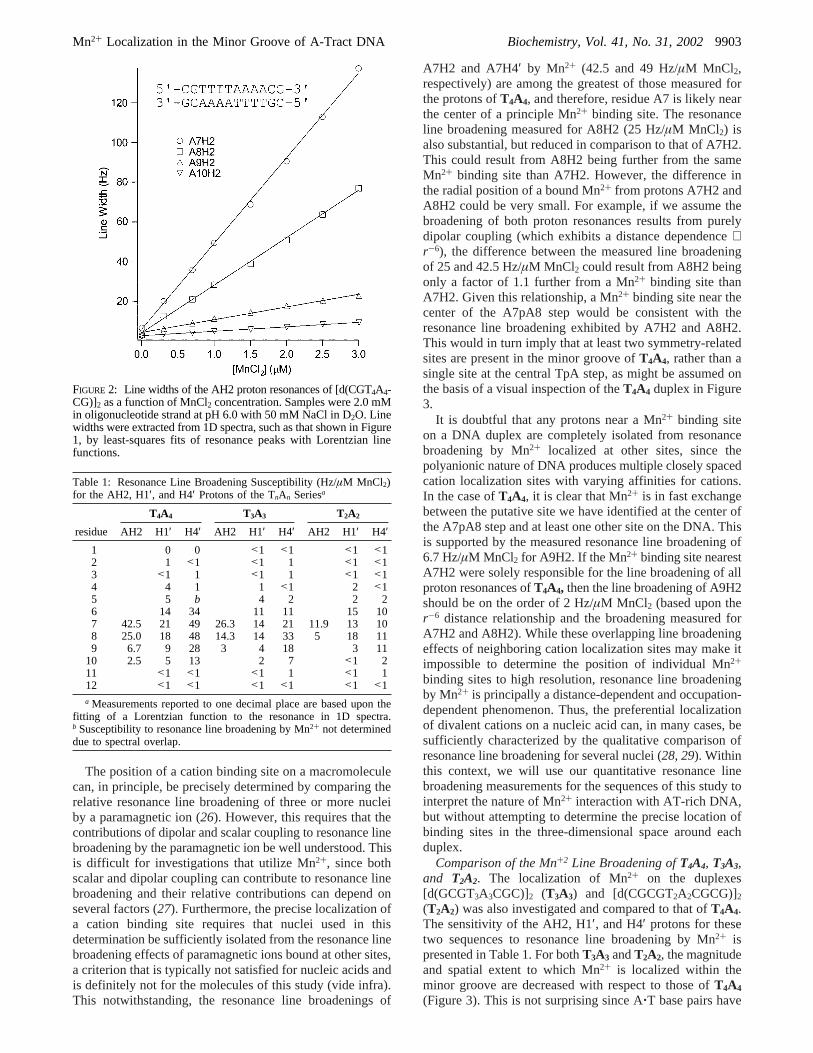
A7H2 and A7H4′ by Mn2+ (42.5 and 49 Hz/µM MnCl2,respectively) are among the greatest of those measured forthe protons ofT4A4, and therefore, residue A7 is likely nearthe center of a principle Mn2+ binding site. The resonanceline broadening measured for A8H2 (25 Hz/µM MnCl2) isalso substantial, but reduced in comparison to that of A7H2.This could result from A8H2 being further from the sameMn2+ binding site than A7H2. However, the difference inthe radial position of a bound Mn2+ from protons A7H2 andA8H2 could be very small. For example, if we assume thebroadening of both proton resonances results from purelydipolar coupling (which exhibits a distance dependence∝r-6), the difference between the measured line broadeningof 25 and 42.5 Hz/µM MnCl2 could result from A8H2 beingonly a factor of 1.1 further from a Mn2+ binding site thanA7H2. Given this relationship, a Mn2+ binding site near thecenter of the A7pA8 step would be consistent with theresonance line broadening exhibited by A7H2 and A8H2.This would in turn imply that at least two symmetry-relatedsites are present in the minor groove ofT4A4, rather than asingle site at the central TpA step, as might be assumed onthe basis of a visual inspection of theT4A4 duplex in Figure3.
It is doubtful that any protons near a Mn2+ binding siteon a DNA duplex are completely isolated from resonancebroadening by Mn2+ localized at other sites, since thepolyanionic nature of DNA produces multiple closely spacedcation localization sites with varying affinities for cations.In the case ofT4A4, it is clear that Mn2+ is in fast exchangebetween the putative site we have identified at the center ofthe A7pA8 step and at least one other site on the DNA. Thisis supported by the measured resonance line broadening of6.7 Hz/µM MnCl2 for A9H2. If the Mn2+ binding site nearestA7H2 were solely responsible for the line broadening of allproton resonances ofT4A4, then the line broadening of A9H2should be on the order of 2 Hz/µM MnCl2 (based upon ther-6 distance relationship and the broadening measured forA7H2 and A8H2). While these overlapping line broadeningeffects of neighboring cation localization sites may make itimpossible to determine the position of individual Mn2+
binding sites to high resolution, resonance line broadeningby Mn2+ is principally a distance-dependent and occupation-dependent phenomenon. Thus, the preferential localizationof divalent cations on a nucleic acid can, in many cases, besufficiently characterized by the qualitative comparison ofresonance line broadening for several nuclei (28, 29). Withinthis context, we will use our quantitative resonance linebroadening measurements for the sequences of this study tointerpret the nature of Mn2+ interaction with AT-rich DNA,but without attempting to determine the precise location ofbinding sites in the three-dimensional space around eachduplex.
Comparison of the Mn+2 Line Broadening ofT4A4, T3A3,and T2A2. The localization of Mn2+ on the duplexes[d(GCGT3A3CGC)]2 (T3A3) and [d(CGCGT2A2CGCG)]2(T2A2) was also investigated and compared to that ofT4A4.The sensitivity of the AH2, H1′, and H4′ protons for thesetwo sequences to resonance line broadening by Mn2+ ispresented in Table 1. For bothT3A3 andT2A2, the magnitudeand spatial extent to which Mn2+ is localized within theminor groove are decreased with respect to those ofT4A4
(Figure 3). This is not surprising since A‚T base pairs have
FIGURE 2: Line widths of the AH2 proton resonances of [d(CGT4A4-CG)]2 as a function of MnCl2 concentration. Samples were 2.0 mMin oligonucleotide strand at pH 6.0 with 50 mM NaCl in D2O. Linewidths were extracted from 1D spectra, such as that shown in Figure1, by least-squares fits of resonance peaks with Lorentzian linefunctions.
Table 1: Resonance Line Broadening Susceptibility (Hz/µM MnCl2)for the AH2, H1′, and H4′ Protons of the TnAn Seriesa
10 2.5 5 13 2 7 <1 211 <1 <1 <1 1 <1 112 <1 <1 <1 <1 <1 <1a Measurements reported to one decimal place are based upon the
fitting of a Lorentzian function to the resonance in 1D spectra.b Susceptibility to resonance line broadening by Mn2+ not determineddue to spectral overlap.
Mn2+ Localization in the Minor Groove of A-Tract DNA Biochemistry, Vol. 41, No. 31, 20029903
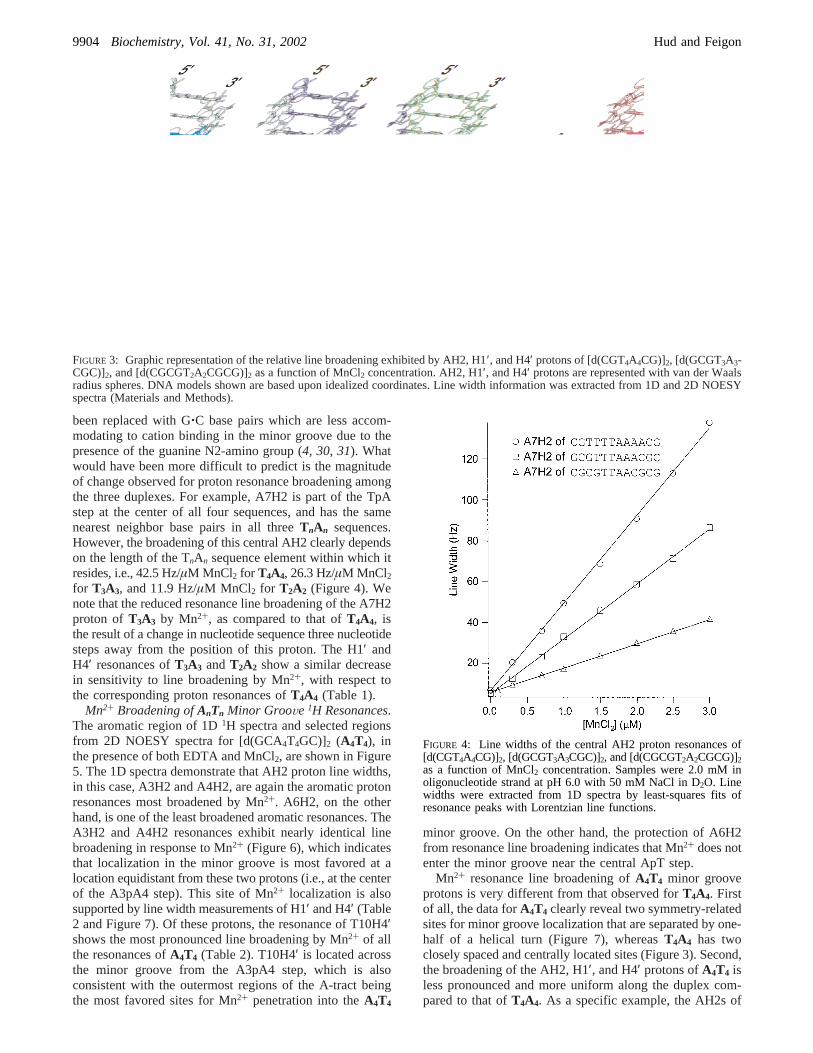
been replaced with G‚C base pairs which are less accom-modating to cation binding in the minor groove due to thepresence of the guanine N2-amino group (4, 30, 31). Whatwould have been more difficult to predict is the magnitudeof change observed for proton resonance broadening amongthe three duplexes. For example, A7H2 is part of the TpAstep at the center of all four sequences, and has the samenearest neighbor base pairs in all threeTnAn sequences.However, the broadening of this central AH2 clearly dependson the length of the TnAn sequence element within which itresides, i.e., 42.5 Hz/µM MnCl2 for T4A4, 26.3 Hz/µM MnCl2for T3A3, and 11.9 Hz/µM MnCl2 for T2A2 (Figure 4). Wenote that the reduced resonance line broadening of the A7H2proton of T3A3 by Mn2+, as compared to that ofT4A4, isthe result of a change in nucleotide sequence three nucleotidesteps away from the position of this proton. The H1′ andH4′ resonances ofT3A3 andT2A2 show a similar decreasein sensitivity to line broadening by Mn2+, with respect tothe corresponding proton resonances ofT4A4 (Table 1).
Mn2+ Broadening ofAnTn Minor GrooVe 1H Resonances.The aromatic region of 1D1H spectra and selected regionsfrom 2D NOESY spectra for [d(GCA4T4GC)]2 (A4T4), inthe presence of both EDTA and MnCl2, are shown in Figure5. The 1D spectra demonstrate that AH2 proton line widths,in this case, A3H2 and A4H2, are again the aromatic protonresonances most broadened by Mn2+. A6H2, on the otherhand, is one of the least broadened aromatic resonances. TheA3H2 and A4H2 resonances exhibit nearly identical linebroadening in response to Mn2+ (Figure 6), which indicatesthat localization in the minor groove is most favored at alocation equidistant from these two protons (i.e., at the centerof the A3pA4 step). This site of Mn2+ localization is alsosupported by line width measurements of H1′ and H4′ (Table2 and Figure 7). Of these protons, the resonance of T10H4′shows the most pronounced line broadening by Mn2+ of allthe resonances ofA4T4 (Table 2). T10H4′ is located acrossthe minor groove from the A3pA4 step, which is alsoconsistent with the outermost regions of the A-tract beingthe most favored sites for Mn2+ penetration into theA4T4
minor groove. On the other hand, the protection of A6H2from resonance line broadening indicates that Mn2+ does notenter the minor groove near the central ApT step.
Mn2+ resonance line broadening ofA4T4 minor grooveprotons is very different from that observed forT4A4. Firstof all, the data forA4T4 clearly reveal two symmetry-relatedsites for minor groove localization that are separated by one-half of a helical turn (Figure 7), whereasT4A4 has twoclosely spaced and centrally located sites (Figure 3). Second,the broadening of the AH2, H1′, and H4′ protons ofA4T4 isless pronounced and more uniform along the duplex com-pared to that ofT4A4. As a specific example, the AH2s of
FIGURE 3: Graphic representation of the relative line broadening exhibited by AH2, H1′, and H4′ protons of [d(CGT4A4CG)]2, [d(GCGT3A3-CGC)]2, and [d(CGCGT2A2CGCG)]2 as a function of MnCl2 concentration. AH2, H1′, and H4′ protons are represented with van der Waalsradius spheres. DNA models shown are based upon idealized coordinates. Line width information was extracted from 1D and 2D NOESYspectra (Materials and Methods).
FIGURE 4: Line widths of the central AH2 proton resonances of[d(CGT4A4CG)]2, [d(GCGT3A3CGC)]2, and [d(CGCGT2A2CGCG)]2as a function of MnCl2 concentration. Samples were 2.0 mM inoligonucleotide strand at pH 6.0 with 50 mM NaCl in D2O. Linewidths were extracted from 1D spectra by least-squares fits ofresonance peaks with Lorentzian line functions.
9904 Biochemistry, Vol. 41, No. 31, 2002 Hud and Feigon
A4T4 exhibit resonance line broadening from 0.9 (A6H2) to6.7 Hz/µM MnCl2 (A3H2), as compared to a range from2.5 (A10H2) to 42.5 Hz/µM MnCl2 (A7H2) for T4A4.
We have also studied the interaction of Mn2+ with theduplexes [d(CGCA3T3GCG)]2 (A3T3) and [d(GCGCA2T2-GCGC)]2 (A2T2). With regard to AH2 resonance line
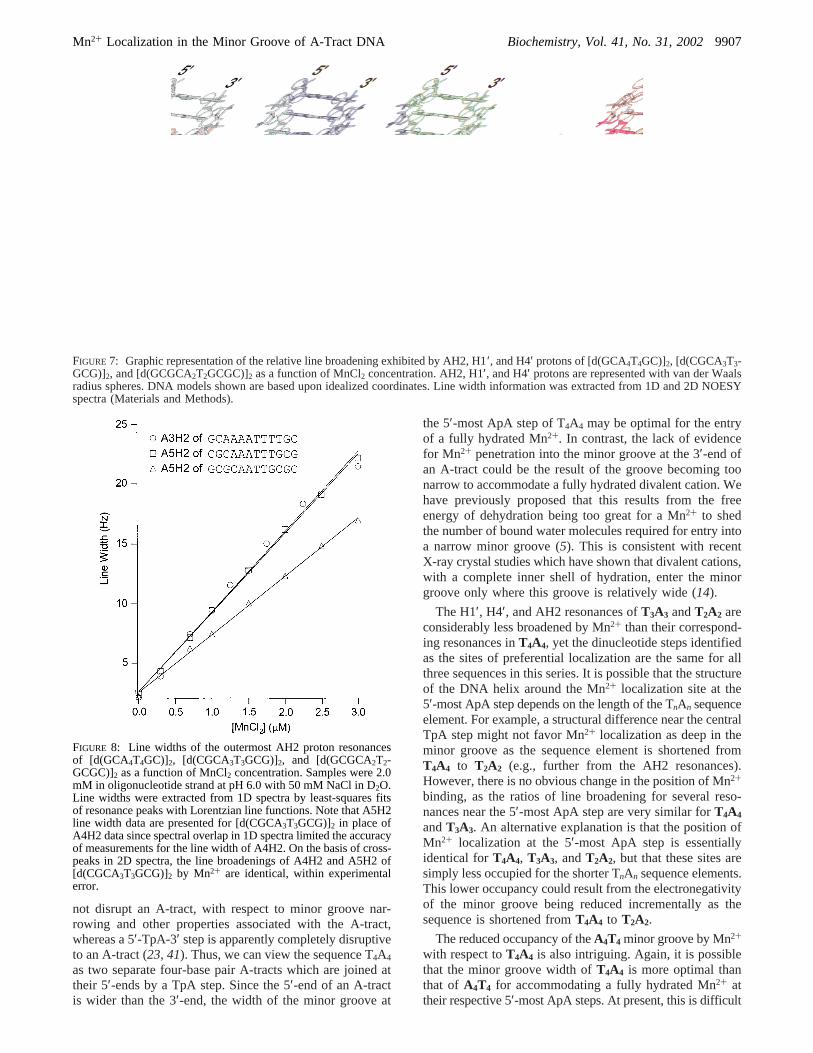
broadening,A3T3 is very similar toA4T4. The 5′-most AH2resonances of these two sequences exhibit a responsevirtually identical to that of the addition of MnCl2 (Figure8). This is in contrast to the substantial reduction in AH2resonance line broadening exhibited byT3A3 in comparisonto T4A4. The shortening of the AnTn sequence element from
FIGURE 5: (A) Aromatic proton region from the 1D spectrum of [d(GCA4T4GC)]2 in the presence of 0.1 mM EDTA. (B) Aromatic protonregion from 1D spectrum of [d(GCA4T4GC)]2 in the presence of 1.0µM MnCl2. (C) H1′-H4′/H5′/H5′′ region from a 2D NOESY spectrumof [d(GCA4T4GC)]2 in the presence of 0.1 mM EDTA. (D) H1′-H4′/H5′/H5′′ region from a 2D NOESY spectrum of [d(GCA4T4GC)]2 inthe presence of 1µM MnCl2. (E) Aromatic-H1′ region from a 2D NOESY spectrum of [d(GCA4T4GC)]2 in the presence of 0.1 mMEDTA. (F) Aromatic-H1′ region from a 2D NOESY spectrum of [d(GCA4T4GC)]2 in the presence of 1.5µM MnCl2. Samples were 2.0mM in oligonucleotide strand at pH 6.0 with 50 mM NaCl in D2O. Details about the collection of spectra are given in Materials andMethods.
Mn2+ Localization in the Minor Groove of A-Tract DNA Biochemistry, Vol. 41, No. 31, 20029905
A3T3 to A2T2 does, however, result in an appreciablereduction in the degree of line broadening exhibited by allminor groove protons (Figure 4 and Table 1). For example,the 5′-most AH2 ofA2T2 (A5H2) broadens at a rate of 4.9Hz/µM MnCl2, in comparison to approximately 7 Hz/µMMnCl2 for both A4T4 (A3H2) andA3T3 (A4H2).
Line Broadening ofTnAn and AnTn Major GrooVe 1HResonances.Several purine H8 resonances ofT4A4 andA4T4
are also affected by the presence of MnCl2 (see the 1Dspectra in Figures 1 and 5). These protons reside in the majorgroove or, arguably, on the border between the major andminor grooves. In the case ofT4A4, the major grooveresonances most broadened by Mn2+ are G2H8 and G12H8,which broaden at approximately 7 and 5 Hz/µM MnCl2,respectively, and A7H8 and A8H8, which broaden atapproximately 5 and 7 Hz/µM MnCl2, respectively. All otherH8 and H6 protons ofT4A4 exhibit resonance line broadeningof <3 Hz/µM MnCl2. The broadening exhibited by G2H8
is not surprising since the dinucleotide step GpT waspreviously shown to be a favorable divalent cation localiza-tion site in the major groove (32). The A8H8 and A7H8protons, on the other hand, belong to an ApA step which,according to a recently reported X-ray crystallography study,does not bind divalent cations in the major groove (13).Furthermore, these particular AH8 protons are within 6-10Å of the most pronounced minor groove Mn2+ localizationsite we have observed (i.e., the 5′-most ApA step ofT4A4).Thus, it is most likely that the resonance line broadeningexhibited by the A7H8 and A8H8 protons ofT4A4 resultsfrom Mn2+ being localized on the minor groove side of thesame dinucleotide step.
For theAnTn series, broadening of major groove protonsis even less pronounced than for theTnAn series. The onlyresonances ofA4T4 that are broadened more than 2 Hz/µMMnCl2 are A4H8 (∼2.5 Hz/µM MnCl2) and A5H8 (∼2.5Hz/µM MnCl2). These resonances are again on the majorgroove side of the most favored minor groove site for Mn2+
localization. Thus, we find no compelling evidence for thesequence-specific localization of Mn2+ in the major grooveof either the AnTn or the TnAn sequence elements.
DISCUSSION
Mn2+ Localization by TnAn and AnTn Sequence Elementsand the Nature of A-Tract DNA.We have shown byresonance line broadening studies that the most favored sitefor Mn2+ groove localization in a TnAn sequence element isin the minor groove at the 5′-most ApA step (or, equivalently,the 3′-most TpT step). AH2 resonance line broadening byMn2+ at this step decreases monotonically as the length ofthe TnAn sequence element is shortened from T4A4 to T2A2.Furthermore, broadening of the AH2 resonances within T4A4
decreases substantially moving from the central A7H2 to theoutermost A10H2. Taken together, these results reveal thatthe two A‚T base pairs at the outer edges of T4A4 (i.e.,A9pA10‚T3pT4 in T4A4) contribute to Mn2+ groove local-ization near the 5′-most ApA step, but do not themselvescreate a site for Mn2+ localization as favorable as the 5′-most ApA step. Our parallel study of the related AnTn seriesalso reveals a preference for Mn2+ localization in the minorgroove at the 5′-most ApA step, and protection of the AH2resonances of the 3′-most ApA step. However, the interactionof Mn2+ with an AnTn sequence element is in other waysvery different from that observed for the TnAn series. Firstof all, the magnitude of line broadening exhibited issubstantially lower for the AnTn sequence elements. Second,the effect of sequence length on the magnitude of resonanceline broadening is less pronounced for the AnTn series thanfor the TnAn series.
The sequence-dependent nature of divalent cation interac-tion with the AnTn and TnAn sequence motifs is consistentwith the unique structural properties of A-tract DNA. It iswell-documented by X-ray crystallography, NMR spectro-scopy, and chemical probing that the minor groove of A-tractDNA is narrow compared to that of canonical B-form DNA,and that this narrowing proceeds in the 5′ to 3′ directionalong the A-tract minor groove (5, 33-40). The anomalousproperties of A-tract DNA, such as sequence-directed bend-ing, become appreciable at four or more consecutive A‚Tbase pairs and plateau around eight base pairs (41). Anotherkey feature of A-tract DNA is that a 5′-ApT-3′ step does
FIGURE 6: Line widths of the AH2 proton resonances of [d(GCA4T4-GC)]2 as a function of MnCl2 concentration. Samples were 2.0 mMin oligonucleotide strand at pH 6.0 with 50 mM NaCl in D2O. Linewidths were extracted from 1D spectra by least-squares fits ofresonance peaks with Lorentzian line functions.
Table 2: Resonance Line Broadening Susceptibility (Hz/µM MnCl2)for the AH2, H1′, and H4′ Protons of the AnTn Seriesa
10 2 12 3 9 1 b11 2 7 2 4 <1 <112 <1 <1 <1 1 <1 <1a Measurements reported to one decimal place are based upon the
fitting of a Lorentzian function to the resonance in 1D spectra.b Susceptibility to resonance line broadening by Mn2+ not determineddue to spectral overlap.
9906 Biochemistry, Vol. 41, No. 31, 2002 Hud and Feigon
not disrupt an A-tract, with respect to minor groove nar-rowing and other properties associated with the A-tract,whereas a 5′-TpA-3′ step is apparently completely disruptiveto an A-tract (23, 41). Thus, we can view the sequence T4A4
as two separate four-base pair A-tracts which are joined attheir 5′-ends by a TpA step. Since the 5′-end of an A-tractis wider than the 3′-end, the width of the minor groove at
the 5′-most ApA step of T4A4 may be optimal for the entryof a fully hydrated Mn2+. In contrast, the lack of evidencefor Mn2+ penetration into the minor groove at the 3′-end ofan A-tract could be the result of the groove becoming toonarrow to accommodate a fully hydrated divalent cation. Wehave previously proposed that this results from the freeenergy of dehydration being too great for a Mn2+ to shedthe number of bound water molecules required for entry intoa narrow minor groove (5). This is consistent with recentX-ray crystal studies which have shown that divalent cations,with a complete inner shell of hydration, enter the minorgroove only where this groove is relatively wide (14).
The H1′, H4′, and AH2 resonances ofT3A3 andT2A2 areconsiderably less broadened by Mn2+ than their correspond-ing resonances inT4A4, yet the dinucleotide steps identifiedas the sites of preferential localization are the same for allthree sequences in this series. It is possible that the structureof the DNA helix around the Mn2+ localization site at the5′-most ApA step depends on the length of the TnAn sequenceelement. For example, a structural difference near the centralTpA step might not favor Mn2+ localization as deep in theminor groove as the sequence element is shortened fromT4A4 to T2A2 (e.g., further from the AH2 resonances).However, there is no obvious change in the position of Mn2+
binding, as the ratios of line broadening for several reso-nances near the 5′-most ApA step are very similar forT4A4
andT3A3. An alternative explanation is that the position ofMn2+ localization at the 5′-most ApA step is essentiallyidentical forT4A4, T3A3, andT2A2, but that these sites aresimply less occupied for the shorter TnAn sequence elements.This lower occupancy could result from the electronegativityof the minor groove being reduced incrementally as thesequence is shortened fromT4A4 to T2A2.
The reduced occupancy of theA4T4 minor groove by Mn2+
with respect toT4A4 is also intriguing. Again, it is possiblethat the minor groove width ofT4A4 is more optimal thanthat of A4T4 for accommodating a fully hydrated Mn2+ attheir respective 5′-most ApA steps. At present, this is difficult
FIGURE 7: Graphic representation of the relative line broadening exhibited by AH2, H1′, and H4′ protons of [d(GCA4T4GC)]2, [d(CGCA3T3-GCG)]2, and [d(GCGCA2T2GCGC)]2 as a function of MnCl2 concentration. AH2, H1′, and H4′ protons are represented with van der Waalsradius spheres. DNA models shown are based upon idealized coordinates. Line width information was extracted from 1D and 2D NOESYspectra (Materials and Methods).
FIGURE 8: Line widths of the outermost AH2 proton resonancesof [d(GCA4T4GC)]2, [d(CGCA3T3GCG)]2, and [d(GCGCA2T2-GCGC)]2 as a function of MnCl2 concentration. Samples were 2.0mM in oligonucleotide strand at pH 6.0 with 50 mM NaCl in D2O.Line widths were extracted from 1D spectra by least-squares fitsof resonance peaks with Lorentzian line functions. Note that A5H2line width data are presented for [d(CGCA3T3GCG)]2 in place ofA4H2 data since spectral overlap in 1D spectra limited the accuracyof measurements for the line width of A4H2. On the basis of cross-peaks in 2D spectra, the line broadenings of A4H2 and A5H2 of[d(CGCA3T3GCG)]2 by Mn2+ are identical, within experimentalerror.
Mn2+ Localization in the Minor Groove of A-Tract DNA Biochemistry, Vol. 41, No. 31, 20029907
to firmly establish, since the width of the minor groovecannot be determined with high resolution in solution andthe minor groove width of DNA duplexes in the crystal statecan be affected by crystal packing (42) and cation binding(14, 18). Furthermore, it is possible that these differences incation localization result from differences in both the widthand electrostatic potential of the minor groove.
The differences we observe in the relationship betweenresonance line broadening by Mn2+ and sequence length forAnTn versusTnAn can also be understood in terms of A-tractstructure. As noted above, shortening an AnTn sequenceelement from A4T4 to A3T3 has little effect on the nature ofMn2+ localization (Figures 7 and 8). We can consider thesequence A4T4 as an eight-base pair A-tract, since an ApTstep is not disruptive to an A-tract. Shortening this sequenceto A3T3 is then equivalent to shortening an A-tract from eightto six base pairs. A six-base pair A-tract still exhibits theanomalous features of A-tract DNA (e.g., minor groovenarrowing). Thus, the outer edges of A4T4 and A3T3, whereMn2+ is most favorably localized in the minor groove, wouldbe very similar for both sequences. In contrast, the centralTpA step of the TnAn series disrupts properties associatedwith the A-tract. As discussed above, T4A4 is best viewedas two separate four-base pair A-tracts joined at their 5′-ends. Thus, shortening T4A4 to T3A3 changes the two four-base pair A-tracts of T4A4 into two three-base pair “protoA-tracts”. Since the anomalous structural properties of A-tractDNA generally become appreciable only at the length of fouror more base pairs, the significant reduction observed forthe localization of Mn2+ by T3A3 with respect toT4A4 couldbe the result of the former sequence having substantiallymuted characteristics of A-tract DNA.
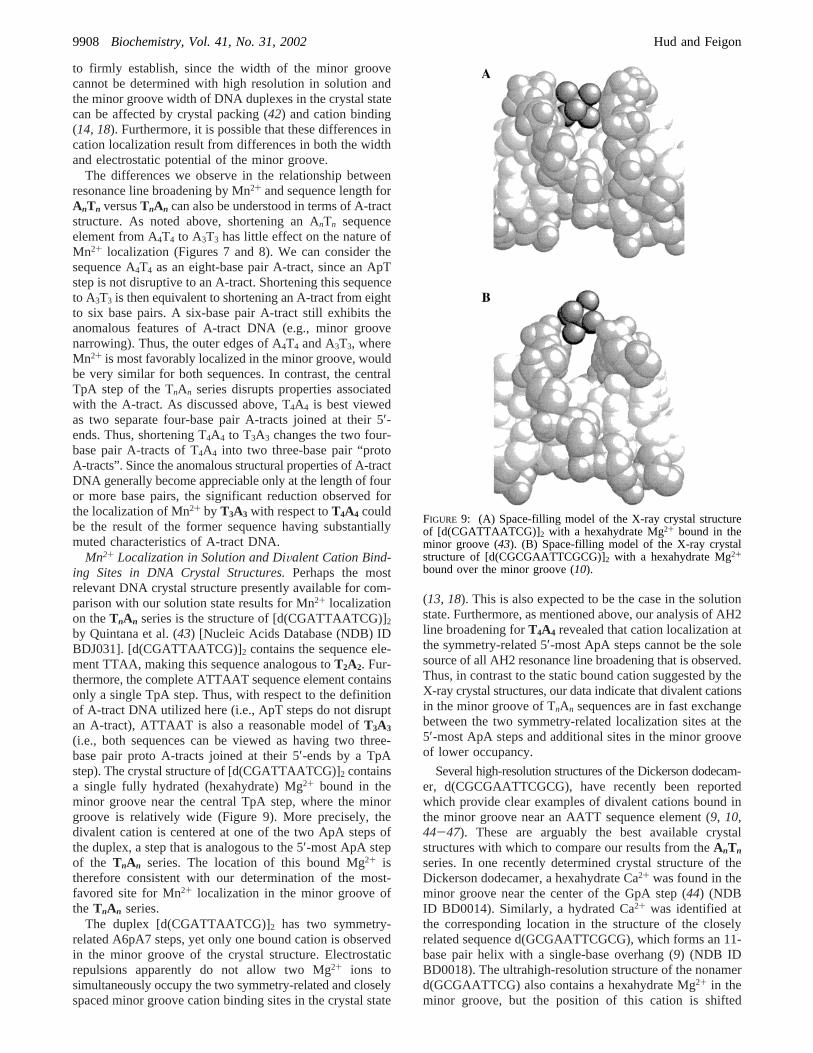
Mn2+ Localization in Solution and DiValent Cation Bind-ing Sites in DNA Crystal Structures.Perhaps the mostrelevant DNA crystal structure presently available for com-parison with our solution state results for Mn2+ localizationon theTnAn series is the structure of [d(CGATTAATCG)]2
by Quintana et al. (43) [Nucleic Acids Database (NDB) IDBDJ031]. [d(CGATTAATCG)]2 contains the sequence ele-ment TTAA, making this sequence analogous toT2A2. Fur-thermore, the complete ATTAAT sequence element containsonly a single TpA step. Thus, with respect to the definitionof A-tract DNA utilized here (i.e., ApT steps do not disruptan A-tract), ATTAAT is also a reasonable model ofT3A3
(i.e., both sequences can be viewed as having two three-base pair proto A-tracts joined at their 5′-ends by a TpAstep). The crystal structure of [d(CGATTAATCG)]2 containsa single fully hydrated (hexahydrate) Mg2+ bound in theminor groove near the central TpA step, where the minorgroove is relatively wide (Figure 9). More precisely, thedivalent cation is centered at one of the two ApA steps ofthe duplex, a step that is analogous to the 5′-most ApA stepof the TnAn series. The location of this bound Mg2+ istherefore consistent with our determination of the most-favored site for Mn2+ localization in the minor groove ofthe TnAn series.
The duplex [d(CGATTAATCG)]2 has two symmetry-related A6pA7 steps, yet only one bound cation is observedin the minor groove of the crystal structure. Electrostaticrepulsions apparently do not allow two Mg2+ ions tosimultaneously occupy the two symmetry-related and closelyspaced minor groove cation binding sites in the crystal state
(13, 18). This is also expected to be the case in the solutionstate. Furthermore, as mentioned above, our analysis of AH2line broadening forT4A4 revealed that cation localization atthe symmetry-related 5′-most ApA steps cannot be the solesource of all AH2 resonance line broadening that is observed.Thus, in contrast to the static bound cation suggested by theX-ray crystal structures, our data indicate that divalent cationsin the minor groove of TnAn sequences are in fast exchangebetween the two symmetry-related localization sites at the5′-most ApA steps and additional sites in the minor grooveof lower occupancy.
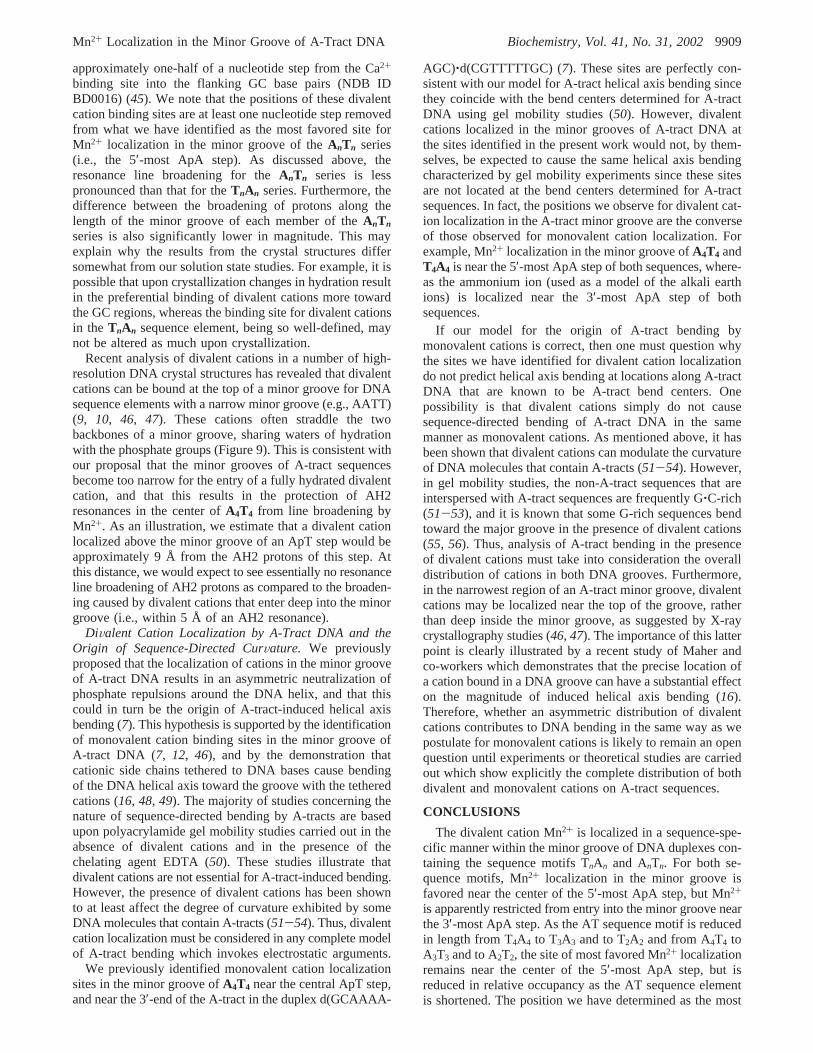
Several high-resolution structures of the Dickerson dodecam-er, d(CGCGAATTCGCG), have recently been reportedwhich provide clear examples of divalent cations bound inthe minor groove near an AATT sequence element (9, 10,44-47). These are arguably the best available crystalstructures with which to compare our results from theAnTn
series. In one recently determined crystal structure of theDickerson dodecamer, a hexahydrate Ca2+ was found in theminor groove near the center of the GpA step (44) (NDBID BD0014). Similarly, a hydrated Ca2+ was identified atthe corresponding location in the structure of the closelyrelated sequence d(GCGAATTCGCG), which forms an 11-base pair helix with a single-base overhang (9) (NDB IDBD0018). The ultrahigh-resolution structure of the nonamerd(GCGAATTCG) also contains a hexahydrate Mg2+ in theminor groove, but the position of this cation is shifted
FIGURE 9: (A) Space-filling model of the X-ray crystal structureof [d(CGATTAATCG)]2 with a hexahydrate Mg2+ bound in theminor groove (43). (B) Space-filling model of the X-ray crystalstructure of [d(CGCGAATTCGCG)]2 with a hexahydrate Mg2+
bound over the minor groove (10).
9908 Biochemistry, Vol. 41, No. 31, 2002 Hud and Feigon
approximately one-half of a nucleotide step from the Ca2+
binding site into the flanking GC base pairs (NDB IDBD0016) (45). We note that the positions of these divalentcation binding sites are at least one nucleotide step removedfrom what we have identified as the most favored site forMn2+ localization in the minor groove of theAnTn series(i.e., the 5′-most ApA step). As discussed above, theresonance line broadening for theAnTn series is lesspronounced than that for theTnAn series. Furthermore, thedifference between the broadening of protons along thelength of the minor groove of each member of theAnTn
series is also significantly lower in magnitude. This mayexplain why the results from the crystal structures differsomewhat from our solution state studies. For example, it ispossible that upon crystallization changes in hydration resultin the preferential binding of divalent cations more towardthe GC regions, whereas the binding site for divalent cationsin the TnAn sequence element, being so well-defined, maynot be altered as much upon crystallization.
Recent analysis of divalent cations in a number of high-resolution DNA crystal structures has revealed that divalentcations can be bound at the top of a minor groove for DNAsequence elements with a narrow minor groove (e.g., AATT)(9, 10, 46, 47). These cations often straddle the twobackbones of a minor groove, sharing waters of hydrationwith the phosphate groups (Figure 9). This is consistent withour proposal that the minor grooves of A-tract sequencesbecome too narrow for the entry of a fully hydrated divalentcation, and that this results in the protection of AH2resonances in the center ofA4T4 from line broadening byMn2+. As an illustration, we estimate that a divalent cationlocalized above the minor groove of an ApT step would beapproximately 9 Å from the AH2 protons of this step. Atthis distance, we would expect to see essentially no resonanceline broadening of AH2 protons as compared to the broaden-ing caused by divalent cations that enter deep into the minorgroove (i.e., within 5 Å of an AH2resonance).
DiValent Cation Localization by A-Tract DNA and theOrigin of Sequence-Directed CurVature. We previouslyproposed that the localization of cations in the minor grooveof A-tract DNA results in an asymmetric neutralization ofphosphate repulsions around the DNA helix, and that thiscould in turn be the origin of A-tract-induced helical axisbending (7). This hypothesis is supported by the identificationof monovalent cation binding sites in the minor groove ofA-tract DNA (7, 12, 46), and by the demonstration thatcationic side chains tethered to DNA bases cause bendingof the DNA helical axis toward the groove with the tetheredcations (16, 48, 49). The majority of studies concerning thenature of sequence-directed bending by A-tracts are basedupon polyacrylamide gel mobility studies carried out in theabsence of divalent cations and in the presence of thechelating agent EDTA (50). These studies illustrate thatdivalent cations are not essential for A-tract-induced bending.However, the presence of divalent cations has been shownto at least affect the degree of curvature exhibited by someDNA molecules that contain A-tracts (51-54). Thus, divalentcation localization must be considered in any complete modelof A-tract bending which invokes electrostatic arguments.
We previously identified monovalent cation localizationsites in the minor groove ofA4T4 near the central ApT step,and near the 3′-end of the A-tract in the duplex d(GCAAAA-
AGC)‚d(CGTTTTTGC) (7). These sites are perfectly con-sistent with our model for A-tract helical axis bending sincethey coincide with the bend centers determined for A-tractDNA using gel mobility studies (50). However, divalentcations localized in the minor grooves of A-tract DNA atthe sites identified in the present work would not, by them-selves, be expected to cause the same helical axis bendingcharacterized by gel mobility experiments since these sitesare not located at the bend centers determined for A-tractsequences. In fact, the positions we observe for divalent cat-ion localization in the A-tract minor groove are the converseof those observed for monovalent cation localization. Forexample, Mn2+ localization in the minor groove ofA4T4 andT4A4 is near the 5′-most ApA step of both sequences, where-as the ammonium ion (used as a model of the alkali earthions) is localized near the 3′-most ApA step of bothsequences.
If our model for the origin of A-tract bending bymonovalent cations is correct, then one must question whythe sites we have identified for divalent cation localizationdo not predict helical axis bending at locations along A-tractDNA that are known to be A-tract bend centers. Onepossibility is that divalent cations simply do not causesequence-directed bending of A-tract DNA in the samemanner as monovalent cations. As mentioned above, it hasbeen shown that divalent cations can modulate the curvatureof DNA molecules that contain A-tracts (51-54). However,in gel mobility studies, the non-A-tract sequences that areinterspersed with A-tract sequences are frequently G‚C-rich(51-53), and it is known that some G-rich sequences bendtoward the major groove in the presence of divalent cations(55, 56). Thus, analysis of A-tract bending in the presenceof divalent cations must take into consideration the overalldistribution of cations in both DNA grooves. Furthermore,in the narrowest region of an A-tract minor groove, divalentcations may be localized near the top of the groove, ratherthan deep inside the minor groove, as suggested by X-raycrystallography studies (46, 47). The importance of this latterpoint is clearly illustrated by a recent study of Maher andco-workers which demonstrates that the precise location ofa cation bound in a DNA groove can have a substantial effecton the magnitude of induced helical axis bending (16).Therefore, whether an asymmetric distribution of divalentcations contributes to DNA bending in the same way as wepostulate for monovalent cations is likely to remain an openquestion until experiments or theoretical studies are carriedout which show explicitly the complete distribution of bothdivalent and monovalent cations on A-tract sequences.
CONCLUSIONS
The divalent cation Mn2+ is localized in a sequence-spe-cific manner within the minor groove of DNA duplexes con-taining the sequence motifs TnAn and AnTn. For both se-quence motifs, Mn2+ localization in the minor groove isfavored near the center of the 5′-most ApA step, but Mn2+
is apparently restricted from entry into the minor groove nearthe 3′-most ApA step. As the AT sequence motif is reducedin length from T4A4 to T3A3 and to T2A2 and from A4T4 toA3T3 and to A2T2, the site of most favored Mn2+ localizationremains near the center of the 5′-most ApA step, but isreduced in relative occupancy as the AT sequence elementis shortened. The position we have determined as the most
Mn2+ Localization in the Minor Groove of A-Tract DNA Biochemistry, Vol. 41, No. 31, 20029909
favored site for Mn2+ localization in T4A4 coincides with aMg2+ binding site found in the minor groove of the [d(CGA-TTAATCG)]2 crystal structure. However, resonance linebroadening data for minor groove protons cannot be ex-plained by a single bound Mn2+. Thus, in contrast to thecrystal structure, our studies reveal a picture of cationlocalization in the minor groove in which divalent cationsrapidly exchange between more than one site with differentlevels of occupancy.
The results presented here can be summarized into threegeneral conclusions concerning the sequence-specific natureof divalent cation localization within the minor groove ofB-form DNA. First of all, a wide and very electronegativeminor groove, as found in T4A4, provides an excellent sitefor divalent cation localization. Second, a very electronega-tive but narrow minor groove, as in A4T4, is not nearly asfavorable. Third, a wide but amino proton-filled groove, asin GC-rich regions, is not good either. The last principle isin contrast to observations from crystal studies, indicatingthat divalent cation localization in the GC-rich minor groovemay only be favored under the rather extreme dehydratingand molecular crowding conditions of the crystal state.Finally, we note that the results presented here provide furthersupport for our proposal that models for the origin of A-tractsequence-directed curvature must consider the potentialeffects of asymmetric screening of phosphate-phosphaterepulsions by preferentially localized cations.
ACKNOWLEDGMENT
We thank Prof. Frank A. L. Anet for helpful discussions.
REFERENCES
1. Frøystein, N. A., and Sletten, E. (1991)Acta Chem. Scand. 45,219-225.
2. Frøystein, N. A., Davis, J. T., Reid, B. R., and Sletten, E. (1993)Acta Chem. Scand. 47, 649-657.
3. Sletten, E., and Frøystein, N. A. (1996) inMetal Ions in BiologicalSystems(Sigel, A., and Sigel, H., Eds.) pp 397-418, Dekker, NewYork.
4. Young, M. A., Jayaram, B., and Beveridge, D. L. (1997)J. Am.Chem. Soc. 119, 59-69.
5. Hud, N. V., and Feigon, J. (1997)J. Am. Chem. Soc. 119, 5756-5757.
6. Shui, X. Q., McFail-Isom, L., Hu, G. G., and Williams, L. D.(1998)Biochemistry 37, 8341-8355.
7. Hud, N. V., Sklenar, V., and Feigon, J. (1999)J. Mol. Biol. 286,651-660.
8. Feig, M., and Pettitt, B. M. (1999)Biophys. J. 77, 1769-1781.9. Minasov, G., Tereshko, V., and Egli, M. (1999)J. Mol. Biol. 291,
83-99.10. Tereshko, V., Minasov, G., and Egli, M. (1999)J. Am. Chem.
Soc. 121, 3590-3595.11. Cheatham, T. E., and Kollman, P. A. (2000)Annu. ReV. Phys.
Chem. 51, 435-471.12. Denisov, V. P., and Halle, B. (2000)Proc. Natl. Acad. Sci. U.S.A.
97, 629-633.13. Chiu, T. K., and Dickerson, R. E. (2000)J. Mol. Biol. 301, 915-
945.14. Hud, N. V., and Polak, M. (2001)Curr. Opin. Struct. Biol. 11,
293-301.15. McFail-Isom, L., Sines, C. C., and Williams, L. D. (1999)Curr.
Opin. Struct. Biol. 9, 298-304.16. Hardwidge, P. R., Lee, D. K., Prakash, T. P., Iglesias, B., Den,
R. B., Switzer, C., and Maher, L. J. (2001)Chem. Biol. 8, 967-980.
17. Record, M. T., Jr., Zhang, W., and Anderson, C. F. (1998)AdV.Protein Chem. 51, 281-353.
18. Kielkopf, C. L., Ding, S., Kuhn, P., and Rees, D. C. (2000)J.Mol. Biol. 296, 787-801.
19. Harvey, S. C., Dlakic, M., Griffin, J., Harrington, R., Park, K.,Sprous, D., and Sacharias, W. (1995)J. Biomol. Struct. Dyn. 13,301-307.
20. Hagerman, P. J. (1990)Annu. ReV. Biochem. 59, 755-781.21. Dickerson, R. E., Goodsell, D. S., and Neidle, S. A. (1994)Proc.
Natl. Acad. Sci. U.S.A. 91, 3579-3583.22. Haran, T. E., Hahn, J. D., and Crothers, D. M. (1994)J. Mol.
Biol. 244, 135-143.23. Hagerman, P. J. (1986)Nature 321, 449-450.24. Burkhoff, A. M., and Tullius, T. D. (1987)Cell 48, 935-943.25. Wuthrich, K. (1986)NMR of Proteins and Nucleic Acids, John
Wiley & Sons, New York.26. Craik, D. J., and Higging, K. A. (1989)Annu. Rep. Nucl. Magn.
Reson. Spectrosc. 22, 61-138.27. Bertini, I., and Luchinat, C. (1986)NMR of Paramagnetic
Molecules in Biological Systems, pp 319, Benjamin/CummingsPublishing Co., Menlo Park, CA.
28. Allain, F. H.-T., and Varani, G. (1995)Nucleic Acids Res. 23,341-350.
29. Butcher, S. E., Allain, F. H.-T., and Feigon, J. (2000)Biochemistry39, 2174-2182.
30. Lavery, R., and Pullman, B. (1985)J. Biomol. Struct. Dyn. 2,1021-1032.
31. Jayaram, B., Sharp, K. A., and Honig, B. (1989)Biopolymers 28,975-993.
32. Steinkopf, S., and Sletten, E. (1994)Acta Chem. Scand. 48, 388-392.
33. Burkhoff, A. M., and Tullius, T. D. (1988)Nature 331, 455-457.
34. Katahira, M., Sugeta, H., Kyogoku, Y., Fujii, S., Fujisawa, R.,and Tomita, K. (1988)Nucleic Acids Res. 16, 8619-8631.
35. Katahira, M., Sueta, H., and Kyogoku, Y. (1990)Nucleic AcidsRes. 18, 613-618.
36. Nadeau, J. G., and Crothers, D. M. (1989)Proc. Natl. Acad. Sci.U.S.A. 86, 2622-2626.
37. Chuprina, V. P., Lipanov, A. A., Federoff, O. Y., Kim, S.-G.,Kintanar, A., and Reid, B. R. (1991)Proc. Natl. Acad. Sci. U.S.A.88, 9087-9091.
38. Coll, M., Frederick, C. A., Wang, A. H.-J., and Rich, A. (1987)Proc. Natl. Acad. Sci. U.S.A. 84, 8365-8369.
39. Nelson, H. C. M., Finch, J. T., Luisi, B. F., and Klug, A. (1987)Nature 330, 221-226.
40. Fratini, A. V., Kopka, M. L., Drew, H., and Dickerson, R. E.(1982)J. Biol. Chem. 257, 14686-14707.
41. Koo, H.-S., Wu, H.-M., and Crothers, D. M. (1986)Nature 320,501-506.
42. Lipanov, A., Kopka, M. L., Kaczorgrzeskowiak, M., Quintana,J., and Dickerson, R. E. (1993)Biochemistry 32, 1373-1389.
43. Quintana, J. R., Grzeskowiak, K., Yanagi, K., and Dickerson, R.E. (1992)J. Mol. Biol. 225, 379-395.
44. Liu, J., and Subirana, J. A. (1999)J. Biol. Chem. 274, 24749-24752.
45. Soler-Lopez, M., Malinina, L., Liu, J., Huynh-Dinh, T., andSubirana, J. A. (1999)J. Biol. Chem. 274, 23683-23686.
46. Sines, C. C., McFail-Isom, L., Howerton, S. B., Van Derveer, D.,and Williams, L. D. (2000)J. Am. Chem. Soc. 122, 11048-11056.
47. Tereshko, V., Minasov, G., and Egli, M. (1999)J. Am. Chem.Soc. 121, 6970.
48. Strauss, J. K., Prakash, T. P., Roberts, C., Switzer, C., and Maher,L. J. (1996)Chem. Biol. 3, 671-678.
49. Strauss, J. K., Roberts, C., Nelson, M. G., Switzer, C., and Maher,L. J. (1996)Proc. Natl. Acad. Sci. U.S.A. 93, 9515-9520.
50. Crothers, D. M., and Drak, J. (1992)Methods Enzymol. 212, 46-71.
51. Koo, H.-S., Drak, J., Rice, J. A., and Crothers, D. M. (1990)Biochemistry 29, 4227-4234.
52. Diekmann, S., and Wang, J. C. (1985)J. Mol. Biol. 186, 1-11.53. Diekmann, S. (1987)Nucleic Acids Res. 15, 247-265.54. Young, M. A., and Beveridge, D. L. (1998)J. Mol. Biol. 281,
675-687.55. Brukner, I., Susic, S., Dlakic, M., Savic, A., and Pongor, S. (1994)
J. Mol. Biol. 236, 26-32.56. Rouzina, I., and Bloomfield, V. A. (1998)Biophys. J. 74,
3152-3164.
BI020159J
9910 Biochemistry, Vol. 41, No. 31, 2002 Hud and Feigon