47
Characterization of domestic duck production systems in Cambodia AHBL • Promoting strategies for prevention and control of HPAI
Characterization ofdomestic duck production systems
in Cambodia
AHBL • Promoting strategies for prevention and control of HPAI

Characterization ofdomestic duck production systems
in Cambodia
M.T. Dinesh, J. Sölkner and M. WurzingerUniversity of Natural Resources and Applied Life Sciences (BOKU)
S. TheaCentre d’Etude et de
Development Agricole Cambodigien (CEDAC)
E. GeerlingsUniversity of Reading (UK)
O. ThiemeFood and Agricultural Organization of the
United Nations (FAO)
FOOD AND AGRICULTURE ORGANIZATION OF THE UNITED NATIONSRome, September 2008
The designations employed and the presentation of material in this information product do not imply the expression of any opinion whatsoever on the part of the Food and Agriculture Organization of the United Nations (FAO) concerning the legal or development status of any country, territory, city or area or of its authorities, or concerning the delimitation of its frontiers or boundaries. The mention of specific companies or products of manufacturers, whether or not these have been patented, does not imply that these have been endorsed or recommended by FAO in preference to others of a similar nature that are not mentioned.
All rights reserved. Reproduction and dissemination of material in this information productfor educational or other non-commercial purposes are authorized without any priorwritten permission from the copyright holders provided the source is fully acknowledged. Reproduction of material in this information product for resale or other commercial purposes is prohibited without written permission of the copyright holders.Applications for such permission should be addressed to:ChiefElectronic Publishing Policy and Support BranchCommunication DivisionFAOViale delle Terme di Caracalla, 00153 Rome, Italyor by e-mail to:[email protected]
© FAO 2009
AUTHORS’ DETAILS
M.T. Dinesh, J. Sölkner and M. WurzingerUniversity of Natural Resources and Applied Life Sciences (BOKU), Vienna
S. TheaCentre d’Etude et de Development Agricole Cambodigien (CEDAC)
E. GeerlingsUniversity of Reading (UK) O. ThiemeFood and Agricultural Organization of the United Nations (FAO), [email protected]
RECOMMENDED CITATIONFAO. 2009. Characterization of domestic duck production systems in Cambodia. Prepared by M.T. Dinesh, E. Geerlings, J. Sölkner, S. Thea, O. Thieme and M. Wurzinger. AHBL - Promoting strategies for prevention and control of HPAI. Rome.
1 Characterization of the Domestic Duck Production Systems in Cambodia
Animal Health, Breeds and Livelihoods
CONTENTS FIGURES/TABLES ....................................................................................................... 3
ACKNOWLEDGEMENTS................................................................................................ 4
ABSTRACT .................................................................................................................. 4
INTRODUCTION.......................................................................................................... 5
MATERIALS AND METHODS ........................................................................................ 6
STUDY AREA................................................................................................................6 DATA COLLECTION.........................................................................................................8 DESCRIPTION OF PRODUCTION SYSTEMS ...............................................................................8 PHENOTYPIC CHARACTERIZATION OF DUCK POPULATIONS ............................................................9 DATA ANALYSIS............................................................................................................9 ANALYSIS OF PRODUCTION SYSTEMS BY PROVINCE ....................................................................9
RESULTS................................................................................................................... 10
DESCRIPTION OF PRODUCTION SYSTEM ............................................................................... 10 Household and life style ........................................................................................ 10 Education level of respondents............................................................................... 10 Household size .................................................................................................... 11 Agriculture and its importance ............................................................................... 11 Use of other livestock and their importance.............................................................. 11 Duck flock sizes ................................................................................................... 12 Herd sizes of other livestock species reared ............................................................. 12 Fluctuation in flock size......................................................................................... 13 Breeding............................................................................................................. 13 Housing and manure disposal ................................................................................ 15 Feeding .............................................................................................................. 15 Animal health and related aspects .......................................................................... 16 Productivity of birds.............................................................................................. 17 Marketing and labour division ................................................................................ 17
PHENOTYPIC CHARACTERIZATION OF DUCKS ......................................................................... 18 Body weight ........................................................................................................ 19 Shank length....................................................................................................... 19 Shank colour ....................................................................................................... 20 Skin colour.......................................................................................................... 21 Bill colour............................................................................................................ 21 Eye colour........................................................................................................... 21 Bill type.............................................................................................................. 22 Bean colour......................................................................................................... 22 Other characteristics of Muscovy ............................................................................ 22
MULTIVARIATE ANALYSIS OF PHENOTYPIC CHARACTERISTICS OF THE BIRDS...................................... 22
ANALYSIS OF THE PRODUCTION SYSTEMS BY PROVINCE......................................... 25
KAMPONG CHAM......................................................................................................... 25 Farmer households and life style ............................................................................ 25 Livestock numbers ............................................................................................... 26
2 Characterization of the Domestic Duck Production Systems in Cambodia
Animal Health, Breeds and Livelihoods
Breeding............................................................................................................. 26 Housing .............................................................................................................. 26 Feeding .............................................................................................................. 27 Productivity......................................................................................................... 27 Marketing and labour division ................................................................................ 27 Phenotypic characterization of ducks....................................................................... 27
KAMPOT .................................................................................................................. 28 Farmer households and life style ............................................................................ 28 Livestock numbers ............................................................................................... 29 Breeding............................................................................................................. 29 Housing .............................................................................................................. 29 Feeding .............................................................................................................. 29 Productivity......................................................................................................... 29 Marketing and labour division ................................................................................ 29 Phenotypic characterization of ducks....................................................................... 30
ODAR MEANCHEY........................................................................................................ 30 Farmer households and life style ............................................................................ 31 Livestock numbers ............................................................................................... 31 Breeding............................................................................................................. 31 Housing .............................................................................................................. 31 Feeding .............................................................................................................. 31 Productivity......................................................................................................... 32 Marketing and labour division ................................................................................ 32 Phenotypic characterization of ducks....................................................................... 32
RATTANAKIRI ............................................................................................................ 33 Farmer households and life style ............................................................................ 33 Livestock numbers ............................................................................................... 34 Breeding............................................................................................................. 34 Housing .............................................................................................................. 34 Feeding .............................................................................................................. 34 Productivity......................................................................................................... 34 Marketing and labour division ................................................................................ 35 Phenotypic characterization of ducks....................................................................... 35
SIEM REAP ............................................................................................................... 35 Farmer households and life style ............................................................................ 33 Livestock numbers ............................................................................................... 36 Breeding............................................................................................................. 36 Housing .............................................................................................................. 36 Feeding .............................................................................................................. 37 Productivity......................................................................................................... 37 Marketing and labour division ................................................................................ 37 Phenotypic characterization of ducks....................................................................... 37
CONCLUSIONS.......................................................................................................... 39
ANNEXES .................................................................................................................. 40
ANNEX 1 POULTRY PRODUCTION SYSTEM EVALUATION.............................................................. 40 ANNEX 2 INDIVIDUAL OBSERVATIONS OF THE DUCKS ............................................................... 44
3 Characterization of the Domestic Duck Production Systems in Cambodia
Animal Health, Breeds and Livelihoods
Figures/Tables TABLE 1 NUMBER OF HOUSEHOLDS IN EACH PROVINCE ....................................................................................................7 TABLE 2 DISTRIBUTION OF HOUSEHOLDS PER DISTRICT...................................................................................................7 TABLE 3 BIRDS CHARACTERIZED PER DISTRICT .............................................................................................................9 TABLE 4 MALE AND FEMALE RESPONDENTS ................................................................................................................10 TABLE 5 RADIO LISTENERS AND MOBILE PHONE USERS..................................................................................................10 TABLE 6 EDUCATION LEVEL OF RESPONDENTS ............................................................................................................11 TABLE 7 HOUSEHOLD SIZE...................................................................................................................................11 TABLE 8 MAIN USE OF RICE ..................................................................................................................................11 TABLE 9 AVERAGE FLOCK SIZES OF LOCAL DUCKS........................................................................................................12 TABLE 10 AVERAGE HERD SIZES OF LOCAL CATTLE.......................................................................................................12 TABLE 11 AVERAGE HERD SIZES OF LOCAL PIGS..........................................................................................................13 TABLE 12 FLUCTUATION OF DUCK NUMBERS IN THE LAST FIVE YEARS .................................................................................13 TABLE 13 MONTHS WITH HIGHEST NUMBERS OF DUCKS (NUMBERS OF FARMERS REPORTING)....................................................13 TABLE 14 MONTHS WITH LOWEST NUMBERS OF DUCKS (NUMBERS OF FARMERS REPORTING) .....................................................13 TABLE 15 NUMBERS OF FARMERS PURCHASING DUCKS ..................................................................................................14 TABLE 16 SOURCES OF PURCHASED DUCKS ...............................................................................................................14 TABLE 17 TYPE OF BIRDS PURCHASED .....................................................................................................................14 TABLE 18 AGE OF BIRDS PURCHASED ......................................................................................................................14 TABLE 19 MATERIALS USED FOR BUILDING DUCK HOUSES ..............................................................................................15 TABLE 20 DIFFERENT TYPE AND SOURCE OF SUPPLEMENTED FEED .................................................................................15 TABLE 21 SOURCES OF PURCHASED FEED .................................................................................................................16 TABLE 22 AVERAGE NUMBERS OF DUCKLINGS HATCHED AND SURVIVING .............................................................................16 TABLE 23 CAUSES OF DUCK LOSSES DURING THE DIFFERENT PERIODS ...............................................................................16 TABLE 24 USE OF VETERINARY SERVICES AND VACCINATION ...........................................................................................17 TABLE 25 PRODUCTIVITY OF DUCKS ........................................................................................................................17 TABLE 26 DUCK SALES .......................................................................................................................................17 TABLE 27 EGG SALES .........................................................................................................................................18 TABLE 28 LABOUR DIVISION IN DUCK MANAGEMENT.....................................................................................................18 TABLE 29 LABOUR DIVISION IN DUCK MARKETING .......................................................................................................18 TABLE 30 LABOUR DIVISION IN EGG MARKETING .........................................................................................................18 TABLE 31 NUMBERS OF FEMALE AND MALE DUCKS CHARACTERIZED ...................................................................................19 TABLE 32 NUMBERS OF FEMALE AND MALE DUCKS ANALYSED...........................................................................................19 TABLE 33 COMPARISON OF BODY WEIGHTS (GRAMS) ACROSS PROVINCES ...........................................................................19 TABLE 34 COMPARISON OF AVERAGE SHANK LENGTHS (CM) ACROSS PROVINCES ..................................................................20 TABLE 35 PERCENTAGE DISTRIBUTION OF SHANK COLOURS ACROSS PROVINCES....................................................................21 TABLE 36 PERCENTAGE DISTRIBUTION OF BILL COLOURS ACROSS PROVINCES.......................................................................21 TABLE 37 PERCENTAGE DISTRIBUTION OF EYE COLOURS ACROSS PROVINCES .......................................................................22 TABLE 38 PERCENTAGE DISTRIBUTION OF BILL TYPES ACROSS PROVINCES...........................................................................22 TABLE 39 PERCENTAGE DISTRIBUTION OF BEAN COLOURS ACROSS PROVINCES .....................................................................22 TABLE 40 DISTRIBUTION OF CARUNCLE COLOURS ACROSS PROVINCES (NUMBERS OF MUSCOVY DUCKS) .......................................22 TABLE 41 DISTRIBUTION OF DUCKS USED FOR MULTIVARIATE ANALYSIS .............................................................................23 TABLE 42 MAHALANOBIS DISTANCES BETWEEN PROVINCES FOR ANALYSIS CONSIDERING ALL VARIABLES.......................................24 TABLE 43 LITERACY RATES, HOUSEHOLD SIZES AND LANDOWNERSHIP ACROSS THE FIVE PROVINCES (PERCENTAGES) .......................37 TABLE 44 NUMBERS AND IMPORTANCE OF DIFFERENT LIVESTOCK SPECIES ACROSS THE FIVE PROVINCES .......................................38 TABLE 45 BREEDING AND HOUSING ACROSS THE FIVE PROVINCES (PERCENTAGES) ................................................................38 TABLE 46 FEEDING, PRODUCTIVITY AND HEALTH CARE ACROSS THE FIVE PROVINCES ..............................................................38
FIGURE 1 MAP OF CAMBODIA SHOWING THE FIVE PROVINCES SELECTED FOR THE SURVEY..........................................................6 FIGURE 2 MAP SHOWING THE LOCATIONS OF THE SELECTED HOUSEHOLDS.............................................................................8 FIGURE 3 DISTRIBUTION OF BODY WEIGHTS AND SHANK LENGTHS OF MALE AND FEMALE BIRDS ACROSS PROVINCES .........................20 FIGURE 4 CLUSTER ANALYSIS OF DUCKS BASED ON ALL VARIABLES ...................................................................................24 FIGURE 5 MAP OF KAMPONG CHAM SHOWING THE DISTRICTS SELECTED FOR THE SURVEY ........................................................25 FIGURE 6 MAP OF KAMPOT SHOWING THE DISTRICTS SELECTED FOR THE SURVEY ..................................................................28 FIGURE 7 MAP OF ODAR MEANCHEY SHOWING THE DISTRICTS SELECTED FOR THE SURVEY .......................................................30 FIGURE 8 MAP OF RATTANAKIRI SHOWING THE DISTRICTS SELECTED FOR THE SURVEY ............................................................33

4 Characterization of the Domestic Duck Production Systems in Cambodia
Animal Health, Breeds and Livelihoods
Acknowledgements This study was jointly implemented together with a similar one about the characterization of indigenous chicken production systems in Cambodia. The general design of the study was prepared by Badi Besbes, Olaf Thieme and Karin Schwabenbauer, the specific design for Cambodia and overall supervision of the study was by Olaf Thieme. In Cambodia the field data recording was planned and guided by Ellen Geerlings and implemented by a team from the Centre d’Etude et de Development Agricole Cambodigien (CEDAC) under the supervision of Thea Sok. Data entry was done by digital Divide Data (DDD) in Phnom Penh, the data analysis and drafting of the final report by T. Dinesh, Johann Sölkner and Maria Wurzinger from the University of Natural Resources and Applied Life Sciences, Vienna, Austria (BOKU). The authors are greatly indebted to the villagers for sharing their valuable time and knowledge during this study. Appreciation is also expressed to officials, veterinary and para-veterinary staff of the Department of Animal Health and Production, Cambodia for providing support to this study.
Abstract A survey was conducted among 99 farmers in Kampong Cham, Kampot, Odar Meanchey, Rattanakiri and Siem Reap provinces in Cambodia to determine the different duck production systems and to differentiate the phenotypic characteristics of ducks in different provinces. The majority of farmers interviewed were men aged between 40 and 50 years. The illiteracy rate among these farmers is less than the national average of 26.4. Rice is the main agricultural crop in all five provinces, 71.7 percent of the farmers rear cattle/buffaloes and 53.5 percent keep pigs along with their ducks. The average flock size is highest in Siem Reap province (204 birds/flock) and lowest in Kampot (10.4 birds/flock). Across all the survey provinces, about 25.2 percent of the farmers stated that poultry numbers have decreased over the last five years. 70.7 percent of the farmers purchase birds from outside, from nearby markets, neighbours or commercial farms. They prefer to buy ducklings rather than adults, and they do not have any particular selection criteria. About 93 percent of the farmers provide some kind of housing for their birds, usually constructed mainly from simple materials available on-farm. Although the birds depend on scavenging, 95 percent of the farmers provide extra feed. Very few farmers use the available veterinary facilities, and disease is reported as the main cause of mortality. In general, the labour involved in managing and marketing the birds is almost equally divided between men and women. The results of multivariate analysis indicate that ducks in Odar Meanchey province are clearly separated from those in all other populations. The most similar populations are those of Kampong Cham and Siem Reap. A comparison of the distances among ducks and chickens (as reported in a separate document) indicates that there is even greater diversity in ducks than chickens in Cambodia.

5 Characterization of the Domestic Duck Production Systems in Cambodia
Animal Health, Breeds and Livelihoods
Introduction Small-scale duck production makes a significant contribution to household economies and food security, especially in developing countries. In addition, it also contributes to improving the nutritional status of the rural poor. Although chickens dominate the poultry egg and meat sector, in some parts of the world, especially Asia, significant amounts of meat and eggs are produced from ducks. For many rural people, this serves as a renewable asset, especially in emergencies. In Cambodia, ducks account for 18 percent of the total poultry population. Ducks adapt easily and rapidly to various adverse environments and are resistant to many common poultry diseases. They can be reared with unconventional feed and they require little labour for management. They can also be integrated with aquaculture. Ducks convert low-quality feed into quality human food efficiently. Layers provide a steady source of eggs. Broiler ducks reach market weights in short periods. Duck manure can be used as a fertilizer and is a rich source of nitrogen and organic materials; when integrated with fishponds it helps increase plankton quantities. However, small-scale duck producers are constrained by poor access to appropriate technologies and information, as well as to the markets and support services that could substantially improve productivity and income generation. Along with these basic problems, outbreaks of diseases such as highly pathogenic avian influenza (HPAI) pose challenges to rural duck farmers. FAO’s Animal Health, Breeding and Livelihood (AHBL) project on Promoting Strategies for Prevention and Control of Highly Pathogenic Avian Influenza (HPAI) that Focus on Smallholder Livelihoods and Biodiversity was implemented in three countries: Cambodia, Egypt and Uganda. The objective of this project is to define HPAI control methods that have a neutral or positive impact on the livelihoods of small-scale poultry keepers, while helping to maintain poultry breed diversity. This study of duck production from Cambodia is part of that project. Its purpose is to identify and describe specific duck genetic resources and production systems across five geographically and demographically different provinces of Cambodia. The aim is to find out whether and how domestic ducks and their production systems differ in different locations.
6 Characterization of the Domestic Duck Production Systems in Cambodia
Animal Health, Breeds and Livelihoods
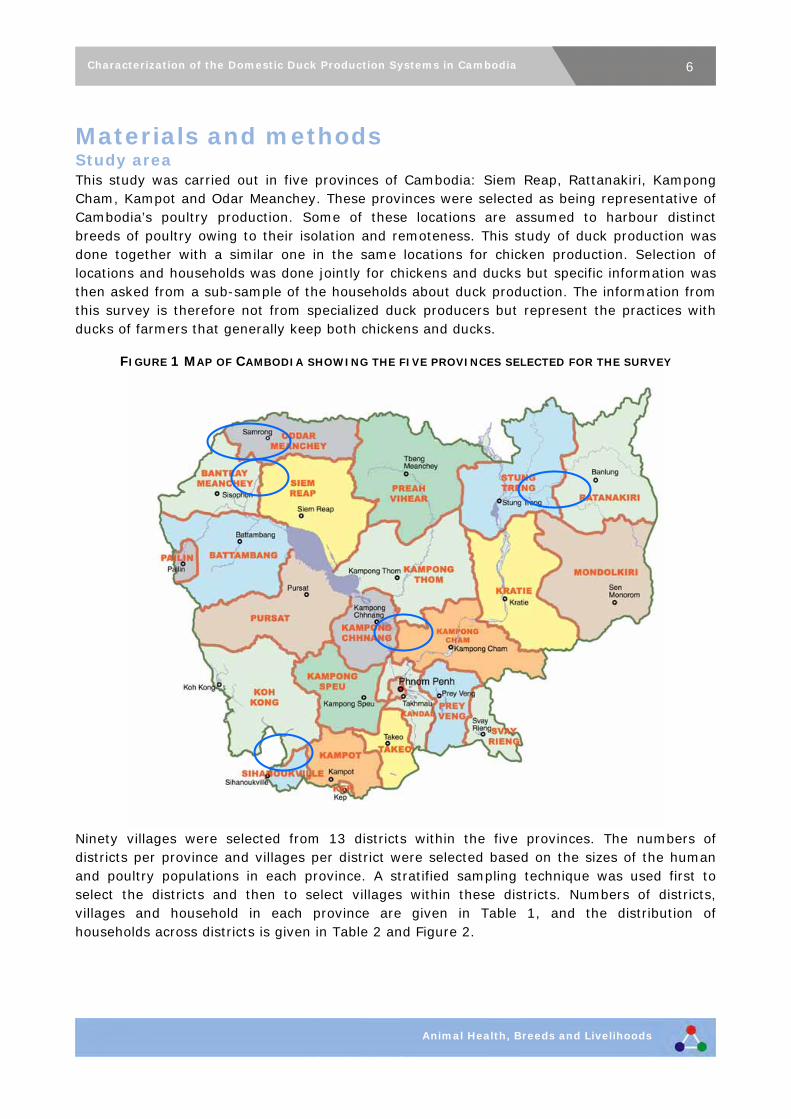
Materials and methods Study area This study was carried out in five provinces of Cambodia: Siem Reap, Rattanakiri, Kampong Cham, Kampot and Odar Meanchey. These provinces were selected as being representative of Cambodia’s poultry production. Some of these locations are assumed to harbour distinct breeds of poultry owing to their isolation and remoteness. This study of duck production was done together with a similar one in the same locations for chicken production. Selection of locations and households was done jointly for chickens and ducks but specific information was then asked from a sub-sample of the households about duck production. The information from this survey is therefore not from specialized duck producers but represent the practices with ducks of farmers that generally keep both chickens and ducks.
FIGURE 1 MAP OF CAMBODIA SHOWING THE FIVE PROVINCES SELECTED FOR THE SURVEY
Ninety villages were selected from 13 districts within the five provinces. The numbers of districts per province and villages per district were selected based on the sizes of the human and poultry populations in each province. A stratified sampling technique was used first to select the districts and then to select villages within these districts. Numbers of districts, villages and household in each province are given in Table 1, and the distribution of households across districts is given in Table 2 and Figure 2.
7 Characterization of the Domestic Duck Production Systems in Cambodia
Animal Health, Breeds and Livelihoods
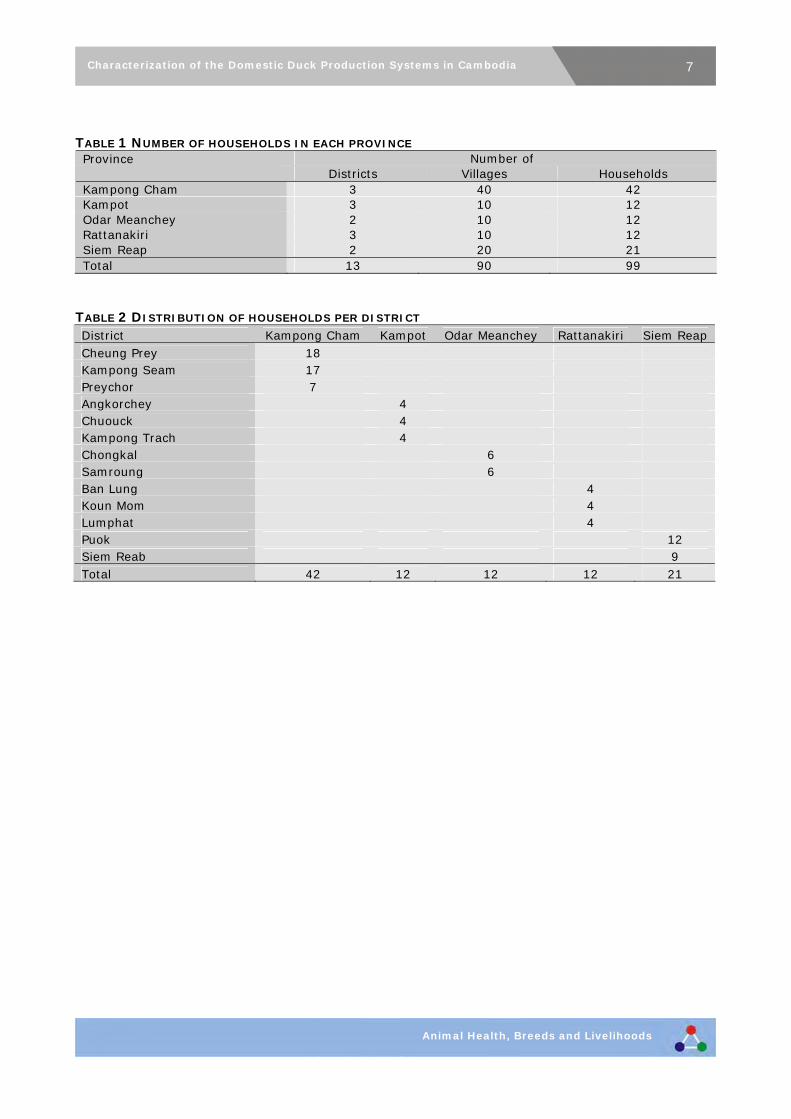
TABLE 1 NUMBER OF HOUSEHOLDS IN EACH PROVINCE Province Number of Districts Villages Households Kampong Cham 3 40 42 Kampot 3 10 12 Odar Meanchey 2 10 12 Rattanakiri 3 10 12 Siem Reap 2 20 21 Total 13 90 99
TABLE 2 DISTRIBUTION OF HOUSEHOLDS PER DISTRICT District Kampong Cham Kampot Odar Meanchey Rattanakiri Siem Reap Cheung Prey 18 Kampong Seam 17 Preychor 7 Angkorchey 4 Chuouck 4 Kampong Trach 4 Chongkal 6 Samroung 6 Ban Lung 4 Koun Mom 4 Lumphat 4 Puok 12 Siem Reab 9 Total 42 12 12 12 21
8 Characterization of the Domestic Duck Production Systems in Cambodia
Animal Health, Breeds and Livelihoods
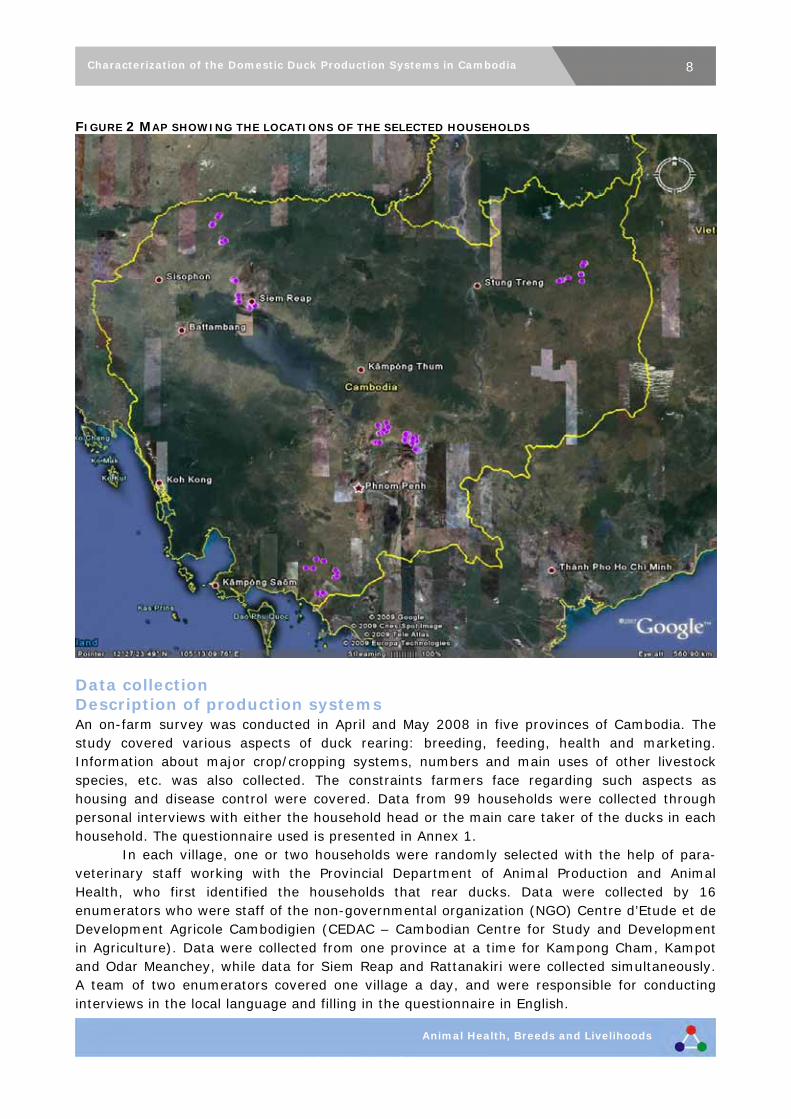
FIGURE 2 MAP SHOWING THE LOCATIONS OF THE SELECTED HOUSEHOLDS
Data collection Description of production systems An on-farm survey was conducted in April and May 2008 in five provinces of Cambodia. The study covered various aspects of duck rearing: breeding, feeding, health and marketing. Information about major crop/cropping systems, numbers and main uses of other livestock species, etc. was also collected. The constraints farmers face regarding such aspects as housing and disease control were covered. Data from 99 households were collected through personal interviews with either the household head or the main care taker of the ducks in each household. The questionnaire used is presented in Annex 1. In each village, one or two households were randomly selected with the help of para-veterinary staff working with the Provincial Department of Animal Production and Animal Health, who first identified the households that rear ducks. Data were collected by 16 enumerators who were staff of the non-governmental organization (NGO) Centre d’Etude et de Development Agricole Cambodigien (CEDAC – Cambodian Centre for Study and Development in Agriculture). Data were collected from one province at a time for Kampong Cham, Kampot and Odar Meanchey, while data for Siem Reap and Rattanakiri were collected simultaneously. A team of two enumerators covered one village a day, and were responsible for conducting interviews in the local language and filling in the questionnaire in English.

9 Characterization of the Domestic Duck Production Systems in Cambodia
Animal Health, Breeds and Livelihoods
It took on average of about 20 minutes to complete each data sheet. Data are based entirely on interviewees’ responses; the enumerators did not carry out any independent assessments through observation. Most of the questions were of multiple-response type, to which farmers could give more than one response. Enumerators were also provided with global positioning system (GPS) hand-sets to record the position of each farm. Phenotypic characterization of duck populations Along with the survey, the enumerators also conducted physical assessments of four or five ducks per household. The data collected were transferred to a checklist which is provided as Annex 2. For each bird, body weight and shank length were measured, and the colours of birds shanks, skins, eyes, beans and caruncles were also noted, as well as the shape of the bill and the carriage. A total of 495 birds were measured. The distribution of these birds across the districts is shown in Table 3. TABLE 3 BIRDS CHARACTERIZED PER DISTRICT District Kampong Cham Kampot Odar Meanchey Rattanakiri Siem Reap Cheung Prey 90 Kampong Seam 82 Preychor 35 Angkorchey 20 Chuouck 20 Kampong Trach 20 Chongkal 29 Samroung 30 Ban Lung 20 Koun Mom 19 Lumphat 20 Puok 60 Siem Reab 50 Total 207 60 59 59 110
Data analysis The NGO, Digital Divide Data (DDD), transferred the information collected by CEDAC to a database. Data were analysed using the statistical analysis software (SAS) computer package (SAS 2007). Frequency counts and means were calculated according to the type of dataset. To analyse traits such as body weight and shank length, the GLM procedure was used, and pair-wise comparison was carried out using the Tukey method. Chi-square was used for the analysis of class variables, and the Bonferoni Holm test for multiple comparisons. Multivariate analysis was conducted to investigate how similar or different the duck populations in the five provinces are. Canonical discriminant analysis was performed to obtain Mahalanobis distances of provinces based on all phenotypic characteristics. In addition, a stepwise discriminant analysis indicates which variates contribute most to differentiation among provinces. The Mahalanobis distances were submitted to cluster analysis to provide a graphical display of similarities/differences. Analysis of production systems by province The data collected were analysed separately for each province, to identify the various production systems and characterize the ducks in each. The data for describing production

10Characterization of the Domestic Duck Production Systems in Cambodia
Animal Health, Breeds and Livelihoods
systems are grouped into four blocks: farmer households and life style, livestock numbers, management, and marketing. Ducks’ productivity and phenotypes are also presented.
Results As the data analysis is based on very few observations (in three of the provinces, only 12 households were interviewed), general conclusions with respect to provincial differences should be made with caution. Description of production system Household and life style The interview was usually administered with the birds’ main care taker. Of the total 99 respondents, sex was recorded for 98, of whom 54 percent (53) are men. Among provinces, the sex ratio of respondents varies from 51 percent men in Kampong Cham to 66.7 percent men in Rattanakiri. TABLE 4 MALE AND FEMALE RESPONDENTS Province Male Female Total
Kampong Cham 20 21 41
Kampot 6 6 12
Odar Meanchey 7 5 12
Rattanakiri 8 4 12
Siem Reap 11 10 21
Total 53 45 98
Of the 99 respondents, 98 have valid age records. Age varies from 18 to 77 years, with 34 percent of respondents belonging to the 40 to 50 years age group. The highest frequency for a single age is 40, with seven observations. 70 percent of the respondents are regular radio listeners but, unlike chicken farmers, duck farmers show wide variation among different provinces, ranging from 57.1 percent in Siem Reap to 83.3 percent in Rattanakiri and Odar Meanchey. Data analysis reveals high mobile phone coverage in all provinces; 96 percent of survey respondents use mobile phones, with this figure rising to 100 percent in Kampot and Siem Reap (Table 5). TABLE 5 RADIO LISTENERS AND MOBILE PHONE USERS
Radio listeners Mobile phone users Province Yes No Total Yes No Total
Kampong Cham 30 12 42 40 2 42
Kampot 7 5 12 12 0 12
Odar Meanchey 10 2 12 11 1 12
Rattanakiri 10 2 12 11 1 12
Siem Reap 12 9 21 21 0 21
Total 69 30 99 95 4 99
Education level of respondents Regarding education level, 96 records were completed and analysed, showing a very similar distribution to that of chicken farmers. Across all five provinces, 15.6 percent of duck farmers are illiterate, 40.6 percent have primary education, 34.3 percent secondary education and only
11Characterization of the Domestic Duck Production Systems in Cambodia
Animal Health, Breeds and Livelihoods
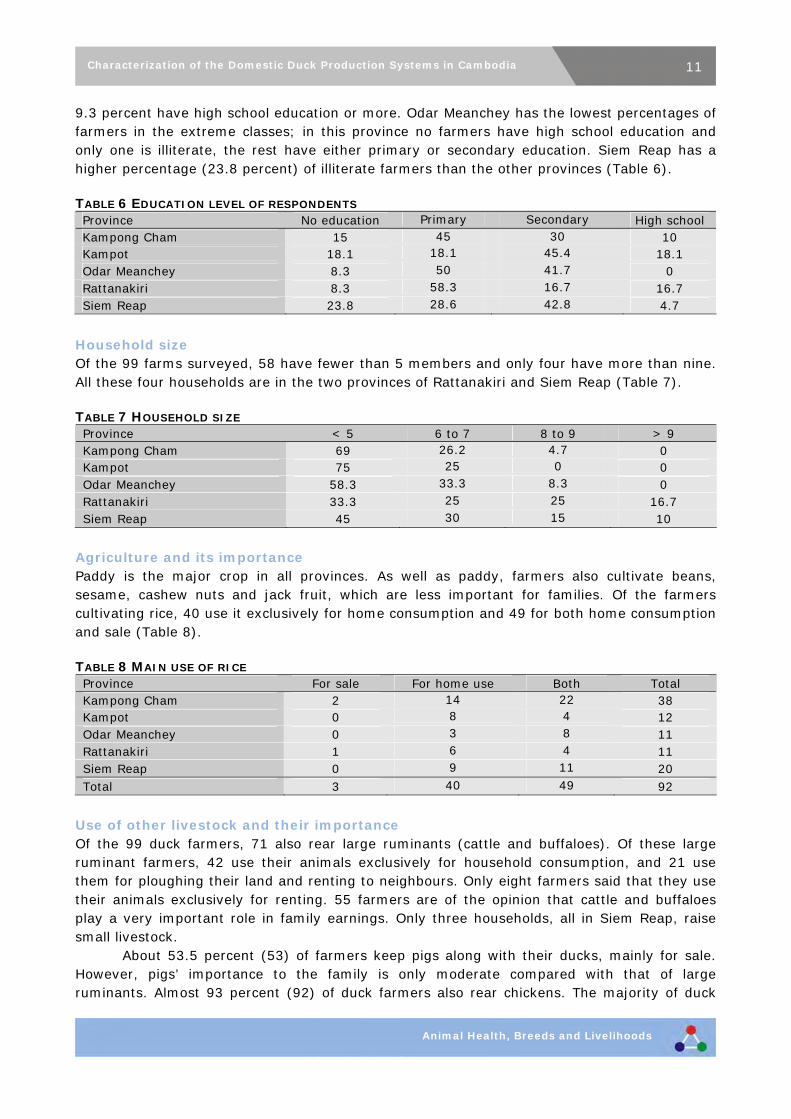
9.3 percent have high school education or more. Odar Meanchey has the lowest percentages of farmers in the extreme classes; in this province no farmers have high school education and only one is illiterate, the rest have either primary or secondary education. Siem Reap has a higher percentage (23.8 percent) of illiterate farmers than the other provinces (Table 6). TABLE 6 EDUCATION LEVEL OF RESPONDENTS Province No education Primary Secondary High school Kampong Cham 15 45 30 10 Kampot 18.1 18.1 45.4 18.1 Odar Meanchey 8.3 50 41.7 0 Rattanakiri 8.3 58.3 16.7 16.7 Siem Reap 23.8 28.6 42.8 4.7
Household size Of the 99 farms surveyed, 58 have fewer than 5 members and only four have more than nine. All these four households are in the two provinces of Rattanakiri and Siem Reap (Table 7). TABLE 7 HOUSEHOLD SIZE Province < 5 6 to 7 8 to 9 > 9 Kampong Cham 69 26.2 4.7 0 Kampot 75 25 0 0 Odar Meanchey 58.3 33.3 8.3 0 Rattanakiri 33.3 25 25 16.7 Siem Reap 45 30 15 10
Agriculture and its importance Paddy is the major crop in all provinces. As well as paddy, farmers also cultivate beans, sesame, cashew nuts and jack fruit, which are less important for families. Of the farmers cultivating rice, 40 use it exclusively for home consumption and 49 for both home consumption and sale (Table 8). TABLE 8 MAIN USE OF RICE Province For sale For home use Both Total Kampong Cham 2 14 22 38 Kampot 0 8 4 12 Odar Meanchey 0 3 8 11 Rattanakiri 1 6 4 11 Siem Reap 0 9 11 20 Total 3 40 49 92
Use of other livestock and their importance Of the 99 duck farmers, 71 also rear large ruminants (cattle and buffaloes). Of these large ruminant farmers, 42 use their animals exclusively for household consumption, and 21 use them for ploughing their land and renting to neighbours. Only eight farmers said that they use their animals exclusively for renting. 55 farmers are of the opinion that cattle and buffaloes play a very important role in family earnings. Only three households, all in Siem Reap, raise small livestock. About 53.5 percent (53) of farmers keep pigs along with their ducks, mainly for sale. However, pigs’ importance to the family is only moderate compared with that of large ruminants. Almost 93 percent (92) of duck farmers also rear chickens. The majority of duck
12Characterization of the Domestic Duck Production Systems in Cambodia
Animal Health, Breeds and Livelihoods
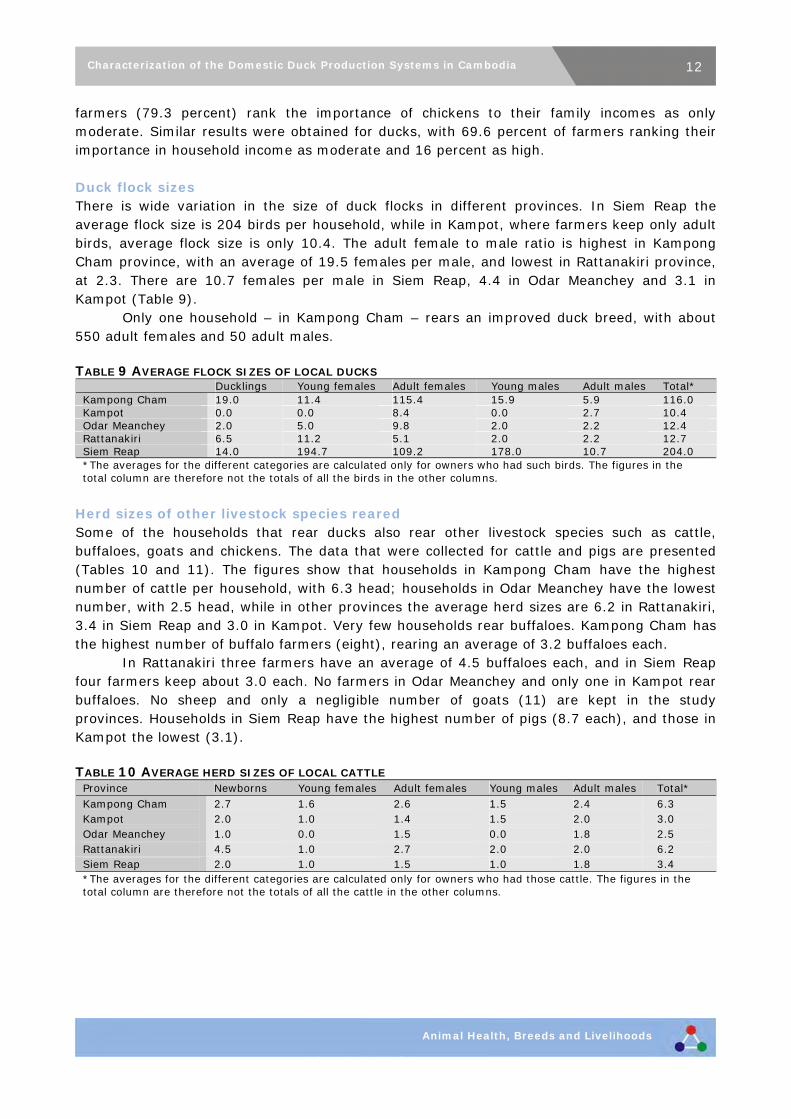
farmers (79.3 percent) rank the importance of chickens to their family incomes as only moderate. Similar results were obtained for ducks, with 69.6 percent of farmers ranking their importance in household income as moderate and 16 percent as high. Duck flock sizes There is wide variation in the size of duck flocks in different provinces. In Siem Reap the average flock size is 204 birds per household, while in Kampot, where farmers keep only adult birds, average flock size is only 10.4. The adult female to male ratio is highest in Kampong Cham province, with an average of 19.5 females per male, and lowest in Rattanakiri province, at 2.3. There are 10.7 females per male in Siem Reap, 4.4 in Odar Meanchey and 3.1 in Kampot (Table 9). Only one household – in Kampong Cham – rears an improved duck breed, with about 550 adult females and 50 adult males. TABLE 9 AVERAGE FLOCK SIZES OF LOCAL DUCKS
Ducklings Young females Adult females Young males Adult males Total* Kampong Cham 19.0 11.4 115.4 15.9 5.9 116.0 Kampot 0.0 0.0 8.4 0.0 2.7 10.4 Odar Meanchey 2.0 5.0 9.8 2.0 2.2 12.4 Rattanakiri 6.5 11.2 5.1 2.0 2.2 12.7 Siem Reap 14.0 194.7 109.2 178.0 10.7 204.0 *The averages for the different categories are calculated only for owners who had such birds. The figures in the total column are therefore not the totals of all the birds in the other columns.
Herd sizes of other livestock species reared Some of the households that rear ducks also rear other livestock species such as cattle, buffaloes, goats and chickens. The data that were collected for cattle and pigs are presented (Tables 10 and 11). The figures show that households in Kampong Cham have the highest number of cattle per household, with 6.3 head; households in Odar Meanchey have the lowest number, with 2.5 head, while in other provinces the average herd sizes are 6.2 in Rattanakiri, 3.4 in Siem Reap and 3.0 in Kampot. Very few households rear buffaloes. Kampong Cham has the highest number of buffalo farmers (eight), rearing an average of 3.2 buffaloes each. In Rattanakiri three farmers have an average of 4.5 buffaloes each, and in Siem Reap four farmers keep about 3.0 each. No farmers in Odar Meanchey and only one in Kampot rear buffaloes. No sheep and only a negligible number of goats (11) are kept in the study provinces. Households in Siem Reap have the highest number of pigs (8.7 each), and those in Kampot the lowest (3.1). TABLE 10 AVERAGE HERD SIZES OF LOCAL CATTLE
Province Newborns Young females Adult females Young males Adult males Total* Kampong Cham 2.7 1.6 2.6 1.5 2.4 6.3 Kampot 2.0 1.0 1.4 1.5 2.0 3.0 Odar Meanchey 1.0 0.0 1.5 0.0 1.8 2.5 Rattanakiri 4.5 1.0 2.7 2.0 2.0 6.2 Siem Reap 2.0 1.0 1.5 1.0 1.8 3.4 *The averages for the different categories are calculated only for owners who had those cattle. The figures in the total column are therefore not the totals of all the cattle in the other columns.

13Characterization of the Domestic Duck Production Systems in Cambodia
Animal Health, Breeds and Livelihoods
TABLE 11 AVERAGE HERD SIZES OF LOCAL PIGS Province Newborns Young females Adult females Young males Adult males Total*
Kampong Cham 6.5 3.3 2.5 16.0 3.0 7.5 Kampot 3.6 0.0 1.8 2.3 0.0 3.1 Odar Meanchey 4.8 3.0 1.3 2.0 0.0 6.0 Rattanakiri 2.0 3.6 1.0 2.0 0.0 5.0 Siem Reap 9.8 1.4 1.7 2.0 0.0 8.7 *The averages for the different categories are calculated only for owners who had those pigs. The figures in the total column are therefore not the totals of all the pigs in the other columns.
Fluctuation in flock size Farmers were given three options regarding fluctuations in flock sizes over the last five years: increase, decrease or remained the same. The majority of respondents (41.8 percent) said that the flock size increased, and only 25.2 percent answered that it decreased. This trend is similar in all five provinces (Table 12). TABLE 12 FLUCTUATION OF DUCK NUMBERS IN THE LAST FIVE YEARS (FARMERS REPORTING)
Province Increase Decrease Remained same Total Kampong Cham 14 16 12 42 Kampot 6 5 1 12 Odar Meanchey 8 2 2 12 Rattanakiri 5 2 4 11 Siem Reap 8 7 6 21 Total 41 32 25 98
61.4 percent of the respondents reported a pattern of seasonal fluctuation in duck numbers over the year, with the highest numbers reported in June, July and December and the lowest in March and April. These trends are similar to those observed among chicken farmers. TABLE 13 MONTHS WITH HIGHEST NUMBERS OF DUCKS (FARMERS REPORTING)
Province Jan Feb Mar Apr May Jun Jul Aug Sep Oct Nov Dec Kampong Cham 7 5 3 6 6 11 12 10 11 10 6 8 Kampot 2 3 3 1 1 1 1 2 3 3 4 3 Odar Meanchey 0 0 0 1 1 2 1 0 0 0 2 2 Rattanakiri 0 0 0 0 2 3 2 1 0 0 1 1 Siem Reap 2 1 1 2 5 5 6 5 5 5 5 6 Total 11 9 7 10 15 22 22 18 19 18 18 20
TABLE 14 MONTHS WITH LOWEST NUMBERS OF DUCKS (NUMBERS OF FARMERS REPORTING)
Province Jan Feb Mar Apr May Jun Jul Aug Sep Oct Nov Dec Kampong Cham 4 6 9 16 5 4 4 3 6 2 5 4 Kampot 1 2 1 3 3 1 0 0 0 0 0 1 Odar Meanchey 0 0 1 2 2 1 0 1 2 2 0 0 Rattanakiri 0 1 2 2 0 0 0 0 0 0 1 0 Siem Reap 2 5 9 9 2 0 1 1 0 0 1 1 Total 7 14 22 32 12 6 5 5 8 4 7 6
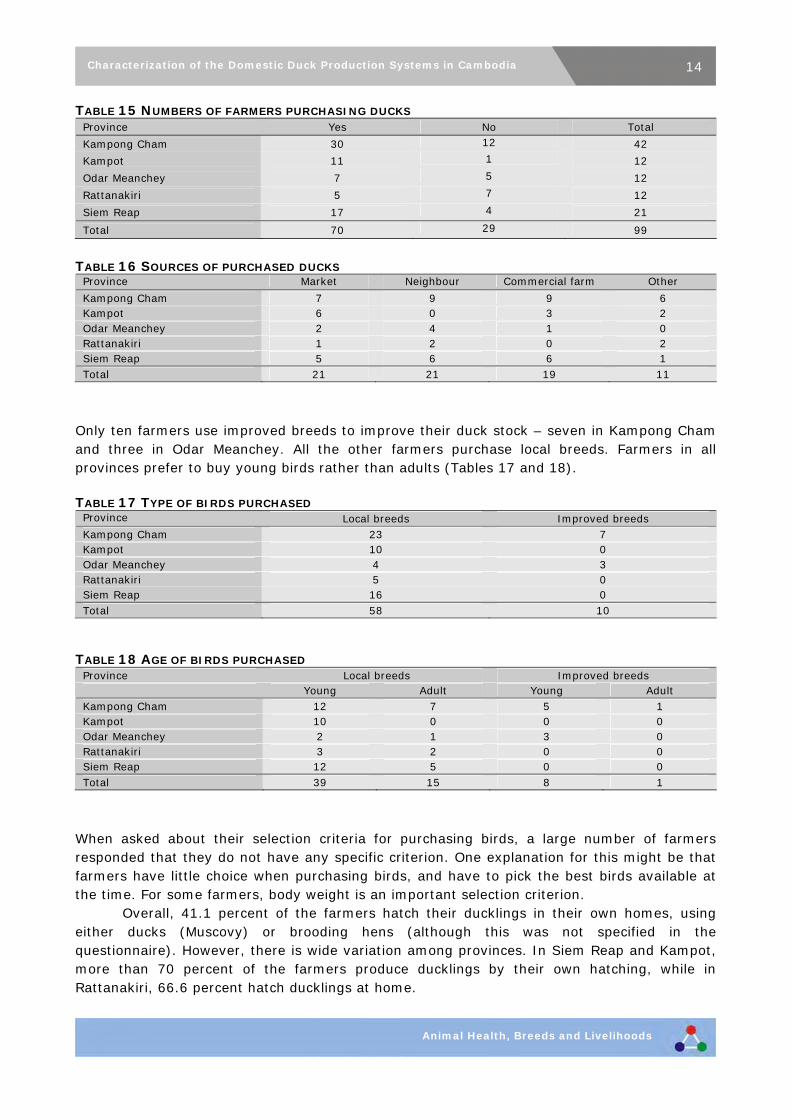
Breeding 70.7 percent of the farmers purchase birds from outside to improve their flocks, from nearby markets, neighbours or commercial farms. Although there are differences among provinces regarding the source of purchases, across the five provinces these three sources are all of almost equal importance (Tables 15 and 16).
14Characterization of the Domestic Duck Production Systems in Cambodia
Animal Health, Breeds and Livelihoods
TABLE 15 NUMBERS OF FARMERS PURCHASING DUCKS Province Yes No Total
Kampong Cham 30 12 42
Kampot 11 1 12
Odar Meanchey 7 5 12
Rattanakiri 5 7 12
Siem Reap 17 4 21
Total 70 29 99
TABLE 16 SOURCES OF PURCHASED DUCKS
Province Market Neighbour Commercial farm Other
Kampong Cham 7 9 9 6 Kampot 6 0 3 2 Odar Meanchey 2 4 1 0 Rattanakiri 1 2 0 2 Siem Reap 5 6 6 1 Total 21 21 19 11
Only ten farmers use improved breeds to improve their duck stock – seven in Kampong Cham and three in Odar Meanchey. All the other farmers purchase local breeds. Farmers in all provinces prefer to buy young birds rather than adults (Tables 17 and 18). TABLE 17 TYPE OF BIRDS PURCHASED
Province Local breeds Improved breeds Kampong Cham 23 7 Kampot 10 0 Odar Meanchey 4 3 Rattanakiri 5 0 Siem Reap 16 0 Total 58 10
TABLE 18 AGE OF BIRDS PURCHASED
Province Local breeds Improved breeds Young Adult Young Adult Kampong Cham 12 7 5 1 Kampot 10 0 0 0 Odar Meanchey 2 1 3 0 Rattanakiri 3 2 0 0 Siem Reap 12 5 0 0 Total 39 15 8 1
When asked about their selection criteria for purchasing birds, a large number of farmers responded that they do not have any specific criterion. One explanation for this might be that farmers have little choice when purchasing birds, and have to pick the best birds available at the time. For some farmers, body weight is an important selection criterion. Overall, 41.1 percent of the farmers hatch their ducklings in their own homes, using either ducks (Muscovy) or brooding hens (although this was not specified in the questionnaire). However, there is wide variation among provinces. In Siem Reap and Kampot, more than 70 percent of the farmers produce ducklings by their own hatching, while in Rattanakiri, 66.6 percent hatch ducklings at home.

15Characterization of the Domestic Duck Production Systems in Cambodia
Animal Health, Breeds and Livelihoods
64.5 percent of the farmers reported that they try to obtain better birds to improve their stock, usually by relying on their own birds for improvement. When selecting which birds to breed from, number of eggs laid is the most important criterion, followed by body weight and disease resistance. Housing and manure disposal Most of the farmers in the study provide some sort of housing for their birds, but the type of construction and the period of housing varies. Only 23 farmers in the five provinces keep their ducks indoors both day and night. About 69 farmers house their ducks at night only, with percentages that vary among provinces, from 100 percent in Kampot to 72.3 percent in Odar Meanchey. Simple farm materials are usually used to construct the houses, although in Kampong Cham and Siem Reap simple purchased materials are also commonly used. Only one farmer (in Kampong Cham) has a duck house built with improved construction techniques (Table 19). TABLE 19 MATERIALS USED FOR BUILDING DUCK HOUSES (NUMBERS OF FARMERS REPORTING)
Province Simple farm materials Simple purchased materials Improved construction Kampong Cham 21 21 1 Kampot 8 4 0
Odar Meanchey 8 2 0
Rattanakiri 9 2 0
Siem Reap 10 9 0
Total 56 38 1
Farmers who do not provide any shelter for their birds gave various reasons for this. The majority (66.7 percent) is of the opinion that housing is not necessary, 22.2 percent said that financial factors hindered them, and 11.1 percent gave other reasons. 86.3 percent of farmers use duck manure as a fertilizer. Feeding Overall figures show that more than 95 percent of the respondents provide feed to their birds, and in Kampot and Siem Reap, 100 percent of farmers do so. Feed includes kitchen waste and/or purchased feedstuff. Of the 98 farmers providing feed, 95 purchase some, and in Kampot and Siem Reap 100 percent of the farmers do so. The most common feedstuff is grain produced on respondents’ own farmland, followed by purchased concentrates. The main source of purchased feed is the market, followed by other miscellaneous sources. In Kampot, none of the farmers buy feed; instead they use grains produced on their own farmland (Tables 20 and 21). TABLE 20 DIFFERENT TYPE AND SOURCE OF SUPPLEMENTED FEED (NUMBERS OF FARMERS
REPORTING) Province Purchased concentrate Grains produced on farms Other sources Kampong Cham 13 26 7 Kampot 0 11 3 Odar Meanchey 1 5 4 Rattanakiri 1 3 7 Siem Reap 3 17 0 Total 18 62 21

16Characterization of the Domestic Duck Production Systems in Cambodia
Animal Health, Breeds and Livelihoods
TABLE 21 SOURCES OF PURCHASED FEED (NUMBERS OF FARMERS REPORTING) Province Market Neighbour Other sources Kampong Cham 20 1 3 Kampot 0 0 0 Odar Meanchey 3 1 3 Rattanakiri 2 0 4 Siem Reap 4 3 0 Total 29 5 10
Animal health and related aspects In total, 42 respondents reported that they note mortalities, keep records of mortality. Mortality data were divided into three periods: period 1 from one day to one month of age; period 2 from one to six months; and period 3 from six months onwards. Numbers of ducklings hatched and surviving periods 1 and 2 are given in Table 22. These figures are from farmers’ answers, which may be less accurate. TABLE 22 AVERAGE NUMBERS OF DUCKLINGS HATCHED AND SURVIVING
Province Number hatched Number surviving until one
month Number surviving until six
months Kampong Cham 13.3 10.0 8.6 Kampot 10.6 10.0 10.0 Odar Meanchey 12.0 9.7 8.2 Rattanakiri 12.6 8.6 6.7 Siem Reap 11.2 8.8 8.3
In all provinces and in all the three periods of life, disease is the main cause of mortality, followed by predators and unknown reasons. TABLE 23 CAUSES OF DUCK LOSSES DURING THE DIFFERENT PERIODS
Province Disease Predator Accident Unknown Losses until one month of age Kampong Cham 16 12 10 7 Kampot 1 1 2 4 Odar Meanchey 6 7 2 2 Rattanakiri 2 5 2 2 Siem Reap 5 1 2 8 Total 30 26 18 23 Losses from one until six months of age Kampong Cham 15 6 7 10 Kampot 1 2 0 1 Odar Meanchey 7 4 4 2 Rattanakiri 2 5 5 2 Siem Reap 3 1 2 0 Total 28 18 18 15 Losses after six months of age Kampong Cham 10 4 3 5 Kampot 0 2 0 0 Odar Meanchey 3 1 2 2 Rattanakiri 2 2 1 2 Siem Reap 3 0 0 0 Total 18 9 6 9
Across all provinces, about three-quarters of the responding farmers (72) do not use any veterinary services for their ducks. The proportions among provinces vary from 65.8 percent in Kampong Cham to 91.6 percent in Rattanakiri. A similar trend is seen for vaccination, with

17Characterization of the Domestic Duck Production Systems in Cambodia
Animal Health, Breeds and Livelihoods
about 80 percent of farmers not following any vaccination programme. In Odar Meanchey and Rattanakiri, none of the farmers vaccinate their flocks. TABLE 24 USE OF VETERINARY SERVICES AND VACCINATION (NUMBERS OF FARMERS REPORTING)
Veterinary services Vaccination Province
Yes No Yes No
Kampong Cham 14 27 12 30
Kampot 4 8 3 9
Odar Meanchey 2 10 0 12
Rattanakiri 1 11 0 12
Siem Reap 5 16 4 17
Total 26 72 19 80
Productivity of birds Ducks’ productivity varied among provinces. The number of production cycles per year ranges from 1.6 in Kampot to 3.6 in Siem Reap. Regarding the number of eggs laid per cycle, the figures vary from 13 in Siem Reap to 15 in Kampong Cham, but these figures are based on answers from just 38 farmers (Table 25). TABLE 25 PRODUCTIVITY OF DUCKS
Province Number of cycles per year Number of eggs per cycle
Kampong Cham 2.9 15.0
Kampot 1.6 14.0
Odar Meanchey 2.5 14.2
Rattanakiri 3.0 14.6
Siem Reap 3.6 13.0
Marketing and labour division Across all provinces, about 52.5 percent of respondents sell excess birds to generate income. The trend is similar in all provinces except Kampot, with only 33.3 percent, and Odar Meanchey, with 41.6 percent. Farmers usually sell the birds to local traders at the farmgate, followed by neighbours (Table 26). TABLE 26 DUCK SALES (NUMBERS OF FARMERS REPORTING)
Province Neighbours Local market
< 10 km Regional
market > 10 km Traders Other
Kampong Cham 9 3 1 16 0
Kampot 2 1 0 1 0
Odar Meanchey 1 1 0 5 0
Rattanakiri 2 3 0 4 0
Siem Reap 8 3 0 2 1
Total 22 11 1 28 1
56.8 percent of the farmers sell eggs, with similar figures found in all provinces except for Rattanakiri, where only 27.2 percent of farmers do so. Unlike their duck sales, farmers prefer to sell eggs to their neighbours, followed by local markets within 10 km (Table 27).

18Characterization of the Domestic Duck Production Systems in Cambodia
Animal Health, Breeds and Livelihoods
TABLE 27 EGG SALES (NUMBERS OF FARMERS REPORTING)
Province Neighbours Local market
< 10 km Regional
market > 10 km Traders Other
Kampong Cham 12 10 1 5 2
Kampot 7 0 0 1 0
Odar Meanchey 2 1 0 6 0
Rattanakiri 3 2 0 0 0
Siem Reap 8 2 1 1 0
Total 32 15 2 13 2
Of the 99 households surveyed, 21 reported that ducks are managed by both the wife and the husband, and 63 that only one partner is responsible. In these cases, responsibility was divided almost equally between men and women, but there is wide variation among provinces. In Kampong Cham more women are responsible for managing birds, while in Siem Reap more men are. Analysis of the labour division for marketing also revealed that the responsibility for selling birds and eggs is divided almost equally between men and women, but again there is variation among provinces (Tables 28, 29 and 30). TABLE 28 LABOUR DIVISION IN DUCK MANAGEMENT (NUMBERS OF FARMERS REPORTING)
Province Both partners One partner Men Women
Kampong Cham 13 23 5 18
Kampot 0 7 5 2
Odar Meanchey 4 8 5 3
Rattanakiri 1 9 5 4
Siem Reap 3 16 12 4
Total 21 63 32 31
TABLE 29 LABOUR DIVISION IN DUCK MARKETING (NUMBERS OF FARMERS REPORTING)
Province Both partners One partner Men Women
Kampong Cham 5 17 6 11
Kampot 0 4 2 2
Odar Meanchey 2 5 2 3
Rattanakiri 1 5 4 1
Siem Reap 0 9 6 3
Total 8 40 20 20
TABLE 30 LABOUR DIVISION IN EGG MARKETING (NUMBERS OF FARMERS REPORTING)
Province Both partners One partner Men Women
Kampong Cham 1 19 6 13
Kampot 0 7 6 1
Odar Meanchey 1 5 2 3
Rattanakiri 1 3 2 1
Siem Reap 0 8 7 1
Total 3 42 23 19
Phenotypic characterization of ducks A total of 495 birds were measured for analysing their morphologic characteristics. Of these birds, 207 were in Kampong Cham and 110 in Siem Reap, with the rest almost equally distributed among the other three provinces (Table 31).

19Characterization of the Domestic Duck Production Systems in Cambodia
Animal Health, Breeds and Livelihoods
TABLE 31 NUMBERS OF FEMALE AND MALE DUCKS CHARACTERIZED Province Female Male Total
Kampong Cham 155 52 207
Kampot 51 9 60
Odar Meanchey 45 14 59
Rattanakiri 44 15 59
Siem Reap 95 15 110
Total 390 105 495
For body weight and shank length, analysis was carried out separately on females and males, while qualitative traits such as skin and shank color, bill color and shape, and bean, eye and caruncle color where analyzed on both sexes together. Body weight Weights of all 495 birds were available, but many of the birds in some provinces were too young, so their weights had to be removed from the dataset. The minimum weight was set at 1 000 g, as there were only 48 birds below this, and they were evenly distributed according to the number of birds in each province. The maximum weight was set at 3 800 g. The numbers and sexes of birds whose weights are included in the dataset are provided in Table 32. TABLE 32 NUMBERS OF FEMALE AND MALE DUCKS ANALYSED
Province Female Male Total Kampong Cham 132 41 173 Kampot 51 9 60 Odar Meanchey 42 10 52 Rattanakiri 39 14 53 Siem Reap 94 15 109 Total 358 97 447
Analysis shows that the heaviest males are in Odar Meanchey and the heaviest females in Rattanakiri. With the exception of those in Kampot, males are heavier than females; the Kampot figure may be due to sampling error, as comparatively few males were sampled in that province. Although the differences in body weight among provinces seem great, they are not significant. TABLE 33 COMPARISON OF BODY WEIGHTS (GRAMS) ACROSS PROVINCES
Sex Kampong Cham Kampot Odar Meanchey Rattanakiri Siem Reap Males 1 659.5a 1 277.7 a 1 987.0 a 1 828.5 a 1 319.3 a Females 1 298.8a 1 342.7 a 1 334.7 a 1 370.0 a 1 303.3 a
abc Means with different superscripts in a row differ significantly (p < 0.05).
Shank length The data for shank length were also analysed separately for males and females, again using body weight cut-off points of 1 000 g and 3 800 g to remove young growing animals from the dataset. After applying the restrictions, 455 birds had valid shank length and sex records. Overall the shank length ranges from 2.5 to 8 cm. The highest frequency is 5 cm for both sexes. Analysis reveals that birds of both sexes in Siem Reap and Kampot have the longest shanks. Birds in these provinces have smaller bodies and longer shanks than those in other provinces. Table 33 shows details of the shank lengths, and Figure 2 compares body weight and shank length.

20Characterization of the Domestic Duck Production Systems in Cambodia
Animal Health, Breeds and Livelihoods
TABLE 34 COMPARISON OF AVERAGE SHANK LENGTHS (CM) ACROSS PROVINCES Sex Kampong Cham Kampot Odar Meanchey Rattanakiri Siem Reap Males 5.5 a 5.7 a 5.3 a 5.6 a 5.7 a Females 5.0 abc 5.3 ac 4.9 b 5.0 abc 5.3 ac
abc Means with different superscripts in a row differ significantly (p < 0.05).
FIGURE 3 DISTRIBUTION OF BODY WEIGHTS AND SHANK LENGTHS OF MALE AND FEMALE BIRDS ACROSS
PROVINCES
0
500
1000
1500
2000
2500
Kampong Cham Kampot Odar Meanchey Rattanakiri Seam Reap
Bod
y w
eigh
t (kg
)
4.4
4.6
4.8
5
5.2
5.4
5.6
5.8
Shan
k L
engt
h (c
m)
body weight male body weight female Shank length Male Shank length Female
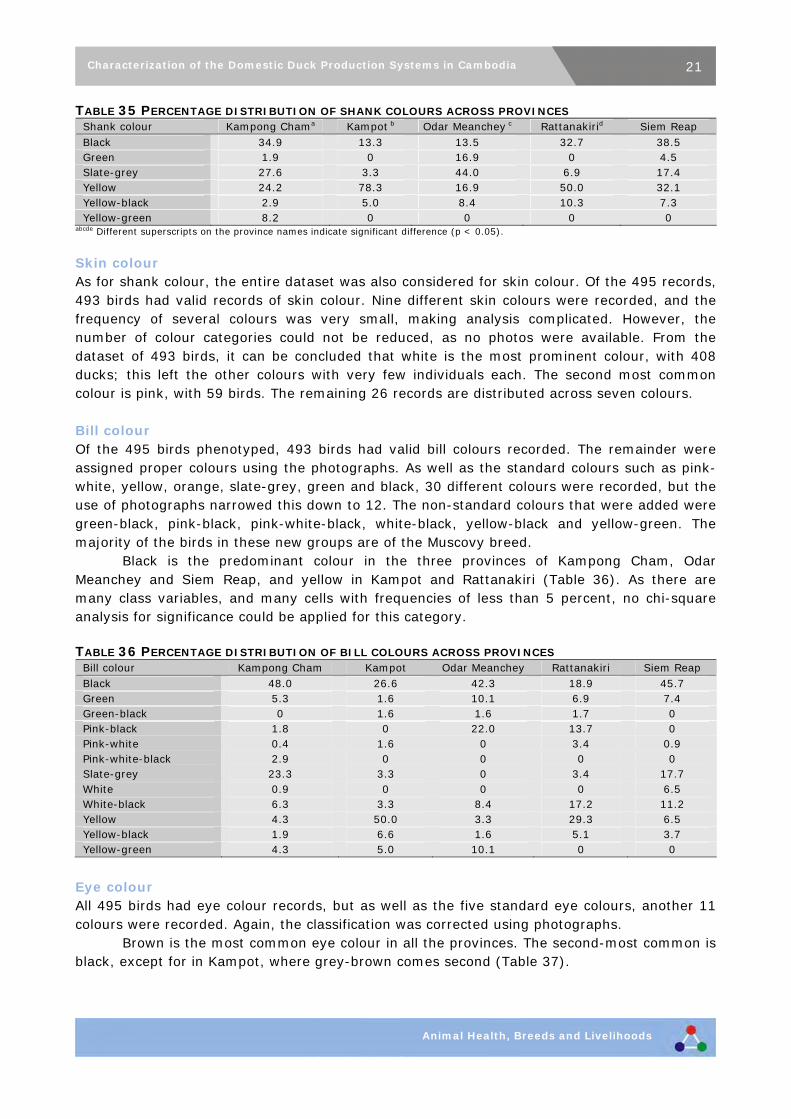
Shank colour In analysing the shank colour, the entire dataset of 495 birds was considered. As well as the standard black, green, slate-grey and yellow varieties, 19 other colour combinations were recorded. This made the analysis impossible, so birds falling into rare colour categories were reclassified based on their photographs. However, not all the birds could be regrouped into the existing categories, so two new colours – yellow-black and yellow-green – were included in the analysis. There is no clear-cut pattern for the distribution of shank colours across provinces. Yellow is the most prominent colour in Kampot and Rattanakiri, black in Kampong Cham and Siem Reap, and slate-grey in Odar Meanchey. Yellow-green is seen only in Kampong Cham. The dominance of yellow in Kampot is greater than the dominance of any single colour in any of the other provinces (Table 35).
21Characterization of the Domestic Duck Production Systems in Cambodia
Animal Health, Breeds and Livelihoods
TABLE 35 PERCENTAGE DISTRIBUTION OF SHANK COLOURS ACROSS PROVINCES Shank colour Kampong Chama Kampot b Odar Meanchey c Rattanakirid Siem Reap Black 34.9 13.3 13.5 32.7 38.5 Green 1.9 0 16.9 0 4.5 Slate-grey 27.6 3.3 44.0 6.9 17.4 Yellow 24.2 78.3 16.9 50.0 32.1 Yellow-black 2.9 5.0 8.4 10.3 7.3 Yellow-green 8.2 0 0 0 0
abcde Different superscripts on the province names indicate significant difference (p < 0.05).
Skin colour As for shank colour, the entire dataset was also considered for skin colour. Of the 495 records, 493 birds had valid records of skin colour. Nine different skin colours were recorded, and the frequency of several colours was very small, making analysis complicated. However, the number of colour categories could not be reduced, as no photos were available. From the dataset of 493 birds, it can be concluded that white is the most prominent colour, with 408 ducks; this left the other colours with very few individuals each. The second most common colour is pink, with 59 birds. The remaining 26 records are distributed across seven colours. Bill colour Of the 495 birds phenotyped, 493 birds had valid bill colours recorded. The remainder were assigned proper colours using the photographs. As well as the standard colours such as pink-white, yellow, orange, slate-grey, green and black, 30 different colours were recorded, but the use of photographs narrowed this down to 12. The non-standard colours that were added were green-black, pink-black, pink-white-black, white-black, yellow-black and yellow-green. The majority of the birds in these new groups are of the Muscovy breed. Black is the predominant colour in the three provinces of Kampong Cham, Odar Meanchey and Siem Reap, and yellow in Kampot and Rattanakiri (Table 36). As there are many class variables, and many cells with frequencies of less than 5 percent, no chi-square analysis for significance could be applied for this category. TABLE 36 PERCENTAGE DISTRIBUTION OF BILL COLOURS ACROSS PROVINCES
Bill colour Kampong Cham Kampot Odar Meanchey Rattanakiri Siem Reap Black 48.0 26.6 42.3 18.9 45.7 Green 5.3 1.6 10.1 6.9 7.4 Green-black 0 1.6 1.6 1.7 0 Pink-black 1.8 0 22.0 13.7 0 Pink-white 0.4 1.6 0 3.4 0.9 Pink-white-black 2.9 0 0 0 0 Slate-grey 23.3 3.3 0 3.4 17.7 White 0.9 0 0 0 6.5 White-black 6.3 3.3 8.4 17.2 11.2 Yellow 4.3 50.0 3.3 29.3 6.5 Yellow-black 1.9 6.6 1.6 5.1 3.7 Yellow-green 4.3 5.0 10.1 0 0
Eye colour All 495 birds had eye colour records, but as well as the five standard eye colours, another 11 colours were recorded. Again, the classification was corrected using photographs. Brown is the most common eye colour in all the provinces. The second-most common is black, except for in Kampot, where grey-brown comes second (Table 37).

22Characterization of the Domestic Duck Production Systems in Cambodia
Animal Health, Breeds and Livelihoods
TABLE 37 PERCENTAGE DISTRIBUTION OF EYE COLOURS ACROSS PROVINCES Eye colour Kampong Chama Kampotd Odar Meancheyab Rattanakiriac Siem Reapbc Black 31.8 13.3 30.5 24.1 14.5 Blue 0 0 1.6 0 0 Brown 57.0 60.0 59.3 74.1 70.9 Grey-brown 4.3 20.0 0 0 1.8 Yellow 6.7 6.7 8.4 1.7 12.7
abcd Different superscripts on the province names indicate significant difference (p < 0.05).
Bill type The majority of the birds have uniform bills, but the proportions in this category vary among provinces, from 71.9 percent in Kampong Cham to 100 percent in Odar Meanchey (Table 38). TABLE 38 PERCENTAGE DISTRIBUTION OF BILL TYPES ACROSS PROVINCES
Bill type Kampong Cham Kampot Odar Meanchey Rattanakiri Siem Reap Uniform 71.9 76.6 100.0 98.3 77.2 Saddle 28.0 23.3 0 1.6 22.7
Bean colour The entire dataset was used in this analysis. The raw data for this characteristic fell into 16 different groups, which were reduced to four standard colours using photographs. Black is the predominant bean colour, with proportions varying from 53.3 percent in Kampot to 92.9 percent in Odar Meanchey. Kampot and Rattanakiri have relatively high percentages of dark beans. Yellow is seen only in Kampot and Rattanakiri (Table 39). TABLE 39 PERCENTAGE DISTRIBUTION OF BEAN COLOURS ACROSS PROVINCES
Bean colour Kampong Cham a Kampot b Odar Meanchay c Rattanakiri b Siem Reap a Black 88.2 53.3 92.9 71.1 87.2 Dark 11.2 26.6 1.7 20.3 12.7 White 0.4 10.0 5.2 3.3 0 Yellow 0 10.0 0 5.0 0
abc Different superscripts on the province names indicate significant differences (p < 0.05).
Other characteristics of Muscovy Of the 495 birds phenotyped, 55 are of the Muscovy breed, which is found in all the provinces except Kampot. The characteristic feature of this breed is its caruncle, which can have different coloured patterns. The study found two colour patterns: red and red-black. No birds with full black caruncles were found. Red is the dominant colour (Table 40). TABLE 40 DISTRIBUTION OF CARUNCLE COLOURS ACROSS PROVINCES (NUMBERS OF MUSCOVY DUCKS) Caruncle colour Kampong Cham Kampot Odar Meanchey Rattanakiri Siem Reap Red 12 0 10 4 16 Red-black 4 0 4 5 0
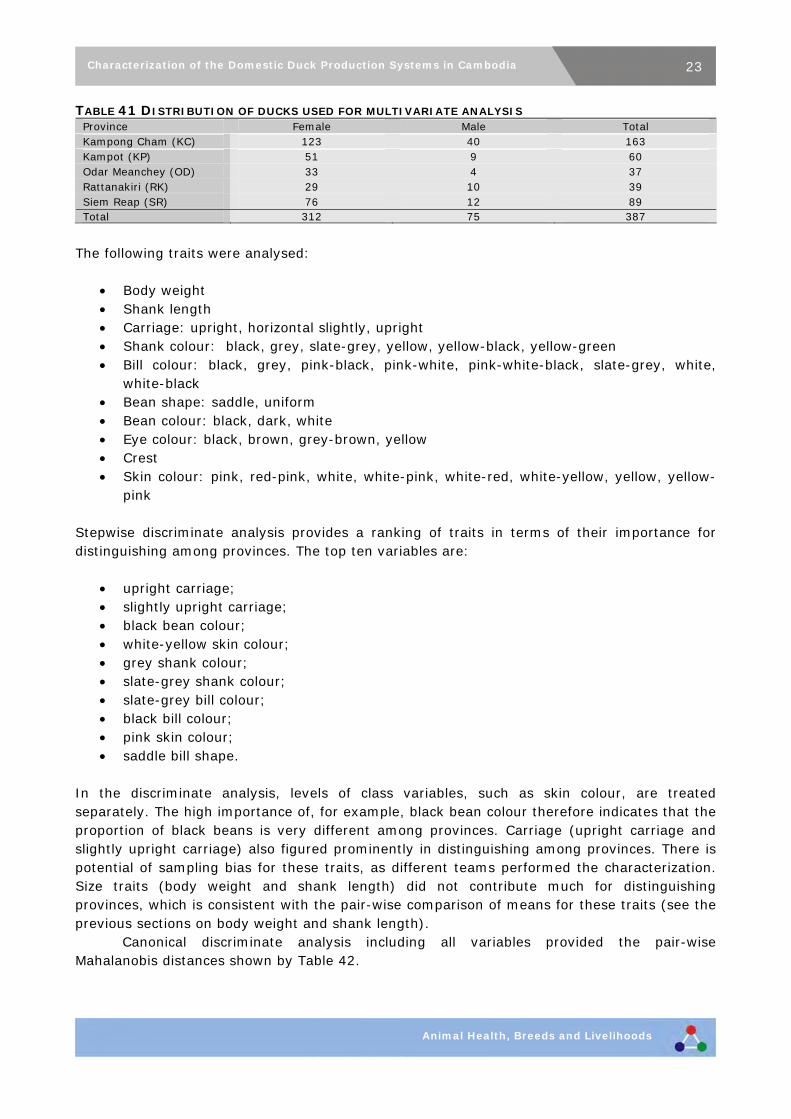
The survey found only 17 crested birds, distributed across all the provinces except Odar Meanchey, with numbers varying from three in Siem Reap and four in Kampong Cham and Kampot, to six in Rattanakiri. Multivariate analysis of phenotypic characteristics of the birds For the multivariate analysis, the 55 Muscovy ducks were removed from the dataset, along with any bird weighing less than 1 000 g or more than 3 800 g. This left a total of 387 birds. Their distribution across provinces and by sex is shown in Table 41.
23Characterization of the Domestic Duck Production Systems in Cambodia
Animal Health, Breeds and Livelihoods
TABLE 41 DISTRIBUTION OF DUCKS USED FOR MULTIVARIATE ANALYSIS Province Female Male Total Kampong Cham (KC) 123 40 163 Kampot (KP) 51 9 60 Odar Meanchey (OD) 33 4 37 Rattanakiri (RK) 29 10 39 Siem Reap (SR) 76 12 89 Total 312 75 387
The following traits were analysed:
Body weight Shank length Carriage: upright, horizontal slightly, upright Shank colour: black, grey, slate-grey, yellow, yellow-black, yellow-green Bill colour: black, grey, pink-black, pink-white, pink-white-black, slate-grey, white,
white-black Bean shape: saddle, uniform Bean colour: black, dark, white Eye colour: black, brown, grey-brown, yellow Crest Skin colour: pink, red-pink, white, white-pink, white-red, white-yellow, yellow, yellow-
pink Stepwise discriminate analysis provides a ranking of traits in terms of their importance for distinguishing among provinces. The top ten variables are:
upright carriage; slightly upright carriage; black bean colour; white-yellow skin colour; grey shank colour; slate-grey shank colour; slate-grey bill colour; black bill colour; pink skin colour; saddle bill shape.
In the discriminate analysis, levels of class variables, such as skin colour, are treated separately. The high importance of, for example, black bean colour therefore indicates that the proportion of black beans is very different among provinces. Carriage (upright carriage and slightly upright carriage) also figured prominently in distinguishing among provinces. There is potential of sampling bias for these traits, as different teams performed the characterization. Size traits (body weight and shank length) did not contribute much for distinguishing provinces, which is consistent with the pair-wise comparison of means for these traits (see the previous sections on body weight and shank length). Canonical discriminate analysis including all variables provided the pair-wise Mahalanobis distances shown by Table 42.

24Characterization of the Domestic Duck Production Systems in Cambodia
Animal Health, Breeds and Livelihoods
TABLE 42 MAHALANOBIS DISTANCES BETWEEN PROVINCES FOR ANALYSIS CONSIDERING ALL
VARIABLES KC KP OD RK SR KC 0 6.90357 13.07724 4.79768 1.80216 KP 6.90357 0 18.86819 5.50909 4.68268 OD 13.07724 18.86819 0 12.49227 13.61084 RK 4.79768 5.50909 12.49227 0 5.44060 SR 1.80216 4.68268 13.61084 5.44060 0
FIGURE 4 CLUSTER ANALYSIS OF DUCKS BASED ON ALL VARIABLES
The results of multivariate analysis indicate that the ducks in Odar Meanchey are clearly separated from all the other populations. The most similar populations are those of Kampong Cham and Siem Reap. A comparison of the distances in ducks and in chickens (reported in a separate document) indicates that there is even more diversity in ducks than in chickens in Cambodia.
25Characterization of the Domestic Duck Production Systems in Cambodia
Animal Health, Breeds and Livelihoods
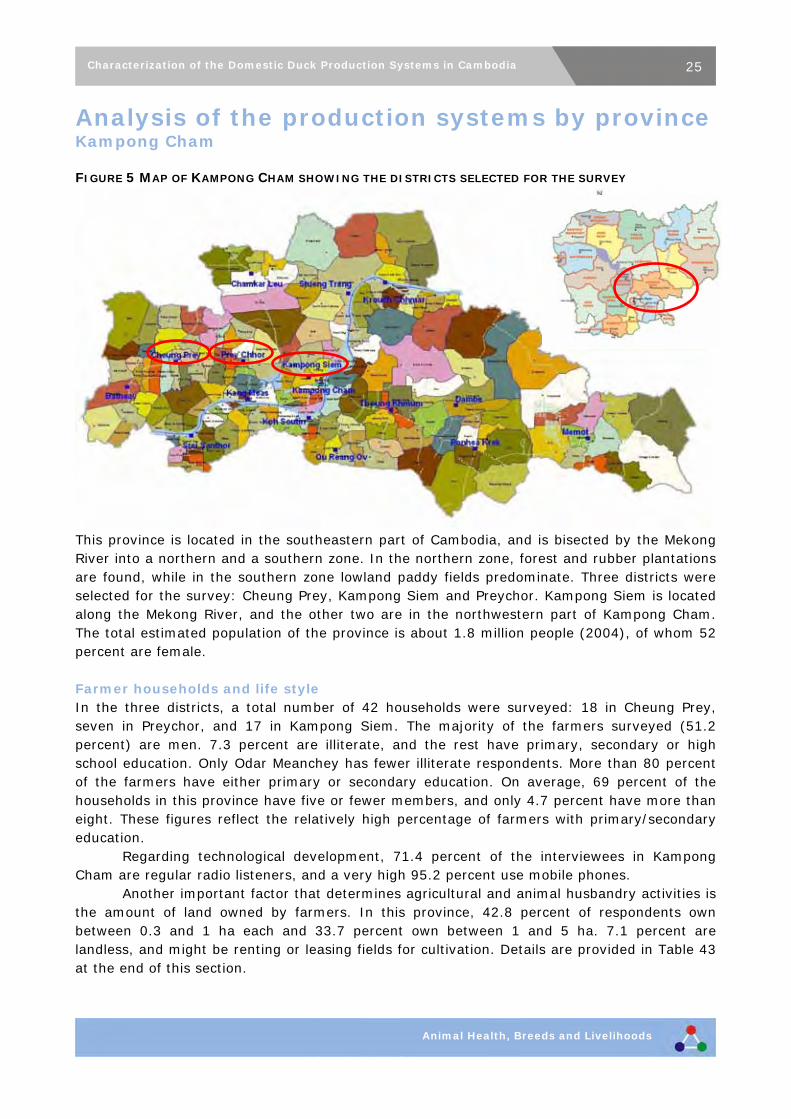
Analysis of the production systems by province Kampong Cham FIGURE 5 MAP OF KAMPONG CHAM SHOWING THE DISTRICTS SELECTED FOR THE SURVEY
This province is located in the southeastern part of Cambodia, and is bisected by the Mekong River into a northern and a southern zone. In the northern zone, forest and rubber plantations are found, while in the southern zone lowland paddy fields predominate. Three districts were selected for the survey: Cheung Prey, Kampong Siem and Preychor. Kampong Siem is located along the Mekong River, and the other two are in the northwestern part of Kampong Cham. The total estimated population of the province is about 1.8 million people (2004), of whom 52 percent are female. Farmer households and life style In the three districts, a total number of 42 households were surveyed: 18 in Cheung Prey, seven in Preychor, and 17 in Kampong Siem. The majority of the farmers surveyed (51.2 percent) are men. 7.3 percent are illiterate, and the rest have primary, secondary or high school education. Only Odar Meanchey has fewer illiterate respondents. More than 80 percent of the farmers have either primary or secondary education. On average, 69 percent of the households in this province have five or fewer members, and only 4.7 percent have more than eight. These figures reflect the relatively high percentage of farmers with primary/secondary education. Regarding technological development, 71.4 percent of the interviewees in Kampong Cham are regular radio listeners, and a very high 95.2 percent use mobile phones. Another important factor that determines agricultural and animal husbandry activities is the amount of land owned by farmers. In this province, 42.8 percent of respondents own between 0.3 and 1 ha each and 33.7 percent own between 1 and 5 ha. 7.1 percent are landless, and might be renting or leasing fields for cultivation. Details are provided in Table 43 at the end of this section.

26Characterization of the Domestic Duck Production Systems in Cambodia
Animal Health, Breeds and Livelihoods
Livestock numbers Farming households rear relatively large numbers of cattle, pigs and ducks. Two-thirds of households keep cattle, with an average of about 6.3 head each. Only 40.4 percent of the farmers keep pigs, with an average of 7.5 pigs each. Each farmer also rears about 116 ducks. Only eight farmers also keep buffaloes, with an average of 3.2 animals per household. The numbers of cattle and pigs per household are the highest among all the provinces, while duck numbers are the second highest. None of the interviewed farmers rear sheep or goats. Each farmer rears about 19 ducklings, 11.4 young females, 115.4 adult females, 15.9 young males and 5.9 adult males. The adult female to male ratio is about 1:19.5. Even with this high number of ducks per household, only 19 percent of the farmers said that the income from ducks is highly important to their families. The majority ranked this importance as medium, and a relatively high 4.7 percent said that the income from ducks is not important at all. This response pattern is not found in any of the other provinces. For pigs, 63 percent of the farmers said that the importance is only moderate, whereas 75 percent said that income from cattle is highly important. The large number of farmers owning relatively large areas of land may be the reason for this phenomenon. These figures also point to the importance of rice cultivation in farmers’ livelihoods, as cattle in Cambodia are used mainly for draught purposes. About 28.5 percent of the farmers said that the number of ducks decreased in the last five years, owing to various reasons. This is a higher figure than in any other province except Siem Reap. Details are provided in Table 44 at the end of this section. Only one farmer in Kampong Cham rears improved ducks, and keeps about 600 birds – 550 adult females and 50 adult males. Breeding When asked about their breeding and husbandry practices, about 71.4 percent of the farmers in Kampong Cham reported that they buy birds from outside for their stock, relying mainly on commercial duck farms and neighbours for their purchases, followed by local markets. Of those buying birds, 76.6 percent prefer local breeds, and the others buy improved breeds. However, these figures contradict other survey results, as only one farmer reported keeping improved birds, while six claimed to look for improved types. Farmers prefer to purchase young birds, and most do not have any special criteria for their purchasing decisions. This might be because they buy young birds from commercial farms and may have little choice for selection. About 60 percent of the farmers seek to improve their flocks, and 48.1 percent of these farmers rely on their own birds for doing so. Number of eggs laid and body weight are the two main factors they consider when selecting for breeding. Housing About 30 percent of the farmers in Kampong Cham said that they house their birds both day and night, but the survey result does not make it clear whether this refers to all their birds or only part of the flock (such as ducklings). All the other provinces have lower figures for this category. Of the remaining households, 82.3 percent provide night housing. The materials used for house construction also differed, with about 50 percent using simple farm materials and the rest simple purchased materials. These figures show that farmers prefer low-cost housing with few inputs, as a measure to help make farming cost-effective. None of the farmers who do not provide housing gave economic reasons for this; they all said that they thought that housing is not necessary. Details are provided in Table 45 at the end of this section.
27Characterization of the Domestic Duck Production Systems in Cambodia
Animal Health, Breeds and Livelihoods
Feeding 97.5 percent of the farmers in Kampong Cham provide feed, and 28.2 of these farmers purchase it. This proportion varies widely among provinces, but Kampong Cham’s is the highest. The main source of purchased feed is the local market, and the main feed used is grain produced on the farm. Details are provided in Table 46 at the end of this section. Productivity The productivity of the birds depends on all of the factors mentioned in the previous paragraphs. The survey’s information about productivity is based on farmers’ responses. Farmers reported an average of about 2.9 production cycles a year, with an average of 15 eggs per cycle. This is the highest figure among all the provinces, but only 61.5 percent of the farmers responded to this question, probably because the farmers kept layer ducks. Of the ducklings hatched, only 64.6 percent survive beyond six months. According to the farmers, disease is the main cause of mortality in all three phases. 34.3 percent of the farmers use the available veterinary facilities, which is the highest figure among the five provinces. According to farmers’ experience, ducks start laying at about six months of age. Details are provided in Table 46 at the end of this section. Marketing and labour division 57.1 percent of the respondent households sell their excess birds, mainly to local traders at the farmgate, followed by neighbours and then local markets within 10 km. About 61 percent of the farmers sell eggs, preferably to neighbours, followed by local markets and then traders. 13 farmers reported that both the husband and the wife are responsible for managing the birds, and 23 farmers that only one is – in 78.2 percent of cases, the woman. Women are responsible for marketing eggs in 68.4 percent of the households, and for marketing birds in 64.7 percent. In general, therefore, women have more control over the management and marketing of birds and eggs in Kampong Cham. Phenotypic characterization of ducks Of the 207 birds phenotyped in Kampong Cham, a dataset of 173 (132 females and 41 males) was used for the analysis of body weight and shank length. On average, male birds weigh about 1 659.5 g and females 1 298.8 g, with average shank lengths of 5.5 and 5 cm respectively. The body weight of females is the lowest in all the provinces. Black is the most common shank colour, with 34.9 percent, followed by slate-grey, with 27.6 percent, and yellow, with 24.2 percent. The most common bill colour is black, with 48 percent, followed by slate-grey, with 23.3 percent. All 12 bill colours except green-black are found in this region, but none of the others have a share of more than 7 percent. The proportions of black and slate-grey are the highest in all provinces. Brown is the most common eye colour, with 57 percent, followed by black. No birds with blue eyes were reported in this study area. The proportion of saddle bills is the highest in all provinces, at about 28 percent. Black is the most prominent bean colour, with 88.2 percent, followed by dark. 10.5 percent of the birds phenotyped in this area were of the Muscovy type, of which 75 percent have red caruncles and the rest have red-black caruncles.

28Characterization of the Domestic Duck Production Systems in Cambodia
Animal Health, Breeds and Livelihoods
Kampot FIGURE 6 MAP OF KAMPOT SHOWING THE DISTRICTS SELECTED FOR THE SURVEY
Kampot is located on the southern part of Cambodia on the coast of the Gulf of Thailand. The topography ranges from coastal areas along the southern border, to extensive lowland paddy fields in the east, and forested areas in the west. The estimated population is about 595 000 people, of whom 52 percent are female. Three districts were included in the survey: Angkorchey, Chuouk and Kampong Trach. Kampong Trach is located in the southwestern part of the province, near the coastal area; the other two districts are in central and western parts respectively. Farmer households and life style Only 12 households were surveyed in this province, four in each district. Hence any conclusions drawn from these results should be treated with caution. The proportion of men involved in duck farming (50 percent) is comparatively small. About 18.1 percent of the farmers surveyed are illiterate. 75 percent of the households have fewer than five members, and 25 percent six or seven. While 100 percent of the farmers use mobile phones, only 58.8 percent listen regularly to the radio. Another interesting figure from this province is that there are no landless farmers and no farmers in the survey owning more than 5 ha. About 91.6 percent of respondents own between 0.3 and 5 ha. This figure is the highest in all the provinces, and these figures show that land is distributed relatively equitably among farmers. Details are provided in Table 43 at the end of this section.
29Characterization of the Domestic Duck Production Systems in Cambodia
Animal Health, Breeds and Livelihoods
Livestock numbers Each farmer rears an average of about 3 head of cattle. All households keep cattle, and 58.3 percent rear pigs, with an average of 3.1 pigs each. None of the farmers keep sheep or goats and only one farmer keeps buffaloes (two). On average each household rears about 10.4 ducks, which is the lowest figure in all five provinces. Farmers in Kampot rear only adult females and males, and no young birds were seen during the survey. On average, each farmer has 8.4 females and 2.7 males. The adult female to male ratio is 1:3.1. None of the interviewed farmers keep improved breeds. As there are very few ducks per household, none of the farmers consider the income from them as highly important to their families. 100 percent of them consider the income from pigs as moderately important, and 83.3 percent consider the income from cattle as highly important. Only 8.3 percent of the farmers in this province said that duck numbers decreased over the last five years. This is the lowest figure from all five provinces. Details are provided in Table 44 at the end of this section. Breeding 91.6 percent of the farmers said that they buy birds from outside to improve their stock; 60 percent rely on the market and the rest on commercial farms and other sources, in equal numbers. None of the farmers depend on neighbours for purchases, possibly because of the low number of ducks per household. Farmers usually buy young ducks, and body weight is the main criterion for selecting purchases. About two-thirds of the farmers said that they seek to improve their flocks, and the majority relies on their own stock for doing so. Here again, body weight is the main selection criterion. About 75 percent of the farmers said that they do not hatch ducklings. Details are provided in Table 45 at the end of this section. Housing None of the farmers provide housing to their birds both day and night, but 100 percent provide housing at night. Two-thirds of them use simple farm materials and the rest use simple purchased materials. Details are provided in Table 45 at the end of this section. Feeding All farmers provide feed, but none of them spend money on it. Details are provided in Table 46 at the end of this section. Productivity According to the farmers, a female duck has about 1.6 production cycles per year, with 14 eggs per cycle. Only 25 percent of the farmers answered this question, probably because the farmers kept layer ducks. Those answering that about 93.7 percent of the ducklings hatched survive beyond six months, but again only 25 percent answered this question, so the results should be treated cautiously. However, 83 percent of the farmers explained that only 71 percent of the ducklings they purchase survive to six months. According to farmers, the main causes of losses are accidents during the first month and predators later on. Disease does not cause any losses after the first month. The birds are about 5.9 months of age when they start producing eggs. Details are provided in Table 46 at the end of this section. Marketing and labour division Only 33.3 percent of the households sell their excess birds, mainly to neighbours. On the other hand, 75 percent of the farmers sell eggs, again usually to neighbours. The low number of birds may be the reason for this high preference for selling to neighbours. Analysis of the

30Characterization of the Domestic Duck Production Systems in Cambodia
Animal Health, Breeds and Livelihoods
labour division showed that more men than women are responsible for managing birds and selling eggs, but women and men are equally responsible for selling birds. Phenotypic characterization of ducks A total of 60 birds were characterized in Kampot: 51 females and 9 males. All of them had valid records. On average male birds weigh about 1 277.7 g and females 1 342.7 g, with average shank lengths of 5.7 and 5.3 cm respectively. This lower body weight of males compared with females might be due to sampling errors, as only nine males were phenotyped. In general, birds have small bodies and long shanks. These two traits are similar to those found in Siem Reap. Yellow is the most common shank colour, with 78.3 percent, followed by black, with 13.3 percent. There are no yellow and yellow-green shanks in the sampled population. The most common bill colour is yellow, with 50 percent, followed by black-grey, with 26.6 percent. The proportion of yellow bills is the highest among all provinces. Brown is the most common eye colour, with 60 percent, followed by grey-brown, with 20 percent. No birds with blue eyes were found in this province. About 23 percent of the birds have saddle bills. Black is the most prominent bean colour, with 88.2 percent, followed by dark. A comparatively high 10 percent of white and yellow beans is also found in this province. There are no Muscovy ducks among the phenotyped birds. Odar Meanchey FIGURE 7 MAP OF ODAR MEANCHEY SHOWING THE DISTRICTS SELECTED FOR THE SURVEY
This province is located in northwestern Cambodia, bordering Thailand to the north. The topography varies from lowland mosaic areas to upland forested areas. This province is the most remote of those considered in the study, and was included in anticipation of finding specific local genetic resources. The estimated population is about 95 000 people, of whom 49 percent are female.

31Characterization of the Domestic Duck Production Systems in Cambodia
Animal Health, Breeds and Livelihoods
The population density, at 14 per square kilometre, is lower than that of other provinces. The survey was conducted in two districts: Chongkal and Samroung. These districts are located in the western part of the province, and Chongkal borders Siem Reap to its south. In total, 12 households were surveyed in this province, six in each district. Farmer households and life style 58.3 percent of the farmers surveyed were men, the second highest figure in all five provinces. None of the farmers is illiterate or has high school education; 100 percent have either primary or secondary education. 58.3 percent of the households have fewer than five members, 33.3 percent have six or seven members, and 8.3 percent eight or nine. About 8.3 percent of the farmers are landless, and 83.3 percent have between 0.3 and 5 ha of land. None of the farmers owns less than 0.3 ha or between 5 and 10 ha. 83.3 percent of respondents are regular radio listeners, which is the highest figure reported in all provinces, shared with Rattanakiri. Mobile phone coverage is about 91.6 percent; this comparatively low figure might be due to the remoteness of the province. Details are provided in Table 43 at the end of this section. Livestock numbers About 66.6 percent of the households keep cattle, and 83 percent rear pigs. Each of these households rears about 2.5 head of cattle, 6 pigs and 12.4 ducks. Each farmer keeps about 2 ducklings, 5 young females, 9.8 adult females, 2 young males and 2.2 adult males. The adult female to male ratio is about 1:4.4. Even with so few ducks per household, 60 percent of the farmers said that the income from ducks is highly important. This figure seems contradictory. 50 percent of the farmers said that the income from pigs is very important and about 87.5 percent that the income from cattle is. None of the farmers in Odar Meanchey rears improved ducks. Only 16.6 percent believed that the numbers of ducks decreased in the last five years. This trend is similar to that of Rattanakiri. Details are provided in Table 44 at the end of this section. Breeding About 58 percent of the farmers in Odar Meachey buy ducks for their flocks, mainly from neighbours. They prefer to buy young ducks of local breeds. No criteria are applied during this process. As in other provinces, the farmers involved in improving their flocks depend mainly on their own ducks for doing so. 50 percent of the farmers hatch ducklings for replacement. Details are provided in Table 45 at the end of this section. Housing 16.6 percent of the farmers house their birds day and night. Of the remainder, only 72.7 percent provide night shelter, which is the lowest proportion in all five provinces. Of those providing housing, 80 percent use simple on-farm materials for construction, and the rest use simple purchased materials. 25 percent of the farmers who do not provide housing gave economic reasons for this. Details are provided in Table 45 at the end of this section. Feeding 91.6 percent of the surveyed farmers provide feed. Of these farmers, only 10 percent purchase feed concentrate. The main source of purchased feed is local markets. Details are provided in Table 46 at the end of this section.
32Characterization of the Domestic Duck Production Systems in Cambodia
Animal Health, Breeds and Livelihoods
Productivity Farmers reported that they get 2.5 production cycles per year, with 14.2 eggs per cycle. These figures are based on the responses of 50 percent of the farmers. Only 68.8 percent of the ducklings hatched survive to six months, compared with about 82 percent of those purchased. The main causes of losses are predators in the first month and disease later on. Only 16.6 percent of farmers use veterinary assistance. Farmers reported seven months as the age of ducks at first lay, this is the highest age found in all provinces. Details are provided in Table 46 at the end of this section. Marketing and labour division In Odar Meanchey, only 41.6 percent of farmers sell their excess birds, mainly to traders at the farmgate. About 63.6 percent sell eggs, again to traders at the farmgate. In this province, the management of birds and the marketing of eggs and birds are dominated by men. Phenotypic characterization of ducks In total 59 birds were phenotyped in Odar Meanchey: 45 females and 14 males. After applying restrictions, 42 females and ten males were selected for the analysis of body weight and shank length. Male birds weigh about 1 987 g and females 1 334.7 g, with average shank lengths of 5.3 and 4.9 cm respectively. Slate-grey is the most common shank colour, with 44 percent, followed by yellow and green, with 16.9 percent each. The most common bill colour is black, with 42.3 percent, followed by pink-black, with 22 percent. The proportion of pink-black bills is the highest in all provinces. Brown is the most common eye colour, with 59.3 percent, followed by black, with 30.5 percent. 1.6 percent of the birds have blue eyes. This is the only province with blue-eyed birds. 100 percent of the birds in Odar Meanchey have uniform bills. Black is the most prominent bean colour, with 92.9 percent, followed by dark. About 23.7 percent of the birds phenotyped in this province are Muscovy ducks, the highest percentage in any province; among these, 71 percent have red caruncles.

33Characterization of the Domestic Duck Production Systems in Cambodia
Animal Health, Breeds and Livelihoods
Rattanakiri FIGURE 8. MAP OF RATTANAKIRI SHOWING THE DISTRICTS SELECTED FOR THE SURVEY
The province of Rattanakiri is located in the northeastern corner of Cambodia; it borders Lao People’s Democratic Republic to the north and Viet Nam to the east. The topography comprises upland forest areas and river valleys. The estimated population is about 118 000 people, of whom 51 percent are female. Three districts were selected for the survey: Ban Lung, Koun Mom and Lumphat. Four households were surveyed in each district. These three districts are located towards the south and central parts of the province. Farmer households and life style Of the farmers surveyed, 66.6 percent are men. About 18.1 percent of them are illiterate, and the rest have primary, secondary or high school education. The illiteracy rate is similar to that in Kampot. A relatively high 25 percent of households have more than eight members, which is the largest proportion in all provinces. Only 33.3 percent have fewer than five members, which is the lowest proportion in all provinces. This large family size could be a reflection of the high illiteracy rate. Nearly 83.3 percent of the farmers are regular radio listeners, and about 91.6 percent use mobile phones. The proportion using mobile phones is the lowest (along with Odar Meanchey) in all provinces. The general backwardness of the province might be the reason. 8.3 percent of the interviewees do not own any farmland, but there is also a large number owning more than 5 ha – about 25 percent. This is the highest figure in all the provinces. In general, there is wide disparity in land distribution, with a large number of people without any land and some farmers owning comparatively large areas. Details are provided in Table 43 at the end of this section.
34Characterization of the Domestic Duck Production Systems in Cambodia
Animal Health, Breeds and Livelihoods
Livestock numbers Only 41.6 percent of the households rear cattle, each having about 6.2 head. One-third of the households keep buffaloes and pigs, with averages of 4.5 and 5 respectively. The number of ducks reared per household (12.7) is similar to that in Odar Meanchey. The unequal land distribution and general backwardness may be the reason for these low figures. Each farmer rears about 6.5 ducklings, 11.2 young females, 5 adult females, 3 young males and 1.8 adult males. The average adult female to male ratio is 1:2.7. None of the farmers in Rattanakiri consider the income from ducks as highly important. The low number of birds per household might be the reason for this. Only 66.6 percent said that the income from cattle is highly important, which is the lowest figure in all provinces. This is probably because, compared with other provinces, fewer farmers (only 72.7 percent) reported rice as the main crop. This figure, along with the lower importance of cattle clearly indicates that Rattanakiri is less dependent on rice than the other provinces are. The topography of the land may not be suitable for rice cultivation. About 18.1 percent of the farmers said that duck numbers decreased over the last five years. Details are provided in Table 44 at the end of this section. Breeding Only 41.6 percent of the farmers buy ducks for their flocks, which is the lowest figure among all five provinces. Those who do buy, do so mainly from neighbours or other sources. They prefer to buy local birds and ducklings. All of the farmers said that they try to improve their stocks and, in-line with observations from other provinces the majority relies on their own stock for this. Body weight is the most important criterion for breeding selection. Two-thirds of the farmers hatch their own ducklings. Details are provided in Table 45 at the end of this section. Housing Only 16.6 percent of the farmers in Rattanakiri provide housing day and night. Of the remainder, 80 percent provide night housing. Nearly 82 percent of these farmers use simple farm materials for constructing houses, and 16.6 percent use simple purchased materials. Details are provided in Table 45 at the end of this section. Feeding 91.6 percent of the farmers in Rattanakiri provide feed for their birds. This is lower than in other provinces, except Odar Meanchey. Of the farmers providing feed, only 11.1 percent purchase it, mainly from nearby markets. Details are provided in Table 46 at the end of this section. Productivity Each bird has an average of three production cycles per year, with 14.6 eggs per cycle. Both of these figures are the second highest reported from all provinces. A comparatively high 66.6 percent of farmers answered this question. The duckling survival rate is the lowest in all provinces, with only 53.5 percent of the ducklings hatched surviving to six months. The main causes of losses are predators before and disease after six months of age. 90 percent of purchased ducklings survive six months. Ducks start laying eggs at 6.2 months of age. In this province only 8.3 percent of farmers use veterinary services. Details are provided in Table 46 at the end of this section.
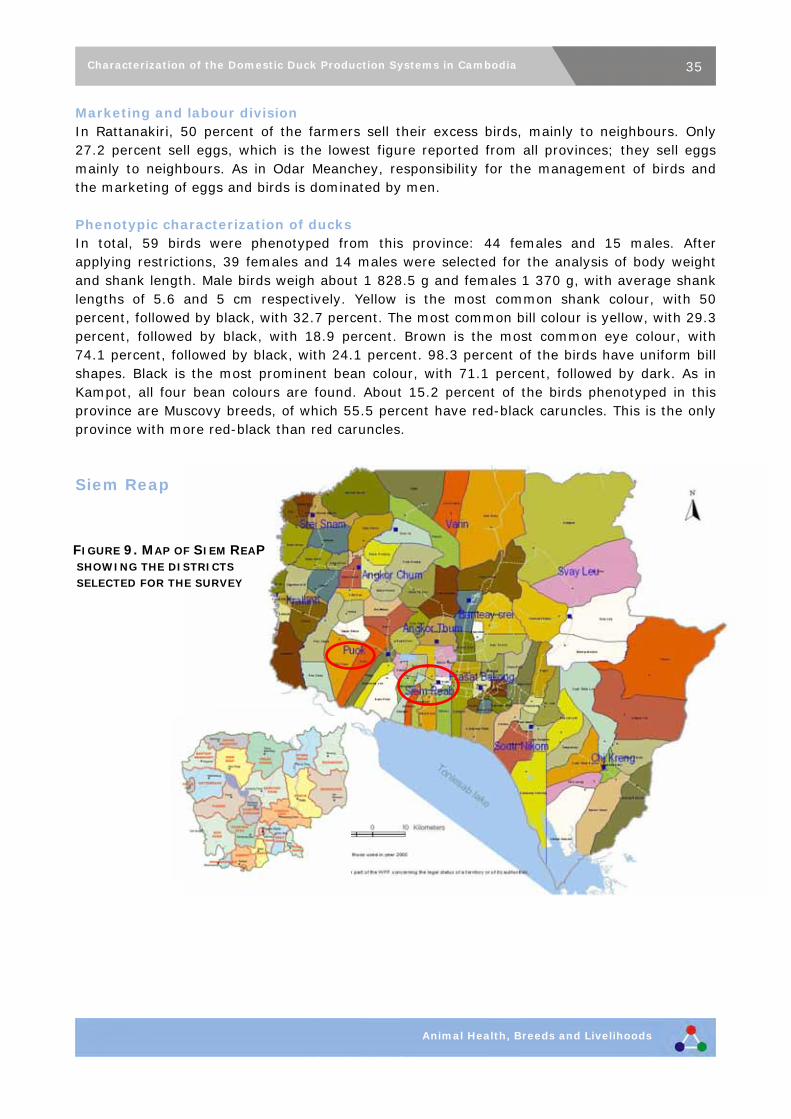
35Characterization of the Domestic Duck Production Systems in Cambodia
Animal Health, Breeds and Livelihoods
Marketing and labour division In Rattanakiri, 50 percent of the farmers sell their excess birds, mainly to neighbours. Only 27.2 percent sell eggs, which is the lowest figure reported from all provinces; they sell eggs mainly to neighbours. As in Odar Meanchey, responsibility for the management of birds and the marketing of eggs and birds is dominated by men. Phenotypic characterization of ducks In total, 59 birds were phenotyped from this province: 44 females and 15 males. After applying restrictions, 39 females and 14 males were selected for the analysis of body weight and shank length. Male birds weigh about 1 828.5 g and females 1 370 g, with average shank lengths of 5.6 and 5 cm respectively. Yellow is the most common shank colour, with 50 percent, followed by black, with 32.7 percent. The most common bill colour is yellow, with 29.3 percent, followed by black, with 18.9 percent. Brown is the most common eye colour, with 74.1 percent, followed by black, with 24.1 percent. 98.3 percent of the birds have uniform bill shapes. Black is the most prominent bean colour, with 71.1 percent, followed by dark. As in Kampot, all four bean colours are found. About 15.2 percent of the birds phenotyped in this province are Muscovy breeds, of which 55.5 percent have red-black caruncles. This is the only province with more red-black than red caruncles. Siem Reap
FIGURE 9. MAP OF SIEM REAP SHOWING THE DISTRICTS SELECTED FOR THE SURVEY
36Characterization of the Domestic Duck Production Systems in Cambodia
Animal Health, Breeds and Livelihoods
The province of Siem Reap is located in the northwest of Cambodia, bordering Odar Meanchey in the north. Its topography varies from floodplains near Tone Le Sap Lake in the south, to lowland paddy fields and forests in the north. The estimated population is about 841 000 people, of whom 51 percent are female. The two districts of Siem Reab and Phuok were selected for the survey. Both are in the south, near Ton Le Sap Lake. Farmer households and life style In total, 21 households were interviewed in this province: 12 from Phuok and nine from Siem Reab. 52.3 percent of the surveyed farmers are men. At 28.5 percent, the proportion of illiterate farmers is the highest in all provinces. About 15 percent of the households have seven or eight members and 45 percent fewer than five. Family size in this province is generally higher than in Kampong Cham and Kampot. Only 57.1 percent of the farmers said that they listen to the radio regularly; this is the lowest reported figure from all provinces. However, the proportion of mobile phone users (100 percent) is higher than in other provinces, but equal to that in Kampot. A comparatively low 4.6 percent of farmers are landless. As in Kampot, no farmers own more than 5 ha. About 76 percent have between 0.3 and 5 ha. Details are provided in Table 43 at the end of this section. Livestock numbers 62 percent of the households in Siem Reap rear pigs, with an average of about 8.7 pigs each. A similar 57 percent rear cattle, with 3.1 head per household. Three households keep an average of three buffaloes each. Each farmer rears approximately 204 local ducks. This is the highest figure of all provinces. Each household rears about 14 ducklings, 194.7 young females, 109.2 adult females, 178 young males and 10.7 adult males. The average adult female to male ratio is 1:10.2. None of the households keep improved breeds. However, in spite of the large number of birds per household, only 10.5 percent consider them as highly important for the family. 76.9 percent of farmers consider the income from cattle as highly important, and 53.8 percent consider the income from pigs as moderate. 33.3 percent of the farmers from this province said that the duck numbers decreased over the last five years; this is the highest proportion observed. Details are provided in Table 44 at the end of this section. Breeding 81 percent of the farmers buy ducks from outside for their flocks and, as seen in other provinces, the first preference is for commercial farms or neighbours, followed by local markets. All of the farmers who purchase ducks buy local breeds, and prefer ducklings to adults. 52.6 percent seek to improve their flocks, among whom 50 percent select birds from their own stock for breeding. A few farmers rely on ducks from neighbours. The most important criterion applied for breeding selection is body weight, followed by disease resistance and longevity. Approximately 28 percent of the farmers hatch ducklings. Housing 28.5 percent of the farmers house their birds both day and night, and 76.4 percent of the remainder provide night housing. None of the farmers use costly materials for house construction; 52.6 percent use simple farm materials and the rest simple purchased materials. Only 14.2 percent of the farmers who do not provide housing gave economic reasons as the cause. Details are provided in Table 45 at the end of this section.

37Characterization of the Domestic Duck Production Systems in Cambodia
Animal Health, Breeds and Livelihoods
Feeding 100 percent of the farmers provide feed (as in Kampot), and 15 percent purchase feed. Markets are the main source for feed purchases. As in other provinces, farmers depend mainly on grain produced on their farms as feed for their birds. Details are provided in Table 46 at the end of this section. Productivity Farmers explained that they get 3.6 production cycles per year, with 13 eggs per cycle, but only about 28 percent of the farmers replied to this question. Regarding the survival of ducklings, the figures implied that more birds survived than were actually hatched. This might be a data collection error, and should therefore be ignored. Farmers reported that about 91 percent of purchased ducklings survive to the first month of age. In all ages disease is the main cause of mortality. The average age at which birds start laying eggs is about 6.4 months. About 24 percent of the farmers use the veterinary facilities provided by the government. Details are provided in Table 46 at the end of this section. Marketing and labour division In Siem Reap, only 61.9 percent of farmers sell their excess birds, mainly to neighbours. About 50 percent sell eggs, again mainly to neighbours. In general, the management of birds and the marketing of eggs and birds are dominated by men. Phenotypic characterization of ducks In total, 110 birds were phenotyped in Siem Reap: 95 females and 15 males. After applying restrictions, 94 females and 15 males were selected for the analysis of body weight and shank length. Male birds weigh about 1 319.3 g and females 1 303.3 g, with average shank lengths of 5.7 and 5.3 cm respectively. As in Kampot, the birds have small body sizes and relatively long shanks. Black is the most common shank colour, with 38.5 percent, followed by yellow, with 32.1 percent. The most common bill colour is black, with 45.7 percent, followed by slate-grey, with 17.7 percent. Brown is the most common eye colour, with 70.9 percent, followed by black, with 14.5 percent. 77.2 percent of the birds in this province have uniform bill shapes. Black is the predominant bean colour, with 87.2 percent; the remaining birds have dark beans. About 14.5 percent of the birds phenotyped are Muscovy breeds, all of which have red caruncles. TABLE 43 LITERACY RATES, HOUSEHOLD SIZES AND LANDOWNERSHIP ACROSS THE FIVE PROVINCES
(PERCENTAGES)
Ill*= Illiterate, PS*= Primary and secondary, Ra*= Radio, Mo*= Mobile,
Proportion Household size Land area owned (ha) Province Male Ill* PS* Ra* Mo* >5 6-7 7-8 Nil > 0.3 > 1 > 5 >
10 Kampong Cham
51.2 7.3 80.4 71.4 95.2 69.0 26.1 4.7 7.1 11.9 42.8 33.7 2.3
Kampot 50.0 18.1 72.6 58.3 100 75.0 25.0 0 0 8.3 33.3 58.3 0 Odar Meanchey
58.3 0 100 83.3 91.6 58.3 33.3 8.3 8.3 0 25.0 58.3 0
Rattanakiri 66.6 18.1 63.6 83.3 91.6 33.3 25.0 25.0 8.3 16.6 0 41.0 25 Siem Reap 52.3 28.5 66.6 57.1 100 45.0 30.0 15.0 4.6 19.0 33.3 42.8 0
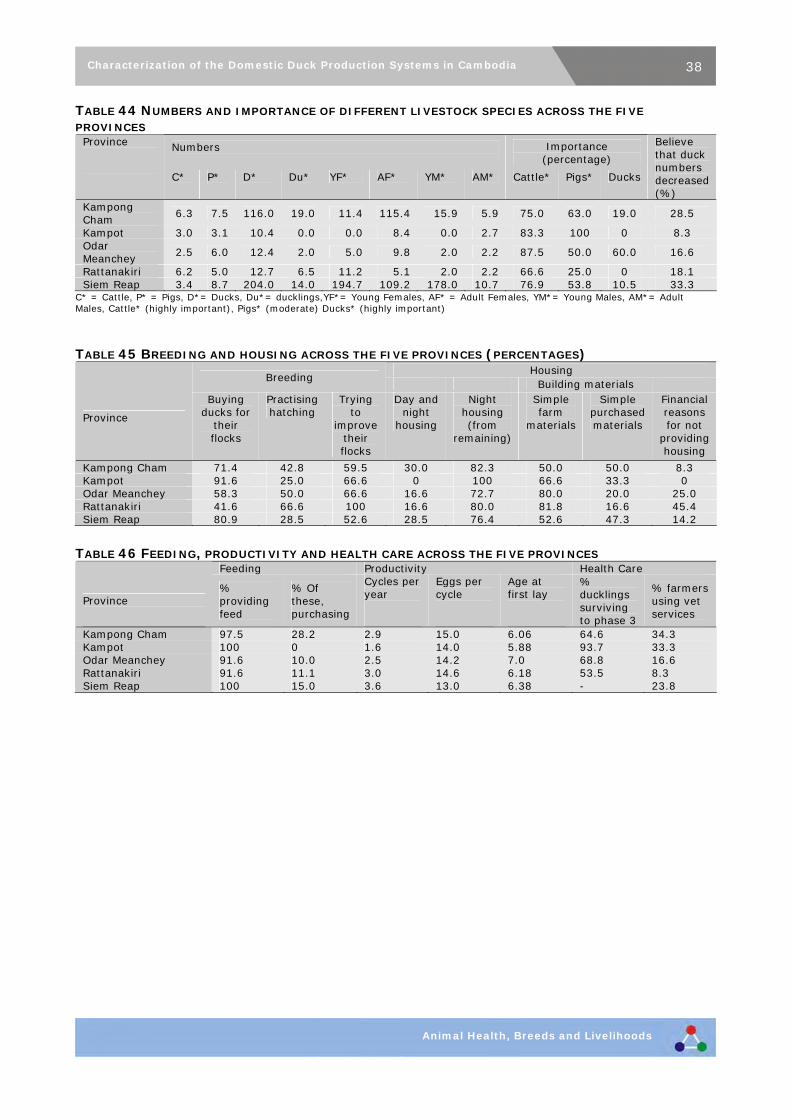
38Characterization of the Domestic Duck Production Systems in Cambodia
Animal Health, Breeds and Livelihoods
TABLE 44 NUMBERS AND IMPORTANCE OF DIFFERENT LIVESTOCK SPECIES ACROSS THE FIVE
PROVINCES Numbers
Importance
(percentage)
Province
C* P* D* Du* YF* AF* YM* AM* Cattle* Pigs* Ducks
Believe that duck numbers decreased (%)
Kampong Cham
6.3 7.5 116.0 19.0 11.4 115.4 15.9 5.9 75.0 63.0 19.0 28.5
Kampot 3.0 3.1 10.4 0.0 0.0 8.4 0.0 2.7 83.3 100 0 8.3 Odar Meanchey
2.5 6.0 12.4 2.0 5.0 9.8 2.0 2.2 87.5 50.0 60.0 16.6
Rattanakiri 6.2 5.0 12.7 6.5 11.2 5.1 2.0 2.2 66.6 25.0 0 18.1 Siem Reap 3.4 8.7 204.0 14.0 194.7 109.2 178.0 10.7 76.9 53.8 10.5 33.3
C* = Cattle, P* = Pigs, D*= Ducks, Du*= ducklings,YF*= Young Females, AF* = Adult Females, YM*= Young Males, AM*= Adult Males, Cattle* (highly important), Pigs* (moderate) Ducks* (highly important)
TABLE 45 BREEDING AND HOUSING ACROSS THE FIVE PROVINCES (PERCENTAGES)
Housing Breeding
Building materials
Province
Buying ducks for
their flocks
Practising hatching
Trying to
improve their flocks
Day and night
housing
Night housing (from
remaining)
Simple farm
materials
Simple purchased materials
Financial reasons for not
providing housing
Kampong Cham 71.4 42.8 59.5 30.0 82.3 50.0 50.0 8.3 Kampot 91.6 25.0 66.6 0 100 66.6 33.3 0 Odar Meanchey 58.3 50.0 66.6 16.6 72.7 80.0 20.0 25.0 Rattanakiri 41.6 66.6 100 16.6 80.0 81.8 16.6 45.4 Siem Reap 80.9 28.5 52.6 28.5 76.4 52.6 47.3 14.2
TABLE 46 FEEDING, PRODUCTIVITY AND HEALTH CARE ACROSS THE FIVE PROVINCES
Feeding Productivity Health Care
Province
% providing feed
% Of these, purchasing
Cycles per year
Eggs per cycle
Age at first lay
% ducklings surviving to phase 3
% farmers using vet services
Kampong Cham 97.5 28.2 2.9 15.0 6.06 64.6 34.3 Kampot 100 0 1.6 14.0 5.88 93.7 33.3 Odar Meanchey 91.6 10.0 2.5 14.2 7.0 68.8 16.6 Rattanakiri 91.6 11.1 3.0 14.6 6.18 53.5 8.3 Siem Reap 100 15.0 3.6 13.0 6.38 - 23.8

39Characterization of the Domestic Duck Production Systems in Cambodia
Animal Health, Breeds and Livelihoods
Conclusions Generally, local ducks in Cambodia are reared under free-range systems, and are kept both for home consumption and as a source of income. Wide variation was observed in the ages of the farmers, which ranged from 18 to 77 years, but only a small proportion of these farmers were under 30, which supports the general trend for fewer and fewer young people to adopt agriculture as a means of livelihood. The high usage of mobile phones shows that people are willing to adopt new user-friendly technologies, and illiteracy is not a barrier for this. Rice is the main agricultural crop, so most farming households keep cattle. Only three households keep goats, and no sheep were found in the entire survey area. Very few farmers use improved breeds for upgrading their flocks; the majority rely on local birds, which they buy from nearby markets, neighbours or commercial farms. When purchasing, they prefer young ducks to adults. Housing is mainly constructed from simple on-farm materials, with about 93 percent of the farmers providing some kind of shelter for their birds. Most traditional duck farmers do not keep any production records, but responding to the survey questions they stated that an average female first lays eggs at between 5.9 and 7 months of age, and has about 1.6 to 3.6 production cycles per year, with 13 to 15 eggs per cycle. Compared with hatched ducklings, purchased ducklings are more likely to survive until six months and in general disease is the main cause of mortality for all ages. Only about 25 percent of farmers utilize the available veterinary facilities, and about 20 percent vaccinate their birds. Although the body weights of females and males vary among provinces, the differences are not significant. Wide variation is observed in shank and bill colour, with different colours dominating in different regions. Brown is the most common eye colour and uniform the most common bill shape. Black is the most prominent bean colour.
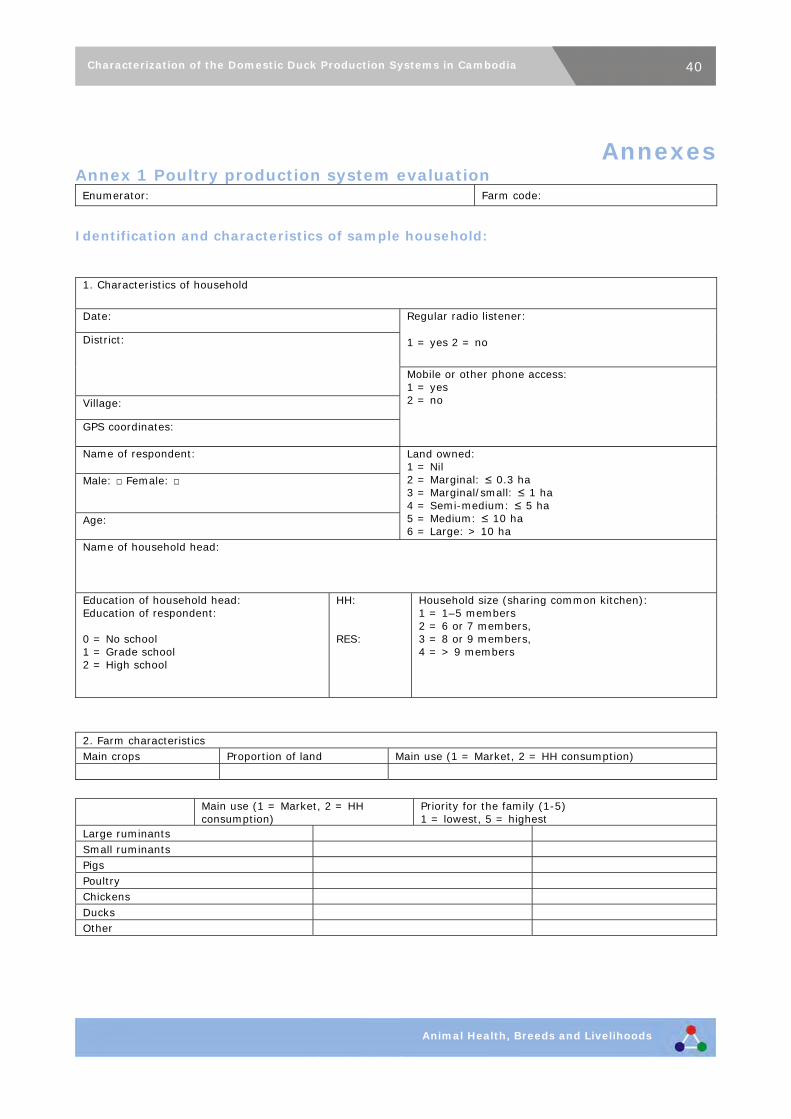
40Characterization of the Domestic Duck Production Systems in Cambodia
Animal Health, Breeds and Livelihoods
Annexes Annex 1 Poultry production system evaluation Enumerator: Farm code:
Identification and characteristics of sample household:
1. Characteristics of household
Date: Regular radio listener:
1 = yes 2 = no District:
Village:
GPS coordinates:
Mobile or other phone access: 1 = yes 2 = no
Name of respondent:
Male: □ Female: □
Age:
Land owned: 1 = Nil 2 = Marginal: ≤ 0.3 ha 3 = Marginal/small: ≤ 1 ha 4 = Semi-medium: ≤ 5 ha 5 = Medium: ≤ 10 ha 6 = Large: > 10 ha
Name of household head:
Education of household head: Education of respondent: 0 = No school 1 = Grade school 2 = High school
HH: RES:
Household size (sharing common kitchen): 1 = 1–5 members 2 = 6 or 7 members, 3 = 8 or 9 members, 4 = > 9 members
2. Farm characteristics Main crops Proportion of land Main use (1 = Market, 2 = HH consumption)
Main use (1 = Market, 2 = HH consumption)
Priority for the family (1-5) 1 = lowest, 5 = highest
Large ruminants
Small ruminants
Pigs
Poultry
Chickens
Ducks
Other

41Characterization of the Domestic Duck Production Systems in Cambodia
Animal Health, Breeds and Livelihoods
Animal numbers and flock management
2.1 List animals owned
Female Male Total Category
Calves/ lambs/kids < 2 years ≥ 2 years < 2 years ≥ 2 years
Cows/bulls Buffaloes Sheep Goats Pigs
Local chickens owned
Chicks Female Male Total
< 1month < 6 months > 6 months < 6 months > 6 months Chickens Ducks Other (name)
Improved (crossbreed) chickens owned
Chicks Female Male Total
< 1 month < 6 months > 6 months < 6 months > 6 months Chickens Ducks Other (name)
Chickens Ducks 2.21 Did the number of birds in your poultry flock change during the last 5 years? 1 = no, remained same 2 = yes, increased 3 = yes, decreased
2.21 Does the number of birds in your chicken flock change with the season? 1 = yes 2 = no
2.22 Which months are chicken numbers highest?
2.23 Which months are chicken numbers lowest?
Separate form for chickens and ducks from here
2.3.a. Do you buy birds for your flock? □ Yes □ No (go to Q 2.4.a)
2.3.b. If YES, where do you buy birds?
□ Market □ Neighbour □ Commercial chicken farm □ Other: .........................…………
2.3.c. If YES, what kind of birds do you buy?
□ Local breed □ Improved breed
□ Young birds □ Adult birds
2.3.d. Check all the criteria you use for the selection of birds you buy:
No special criteria: Size/weight: Longevity: Ability to live on its own (needs no housing, good scavenger): Number of eggs laid: Colour of eggs laid: Flavour of meat: Disease resistance: Good mothering qualities Colour or pattern of plumage
□ Yes □ Yes □ No □ Yes □ No □ Yes □ No □ Yes □ No □ Yes □ No □ Yes □ No □ Yes □ No □ Yes □ No □ Yes □ No
Remarks ____________________________ ____________________________
Other reasons (describe)
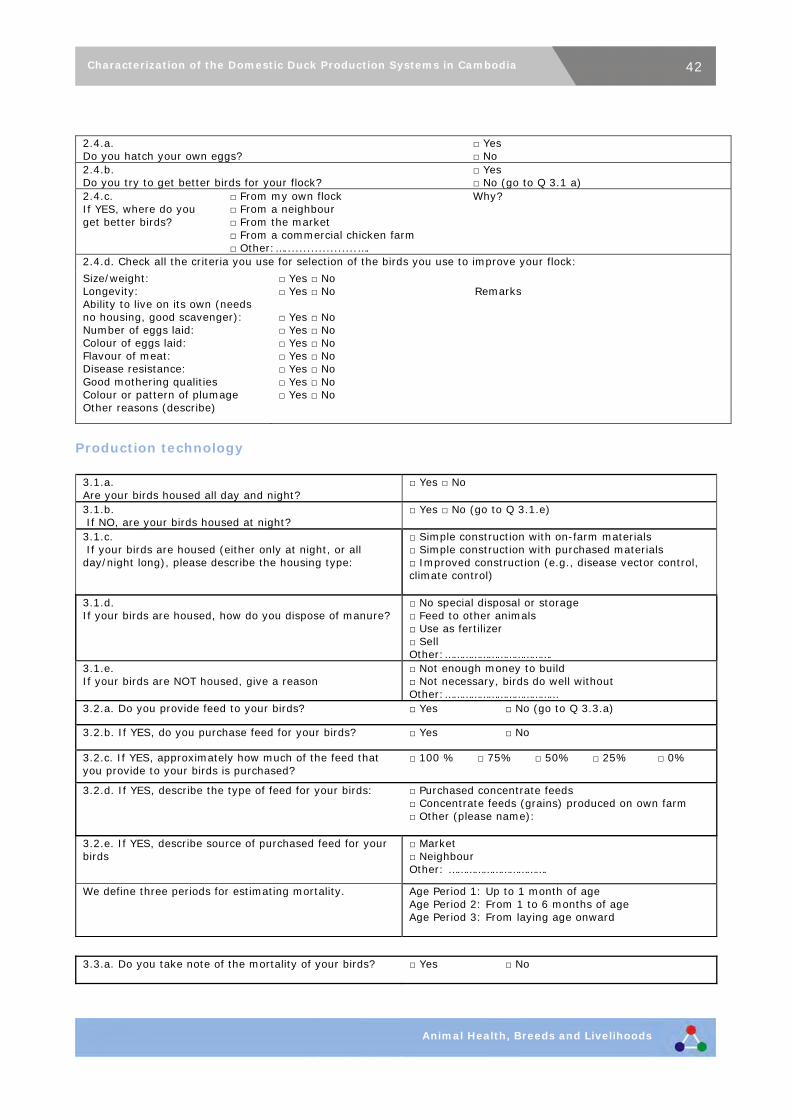
42Characterization of the Domestic Duck Production Systems in Cambodia
Animal Health, Breeds and Livelihoods
2.4.a. Do you hatch your own eggs?
□ Yes □ No
2.4.b. Do you try to get better birds for your flock?
□ Yes □ No (go to Q 3.1 a)
2.4.c. If YES, where do you get better birds?
□ From my own flock □ From a neighbour □ From the market □ From a commercial chicken farm □ Other:…...................….
Why?
2.4.d. Check all the criteria you use for selection of the birds you use to improve your flock:
Size/weight: Longevity: Ability to live on its own (needs no housing, good scavenger): Number of eggs laid: Colour of eggs laid: Flavour of meat: Disease resistance: Good mothering qualities Colour or pattern of plumage
□ Yes □ No □ Yes □ No □ Yes □ No □ Yes □ No □ Yes □ No □ Yes □ No □ Yes □ No □ Yes □ No □ Yes □ No
Remarks
Other reasons (describe)
Production technology
3.1.a. Are your birds housed all day and night?
□ Yes □ No
3.1.b. If NO, are your birds housed at night?
□ Yes □ No (go to Q 3.1.e)
3.1.c. If your birds are housed (either only at night, or all day/night long), please describe the housing type:
□ Simple construction with on-farm materials □ Simple construction with purchased materials □ Improved construction (e.g., disease vector control, climate control)
3.1.d. If your birds are housed, how do you dispose of manure?
□ No special disposal or storage □ Feed to other animals □ Use as fertilizer □ Sell Other:……………………………….
3.1.e. If your birds are NOT housed, give a reason
□ Not enough money to build □ Not necessary, birds do well without Other:…………………………………
3.2.a. Do you provide feed to your birds? □ Yes □ No (go to Q 3.3.a)
3.2.b. If YES, do you purchase feed for your birds? □ Yes □ No
3.2.c. If YES, approximately how much of the feed that you provide to your birds is purchased?
□ 100 % □ 75% □ 50% □ 25% □ 0%
3.2.d. If YES, describe the type of feed for your birds: □ Purchased concentrate feeds □ Concentrate feeds (grains) produced on own farm □ Other (please name):
3.2.e. If YES, describe source of purchased feed for your birds
□ Market □ Neighbour Other: …………………………….
We define three periods for estimating mortality.
Age Period 1: Up to 1 month of age Age Period 2: From 1 to 6 months of age Age Period 3: From laying age onward
3.3.a. Do you take note of the mortality of your birds? □ Yes □ No
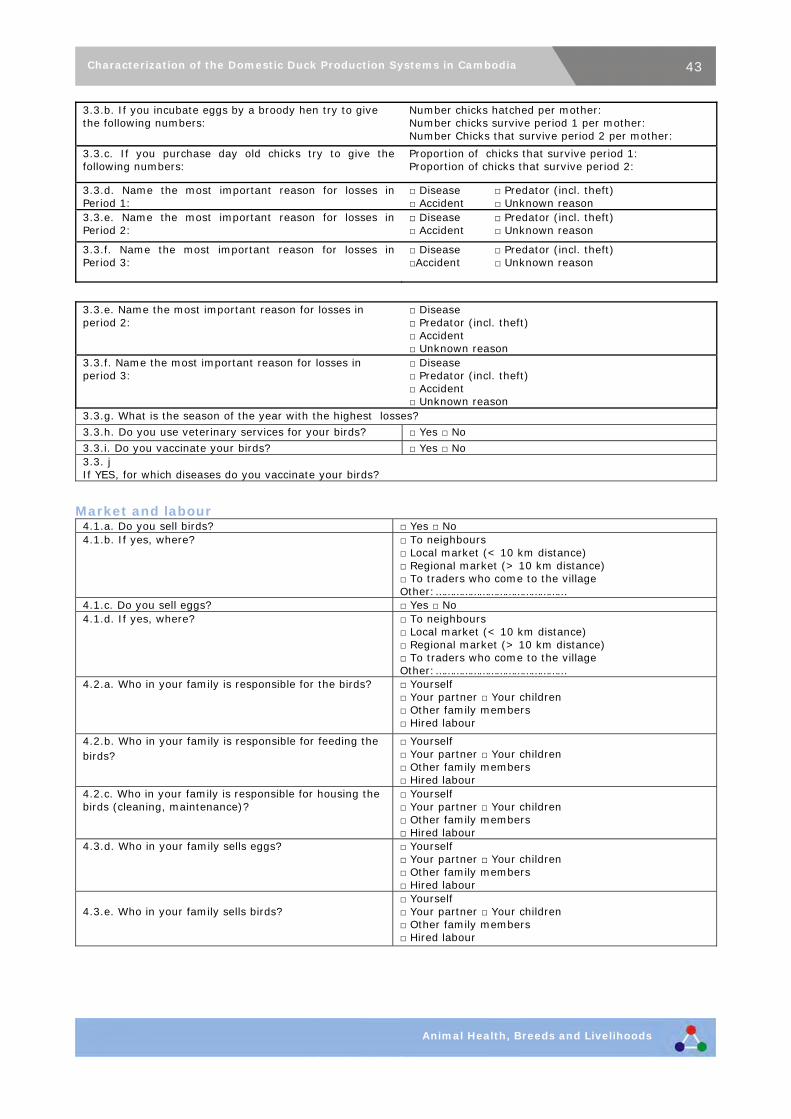
43Characterization of the Domestic Duck Production Systems in Cambodia
Animal Health, Breeds and Livelihoods
3.3.b. If you incubate eggs by a broody hen try to give the following numbers:
Number chicks hatched per mother: Number chicks survive period 1 per mother: Number Chicks that survive period 2 per mother:
3.3.c. If you purchase day old chicks try to give the following numbers:
Proportion of chicks that survive period 1: Proportion of chicks that survive period 2:
3.3.d. Name the most important reason for losses in Period 1:
□ Disease □ Predator (incl. theft) □ Accident □ Unknown reason
3.3.e. Name the most important reason for losses in Period 2:
□ Disease □ Predator (incl. theft) □ Accident □ Unknown reason
3.3.f. Name the most important reason for losses in Period 3:
□ Disease □ Predator (incl. theft) □Accident □ Unknown reason
3.3.e. Name the most important reason for losses in period 2:
□ Disease □ Predator (incl. theft) □ Accident □ Unknown reason
3.3.f. Name the most important reason for losses in period 3:
□ Disease □ Predator (incl. theft) □ Accident □ Unknown reason
3.3.g. What is the season of the year with the highest losses?
3.3.h. Do you use veterinary services for your birds? □ Yes □ No
3.3.i. Do you vaccinate your birds? □ Yes □ No 3.3. j If YES, for which diseases do you vaccinate your birds?
Market and labour
4.1.a. Do you sell birds? □ Yes □ No 4.1.b. If yes, where? □ To neighbours
□ Local market (< 10 km distance) □ Regional market (> 10 km distance) □ To traders who come to the village Other:………………………………………
4.1.c. Do you sell eggs? □ Yes □ No 4.1.d. If yes, where? □ To neighbours
□ Local market (< 10 km distance) □ Regional market (> 10 km distance) □ To traders who come to the village Other:………………………………………
4.2.a. Who in your family is responsible for the birds?
□ Yourself □ Your partner □ Your children □ Other family members □ Hired labour
4.2.b. Who in your family is responsible for feeding the birds?
□ Yourself □ Your partner □ Your children □ Other family members □ Hired labour
4.2.c. Who in your family is responsible for housing the birds (cleaning, maintenance)?
□ Yourself □ Your partner □ Your children □ Other family members □ Hired labour
4.3.d. Who in your family sells eggs?
□ Yourself □ Your partner □ Your children □ Other family members □ Hired labour
4.3.e. Who in your family sells birds?
□ Yourself □ Your partner □ Your children □ Other family members □ Hired labour
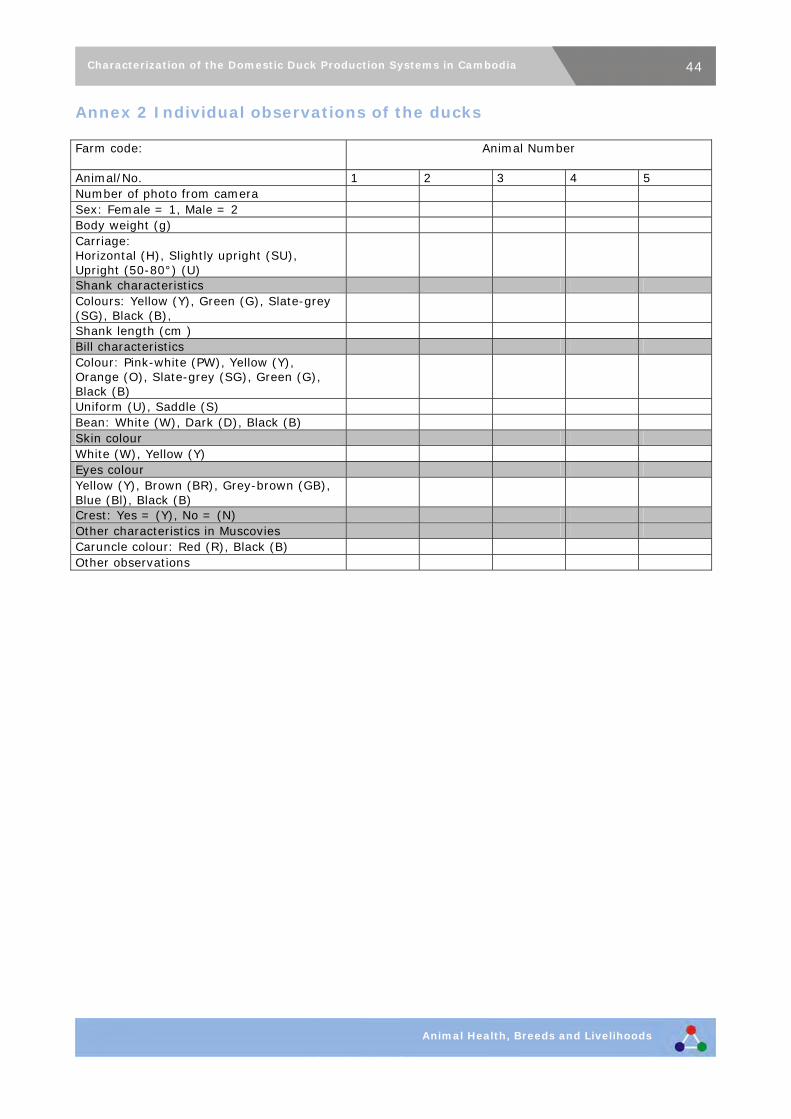
44Characterization of the Domestic Duck Production Systems in Cambodia
Animal Health, Breeds and Livelihoods
Annex 2 Individual observations of the ducks Farm code:
Animal Number
Animal/No. 1 2 3 4 5 Number of photo from camera Sex: Female = 1, Male = 2 Body weight (g) Carriage: Horizontal (H), Slightly upright (SU), Upright (50-80°) (U)
Shank characteristics Colours: Yellow (Y), Green (G), Slate-grey (SG), Black (B),
Shank length (cm ) Bill characteristics Colour: Pink-white (PW), Yellow (Y), Orange (O), Slate-grey (SG), Green (G), Black (B)
Uniform (U), Saddle (S) Bean: White (W), Dark (D), Black (B) Skin colour White (W), Yellow (Y) Eyes colour Yellow (Y), Brown (BR), Grey-brown (GB), Blue (Bl), Black (B)
Crest: Yes = (Y), No = (N) Other characteristics in Muscovies Caruncle colour: Red (R), Black (B) Other observations


