University Bulletin – ISSUE No.18- Vol. (2) – May - 2016. - 79 - Characterization Of Feed And Products In Petroleum Refinery Dr. Ibrahim M. Abou El Lei1 Dr. Raheel J. Raheel Petroleum Engineering Department Faculty of Engineering Omar Al Muktar University Dr. Khaled M.Mezughi Chemical Engineering Department, Faculty of Petroleum and Gas, Zawia University Abstract: This study has been conducted on Messla and Sarir crude oils that are mixed together as a feed for Tobruk petroleum refinery. Characterization properties of the feed mixture and petroleum products of refinery including light naphtha, heavy naphtha, kerosene and diesel have been measured and compared with other crude oils are reported in this paper. According to the evaluation parameters Messla and Sarir mixture can be classified as light sweet crude oil because of the low content of sulfur. It has been established that light crude oil characterized by light fraction
Transcript
University Bulletin – ISSUE No.18- Vol. (2) – May - 2016. - 79 -
Characterization Of Feed And Products In Petroleum Refinery
Dr. Ibrahim M. Abou El Lei1 Dr. Raheel J. Raheel Petroleum Engineering Department
Faculty of Engineering Omar Al Muktar University
Dr. Khaled M.Mezughi Chemical Engineering Department,
Faculty of Petroleum and Gas, Zawia University
Abstract: This study has been conducted on Messla and Sarir crude oils that
are mixed together as a feed for Tobruk petroleum refinery.
Characterization properties of the feed mixture and petroleum products of refinery including light naphtha, heavy naphtha, kerosene and diesel have been measured and compared with other crude oils are reported in this paper.
According to the evaluation parameters Messla and Sarir mixture can be classified as light sweet crude oil because of the low content of sulfur. It has been established that light crude oil characterized by light fraction
Characterization Of Feed And Products In Petroleum Refinery ــــــــــــــــــــــــــــــــــــــــــــ
University Bulletin – ISSUE No.18- Vol. (2) – May - 2016. - 80 -
high content, diesel fraction low and low K-factor. The pour point of light crude oil is higher than that of heavy crude oil. The Salt content shows low content in the mixture compared with other types, and the water content found as traces.
The boiling point of the distillate fractions increases as the volume percent of the fraction increases. Moreover, as expected diesel has a higher boiling point than kerosene which has a higher boiling point than naphtha for all the fractions collected.
1. Introduction: The characterization of petroleum process streams is approached
from both chemistry and physical properties perspective. The chemistry perspective indicates to characterize the crude oil in terms of the functional groups such as olefins, paraffins, naphthenes, aromatics and resins[1]. The dominance of one or more of the functional groups in various petroleum processing streams is indicative of the desired product quality and characterization. For instance, the lighter fractions of the refinery consist of only olefins and paraffins. On the other hand, products such that should have high octane number which is a characteristic feature of olifinic and aromatic groups present in the product stream[2].
The physical characterization of the crude oil in terms of viscosity, density, boiling point curves is equally important. These properties are also indicative of the quality of the product as well as the feed[3]. Therefore, in petroleum processing, obtaining any intermediate or a product stream with
Dr. Ibrahim. M. Abou El Lei1& et al., ـــــــــــــــــــــــــــــــــــــــــــــــــــــــــــــــــــــــــــــــــــــــــــــ
University Bulletin – ISSUE No.18- Vol. (2) – May - 2016. - 81 -
a defined characterization of several properties indicates whether it is diesel or petrol or any other product[4].
The product characterization is illustrated now with an example. Aviation gasoline is characterized using ASTM distillation. The specified temperatures for vol% distilled at 1 atm. Are 158 °F maximum for 10 % volume, 221 °F maximum for 50 % volume and 275 °F maximum for 90% volume. This is indicative of the fact that any product obtained in the refinery process and meets these ASTM distillation characteristics is anticipated to represent aviation gasoline product. However, other important properties such as viscosity, density, aniline product, sulphur density are as well measured to fit within a specified range and to conclude that the produced stream is indeed aviation gasoline[1].
2. Characterization Properties of crude oil: Numerous important feed and product characterization properties in
petroleum industry include:
2.1. API gravity: API gravity of petroleum fractions is a measure of density of the
stream. Usually measured at 60 °Fthe API gravity is expressed as°API = 141.5/specific gravity – 131.5, where specific gravity is measured at 60 °F.
According to the above expression, 10 oAPI gravity indicates a specific gravity of 1 (equivalent to water specific gravity). In other words, higher values of °API gravity indicate lower specific gravity and therefore lighter crude oils or refinery products and vice-versa[5]. As far as crude oil is concerned, lighter API gravity value is desired as more amount of gas fraction, naphtha and gas oils can be produced from the lighter crude oil than with the heavier crude oil[6]. Therefore, crude oil with high values of
Characterization Of Feed And Products In Petroleum Refinery ــــــــــــــــــــــــــــــــــــــــــــ
University Bulletin – ISSUE No.18- Vol. (2) – May - 2016. - 82 -
API gravity are expensive to procure due to their quality. API gravity or density or relative density: can be determined using hydrometer method (ASTM D-287)[7,8].
2.2. Watson Characterization Factor: The Watson characterization factor is usually expressed as
K = (TB)1/3 / specificgravity
Where TB is the average boiling point in degrees R taken from five temperatures corresponding to 10, 30, 50, 70 and 90 volume % vaporized. Typically Watson characterization factor varies between 10.5 and 13 for various crude streams[9]. A highly paraffinic crude typically possesses a K factor of 13. On the other hand, a highly naphthenic crude possesses a K factor of 10.5. Therefore, Watson characterization factor can be used to judge upon the quality of the crude oil in terms of the dominance of the paraffinic or naphthenic components. It is determined by the standard distillation method(ASTM D-86, ASTM D-1160)[10].
2.3. Sulfur Content: Since crude oil is obtained from petroleum reservoirs, sulphur is
present in the crude oil. Usually, crude oil has both organic and inorganic sulphur in which the inorganic sulphur dominates the composition. Typically, crude oils with high sulphur content are termed as sour crude. On the other hand, crude oils with low sulphur content are termed as sweet crude. Typically, crude oil sulphur content consists of 0.5 – 3.0wt % of sulphur. Crudes with sulphur content lower than 0.5 wt % are termed as sweet crudes, when exceeds this value regards as sour crudes. It is estimated that about 80 % of world crude oil reserves are sour. Doctor test measures the amount of sulfur (ASTM D-129)[10].
Dr. Ibrahim. M. Abou El Lei1& et al., ـــــــــــــــــــــــــــــــــــــــــــــــــــــــــــــــــــــــــــــــــــــــــــــ
University Bulletin – ISSUE No.18- Vol. (2) – May - 2016. - 83 -
2.4. Viscosity Index: Typically in the refining industry, viscosity is measured in terms of
centistokes (termed as cst) or saybolt seconds or redwood seconds. Usually, the viscosity measurements are carried out at 100 oF and 210 °F. Viscosity is a very important property for the heavy products obtained from the crude oil. The viscosity acts as an important characterization property in the blending units associated to heavy products such as bunker fuel(11). Typically, viscosity of these products is specified to be within a specified range and this is achieved by adjusting the viscosities of the streams entering the blending unit. It is estimated using (ASTM D-445) method[12].
2.5. Flash and Fire Point: Flash and fire point are important properties that are relevant to the
safety and transmission of refinery products. Flash point is the temperature above which the product flashes forming a mixture capable of inducing ignition with air. Fire point is the temperature well above the flash point where the product could catch fire. These two important properties are always taken care in the daily operation of a refinery. The method used to determine the flash point and fire point are (ASTM D-56, ASTM D-93, ASTM D-3828)[13].
2.6. Pour Point: When a petroleum product is cooled, first a cloudy appearance of the
product occurs at a certain temperature. This temperature is termed as the cloud point. Upon further cooling, the product will ceases to flow at a temperature. This temperature is termed as the pour point. Both pour and cloud points are important properties of the product streams as far as heavier products are concerned. For heavier products, they are specified in
Characterization Of Feed And Products In Petroleum Refinery ــــــــــــــــــــــــــــــــــــــــــــ
University Bulletin – ISSUE No.18- Vol. (2) – May - 2016. - 84 -
a desired range and this is achieved by blending appropriate amounts of lighter intermediate products. The test used to determine the pour point is (ASTM D-97, IP 15)[13].
3. Characterization Properties of products:
3.1. Octane Number: Though irrelevant to the crude oil stream, the octane number is an
important property for many intermediate streams that undergo blending later on to produce automotive gasoline, diesel etc.[14]. Typically gasoline tends to knock the engines. The knocking tendency of the gasoline is defined in terms of the maximum compression ratio of the engine at which the knock occurs. Therefore, high quality gasoline will tend to knock at higher compression ratios and vice versa. However, for comparative purpose, still one needs to have a pure component whose compression ratio is known for knocking. Iso-octane is eventually considered as the barometer for octane number comparison. While iso-octane was given an octane number of 100, n-heptane is given a scale of 0. Therefore, the octane number of a fuel is equivalent to a mixture of a iso-octane and n-heptane that provides the same compression ratio in a fuel engine. Thus an octane number of 80 indicates that the fuel is equivalent to the performance characteristics in a fuel engine fed with 80 vol. % of isooctane and 20 % of n-heptane.
3.2. TBP/ASTM Distillation Curves : The most important characterization properties of the
crude/intermediate/product streams are the TBP/ASTM distillation curves. Both these distillation curves are measured at 1 atm. pressure. In both these cases, the boiling points of various volume fractions are being measured.
Dr. Ibrahim. M. Abou El Lei1& et al., ـــــــــــــــــــــــــــــــــــــــــــــــــــــــــــــــــــــــــــــــــــــــــــــ
University Bulletin – ISSUE No.18- Vol. (2) – May - 2016. - 85 -
However, the basic difference between TBP curve and ASTM distillation curve is that while TBP curve is measured using batch distillation apparatus consisting of no less than 100 trays and very high reflux ratio, the ASTM distillation is measured in a single stage apparatus without any reflux. Therefore, the ASTM does not indicate a good separation of various components and indicates the operation of the laboratory setup far away from the equilibrium[15].
4. World Crude Oil Quality: Figure 1 presents the general trend of World crude oil quality
through the period between 1980 and 2013. It is clear that API gravity decreases while the sulphur and metal contents increase.
Figure 1: World crude oil quality[14]
5. Material and Methods: The Physiochemical properties of crude oil and petroleum products
were determined through the data of tests and chemical analysis that have
1985 1990 1995 2001 2010 2013
S in crude oil (wt%) 1.14 1.12 1.31 1.41 1.51 1.59
API of crude oil 32.7 32.6 32.4 32.2 31.8 31.7
Metal in crude oil residue (ppm) 275 286 297 309 320 325
Residue in crude (vol.%) 19 19.4 19.8 20.2 21.3 22.1
Characterization Of Feed And Products In Petroleum Refinery ــــــــــــــــــــــــــــــــــــــــــــ
University Bulletin – ISSUE No.18- Vol. (2) – May - 2016. - 86 -
been carried out on the Messla and Sarir crude oils samples and petroleum products of Tobruk refinery using different analytical technique as mentioned previously of ASTM in central laboratory of refinery.
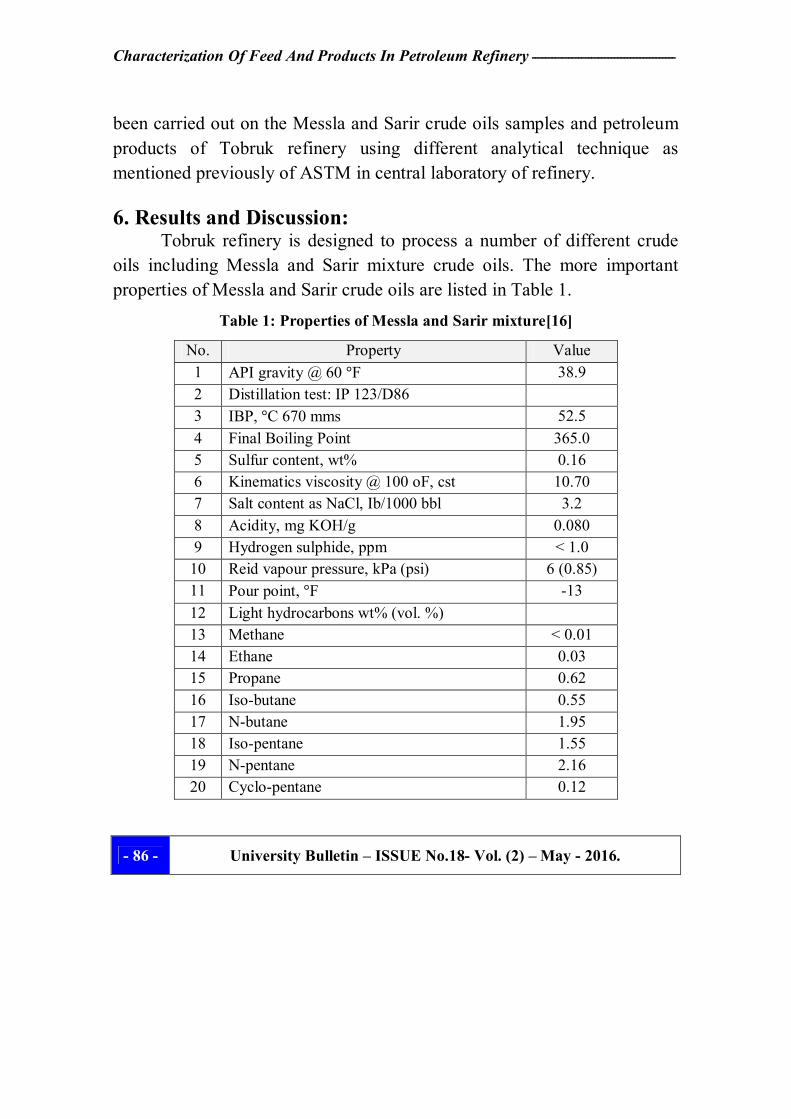
6. Results and Discussion: Tobruk refinery is designed to process a number of different crude
oils including Messla and Sarir mixture crude oils. The more important properties of Messla and Sarir crude oils are listed in Table 1.
Table 1: Properties of Messla and Sarir mixture[16]
No. Property Value 1 API gravity @ 60 °F 38.9 2 Distillation test: IP 123/D86 3 IBP, °C 670 mms 52.5 4 Final Boiling Point 365.0 5 Sulfur content, wt% 0.16 6 Kinematics viscosity @ 100 oF, cst 10.70 7 Salt content as NaCl, Ib/1000 bbl 3.2 8 Acidity, mg KOH/g 0.080 9 Hydrogen sulphide, ppm < 1.0
Dr. Ibrahim. M. Abou El Lei1& et al., ـــــــــــــــــــــــــــــــــــــــــــــــــــــــــــــــــــــــــــــــــــــــــــــ
University Bulletin – ISSUE No.18- Vol. (2) – May - 2016. - 87 -
The characterization properties of Messla and Sarir mixture crude oils are summarized in Table 2 and compared with other crude oils in the world. The data in Table 2 show that the API gravity of light crude is above 30°, such as Messla and Sarir mix, MAD, BR, AL and Kuw crudes, while that of heavy crude is less than 30° such as AM and AH crudes. These API gravity values agree with publish data. Furthermore, as expressed the pour point of light crude oil is higher than that of heavy crude oil.
The data in Table 2 is expressed graphically in figures 2, 3&4, that give acomparison between thecharacterization properties of Messla-Sarir mix and the other crude oils. The figures reveal that Messla-Sarir mix has anAPI gravity similar with that of Brent blend crude oil and less than Murban crude oil as well as higher than Arab medium, Arab heavy and Kuwait crude oils. The Kinematics viscosity shows variable values for the different crude oils where the highest value of Arab heavy crude oil and the lowest value of Murban crude oil. The other parameters such as specific gravity, cetane index, smoke point, acid number and aniline point show no wide variation between them. On the other hand the sulfur content in Messla-Sarir crude oils is lowest value (0.16) while the highest value was recorded in Arab medium crude oil (2.85). The pour point of Messla-Sarir mixture shows the highest value (-13℉) and the highest value of Arab heavy crude oil.
Characterization Of Feed And Products In Petroleum Refinery ــــــــــــــــــــــــــــــــــــــــــــ
University Bulletin – ISSUE No.18- Vol. (2) – May - 2016. - 88 -
Table 2: Comprehensive assay of crude oil under study[14].
Note: Names of the studied crude oils are as follow: -MAD = MURBAN (origin:Abu Dhabi, UAE) -BR = BRENT BLEND (origin:Nord sea) -AL = ARAB LIGHT (origin:Saudi Arabia) -AM = ARAB MEDIUM (origin:Saudi Arabia) -KUW = KUWAIT EXPORT (origin:Kuwait) -AH = ARAB HEAVY (origin:Saudi Arabia)
Figure 2: °API gravity of Messla-Sarir mixture and other crude oils
05
1015202530354045
API
Gra
vity
Crude oils
Dr. Ibrahim. M. Abou El Lei1& et al., ـــــــــــــــــــــــــــــــــــــــــــــــــــــــــــــــــــــــــــــــــــــــــــــ
University Bulletin – ISSUE No.18- Vol. (2) – May - 2016. - 89 -
Figure 3: Messla-Sarir mixture and other crude oils properties
Figure 4: Messla-Sarir mixture and other crude oils properties
The data in Table 3 of petroleum products of Tobruk refinery represented kerosene, naphtha and diesel that have different characterization properties, this may attributed to the differences in their
0
0.5
1
1.5
2
2.5
3
Crude oils
Sulfur content (w/w %)
Acid number (mg, KOH/g)
Specific gravity (g/cm3)
0
20
40
60
80
100
120
140
160
Crude oils
Smoke point (mm)
Cetane index
Aniline point (C)
Kinematics viscosity (cst) @ 100 F
Characterization Of Feed And Products In Petroleum Refinery ــــــــــــــــــــــــــــــــــــــــــــ
University Bulletin – ISSUE No.18- Vol. (2) – May - 2016. - 90 -
chemical characteristics. The API gravity of kerosene is higher than diesel (42.5 and 35.95 respectively), this is the vice versa of flash point (35.0 and 90.0 respectively). The sulfur content in kerosene (0.005) is very low if compared with diesel (0.07). On the other hand, they have a similar content of acid (0.008). Figures 5&6 illustrate the different characterization properties of petroleum products.
Table 3: Physiochemical properties of petroleum products[16]
The data in Table 4 are expressed graphically in Figure7 which gives a plot of the true boiling points (TBP) of the distillate fractions versus the percentage cumulative volume of the crude oil.
Dr. Ibrahim. M. Abou El Lei1& et al., ـــــــــــــــــــــــــــــــــــــــــــــــــــــــــــــــــــــــــــــــــــــــــــــ
University Bulletin – ISSUE No.18- Vol. (2) – May - 2016. - 91 -
Figure 5. Characterization properties of petroleum products
Figure 6: physiochemical properties of petroleum fractions
0
10
20
30
40
50
60
70
80
90
100
Kerosene Diesel Naphtha
Phys
ioch
emic
al p
rope
rtie
s
Petroleum products
API°
Pour poit
Flash poit
Viscosity idex
0
0.1
0.2
0.3
0.4
0.5
0.6
0.7
0.8
0.9
Kerosene Diesel Naphtha
Phys
ioch
emic
sl p
rope
rtie
s
Petroleum products
Specific gravity (g/cm3)
Acid content (mg, KOH/g)
Sulfur content (w%)
Characterization Of Feed And Products In Petroleum Refinery ــــــــــــــــــــــــــــــــــــــــــــ
University Bulletin – ISSUE No.18- Vol. (2) – May - 2016. - 92 -
Table 4: Products of crude oil distillation
Products Light naphtha
Heavy naphtha Kerosene Diesel Residue Total Loss
True boiling points (TBP) (oC)
95 160 255 325 402 - -
Fraction percent
15.4 31.5 22.9 18.8 11.02 99.62 0.38
Figure 8 presents the plots of the volume fractions as a function of the true boiling points. From the results obtained, it is found that the distillation of products of atmospheric distillation are coinciding with the published data for the similar characteristic features of the investigate crude oils.
Figure 7: True boiling point versus percentage cumulative volume fractions
L. naphtha
Kerosene
Residue
0
50
100
150
200
250
300
350
400
450
Trueboiling
point (oC)
Percentcumulative
volume
Tem
pera
ture
, o C
Dr. Ibrahim. M. Abou El Lei1& et al., ـــــــــــــــــــــــــــــــــــــــــــــــــــــــــــــــــــــــــــــــــــــــــــــ
University Bulletin – ISSUE No.18- Vol. (2) – May - 2016. - 93 -
Figure 8: Volume percent of crude oil fractions versus true boiling point
In the petroleum refinery the physical and chemical processes are integrated, where atmospheric distillation process involved. Thus the products are expected to show a wider range in their characteristics. However, our present results show that the product distribution of atmospheric fractional distillation of Messla-Sarir mixture is a function of the nature of the crude oils.
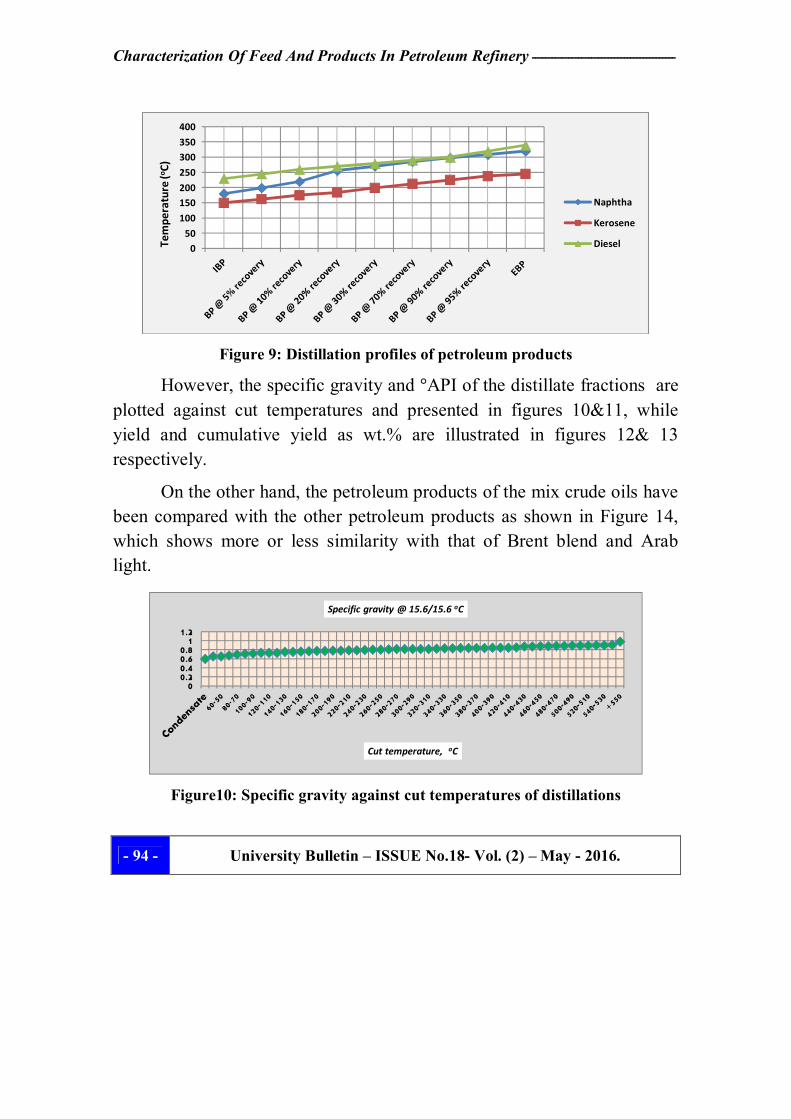
The distillation profiles (Figure 9 ) of the investigated petroleum products also show the same trend. The boiling point of the distillate fractions increases as the volume percent of the fraction increases. Moreover, as expected diesel has a higher boiling point than kerosene which has a higher boiling point than naphtha for all the fractions collected.
L. naphtha
H. naphtha
KeroseneDeisel
Residue
0
100
200
300
400
500
True boilingpoint (oC)
Volumepercent
Characterization Of Feed And Products In Petroleum Refinery ــــــــــــــــــــــــــــــــــــــــــــ
University Bulletin – ISSUE No.18- Vol. (2) – May - 2016. - 94 -
Figure 9: Distillation profiles of petroleum products
However, the specific gravity and °API of the distillate fractions are plotted against cut temperatures and presented in figures 10&11, while yield and cumulative yield as wt.% are illustrated in figures 12& 13 respectively.
On the other hand, the petroleum products of the mix crude oils have been compared with the other petroleum products as shown in Figure 14, which shows more or less similarity with that of Brent blend and Arab light.
Figure10: Specific gravity against cut temperatures of distillations
050
100
150200
250
300350
400
Tem
pera
ture
(o C)
Naphtha
Kerosene
Diesel
00.20.40.60.81
1.2
Cut temperature, oC
Specific gravity @ 15.6/15.6 oC
Dr. Ibrahim. M. Abou El Lei1& et al., ـــــــــــــــــــــــــــــــــــــــــــــــــــــــــــــــــــــــــــــــــــــــــــــ
University Bulletin – ISSUE No.18- Vol. (2) – May - 2016. - 95 -
Figure 11: API gravity against cut temperatures of distillations
Figure 12: Yield as wt.% versus cut temperatures of distillations
Figure 13: Cumulative yield as wt..% versus cut temperatures of fractions
0
20
40
60
80
100
120
Cut temperature, oC
API gravity
0510152025
Cut temperature, oC
Yield (wt. %)
020406080100120
Cut temperature oC
Cumulative yield (wt. %)
Characterization Of Feed And Products In Petroleum Refinery ــــــــــــــــــــــــــــــــــــــــــــ
University Bulletin – ISSUE No.18- Vol. (2) – May - 2016. - 96 -
Figure 14: Petroleum products of different crude oils
7. Evaluation Parameters of Crude Oil: There are different parameters can be applied to evaluate the quality
of the crude oils. The most important of them including°API, the factor governing the quality of crude oils. The results from the investigated Sarir crude oils reveal an average value of °API is 38.9. According to this value crude oil can be classified as light crude oil.
The content of sulfur play an important role for the quality of the crude oil. Generally it ranges from 0.1% to 5% by weight percent. Crude oil are classified as sweet when sulfur content less than 0.5% and sour if the percent exceeds this value. The concentration of sulfur in the studied crude oil of Messla-Sarir is 0.16, thus it can be classified as sweet crude oil (Table 1).
The pour point of petroleum is an index of the lowest temperature at which the crude oil will flow under specified conditions. The pour point of
0
5
10
15
20
25
30
35
40
LPG
Naphtha
Kerosene
Gas Oil
VGO
Short Resid
Dr. Ibrahim. M. Abou El Lei1& et al., ـــــــــــــــــــــــــــــــــــــــــــــــــــــــــــــــــــــــــــــــــــــــــــــ
University Bulletin – ISSUE No.18- Vol. (2) – May - 2016. - 97 -
the examined crude oil shows that both paraffinic and aromatic more or less are similar content, where the average of the pour point is -13°F.
The Characterization Factor was originally devised to show the thermal cracking characteristics of heavy oil. Thus, highly paraffinic oils have K = 12.5–13.0 and cyclic (naphthenic) oils have K =10.5–12.5. The average value of characterization factor for the investigated crude oil is 10.90, these means that the crude oil is naphthenic
The crude oil of naphthenic base exhibit a wide variation of viscosity index (-60 - +40), while the paraffinic base has high viscosity index (79-151), and not affected so much by temperature degree. The intermediate crude oils show viscosity index ranging from 20-98. The viscosity index of Messla-Sarir crude oil shows low value (24), and this may be attributed to naphthenic base.
8. Conclusion: The following conclusions can be summarized as a result of the
studied carried out on crude oil and their products:
The characterization properties of Messla-Sarir mixture crude oils are compared with other crude oils in the world. The results reveal that the °API gravity of light crude is above 30°, such as Messla-Sarir mix, MAD, BR, AL and Kuw crudes, while that of heavy crude is less than 30° such as AM and AH crudes. The pour point of light crude oil is higher than that of heavy crude oil.
Messla-Sarir mixture has a gravity °API similar with that of Brent blend crude oil and less than Murban crude oil as well as higher than Arab medium, Arab heavy and Kuwait crude oils. The Kinematics viscosity shows variable values for the different crude oils.
Characterization Of Feed And Products In Petroleum Refinery ــــــــــــــــــــــــــــــــــــــــــــ
University Bulletin – ISSUE No.18- Vol. (2) – May - 2016. - 98 -
The studied crude oil can be classified as light sweet crude oil because of the low content of sulfur. It has been established that light crude oil characterized by light fraction high content, diesel fraction low and low K-factor. The Salt content shows low contents in crude oils compared with other types and the water content found as traces
The other parameters such as specific gravity, cetane index, smoke point, acid number and aniline point show no wide variation between them. The sulphur content in Sarir crude oil is lowest value comparing with the other crude oils, while the pour point of Sarir crude oil shows the highest value.
The petroleum products of kerosene and diesel have different characterization properties, this may attributed to the differences in their chemical characteristics. The API gravity of kerosene is higher than diesel, this is the vice versa of flash point. The sulfur content in kerosene is very low if compared with diesel. Also it is found that the distillation of products of atmospheric distillation are coinciding with the publish data.
The distillation profiles of the petroleum products also show that the trend of the boiling point of the distillate fractions increases as the volume percent of the fraction increases. Moreover, as expected diesel has a higher boiling point than kerosene which has a higher boiling point than naphtha for all the fractions collected.
9. References:
1. Hartmann, J. C. M. (2003) Crude valuation for crude selection, Petroleum Technology Quarterly, 123.
Dr. Ibrahim. M. Abou El Lei1& et al., ـــــــــــــــــــــــــــــــــــــــــــــــــــــــــــــــــــــــــــــــــــــــــــــ
University Bulletin – ISSUE No.18- Vol. (2) – May - 2016. - 99 -
2. Hoffman, H.L., and J.J. McKetta, (1993) Petroleum Processing. In: Chemical Processing Handbook. J.J. McKetta (Editor). Marcel Dekker, New York. Page 851.
3. Heinrich, H., and D. Duée, (2000) In: Modern Petroleum Technology. Volume 2: Downstream. A.G. Lucas (Editor). John Wiley & Sons, New York. Chapter 10.
4. Habson, G. D. (1984) Modern Petroleum Technology, Institute of Petroleum, Fifth Edition , Part I & II, John-Wiley & Sons, Chichester.
5.Kite,W.H. Jr., and R.E. Pegg (1993) In: Criteria for Quality of Petroleum Products. J.P. Allinson (Editor). John Wiley & Sons, New York. Chapter7.
6.Yeung, T. W. (2006) Evaluating opportunity crude processing “, Petroleum Technology Quarterly, Q4, 93.
8. Lambert, D. (2007) Determination of crude properties”, Petroleum Technology Quarterly, 119.
9. Speight, J.G. (1999) The Chemistry and Technology of Petroleum. 3rd Edition. Marcel Dekker, New York.
10. Speight, J.G. (2001) Handbook of Petroleum Analysis. John Wiley & Sons, New York.
11. Riazi, M. R. and T. A. Al-Sahhaf (2006) Physical properties of heavy petroleum fractions and crude oils”, Fluid Phase Equilibra 117, 217-224.
Characterization Of Feed And Products In Petroleum Refinery ــــــــــــــــــــــــــــــــــــــــــــ
University Bulletin – ISSUE No.18- Vol. (2) – May - 2016. - 100 -
12. Speight, J.G. and Ozum, B. (2002) Petroleum Refining Processes. Marcel Dekker, New York.
13. ASTM (2000) Annual Book of ASTM Standards. American Society for Testing and Materials,West Conshohocken, PA.
14. Stratiev, D., Dinkov, R., Petkov, K. and Stanulov, K., (2010) Evaluation of Crude Oil Quality. University of Chemical Technology and Metallurgy - Sofia, 1756 Sofia, Bulgaria
15. McCann, J.M. (1998) In: Manual on Hydrocarbon Analysis. 6th Edition.A.W. Drews(Editor). American Society for Testing and Materials,West Conshohocken, PA. Chapter 2.
16. Arabian Gulf Oil Company (AGOCO) (2014), Oil Refinery, Tobruk, Libya.