Food Structure Volume 11 | Number 4 Article 2 1992 Characterization of Food Packaging Materials by Microscopic, Spectrophotometric, ermal and Dynamic Mechanical Analysis I. R. Urzendowski Kraſt General Foods, Inc. D. G. Pechak Kraſt General Foods, Inc. Follow this and additional works at: hp://digitalcommons.usu.edu/foodmicrostructure is Article is brought to you for free and open access by the Western Dairy Center at DigitalCommons@USU. It has been accepted for inclusion in Food Structure by an authorized administrator of DigitalCommons@USU. For more information, please contact [email protected]. Recommended Citation Urzendowski, I. R. and Pechak, D. G. (1992) "Characterization of Food Packaging Materials by Microscopic, Spectrophotometric, ermal and Dynamic Mechanical Analysis," Food Structure: Vol. 11: No. 4, Article 2. Available at: hp://digitalcommons.usu.edu/foodmicrostructure/vol11/iss4/2
Transcript
Food Structure
Volume 11 | Number 4 Article 2
1992
Characterization of Food Packaging Materials byMicroscopic, Spectrophotometric, Thermal andDynamic Mechanical AnalysisI. R. UrzendowskiKraft General Foods, Inc.
D. G. PechakKraft General Foods, Inc.
Follow this and additional works at: http://digitalcommons.usu.edu/foodmicrostructure
This Article is brought to you for free and open access by the Western DairyCenter at DigitalCommons@USU. It has been accepted for inclusion inFood Structure by an authorized administrator of [email protected] more information, please contact [email protected].
Recommended CitationUrzendowski, I. R. and Pechak, D. G. (1992) "Characterization of Food Packaging Materials by Microscopic, Spectrophotometric,Thermal and Dynamic Mechanical Analysis," Food Structure: Vol. 11: No. 4, Article 2.Available at: http://digitalcommons.usu.edu/foodmicrostructure/vol11/iss4/2
FOOD STRUCTURE, Vol. 11 (1992) , pp. 301-314 1046-705X/92$3 . 00 + . 00 Scanning Microscopy International, Chicago (AMF O'Hare) , IL 60666 USA
CHARACTERIZATION OF FOOD PACKAGING MATERIALS BY MICROSCOPIC, SPECTROPHOTOMETRIC, THERMAL AND DYNAMIC MECHANICAL ANALYSIS
I.R. Urzendowski and D.G. Pechak*
Kraft General Foods, Inc. 801 Waukegan Road , Glenview, Illinois, 60025
Abstract
Food companies use many materials in the form of homopolymers, copolymers, blends, composites, etc., as films or rigid packaging materials . A thorough knowledge of the materials is necessary to understand environmental effects, impact modification requirements, and identification of physical and thermal properties in order to define material usage, cost analysis, and quality control techniques. Glassy state relaxations, secondary transitions, heats of fusion, tan5 data, and storage modulus data were used to identify the compatibility of polyethylene/polypropylene blends. Permeability, thermal, and microscopic data showed that Saran coated high impact polystyrene cups could not be used for oil based products because of environmental stresses induced in the polystyrene layer.
Initial paper received December 9, 1991 Manuscript received October 13, 1992 Direct inquiries to David G. Pechak Telephone number: (708) 646 4808 Fax number: (708) 646 3864
*Address for correcpondence: David G. Pechak Kraft General Foods, Inc. 801 Waukegan Road, Glenview, Illinois , 60025
301
Introduction
There are two studies presented in this paper: 1) Ethylene/Propylene Copolymer Blends , and studies with 2) High Impact Polystyrene (HIPS). Both studies deal with the use of these materials as rigid packaging materials .
1. Ethylene/Propylene Copolymer Blends
Blends of isotactic polypropylene (PP) and high density polyethylene (HDPE) are used in the food industry as packaging materials to improve environmental stress cracking resistance, impact strength, and processibility of PP. Similar to HDPE, polypropylene is highly crystalline and its high crystallinity imparts to it high tensile strength, stiffness, and hardness, however, the low temperature impact strength of PP is somewhat sensitive to fabrication, test conditions and product end use . This sensitivity results from the presence of a dominating a - transition in PP at about -10 °C, resulting in a loss in toughness or impact strength near or lower than the glass transition, T g· To overcome this loss in impact strength, wide use is made of both random and block copolymers (CP) of PP with PE. In the presence of a coordination polymerization catalyst, a small amount of comonomer ethylene may polymerize at random intervals with propylene (21) and if both polymers are amorphous, the glass transition temperature varies monotonically with composition . Impact copolymers contain ethylene monomer (typically 4-25%) blended with PP . If crystalline PE is present it can be detected as a second melting peak and although these PE/PP copolymer blends appear to be incompatible they are characterized by an increase in stiffness and toughness at low temperatures.
Although a great deal of progress has been made regarding the characterization of olefin copolymer blends , many contradictions and unanswered questions remain (3-5, 10-12, 24, 27, 31). This is due in part to the difficulty in relating the mechanical properties and the internal morphological structure of the copolymer blend to the changes in the a-, {3-, and -y-, relaxation regions present in the individual monomers. Fujiyama et al. (12) measured the dynamic viscoelastic properties of PP/HDPE blends and found a notable increase in
I.R. Urzendowski and D.G. Pechak
elasticity for blends containing 30% and 70% PE. They concluded that PP and HDPE are partially compatible because of the entanglement of the molecular chains of the components. Other uncertainties are associated with the quantitative relationship between the structural state of the blend and reactivity , shrinkage, the degree of miscibility in the molten state, and the effect of the crystalline and amorphous regions.
This study uses differential scanning calorimetry (DSC: 2, 7-8 , 17, 29, 32, 34-37) , infrared (IR: 9, 14, 18, 23 , 30, 33) and dynamic mechanical spectroscopy (DMA: 1, 4, 11-13, 19-20, 26), to describe the influence of composition and temperature on the dynamic relaxation spectra of blends of PP homopolymer combined with various concentrations of a (PE/PP) blend to give PP/(PP/PE). 2. High Impact Polystyrene (HIPS)
This study was initiated to determine the use of HIPS cups for oil based products. The impact-resistant polystyrene is made by blending polystyrene resin with a rubbery butadiene-styrene copolymer. The morphological structure results in a continuous matrix of polystyrene in which small rubbery spheres of copolymer are dispersed and which should prevent the initiation and termination of possible cracks and/or voids. In order to use HIPS coextruded sheet for portion control (PC) cups for oil based dressings , the HIPS must be completely coated with polyvinylidene chloride (PVDC) on the product contact surface to prevent dissolution of the HIPS layer (the latter is soluble in an oil base). Previous electron microscope studies have confirmed the formation of crazes in high impact polystyrene materials (6 , 15 , 16, 22, 28) which could cause cracking of the Saran layer and render the cups unsatisfactory for oil based products.
This study uses thermal, microscopic , and permeability studies to determine if HIPS/PVDC cups may be used for oil based products.
Materials and Methods
Materials
The materials studied are summarized in Table 1. The first study involved PP/(PE/PP) copolymer blends and the second study involved high impact polystyrene materials.
For the copolymer blends, the PP homopolymer was heated and mixed with the appropriate concentration of PE/PP copolymer blend and thermo-formed into sheets and/or extruded into a cavity mold to form cups. The studies were performed on the formed cup blends of known composition as obtained from the supplier.
The HIPS/PVDC cups were obtained from the supplier who prepared the high impact grade by blending polystyrene with 5 to 10% of a rubbery butadienestyrene copolymer. The HIPS was then extruded into sheets and the sheets were coated with a Saran emulsion of 8# (single pass) ; 12# (double pass) , or 15# (triple
302
Table 1. Materials used in the two studies .
Study #1 - Ethylene/Propylene Copolymer Blends:
1) Ethylene plus propylene (E+ P) copolymer with 4% PE
2) Resins:
a) 100% polypropylene resin
b) 100% resin blend (50% PP/50% PE)
3) 8 oz preformed cups:
a) 100% PP homopolymer b) 90% PP/10% copolymer blend (PP/PE) c) 85% PP/15% copolymer blend (PP/PE)
Study #2- High Impact Polystyrene (HIPS) Materials:
1) HIPS sheet stock from Concord Industries:
a) HIPS (polystyrene+ 5-10% styrene-butadiene copolymer (13 mil or 330 ILm sheet stock)
b) Saran coated HIPS (12 mil or 305 ILm sheet stock)
2) HIPS 1 ounce cups with Saran coating on inside of cup (from three suppliers):
1) 8# (single pass) Saran coating
2) 12# (double pass) Saran coating
3) 15# (triple pass) Saran coating
pass) of coating per ream of plastic. This is equivalent to approximately 6 /Lm , 12 ILm and 16 ILm of Saran per single, double, and triple pass , respectively . The coated sheets were then thermo-formed into cups in a cavity mold.
Methods and Instrumentation
DSC-7. Thermal transitions were determined under nitrogen with a Perkin Elmer DSC-7 Differential Scanning Calorimeter at a heating rate of 15 °C/min and a sample size of approximately 7 to 8 milligrams . All DSC scans were obtained after eliminating the previous thermal history of the samples by heating to 180 °C. Cooling curves were obtained on the same sample after prior heating to 175 oc. The distance moved by therecorder pen is directly equivalent to the rate of energy absorption or release in cal/sec and the area under the peak measures the heat of transition directly in Joules/ gram (32 , 37). The software supplied by the manufacturer was used to analyze the DSC thermograms. Commercial samples of indium and zinc (99.999% purity) were used as calibration standards; the melting transitions of indium and zinc at 156.6 oc and 419 .5 oc have enthalpies of 28.4 and 109 Jig , respectively .
Characterization of Food Packaging Materials .
Table 2. DSC data for the PE component in the PP/(PP/PE) copolymer blends.
Table 3. DSC data for the PP component in the PP/(PP/PE) copolymer blends.
Sample Description
1. Cup No.1, 100% PP, noPE
2. Cup No .2, 90% PP/10% Copolymer (PE/PP)
3. Cup No.3, 85% PP/15% Copolymer (PE/PP)
4. Cup No.4 , 80% PP/20% Copolymer (PE/P~)
5. Cup No.5, 70% PP/30% Copolymer (PE/PP)
6. Cup No.6, 100% Copolymer (50% PP/50% PE)
7. 100% Copolymer Resin (50% PP/50% PE)
8. 100% PP Resin
* No corrections made; not used on Figure 4.
DMA-7. Dynamic mechanical measurements were made with a Perkin Elmer DMA-7. Sample bars (mean dimension: 5.0 mm x 6.0 mm x 0.7 mm) were subjected to the three-point bending mode and the resultant sample displacement gave the storage modulus (E'), the loss modulus (E") and tano. The storage modulus is a measure of the stiffness or rigidity of the material and is calculated as the ratio of the stress to the applied strain. The loss modulus reflects the ability of a material to dissipate mechanical energy by converting it to heat through molecular motion. As the specific molecular groups undergo rotation at a given temperature, a peak is observed in the loss modulus data due to the absorption of the energy applied by the mechanical spectrometer. Tano is the ratio of the loss modulus to the elastic modulus (tano = E"/E') and is a useful index of material viscoelasticity. For this study , the samples were subjected to a small amplitude oscillating flexure at 1. 0 Hz while the temperature was increased from -120 octo 100 oc at 5 °C/min.
Polypropylene Uncorrected Corrected Temp .1H , J/g PP + PE .1H, J/g PP + PE .1H, J/g
Bausch & Lomb Bal Plan Light Microscope. Surface studies on different passes of Saran coatings on specified HIPS cups were examined with a microscope using episcopic illumination at 200X and 400X magnification . Cups were examined before and after treatment with toluene and/or oils to note flaws in the PVDC layer. The microscope was equipped with a B & L AX-1 automatic exposure controller for automatic photomicrography.
Infrared Spectrophotometer (FTIR). A Mattson Cygnus 100 FTIR Spectrometer equipped with a midband mercury-cadmium-telluride detector was used to obtain the transmission spectra of the copolymer blends. Infrared spectra were the result of 128 co-added interferograms at 1 cm· 1 resolution with triangular apodization. Copolymers were prepared for spectroscopic analysis by compression molding a 0.0017 inch (43 JLm) thick film at 175° C and a pressure of 1100 psi (773.4 g/sq mm) for 10 seconds.
I.R. Urzendowski and D.G. Pechak
55.00
50.00
~ 45.00
3: 0 40.00 u:
'" Q) 35.00 :I:
30.00
25.00
/\ ~r: i · II .
/::\ .-·-· i I ·-·-pp Resin -·-- • • ·-·-·-·-·-· / i
/ i ........ ~-""'· ~------··
700'!1. PP/0% Copolymer Cup •• -··-·· _____ .,--·-----·--·---
80% PP/20% Copolymer Cup
50.0 75.00 100.0 125.0 150.0 175.0
Temperature (°C)
Figure 1. DSC scan for the PP resin ,the 100% PP cup and the 80% PP/20% copolymer cup.
11.0
10.0
9.0
§' 8.0
.s 7.0
3: 6.0 0 u: 5.0
'" Q) 4.0 :I:
3.0
2.0
1.0
0.0
0.0 25.0 50.0 75.0 100.0 125.0 150.0 175.0
Temperature (°C)
Figure 2. DSC scans for the optimized region on 100% PP cup, the 50% PP/50% PE resin, and the 50% PP/50% PE cup.
Figure 3. Melting endotherms for the PP/(PP/PE) copolymer blends.
304
Zeiss (LSM 10) Confocal Laser Scanning Microscope. The inner surfaces of the HIPS cups were examined with a laser scan microscope (LSM 10) to note irregularities in the Saran layer.
Scanning Electron Microscope (SEM). Surface and fractured HIPS samples were observed by scanning electron microscopy (JSM 840-A) after sputter coating with gold . The freeze fractures were made at liquid nitrogen temperatures before coating with gold .
Saran (PVDC) Test. A chemical indicator solution of: 13.3 ml tetrahydrofuran, 25.0 ml dimethylsulfoxide, 2. 3 ml saturated solution of potassium hydroxide, and 2.0 ml of methyl alcohol, was used to determine the presence of Saran (PVDC) by the formation of a black color within 5 to 30 seconds. The mechanism of the reaction is not thoroughly understood; however, the black or brown color which the polymer may acquire under alkaline conditions, is probably due to conjugated unsaturation caused by dehydrochlorination (22) .
Toluene and Oil Seepage Test. The HIPS/ PVDC cups were filled with toluene, 100% soybean oil (Wesson) and/or salad dressing and allowed to stand at room temperature, after which the surface areas were examined with an optical microscope. Saran is insoluble in toluene or oil; however, if defects are present in the Saran layer, toluene (or oil) seeps through the coating and readily attacks the HIPS layer. After treatment with toluene small holes or fissures were clearly identified on the Saran surface due to the dissolution of the HIPS layer. Wesson oil and/or salad dressing in the cups showed oil stains on an absorbent paper below the cups and ultimately showed softening of the cups.
Oxygen Permeability of HIPS Cups. The cups were mounted on a Mocon 1000-H Oxygen Analyzer and oxygen permeability through the cups was measured in air (21% oxygen), 23 °C, and 50% relative humidity.
Results and Discussion
Ethylene/Propylene Copolymers. The compatibility of the PP/(PE/PP) copolymer blends was studied by thermal, infrared, and dynamic mechanical analysis. Figure 1 shows the DSC scan for the PP resin, the 100% PP cup, and the 80% PP/20% copolymer blend (PE/PP) cup. Optimization of the region near 127 oc for the 100% PP cup (Figure 2 and Tables 2, 3) showed that some PE was present in the homopolymer. This may have originated from color concentrate or regrind added at the time of cup formation. As noted (Figure 1 and Table 3), the PP resin had a melting peak at 167 oc and a .::lH of 97.0 Joules/gram. The 100% PP cup had peaks at 127 oc and 167 oc with .::lH values of 4.6 and 96.4 Joules/gram for PE and PP, respectively (Tables 2, 3 and Figures 2, 3) . The 100% copoly-
Characterization of Food Packaging Materials
Table 4. DSC crystallization temperature , Tc, for the samples.
Sample Description Polyethylene
Temp, Tc AHc, J/g
1. Cup No.1, 100% PP, noPE * 2. Cup No.2 , 90% PP/10% Copolymer (PE/PP) 117 oc 3. Cup No.3, 85% PP/15% Copolymer (PE/PP) 118 oc 4. Cup No.4, 80% PP/20% Copolymer (PE/PP) 118 oc 5. Cup No.5, 70% PP/30% Copolymer (PE/PP) 115 oc 6. Cup No.6, 100% Copolymer (50% PP/50% *
(50% PP/50% PE)
* None detected .
~,------------------------.
.E' ...., ui 15 D. J: .!! 10 Qj c
X Intercept"' -6.97
ol-':.-..--..--..--~~.-l
·10 10
%Copolymer (Uncorrected Values)
0 15~-----------------------4
"> ui ~ 10~----------------~~---4
%Copolymer (Corrected Values)
Figure 4. Plot of AH of PE versus % Copolymer added (corrected and uncorrected values).
* 26 .5
27.0
11.7
11.4
*
Polypropylene Total PP + PE Temp,Tc AHc, J/g AHc, J/g
111 oc 103 .6 103.6
111 oc 78 .5 105.0
110 oc 77 .8 104.8
112 oc 93.8 105.5
108 oc 94 .9 106.3
111 oc 113.0 113.0
15 20 25
%Copolymer
30
FigureS. AH PP + AH PE versus % Copolymer added (corrected values).
Figure 6. DSC crystallization exotherms for the blends.
305
., (.) c: "' .0
0 en .0 C(
13.4 13.6
740
Microns
13.8 14.0 14.2
730 m 710 700
Wavenumber
Figure 7. Infrared polyethylene doublet observed for the copolymer blend cups.
I.R. Urzendowski and D.G. Pechak
mer cup as well as the 100% copolymer resin (50% PP/50% PE), showed two fusion peaks at 127 oc and 167 oc (Tables 2, 3 and Figure 2).
Figure 3 shows the incompatibility of the two monomers by the presence of two endothermic fusion peaks for the PP/(PE/PP) copolymer blends, however, some co-crystallization is evident. HDPE and PP homopolymers have melting peaks of 135 oc and 167 oc, respectively, and it is clear that the blend thermograms are not a simple superpositioning of the two homopolymers. The HDPE melting peak is shifted to a lower temperature (127 °C) and no pronounced shifts in the copolymer blend peak temperatures (127 oc PE and 167 oc PP) were noted for successive changes in blend concentrations. Changes in the ..:1H values were attributed to changes in crystallinity resulting from crystal lattice packing interferences.
The plot of the ..:1H PE versus % PE in copolymer (PP/PE), Figure 4, corrected and uncorrected values, showed that the 100% PP homopolymer cup did not extrapolate to zero percent PE concentration. Extrapolation of the ..:1H PE to zero showed the cup labeled 100% PP contained approximately 7.0% copolymer blend. The corrected values with noPE in the homopolymer were obtained by subtracting the original ..:1H value for polyethylene from each subsequent concentration.
Figure 5 relates the combined sum (corrected) of the ..:1H values for the PE and PP peaks to the amount of blend (PP/PE) added. A straight line plot resulted which showed slight deviations in the ..:1H values at higher concentrations. Turi (32) has shown that changes in temperature and ..:1H result from endothermal or exothermal enthalpic transitions associated with phase changes, crystalline structure inversions, and/or destruction of crystalline lattice structures. The lower ..:1H values obtained for the 50% PP/50% PE resin (Tables 2 and 3) are probably due to differences in the previous thermal
· treatment of the resins as opposed to that of the preformed cups.
Table 4 and Figure 6 illustrates the dependence of crystallization behavior on the stereoregularity of the polymer chain. The crystallization scans show pronounced differences, hence, the scans are more diagnostic than the fusion peaks (Figure 3). The crystallization scans show that the pure PP cup has one peak, however, a small addition of copolymer blend (10% and 15%) showed a distinct PE peak at 118 °C. Further addition of copolymer blend (20% and 30%) showed a cocrystallization of PE with PP so that only a shoulder was observed for the PE peak and finally, the 100% copolymer blend showed a single peak at 111 oc. This suggests that crystallization behavior is related to variations in the stereochemical structure (7). Increasing the PE content increased cocrystallization with PP and resulted in an initial decrease in the heat of crystallization (..:1Hc) for PP followed by an increase at higher copolymer additions.
Characteristic bands in the infrared at 720 and 1168 cm·1 are due to the absorbance of PE and PP,
306
Table 5. Tanll data for the copolymer blends.
100% PP/0% Copolymer Cup
Tanll Peak, oc -104 -52 20 78
Tanll, height 0.019 0.020 0.074 0. 108
90% PP/10% Copolymer Cup
Tanll Peak, oc -106 -52 10 78
Tanll, height 0.020 0.021 0.076 0.101
85% PP/15% Copolymer Cup
Tanll Peak, oc -105 -53 12 77
Tanll, height 0.019 0.021 0.068 0.103
80 PP/20% Copolymer Cup
Tanll Peak, oc -109 -48 7 85
Tanll, height 0.041 0.039 0.087 0.122
70% PP/30% Copolymer Cup
Tanll Peak, oc -112 -52 13 84
Tanll, height 0.020 0.031 0.074 0.101
0% PP/100% Copolymer Cup
Tanll Peak, oc -115 -52 10 84
Tanll, height 0.034 0.031 0.071 0.132
Table 6. Storage modulus data for the copolymer blends at specified temperatures.
(Storage Modulus, Pax 109)
Sample Description Temperature in oc -104 -50 20 80
100% PP/0% Copolymer Cup 3.5 3.0 1.8 0.5
90% PP/10% Copolymer Cup 3.2 2.6 1.5 0.8
85% PP/15% Copolymer Cup 3.7 3.3 2.0 0.7
80% PP/20% Copolymer Cup 4.3 3.7 2.3 0.9
70% PP/30% Copolymer Cup 1.8 1.4 0.8 0.5
0% PP/100% Copolymer Cup 3.4 2.8 1.0 0.4
respectively, and ratio variations of these bands define the relative proportions of PE to PP. It has been suggested (9, 33) that the 720 and 730 cm·1 band doublet (Figure 7) identifies the crystalline nature of the polymer, however, no attempt was made to quantitate crystallinity by infrared.
The calibration curve of the absorbance ratio [A720/A1168] versus [%CP/%PP] for the blends produced a straight line plot with a non-zero intercept
Figure 10. Variation of the storage modulus with temperature for the copolymer blends.
(Figure 8) . The A720 and A1168 refers to the absorbance of PE and PP in the samples, and the %CP/%PP is the ratio of the percent copolymer blend (PP/PE) initially added to the PP homopolymer. In agreement with the DSC data , the 100% PP cup contained 7.0% copolymer which may have been added as regrind or color concentrate to all blends. The true concentration of copolymer present in all blends, exclusive of the regrind added , was calculated (23) from the equation of the straight line plot of the calibration curve where Y[A720/A1168] = 0 (Figure 8).
The variation of tangent delta (tano) and the storage modulus versus ·temperature was determined for the samples by dynamic mechanical analysis (Tables 5, 6 and Figures 9 through 11). Figure 9 shows four tano regions depicted by: 1) -120 o C to -100 o C which is said
0 ,... ~ «> c .!!
150.0
307
1.20 ® 1.10
1.00
0.90
0.80
0.70
0.60
0.50
0.40
0.30
0.20
-150.0 ·100.0 -50.0 0.0 50.0 100.0 150.0
Temperature (0 C)
Figure 8 (at left). Plot of infrared absorbance versus the ratio of percent copolymer to percent polypropylene (corrected , at bottom, and uncorrected, at top).
Figure 9 (above). Variation of tano with temperature for the copolymer blends.
"' 0
3.50
3.00
,... 2.50 )(
"' e:.. 2.00
"' :1 3 1.50 '0 0
::: 1.00
0.50
-100.0 -50.0 0.0 50.0 100.0
Temperature (0 C)
3.50
3.00
0 2.50
E 2.00 «> c .!! 1.50
1.00
0.50
0.00
150.0
Figure 11 . The storage modulus and tano versus temperature for the 100% copolymer cup (50 % PP/50% PE) .
to be due to long chain ( -CH2 ") 0 crankshaft relaxations in the amorphous phase (33) ; 2) the glass transition (T ) of the PE+ PP amorphous copolymer at -50 oc to -1d oc; 3) the Tg for PP at -10 oc ; and 4) the secondary transition at approximately 75 oc to 85 oc where the loss modulus increases so rapidly that the storage modulus no longer contributes any restoring force to the compound resonance system (4, 11-12 , 26). The exact nature of molecular motions associated with tano peaks for mixtures of amorphous and crystalline polymers are difficult to interpret , however , Tobolsky and Mark (31) have shown that tano measurements are especially significant in the amorphous state. Large tano peaks below -100 oc are generally associated with the high impact strength of polymers (6 , 13 , 32) . Figure 9 and Table 5 shows that the 80% PP/20% copolymer had the largest
I.R. Urzendowski and D.G. Pechak
Table 7. Tensile strength of HIPS, coated and uncoated.
Sample ID Area Tensile , CD Tensile , MD sq in sq mm lb/sq in kg/sq mm lb/sq in kg/sq mm
1. Plain HIPS Sheet Stock 0 .0033
2. Saran coated HIPS 0.0033
2.13
2. 13
2850
2797
2.0
1.9
2994
3619
2. 1
2.5
Sample width - 0.250 in. (6.35 mm) Sample thickness- 0.013 in . (0.33 mm)
Cross direction - CD Machine direction - MD
Table 8. Average thickness of Saran coated HIPS cups. All samples contain -17 mil HIPS and 8# , 12#, or 15# per ream Saran coating on inside.
tanc5 peak below -100 o C; the PE in the 10% and 15% copolymer blend may be too dilute to see the -100 oc peak. The increase in tanc5 near -50 oc suggests greater interactions of the amorphous regions of the blends and the interactions above 0 oc are associated with the crystalline phases of the blends.
Figure 10 and Table 6 shows that the 80% PP/ 20% copolymer blend has the highest modulus at -100 o C which suggests it is the strongest blend. Also shown is the storage modulus for the amorphous ethylene/propylene (E+ P) copolymer where the modulus decreases at -50 oc (the T of the amorphous copolymer). It is clear that cross-lin~ing by the crystalline copolymers of this study suppresses the region of rubbery flow of the pure amorphous copolymer (E+ P) and enhances the modulus between its T g and the melting point. The exact form of modulus enhancement depends on the degree of crystallinity and the size of the crystallites. The experimental modulii curves (Figure 10) suggest that the 80% PP/20% copolymer blend extends the Tg to approximately 5 oc and the slope is continuous to beyond 130 °C. All samples have broad storage modulii slopes (E versus temperature slopes) which is an indication of increased blend compatibility (24).
Tables 5 and 6 and Figure 11 show the DMA data for the 100% copolymer cup. The tanc5 peaks at -100 °C, -50 °C, -10 oc, and 80 oc suggest increased blend compatibility similar to the results obtained for the 80% PP/20% and the 70% PP/30% copolymer blends. This coincides with the DSC crystallization data (Figure 6 and Table 4) which showed a single peak at 111 °C .
Conclusions: The study showed that the enthalpies of fusion and crystallization of the blends are related to crystallinity and to blend compatibility. The .:1Hf fusion values increased with an increase in blend concentration, however, variations in the heat of crystallization and the disappearance of the PE peak at high blend concentrations, suggested cocrystallization of peaks. This is in agreement with the data generated for the 100% copolymer blend and with the DMA results, which suggest that as the concentration of copolymer in the blend increased beyond 15%, blend compatibility increased. Increased compatibility resulted from the broadening of the a-transition for PP and the appearance of the tanc5 PE peaks at lower temperatures.
High Impact Polystyrene Cups
This study includes: 1) initial studies on pure HIPS and PVDC/HIPS sheet stock, 2) studies on the empty trays, and 3) studies on trays which contained product.
1. Initial studies on pure HIPS and PVDC/ HIPS sheet stock. The DSC scans for both the HIPS and HIPS/PVDC sheet stock are seen on Figure 12. The scans show the glass transition (T g) of the styrenepolybutadiene rubber component at approximately -20 °C,
§" .s 3: .2 u.. ... .. J:
309
30.0
25.0
20.0
15.0
10.0
5.0
-50.0 0.0 50.0 100.0 150.0 200.0 250.0
Temperature (°C)
Figure 12. DSC scans for HIPS and HIPS/PVDC sheet stock.
Table 10. Reaction time observed before noticeable cup breakdown was evident after toluene was placed
inside the cup on the Saran layer (10 cups/test).
Sample Number
1
2
1
2
1
2
1 2
2
2
2
2
1
2
Supplier Number
1
1
2
2
2
2
2
2
3
3
3
3
3
3
Saran Passes
8# Saran
8# Saran
12# Saran
12# Saran
15# Saran
15# Saran
8# Saran 8# Saran
12# Saran
12# Saran
15# Saran
15# Saran
8# Saran
8# Saran
12# Saran
12# Saran
15# Saran
15# Saran
Time of Breakdown
7 min.
3 min.
8 min .
15 min .
4 days
6 days
7 min.
10 min.
4 days
6 days
6 days
6 days
7 min.
4 min.
4 days
4 days
6 days
6 days
NOTE: Samples from each supplier refer to samples from the same lot; min. = minutes.
the T g of polystyrene at 101 oc, and the melt decomposition peak for Saran above 200 °C. The pure HIPS sample was identical except for the added Saran .
I.R. Urzendowski and D.G. Pechak
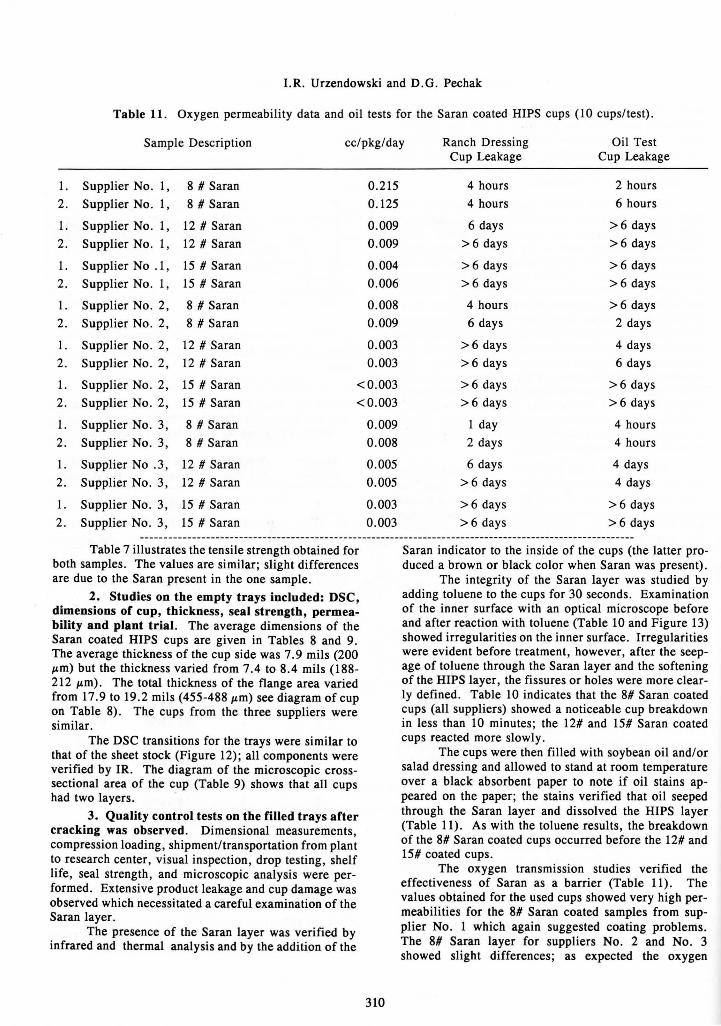
Table 11. Oxygen permeability data and oil tests for the Saran coated HIPS cups (10 cups/test).
Sample Description cc/pkg/day Ranch Dressing Oil Test
Table 7 illustrates the tensile strength obtained for both samples. The values are similar; slight differences are due to the Saran present in the one sample.
2. Studies on the empty trays included: DSC, dimensions of cup, thickness, seal strength, permeability and plant trial. The average dimensions of the Saran coated HIPS cups are given in Tables 8 and 9. The average thickness of the cup side was 7.9 mils (200 ~-tm) but the thickness varied from 7.4 to 8.4 mils (188-212 ~-tm). The total thickness of the flange area varied from 17.9 to 19.2 mils (455-488 ~-tm) see diagram of cup on Table 8) . The cups from the three suppliers were similar.
The DSC transitions for the trays were similar to that of the sheet stock (Figure 12); all components were verified by IR. The diagram of the microscopic crosssectional area of the cup (Table 9) shows that all cups had two layers.
3. Quality control tests on the filled trays after cracking was observed. Dimensional measurements, compression loading, shipment/transportation from plant to research center, visual inspection, drop testing, shelf life, seal strength, and microscopic analysis were performed. Extensive product leakage and cup damage was observed which necessitated a careful examination of the Saran layer.
The presence of the Saran layer was verified by infrared and thermal analysis and by the addition of the
0.009
0.008
0.005 0.005
0.003
0.003
310
Cup Leakage Cup Leakage
4 hours 2 hours
4 hours 6 hours
6 days > 6 days
> 6 days >6 days
> 6 days > 6 days > 6 days > 6 days
4 hours > 6 days 6 days 2 days
> 6 days 4 days
>6 days 6 days
> 6 days > 6 days
> 6 days >6 days
1 day 4 hours 2 days 4 hours
6 days 4 days
> 6 days 4 days
> 6 days > 6 days
> 6 days >6 days
Saran indicator to the inside of the cups (the latter produced a brown or black color when Saran was present).
The integrity of the Saran layer was studied by adding toluene to the cups for 30 seconds. Examination of the inner surface with an optical microscope before and after reaction with toluene (Table 10 and Figure 13) showed irregularities on the inner surface. Irregularities were evident before treatment, however, after the seepage of toluene through the Saran layer and the softening of the HIPS layer, the fissures or holes were more clearly defined. Table 10 indicates that the 8# Saran coated cups (all suppliers) showed a noticeable cup breakdown in less than 10 minutes; the 12# and 15# Saran coated cups reacted more slowly .
The cups were then filled with soybean oil and/or salad dressing and allowed to stand at room temperature over a black absorbent paper to note if oil stains appeared on the paper; the stains verified that oil seeped through the Saran layer and dissolved the HIPS layer (Table 11). As with the toluene results, the breakdown of the 8# Saran coated cups occurred before the 12# and 15# coated cups.
The oxygen transmission studies verified the effectiveness of Saran as a barrier (Table 11). The values obtained for the used cups showed very high permeabilities for the 8# Saran coated samples from supplier No. 1 which again suggested coating problems. The 8# Saran layer for suppliers No. 2 and No. 3 showed slight differences; as expected the oxygen
Characterization of Food Packaging Materials
Figure 13. Irregularities observed (arrows) on the 8# Saran layer from supplier numbers 1 (a, b) and 3 (b, d), before (a, c) and after (b, d) treatment with toluene .
permeability was less for the 12# and 15# Saran coated cups . Saran thickness varied from approximately 2 ~m to 16 ~m from the 8# to the 15# Saran coated cups.
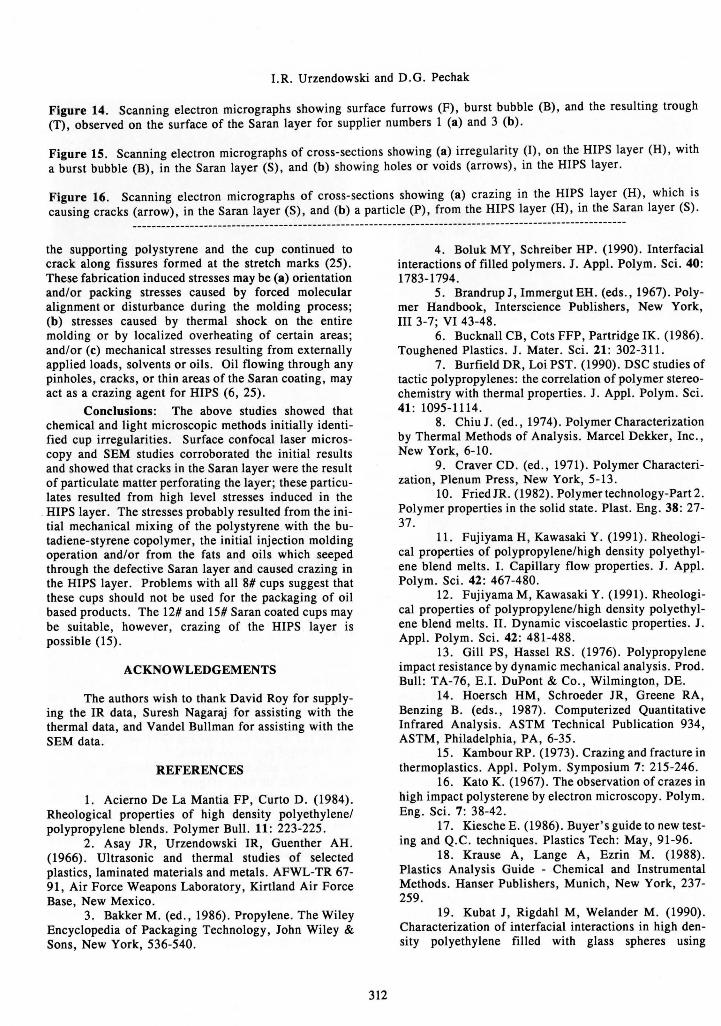
Preliminary surface laser analysis by confocal microscopy (LSM 10) revealed what appeared to be cracks in the 8# single pass Saran coated HIPS cups. These cracks were prominent near the bottom corners of the cups and correlated well with the area where leakage usually occurs. Closer examination of the Saran surface by SEM (Figures 14a, 14b) revealed these cracks to be surface furrows where the thickness of the Saran layer decreased as the furrows were formed. Based on numerous observations at the correct tilt , the thickness of the Saran coat adjacent to the stretch marks varied from 3.5 to 4 .5 ~m while the thickness of the Saran coat in the trough was less than 0 . 1 ~m . Fewer surface furrows were seen in the Saran layer of double coated (12#) cups and no such structures were seen within the Saran layer of the triple coated cups .
311
Confocal laser microscopy revealed round irregularities on the Saran surface which were shown by SEM to be bubbles that apparently burst in the Saran during the coating and molding process (Figures 14a, 14b) ; the cross-sectional cut on Figure !Sa shows irregularities in the HIPS layer with a bubble in the ·Saran layer. The thickness of the Saran coating in the trough of the bubbl e was less than 0.1 ~m. Very few bubbles were observed on the 12# double pass cups and none were observed on the 15# triple pass Saran layers .
Cross-sections of the cup observed by SEM showed voids or holes (Figure 15b) in the HIPS laye r and particles embedded in the Saran Iay~r (Figures 16a, 16b). On the cups with a single Saran coat these particles span the thickness of the Saran coating creating definite cracks through which oil could f Ontact the HIPS layer and cause crazing . The particles were also ob served on the double and triple coated cups but very few spanned the thickness of the Saran ·layer .
Leakage in the cups started where bubbles had formed and burst in the Saran during the coating or forming process , at deep stretch marks , or at cracks formed by the embedded particles. The oil weakened
I.R. Urzendowski and D.G. Pechak
Figure 14. Scanning electron micrographs showing surface furrows (F) , burst bubble (B) , and the resulting trough (T), observed on the surface of the Saran layer for supplier numbers 1 (a) and 3 (b) .
Figure 15. Scanning electron micrographs of cross-sections showing (a) irregularity (I), on the HIPS layer (H), with a burst bubble (B) , in the Saran layer (S), and (b) showing holes or voids (arrows), in the HIPS layer.
Figure 16. Scanning electron micrographs of cross-sections showing (a) crazing in the HIPS layer (H), which is causing cracks (arrow), in the Saran layer (S) , and (b) a particle (P), from the HIPS layer (H) , in the Saran layer (S).
the supporting polystyrene and the cup continued to crack along fissures formed at the stretch marks (25) . These fabrication induced stresses may be (a) orientation and/or packing stresses caused by forced molecular alignment or disturbance during the molding process; (b) stresses caused by thermal shock on the entire molding or by localized overheating of certain areas; and/or (c) mechanical stresses resulting from externally applied loads, solvents or oils. Oil flowing through any pinholes, cracks, or thin areas of the Saran coating, may act as a crazing agent for HIPS (6, 25).
Conclusions: The above studies showed that chemical and light microscopic methods initially identified cup irregularities . Surface confocal laser microscopy and SEM studies corroborated the initial results and showed that cracks in the Saran layer were the result of particulate matter perforating the layer; these particulates resulted from high level stresses induced in the
. HIPS layer. The stresses probably resulted from the initial mechanical mixing of the polystyrene with the butadiene-styrene copolymer, the initial injection molding operation and/or from the fats and oils which seeped through the defective Saran layer and caused crazing in the HIPS layer. Problems with all 8# cups suggest that these cups should not be used for the packaging of oil based products. The 12# and 15# Saran coated cups may be suitable, however, crazing of the HIPS layer is possible (15).
ACKNOWLEDGEMENTS
The authors wish to thank David Roy for supplying the IR data, Suresh Nagaraj for assisting with the thermal data, and Vande! Bullman for assisting with the SEM data.
REFERENCES
1. Acierno De La Mantia FP, Curto D. (1984). Rheological properties of high density polyethylene/ polypropylene blends . Polymer Bull. 11: 223-225.
2. Asay JR, Urzendowski IR, Guenther AH. ( 1966) . Ultrasonic and thermal studies of selected plastics, laminated materials and metals. AFWL-TR 67-91, Air Force Weapons Laboratory , Kirtland Air Force Base, New Mexico.
3. Bakker M. (ed., 1986). Propylene. The Wiley Encyclopedia of Packaging Technology, John Wiley & Sons, New York, 536-540.
7. Burfield DR, Loi PST. ( 1990) . DSC studies of tactic polypropylenes: the correlation of polymer stereochemistry with thermal properties. J. Appl. Polym. Sci. 41: 1095-1114.
8. Chiu J. (ed., 1974). Polymer Characterization by Thermal Methods of Analysis. Marcel Dekker, Inc., New York, 6-10.
9. Craver CD. (ed., 1971) . Polymer Characterization , Plenum Press, New York, 5-13.
10. Fried JR. (1982). Polymertechnology-Part2. Polymer properties in the solid state. Plast. Eng. 38: 27-37.
11. Fujiyama H, Kawasaki Y. (1991). Rheological properties of polypropylene/high density polyethylene blend melts . I. Capillary flow properties. J. Appl. Polym. Sci. 42 : 467-480.
12. Fujiyama M, Kawasaki Y. (1991). Rheological properties of polypropylene/high density polyethylene blend melts. II. Dynamic viscoelastic properties. J . Appl. Polym. Sci. 42 : 481-488.
13 . Gill PS , Hassel RS . (1976) . Polypropylene impact resistance by dynamic mechanical analysis . Prod. Bull: TA-76, E. I. DuPont & Co., Wilmington, DE.
14. Hoersch HM, Schroeder JR, Greene RA , Benzing B. (eds., 1987). Computerized Quantitative Infrared Analysis. ASTM Technical Publication 934, ASTM, Philadelphia, PA , 6-35.
15. Kambour RP. ( 1973). Crazing and fracture in thermoplastics. Appl. Polym. Symposium 7: 215-246.
16. Kato K. (1967). The observation of crazes in high impact polysterene by electron microscopy. Polym. Eng . Sci. 7: 38-42.
17. KiescheE. (1986). Buyer'sguidetonewtesting and Q.C. techniques. Plastics Tech: May, 91-96.
18. Krause A, Lange A, Ezrin M. (1988). Plastics Analysis Guide - Chemical and Instrumental Methods. Hanser Publishers , Munich, New York, 237-259.
19. Kubat J , Rigdahl M, Welander M. (1990). Characterization of interfacial interactions in high density polyethylene filled with glass spheres using
Characterization of Food Packaging Materials
313
I.R. Urzendowski and D.G. Pechak
dynamic-mechanical analysis. J. Appl. Polym. Sci. 39: 1527-1539.
20. Li Y, Williams HL. (1990). A dynamic mechanical study of polycarbonate-polystyrene blends. I. Appl. Polym. Sci. 40: 1881-1890.
21. Loan LD, Winslow FH. (1985). Polymer Stabilization. Hawkins W (ed.), Wiley Publishers, New York, 117-159.
22 . Mark IE, Eisenberg A, Graessley WW, Mandelkern L, Koenig JL. (1988). Physical Properties of Polymers. Amer. Chern. Soc. Washington, DC, 227-231.
23. Messerschmidt RG, Harthcock MA. (eds., 1988). Infrared Microspectroscopy. Marcel Dekker, Inc, New York, 1-39.
24. Plochocki A. (1972). On the rheology of molten binary blends of polyolefins. X. Homogeneity and high shear (Poiseuille' s) melt flow of polypropylenepolyethylene blends. J. Appl. Polym. Sci. 16: 987-1008.
25. Raetz RW. (1986). Crazing. In: Encyclopedia of Materials Science and Technology, Vol. 4, Kambour RP (ed.), John Wiley & Sons, New York, 169-198.
26. Rego JM, Gonzales Orozco JA, Katime I. (1990). Determination of the influence of structure and thermal history on the dynamic mechanical properties of high density polyethylene. I. Appl. Polym. Sci. 40: 1453-1472.
27. RobertsonRR, Paul DR. (1973). Stress-strain behavior of polyolefin blends. J. Appl. Polym. Sci. 17: 2579-2595.
28. SewardRJ. (1970). Theobservationofcrazes in high-impact polystyrene by electron microscopy. J. Appl. Polym. Sci. 14: 852-858.
29. Shah V. (1984). Handbook of Plastics Testing Technology, Wiley-Interscience Pub., New York, 276-277.
30. Siesler HW, Holland-Moritz R. (1980). Infrared and Raman Spectroscopy of Polymers. Marcel Dekker, Inc., New York, 1-145.
31. Tobolsky AV, Mark HF. (eds., 1971). Polymer Science and Materials . Wiley-Interscience, Inc., New York, 215-221.
32 . Turi EA. (ed., 1981) . Thermal Characterization of Polymeric Materials. Academic Press, New York, 71-75, 580-592, 601-621.
33. Urbanski I, Czerwinski W, Janicka R, Majewska F, Zowall H. (1977). Analysis of Synthetic Polymers and Plastics. English edition published by Ellis Horwood Ltd., Chichester, Sussex, England, pp. 70-72, 85-86, 344-349.
34. Urzendowski IR, Guenther AH, Asay JR. (1968) . The temperature dependence of the Gruneisen ratio of polymeric materials determined by thermal and ultrasonic sound velocity measurements. In: Analytical Calorimetry, Porter RS, Johnson IF (eds.), Plenum Press, New York, 119-132.
35. Urzendowski IR, Guenther AH. (1970). Thermodynamical and statistical mechanical implications
314
associated with Gruneisen ratios calculated by various formulations. In: Analytical Calorimetry, Porter RS, Johnson IF (eds.), Plenum Press, New York, 77-94.
36. Urzendowski IR, Guenther AH. (1974). The use of thermal and ultrasonic data to calculate the pressure dependence of the Gruneisen parameter. In: Analytical Calorimetry, Porter RS, Johnson IF (eds.), Plenum Press, New York, 165-184.
37. Wendlandt WW. (1986). Thermal analysis. Third Edition, John Wiley & Sons, New York, 213-241.
Discussion with Reviewers
C. Qin and S. Ding: The symbols for blends and copolymers should be consistent in the paper. Authors: In this text the blends are a combination of homopolymer plus copolymer blend depicted as PP/(PE/PP) in order to define the amount of each constituent added. In all instances, the titles % Copolymer Cup (Figures 1 and 2), or % Copolymer (Figures 3-4, and 6-8) refer to the copolymer blend (PE/PP). The E/P symbol on Figure 10 refers to the copolymer of ethylene and propylene and not the blend.
C. Qin and S. Ding: The material sources are not clear. Authors: As stated in paragraph 2 under the Materials section, the studies were performed on formed cups as obtained from the supplier; the latter provided the compositions of each component in the blend before DSC and FTIR compositions were determined.
C. Qin and S. Ding: Did the authors try to correlate Fig. 6 and Fig . 9 results? Authors: No extensive correlations were made between Fig. 6 and Fig. 9 at this time. Figure 12 shows the Tg of styrene-butadiene.
D. Neuberger: Clarification is needed regarding the thickness of the Saran layer. Authors: The diagram on Table 9 shows the average thickness of the side wall and does not include the corners where bubbles were generally observed and where the Saran layer was much thinner. Microscopy deals with the thickness of the Saran at the corners where the Saran is thinner due to the stretching of the Saran layer and the burst of the bubble. Both the Saran and the HIPS layers were much thicker on the flange area (Tables 8 and 9).