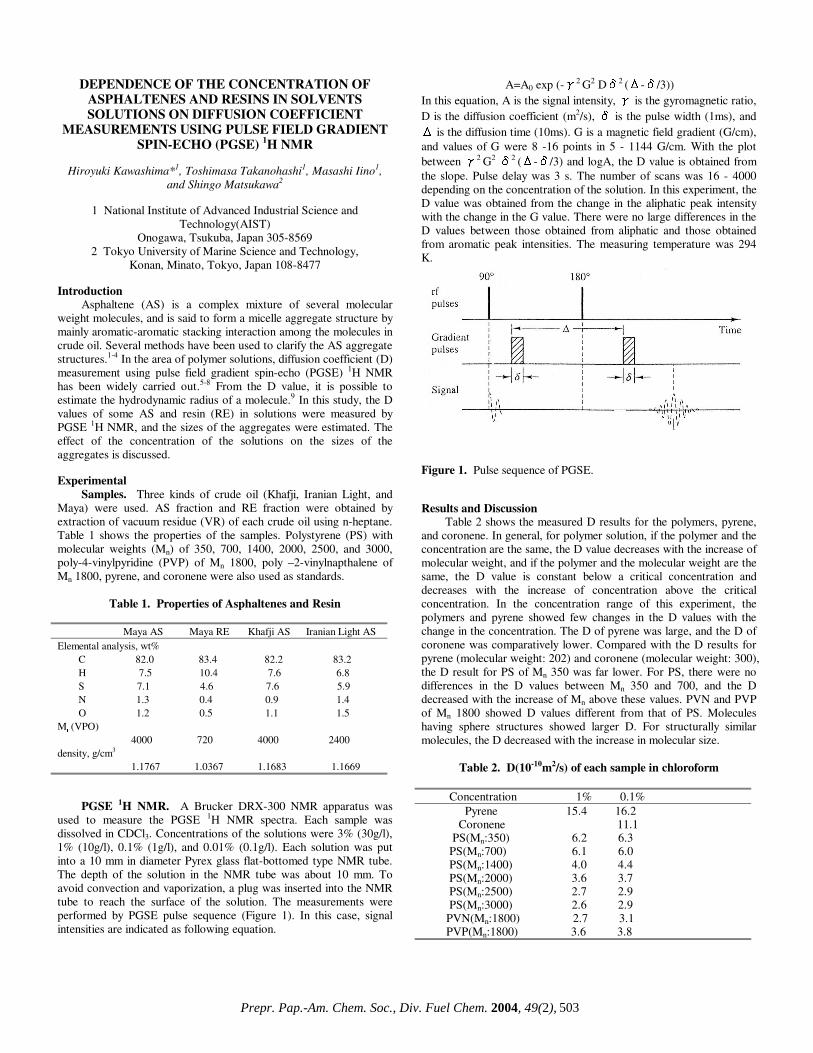
CHARACTERIZATION OF HEAVY, BIODEGRADED CRUDE OILS BY HIGH RESOLUTION ESI FT-ICR MASS SPECTROMETRY Ryan P. Rodgers 2 , Geoffrey C. Klein 1 , Lateefah A. Stanford 1 , Sunghwan Kim 2 and Alan G. Marshall 1,2 1. Department of Chemistry and Biochemistry, Florida State University, Tallahassee, Florida 32306. 2. Ion Cyclotron Resonance Program, National High Magnetic Field Laboratory, Florida State University, 1800 E Paul Dirac Drive, Tallahassee, Florida 32310. Introduction ESI FT-ICR MS analysis crude oil achieves sufficient mass resolving power (m/∆m 50% > 300,000 , in which ∆m 50% denotes mass spectral peak full width at half height) and high mass accuracy (< 1 ppm) to allow for the baseline resolution and elemental composition assignment of thousands of heteroatomic species in a single crude oil. 1 The selectivity of the ElectroSpray Ionization (ESI) process limits the observed species to those that both contain one or more heteroatoms (N,S or O) and are acidic (negative ion mode) or basic (positive ion mode). The limitation imposed by ESI is beneficial in that the bulk hydrocarbon matrix is transparent to the analysis, and therefore chromatographic pretreatment for the isolation of polar heteroaromatic species is superfluous. Here we apply ESI FT-ICR MS to a series of heavy crude oils of similar geographic origin that have gone through varying degrees of biodegradation. Experimental Crude Oil Samples. Each of six biodegraded crude oils (~20 mg) was dissolved in 10 mL of toluene and then diluted with 10 mL of methanol to a final volume of 20 mL. The samples were further diluted to a final concentration of 0.1 mg of crude/mL of solvent. One mL of the final solution was spiked with 30 μL of ammonium hydroxide to facilitate deprotonation for the ESI FT-ICR mass spectral analysis. mg) was dissolved in 10 mL of toluene and then diluted with 10 mL of methanol to a final volume of 20 mL. The samples were further diluted to a final concentration of 0.1 mg of crude/mL of solvent. One mL of the final solution was spiked with 30 μL of ammonium hydroxide to facilitate deprotonation for the ESI FT-ICR mass spectral analysis. Mass Analysis. The crude oils were analyzed at the National High Magnetic Field Laboratory (NHMFL) with a homebuilt 9.4 Tesla Fourier transform mass spectrometer. Ions were generated externally by a micro-electrospray source and samples were delivered by a syringe pump at a rate of 300 nL/min. Approximately 2.2 kV was applied between the capillary needle and ion entrance (heated metal capillary). The externally generated ions were accumulated in a short (15 cm) rf-only octopole for 30s and then transferred via a 200 cm rf-only octopole ion guide to a Penning trap. Ions were excited by frequency-sweep (100-725 kHz @ 150 Hz/µs at an amplitude of 200 Vp-p across a 10-cm diameter open cylindrical cell). The time-domain ICR signal was sampled at 1.28 Msample/s for 3.27 s to yield 4 Mword time-domain data. One hundred data sets were co-added, zero-filled once, Hanning apodized, and fast Fourier transformed with magnitude computation. Mass spectra were internally calibrated with respect to the most abundant heteroatom containing series over the full mass range. Homologous series were separated and grouped by nominal Kendrick mass and Kendrick mass defect to facilitate rapid identification, as described elsewhere. 2 Mass Analysis. The crude oils were analyzed at the National High Magnetic Field Laboratory (NHMFL) with a homebuilt 9.4 Tesla Fourier transform mass spectrometer. Ions were generated externally by a micro-electrospray source and samples were delivered by a syringe pump at a rate of 300 nL/min. Approximately 2.2 kV was applied between the capillary needle and ion entrance (heated metal capillary). The externally generated ions were accumulated in a short (15 cm) rf-only octopole for 30s and then transferred via a 200 cm rf-only octopole ion guide to a Penning trap. Ions were excited by frequency-sweep (100-725 kHz @ 150 Hz/µs at an amplitude of 200 Vp-p across a 10-cm diameter open cylindrical cell). The time-domain ICR signal was sampled at 1.28 Msample/s for 3.27 s to yield 4 Mword time-domain data. One hundred data sets were co-added, zero-filled once, Hanning apodized, and fast Fourier transformed with magnitude computation. Mass spectra were internally calibrated with respect to the most abundant heteroatom containing series over the full mass range. Homologous series were separated and grouped by nominal Kendrick mass and Kendrick mass defect to facilitate rapid identification, as described elsewhere. 2 Results and Discussion Results and Discussion Variations in the molecular weight distributions are readily observable in the broadband mass spectra shown in Figure 1. As the level of degradation increases (Figure 1, top to bottom) the molecular weight distribution narrows and the average mass shifts to lower m/z. Variations in the molecular weight distributions are readily observable in the broadband mass spectra shown in Figure 1. As the level of degradation increases (Figure 1, top to bottom) the molecular weight distribution narrows and the average mass shifts to lower m/z. Figure 1 Non degraded Moderately degraded Figure 1. Series of broadband negative ion ESI mass spectra for three (undegraded (top), moderately degraded (middle) and very severely degraded (bottom)) members of a series of biodegraded oil samples. Figure 1. Series of broadband negative ion ESI mass spectra for three (undegraded (top), moderately degraded (middle) and very severely degraded (bottom)) members of a series of biodegraded oil samples. Such changes in the molecular weight distribution provide little information and are easily obtainable from lower resolution mass spectrometers. FT-ICR MS is unique in that the high resolution coupled with the extremely high mass accuracy (less than 1 ppm) allow for the resolution of very closely spaced isobaric doublets (less than 3 mDa) and elemental composition assignment for observed species. Mass resolution is paramount because each mass spectrum is composed of as many as ~8,000 peaks with as many as 20 peaks at a single nominal mass at an average mass resolving power that exceeds 300,000. The assignment of elemental compositions for the thousands of polar heteroaromatic species observed allows for component-by-component monitoring of the compositional changes in the biodegradation samples. Such changes in the molecular weight distribution provide little information and are easily obtainable from lower resolution mass spectrometers. FT-ICR MS is unique in that the high resolution coupled with the extremely high mass accuracy (less than 1 ppm) allow for the resolution of very closely spaced isobaric doublets (less than 3 mDa) and elemental composition assignment for observed species. Mass resolution is paramount because each mass spectrum is composed of as many as ~8,000 peaks with as many as 20 peaks at a single nominal mass at an average mass resolving power that exceeds 300,000. The assignment of elemental compositions for the thousands of polar heteroaromatic species observed allows for component-by-component monitoring of the compositional changes in the biodegradation samples. To highlight the compositional changes, three-dimensional van Krevelen diagrams are constructed from the assigned elemental compositions. The van Krevelen diagram facilitates information retrieval from assigned formulas. The plots, constructed from the assigned elemental compositions of peaks corresponding to oxygen containing compounds in the mass spectra, are displayed in Figures 2 and 3. It is clear that there has been substantial change in molecular compositions as the biodegradation of oil proceeds. For the diagram constructed from the spectrum of the non-degraded sample (Figure 2), O 2 species with double bond equivalence (DBE) value of 1 (which are presumably acyclic fatty acids) dominate in abundance. O 2 species with 6 DBE (likely hopanoic acids) are also abundant. The sample is also rich in highly cyclic or aromatic fatty acid type molecules. The diagram (Figure 3) from the severely degraded oil, shows a shift in dominance of O 2 type abundance from a DBE value To highlight the compositional changes, three-dimensional van Krevelen diagrams are constructed from the assigned elemental compositions. The van Krevelen diagram facilitates information retrieval from assigned formulas. The plots, constructed from the assigned elemental compositions of peaks corresponding to oxygen containing compounds in the mass spectra, are displayed in Figures 2 and 3. It is clear that there has been substantial change in molecular compositions as the biodegradation of oil proceeds. For the diagram constructed from the spectrum of the non-degraded sample (Figure 2), O 2 species with double bond equivalence (DBE) value of 1 (which are presumably acyclic fatty acids) dominate in abundance. O 2 species with 6 DBE (likely hopanoic acids) are also abundant. The sample is also rich in highly cyclic or aromatic fatty acid type molecules. The diagram (Figure 3) from the severely degraded oil, shows a shift in dominance of O 2 type abundance from a DBE value m 500 /z 600 800 700 400 300 Very severely degraded Prepr. Pap.-Am. Chem. Soc., Div. Fuel Chem. 2004, 49(2), 483
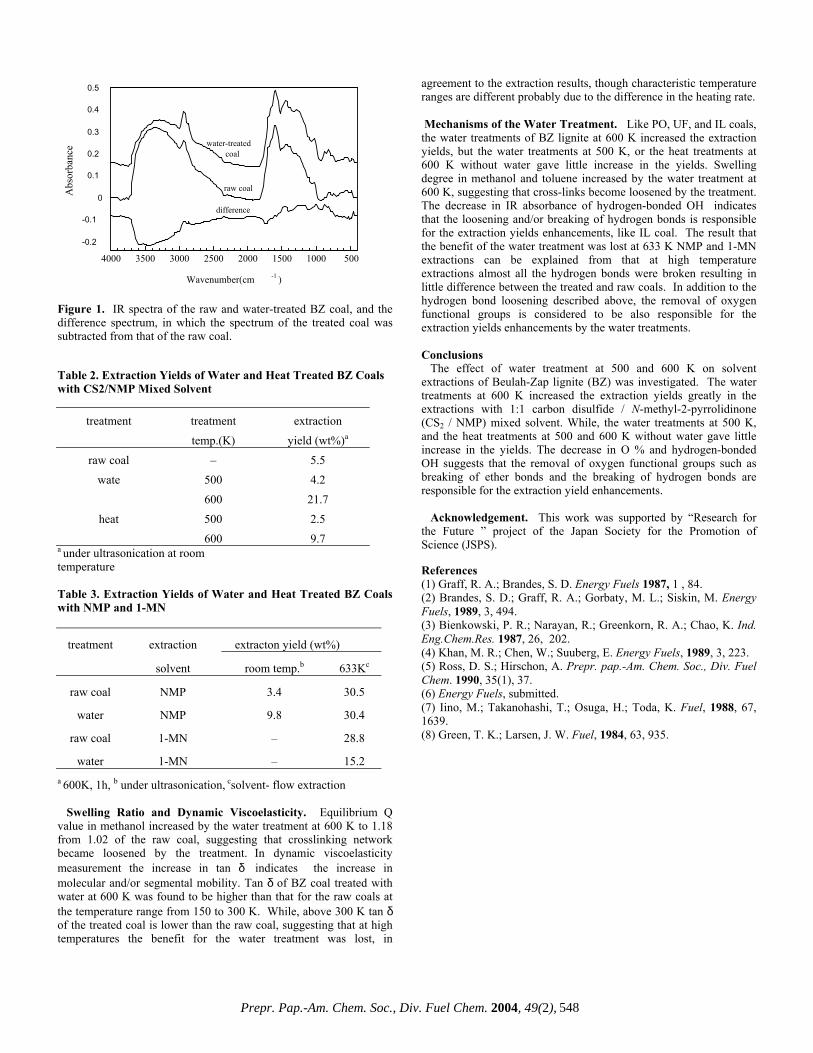
Transcript
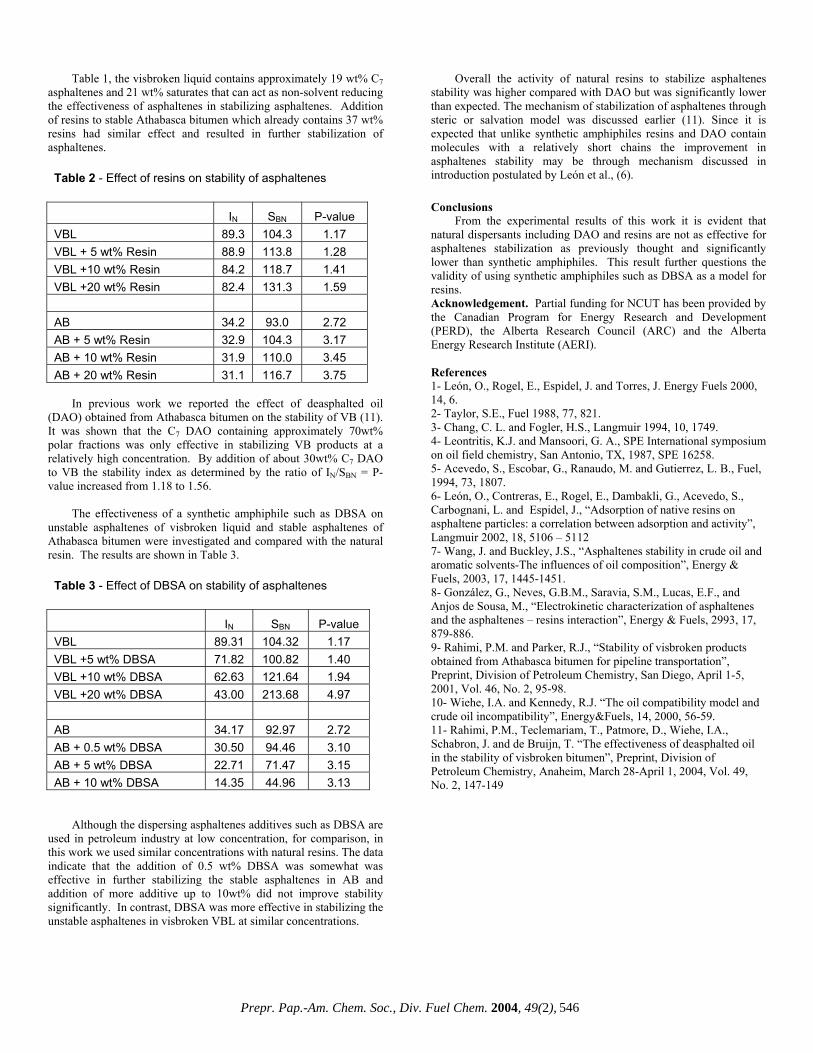
CHARACTERIZATION OF HEAVY, BIODEGRADED CRUDE OILS BY HIGH RESOLUTION ESI FT-ICR
MASS SPECTROMETRY
Ryan P. Rodgers2, Geoffrey C. Klein1, Lateefah A. Stanford1, Sunghwan Kim2 and Alan G. Marshall1,2
1. Department of Chemistry and Biochemistry, Florida State
University, Tallahassee, Florida 32306.2. Ion Cyclotron Resonance Program, National High Magnetic Field
Laboratory, Florida State University, 1800 E Paul Dirac Drive, Tallahassee, Florida 32310.
Introduction
ESI FT-ICR MS analysis crude oil achieves sufficient mass resolving power (m/∆m50% > 300,000, in which ∆m50% denotes mass spectral peak full width at half height) and high mass accuracy (< 1 ppm) to allow for the baseline resolution and elemental composition assignment of thousands of heteroatomic species in a single crude oil.1 The selectivity of the ElectroSpray Ionization (ESI) process limits the observed species to those that both contain one or more heteroatoms (N,S or O) and are acidic (negative ion mode) or basic (positive ion mode). The limitation imposed by ESI is beneficial in that the bulk hydrocarbon matrix is transparent to the analysis, and therefore chromatographic pretreatment for the isolation of polar heteroaromatic species is superfluous. Here we apply ESI FT-ICR MS to a series of heavy crude oils of similar geographic origin that have gone through varying degrees of biodegradation.
Experimental
Crude Oil Samples. Each of six biodegraded crude oils (~20 mg) was dissolved in 10 mL of toluene and then diluted with 10 mL of methanol to a final volume of 20 mL. The samples were further diluted to a final concentration of 0.1 mg of crude/mL of solvent. One mL of the final solution was spiked with 30 µL of ammonium hydroxide to facilitate deprotonation for the ESI FT-ICR mass spectral analysis.
mg) was dissolved in 10 mL of toluene and then diluted with 10 mL of methanol to a final volume of 20 mL. The samples were further diluted to a final concentration of 0.1 mg of crude/mL of solvent. One mL of the final solution was spiked with 30 µL of ammonium hydroxide to facilitate deprotonation for the ESI FT-ICR mass spectral analysis.
Mass Analysis. The crude oils were analyzed at the National High Magnetic Field Laboratory (NHMFL) with a homebuilt 9.4 Tesla Fourier transform mass spectrometer. Ions were generated externally by a micro-electrospray source and samples were delivered by a syringe pump at a rate of 300 nL/min. Approximately 2.2 kV was applied between the capillary needle and ion entrance (heated metal capillary). The externally generated ions were accumulated in a short (15 cm) rf-only octopole for 30s and then transferred via a 200 cm rf-only octopole ion guide to a Penning trap. Ions were excited by frequency-sweep (100-725 kHz @ 150 Hz/µs at an amplitude of 200 Vp-p across a 10-cm diameter open cylindrical cell). The time-domain ICR signal was sampled at 1.28 Msample/s for 3.27 s to yield 4 Mword time-domain data. One hundred data sets were co-added, zero-filled once, Hanning apodized, and fast Fourier transformed with magnitude computation. Mass spectra were internally calibrated with respect to the most abundant heteroatom containing series over the full mass range. Homologous series were separated and grouped by nominal Kendrick mass and Kendrick mass defect to facilitate rapid identification, as described elsewhere.2
Mass Analysis. The crude oils were analyzed at the National High Magnetic Field Laboratory (NHMFL) with a homebuilt 9.4 Tesla Fourier transform mass spectrometer. Ions were generated externally by a micro-electrospray source and samples were delivered by a syringe pump at a rate of 300 nL/min. Approximately 2.2 kV was applied between the capillary needle and ion entrance (heated metal capillary). The externally generated ions were accumulated in a short (15 cm) rf-only octopole for 30s and then transferred via a 200 cm rf-only octopole ion guide to a Penning trap. Ions were excited by frequency-sweep (100-725 kHz @ 150 Hz/µs at an amplitude of 200 Vp-p across a 10-cm diameter open cylindrical cell). The time-domain ICR signal was sampled at 1.28 Msample/s for 3.27 s to yield 4 Mword time-domain data. One hundred data sets were co-added, zero-filled once, Hanning apodized, and fast Fourier transformed with magnitude computation. Mass spectra were internally calibrated with respect to the most abundant heteroatom containing series over the full mass range. Homologous series were separated and grouped by nominal Kendrick mass and Kendrick mass defect to facilitate rapid identification, as described elsewhere.2
Results and Discussion Results and Discussion
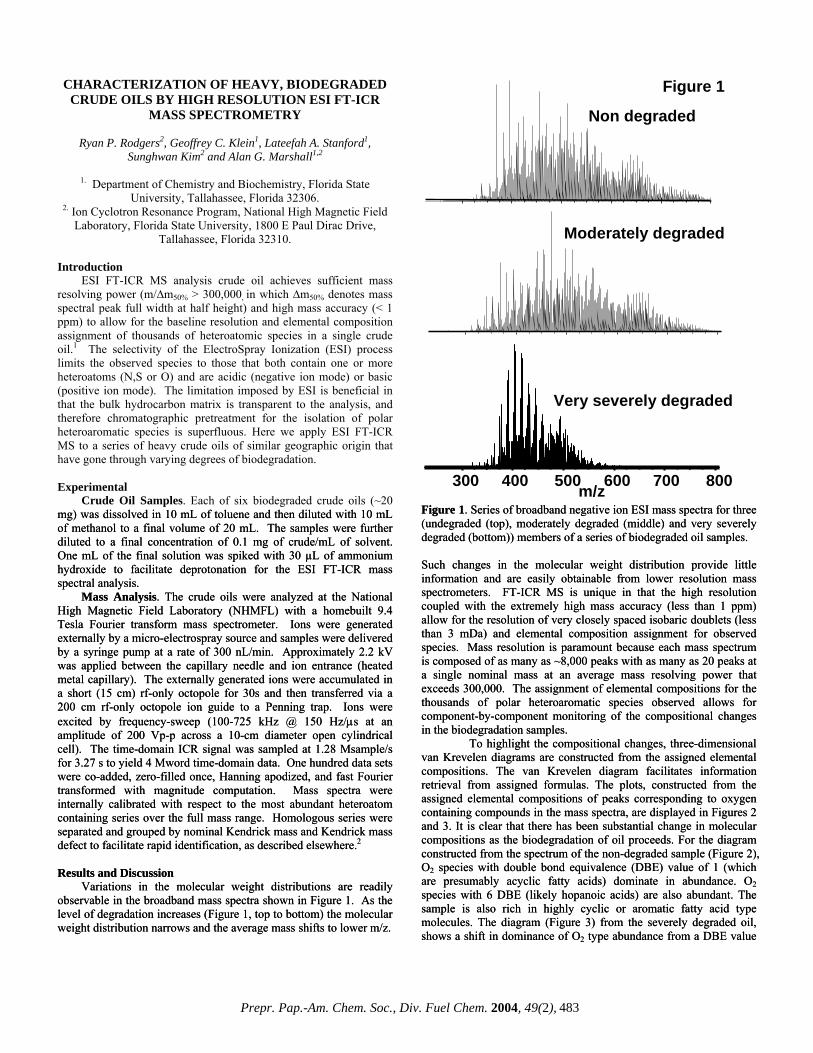
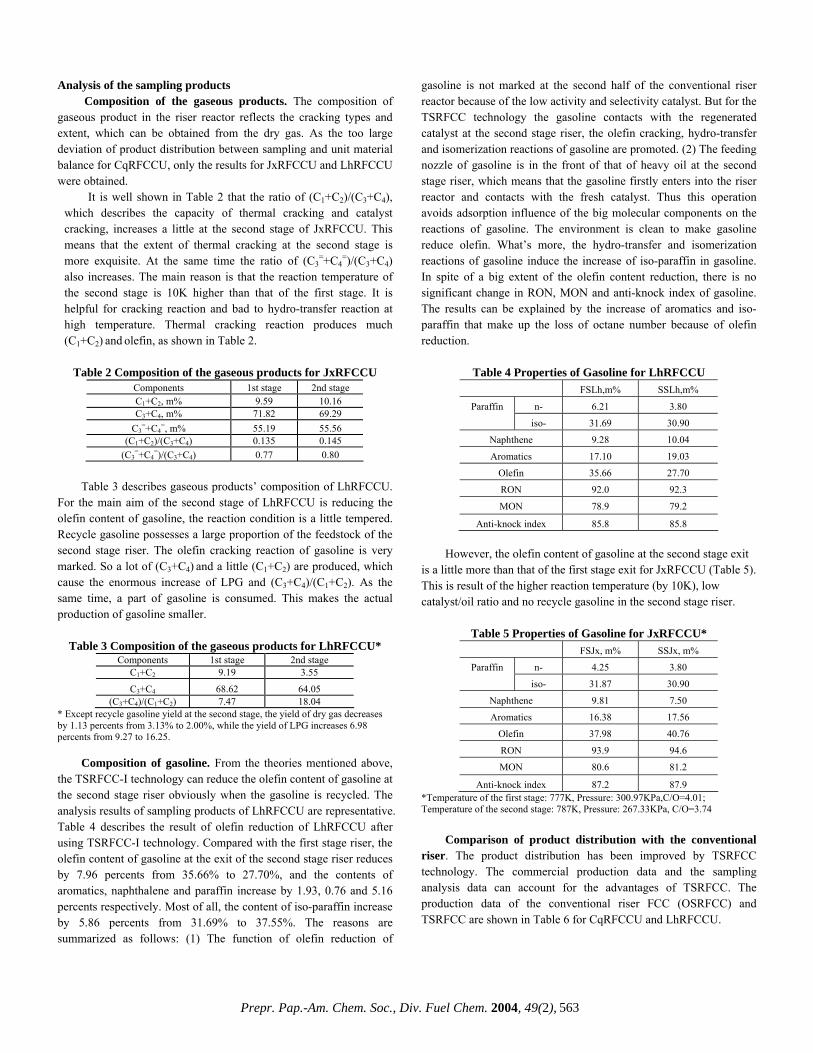
Variations in the molecular weight distributions are readily observable in the broadband mass spectra shown in Figure 1. As the level of degradation increases (Figure 1, top to bottom) the molecular weight distribution narrows and the average mass shifts to lower m/z.
Variations in the molecular weight distributions are readily observable in the broadband mass spectra shown in Figure 1. As the level of degradation increases (Figure 1, top to bottom) the molecular weight distribution narrows and the average mass shifts to lower m/z.
Figure 1
Non degraded
Moderately degraded
Figure 1. Series of broadband negative ion ESI mass spectra for three (undegraded (top), moderately degraded (middle) and very severely degraded (bottom)) members of a series of biodegraded oil samples.
Figure 1. Series of broadband negative ion ESI mass spectra for three (undegraded (top), moderately degraded (middle) and very severely degraded (bottom)) members of a series of biodegraded oil samples. Such changes in the molecular weight distribution provide little information and are easily obtainable from lower resolution mass spectrometers. FT-ICR MS is unique in that the high resolution coupled with the extremely high mass accuracy (less than 1 ppm) allow for the resolution of very closely spaced isobaric doublets (less than 3 mDa) and elemental composition assignment for observed species. Mass resolution is paramount because each mass spectrum is composed of as many as ~8,000 peaks with as many as 20 peaks at a single nominal mass at an average mass resolving power that exceeds 300,000. The assignment of elemental compositions for the thousands of polar heteroaromatic species observed allows for component-by-component monitoring of the compositional changes in the biodegradation samples.
Such changes in the molecular weight distribution provide little information and are easily obtainable from lower resolution mass spectrometers. FT-ICR MS is unique in that the high resolution coupled with the extremely high mass accuracy (less than 1 ppm) allow for the resolution of very closely spaced isobaric doublets (less than 3 mDa) and elemental composition assignment for observed species. Mass resolution is paramount because each mass spectrum is composed of as many as ~8,000 peaks with as many as 20 peaks at a single nominal mass at an average mass resolving power that exceeds 300,000. The assignment of elemental compositions for the thousands of polar heteroaromatic species observed allows for component-by-component monitoring of the compositional changes in the biodegradation samples. To highlight the compositional changes, three-dimensional van Krevelen diagrams are constructed from the assigned elemental compositions. The van Krevelen diagram facilitates information retrieval from assigned formulas. The plots, constructed from the assigned elemental compositions of peaks corresponding to oxygen containing compounds in the mass spectra, are displayed in Figures 2 and 3. It is clear that there has been substantial change in molecular compositions as the biodegradation of oil proceeds. For the diagram constructed from the spectrum of the non-degraded sample (Figure 2), O2 species with double bond equivalence (DBE) value of 1 (which are presumably acyclic fatty acids) dominate in abundance. O2 species with 6 DBE (likely hopanoic acids) are also abundant. The sample is also rich in highly cyclic or aromatic fatty acid type molecules. The diagram (Figure 3) from the severely degraded oil, shows a shift in dominance of O2 type abundance from a DBE value
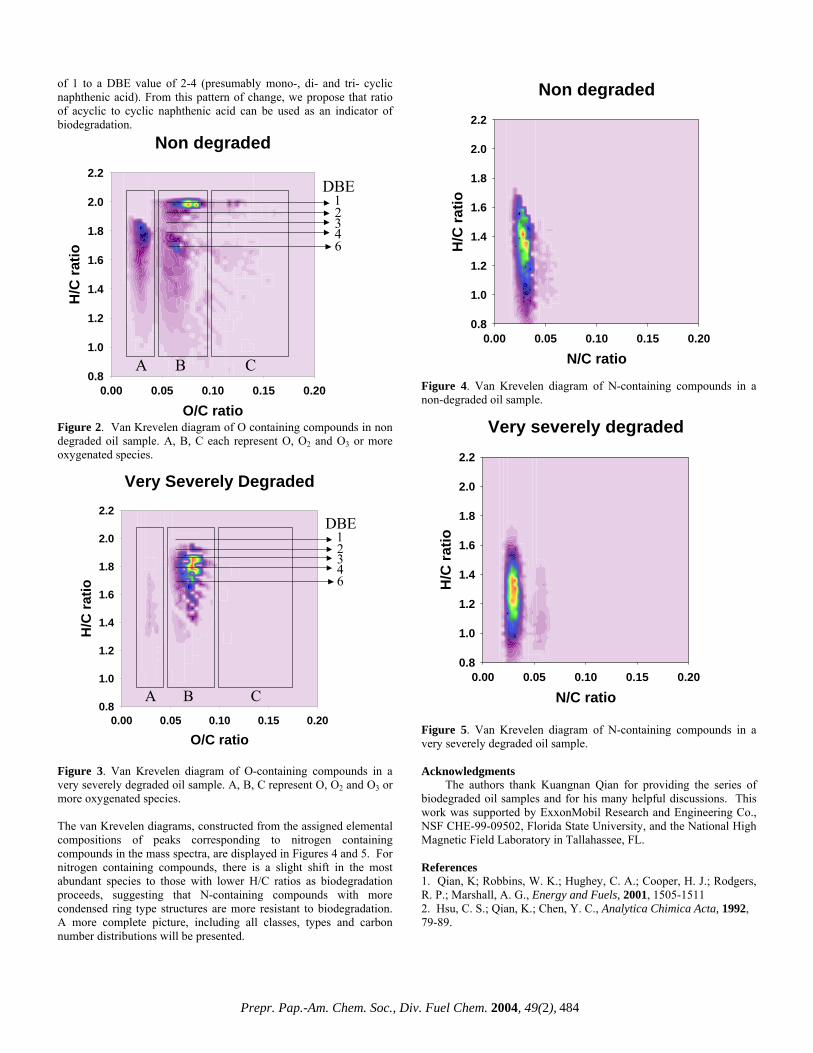
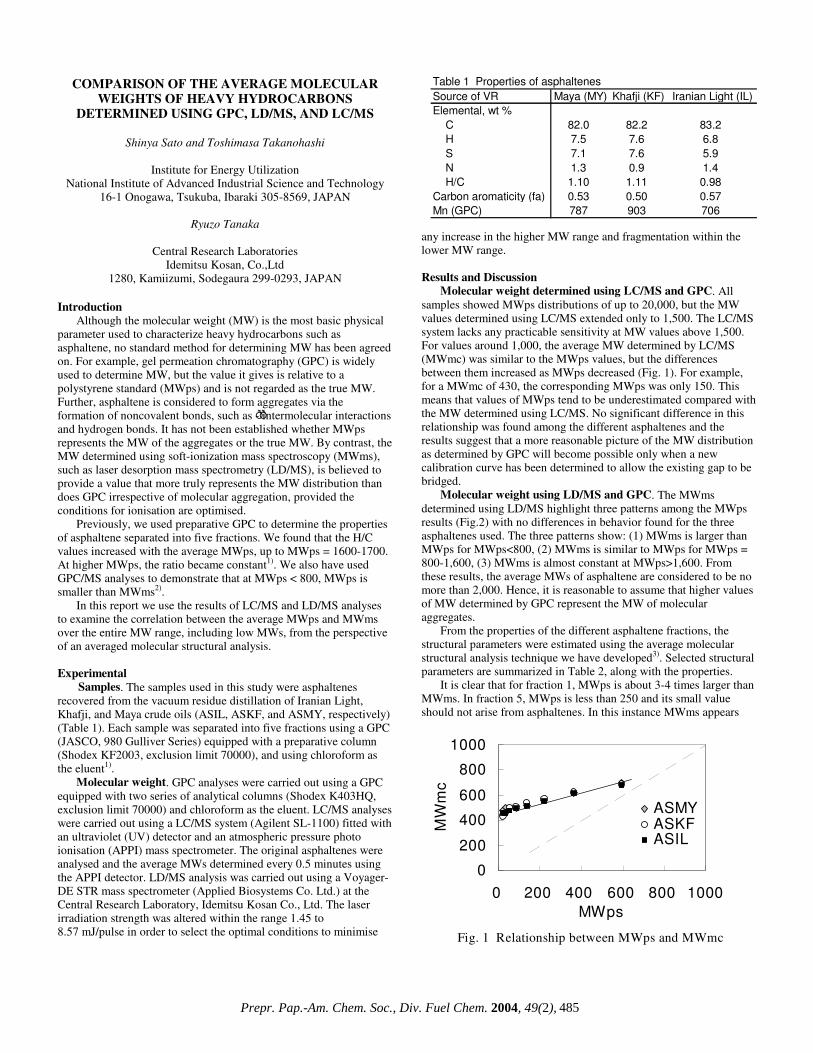
To highlight the compositional changes, three-dimensional van Krevelen diagrams are constructed from the assigned elemental compositions. The van Krevelen diagram facilitates information retrieval from assigned formulas. The plots, constructed from the assigned elemental compositions of peaks corresponding to oxygen containing compounds in the mass spectra, are displayed in Figures 2 and 3. It is clear that there has been substantial change in molecular compositions as the biodegradation of oil proceeds. For the diagram constructed from the spectrum of the non-degraded sample (Figure 2), O2 species with double bond equivalence (DBE) value of 1 (which are presumably acyclic fatty acids) dominate in abundance. O2 species with 6 DBE (likely hopanoic acids) are also abundant. The sample is also rich in highly cyclic or aromatic fatty acid type molecules. The diagram (Figure 3) from the severely degraded oil, shows a shift in dominance of O2 type abundance from a DBE value
of 1 to a DBE value of 2-4 (presumably mono-, di- and tri- cyclic naphthenic acid). From this pattern of change, we propose that ratio of acyclic to cyclic naphthenic acid can be used as an indicator of biodegradation. Figure 2. Van Krevelen diagram of O containing compounds in non degraded oil sample. A, B, C each represent O, O2 and O3 or more oxygenated species.
Figure 3. Van Krevelen diagram of O-containing compounds in a very severely degraded oil sample. A, B, C represent O, O2 and O3 or more oxygenated species.
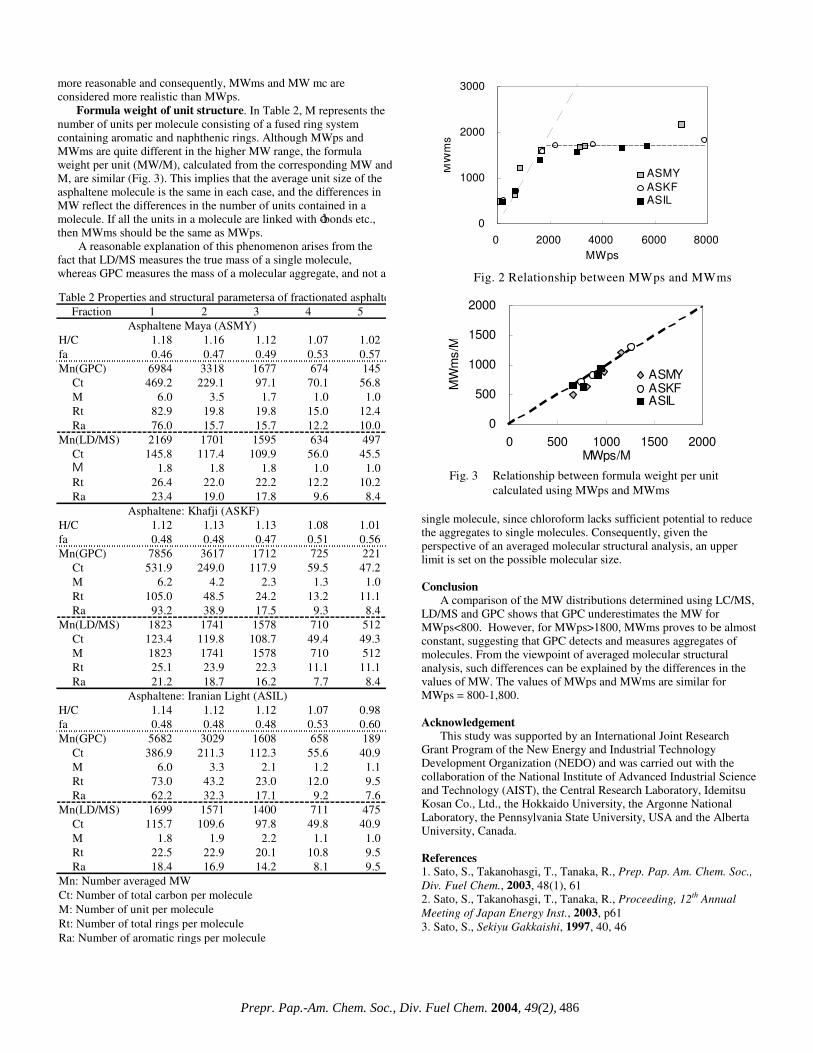
The van Krevelen diagrams, constructed from the assigned elemental compositions of peaks corresponding to nitrogen containing compounds in the mass spectra, are displayed in Figures 4 and 5. For nitrogen containing compounds, there is a slight shift in the most abundant species to those with lower H/C ratios as biodegradation proceeds, suggesting that N-containing compounds with more condensed ring type structures are more resistant to biodegradation. A more complete picture, including all classes, types and carbon number distributions will be presented.
Non degraded
N/C ratio0.00 0.05 0.10 0.15 0.20
H/C
ratio
0.8
1.0
1.2
1.4
1.6
1.8
2.0
2.2
Non degraded
O/C ratio0.00 0.05 0.10 0.15 0.20
H/C
ratio
0.8
1.0
1.2
1.4
1.6
1.8
2.0
2.2
A B C
1
6
234
DBE
Figure 4. Van Krevelen diagram of N-containing compounds in a non-degraded oil sample.
Very severely degraded
N/C ratio0.00 0.05 0.10 0.15 0.20
H/C
ratio
0.8
1.0
1.2
1.4
1.6
1.8
2.0
2.2
Very Severely Degraded
O/C ratio0.00 0.05 0.10 0.15 0.20
H/C
ratio
0.8
1.0
1.2
1.4
1.6
1.8
2.0
2.2
1
A B C
6
DBE 234
Figure 5. Van Krevelen diagram of N-containing compounds in a very severely degraded oil sample. Acknowledgments
The authors thank Kuangnan Qian for providing the series of biodegraded oil samples and for his many helpful discussions. This work was supported by ExxonMobil Research and Engineering Co., NSF CHE-99-09502, Florida State University, and the National High Magnetic Field Laboratory in Tallahassee, FL. References 1. Qian, K; Robbins, W. K.; Hughey, C. A.; Cooper, H. J.; Rodgers, R. P.; Marshall, A. G., Energy and Fuels, 2001, 1505-1511 2. Hsu, C. S.; Qian, K.; Chen, Y. C., Analytica Chimica Acta, 1992, 79-89.
COMPARISON OF THE AVERAGE MOLECULAR WEIGHTS OF HEAVY HYDROCARBONS
DETERMINED USING GPC, LD/MS, AND LC/MS
Shinya Sato and Toshimasa Takanohashi
Institute for Energy Utilization National Institute of Advanced Industrial Science and Technology
16-1 Onogawa, Tsukuba, Ibaraki 305-8569, JAPAN
Ryuzo Tanaka
Central Research Laboratories Idemitsu Kosan, Co.,Ltd
1280, Kamiizumi, Sodegaura 299-0293, JAPAN Introduction
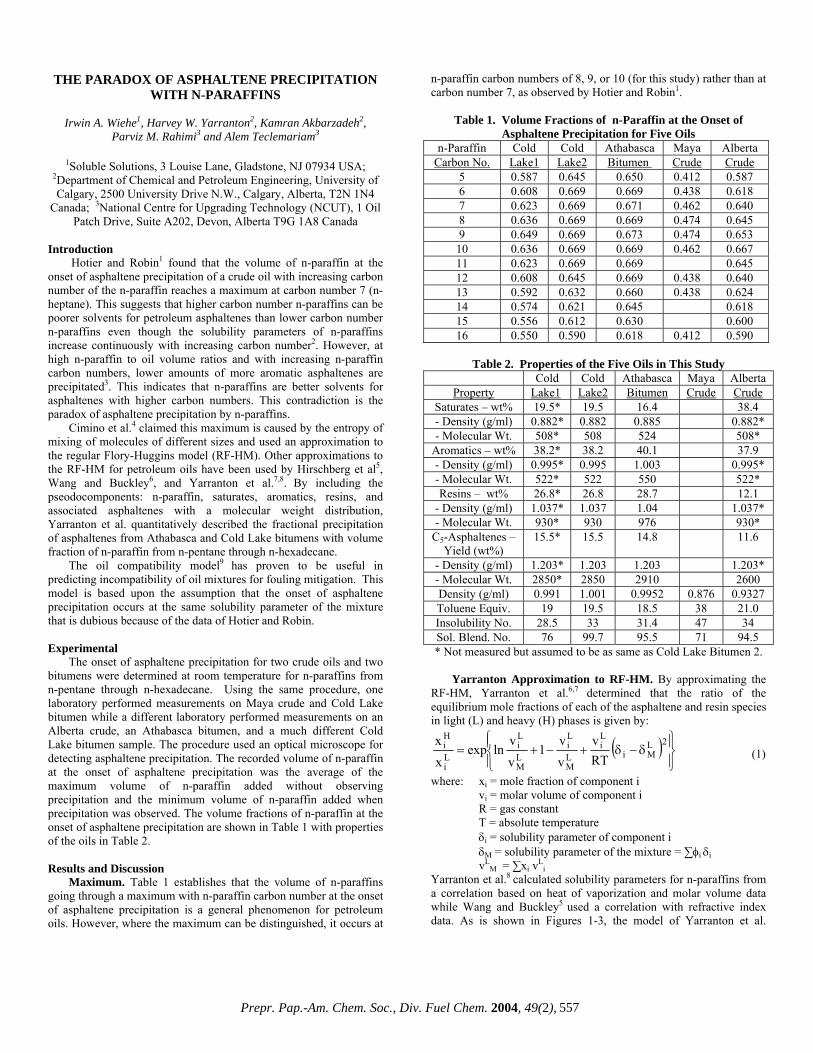
Although the molecular weight (MW) is the most basic physical parameter used to characterize heavy hydrocarbons such as asphaltene, no standard method for determining MW has been agreed on. For example, gel permeation chromatography (GPC) is widely used to determine MW, but the value it gives is relative to a polystyrene standard (MWps) and is not regarded as the true MW. Further, asphaltene is considered to form aggregates via the formation of noncovalent bonds, such as ð-ð intermolecular interactions and hydrogen bonds. It has not been established whether MWps represents the MW of the aggregates or the true MW. By contrast, the MW determined using soft-ionization mass spectroscopy (MWms), such as laser desorption mass spectrometry (LD/MS), is believed to provide a value that more truly represents the MW distribution than does GPC irrespective of molecular aggregation, provided the conditions for ionisation are optimised.
Previously, we used preparative GPC to determine the properties of asphaltene separated into five fractions. We found that the H/C values increased with the average MWps, up to MWps = 1600-1700. At higher MWps, the ratio became constant1). We also have used GPC/MS analyses to demonstrate that at MWps < 800, MWps is smaller than MWms2).
In this report we use the results of LC/MS and LD/MS analyses to examine the correlation between the average MWps and MWms over the entire MW range, including low MWs, from the perspective of an averaged molecular structural analysis. Experimental
Samples. The samples used in this study were asphaltenes recovered from the vacuum residue distillation of Iranian Light, Khafji, and Maya crude oils (ASIL, ASKF, and ASMY, respectively) (Table 1). Each sample was separated into five fractions using a GPC (JASCO, 980 Gulliver Series) equipped with a preparative column (Shodex KF2003, exclusion limit 70000), and using chloroform as the eluent1).
Molecular weight. GPC analyses were carried out using a GPC equipped with two series of analytical columns (Shodex K403HQ, exclusion limit 70000) and chloroform as the eluent. LC/MS analyses were carried out using a LC/MS system (Agilent SL-1100) fitted with an ultraviolet (UV) detector and an atmospheric pressure photo ionisation (APPI) mass spectrometer. The original asphaltenes were analysed and the average MWs determined every 0.5 minutes using the APPI detector. LD/MS analysis was carried out using a Voyager-DE STR mass spectrometer (Applied Biosystems Co. Ltd.) at the Central Research Laboratory, Idemitsu Kosan Co., Ltd. The laser irradiation strength was altered within the range 1.45 to 8.57 mJ/pulse in order to select the optimal conditions to minimise
any increase in the higher MW range and fragmentation within the lower MW range. Results and Discussion
Molecular weight determined using LC/MS and GPC. All samples showed MWps distributions of up to 20,000, but the MW values determined using LC/MS extended only to 1,500. The LC/MS system lacks any practicable sensitivity at MW values above 1,500. For values around 1,000, the average MW determined by LC/MS (MWmc) was similar to the MWps values, but the differences between them increased as MWps decreased (Fig. 1). For example, for a MWmc of 430, the corresponding MWps was only 150. This means that values of MWps tend to be underestimated compared with the MW determined using LC/MS. No significant difference in this relationship was found among the different asphaltenes and the results suggest that a more reasonable picture of the MW distribution as determined by GPC will become possible only when a new calibration curve has been determined to allow the existing gap to be bridged.
Molecular weight using LD/MS and GPC. The MWms determined using LD/MS highlight three patterns among the MWps results (Fig.2) with no differences in behavior found for the three asphaltenes used. The three patterns show: (1) MWms is larger than MWps for MWps<800, (2) MWms is similar to MWps for MWps = 800-1,600, (3) MWms is almost constant at MWps>1,600. From these results, the average MWs of asphaltene are considered to be no more than 2,000. Hence, it is reasonable to assume that higher values of MW determined by GPC represent the MW of molecular aggregates.
From the properties of the different asphaltene fractions, the structural parameters were estimated using the average molecular structural analysis technique we have developed3). Selected structural parameters are summarized in Table 2, along with the properties.
It is clear that for fraction 1, MWps is about 3-4 times larger than MWms. In fraction 5, MWps is less than 250 and its small value should not arise from asphaltenes. In this instance MWms appears
Table 1 Properties of asphaltenesSource of VR Maya (MY) Khafji (KF) Iranian Light (IL)Elemental, wt %
more reasonable and consequently, MWms and MW mc are considered more realistic than MWps.
Formula weight of unit structure. In Table 2, M represents the number of units per molecule consisting of a fused ring system containing aromatic and naphthenic rings. Although MWps and MWms are quite different in the higher MW range, the formula weight per unit (MW/M), calculated from the corresponding MW and M, are similar (Fig. 3). This implies that the average unit size of the asphaltene molecule is the same in each case, and the differences in MW reflect the differences in the number of units contained in a molecule. If all the units in a molecule are linked with ó-bonds etc., then MWms should be the same as MWps.
A reasonable explanation of this phenomenon arises from the fact that LD/MS measures the true mass of a single molecule, whereas GPC measures the mass of a molecular aggregate, and not a
single molecule, since chloroform lacks sufficient potential to reduce the aggregates to single molecules. Consequently, given the perspective of an averaged molecular structural analysis, an upper limit is set on the possible molecular size. Conclusion
A comparison of the MW distributions determined using LC/MS, LD/MS and GPC shows that GPC underestimates the MW for MWps<800. However, for MWps>1800, MWms proves to be almost constant, suggesting that GPC detects and measures aggregates of molecules. From the viewpoint of averaged molecular structural analysis, such differences can be explained by the differences in the values of MW. The values of MWps and MWms are similar for MWps = 800-1,800. Acknowledgement
This study was supported by an International Joint Research Grant Program of the New Energy and Industrial Technology Development Organization (NEDO) and was carried out with the collaboration of the National Institute of Advanced Industrial Science and Technology (AIST), the Central Research Laboratory, Idemitsu Kosan Co., Ltd., the Hokkaido University, the Argonne National Laboratory, the Pennsylvania State University, USA and the Alberta University, Canada. References 1. Sato, S., Takanohasgi, T., Tanaka, R., Prep. Pap. Am. Chem. Soc., Div. Fuel Chem., 2003, 48(1), 61 2. Sato, S., Takanohasgi, T., Tanaka, R., Proceeding, 12th Annual Meeting of Japan Energy Inst., 2003, p61 3. Sato, S., Sekiyu Gakkaishi, 1997, 40, 46
MWps = MWms
0
1000
2000
3000
0 2000 4000 6000 8000MWps
MW
ms
ASMYASKFASIL
Fig. 2 Relationship between MWps and MWms
0
500
1000
1500
2000
0 500 1000 1500 2000MWps/M
MW
ms/
M
ASMYASKFASIL
Relationship between formula weight per unit calculated using MWps and MWms
Fig. 3
Table 2 Properties and structural parametersa of fractionated asphaltenesFraction 1 2 3 4 5
Mn: Number averaged MWCt: Number of total carbon per moleculeM: Number of unit per moleculeRt: Number of total rings per moleculeRa: Number of aromatic rings per molecule
MULTI-DIMENSIONAL HPLC DETERMINATION OF AROMATIC CORE CONTENT, MASS
COMPOSTION AND ALIPHATIC SIDE CHAIN DISTRIUBTIONS IN HYDROCARBON FRACTIONS
OF HEAVY DISTILLATES
Ashraf Z Khan, Intertek Caleb Brett
Philadelphia Regional Laboratory 327 Erickson Ave, Essington, PA 19029
Telephone: 610 521 1725; [email protected] Introduction In recent years there has been growing interest in refining and asphalt industries for quantitative measurements of hydrocarbon compositions in heavy distillates and solid asphalt materials. The heavy distillates are deep boiling fractions of crude oil separated by multiple refining processes such as atmospheric and vacuum distillations and usually comprise of complex molecules with initial boiling points (IBPs) in the range of 650 - 1300º F. These liquid distillates are widely used as feedstocks for refinery processes including fluid catalytic cracking (FCC), hydrocaracking, dewaxing, coking, lube extraction et al. This is because of their specific values and importance, as well as the refining industries’ interests in cutting deep into crude oil barrels [1]. Whatever the means to upgrading the “bottom of the barrel” may be, improved characterization methods for compositional analyses are necessary for process design, operational control and unit optimization. Modern analytical techniques can offer much in this direction. In spite of the necessity of reliable and affordable techniques, there are only a handful of modern techniques, most notably a specially designed high performance liquid chromatography (HPLC), that can effectively examine heavy distillates [2,3]. Characterization of heavy distillates by conventional techniques like preparative scale liquid or clay-gel chromatography suffers from tedious steps, poor separation capabilities and low repeatability [3]. Although, historically, high resolution mass spectrometry (HRMS) has been an excellent technique, particularly for building refinery process models, it is quite complex, time-consuming and expensive thereby making it difficult for routine analyses [2,4]. Moreover, HRMS involves multiple steps like, first, separation of saturates, aromatics and polar fractions by a preparative HPLC followed by a field ionization mass spectrometry (FIMS) determination of the saturates and a low energy HRMS determination of the aromatics and polars. As a result it takes many hours to analyze a sample. Attempts have been made to update older HRMS methods for use with modern quadrupole mass spectrometers, but it still involves multiple steps for sample preparation and isolation [4]. In this paper attempts have been made to show that a multi-dimensional HPLC, originally pioneered by Robbins and others [2], comprising two detectors and normal phase columns and operating under isocratic and gradient modes offers a number of advantages that makes it an attractive tool for heavy distillate analyses and that no other modern technique can offer. Experimental Instrumentation. The multi-dimensional HPLC system, obtained commercially from AC Analytical Controls (Rotterdam, the Netherlands), is based on an HP 1100 unit (Hewlett-Packard, Palo Alto, California) with a module from Alltech (Des Plaines, Illinois). It is operated by a 2D LC Chemstation software with an
additional AC software. The system comprises a quaternary pump for isocratic and gradient flows, a vacuum degasser unit for extracting any dissolved air from the solvents, an automatic liquid sampler for sample injection and other accessories. Two normal phase HPLC columns are mounted in series in a thermostated column compartment on separate switching valves (Rheodyne, Rohnert Park, California) that allows a forward flow of solvent to be directed through both or either of the columns independently. An HP photo diode array detector (DAD) is used for determining the aromaticity (% Ca) and an Alltech 500 evaporative light scattering detector (ELSD) for the mass compositions. The DAD spectra are collected over a range of 200 – 430 nm (reference 550 nm) for a maximum coverage of the aromatic π-π absorption [2,3]. A specially designed 1-mm quartz flow cell is used to keep the sensitivities of both the detectors within the working range. The ELSD spectra are obtained using a laser light (650 nm) refractive scattering produced by the sample particles with a nitrogen nebulizer. A dual channel HP 35900E serves as an analog-to-digital interface for the raw ELSD signal, and communicates across the HPIB (IEEE-488) cables. A preparatory HPLC comprising a 2” diameter silica column and a pre-column with a refractive index detection to monitor cut points was used for comparison of mass. A 500 MHz Varian NMR in CDCl3 with a relaxation agent (TEMPO) was used to record 13C NMR spectra to compare aromaticity. Separation. The hydrocarbon group-type separation is carried out using two normal phase columns: a propylaminocyano (PAC) column (Whatman, Clifton, NJ) for separation of saturates and mono-aromatics and a dinitroaminopropyl (DNAP) column (ES Industries, Berlin, NJ) for separation of di-, tri-, tetra- and polar (> 5+ ring plus N- and O- functionalities) aromatics. The starting cut points are based on hexadecane (saturates), nonadecylbenzene (1-ring), naphthalene (2-ring), dibenzothiophene (3-ring) and pyrene (4-ring). The valve switching time is determined using a dodecahydrotriphenylene (a 1-ring with a retention in the 2-ring region) solution in n-hexane. The column thermostat temperature is kept at 85ºF. Calibration. Nonadecylbenzene (1-ring) dissolved in n-hexane is used as a calibration standard with fine tunings done by a certified ‘super’ heavy distillate (IBP 716ºF) containing no asphaltenes. The calibration procedure is similar to those described [2,3,5]. The DAD response factors for aromaticity are based on the average values determined from the 200-430 nm spectra over 80 model compounds dissolved in n-hexane [2]. The DAD is programmed to measure the absorbance at 210 and 262 nm. The spectra are converted to an energy (meV) basis for each wavelength and the absorbance are integrated over the range 204-430 nm. Because these integrated absorption energies (“oscillator strength”) include all transitions between a ground state molecule and its excited states, they count the aromatic carbons [2]. The ELSD is a non-linear detector and does not obey Beer’s law, unlike the DAD. Its response (mV) is calibrated using 15 solutions of nonadecylbenzene in n-hexane in the range 0.05 – 12 mg/ml. These 15 solutions are eluted through both the columns and detected by the DAD at 210 and 262 nm followed by the ELSD. The instantaneous concentration (µg/ml) at the chromatographic peak maximum (a pseudo-steady state point) is calculated by applying Beer’s law to the absorbance at 210 and 262 nm [2]. Since the ELSD calibration data over the wide concentration range could not be fitted with a single function, the standard levels are divided into two ranges (standards 1 -8 for the low range and 8 – 15 for the high range). The best fit for both sets are plotted in one graph and a ‘cross-over point’ (the point in the
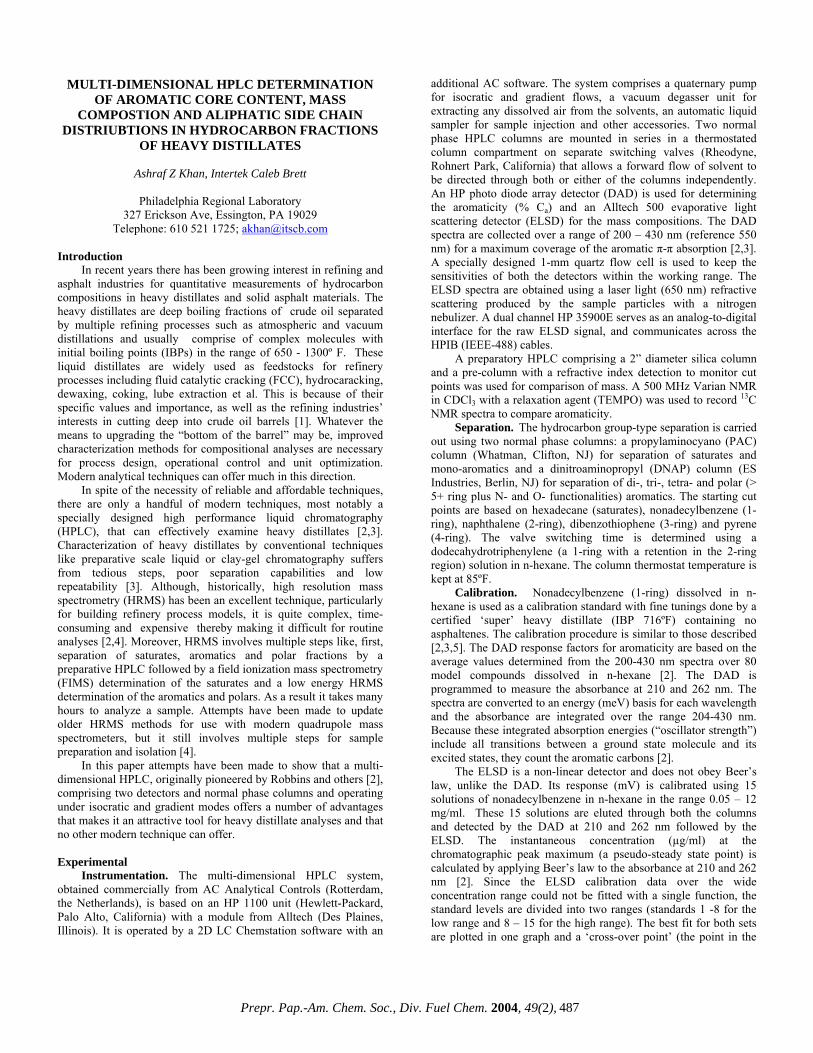
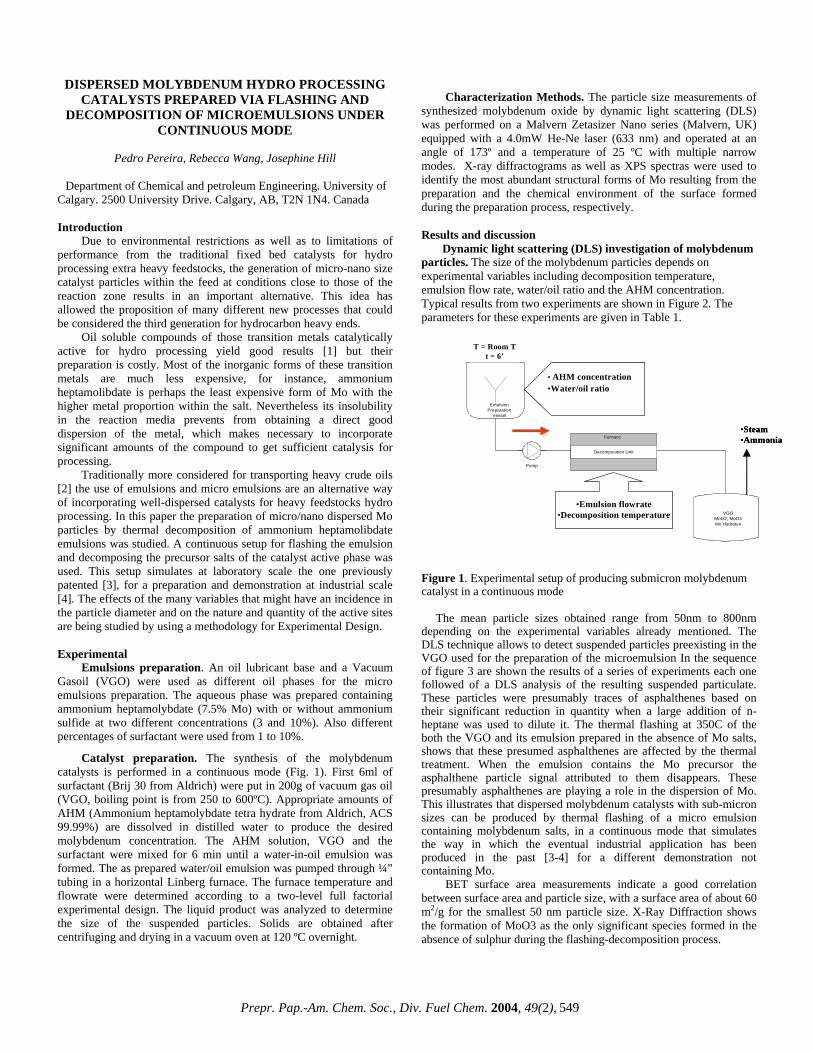
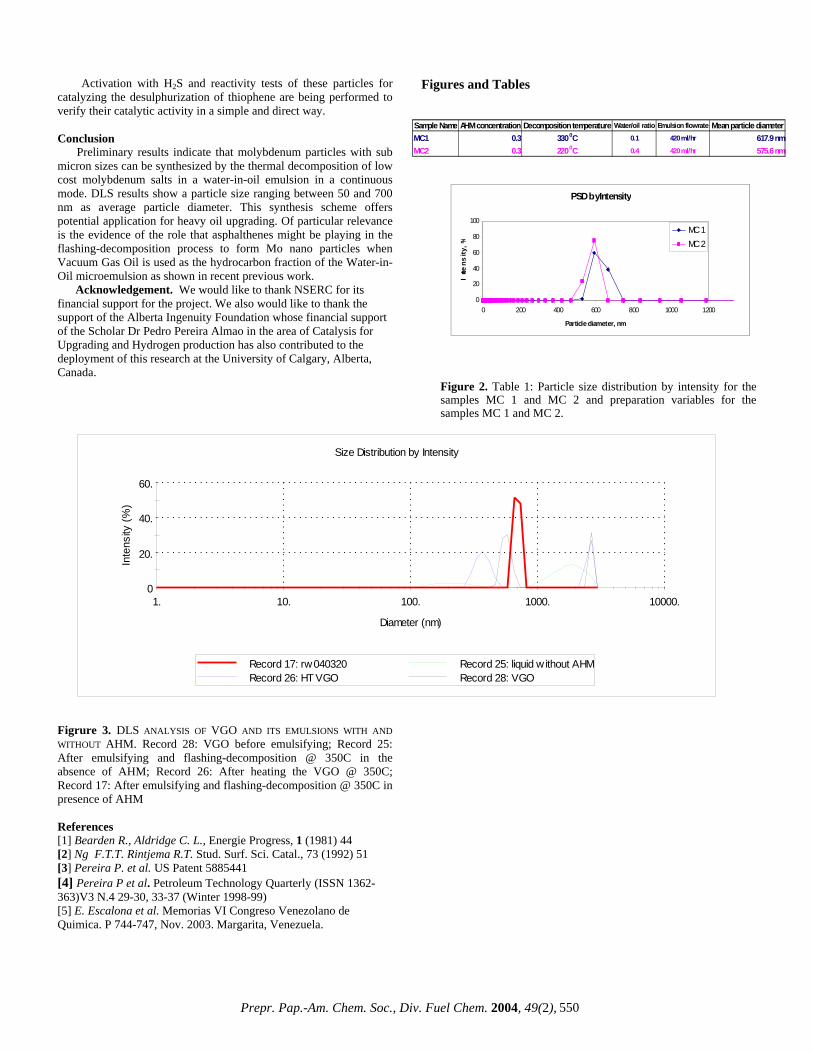
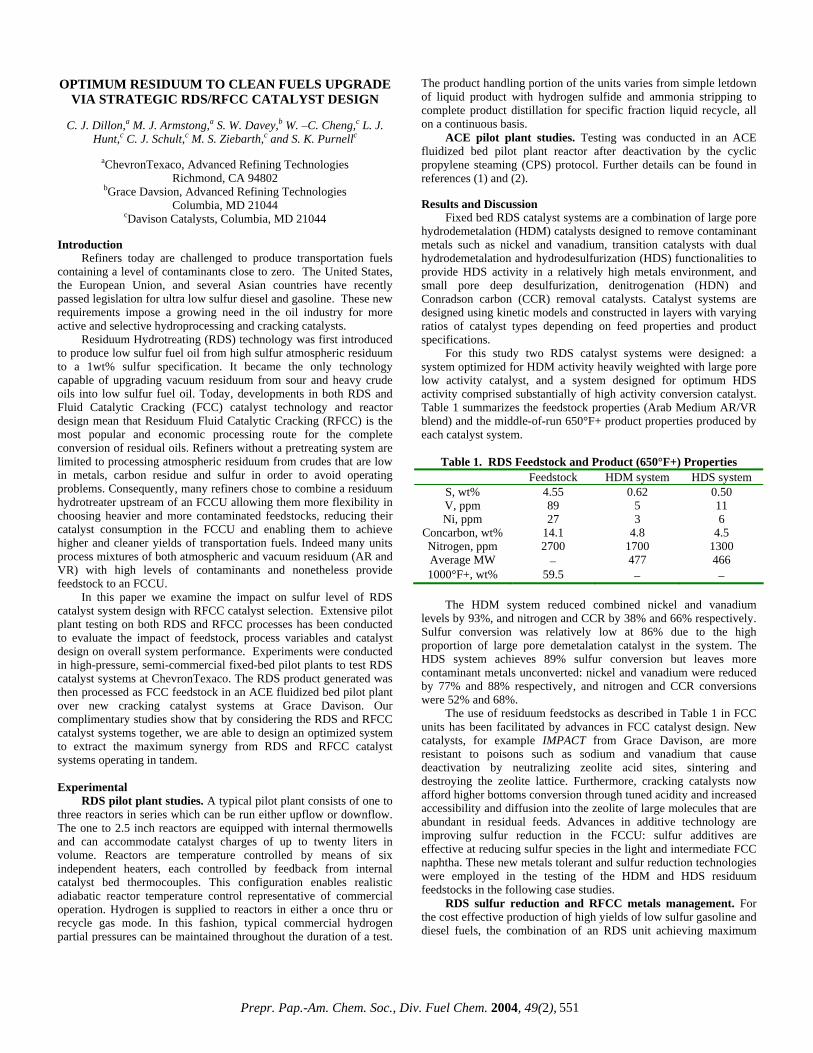
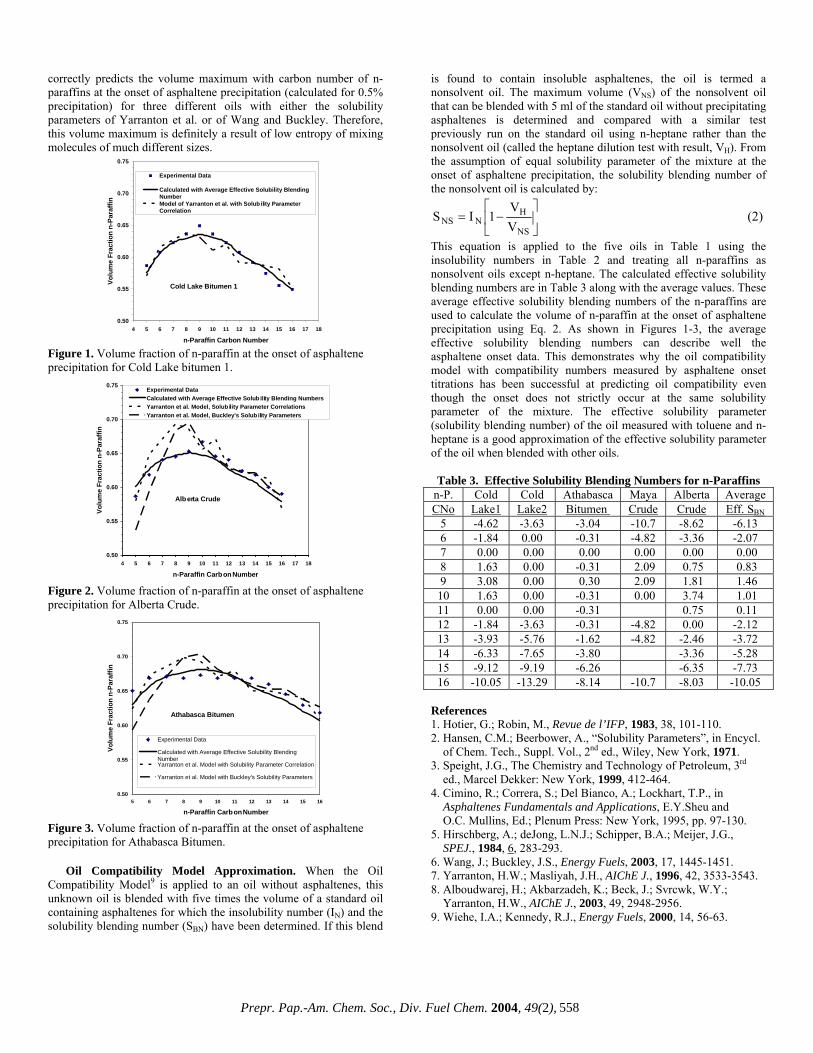
graph where both fits are closest to each other or actually cross each other) is determined. The calibration curve as established with the calibration procedure is ‘scaled’ to get a correct calculation of the amount of standard injected. This is done by calculating the Injection and Flow Factors from a nonadecylbenzene standard of 2.000 mg/ml. The Injection Factor and the Flow Factor are related to the DAD and the ELSD responses respectively. Solvents and Sample Preparation. Three HPLC grade solvents: n-hexane, methylene chloride and iso-propanol (J.T.Baker, Phillipsburgh, NJ) are used as the mobile phase and cyclohexane as the dissolving solvent. Always n-hexane and methylene chloride are treated with activated molecular sieve 4A (J.T.Baker). The sample preparation procedure is simple and involves only one step. A 300 mg of sample is dissolved in a scintillation vial with cyclohexane (10 ml) and sonicated or mildly heated up at 140ºF for 5 min. An aliquot of 1 ml is transferred to a 2 ml vial, from where 10 µl is injected into the system by an autosampler. Representative samples of refinery process streams are used to illustrate the potential of the technique. These include vacuum gas oils (VGO, 650 to 1050ºF), heavy vacuum gas oils (HVGO, 800 to 1050ºF), vacuum resides (VR, 1050ºF and above) and deep distillates obtained by short-path distillation (DISTACT, 1050 to 1300ºF). Data Acquisition. The two detectors acquire data at 3 s intervals starting after a dead volume delay (2.1 min) and continuing until the end of the run. The run time is 35 min followed by a regeneration of the columns for 40 min. Each set of samples is initiated with two blanks (cyclohexane) to ensure that each analysis starts from the same condition. This is followed by two quality control standards (‘super’ heavy distillates) to establish acceptable performance both before and after running the unknown samples. At the end of each run the mass composition, aromatic core content and aliphatic side chain distributions plus the total aromatic core content and mass recovery (in total 20 key parameters) are calculated by the software. The data files can be easily converted to a PDF format for reporting. Results and Discussion Chromatographic Profiles. Due to the complex nature of heavy distillates, it takes real efforts to separate and quantitate each of the six key molecular fractions precisely. A proper optimization of the entire system facilitates this separation . After the raw data have been acquired, those are converted into chromatograms, which are automatically plotted - one for the aromaticity in meV and the other for the mass in mV. The DAD and ELSD chromatograms of a heavy distillate standard is illustrated in Figure 1. The size and shape of the peaks vary from each other with the saturates eluting first and the polars last. The cut points are marked by 5 vertical lines. The saturates show a sharp and tall ELSD peak, no DAD response is to be expected because of its non-aromatic nature. The 1-ring DAD profile shows two distinct peak maxima, presumably, due to the presence of multiple absorption chromophores in the specially refined ‘super’ heavy distillate standard. Such double peak maxima are absent in any other fractions or in any refinery sample routinely done in this laboratory and, to the best of our knowledge, have not been reported before. The valve-switching time and solvent gradient scheme developed to maximize the resolution of the six groups remain unchanged for subsequent runs. As evident (Figure 1), most of the peaks, particularly the DAD, are asymmetric with some tailing, which is
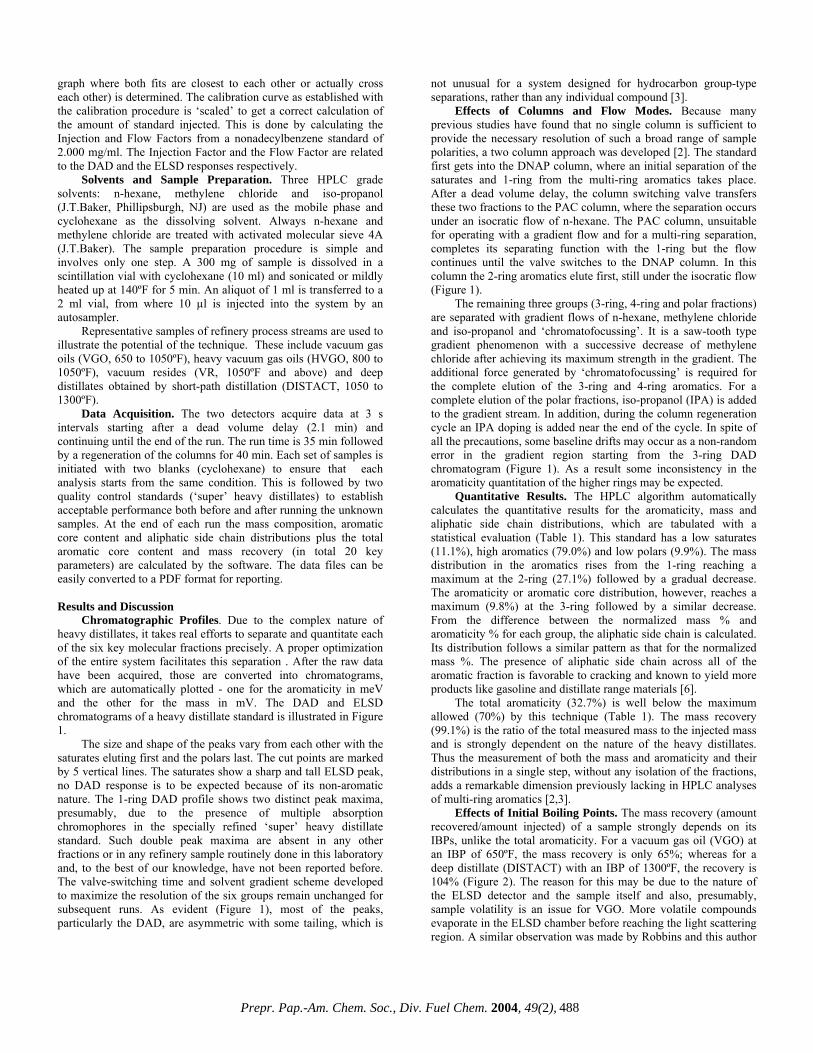
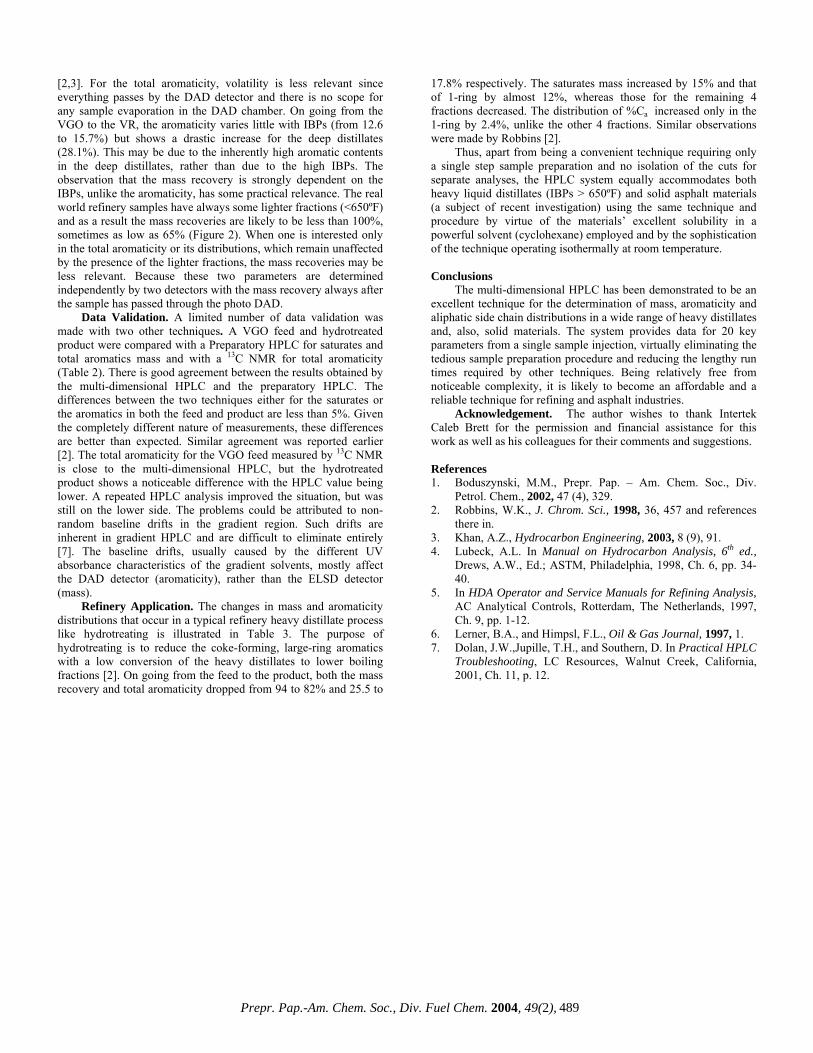
not unusual for a system designed for hydrocarbon group-type separations, rather than any individual compound [3]. Effects of Columns and Flow Modes. Because many previous studies have found that no single column is sufficient to provide the necessary resolution of such a broad range of sample polarities, a two column approach was developed [2]. The standard first gets into the DNAP column, where an initial separation of the saturates and 1-ring from the multi-ring aromatics takes place. After a dead volume delay, the column switching valve transfers these two fractions to the PAC column, where the separation occurs under an isocratic flow of n-hexane. The PAC column, unsuitable for operating with a gradient flow and for a multi-ring separation, completes its separating function with the 1-ring but the flow continues until the valve switches to the DNAP column. In this column the 2-ring aromatics elute first, still under the isocratic flow (Figure 1). The remaining three groups (3-ring, 4-ring and polar fractions) are separated with gradient flows of n-hexane, methylene chloride and iso-propanol and ‘chromatofocussing’. It is a saw-tooth type gradient phenomenon with a successive decrease of methylene chloride after achieving its maximum strength in the gradient. The additional force generated by ‘chromatofocussing’ is required for the complete elution of the 3-ring and 4-ring aromatics. For a complete elution of the polar fractions, iso-propanol (IPA) is added to the gradient stream. In addition, during the column regeneration cycle an IPA doping is added near the end of the cycle. In spite of all the precautions, some baseline drifts may occur as a non-random error in the gradient region starting from the 3-ring DAD chromatogram (Figure 1). As a result some inconsistency in the aromaticity quantitation of the higher rings may be expected. Quantitative Results. The HPLC algorithm automatically calculates the quantitative results for the aromaticity, mass and aliphatic side chain distributions, which are tabulated with a statistical evaluation (Table 1). This standard has a low saturates (11.1%), high aromatics (79.0%) and low polars (9.9%). The mass distribution in the aromatics rises from the 1-ring reaching a maximum at the 2-ring (27.1%) followed by a gradual decrease. The aromaticity or aromatic core distribution, however, reaches a maximum (9.8%) at the 3-ring followed by a similar decrease. From the difference between the normalized mass % and aromaticity % for each group, the aliphatic side chain is calculated. Its distribution follows a similar pattern as that for the normalized mass %. The presence of aliphatic side chain across all of the aromatic fraction is favorable to cracking and known to yield more products like gasoline and distillate range materials [6]. The total aromaticity (32.7%) is well below the maximum allowed (70%) by this technique (Table 1). The mass recovery (99.1%) is the ratio of the total measured mass to the injected mass and is strongly dependent on the nature of the heavy distillates. Thus the measurement of both the mass and aromaticity and their distributions in a single step, without any isolation of the fractions, adds a remarkable dimension previously lacking in HPLC analyses of multi-ring aromatics [2,3]. Effects of Initial Boiling Points. The mass recovery (amount recovered/amount injected) of a sample strongly depends on its IBPs, unlike the total aromaticity. For a vacuum gas oil (VGO) at an IBP of 650ºF, the mass recovery is only 65%; whereas for a deep distillate (DISTACT) with an IBP of 1300ºF, the recovery is 104% (Figure 2). The reason for this may be due to the nature of the ELSD detector and the sample itself and also, presumably, sample volatility is an issue for VGO. More volatile compounds evaporate in the ELSD chamber before reaching the light scattering region. A similar observation was made by Robbins and this author
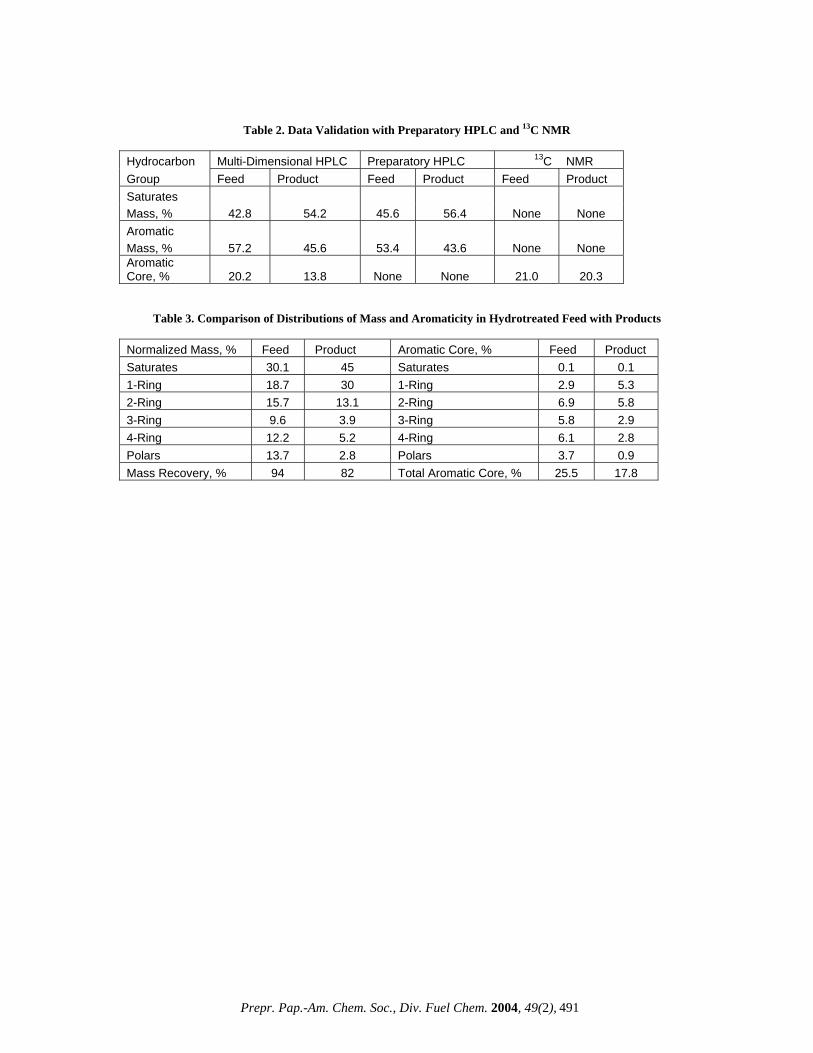
[2,3]. For the total aromaticity, volatility is less relevant since everything passes by the DAD detector and there is no scope for any sample evaporation in the DAD chamber. On going from the VGO to the VR, the aromaticity varies little with IBPs (from 12.6 to 15.7%) but shows a drastic increase for the deep distillates (28.1%). This may be due to the inherently high aromatic contents in the deep distillates, rather than due to the high IBPs. The observation that the mass recovery is strongly dependent on the IBPs, unlike the aromaticity, has some practical relevance. The real world refinery samples have always some lighter fractions (<650ºF) and as a result the mass recoveries are likely to be less than 100%, sometimes as low as 65% (Figure 2). When one is interested only in the total aromaticity or its distributions, which remain unaffected by the presence of the lighter fractions, the mass recoveries may be less relevant. Because these two parameters are determined independently by two detectors with the mass recovery always after the sample has passed through the photo DAD. Data Validation. A limited number of data validation was made with two other techniques. A VGO feed and hydrotreated product were compared with a Preparatory HPLC for saturates and total aromatics mass and with a 13C NMR for total aromaticity (Table 2). There is good agreement between the results obtained by the multi-dimensional HPLC and the preparatory HPLC. The differences between the two techniques either for the saturates or the aromatics in both the feed and product are less than 5%. Given the completely different nature of measurements, these differences are better than expected. Similar agreement was reported earlier [2]. The total aromaticity for the VGO feed measured by 13C NMR is close to the multi-dimensional HPLC, but the hydrotreated product shows a noticeable difference with the HPLC value being lower. A repeated HPLC analysis improved the situation, but was still on the lower side. The problems could be attributed to non-random baseline drifts in the gradient region. Such drifts are inherent in gradient HPLC and are difficult to eliminate entirely [7]. The baseline drifts, usually caused by the different UV absorbance characteristics of the gradient solvents, mostly affect the DAD detector (aromaticity), rather than the ELSD detector (mass). Refinery Application. The changes in mass and aromaticity distributions that occur in a typical refinery heavy distillate process like hydrotreating is illustrated in Table 3. The purpose of hydrotreating is to reduce the coke-forming, large-ring aromatics with a low conversion of the heavy distillates to lower boiling fractions [2]. On going from the feed to the product, both the mass recovery and total aromaticity dropped from 94 to 82% and 25.5 to
17.8% respectively. The saturates mass increased by 15% and that of 1-ring by almost 12%, whereas those for the remaining 4 fractions decreased. The distribution of %Ca increased only in the 1-ring by 2.4%, unlike the other 4 fractions. Similar observations were made by Robbins [2]. Thus, apart from being a convenient technique requiring only a single step sample preparation and no isolation of the cuts for separate analyses, the HPLC system equally accommodates both heavy liquid distillates (IBPs > 650ºF) and solid asphalt materials (a subject of recent investigation) using the same technique and procedure by virtue of the materials’ excellent solubility in a powerful solvent (cyclohexane) employed and by the sophistication of the technique operating isothermally at room temperature. Conclusions The multi-dimensional HPLC has been demonstrated to be an excellent technique for the determination of mass, aromaticity and aliphatic side chain distributions in a wide range of heavy distillates and, also, solid materials. The system provides data for 20 key parameters from a single sample injection, virtually eliminating the tedious sample preparation procedure and reducing the lengthy run times required by other techniques. Being relatively free from noticeable complexity, it is likely to become an affordable and a reliable technique for refining and asphalt industries. Acknowledgement. The author wishes to thank Intertek Caleb Brett for the permission and financial assistance for this work as well as his colleagues for their comments and suggestions. References 1. Boduszynski, M.M., Prepr. Pap. – Am. Chem. Soc., Div.
Petrol. Chem., 2002, 47 (4), 329. 2. Robbins, W.K., J. Chrom. Sci., 1998, 36, 457 and references
there in. 3. Khan, A.Z., Hydrocarbon Engineering, 2003, 8 (9), 91. 4. Lubeck, A.L. In Manual on Hydrocarbon Analysis, 6th ed.,
Drews, A.W., Ed.; ASTM, Philadelphia, 1998, Ch. 6, pp. 34-40.
5. In HDA Operator and Service Manuals for Refining Analysis, AC Analytical Controls, Rotterdam, The Netherlands, 1997, Ch. 9, pp. 1-12.
6. Lerner, B.A., and Himpsl, F.L., Oil & Gas Journal, 1997, 1. 7. Dolan, J.W.,Jupille, T.H., and Southern, D. In Practical HPLC
Troubleshooting, LC Resources, Walnut Creek, California, 2001, Ch. 11, p. 12.
0 5 10 15 20 25 30 min Figure 1. Multi-dimensional chromatograms of a heavy distillate standard obtained by the DAD (thin/blue line in meV) and the ELSD (thick/red line in mV) detectors with the cut points marked by 5 vertical lines (green).
0
20
40
60
80
100
120
600 800 1000 1200 1400Initial Boiling Points (F)
percen
tage
Mass RecoveryTotal Aromaticity
Figure 2. Effects of Initial Boiling Points of Heavy Distillates on Mass Recovery and Total Aromaticity
Table 1. Quantitative Results for Mass, Aromaticit and Aliphatic Side Chain Distributions in a Heavy
Table 2. Data Validation with Preparatory HPLC and 13C NMR
Hy ocarbon Multi-Dimensional HPLC Preparatory HPLC 13C NMR drGroup Feed Product Feed Product Feed t ProducSaturates Mass, % 42.8 54.2 45.6 56.4 N e N e on onAromatic Mass, % 57.2 45.6 53.4 43.6 N e N e on onAromatic Core, % 20.2 13.8 None None 21.0 20.3
Table 3. Comparison of Distributions of Mass and Aromaticity in Hydrotreated Feed with Products
Introduction Visbreaking is an important part of petroleum refining as
it converts heavy oil fractions to more useful, lighter distillate fuels. Modelling this process has involved the pyrolysis of petroleum residua in mini- bombs 1. Usually, examination of these mechanisms is based on changes to the bulk compositions of the product generated from pyrolysis under different conditions. However, these are not necessarily sensitive to small changes in the extent of cracking. In this study, attention is focussed on discrete molecular transformations that occur in the maltene fraction. The transformations involve a suite of compounds more commonly known as biomarkers, which are routinely employed for upstream petroleum exploration purposes, and have been shown to be extremely sensitive and adaptable through a range of thermal regimes 2. It is anticipated that further development of the biological marker approach outlined here may be able to accurately detect the proximity to coke formation during visbreaking.
Experimental
Pyrolysis Approximately 2 g of feed was used for both anhydrous and hydrous pyrolysis experiments. Prior to anhydrous pyrolysis, the reactor was evacuated using a vacuum pump. For the hydrous pyrolysis experiments, the reactor was evacuated, then refilled with nitrogen. The reactor was placed in a temperature stabilised sand bath, where pyrolysis was allowed to run for 30 minutes, at temperatures of 420, 430 and 440oC. Once complete, the reactor was removed from the sand bath and submerged in dry ice to quench any further reactions. To sample the gas, a 100 ml syringe was attached to the reactor. When the syringe revealed no further expansion of gas, a sampling bag was attached, and the gas was injected, ready for immediate chromatographic analysis. The reactor was then carefully disassembled and the product was collected by extensive washing in toluene.
Asphaltene Precipitation The reactor washings were first evaporated so as to contain a minimum amount of solvent. To this, a 40 fold excess of n-heptane was added and mixed using a magnetic stirrer for 20 minutes. The solution was then added to centrifuge tubes and spun for 5 minutes at 2500 rpm. The n-heptane supernatant was then removed to a round bottom flask and the remaining asphaltenes were transported back to the beaker using toluene. This process was repeated a further 3 times. The maltenes were combined and evaporated.
Open Column Chromatography Separation of maltene fractions into compound classes were performed using a silica gel column. The aliphatic hydrocarbons were attained by elution with 50 ml n-hexane. The aromatic hydrocarbons and polar spices were obtained by elution with a 20% v/v mixture of CH2Cl2 (dichloromethane) in n-hexane (50 ml), and a 1:1 mixture of CH2Cl2 and CH3OH (methanol) (50 ml) respectively.
Gas Chromatography (GC) Analysis of the gas was performed on a Carlo Erba HRGC Mega Series gas chromatograph with a thermal conductivity detector attached, set at 200oC. Analysis of total aliphatic hydrocarbon distributions were performed on a Carlo Erba HRGC gas chromatograph with the flame ionisation detector (FID) attached. Gas
Chromatography – Mass Spectrometry (GC-MS) Analysis of hydrocarbon fractions were carried out on a Carlo Erba / Fisons Instruments 8000 Series (8035) gas chromatograph interfaced to a Fisons Instruments MD 800 mass spectrometer, electron voltage 70 eV with a source temperature of 280oC.
Solution State 1H NMR This was performed on maltene fractions dissolved in deuterated chloroform (CDCl3), using a Bruker 500 MHz spectrometer. Results and Discussion
Anhydrous Pyrolysis The composition of the petroleum residua before and after various conditions of pyrolysis are displayed in table 1. The series of anhydrous pyrolysis experiments (420 – 440oC) reveal the expected marked decrease in maltene content, which is accompanied by an increase in gas and asphaltene content. The changes in product composition are also reflected in the percentage of aromatic hydrogen as determined by 1H NMR, which increase systematically with increasing pyrolysis temperature. However, these changes occur over a small range of values and are therefore more susceptible to experimental and interpretive error. Further changes to the refinery residua with increasing pyrolysis temperature are also represented by certain aliphatic and aromatic hydrocarbon molecular transformations (table 2).
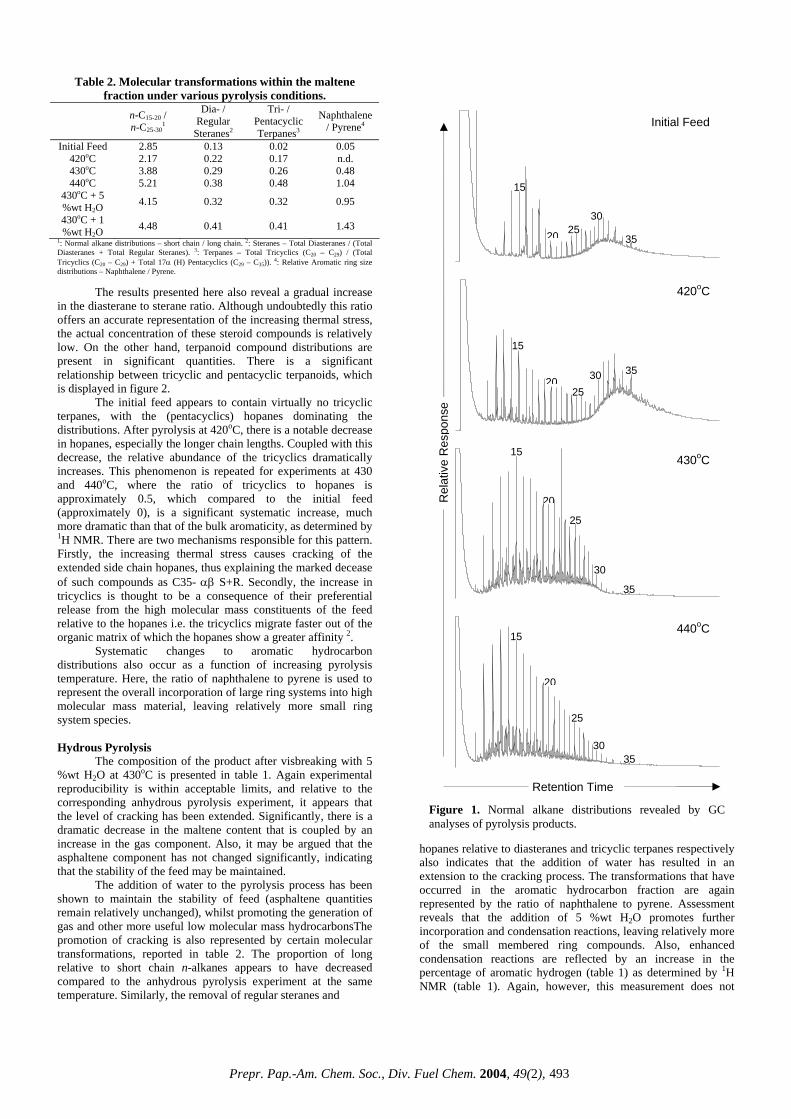
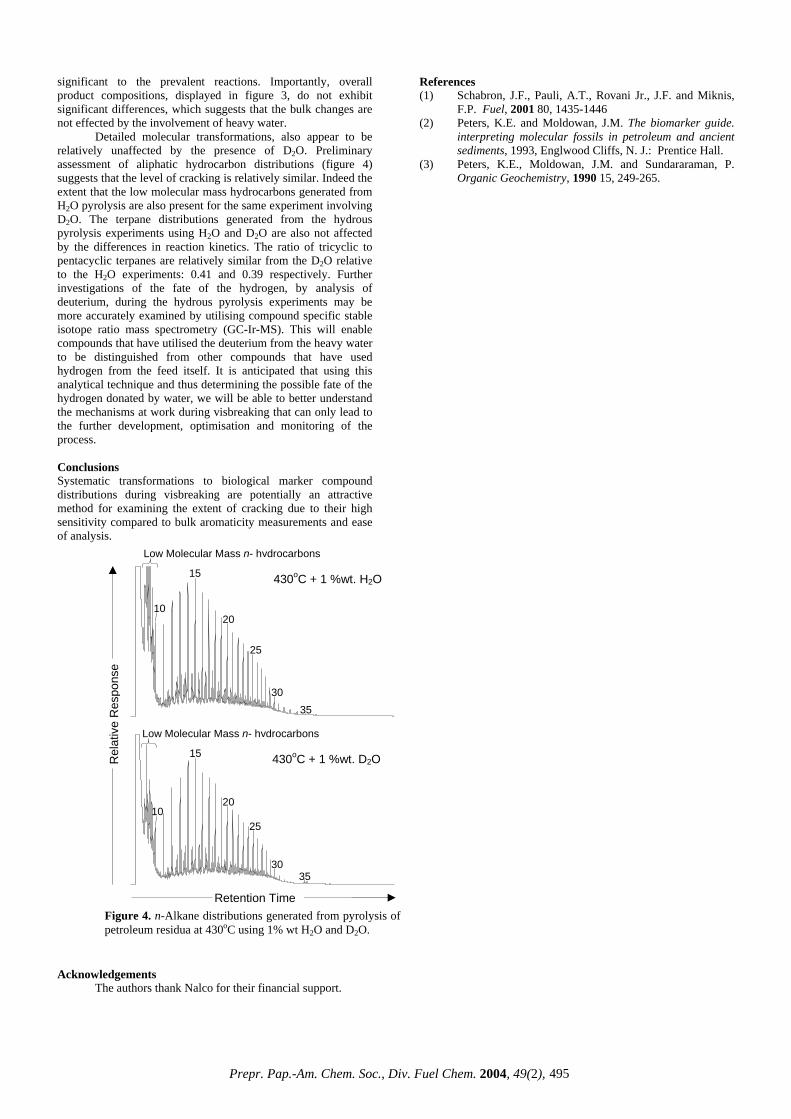
Normal alkane distributions (figure 1) are particularly useful due to their high relative abundance. Here, the ratio of short to long chain n-alkanes increases with pyrolysis temperature as more of the longer chained components are cracked.
Similar thermally induced molecular transformations occur for certain biological marker compounds present in the aliphatic hydrocarbon fractions in the maltenes. One such group of compounds are the steroids. It has been shown that rearranged steranes, or diasteranes, are much more thermodynamically stable than their regular sterane counterparts 2. Therefore, the diasterane to sterane ratio increases with increasing thermal stress, which has been shown in previous pyrolysis experiments3.
Table 1. Composition of petroleum residua after various
2.7 +/-0.12 0.6 +/-0.12 12.0 1: Mean of three experimental runs; error is standard deviation. 2: Mean of two experimental runs; error is standard deviation. 3: Toluene insolubles, including light ends lost during evaporation of maltene fractions. 4: Total Hydrocarbon Gas (HC). 5: Aromatic hydrogen within maltene fractions; error is +/-0.2
4.48 0.41 0.41 1.43 1: Normal alkane distributions – short chain / long chain. 2: Steranes – Total Diasteranes / (Total Diasteranes + Total Regular Steranes). 3: Terpanes – Total Tricyclics (C20 – C29) / (Total Tricyclics (C20 – C29) + Total 17α (H) Pentacyclics (C29 – C35)).
4: Relative Aromatic ring size distributions – Naphthalene / Pyrene.
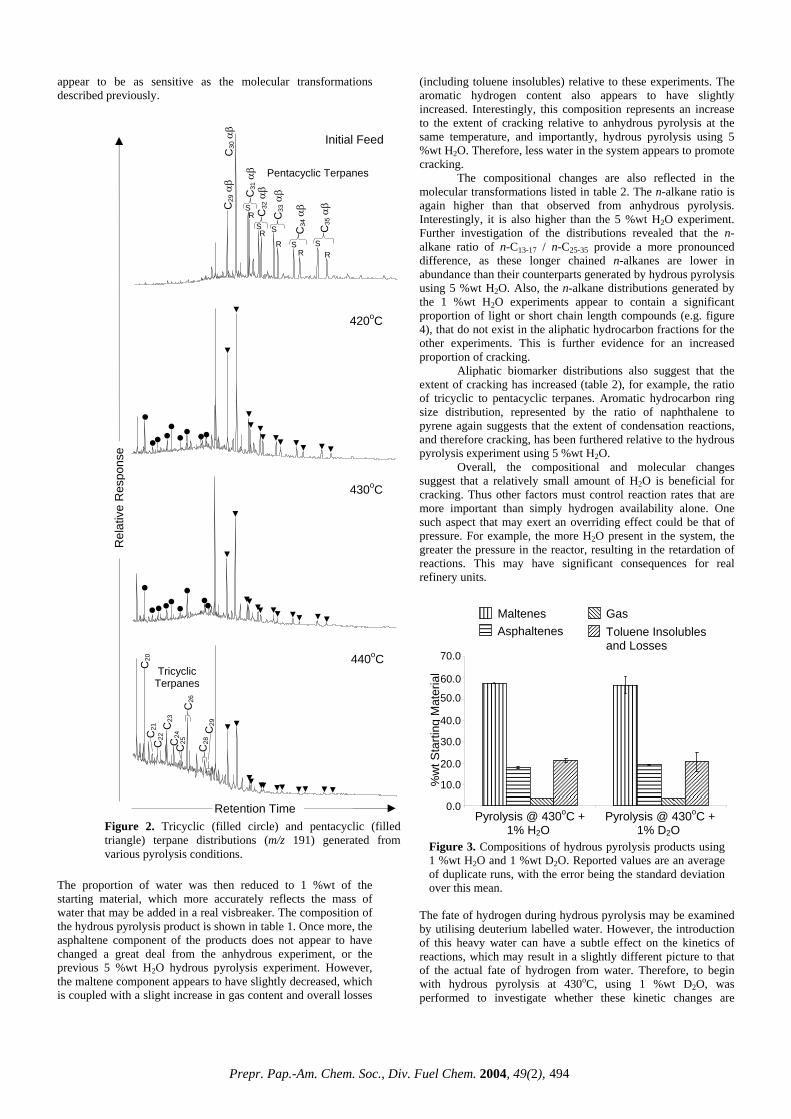
The results presented here also reveal a gradual increase in the diasterane to sterane ratio. Although undoubtedly this ratio offers an accurate representation of the increasing thermal stress, the actual concentration of these steroid compounds is relatively low. On the other hand, terpanoid compound distributions are present in significant quantities. There is a significant relationship between tricyclic and pentacyclic terpanoids, which is displayed in figure 2.
The initial feed appears to contain virtually no tricyclic terpanes, with the (pentacyclics) hopanes dominating the distributions. After pyrolysis at 420oC, there is a notable decrease in hopanes, especially the longer chain lengths. Coupled with this decrease, the relative abundance of the tricyclics dramatically increases. This phenomenon is repeated for experiments at 430 and 440oC, where the ratio of tricyclics to hopanes is approximately 0.5, which compared to the initial feed (approximately 0), is a significant systematic increase, much more dramatic than that of the bulk aromaticity, as determined by 1H NMR. There are two mechanisms responsible for this pattern. Firstly, the increasing thermal stress causes cracking of the extended side chain hopanes, thus explaining the marked decease of such compounds as C35- αβ S+R. Secondly, the increase in tricyclics is thought to be a consequence of their preferential release from the high molecular mass constituents of the feed relative to the hopanes i.e. the tricyclics migrate faster out of the organic matrix of which the hopanes show a greater affinity 2.
Systematic changes to aromatic hydrocarbon distributions also occur as a function of increasing pyrolysis temperature. Here, the ratio of naphthalene to pyrene is used to represent the overall incorporation of large ring systems into high molecular mass material, leaving relatively more small ring system species. Hydrous Pyrolysis
The composition of the product after visbreaking with 5 %wt H2O at 430oC is presented in table 1. Again experimental reproducibility is within acceptable limits, and relative to the corresponding anhydrous pyrolysis experiment, it appears that the level of cracking has been extended. Significantly, there is a dramatic decrease in the maltene content that is coupled by an increase in the gas component. Also, it may be argued that the asphaltene component has not changed significantly, indicating that the stability of the feed may be maintained.
The addition of water to the pyrolysis process has been shown to maintain the stability of feed (asphaltene quantities remain relatively unchanged), whilst promoting the generation of gas and other more useful low molecular mass hydrocarbonsThe promotion of cracking is also represented by certain molecular transformations, reported in table 2. The proportion of long relative to short chain n-alkanes appears to have decreased compared to the anhydrous pyrolysis experiment at the same temperature. Similarly, the removal of regular steranes and
hopanes relative to diasteranes and tricyclic terpanes respectively also indicates that the addition of water has resulted in an extension to the cracking process. The transformations that have occurred in the aromatic hydrocarbon fraction are again represented by the ratio of naphthalene to pyrene. Assessment reveals that the addition of 5 %wt H2O promotes further incorporation and condensation reactions, leaving relatively more of the small membered ring compounds. Also, enhanced condensation reactions are reflected by an increase in the percentage of aromatic hydrogen (table 1) as determined by 1H NMR (table 1). Again, however, this measurement does not
15
Figure 1. Normal alkane distributions revealed by GC analyses of pyrolysis products.
appear to be as sensitive as the molecular transformations described previously.
The proportion of water was then reduced to 1 %wt of the starting material, which more accurately reflects the mass of water that may be added in a real visbreaker. The composition of the hydrous pyrolysis product is shown in table 1. Once more, the asphaltene component of the products does not appear to have changed a great deal from the anhydrous experiment, or the previous 5 %wt H2O hydrous pyrolysis experiment. However, the maltene component appears to have slightly decreased, which is coupled with a slight increase in gas content and overall losses
(including toluene insolubles) relative to these experiments. The aromatic hydrogen content also appears to have slightly increased. Interestingly, this composition represents an increase to the extent of cracking relative to anhydrous pyrolysis at the same temperature, and importantly, hydrous pyrolysis using 5 %wt H2O. Therefore, less water in the system appears to promote cracking.
The compositional changes are also reflected in the molecular transformations listed in table 2. The n-alkane ratio is again higher than that observed from anhydrous pyrolysis. Interestingly, it is also higher than the 5 %wt H2O experiment. Further investigation of the distributions revealed that the n-alkane ratio of n-C13-17 / n-C25-35 provide a more pronounced difference, as these longer chained n-alkanes are lower in abundance than their counterparts generated by hydrous pyrolysis using 5 %wt H2O. Also, the n-alkane distributions generated by the 1 %wt H2O experiments appear to contain a significant proportion of light or short chain length compounds (e.g. figure 4), that do not exist in the aliphatic hydrocarbon fractions for the other experiments. This is further evidence for an increased proportion of cracking.
Aliphatic biomarker distributions also suggest that the extent of cracking has increased (table 2), for example, the ratio of tricyclic to pentacyclic terpanes. Aromatic hydrocarbon ring size distribution, represented by the ratio of naphthalene to pyrene again suggests that the extent of condensation reactions, and therefore cracking, has been furthered relative to the hydrous pyrolysis experiment using 5 %wt H2O.
Overall, the compositional and molecular changes suggest that a relatively small amount of H2O is beneficial for cracking. Thus other factors must control reaction rates that are more important than simply hydrogen availability alone. One such aspect that may exert an overriding effect could be that of pressure. For example, the more H2O present in the system, the greater the pressure in the reactor, resulting in the retardation of reactions. This may have significant consequences for real refinery units.
The fate of hydrogen during hydrous pyrolysis may be examined by utilising deuterium labelled water. However, the introduction of this heavy water can have a subtle effect on the kinetics of reactions, which may result in a slightly different picture to that of the actual fate of hydrogen from water. Therefore, to begin with hydrous pyrolysis at 430oC, using 1 %wt D2O, was performed to investigate whether these kinetic changes are
Initial Feed
C29
αβ
S S
S R
SR R
R
420oC
440oC C20
Rel
ativ
e R
espo
nse
Figure 2. Tricyclic (filled circle) and pentacyclic (filled triangle) terpane distributions (m/z 191) generated from various pyrolysis conditions.
Retention Time
430oC
C31
αβ
S R C
32 αβ
C33
αβ
C34
αβ
C35
αβ
C30
αβ
Pentacyclic Terpanes
C21
C22
C23
C24
C25
C26
C28
C29
Tricyclic Terpanes
MaltenesAsphaltenes Toluene Insolubles
and Losses
Gas
Figure 3. Compositions of hydrous pyrolysis products using 1 %wt H2O and 1 %wt D2O. Reported values are an average of duplicate runs, with the error being the standard deviation over this mean.
significant to the prevalent reactions. Importantly, overall product compositions, displayed in figure 3, do not exhibit significant differences, which suggests that the bulk changes are not effected by the involvement of heavy water.
Detailed molecular transformations, also appear to be relatively unaffected by the presence of D2O. Preliminary assessment of aliphatic hydrocarbon distributions (figure 4) suggests that the level of cracking is relatively similar. Indeed the extent that the low molecular mass hydrocarbons generated from H2O pyrolysis are also present for the same experiment involving D2O. The terpane distributions generated from the hydrous pyrolysis experiments using H2O and D2O are also not affected by the differences in reaction kinetics. The ratio of tricyclic to pentacyclic terpanes are relatively similar from the D2O relative to the H2O experiments: 0.41 and 0.39 respectively. Further investigations of the fate of the hydrogen, by analysis of deuterium, during the hydrous pyrolysis experiments may be more accurately examined by utilising compound specific stable isotope ratio mass spectrometry (GC-Ir-MS). This will enable compounds that have utilised the deuterium from the heavy water to be distinguished from other compounds that have used hydrogen from the feed itself. It is anticipated that using this analytical technique and thus determining the possible fate of the hydrogen donated by water, we will be able to better understand the mechanisms at work during visbreaking that can only lead to the further development, optimisation and monitoring of the process.
Conclusions Systematic transformations to biological marker compound distributions during visbreaking are potentially an attractive method for examining the extent of cracking due to their high sensitivity compared to bulk aromaticity measurements and ease of analysis.
Acknowledgements
The authors thank Nalco for their financial support.
CHARACTERIZATION AND STUDIES OF KINETIC AND SEVERITY IN THE VISBREAKING OF HEAVY CRUDE
OILS: CASTILLA, RUBIALES AND NARE-JAZMIN
J.A. Carrillo
Colombian Petroleum Institute-ECOPETROL Km 7, Piedecuesta, Colombia.
L.M. Corredor, M.L. Valero
Universidad Industrial de Santander
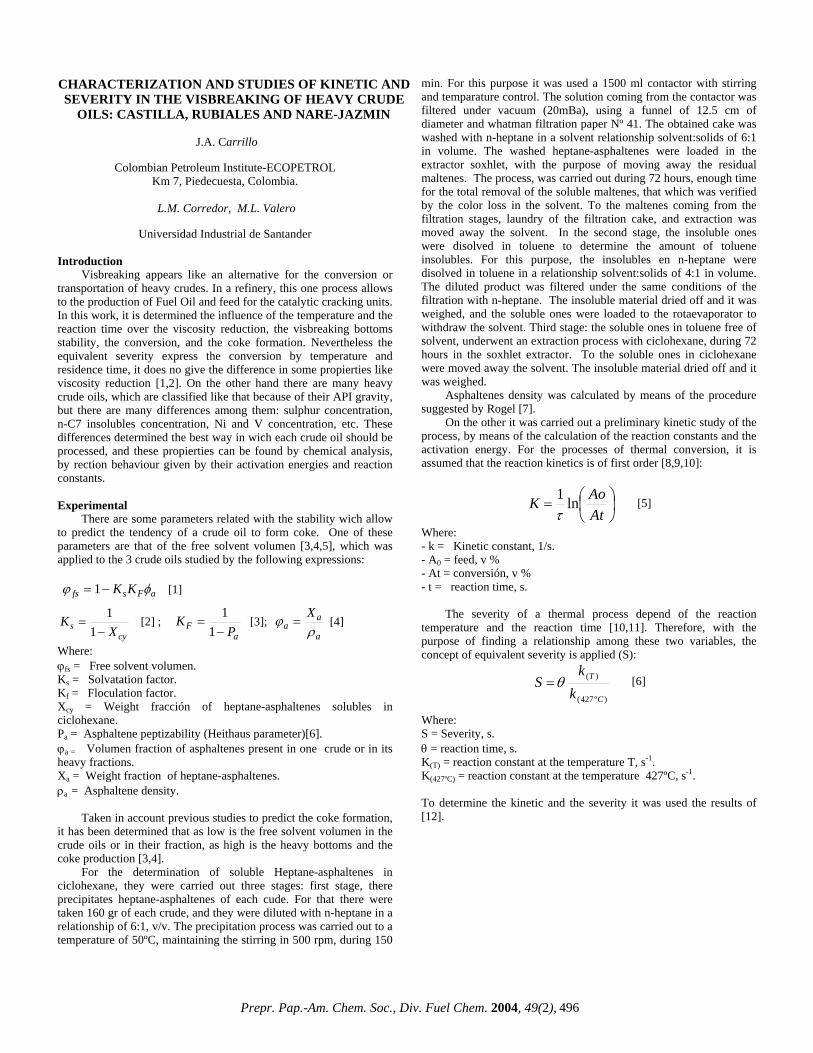
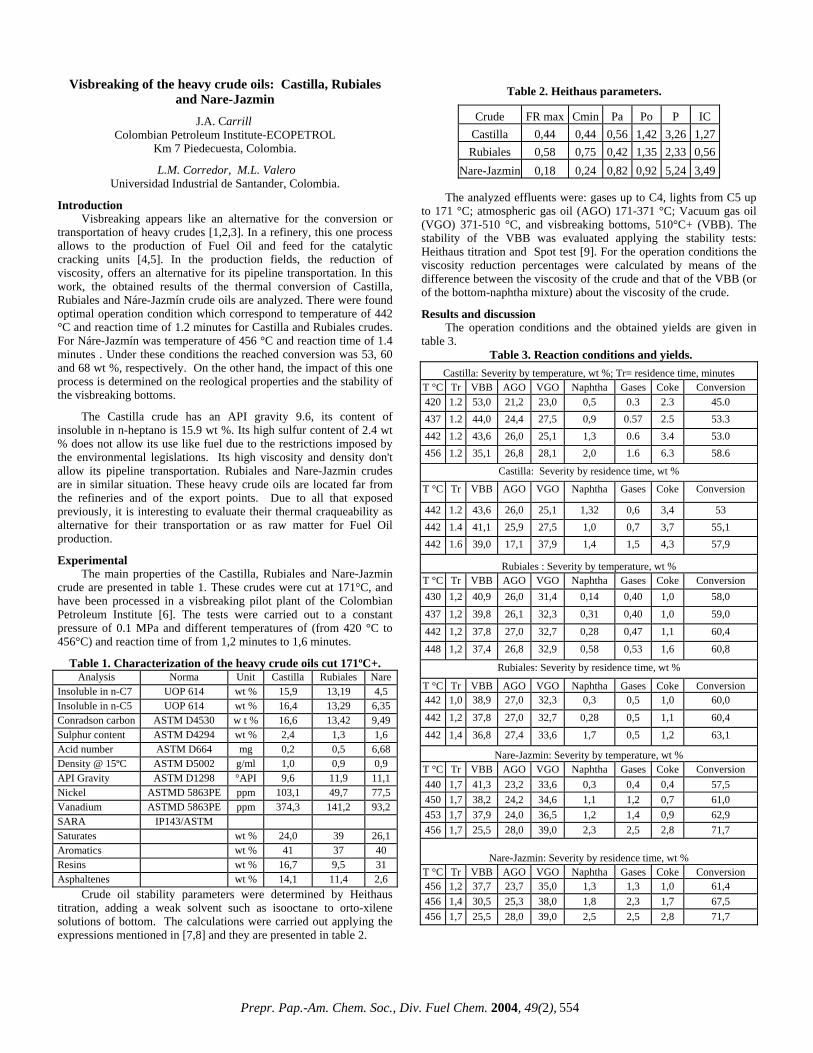
Introduction Visbreaking appears like an alternative for the conversion or transportation of heavy crudes. In a refinery, this one process allows to the production of Fuel Oil and feed for the catalytic cracking units. In this work, it is determined the influence of the temperature and the reaction time over the viscosity reduction, the visbreaking bottoms stability, the conversion, and the coke formation. Nevertheless the equivalent severity express the conversion by temperature and residence time, it does no give the difference in some propierties like viscosity reduction [1,2]. On the other hand there are many heavy crude oils, which are classified like that because of their API gravity, but there are many differences among them: sulphur concentration, n-C7 insolubles concentration, Ni and V concentration, etc. These differences determined the best way in wich each crude oil should be processed, and these propierties can be found by chemical analysis, by rection behaviour given by their activation energies and reaction constants. Experimental There are some parameters related with the stability wich allow to predict the tendency of a crude oil to form coke. One of these parameters are that of the free solvent volumen [3,4,5], which was applied to the 3 crude oils studied by the following expressions: aFsfs KK φϕ −= 1 [1]
cys X
K−
=1
1 [2] ;
aF P
K−
=1
1 [3];
a
aa
Xρ
ϕ = [4]
Where: ϕfs = Free solvent volumen. Ks = Solvatation factor. Kf = Floculation factor. Xcy = Weight fracción of heptane-asphaltenes solubles in ciclohexane. Pa = Asphaltene peptizability (Heithaus parameter)[6]. ϕa = Volumen fraction of asphaltenes present in one crude or in its heavy fractions. Xa = Weight fraction of heptane-asphaltenes. ρa = Asphaltene density. Taken in account previous studies to predict the coke formation, it has been determined that as low is the free solvent volumen in the crude oils or in their fraction, as high is the heavy bottoms and the coke production [3,4]. For the determination of soluble Heptane-asphaltenes in ciclohexane, they were carried out three stages: first stage, there precipitates heptane-asphaltenes of each cude. For that there were taken 160 gr of each crude, and they were diluted with n-heptane in a relationship of 6:1, v/v. The precipitation process was carried out to a temperature of 50ºC, maintaining the stirring in 500 rpm, during 150
min. For this purpose it was used a 1500 ml contactor with stirring and temparature control. The solution coming from the contactor was filtered under vacuum (20mBa), using a funnel of 12.5 cm of diameter and whatman filtration paper Nº 41. The obtained cake was washed with n-heptane in a solvent relationship solvent:solids of 6:1 in volume. The washed heptane-asphaltenes were loaded in the extractor soxhlet, with the purpose of moving away the residual maltenes. The process, was carried out during 72 hours, enough time for the total removal of the soluble maltenes, that which was verified by the color loss in the solvent. To the maltenes coming from the filtration stages, laundry of the filtration cake, and extraction was moved away the solvent. In the second stage, the insoluble ones were disolved in toluene to determine the amount of toluene insolubles. For this purpose, the insolubles en n-heptane were disolved in toluene in a relationship solvent:solids of 4:1 in volume. The diluted product was filtered under the same conditions of the filtration with n-heptane. The insoluble material dried off and it was weighed, and the soluble ones were loaded to the rotaevaporator to withdraw the solvent. Third stage: the soluble ones in toluene free of solvent, underwent an extraction process with ciclohexane, during 72 hours in the soxhlet extractor. To the soluble ones in ciclohexane were moved away the solvent. The insoluble material dried off and it was weighed. Asphaltenes density was calculated by means of the procedure suggested by Rogel [7]. On the other it was carried out a preliminary kinetic study of the process, by means of the calculation of the reaction constants and the activation energy. For the processes of thermal conversion, it is assumed that the reaction kinetics is of first order [8,9,10]:
⎟⎠⎞
⎜⎝⎛=
AtAoK ln
1
τ [5]
Where: - k = Kinetic constant, 1/s. - A0 = feed, v % - At = conversión, v % - t = reaction time, s. The severity of a thermal process depend of the reaction temperature and the reaction time [10,11]. Therefore, with the purpose of finding a relationship among these two variables, the concept of equivalent severity is applied (S):
)º427(
)(
C
T
kk
S θ= [6]
Where: S = Severity, s. θ = reaction time, s. K(T) = reaction constant at the temperature T, s-1. K(427ºC) = reaction constant at the temperature 427ºC, s-1. To determine the kinetic and the severity it was used the results of [12].
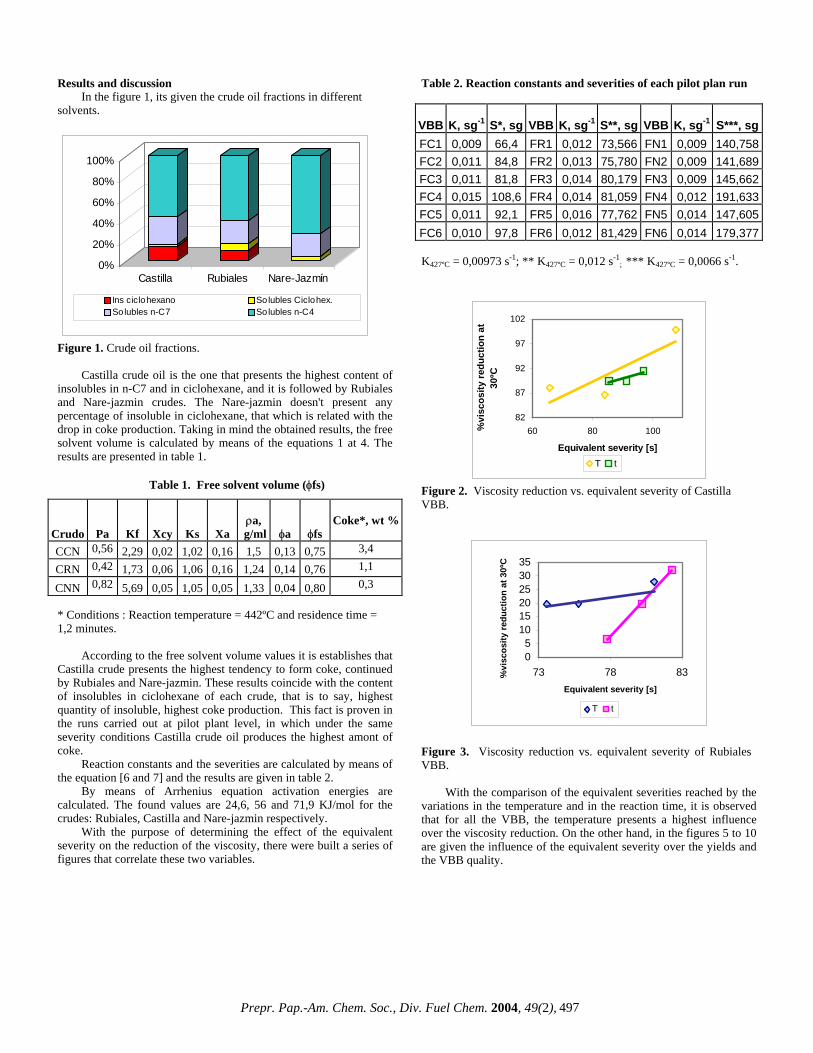
Results and discussion In the figure 1, its given the crude oil fractions in different solvents.
0%
20%
40%
60%
80%
100%
Castilla Rubiales Nare-Jazmín
Ins ciclohexano Solubles Ciclohex.Solubles n-C7 Solubles n-C4
Figure 1. Crude oil fractions. Castilla crude oil is the one that presents the highest content of insolubles in n-C7 and in ciclohexane, and it is followed by Rubiales and Nare-jazmin crudes. The Nare-jazmin doesn't present any percentage of insoluble in ciclohexane, that which is related with the drop in coke production. Taking in mind the obtained results, the free solvent volume is calculated by means of the equations 1 at 4. The results are presented in table 1.
Table 1. Free solvent volume (φfs)
Crudo
Pa Kf Xcy Ks Xa ρa,
g/ml φa φfs
Coke*, wt %
CCN 0,56 2,29 0,02 1,02 0,16 1,5 0,13 0,75 3,4
CRN 0,42 1,73 0,06 1,06 0,16 1,24 0,14 0,76 1,1
CNN 0,82 5,69 0,05 1,05 0,05 1,33 0,04 0,80 0,3
* Conditions : Reaction temperature = 442ºC and residence time = 1,2 minutes. According to the free solvent volume values it is establishes that Castilla crude presents the highest tendency to form coke, continued by Rubiales and Nare-jazmin. These results coincide with the content of insolubles in ciclohexane of each crude, that is to say, highest quantity of insoluble, highest coke production. This fact is proven in the runs carried out at pilot plant level, in which under the same severity conditions Castilla crude oil produces the highest amont of coke. Reaction constants and the severities are calculated by means of the equation [6 and 7] and the results are given in table 2. By means of Arrhenius equation activation energies are calculated. The found values are 24,6, 56 and 71,9 KJ/mol for the crudes: Rubiales, Castilla and Nare-jazmin respectively. With the purpose of determining the effect of the equivalent severity on the reduction of the viscosity, there were built a series of figures that correlate these two variables.
Table 2. Reaction constants and severities of each pilot plan run
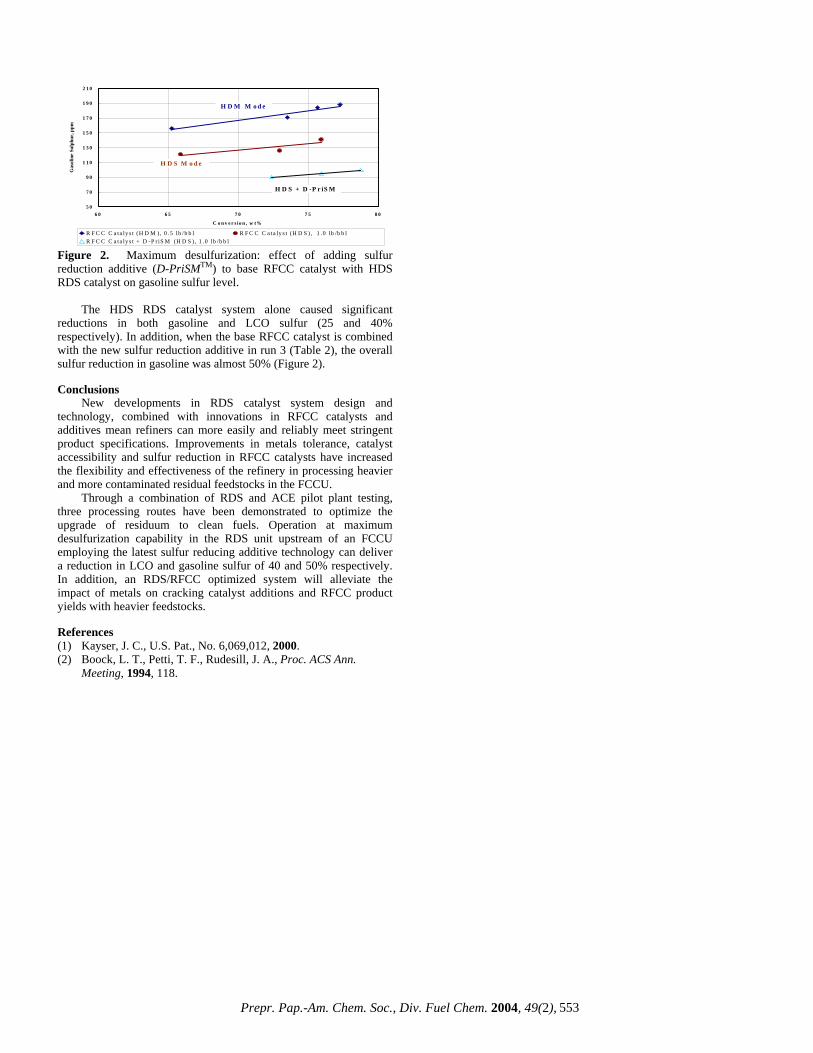
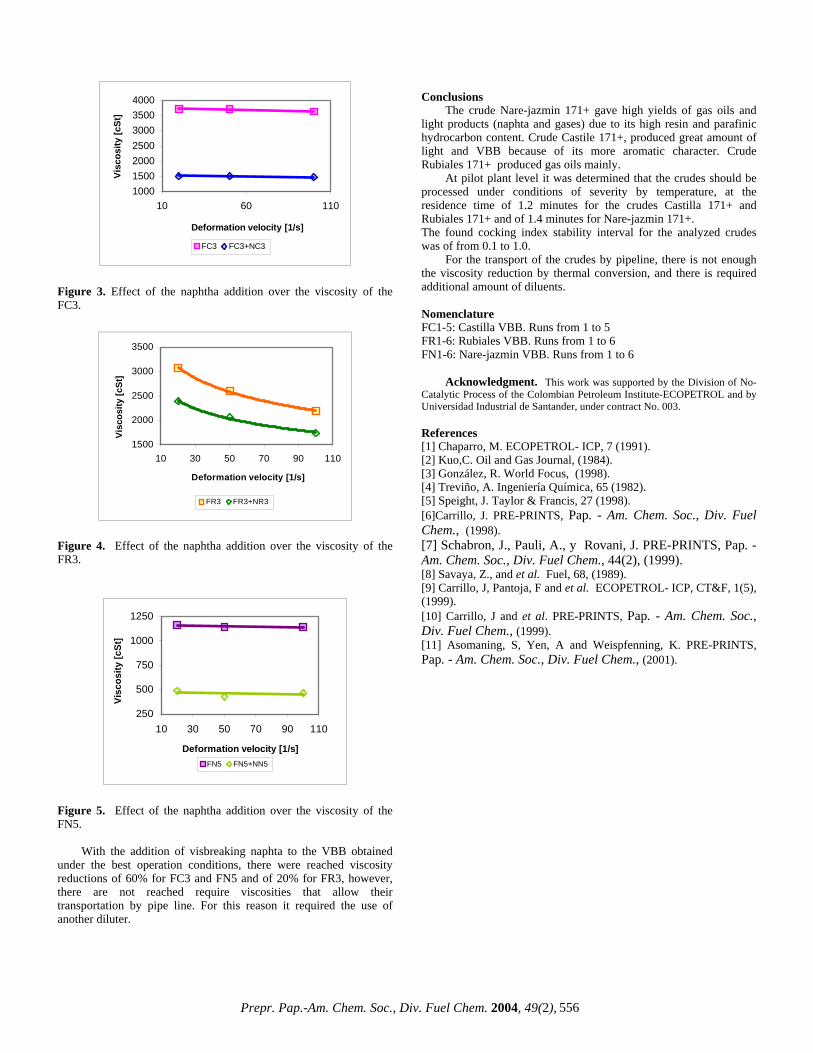
Figure 2. Viscosity reduction vs. equivalent severity of Castilla VBB.
05
101520253035
73 78 83Equivalent severity [s]
%vi
scos
ity re
duct
ion
at 3
0ºC
T t
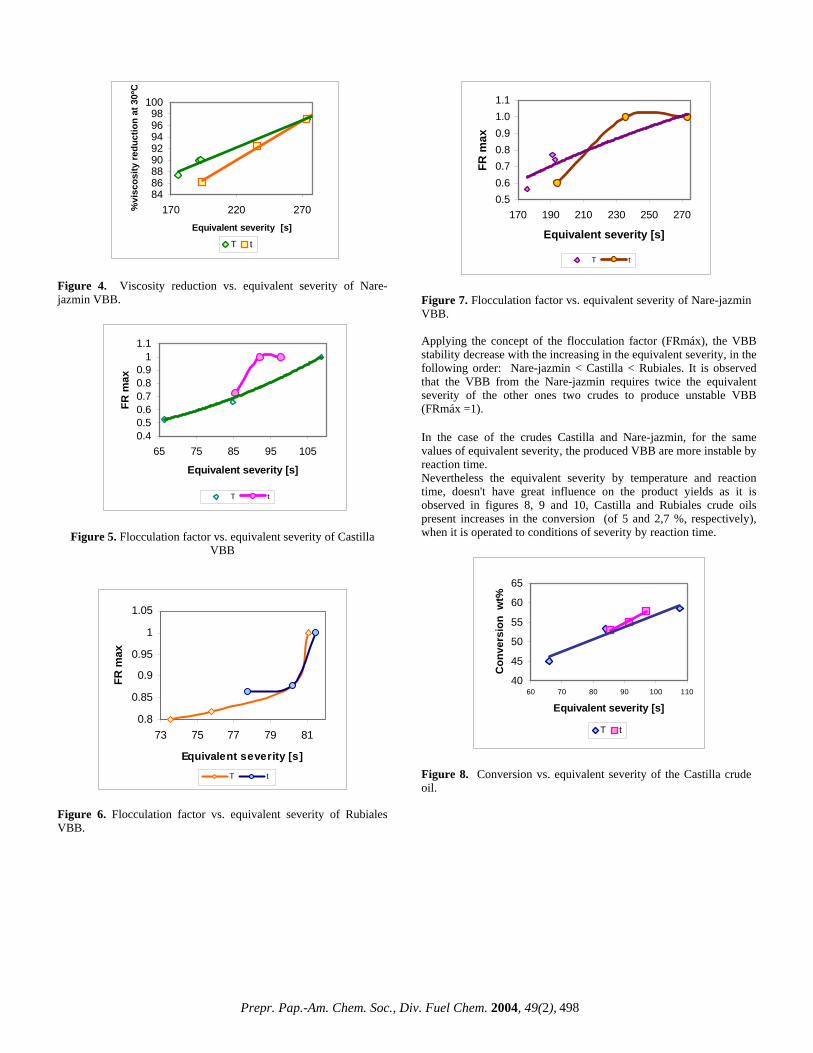
Figure 3. Viscosity reduction vs. equivalent severity of Rubiales VBB. With the comparison of the equivalent severities reached by the variations in the temperature and in the reaction time, it is observed that for all the VBB, the temperature presents a highest influence over the viscosity reduction. On the other hand, in the figures 5 to 10 are given the influence of the equivalent severity over the yields and the VBB quality.
Figure 4. Viscosity reduction vs. equivalent severity of Nare-jazmin VBB.
0.40.50.60.70.80.9
11.1
65 75 85 95 105
Equivalent severity [s]
FR m
ax
T t
Figure 5. Flocculation factor vs. equivalent severity of Castilla VBB
0.8
0.85
0.9
0.95
1
1.05
73 75 77 79 81
Equivalent severity [s]
FR m
ax
T t
Figure 6. Flocculation factor vs. equivalent severity of Rubiales VBB.
0.50.60.70.80.91.01.1
170 190 210 230 250 270
Equivalent severity [s]
FR m
ax
T t
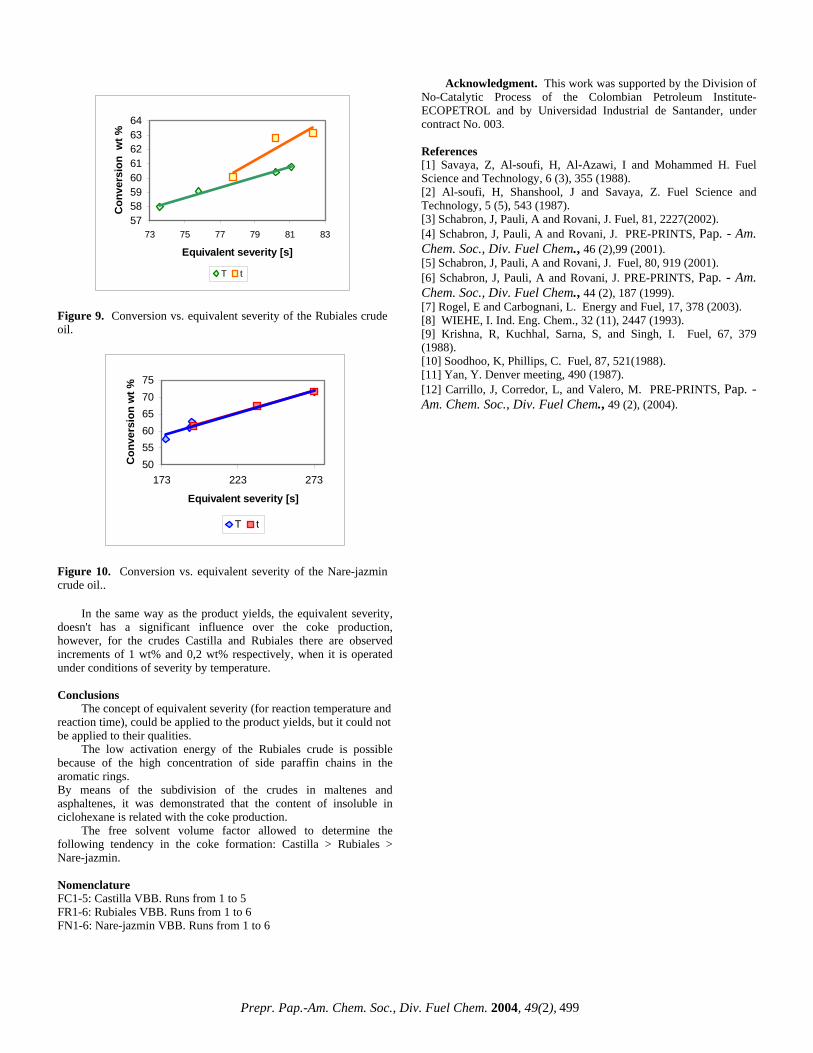
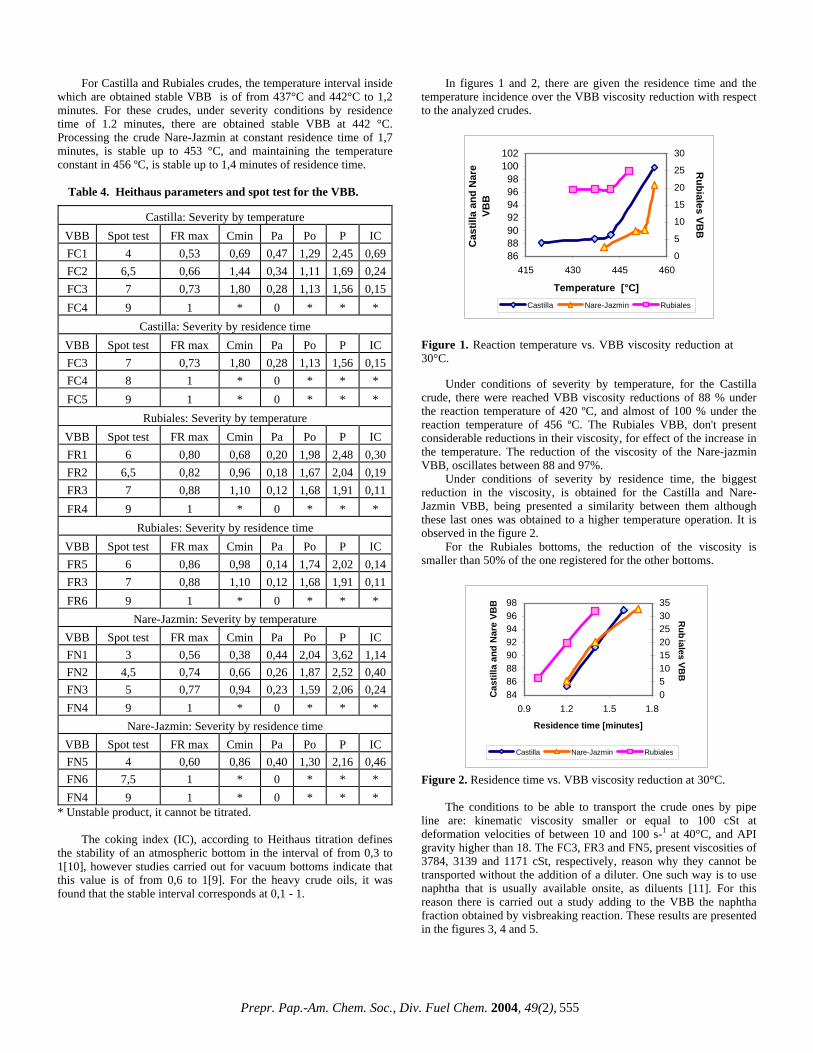
Figure 7. Flocculation factor vs. equivalent severity of Nare-jazmin VBB. Applying the concept of the flocculation factor (FRmáx), the VBB stability decrease with the increasing in the equivalent severity, in the following order: Nare-jazmin < Castilla < Rubiales. It is observed that the VBB from the Nare-jazmin requires twice the equivalent severity of the other ones two crudes to produce unstable VBB (FRmáx =1). In the case of the crudes Castilla and Nare-jazmin, for the same values of equivalent severity, the produced VBB are more instable by reaction time. Nevertheless the equivalent severity by temperature and reaction time, doesn't have great influence on the product yields as it is observed in figures 8, 9 and 10, Castilla and Rubiales crude oils present increases in the conversion (of 5 and 2,7 %, respectively), when it is operated to conditions of severity by reaction time.
40
45
50
55
60
65
60 70 80 90 100 110
Equivalent severity [s]
Con
vers
ion
wt%
T t
Figure 8. Conversion vs. equivalent severity of the Castilla crude oil.
Figure 9. Conversion vs. equivalent severity of the Rubiales crude oil.
505560657075
173 223 273
Equivalent severity [s]
Con
vers
ion
wt %
T t
Figure 10. Conversion vs. equivalent severity of the Nare-jazmin crude oil.. In the same way as the product yields, the equivalent severity, doesn't has a significant influence over the coke production, however, for the crudes Castilla and Rubiales there are observed increments of 1 wt% and 0,2 wt% respectively, when it is operated under conditions of severity by temperature. Conclusions The concept of equivalent severity (for reaction temperature and reaction time), could be applied to the product yields, but it could not be applied to their qualities. The low activation energy of the Rubiales crude is possible because of the high concentration of side paraffin chains in the aromatic rings. By means of the subdivision of the crudes in maltenes and asphaltenes, it was demonstrated that the content of insoluble in ciclohexane is related with the coke production. The free solvent volume factor allowed to determine the following tendency in the coke formation: Castilla > Rubiales > Nare-jazmin. Nomenclature FC1-5: Castilla VBB. Runs from 1 to 5 FR1-6: Rubiales VBB. Runs from 1 to 6 FN1-6: Nare-jazmin VBB. Runs from 1 to 6
Acknowledgment. This work was supported by the Division of No-Catalytic Process of the Colombian Petroleum Institute-ECOPETROL and by Universidad Industrial de Santander, under contract No. 003. References [1] Savaya, Z, Al-soufi, H, Al-Azawi, I and Mohammed H. Fuel Science and Technology, 6 (3), 355 (1988). [2] Al-soufi, H, Shanshool, J and Savaya, Z. Fuel Science and Technology, 5 (5), 543 (1987). [3] Schabron, J, Pauli, A and Rovani, J. Fuel, 81, 2227(2002). [4] Schabron, J, Pauli, A and Rovani, J. PRE-PRINTS, Pap. - Am. Chem. Soc., Div. Fuel Chem., 46 (2),99 (2001). [5] Schabron, J, Pauli, A and Rovani, J. Fuel, 80, 919 (2001). [6] Schabron, J, Pauli, A and Rovani, J. PRE-PRINTS, Pap. - Am. Chem. Soc., Div. Fuel Chem., 44 (2), 187 (1999). [7] Rogel, E and Carbognani, L. Energy and Fuel, 17, 378 (2003). [8] WIEHE, I. Ind. Eng. Chem., 32 (11), 2447 (1993). [9] Krishna, R, Kuchhal, Sarna, S, and Singh, I. Fuel, 67, 379 (1988). [10] Soodhoo, K, Phillips, C. Fuel, 87, 521(1988). [11] Yan, Y. Denver meeting, 490 (1987). [12] Carrillo, J, Corredor, L, and Valero, M. PRE-PRINTS, Pap. - Am. Chem. Soc., Div. Fuel Chem., 49 (2), (2004).
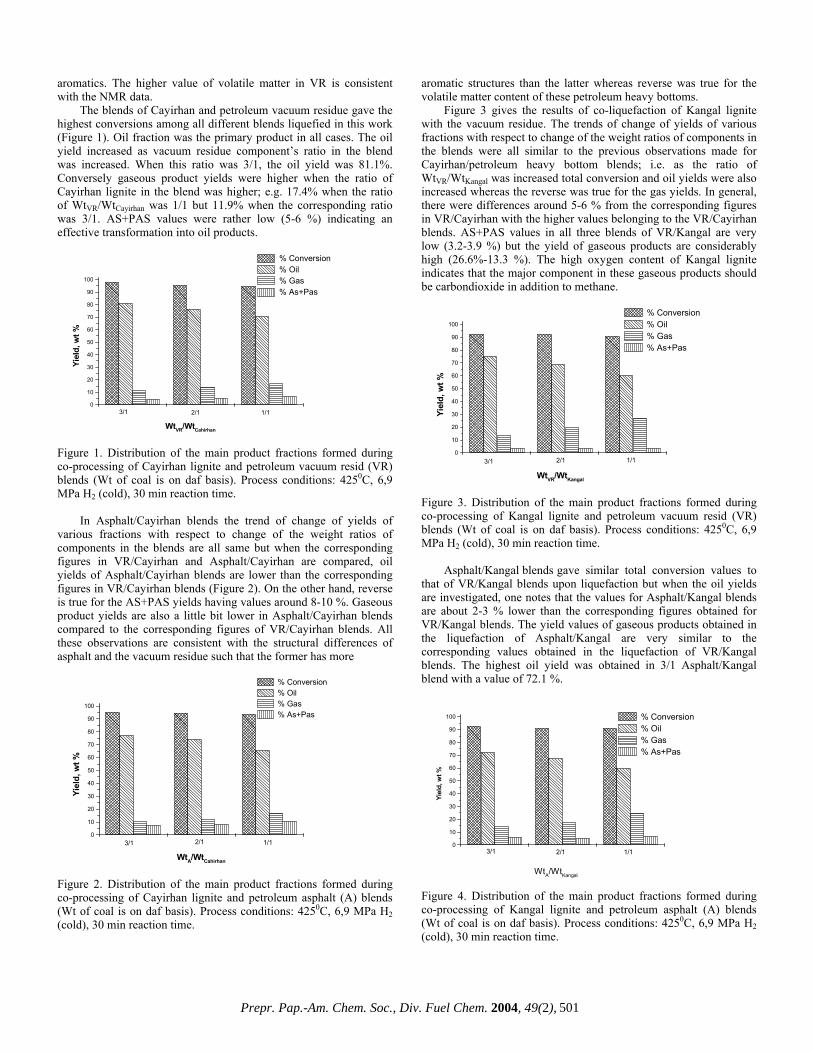
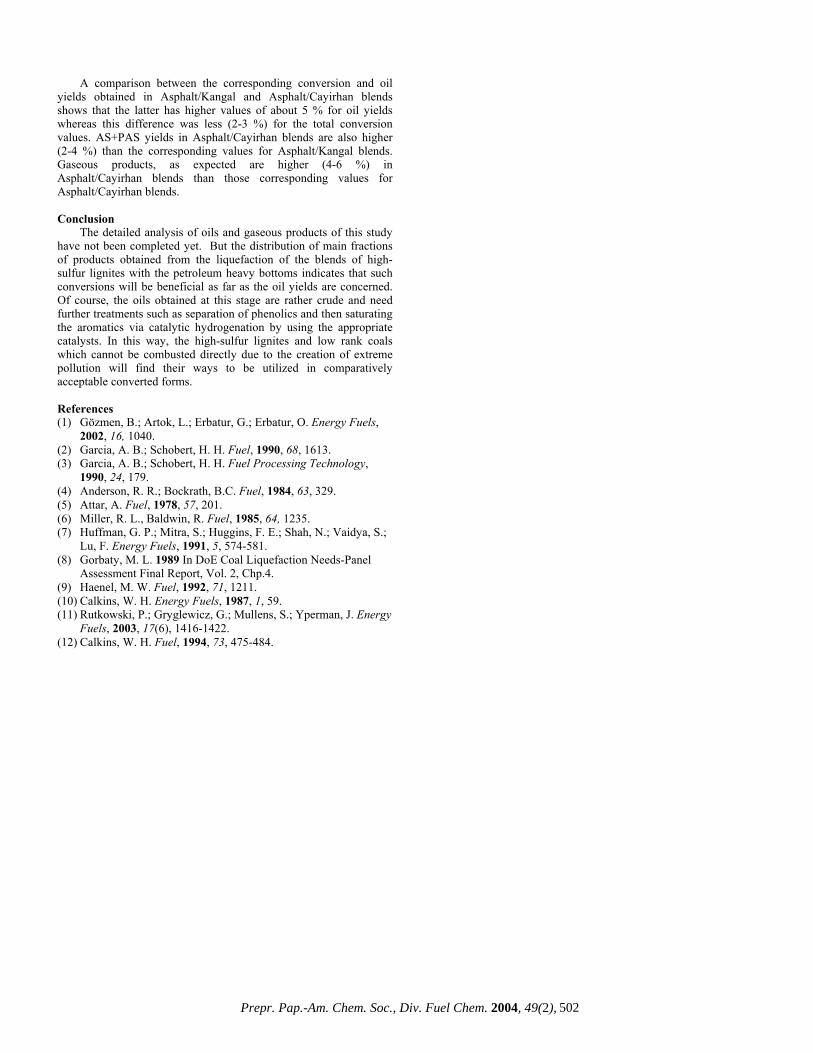
DISTRIBUTION OF MAIN PRODUCT FRACTIONS IN CO-LIQUEFACTION OF HIGH-SULFUR LIGNITES
BLENDED WITH PETROLEUM HEAVY BOTTOMS
Arif Hesenov*, Ömer Gül*†, Pervane Gafarova*†, Oktay Erbatur*, Harold H. Schobert†
*Çukurova Üniversitesi, Fen Edebiyat Fakültesi,
Kimya Bölümü, 01330 Adana, Turkey †The Energy Institute, The Pennsylvania State University,
University Park, PA 16802
Introduction Low rank coals with high sulfur contents liquify comparatively easily (1-4). The type of sulfur in coal structure is an important factor affecting the conversions in catalytic or non-catalytic direct hydrogenations. Pyrite transforms into pyrothite during the process and catalyses the liquefaction reactions (5). Iron sulfate structures are also transformed into pyrothite and contributes to the catalysis of liquefaction reactions (6). When organic sulfur is concerned, the organic sulfide content increases with decreasing rank, although thiophenic sulfur is normally the dominant organic component, regardless of rank (7). In general, aliphatic sulfides are mainly found in lignites whereas thiols, thiophenols, aryl and diaryl sulfides and disulfides are also present in lesser amounts. As the rank goes up, e.g. in sub-bituminous coals aryl sulfides tend to dominate and more heterocyclic structures are also observed. Finally in high-rank bituminous coals almost all organic sulfur is in thiophenic structures with very few of other sulfur fuctional groups (8-11). The aliphatic C-S bonds, other than thiophenics, are thermally less stable (12) and therefore cleave comparatively easily under liquefaction conditions.
In this work, liquefaction of high-sulfur lignites blended with petroleum heavy bottoms has been investigated. This is a continuation of a study in which catalytic direct liquefaction of high-sulfur coals are being evaluated. Experimental
The analytical data regarding two lignites from Turkey and the petroleum heavy bottoms are given in Table 1 and Table 2, respectively. Petroleum feedstocks were obtained from Izmir Tupras Refinery from Turkey.
Table 1. Analytical Data of the Cayirhan and Kangal Lignites.
a daf: dry, ash-free; b calculated from difference
The catalyst (1% by wt based on Mo to daf coal ratio) was dissolved in 30 mL of distilled water and added dropwise onto 100 g of dry coal while the coal was effectively mixed with a spatula to achieve a homogeneous mixture. Following addition of the catalyst
precursor, the impregnated coal was dried at 50 °C under reduced nitrogen pressure until the moisture content fell below 3 %. A pre-determined amount of catalyst-precursor impregnated coal (50 g daf basis) is charged into a 500 mL PARR model 4575 HP/HT reactor having a magne-drive mixing facility. Also, the petroleum heavy –bottom sample onto which Co/Mo hydrotreating catalyst (CRITERION HDS-22) was added with a weight ratio based on 1% Mo per 100 g organic material has been added to the reactor. Three different weight ratios of blends of petroleum heavy bottoms and lignites were prepared for liquefaction studies. These are 1:1; 2:1; and 3:1 (lignite weight was on daf basis) cases. All liquefaction experiments were carried out at a constant treatment time of 30 min with a constant process temperature of 425 °C.
Following loading the lignite and petroleum heavy bottom blend, the reactor was sealed and air inside the reactor was swept out by successive pressurizing (6.9 MPa cold) and depressurizing twice with nitrogen and twice with hydrogen gases. Finally the reactor was pressurized with hydrogen gas (6.9 MPa cold) and then heated with a rate of 4.7 °C/min upto 425 °C. Following mixing the reactor contents for 30 min continuously via the magne-drive at 425 °C, the reactor was taken out of the heating system and quenched with ice-cold water. Following discharge of the gaseous components, the content of the reactor was withdrawn and transferred into an extraction thimble with the aid of n-hexane. Successive extraction of this material were carried out in a soxhlet apparatus by using n-hexane and tetrahydrofuran. Hexane solubles were called oil and THF solubles were called asphaltene + preasphaltene (AS + PAS). The amount of oil and AS+PAS were determined after removing the solvents under reduced pressure. The char (solid remaining following THF extraction) was also weighed. The difference between the amount of total material charged to the reactor and the total amount of Oil, AS+PAS and Char was accepted as the total amount of gaseous products. Conversion (total) is calculated by taking the per cent ratio: (Woil + Wgas + WAS+PAS)∗ 100/Wtotal charge(organic)
Table 2. Analytical Data for Petroleum Vacuum Resid (VR) and Petroleum Asphalt (A).
VR A C, wt % 85.31 84.54 H, wt % 10.17 10.45 N, wt % 0.32 0.34 S, wt % 4.70 5.45 V.M., wt % 86.00 78.16 Ash, wt % 0.17 0.09 a FC 13.83 21.75 b %Carom 21.25 25.88 b %Calip 78.75 74.12 b %Harom 5.99 7.90 b %Halip 94.01 92.10
aFC: Fixed Carbon; bFrom NMR data
Results and Discussion Elemental analysis of lignites show that Cayirhan lignite has a higher rank than Kangal lignite. The oxygen content of Kangal lignite is much higher than that of Cayirhan. On the other hand the total sulfur content of Cayirhan is higher than that of Kangal lignite. While Cayirhan has higher inorganic type of sulfur, Kangal has higher organic sulfur content. Analytical data of petroleum heavy bottoms show that although elemental analysis results of both vacuum residue and asphalt are very similar, NMR data indicates that asphalt has a higher content of
aromatics. The higher value of volatile matter in VR is consistent with the NMR data. The blends of Cayirhan and petroleum vacuum residue gave the highest conversions among all different blends liquefied in this work (Figure 1). Oil fraction was the primary product in all cases. The oil yield increased as vacuum residue component’s ratio in the blend was increased. When this ratio was 3/1, the oil yield was 81.1%. Conversely gaseous product yields were higher when the ratio of Cayirhan lignite in the blend was higher; e.g. 17.4% when the ratio of WtVR/WtCayirhan was 1/1 but 11.9% when the corresponding ratio was 3/1. AS+PAS values were rather low (5-6 %) indicating an effective transformation into oil products.
1 2 30
10
20
30
40
50
60
70
80
90
100
3/1 2/1 1/1
Yiel
d, w
t %
WtVR/WtCahirhan
% Conversion % Oil % Gas % As+Pas
Figure 1. Distribution of the main product fractions formed during co-processing of Cayirhan lignite and petroleum vacuum resid (VR) blends (Wt of coal is on daf basis). Process conditions: 4250C, 6,9 MPa H2 (cold), 30 min reaction time. In Asphalt/Cayirhan blends the trend of change of yields of various fractions with respect to change of the weight ratios of components in the blends are all same but when the corresponding figures in VR/Cayirhan and Asphalt/Cayirhan are compared, oil yields of Asphalt/Cayirhan blends are lower than the corresponding figures in VR/Cayirhan blends (Figure 2). On the other hand, reverse is true for the AS+PAS yields having values around 8-10 %. Gaseous product yields are also a little bit lower in Asphalt/Cayirhan blends compared to the corresponding figures of VR/Cayirhan blends. All these observations are consistent with the structural differences of asphalt and the vacuum residue such that the former has more
1 2 30
10
20
30
40
50
60
70
80
90
100
3/1 2/1 1/1
Yiel
d, w
t %
WtA/WtCahirhan
% Conversion % Oil % Gas % As+Pas
Figure 2. Distribution of the main product fractions formed during co-processing of Cayirhan lignite and petroleum asphalt (A) blends (Wt of coal is on daf basis). Process conditions: 4250C, 6,9 MPa H2 (cold), 30 min reaction time.
aromatic structures than the latter whereas reverse was true for the volatile matter content of these petroleum heavy bottoms.
Figure 3 gives the results of co-liquefaction of Kangal lignite with the vacuum residue. The trends of change of yields of various fractions with respect to change of the weight ratios of components in the blends were all similar to the previous observations made for Cayirhan/petroleum heavy bottom blends; i.e. as the ratio of WtVR/WtKangal was increased total conversion and oil yields were also increased whereas the reverse was true for the gas yields. In general, there were differences around 5-6 % from the corresponding figures in VR/Cayirhan with the higher values belonging to the VR/Cayirhan blends. AS+PAS values in all three blends of VR/Kangal are very low (3.2-3.9 %) but the yield of gaseous products are considerably high (26.6%-13.3 %). The high oxygen content of Kangal lignite indicates that the major component in these gaseous products should be carbondioxide in addition to methane.
1 2 30
10
20
30
40
50
60
70
80
90
100
3/1 2/1 1/1
Yiel
d, w
t %
WtVR/WtKangal
% Conversion % Oil % Gas % As+Pas
Figure 3. Distribution of the main product fractions formed during co-processing of Kangal lignite and petroleum vacuum resid (VR) blends (Wt of coal is on daf basis). Process conditions: 4250C, 6,9 MPa H2 (cold), 30 min reaction time. Asphalt/Kangal blends gave similar total conversion values to that of VR/Kangal blends upon liquefaction but when the oil yields are investigated, one notes that the values for Asphalt/Kangal blends are about 2-3 % lower than the corresponding figures obtained for VR/Kangal blends. The yield values of gaseous products obtained in the liquefaction of Asphalt/Kangal are very similar to the corresponding values obtained in the liquefaction of VR/Kangal blends. The highest oil yield was obtained in 3/1 Asphalt/Kangal blend with a value of 72.1 %.
1 2 30
10
20
30
40
50
60
70
80
90
100
3/1 2/1 1/1
Yiel
d, w
t %
WtA/WtKangal
% Conversion % Oil % Gas % As+Pas
Figure 4. Distribution of the main product fractions formed during co-processing of Kangal lignite and petroleum asphalt (A) blends (Wt of coal is on daf basis). Process conditions: 4250C, 6,9 MPa H2 (cold), 30 min reaction time.
A comparison between the corresponding conversion and oil yields obtained in Asphalt/Kangal and Asphalt/Cayirhan blends shows that the latter has higher values of about 5 % for oil yields whereas this difference was less (2-3 %) for the total conversion values. AS+PAS yields in Asphalt/Cayirhan blends are also higher (2-4 %) than the corresponding values for Asphalt/Kangal blends. Gaseous products, as expected are higher (4-6 %) in Asphalt/Cayirhan blends than those corresponding values for Asphalt/Cayirhan blends. Conclusion The detailed analysis of oils and gaseous products of this study have not been completed yet. But the distribution of main fractions of products obtained from the liquefaction of the blends of high-sulfur lignites with the petroleum heavy bottoms indicates that such conversions will be beneficial as far as the oil yields are concerned. Of course, the oils obtained at this stage are rather crude and need further treatments such as separation of phenolics and then saturating the aromatics via catalytic hydrogenation by using the appropriate catalysts. In this way, the high-sulfur lignites and low rank coals which cannot be combusted directly due to the creation of extreme pollution will find their ways to be utilized in comparatively acceptable converted forms. References (1) Gözmen, B.; Artok, L.; Erbatur, G.; Erbatur, O. Energy Fuels,
2002, 16, 1040. (2) Garcia, A. B.; Schobert, H. H. Fuel, 1990, 68, 1613. (3) Garcia, A. B.; Schobert, H. H. Fuel Processing Technology,
1990, 24, 179. (4) Anderson, R. R.; Bockrath, B.C. Fuel, 1984, 63, 329. (5) Attar, A. Fuel, 1978, 57, 201. (6) Miller, R. L., Baldwin, R. Fuel, 1985, 64, 1235. (7) Huffman, G. P.; Mitra, S.; Huggins, F. E.; Shah, N.; Vaidya, S.;
Lu, F. Energy Fuels, 1991, 5, 574-581. (8) Gorbaty, M. L. 1989 In DoE Coal Liquefaction Needs-Panel
Assessment Final Report, Vol. 2, Chp.4. (9) Haenel, M. W. Fuel, 1992, 71, 1211. (10) Calkins, W. H. Energy Fuels, 1987, 1, 59. (11) Rutkowski, P.; Gryglewicz, G.; Mullens, S.; Yperman, J. Energy
Fuels, 2003, 17(6), 1416-1422. (12) Calkins, W. H. Fuel, 1994, 73, 475-484.
1 National Institute of Advanced Industrial Science and Technology(AIST)
Onogawa, Tsukuba, Japan 305-8569 2 Tokyo University of Marine Science and Technology,
Konan, Minato, Tokyo, Japan 108-8477 Introduction
Asphaltene (AS) is a complex mixture of several molecular weight molecules, and is said to form a micelle aggregate structure by mainly aromatic-aromatic stacking interaction among the molecules in crude oil. Several methods have been used to clarify the AS aggregate structures.1-4 In the area of polymer solutions, diffusion coefficient (D) measurement using pulse field gradient spin-echo (PGSE) 1H NMR has been widely carried out.5-8 From the D value, it is possible to estimate the hydrodynamic radius of a molecule.9 In this study, the D values of some AS and resin (RE) in solutions were measured by PGSE 1H NMR, and the sizes of the aggregates were estimated. The effect of the concentration of the solutions on the sizes of the aggregates is discussed. Experimental
Samples. Three kinds of crude oil (Khafji, Iranian Light, and Maya) were used. AS fraction and RE fraction were obtained by extraction of vacuum residue (VR) of each crude oil using n-heptane. Table 1 shows the properties of the samples. Polystyrene (PS) with molecular weights (Mn) of 350, 700, 1400, 2000, 2500, and 3000, poly-4-vinylpyridine (PVP) of Mn 1800, poly –2-vinylnapthalene of Mn 1800, pyrene, and coronene were also used as standards.
Table 1. Properties of Asphaltenes and Resin
Maya AS Maya RE Khafji AS Iranian Light AS Elemental analysis, wt% C 82.0 83.4 82.2 83.2 H 7.5 10.4 7.6 6.8 S 7.1 4.6 7.6 5.9 N 1.3 0.4 0.9 1.4 O 1.2 0.5 1.1 1.5 M
PGSE 1H NMR. A Brucker DRX-300 NMR apparatus was used to measure the PGSE 1H NMR spectra. Each sample was dissolved in CDCl3. Concentrations of the solutions were 3% (30g/l), 1% (10g/l), 0.1% (1g/l), and 0.01% (0.1g/l). Each solution was put into a 10 mm in diameter Pyrex glass flat-bottomed type NMR tube. The depth of the solution in the NMR tube was about 10 mm. To avoid convection and vaporization, a plug was inserted into the NMR tube to reach the surface of the solution. The measurements were performed by PGSE pulse sequence (Figure 1). In this case, signal intensities are indicated as following equation.
A=A0 exp (-γ2 G2 Dδ2 (Δ-δ/3)) In this equation, A is the signal intensity, γ is the gyromagnetic ratio, D is the diffusion coefficient (m2/s), δ is the pulse width (1ms), and Δ is the diffusion time (10ms). G is a magnetic field gradient (G/cm), and values of G were 8 -16 points in 5 - 1144 G/cm. With the plot between γ2 G2 δ2 (Δ-δ/3) and logA, the D value is obtained from the slope. Pulse delay was 3 s. The number of scans was 16 - 4000 depending on the concentration of the solution. In this experiment, the D value was obtained from the change in the aliphatic peak intensity with the change in the G value. There were no large differences in the D values between those obtained from aliphatic and those obtained from aromatic peak intensities. The measuring temperature was 294 K.
Figure 1. Pulse sequence of PGSE. Results and Discussion
Table 2 shows the measured D results for the polymers, pyrene, and coronene. In general, for polymer solution, if the polymer and the concentration are the same, the D value decreases with the increase of molecular weight, and if the polymer and the molecular weight are the same, the D value is constant below a critical concentration and decreases with the increase of concentration above the critical concentration. In the concentration range of this experiment, the polymers and pyrene showed few changes in the D values with the change in the concentration. The D of pyrene was large, and the D of coronene was comparatively lower. Compared with the D results for pyrene (molecular weight: 202) and coronene (molecular weight: 300), the D result for PS of Mn 350 was far lower. For PS, there were no differences in the D values between Mn 350 and 700, and the D decreased with the increase of Mn above these values. PVN and PVP of Mn 1800 showed D values different from that of PS. Molecules having sphere structures showed larger D. For structurally similar molecules, the D decreased with the increase in molecular size.
Table 3 shows the measured D results for the AS and RE. These
samples showed different behaviors from those of the polymers. For 3% solutions, the ASs showed similar D values. For 1% solutions, the D value of each AS increased, and the D values were in the order Maya RE > Iranian Light AS = Khafji AS > Maya AS. For 0.1% and 0.01% solutions, two components having quite different D values were observed (In Table 3, percentages of each component obtained from the echo signal intensity are also shown. At 0.01%, signal intensities were very weak, and shimming and phase adjustments for NMR spectra were difficult, so some errors are thought to be contained in obtained D values.).
Table 3. D(10-10m2/s) of each sample in chloroform
Concentration 3% 1% 0.1% 0.01% Maya AS 1.0 1.3 2.2(70%),1.3(30%) 5.1(70%),0.9(30%) Maya RE 2.5 2.7 4.3(62%),2.3(38%) 8.7(69%),2.1(31%) Khafji AS 1.0 1.6 3.4(87%),1.0(13%) 5.6(88%),1.0(12%) Iranian Light AS 1.0 1.6 2.6(45%),2.0(55%) 6.5(50%),1.1(50%)
From the relation between the measured D value and the concentration of the solution, the effect of the concentration on the sizes of the aggregates is considered as follows. AS and RE associated themselves originally in the solid state. In higher concentration solutions, AS and RE formed complex aggregates, and the association of the samples was not so greatly dissociated. Consequently, only one component was observed. By VPO measurement, Mn of Maya RE was 720. The D result for the RE was about 2.5×10⁻¹⁰ (m2/s) in higher concentration solutions (3 and 1%), and this value corresponded to that for PS of Mn 2500 or 3000. Therefore, about four or five RE molecules on average were thought to associate in the solutions. By VPO measurement, Mn values of AS samples were in the range of 2400 - 4000. The D results for the AS samples were 1.0 - 1.6×10⁻¹⁰ (m2/s) in higher concentration solutions (3 and 1%), and these values corresponded to those of PS of Mn over 3000. Thus, the average number of AS molecules contained in the aggregates in the solutions was not clear, but, considering the result of the RE, some molecules were thought to associate in the solutions. In lower concentration solutions, some portion of the association was dissociated from the aggregates with solvation by large amounts of CDCl3, and two components were observed. Likely, the dissociated portion consisted of smaller molecules having lower molecular weights.
By using the Stokes-Einstein equation, the average molecular radius (rav) of each sample was calculated for each solution from the D result. The Stokes-Einstein equation is indicated as followed equation. D = kT/(6πηS rav) In this equation, k is the Boltzmann constant, T is the temperature (K), and ηS is the viscosity of solution. Table 4 shows calculated rav values. The calculated rav values of AS were 2.4 - 3.8 nm in solutions with a concentration above 1 %, and were 3.5 - 4.2 nm (for one component) and 0.6 - 0.7 nm (for the other component) for solutions with a concentration at 0.01%. Tanaka et al. measured some AS aggregates in solutions (decalin, 1-methylnaphthalene, and quinoline) using SANS (small-angle neutron scattering), and showed that the sizes of AS aggregates for 5% solutions were about 5 nm in radius at 298 K.4 Their results are relatively consistent with ours in the higher concentration solutions. The decreases and the appearances of two components of the rav values with the decrease of the concentration
were caused by dissociation of the smaller molecules from the aggregates. The interactions between the aggregates are considered to include aromatic-aromatic stacking, hydrogen bonding, and van der Waals interaction. However, the contribution of each interaction to the aggregates has not yet been clarified. The D measurements using several solvent solutions such as pyridine or toluene and the comparison of the D results among these solutions might be needed to separate the contribution of each interaction to the aggregates.
Table 4. Radius (nm) of each sample in chloroform calculated from the D results
Concentration 3% 1% 0.1% 0.01% Maya AS 3.8 2.9 1.7, 2.9 0.7, 4.2 Maya RE 1.5 1.4 0.9, 1.6 0.4, 1.8 Khafji AS 3.8 2.4 1.1, 3.8 0.7, 3.8 Iranian Light AS 3.8 2.4 1.5, 1.9 0.6, 3.5
Conclusion Three kinds of AS and one kind of RE obtained from VR were
measured by PGSE 1H NMR, and the D value of each sample was estimated. By using the Stokes-Einstein equation, the rav value of each sample was calculated for each solution from the D result. From the relation between the calculated molecular radius and the concentration of the solution, the effect of the concentration on the sizes of the aggregates is discussed. The differences of the D and rav values with the concentration were caused by the partial dissociation of aggregates. References (1) Norinaga, K.; Wargardalam, V.J.; Takasugi, S.; Iino, M.; Matsukawa, S.
Energy Fuels, 2001, 15, 1317. (2) Wargadalam, V.J.; Norinaga, K.; Iino, M. Fuel, 2002, 81, 1403. (3) Zhang, Y.; Takanohashi, T.; Sato, S.; Kondo, T.; Saito, I. Energy Fuels,
Hong-Hong Shan, Jian-Fang Zhang, Chao-He Yang, Gen-Lin Niu, Yong-Shan Tu
State Key Laboratory of Heavy Oil Processing
University of Petroleum, Dongying, 257061, P. R. China Introduction
In China, the fluid catalytic cracking (FCC) process is one of the most important refining processes, it affords about 80% of gasoline and 30% of diesel oil in market, but now it is faced with a baptism to satisfy the need for producing environmentally-cleaner gasoline and diesel fuels. During the recent decade, almost all the FCC processes became the RFCC (residue fluid catalytic cracking) processes by revamping for processing the heavier feedstock, and RFCC technology got great development around the reaction system, including the feeding atomization, quick separation of oil vapor and spent catalyst, steam stripping of high efficiency, temperature control of reaction, as well as the innovation of riser reactor [1-3].
In order to improve the product distribution, as well as reduce the olefin content and increase the octane number of FCC gasoline, and raise the cetane number of FCC diesel fuel, many technology innovations were proposed and tested in China.
Riser reactor, commonly applied by worldwide FCC (One-Stage Riser, OSRFCC) process, was proved that, in the second half of riser, the activity and selectivity of the catalyst drop dramatically and over-cracking of intermediate products occurs [4], which deteriorate markedly the product distribution and final products properties. Based on this fact, a novel FCC process named TSRFCC had been invented successfully in china. The features of this new process are attributed to catalyst in relay, subsection reaction, short residence time, and high catalyst/oil (C/O) ratio, through which the average activity and selectivity of the catalyst are enhanced and undesirable secondary reaction and thermal reaction are suppressed efficiently. Some former studies proved that TSRFCC process open a fairly good way to optimize product distribution and improve product quality. In this article, the one of Two-Stage Riser FCC technology (TSRFCC-I) was introduced especially for its comercial application.
The Theory of TSRFCC-I technology The TSRFCC aiming at the disadvantage that the activity of
catalyst and the selectivity to ideal products fall greatly at the anaphase of reaction in the traditional one-stage riser FCC (OSRFCC) replaces the present single riser reactor by two modified riser reactors, has two catalyst cycling system. A series of TSRFCC technologies have been developed for various product schemes. TSRFCC-I technology is suitable for enhancing the yield of light oil, especially the ratio of diesel to gasoline. Figure 1 shows the principle flow chart of both OSRFCC and TSRFCC-I processes. For TSRFCC-I technology, the fresh feed is fed into the first riser reactor, after the first stage cracking reaction to a proper extent, diesel distillate as a part of the final product is separated, while heavy oil (or heavy oil and gasoline when olefin reduction of gasoline is needed) enters the second stage riser reactor, contacts with the regenerated catalysts and
reacts simultaneously. Therefore, diesel is well protected from non-desired second cracking since it does not take part in the reaction in the second stage after the separation, which increases the yield of diesel. On the other hand, the partial pressure of diesel at the second stage is effectively lowered, so it is optimal for the large molecules of heavy oil breaking down to generate more light oil. The two risers in TSRFCC-I technology are designed to keep the total reaction time less than 2 seconds, this affords a favorable condition for high temperature and short time operation. Compared with the recycle oil, the residue is easier to cracking, but more difficult to atomize, vaporize, and diffuse into the pores of catalyst, so the recycle oil will firstly vaporize and diffuse into the pores of catalyst and cover the active sites when both together enters the riser at the same time, this does affect the effective conversion of residue. The residue and recycle oil entering the two different risers respectively is reasonable for improving the product distribution.
Figure 1. Comparison between OSRFCC and TSRFCC-I
Table 1 Product distribution comparison of TSRFCC-I and
OSRFCC processes
Statistically average of January and February 2002
Calibration on 17-18 June
2002
Changes before and after
revamping
Output data *Corrected data Capacity, 104t/a 10.6 10.6 13.9 +3.3
Commercial application of TSRFCC-I technology In 1994, the TSRFCC technology [5-7] was proposed by the State
Key Laboratory of Heavy Oil Processing, University of Petroleum (East China), and was put into industrial test in 2002 at a revamped unit of 100 thousand ton/year capacity. As yet, there are four RFCC units to be modified by the TSRFCC-I technology, including Shenghua refinery, University of Petroleum (East China), Huabei Petrochemical corporation, Liaohe Petrochemical corporation and Changqing Petrochemical corporation.
In 2002, the TSRFCC-I technology was firstly tested in the distillate FCC unit of 100 thousand ton /year capacity, the product distribution comparison of TSRFCC-I process and the conventional OSRFCC before revamping is listed in table 1 with the same FCC feed and catalyst conditions. TSRFCC-I technology increases the yield of desired products, does 3.62 percents for light oil (gasoline and diesel oil) and 2.08 percents for total liquid products. The product distribution is improved obviously, that is, the yield of dry gas and coke decreases 2.08 percents, and the yield of diesel oil increases 3.55 percents. The production capacity is increased over 30%, it imply that the TSRFCC-I has the higher activity of catalyst and the selectivity of product than the OSRFCC process. In addition, the olefin content of gasoline reduces by 7 percents, the cetane number of diesel oil increases 3 units, the sulfur content of light oil decreases by 20-30%, and the reserve stability of gasoline and diesel oil is improved obviously.
Table 2 Product distribution (wt%), Changqing refinery
LPG gasoline diesel oil Decanted oil Dry gas
*Statistically average of the first season 2003 14.37 38.46 32.61 0.56 4.4
**Calibration on 30-31 July 14.54 34.41 38.01 0.0 4.2
coke losses Light oil Desired product
Liquid yield
*Statistically average of the first season 2003 8.6 1 71.07 85.38 85.94
**Calibration on 30-31 July 8.3 0.55 72.42 86.96 86.96
*OSRFCC process; **TSRFCC-I process
In July, 2003, the product distribution result of TSRFCC-I process, Changqing petrochemical corporation, PetroChina, was obtained through calibration. Because the yield of distillates in atmospheric distillation tower increases by 2 percents, this unit processes the atmospheric residue with a higher carbon residue by 0.3-0.5 percents than one used before revamping. The microactivity of catalyst is 52-53, it is 58-60 before revamping. Under the so unfavorable operation conditions for TSRFCC, the comparison of product distribution between TSRFCC-I and OSRFCC was shown in table 2. The yield of diesel oil increases by 5.4 percents, the yield does by 1.35 and 1.58 percents respectively for light oil and the desired product, and the yield of dry gas and coke decreases by 0.95 percents. By the way, the diesel distillate from FCC process is an important product in China, the ratio of diesel oil to gasoline increases from 0.85 to 1.10 by the revamping with TSRFCC-I technology.
In Liaohe Petrochemical Corporation, the key of the RFCC unit running effectively is to produce the low olefin content gasoline according with the specification of GB 17930-1999. The RFCC unit was revamped using TSRFCC-I technology in May 2003. As shown in table 3, the output data were compared before and after revamping at the same operation scheme. The olefin content of gasoline decreases from 37.5v% to 33.5v%, satisfies the requirement of olefin content specification in GB 19730-1999. The yields of light oil and the desired product increase by 2.36 percents and 3.42 percents respectively, and the yield of coke and dry gas decreases by 2.9 percents. The latest output data of TSRFCC-I technology shows that the product distribution is better for producing low olefin gasoline than the best data before revamping and without considering the reduction of olefin in gasoline. Table 3 Product distribution (wt%), Liaohe Petrochemical Corp
LPG gasoline Diesel oil
Dry gas + coke
*Statistically average in December 2002 12.41 41.70 26.84 16.70
**Statistically average in June 2003 13.48 39.25 31.65 13.80
Light oil Desired product
Liquid yield
Olefin content of gasoline,v%
*Statistically average in December 2002 68.54 80.95 83.30 37.5
**Statistically average in June 2003 70.90 84.38 86.20 33.5
*OSRFCC process; **TSRFCC-I process
Conclusions Compared with the conventional OSRFCC process, TSRFCC
technology has great advantages in increasing the yield of desired product, improve the product distribution and product quality for distillate FCC or RFCC.
Acknowledgement. Thanks PetroChina for their financial Support. Thanks Feng Du, Zhong-xiang Han, and Jin-you Wang for their work in this project. References (1) Hou Fusheng. Petroleum Processing and Petrochemicals. 2001, 32(1):1-6 (2) Miao Yi, Guan Minghua, Luo Yibin. Petroleum Processing and Petrochemicals. 2000, 31(8):1-7 (3) Xie Chaogang, Zhong Xiaoxiang, and Yang Yinan. Petroleum Processing and Petrochemicals. 2001, 32(1):26-30 (4) Jun-wu Chen and Han-chang Cao, Catalytic Cracking Technology and Engineering, SINOPEC Press, 1991. (5) Zhang Jianfang, Shan Honghong, and Yang Chaohe. US Patent, 2002, Application Number: 0108887A1 (6) Zhang Jianfang, Shan Honghong, and Yang Chaohe. Chinese Patent, 2002, Application Number: 00134054.9 (7) Zhang Jianfang, Shan Honghong, and Yang Chaohe. Ninth Annual Conference of Catalytic Cracking. 2002.11, Guangzhou
Discussion on the shortcoming of conventional RFCC riser reactor
Chao-He Yang, Hong-Hong Shan, Jian-Fang Zhang
Yu-Dong Sun, Feng Du
State Key Laboratory of Heavy Oil Processing University of Petroleum, Dongying, 257061, P. R. China
Introduction
In petroleum refining industry, the fluid catalytic cracking (FCC) process is one of the most important processes converting heavy oil into light products. Especially in China, it affords about 80% of gasoline and 30% of diesel oil in market. So increasing the yield of desired products and improving the product distribution is the eternal aim pursued by researcher and engineer in this field. But now it is faced with another baptism to satisfy the need for producing e n v i r o n m e n t a l l y - c l e a n e r g a s o l i n e a n d d i e s e l f u e l s .
During the recent decade, most FCC processes were revamped into the RFCC (residue fluid catalytic cracking) processes for processing the heavier and heavier feedstock. According to the intuitive knowledge on the disadvantages of conventional FCC reactor, RFCC technology have been got great development around the reaction system, including the feeding atomization (nozzle), quick separation of oil vapor and spent catalyst, steam stripping of high efficiency, temperature control of reaction, as well as the innovation of riser reactor [1-3]. Except for the downer riser technology [4-7] and MSCC technology [8], the studies on the reactor technology of RFCC is scarce. In order to promote the progress of RFCC technology, it is much important to understand the shortcoming of the conventional riser reactor. This problem was discussed in this paper according to the experimental results, industrial test data, as well as literature information. Experimental
Most researches about the reaction characteristics of RFCC were completed in the fixed fluidized-bed reactors, or with the small riser or downer reactor in laboratory. Because of the complex physical and chemical phenomena occurring in the RFCC reactor, the results obtained in laboratory only afford the limited information about the real situation in commercial unit. For understanding the reality occurring in industrial RFCC riser reactor, a special sampling system was developed, and the treatment and analysis procedure was established. The flow chart of the modified sampling system as shown in figure 1 includes tube sampling probe for catalyst and product (8), the small cyclone for the partial separation of catalyst and oil vapor (2), two stages of cooler of product oil vapor (3A and 3), two liquid product collectors (4A and 4), the wet gas meter for measuring the volume of the noncondensable gas (6), and the gas sample bag for analyzing the composition of the noncondensable gas product (7). The samples obtained from the riser consisted of gas, light liquid, heavy liquid product, and oily catalyst. The gas and liquid were handled and analyzed in a manner to determine their weights and composition. The oily catalyst was treated with different methods including the steam stripping and solvent extraction. The safety measures to be used in the sampling process using this sampling system refers to the previously published papers [9-10]. The sampling work was done in RFCC units of Shengli Petrochemical Factory and Qingdao Petrochemical factory, the sampling points on RFCC riser were selected in terms of the real situation of industrial unit and shown in figure 2.
Figure 1. Flow chart of the sampling system for RFCC riser
Figure 2. Illustration of sampling points on RFCC riser Results and Discussion
From the literature, experimental results, and the sampling research of industrial RFCC units, at least three defects could be realized, that is, too long reaction time, too low average activity of catalyst, and the harmful competition of different reactants. These defects resulted in the worse product distribution and the lower once-through conversion.
Too long reaction time. Although the feedstock of RFCC is different from that of distillate FCC because of its high boiling point, high resin and asphaltene content, and high contaminant concentration, the riser reactor is the same for most RFCC with FCC process yet. In general, the distillate FCC is thought to be a gas-solid catalytic reaction, but gas, liquid, and solid exist simultaneously in reactor for RFCC. In catalytic cracking, the chemical bond rupture should mainly occur in the paraffin and naphthene hydrocarbons, the side chains of benzene ring, and the bridge bond between two cyclic structures. The larger the molecule of reactant is, the easier the cracking reaction happens, so the RFCC feedstock is easier to be cracked than distillate feedstock, then the RFCC process should need a shorter reaction time than the distillate FCC. This viewpoint has been accepted in petroleum refining for a long time, so the quick separation of oil vapor and spent catalyst, temperature control of riser reactor, and the MSCC technology were developed, and the downer reactor has been researching.
Gao Yongcan[11] studied the thermal and catalytic cracking of VGO mixed with some AR and VR with ACE-Model-R small fixed fluidized-bed reactor, Xytel corporation. The reaction time, catalyst/oil ratio, and temperature are considered for their contribution to thermal and catalytic reaction, it is concluded that the
short contact time of oil and catalyst may suppress the detrimental thermal cracking reaction obviously.
The riser of 60×104t/a RFCC unit in Shengli Petrochemical Factory is 48 m long, the studies on product distribution along the riser of RFCC show that the main conversion of feedstock to gasoline and diesel distillates is completed in the front stage of riser [12]. At 1# sampling point (Figure 2(A)), only 0.5m from the feedstock nozzles, about 60% feedstock was converted into diesel and lighter compounds, the conversion of feedstock reaches about 80% at 2# sampling point. Figure 3 describes the variation of product distribution along the riser length of the RFCC unit. It means that the riser is too long to result in an ideal product distribution at the exit of riser.
Figure 3. Conversion of feedstock and yields of products versus the length of riser (Simulated result of commercial RFCC unit [13])
0 5 10 15 20 25 30 35 40 45 500
20
40
60
80
100
Gasoline Yield Diesel Oil Yield Heavy Oil Yield
Riser Height, m
Yiel
d of
Pro
duct
s, %
Figure 4. Product yields varies along the riser height
Fortunately the sampling work was perfectly completed in
Qingdao Petrochemical Factory. The material balances at every sampling point (Figure 2(B)) were made in terms of gases and liquid products collected in sampling process, as well as the oil absorbed in oily catalysts. The product distribution at different sampling positions was shown in figure 4. The gasoline yield reaches its maximum point at the middle of riser, but the yield of diesel oil reaches its maximum point at the initial stage of riser. The remaining heavy oil (>350°C) deceases along the riser at the bottom of riser, but has no notable change at the later half of riser. In another words, the change of product distribution is drastic in the initial stage of riser and tempered at the later half of riser. In the initial stage of riser, the heavy oil yield decreases from 90m% in feedstock to 28.9m% at the first sampling point (3.8m apart from the nozzles), and nearly 60m%
of feedstock are converted into gasoline, diesel oil, gaseous product and coke. This points again that the initial stage play a very important role in RFCC processing, and improving the contacting situation of feedstock with regenerated catalyst is a key method to get satisfied product distribution and maximum refinery profit.
From the results mentioned above, a much short reaction time than the present one (about 3 seconds) is enough for the RFCC riser to complete the conversion of heavy oil into diesel and gasoline distillates, gas and coke. For distillate FCC process, the same viewpoint would be derived from the previous researches. With a continuous, isothermal wall, transfer line catalytic cracking reactor, Paraskos and Shah[14] studied the FCC reaction of mid continent gas oil at the catalyst/oil ratio of 4~8 and temperature of 510~538°C. The conversion of mid continent gas oil into gasoline, gas and coke was plotted with the contact time of oil and catalyst in reactor as shown in figure 5, the contact time is calculated based on zero conversion of gas oil. Before 3 seconds of contact time, the conversion increases quickly, and then closes to a stable level. It could be deduced that 2 seconds of real contact time of oil vapor and catalyst is enough to convert gas oil into gasoline, gas and coke. In china, the diesel distillate in FCC process is also the desired product, a shorter reaction time than 2 seconds should be employed.
00.10.20.30.4
0.50.60.70.80.9
0.0 2.0 4.0 6.0 8.0 10.0
Contact time, s
Frac
tiona
l con
vers
ion
Figure 5. Conversion versus contact time in pilot apparatus
Figure 6. Conversion versus contact time in commercial FCC unit
In a commercial FCC riser of 30 meters long, the sampling was
done by Shah and Huling [15] through an open pipe probe using a specialized sampling technique at three probe positions: 8.8, 15.0, and 23.8 miters from the bottom of the riser. In this study, the feedstock is the blend of atmospheric gas oil and vacuum gas oil, the desired product is gasoline, the operation conditions is 6.6~7.1 for catalyst/oil ratio and 480-520°C for reaction temperature. According to the material balance at every sampling point, the similar
relationship between conversion of gas oil and the contact time was obtained as shown in figure 6, the conversion of gas oil cracking increases quickly at the initial stage of riser, and then slowly. It is shown again that the cracking reaction in FCC process occurs at the initial stage of riser.
For distillate FCC process and RFCC process, the conversion of feedstock into desired product is completed in very short time at the bottom of riser reactor, especially the diesel distillate is produced as a desired product in China. If the contact time is too long, the overcracking of diesel and gasoline is inevitable.
Low catalyst activity and poor selectivity. In FCC process, thermal cracking and catalytic cracking exist simultaneously, what is the dominant one depends on the catalyst properties and operation conditions (reaction temperature, catalyst/oil ratio, contact time). The catalytic cracking is the desired reaction for its good product selectivity. Too long contact time and too high reaction temperature will accelerate the thermal cracking, and lead to excessive light gas yield and lower desired product value. At the proper reaction temperature and contact time, the catalyst properties, especially the microactivity, is the key to intensify the catalytic cracking.
Figure 7. Effect of coke deposition on thermal cracking and catalytic cracking [11]
Gao Yongcan[11] gave the effect of coke deposition in catalyst on thermal cracking and catalytic cracking as shown in figure 7. In figure 7, Cs is the coke content of catalyst (mg coke/ g catalyst); kc is the overall reaction rate constant, represents the catalyst activity; and R is the ratio of (C1+C2) to i-C4, the criterion of thermal cracking and catalytic cracking. With the increase of coke deposition on catalyst, the catalyst activity decreases gradually, the thermal cracking becomes more and more dominant, so the catalyst selectivity to desired product lowers.
0. 0
0. 5
1. 0
1. 5
0 10 20 3Riser length, m
coke
yie
ld, w
t%
0 0 5 10 15 20 25 30 350
10
20
30
40
50
60
Figure 8. Coke content of catalyst versus riser length in commercial test [15]
For a commercial gas oil FCC process, Shah and Huling [15]
obtained the curve of coke content of catalyst along the riser length through the in situ sampling at different position. From figure 8, coke
content of catalyst increases rapidly to a stable value at the front section, and then has no obvious change in the rear end of riser. According to the report from Gao Yongcan[11], the catalyst activity will decrease quickly to a low level, and the thermal cracking become a more important reaction at the rear end of riser.
For commercial RFCC process, the changes of catalyst activity with riser length were obtained through the sampling work in Shengli Petrochemical Factory and Qingdao Petrochemical Factory. Figure 9 shows the curves of activity varying with riser height. In figure 9A, the catalyst activity falls down to a low level at the mixing zone of regenerated catalyst and feedstock, then increases slightly to a maximum, finally decreases gradually again. The average microactivity of catalyst in riser reactor is about 50% of the regenerated catalyst. In figure 9B, the microactivity of catalyst decreases to a stable value, and then maintain the level, no maximum exist. The average microactivity of catalyst in riser reactor is only 40% of the regenerated catalyst. Although the feed properties and the operation conditions influence the detail of activity evolution along the RFCC riser, the common result is the drastic fall of catalyst microactivity at the initial stage, the subsequent reactions in riser occur in the catalyst with low activity and poor selectivity.
Therefore, increasing the average microactivity of catalyst in RFCC riser reactor and improving its selectivity is one of the key problems to develop the new RFCC technology.
Figure 9. Catalyst microactivity versus riser length for RFCC units
Mic
roac
tivity
, wt%
Riser Height, m
Oily Catalyst Extraction with n-C5H12 Extraction with n-C5H12
& CCL4-C2H5OH(1:1)
0
10
20
30
40
50
60
0 5 10 15 20 25 30 35 40 45 50Riser Height, m
Mic
roac
tivity
, wt%
A: Shengli Petrochemical Factory
B: Qingdao Petrochemical Factory
Harmful competition of different reactants. In RFCC process,
always there is the recycle oil to be piped into the riser reactor from the bottom of RFCC fractionation tower. The ratio of recycle oil to fresh feed is 0.1~0.8 depending on the feed properties and the
product scheme. The RFCC feedstock has a lot of heavy component with high boiling point, difficult to gasify and move into the interior surface of catalyst, but easy to subject to cracking reactions. Compared with the former, the recycle oil, mainly consisting of aromatics, has a narrow boiling range, so it is easier to gasify and move into the interior surface of catalyst, more difficult to react continuously. In the conventional RFCC process, the fresh feed and the recycle oil exist in one reactor, competition of adsorption on catalyst and chemical reaction will reduces the conversion of fresh feed and results in the unsatisfactory product distribution. So the ideal technology should make the fresh feed and the recycle oil to react respectively in two reactors with different conditions.
9.98
38.58
35.28
7.96 8.2
7. 59
45. 86
28. 3
8. 110. 15
05
101520253035404550
LPG Gasol i ne Di eseloi l
Decant edoi l
Coke andgas
Yiel
d, w
t%
Feedi ng r espect i vel ymi xed f eedi ng
Figure 10. Influence of competition on FCC product distribution
A set of commercial distillate FCC data were shown in figure 10,
the Feeding respectively presents the fresh FCC feed and the recycle oil to be injected into two different riser reactor at the different reaction conditions, and the Mixed feeding does the fresh FCC feed and the recycle oil to be injected into one riser reactor as a mixture. Compared with the conventional feeding, the feeding respectively can increase the conversion, obviously increase the ratio of diesel oil to gasoline, and decrease the yield of coke and dry gas. Conclusions
From the literature, experimental results, and the sampling research of industrial RFCC units, three defects, that is, too long reaction time, too low average activity of catalyst, and the harmful competition of different reactants, were proposed and discussed. These defects resulted in the worse product distribution and the lower once-through conversion.
Acknowledgement . This study was Supported by the Ministry of Education, PetroChina and Sinopec. Thanks Gen-lin Niu, Zhong-xiang Han, De-lian Lin, and Jin-you Wang for their work in this project. References (1) Hou Fusheng. Petroleum Processing and Petrochemicals. 2001, 32(1):1-6 (2) Miao Yi, Guan Minghua, Luo Yibin. Petroleum Processing and Petrochemicals. 2000, 31(8):1-7 (3) Xie Chaogang, Zhong Xiaoxiang, and Yang Yinan. Petroleum Processing and Petrochemicals. 2001, 32(1):26-30 (4) Vogiatzis A L. AIChE Symp. Series: Fluidization and Fluid − Particle Systems − Fundamental and Application, 1989, 85(270):69-76
(5) J. A. Talman, R. Gerier, L. Reh. Chemical Engineering Science, 1999, (54):2123-2130 (6) Ali G Maadhah, Mohammed Abul-Hamayel, Abdullah M Aitani, et al. Oil & Gas Journal, 2000, 99(33):66-70 (7) Deng Xin. Research on downer reactor in catalytic pyrolysis and catalytic cracking, Doctoral thesis, Tsinghua University, 2001 (8) Kauff D, Bartholic D, Steves C, et al. Successful application of the MSCC process. NPRA Annual Meeting, San Antonio, 1996 (9) Xu Chun-ming, Lin Shi-xiong, Lu Liang-gong. Petroleum refinery engineering. 1997, 27(3), 39-42. (10) Xu Chun-ming, Lu Liang-gong, Lin Shi-xiong. Journal of the University of Petroleum, China. 1997, 21(2), 72-75. (11) Gao Yongcan, Zhang Jiushun. Journal of Chemical Industry and Engineering (China), 2002, 53(5):469-472 (12) Niu Genlin, Yang Chaohe. Journal of Fuel Chemistry and Technology. 2002, 30(3):249-253 (13) Dong Wei. Modelization for the processes in Heavy Oil Catalytic Cracking Riser Reactors and Its Application, Doctoral thesis, University of Petroleum, China, 2001 (14) Paraskos J A, Shah Y T, Mckinney J D, et al. IEC Process Des. Dev., 1976, 15(1):165-169 (15) Shah Y T, Huling G P, Paraskos J A, et al. IEC Process Des. Dev., 1977, 16(1):89-94
RESIN-ASPHALTENE INTERACTIONS IN VIRGIN AND CRACKED BITUMEN
Parviz M. Rahimi1, Irwin Wiehe2, David Patmore1, Alem
Teclemariam1, and Theo deBrujin1
1National Centre for Upgrading Technology (NCUT), 1 Oil Patch Drive, Suite A202, Devon, Alberta T9G 1A8 Canada
2Soluble Solutions, 3 Louise Lane, Gladstone, NJ 07934 USA Introduction
The colloidal stability of petroleum can alter significantly as a result of physical or chemical treatment. During crude oil production changes in pressure and temperature can result in asphaltenes precipitation. Addition of diluent or natural gas condensate to crudes to produce piplineable crudes may result in asphaltenes separation and precipitation. To produce synthetic crudes from heavy oils and bitumen these feedstocks have to be upgraded through thermal and catalytic processes resulting in colloidal instability leading to precipitation of asphaltenes. Composition of petroleum particularly the chemical composition of dispersed phase (soluble in n-paraffin) and the peptizing power of the resins plays major role in stabilizing of asphaltenes (1-2). It has been suggested that the resins attach to the asphaltenes provide a steric stabilization and prevent asphaltenes flocculation. Although this qualitative interaction between resin and asphaltenes can be determined by spectroscopic techniques, quantifying it is rather difficult. For this reason, model resins such as alkylbenzene-derived amphiphiles have been used to study the effectiveness of these compounds as asphaltenes stabilizer. A steric stabilization mechanism has been provoked in which amphiphiles adsorbed on the asphaltenes surface and reduce the chances for further asphaltenes-asphaltenes interaction (3).
It is generally accepted that the role of resin in petroleum is to stabilize asphaltenes. However, the mechanism of stabilization is not clear. Although a steric stabilization of resins has been suggested (4), adsorption of multilayer resins on the surface of asphaltenes has been reported (5). More recently León et al., reported the adsorption of native resins on asphaltenes particles (6). Adsorption isotherms of two resins on two different asphaltenes were studied using UV-vis spectrophotometric technique. At the same time the stabilizing power of resins were compared with the known amphiphiles as asphaltenes stabilizer such as nonylphenol. It was shown that resins adsorb and form a multi layer structure on the surface of asphaltenes. Also, when resins were added to the asphaltenes sample immersed n-heptane, a volumetric expansion in asphaltenes was observed that indicated resins penetrated into the microporous structure of asphaltenes. Comparing the stabilizing power of amphiphiles with native resins, it was shown that at the same equilibrium concentration the native resins adsorb in a lower amount than amphiphiles. However, some native resins were capable in dissolving more asphaltenes and were more effective as asphaltenes stabilizer. Based on these results the authors proposed a model for asphaltenes stabilization by resins. According to this model, 1) resins are first adsorb on the surface of asphaltenes; 2) the resins penetrate into the microporous structure of the asphaltenes; 3) breaking microporous of asphaltenes by reins and 4) diffusion of asphaltenes-resins particles in the solvent.
In another study by Wang and Buckley the role of resin in stabilizing asphaltenes was investigated (7). These authors concluded that the role of resin to improve asphaltenes stability is more than just
changing the solvent properties. However, there was no evidence of specific interaction between the resins and asphaltenes in this study. Recently González et al., studied the electric characteristic charge of asphaltenes in different solvents. It was shown although asphaltenes dispersed in water showed negative electrophoretic mobility but in organic solvent the mobility was positive (8). Moreover, the addition of resins did not change the electrophoretic mobility and resulted in coprecipitation with asphaltenes i.e., resins failed to stabilize asphaltenes dispersions. The authors concluded that the interaction between asphaltenes and resins exist through some sort of binding interaction (acidic groups) rather that adsorption and this type of interaction does not provide stability to asphaltenes dispersions.
The objective of the present work was to investigate the effectiveness of resins obtained from Athabasca bitumen on stability of thermally cracked bitumen containing unstable asphaltenes prone to precipitation.
Experimental. Athabasca bitumen was subjected to thermal cracking under different severities. Detailed experimental procedure can be found elsewhere (9). For the purpose of the current research we selected a visbroken product that was obtained at a relatively high severity (pitch conversion of 42wt %) and the asphaltenes in this liquid was considered to be relatively unstable.
The resin from Athabasca bitumen was obtained from the +524°C fraction of Athabasca bitumen using a modified ASTM D-2007. In this procedure C7 asphaltenes were first precipitated and the heptane solubles maltenes were separated into saturates aromatics and resins. For comparison, the visbroken product was also separated into C7 asphaltenes, saturates, aromatics and resins. The yields of these products are shown in Table 1.
Table 1- SARA analysis of Athabasca bitumen and visbroken products
To determine the effectiveness of resins on the stability of visbroken products (VBL), the solubility parameters of VBL as well as those containing different concentration of resins were determined using Wiehe’s procedure (10). In this procedure the insolubility (IN) and solubility blending (SBN) numbers are determined based on n-heptane toluene scale. Similarly, the additions of resins to Athabasca bitumen at different resins concentrations were examined. Results and Discussions
In the present work the effect of resins separated from Athabasca bitumen was investigated on the stability of unstable asphaltenes present in visbroken liquids (VBL) and on a stable asphaltenes present in Athabasca bitumen. The effectiveness of the resins on asphaltenes stability is shown in Table 2. In this table we report the solubility blending numbers and the P-values (SBN/IN) as function of resins concentration. The resin concentration changed from 0-20 wt% for both visbroken liquid and Athabasca bitumen. As shown in
Table 1, the visbroken liquid contains approximately 19 wt% C7 asphaltenes and 21 wt% saturates that can act as non-solvent reducing the effectiveness of asphaltenes in stabilizing asphaltenes. Addition of resins to stable Athabasca bitumen which already contains 37 wt% resins had similar effect and resulted in further stabilization of asphaltenes. Table 2 - Effect of resins on stability of asphaltenes
In previous work we reported the effect of deasphalted oil
(DAO) obtained from Athabasca bitumen on the stability of VB (11). It was shown that the C7 DAO containing approximately 70wt% polar fractions was only effective in stabilizing VB products at a relatively high concentration. By addition of about 30wt% C7 DAO to VB the stability index as determined by the ratio of IN/SBN = P-value increased from 1.18 to 1.56.
The effectiveness of a synthetic amphiphile such as DBSA on unstable asphaltenes of visbroken liquid and stable asphaltenes of Athabasca bitumen were investigated and compared with the natural resin. The results are shown in Table 3. Table 3 - Effect of DBSA on stability of asphaltenes
Although the dispersing asphaltenes additives such as DBSA are used in petroleum industry at low concentration, for comparison, in this work we used similar concentrations with natural resins. The data indicate that the addition of 0.5 wt% DBSA was somewhat was effective in further stabilizing the stable asphaltenes in AB and addition of more additive up to 10wt% did not improve stability significantly. In contrast, DBSA was more effective in stabilizing the unstable asphaltenes in visbroken VBL at similar concentrations.
Overall the activity of natural resins to stabilize asphaltenes stability was higher compared with DAO but was significantly lower than expected. The mechanism of stabilization of asphaltenes through steric or salvation model was discussed earlier (11). Since it is expected that unlike synthetic amphiphiles resins and DAO contain molecules with a relatively short chains the improvement in asphaltenes stability may be through mechanism discussed in introduction postulated by León et al., (6). Conclusions
From the experimental results of this work it is evident that natural dispersants including DAO and resins are not as effective for asphaltenes stabilization as previously thought and significantly lower than synthetic amphiphiles. This result further questions the validity of using synthetic amphiphiles such as DBSA as a model for resins. Acknowledgement. Partial funding for NCUT has been provided by the Canadian Program for Energy Research and Development (PERD), the Alberta Research Council (ARC) and the Alberta Energy Research Institute (AERI).
References 1- León, O., Rogel, E., Espidel, J. and Torres, J. Energy Fuels 2000, 14, 6. 2- Taylor, S.E., Fuel 1988, 77, 821. 3- Chang, C. L. and Fogler, H.S., Langmuir 1994, 10, 1749. 4- Leontritis, K.J. and Mansoori, G. A., SPE International symposium on oil field chemistry, San Antonio, TX, 1987, SPE 16258. 5- Acevedo, S., Escobar, G., Ranaudo, M. and Gutierrez, L. B., Fuel, 1994, 73, 1807. 6- León, O., Contreras, E., Rogel, E., Dambakli, G., Acevedo, S., Carbognani, L. and Espidel, J., “Adsorption of native resins on asphaltene particles: a correlation between adsorption and activity”, Langmuir 2002, 18, 5106 – 5112 7- Wang, J. and Buckley, J.S., “Asphaltenes stability in crude oil and aromatic solvents-The influences of oil composition”, Energy & Fuels, 2003, 17, 1445-1451. 8- González, G., Neves, G.B.M., Saravia, S.M., Lucas, E.F., and Anjos de Sousa, M., “Electrokinetic characterization of asphaltenes and the asphaltenes – resins interaction”, Energy & Fuels, 2993, 17, 879-886. 9- Rahimi, P.M. and Parker, R.J., “Stability of visbroken products obtained from Athabasca bitumen for pipeline transportation”, Preprint, Division of Petroleum Chemistry, San Diego, April 1-5, 2001, Vol. 46, No. 2, 95-98. 10- Wiehe, I.A. and Kennedy, R.J. “The oil compatibility model and crude oil incompatibility”, Energy&Fuels, 14, 2000, 56-59. 11- Rahimi, P.M., Teclemariam, T., Patmore, D., Wiehe, I.A., Schabron, J. and de Bruijn, T. “The effectiveness of deasphalted oil in the stability of visbroken bitumen”, Preprint, Division of Petroleum Chemistry, Anaheim, March 28-April 1, 2004, Vol. 49, No. 2, 147-149
and Haruo Kumagai2 1National Institute of Advanced Industrial Science and Technology (AIST), 16-1 Onogawa, Tsukuba, 305-8569, Japan 2Hokkaido University, Kita-ku, Sapporo, 060-8628, Japan Introduction
, Graff and Brandes1,2 reported that the treatment of Illinois No.6 coal with 50atm of steam at 340-350°C increased the pyridine extraction yields from 17% for the raw coal to about 30%. Steam treatment of Wiodak coal at 200 °C increased the toluene-solubles conversion in liquefaction at 400°C from 27.3% to 38.4%.3 However, there are several papers showing that water treatment gave no benefits. Khan et al.4 reported that steam treatment of Illinois No.6 coal at 330 °C gave only a very small increase in total volatiles of rapid steam pyrolysis, unlike the great increase in total volatiles and tar obtained by Graff and Brandes.1,2 Ross and Hirschon5 reported that water treatment of Illinois No.6 coal at 250 °C did not increase toluene solubles in liquefaction in tetralin, though S/C atomic ratio and ash content decreased greatly due to the conversion of pyrite to water soluble sulfate. In the previous paper6 we have studied on the effect of water treatment on coal extraction yields of Argonne Premium coals, Pocahontas No. 3 (PO), Upper Freeport (UF), and Illinois No.6 (IL) coals. All the coals used show that the water treatments at 600 K increased the extraction yields greatly in the extractions with a 1:1 carbon disulfide / N-methyl-2-pyrrolidinone (CS2 / NMP) mixed solvent, NMP, or 1-methylnaphthalene (1-MN). While, the water treatments at 500 K, and the heat treatments at 600 K without water gave little increase in the yields. It was concluded that the loosening of π−π interactions and hydrogen bonds are responsible for the yield enhancements of PO and UF. While, the yield enhancements of IL may be due to the removal of oxygen functional groups, in addition to the loosening of hydrogen bonds. In this paper water treatment of Beulah-Zap lignite was investigated. Experimental Coal Samples. Argonne Premium Beulah-Zap lignite (BZ) with particle size under 100 mesh were used after they were dried in vacuum at 353 K overnight. Water Treatment. Water treatment of BZ was carried out using a 50 ml autoclave at 500 and 600K. In each run, 10 g of BZ and 20g of water were put into the autoclave, purged with nitrogen three times, and finally pressurized with nitrogen to about 1 Kg/cm2 at room temperature. Then the autoclave was heated to a fixed temperature at about 10 K/min under stirring at 500 rpm. After the treatment for 1 h the autoclave was cooled down rapidly by immersing in an ice/water bath. The coal/water mixture was filtered, and the treated coal was dried in vacuum at 353 K overnight. The work up of the treated samples including the filtration was carried out without any protection to oxygen exposure. The heat treatment in the absence of water was also carried in the same way as the water treatment. Characterisation of Water-Treated BZ. FT-IR spectra were measured by a diffuse reflectance method. The difference spectra between raw and treated coal were obtained using the absorption of C=C bond stretching of aromatic rigs at 1610 cm-1 as a standard peak.
Extraction yield of the treated coals with CS2/NMP mixed solvent (1/1 by volume) was determined at the room temperature extraction under ultrasonication, as described previously.7 Extraction with NMP or 1-methylnaphthalene (1-MN) at 633 K was carried out
using a flow-type extractor at various temperatures. The extraction yield was calculated on a dry ash-free basis from the weight of the residue.
Swelling ratio, Q, was determined in methanol by the volumetric method by Green and Larsen.8 Equilibrium swelling ratio was determined from Q when the change in Q became within 2% variation, and it took 12 – 48 h, depending on the sample and solvent.
Dynamic viscoelastic measurement was carried out using a rheometer, Rheometrics ARES 2K-STD. The coal pellet was heated at a rate of 3 K/min from 573 to 823 K under nitrogen flow, and tan δ, i.e., the ratio of viscous modulus (G’’) to elastic modulus (G’), was determined.
Results and Discussion Weight Loss, and Ultimate and Proximate Analysis. The weight losses accompanying the water treatments of BZ at 500 and 600 K for 1h were 5.5 and 8.9 wt %, respectively. In Table 1 the results of ultimate and proximate analysis are shown. The water treatment at 600K decreased oxygen and VM % due to the loss of oxygen functional groups. Table 1. Ultimate and Proximate Analyses of the Water Treated
a by difference FT-IR Spectra. Figure 1 shows IR spectra of raw and treated coal, and the difference spectra (“water-treated coal” – “raw coal”). The difference spectra show the large decrease in the absorption of hydrogen bonded OH, in agreement to the decease in O %. The decrease in the amount of absorbed water for the treated coal during the IR measurement may be also partly responsible. Extraction Yield. Table 2 shows that the water treatments at 600 K increased the extraction yield with CS2/NMP mixed solvent at room temperature by 16.2 %. While, the water treatments at 500 K or the heat treatments without water at 500 and 600 K resulted in a decrease or an only small increase in the extraction yield. Table 3 shows the results for the extraction with NMP and 1-MN. NMP room temperature extraction yield increased from 3.4 % to 9.8 % by the water treatment, but at 633 K extraction the water treatment did not increase the yield, suggesting that the benefit of the water treatment was lost at thigh temperature extraction. 633 K 1-MN extraction shows that the benefit of the treatment was also lost.
Figure 1. IR spectra of the raw and water-treated BZ coal, and the difference spectrum, in which the spectrum of the treated coal was subtracted from that of the raw coal.
Table 2. Extraction Yields of Water and Heat Treated BZ Coals with CS2/NMP Mixed Solvent
600 9.7 a under ultrasonication at room temperature Table 3. Extraction Yields of Water and Heat Treated BZ Coals with NMP and 1-MN
treatment extraction extracton yield (wt%)
solvent room temp.b 633Kc
raw coal NMP 3.4 30.5
water NMP 9.8 30.4
raw coal 1-MN – 28.8
water 1-MN – 15.2 a 600K, 1h, b under ultrasonication, csolvent- flow extraction Swelling Ratio and Dynamic Viscoelasticity. Equilibrium Q value in methanol increased by the water treatment at 600 K to 1.18 from 1.02 of the raw coal, suggesting that crosslinking network became loosened by the treatment. In dynamic viscoelasticity measurement the increase in tan δ indicates the increase in molecular and/or segmental mobility. Tan δ of BZ coal treated with water at 600 K was found to be higher than that for the raw coals at the temperature range from 150 to 300 K. While, above 300 K tan δ of the treated coal is lower than the raw coal, suggesting that at high temperatures the benefit for the water treatment was lost, in
agreement to the extraction results, though characteristic temperature ranges are different probably due to the difference in the heating rate.
5001000150020002500300035004000
-0.2
-0.1
0
0.1
0.2
0.3
0.4
0.5
Abs
orba
nce
Wavenumber(cm -1 )
raw coal
water-treated coal
difference
Mechanisms of the Water Treatment. Like PO, UF, and IL coals, the water treatments of BZ lignite at 600 K increased the extraction yields, but the water treatments at 500 K, or the heat treatments at 600 K without water gave little increase in the yields. Swelling degree in methanol and toluene increased by the water treatment at 600 K, suggesting that cross-links become loosened by the treatment. The decrease in IR absorbance of hydrogen-bonded OH indicates that the loosening and/or breaking of hydrogen bonds is responsible for the extraction yields enhancements, like IL coal. The result that the benefit of the water treatment was lost at 633 K NMP and 1-MN extractions can be explained from that at high temperature extractions almost all the hydrogen bonds were broken resulting in little difference between the treated and raw coals. In addition to the hydrogen bond loosening described above, the removal of oxygen functional groups is considered to be also responsible for the extraction yields enhancements by the water treatments. Conclusions The effect of water treatment at 500 and 600 K on solvent extractions of Beulah-Zap lignite (BZ) was investigated. The water treatments at 600 K increased the extraction yields greatly in the extractions with 1:1 carbon disulfide / N-methyl-2-pyrrolidinone (CS2 / NMP) mixed solvent. While, the water treatments at 500 K, and the heat treatments at 500 and 600 K without water gave little increase in the yields. The decrease in O % and hydrogen-bonded OH suggests that the removal of oxygen functional groups such as breaking of ether bonds and the breaking of hydrogen bonds are responsible for the extraction yield enhancements.
Acknowledgement. This work was supported by “Research for the Future ” project of the Japan Society for the Promotion of Science (JSPS). References (1) Graff, R. A.; Brandes, S. D. Energy Fuels 1987, 1 , 84. (2) Brandes, S. D.; Graff, R. A.; Gorbaty, M. L.; Siskin, M. Energy Fuels, 1989, 3, 494. (3) Bienkowski, P. R.; Narayan, R.; Greenkorn, R. A.; Chao, K. Ind. Eng.Chem.Res. 1987, 26, 202. (4) Khan, M. R.; Chen, W.; Suuberg, E. Energy Fuels, 1989, 3, 223. (5) Ross, D. S.; Hirschon, A. Prepr. pap.-Am. Chem. Soc., Div. Fuel Chem. 1990, 35(1), 37. (6) Energy Fuels, submitted. (7) Iino, M.; Takanohashi, T.; Osuga, H.; Toda, K. Fuel, 1988, 67, 1639. (8) Green, T. K.; Larsen, J. W. Fuel, 1984, 63, 935.
DISPERSED MOLYBDENUM HYDRO PROCESSING CATALYSTS PREPARED VIA FLASHING AND
DECOMPOSITION OF MICROEMULSIONS UNDER CONTINUOUS MODE
Pedro Pereira, Rebecca Wang, Josephine Hill
Department of Chemical and petroleum Engineering. University of Calgary. 2500 University Drive. Calgary, AB, T2N 1N4. Canada
Introduction
Due to environmental restrictions as well as to limitations of performance from the traditional fixed bed catalysts for hydro processing extra heavy feedstocks, the generation of micro-nano size catalyst particles within the feed at conditions close to those of the reaction zone results in an important alternative. This idea has allowed the proposition of many different new processes that could be considered the third generation for hydrocarbon heavy ends.
Oil soluble compounds of those transition metals catalytically active for hydro processing yield good results [1] but their preparation is costly. Most of the inorganic forms of these transition metals are much less expensive, for instance, ammonium heptamolibdate is perhaps the least expensive form of Mo with the higher metal proportion within the salt. Nevertheless its insolubility in the reaction media prevents from obtaining a direct good dispersion of the metal, which makes necessary to incorporate significant amounts of the compound to get sufficient catalysis for processing.
Traditionally more considered for transporting heavy crude oils [2] the use of emulsions and micro emulsions are an alternative way of incorporating well-dispersed catalysts for heavy feedstocks hydro processing. In this paper the preparation of micro/nano dispersed Mo particles by thermal decomposition of ammonium heptamolibdate emulsions was studied. A continuous setup for flashing the emulsion and decomposing the precursor salts of the catalyst active phase was used. This setup simulates at laboratory scale the one previously patented [3], for a preparation and demonstration at industrial scale [4]. The effects of the many variables that might have an incidence in the particle diameter and on the nature and quantity of the active sites are being studied by using a methodology for Experimental Design.
Experimental
Emulsions preparation. An oil lubricant base and a Vacuum Gasoil (VGO) were used as different oil phases for the micro emulsions preparation. The aqueous phase was prepared containing ammonium heptamolybdate (7.5% Mo) with or without ammonium sulfide at two different concentrations (3 and 10%). Also different percentages of surfactant were used from 1 to 10%.
Catalyst preparation. The synthesis of the molybdenum catalysts is performed in a continuous mode (Fig. 1). First 6ml of surfactant (Brij 30 from Aldrich) were put in 200g of vacuum gas oil (VGO, boiling point is from 250 to 600ºC). Appropriate amounts of AHM (Ammonium heptamolybdate tetra hydrate from Aldrich, ACS 99.99%) are dissolved in distilled water to produce the desired molybdenum concentration. The AHM solution, VGO and the surfactant were mixed for 6 min until a water-in-oil emulsion was formed. The as prepared water/oil emulsion was pumped through ¼” tubing in a horizontal Linberg furnace. The furnace temperature and flowrate were determined according to a two-level full factorial experimental design. The liquid product was analyzed to determine the size of the suspended particles. Solids are obtained after centrifuging and drying in a vacuum oven at 120 ºC overnight.
Characterization Methods. The particle size measurements of
synthesized molybdenum oxide by dynamic light scattering (DLS) was performed on a Malvern Zetasizer Nano series (Malvern, UK) equipped with a 4.0mW He-Ne laser (633 nm) and operated at an angle of 173º and a temperature of 25 ºC with multiple narrow modes. X-ray diffractograms as well as XPS spectras were used to identify the most abundant structural forms of Mo resulting from the preparation and the chemical environment of the surface formed during the preparation process, respectively. Results and discussion Dynamic light scattering (DLS) investigation of molybdenum particles. The size of the molybdenum particles depends on experimental variables including decomposition temperature, emulsion flow rate, water/oil ratio and the AHM concentration. Typical results from two experiments are shown in Figure 2. The parameters for these experiments are given in Table 1.
EmulsionPreparation
Vessel
VGOMoO2, MoO3Mo Hydrates
Decomposition Unit
Pump
Furnace
• AHM concentration•Water/oil ratio
•Emulsion flowrate•Decomposition temperature
T = Room Tt = 6’
•Steam•Ammonia
EmulsionPreparation
Vessel
VGOMoO2, MoO3Mo Hydrates
Decomposition Unit
Pump
Furnace
• AHM concentration•Water/oil ratio• AHM concentration•Water/oil ratio
•Emulsion flowrate•Decomposition temperature
T = Room Tt = 6’
•Steam•Ammonia
Figure 1. Experimental setup of producing submicron molybdenum catalyst in a continuous mode
The mean particle sizes obtained range from 50nm to 800nm
depending on the experimental variables already mentioned. The DLS technique allows to detect suspended particles preexisting in the VGO used for the preparation of the microemulsion In the sequence of figure 3 are shown the results of a series of experiments each one followed of a DLS analysis of the resulting suspended particulate. These particles were presumably traces of asphalthenes based on their significant reduction in quantity when a large addition of n-heptane was used to dilute it. The thermal flashing at 350C of the both the VGO and its emulsion prepared in the absence of Mo salts, shows that these presumed asphalthenes are affected by the thermal treatment. When the emulsion contains the Mo precursor the asphalthene particle signal attributed to them disappears. These presumably asphalthenes are playing a role in the dispersion of Mo. This illustrates that dispersed molybdenum catalysts with sub-micron sizes can be produced by thermal flashing of a micro emulsion containing molybdenum salts, in a continuous mode that simulates the way in which the eventual industrial application has been produced in the past [3-4] for a different demonstration not containing Mo.
BET surface area measurements indicate a good correlation between surface area and particle size, with a surface area of about 60 m2/g for the smallest 50 nm particle size. X-Ray Diffraction shows the formation of MoO3 as the only significant species formed in the absence of sulphur during the flashing-decomposition process.
Activation with H2S and reactivity tests of these particles for catalyzing the desulphurization of thiophene are being performed to verify their catalytic activity in a simple and direct way.
Conclusion
Preliminary results indicate that molybdenum particles with sub micron sizes can be synthesized by the thermal decomposition of low cost molybdenum salts in a water-in-oil emulsion in a continuous mode. DLS results show a particle size ranging between 50 and 700 nm as average particle diameter. This synthesis scheme offers potential application for heavy oil upgrading. Of particular relevance is the evidence of the role that asphalthenes might be playing in the flashing-decomposition process to form Mo nano particles when Vacuum Gas Oil is used as the hydrocarbon fraction of the Water-in-Oil microemulsion as shown in recent previous work. Acknowledgement. We would like to thank NSERC for its financial support for the project. We also would like to thank the support of the Alberta Ingenuity Foundation whose financial support of the Scholar Dr Pedro Pereira Almao in the area of Catalysis for Upgrading and Hydrogen production has also contributed to the deployment of this research at the University of Calgary, Alberta, Canada. Figrure 3. DLS ANALYSIS OF VGO AND ITS EMULSIONS WITH AND
WITHOUT AHM. Record 28: VGO before emulsifying; Record 25: After emulsifying and flashing-decomposition @ 350C in the absence of AHM; Record 26: After heating the VGO @ 350C; Record 17: After emulsifying and flashing-decomposition @ 350C in presence of AHM References [1] Bearden R., Aldridge C. L., Energie Progress, 1 (1981) 44 [2] Ng F.T.T. Rintjema R.T. Stud. Surf. Sci. Catal., 73 (1992) 51 [3] Pereira P. et al. US Patent 5885441 [4] Pereira P et al. Petroleum Technology Quarterly (ISSN 1362-363)V3 N.4 29-30, 33-37 (Winter 1998-99) [5] E. Escalona et al. Memorias VI Congreso Venezolano de Quimica. P 744-747, Nov. 2003. Margarita, Venezuela.
Figures and Tables
Sample Name AHM concentration Decomposition temperature Water/oil ratio Emulsion flowrate Mean particle diameterMC1 0.3 330 0C 0.1 420 ml/hr 617.9 nmMC2 0.3 220 0C 0.4 420 ml/hr 575.6 nm
PSD by Intensity
0
20
40
60
80
100
0 200 400 600 800 1000 1200
Particle diameter, nm
Inte
nsity
, %
MC 1MC 2
Sample Name AHM concentration Decomposition temperature Water/oil ratio Emulsion flowrate Mean particle diameterMC1 0.3 330 0C 0.1 420 ml/hr 617.9 nmMC2 0.3 220 0C 0.4 420 ml/hr 575.6 nm
PSD by Intensity
0
20
40
60
80
100
0 200 400 600 800 1000 1200
Particle diameter, nm
Inte
nsity
, %
MC 1MC 2
Figure 2. Table 1: Particle size distribution by intensity for the samples MC 1 and MC 2 and preparation variables for the samples MC 1 and MC 2.
0
20.
40.
60.
1. 10. 100. 1000. 10000.
Inte
nsity
(%)
Diameter (nm)
Size Distribution by Intensity
Record 17: rw040320 Record 25: liquid w ithout AHMRecord 26: HT VGO Record 28: VGO
Refiners today are challenged to produce transportation fuels containing a level of contaminants close to zero. The United States, the European Union, and several Asian countries have recently passed legislation for ultra low sulfur diesel and gasoline. These new requirements impose a growing need in the oil industry for more active and selective hydroprocessing and cracking catalysts.
Residuum Hydrotreating (RDS) technology was first introduced to produce low sulfur fuel oil from high sulfur atmospheric residuum to a 1wt% sulfur specification. It became the only technology capable of upgrading vacuum residuum from sour and heavy crude oils into low sulfur fuel oil. Today, developments in both RDS and Fluid Catalytic Cracking (FCC) catalyst technology and reactor design mean that Residuum Fluid Catalytic Cracking (RFCC) is the most popular and economic processing route for the complete conversion of residual oils. Refiners without a pretreating system are limited to processing atmospheric residuum from crudes that are low in metals, carbon residue and sulfur in order to avoid operating problems. Consequently, many refiners chose to combine a residuum hydrotreater upstream of an FCCU allowing them more flexibility in choosing heavier and more contaminated feedstocks, reducing their catalyst consumption in the FCCU and enabling them to achieve higher and cleaner yields of transportation fuels. Indeed many units process mixtures of both atmospheric and vacuum residuum (AR and VR) with high levels of contaminants and nonetheless provide feedstock to an FCCU.
In this paper we examine the impact on sulfur level of RDS catalyst system design with RFCC catalyst selection. Extensive pilot plant testing on both RDS and RFCC processes has been conducted to evaluate the impact of feedstock, process variables and catalyst design on overall system performance. Experiments were conducted in high-pressure, semi-commercial fixed-bed pilot plants to test RDS catalyst systems at ChevronTexaco. The RDS product generated was then processed as FCC feedstock in an ACE fluidized bed pilot plant over new cracking catalyst systems at Grace Davison. Our complimentary studies show that by considering the RDS and RFCC catalyst systems together, we are able to design an optimized system to extract the maximum synergy from RDS and RFCC catalyst systems operating in tandem. Experimental
RDS pilot plant studies. A typical pilot plant consists of one to three reactors in series which can be run either upflow or downflow. The one to 2.5 inch reactors are equipped with internal thermowells and can accommodate catalyst charges of up to twenty liters in volume. Reactors are temperature controlled by means of six independent heaters, each controlled by feedback from internal catalyst bed thermocouples. This configuration enables realistic adiabatic reactor temperature control representative of commercial operation. Hydrogen is supplied to reactors in either a once thru or recycle gas mode. In this fashion, typical commercial hydrogen partial pressures can be maintained throughout the duration of a test.
The product handling portion of the units varies from simple letdown of liquid product with hydrogen sulfide and ammonia stripping to complete product distillation for specific fraction liquid recycle, all on a continuous basis.
ACE pilot plant studies. Testing was conducted in an ACE fluidized bed pilot plant reactor after deactivation by the cyclic propylene steaming (CPS) protocol. Further details can be found in references (1) and (2). Results and Discussion
Fixed bed RDS catalyst systems are a combination of large pore hydrodemetalation (HDM) catalysts designed to remove contaminant metals such as nickel and vanadium, transition catalysts with dual hydrodemetalation and hydrodesulfurization (HDS) functionalities to provide HDS activity in a relatively high metals environment, and small pore deep desulfurization, denitrogenation (HDN) and Conradson carbon (CCR) removal catalysts. Catalyst systems are designed using kinetic models and constructed in layers with varying ratios of catalyst types depending on feed properties and product specifications.
For this study two RDS catalyst systems were designed: a system optimized for HDM activity heavily weighted with large pore low activity catalyst, and a system designed for optimum HDS activity comprised substantially of high activity conversion catalyst. Table 1 summarizes the feedstock properties (Arab Medium AR/VR blend) and the middle-of-run 650°F+ product properties produced by each catalyst system.
Table 1. RDS Feedstock and Product (650°F+) Properties Feedstock HDM system HDS system
The HDM system reduced combined nickel and vanadium
levels by 93%, and nitrogen and CCR by 38% and 66% respectively. Sulfur conversion was relatively low at 86% due to the high proportion of large pore demetalation catalyst in the system. The HDS system achieves 89% sulfur conversion but leaves more contaminant metals unconverted: nickel and vanadium were reduced by 77% and 88% respectively, and nitrogen and CCR conversions were 52% and 68%. The use of residuum feedstocks as described in Table 1 in FCC units has been facilitated by advances in FCC catalyst design. New catalysts, for example IMPACT from Grace Davison, are more resistant to poisons such as sodium and vanadium that cause deactivation by neutralizing zeolite acid sites, sintering and destroying the zeolite lattice. Furthermore, cracking catalysts now afford higher bottoms conversion through tuned acidity and increased accessibility and diffusion into the zeolite of large molecules that are abundant in residual feeds. Advances in additive technology are improving sulfur reduction in the FCCU: sulfur additives are effective at reducing sulfur species in the light and intermediate FCC naphtha. These new metals tolerant and sulfur reduction technologies were employed in the testing of the HDM and HDS residuum feedstocks in the following case studies.
RDS sulfur reduction and RFCC metals management. For the cost effective production of high yields of low sulfur gasoline and diesel fuels, the combination of an RDS unit achieving maximum
Maximizing demetalation in the RDS unit (HDM catalyst system, run 1) means the refiner processes a low metals feedstock in the RFCC, and benefits by maintaining a low cat-to-oil ratio, in addition to producing less coke and achieving higher yields of the desired products. However, maximizing desulfurization in the RDS unit and exploiting the latest RFCC metals-tolerant catalyst technology (at a higher catalyst addition rate) means higher gasoline yields and optimum profitability for the refiner.
desulfurization followed by an RFCC is a popular processing route. The HDS RDS catalyst system achieves deep desulfurization, but as a consequence the residuum FCC feedstock contains double the amount of nickel and vanadium contaminants than the feedstock prepared over the HDM RDS catalyst system. Testing of both the HDS and HDM residuum FCC feedstocks in the ACE pilot plant is compared in Table 2. Comparing runs 1 and 2 demonstrates the effect of doubling feed metals on the performance of the RFCC catalyst (changing from HDM to HDS RDS ‘mode’): the catalyst-to-oil ratio, selectivities to hydrogen and gasoline, and the amount of coke formed makes this mode of operation impractical for the refiner. The result of increasing catalyst additions to return the catalyst equilibrium (ecat) metal levels to base levels in the RFCC while optimizing HDS in the RDS is shown in run 3. The yields are comparable to run 1; doubling the fresh catalyst addition rate from 0.5 lb/bbl to 1.0 lb/bbl restored the catalyst yields to that of the base case (run 1, HDM RDS system) while giving 25% lower sulfur in the gasoline and 40% lower sulfur in the LCO.
Run 4 shows the effect of employing a new RFCC catalyst (IMPACT). Optimizing desulfurization in the RDS and therefore with a high metals RFCC feedstock, the new RFCC catalyst achieves yields comparable with those in run 3, but with half the fresh cracking catalyst additions. The improved coke selectivity and metals tolerance of the new technology is clearly evident, and coke and gas levels are only marginally higher than run 3 at twice the metals level.
Figure 1. RDS metals management: effect of adding sulfur reduction additive (D-PriSMTM) to base RFCC catalyst with HDM RDS catalyst on gasoline sulfur level.
Table 2. Comparison of ACE Tests of RFCC Simulation at
Constant Conversion (Runs 1-5) and Constant Coke (Run 5a) Run 1 2 3 4 5 5a RFCC Catalyst
Base Base Base New New New
RDS Catalyst
HDM HDS HDS HDS HDS HDS
FCC Cat. Additions, lb/bbl
0.5 0.5 1.0 0.5 0.65 0.65
Ni+V, ppm 5929 12427 6377 12576 9776 9776 Cat-to-Oil Ratio
RDS metals management and RFCC sulfur reduction. In this case study, the RDS product being fed to the RFCC is low in nickel and vanadium (Table 1) allowing the refiner to operate at a low fresh cracking catalyst addition rate. However, the sulfur content of the RDS product is high (0.62 wt% compared to 0.50 wt% from a HDS RDS catalyst system), which leads to an increase in gasoline sulfur of approximately 25%.
Figure 1 shows the effect of applying recent sulfur reduction additive technology to the base catalyst; Grace Davison’s D-PriSMTM
additive was combined in run 1 (Table 2). The result was to reduce gasoline sulfur from 170 ppm to 132 ppm (22% reduction). The combination of the HDM RDS catalyst system with RFCC sulfur reduction technology was able to achieve a comparable gasoline sulfur level as the HDS RDS catalyst system and base RFCC catalyst alone (Table 2, run 3), allowing the refiner to take further advantage of potential yield improvements and metals tolerance of the HDM system.
Maximum RDS and RFCC sulfur reduction. In order to optimize sulfur removal and achieve the lowest sulfur levels in transportation fuels, a HDS RDS catalyst system is combined with the use of a sulfur reduction additive in the RFCC unit. Relative to RDS operation in ‘HDM’ mode, this means higher fresh catalyst addition rates in the FCC due to increased contaminant metal levels in the feedstock.
aC5-430°F, b430-700°F, c+700°F
Run 5 demonstrates the yield improvements possible by employing the new FCC catalyst and only a 30% increase in fresh catalyst additions (0.65 lb/bbl) while employing the HDS catalyst system in the RDS. The result is a processing route that achieves the lowest hydrogen yield and the highest gasoline yield, while producing the least coke. Comparing this configuration at constant coke (run 5a) reveals an even greater gasoline yield advantage and therefore benefit of the new FCC technology to the refiner.
R F C C C a ta ly s t (H D M ), 0 .5 lb /b b l R F C C C a ta ly s t (H D S ), 1 .0 lb /b b lR F C C C a ta ly s t + D -P r iS M (H D S ) , 1 .0 lb /b b l
H D M M o d e
H D S + D -P r iS M
H D S M o d e
Figure 2. Maximum desulfurization: effect of adding sulfur reduction additive (D-PriSMTM) to base RFCC catalyst with HDS RDS catalyst on gasoline sulfur level.
The HDS RDS catalyst system alone caused significant
reductions in both gasoline and LCO sulfur (25 and 40% respectively). In addition, when the base RFCC catalyst is combined with the new sulfur reduction additive in run 3 (Table 2), the overall sulfur reduction in gasoline was almost 50% (Figure 2). Conclusions
New developments in RDS catalyst system design and technology, combined with innovations in RFCC catalysts and additives mean refiners can more easily and reliably meet stringent product specifications. Improvements in metals tolerance, catalyst accessibility and sulfur reduction in RFCC catalysts have increased the flexibility and effectiveness of the refinery in processing heavier and more contaminated residual feedstocks in the FCCU.
Through a combination of RDS and ACE pilot plant testing, three processing routes have been demonstrated to optimize the upgrade of residuum to clean fuels. Operation at maximum desulfurization capability in the RDS unit upstream of an FCCU employing the latest sulfur reducing additive technology can deliver a reduction in LCO and gasoline sulfur of 40 and 50% respectively. In addition, an RDS/RFCC optimized system will alleviate the impact of metals on cracking catalyst additions and RFCC product yields with heavier feedstocks. References (1) Kayser, J. C., U.S. Pat., No. 6,069,012, 2000. (2) Boock, L. T., Petti, T. F., Rudesill, J. A., Proc. ACS Ann.
Visbreaking of the heavy crude oils: Castilla, Rubiales and Nare-Jazmin
J.A. Carrill
Colombian Petroleum Institute-ECOPETROL Km 7 Piedecuesta, Colombia.
L.M. Corredor, M.L. Valero
Universidad Industrial de Santander, Colombia. Introduction
Visbreaking appears like an alternative for the conversion or transportation of heavy crudes [1,2,3]. In a refinery, this one process allows to the production of Fuel Oil and feed for the catalytic cracking units [4,5]. In the production fields, the reduction of viscosity, offers an alternative for its pipeline transportation. In this work, the obtained results of the thermal conversion of Castilla, Rubiales and Náre-Jazmín crude oils are analyzed. There were found optimal operation condition which correspond to temperature of 442 °C and reaction time of 1.2 minutes for Castilla and Rubiales crudes. For Náre-Jazmín was temperature of 456 °C and reaction time of 1.4 minutes . Under these conditions the reached conversion was 53, 60 and 68 wt %, respectively. On the other hand, the impact of this one process is determined on the reological properties and the stability of the visbreaking bottoms.
The Castilla crude has an API gravity 9.6, its content of insoluble in n-heptano is 15.9 wt %. Its high sulfur content of 2.4 wt % does not allow its use like fuel due to the restrictions imposed by the environmental legislations. Its high viscosity and density don't allow its pipeline transportation. Rubiales and Nare-Jazmin crudes are in similar situation. These heavy crude oils are located far from the refineries and of the export points. Due to all that exposed previously, it is interesting to evaluate their thermal craqueability as alternative for their transportation or as raw matter for Fuel Oil production. Experimental
The main properties of the Castilla, Rubiales and Nare-Jazmin crude are presented in table 1. These crudes were cut at 171°C, and have been processed in a visbreaking pilot plant of the Colombian Petroleum Institute [6]. The tests were carried out to a constant pressure of 0.1 MPa and different temperatures of (from 420 °C to 456°C) and reaction time of from 1,2 minutes to 1,6 minutes.
Table 1. Characterization of the heavy crude oils cut 171ºC+. Analysis Norma Unit Castilla Rubiales Nare
Crude oil stability parameters were determined by Heithaus titration, adding a weak solvent such as isooctane to orto-xilene solutions of bottom. The calculations were carried out applying the expressions mentioned in [7,8] and they are presented in table 2.
Table 2. Heithaus parameters.
Crude FR max Cmin Pa Po P IC
Castilla 0,44 0,44 0,56 1,42 3,26 1,27
Rubiales 0,58 0,75 0,42 1,35 2,33 0,56
Nare-Jazmin 0,18 0,24 0,82 0,92 5,24 3,49
The analyzed effluents were: gases up to C4, lights from C5 up to 171 °C; atmospheric gas oil (AGO) 171-371 °C; Vacuum gas oil (VGO) 371-510 °C, and visbreaking bottoms, 510°C+ (VBB). The stability of the VBB was evaluated applying the stability tests: Heithaus titration and Spot test [9]. For the operation conditions the viscosity reduction percentages were calculated by means of the difference between the viscosity of the crude and that of the VBB (or of the bottom-naphtha mixture) about the viscosity of the crude.
Results and discussion
The operation conditions and the obtained yields are given in table 3.
Table 3. Reaction conditions and yields. Castilla: Severity by temperature, wt %; Tr= residence time, minutes
T °C Tr VBB AGO VGO Naphtha Gases Coke Conversion 420 1.2 53,0 21,2 23,0 0,5 0.3 2.3 45.0
437 1.2 44,0 24,4 27,5 0,9 0.57 2.5 53.3
442 1.2 43,6 26,0 25,1 1,3 0.6 3.4 53.0
456 1.2 35,1 26,8 28,1 2,0 1.6 6.3 58.6
Castilla: Severity by residence time, wt %
T °C Tr VBB AGO VGO Naphtha Gases Coke Conversion
442 1.2 43,6 26,0 25,1 1,32 0,6 3,4 53
442 1.4 41,1 25,9 27,5 1,0 0,7 3,7 55,1
442 1.6 39,0 17,1 37,9 1,4 1,5 4,3 57,9
Rubiales : Severity by temperature, wt % T °C Tr VBB AGO VGO Naphtha Gases Coke Conversion
430 1,2 40,9 26,0 31,4 0,14 0,40 1,0 58,0
437 1,2 39,8 26,1 32,3 0,31 0,40 1,0 59,0
442 1,2 37,8 27,0 32,7 0,28 0,47 1,1 60,4
448 1,2 37,4 26,8 32,9 0,58 0,53 1,6 60,8
Rubiales: Severity by residence time, wt %
T °C Tr VBB AGO VGO Naphtha Gases Coke Conversion 442 1,0 38,9 27,0 32,3 0,3 0,5 1,0 60,0
442 1,2 37,8 27,0 32,7 0,28 0,5 1,1 60,4
442 1,4 36,8 27,4 33,6 1,7 0,5 1,2 63,1
Nare-Jazmin: Severity by temperature, wt % T °C Tr VBB AGO VGO Naphtha Gases Coke Conversion
440 1,7 41,3 23,2 33,6 0,3 0,4 0,4 57,5
450 1,7 38,2 24,2 34,6 1,1 1,2 0,7 61,0
453 1,7 37,9 24,0 36,5 1,2 1,4 0,9 62,9
456 1,7 25,5 28,0 39,0 2,3 2,5 2,8 71,7
Nare-Jazmin: Severity by residence time, wt %
T °C Tr VBB AGO VGO Naphtha Gases Coke Conversion 456 1,2 37,7 23,7 35,0 1,3 1,3 1,0 61,4
For Castilla and Rubiales crudes, the temperature interval inside which are obtained stable VBB is of from 437°C and 442°C to 1,2 minutes. For these crudes, under severity conditions by residence time of 1.2 minutes, there are obtained stable VBB at 442 °C. Processing the crude Nare-Jazmin at constant residence time of 1,7 minutes, is stable up to 453 °C, and maintaining the temperature constant in 456 ºC, is stable up to 1,4 minutes of residence time.
Table 4. Heithaus parameters and spot test for the VBB.
Castilla: Severity by temperature
VBB Spot test FR max Cmin Pa Po P IC
FC1 4 0,53 0,69 0,47 1,29 2,45 0,69
FC2 6,5 0,66 1,44 0,34 1,11 1,69 0,24
FC3 7 0,73 1,80 0,28 1,13 1,56 0,15
FC4 9 1 * 0 * * *
Castilla: Severity by residence time
VBB Spot test FR max Cmin Pa Po P IC
FC3 7 0,73 1,80 0,28 1,13 1,56 0,15
FC4 8 1 * 0 * * *
FC5 9 1 * 0 * * *
Rubiales: Severity by temperature
VBB Spot test FR max Cmin Pa Po P IC
FR1 6 0,80 0,68 0,20 1,98 2,48 0,30
FR2 6,5 0,82 0,96 0,18 1,67 2,04 0,19
FR3 7 0,88 1,10 0,12 1,68 1,91 0,11
FR4 9 1 * 0 * * *
Rubiales: Severity by residence time
VBB Spot test FR max Cmin Pa Po P IC
FR5 6 0,86 0,98 0,14 1,74 2,02 0,14
FR3 7 0,88 1,10 0,12 1,68 1,91 0,11
FR6 9 1 * 0 * * *
Nare-Jazmin: Severity by temperature
VBB Spot test FR max Cmin Pa Po P IC
FN1 3 0,56 0,38 0,44 2,04 3,62 1,14
FN2 4,5 0,74 0,66 0,26 1,87 2,52 0,40
FN3 5 0,77 0,94 0,23 1,59 2,06 0,24
FN4 9 1 * 0 * * *
Nare-Jazmin: Severity by residence time
VBB Spot test FR max Cmin Pa Po P IC
FN5 4 0,60 0,86 0,40 1,30 2,16 0,46
FN6 7,5 1 * 0 * * *
FN4 9 1 * 0 * * * * Unstable product, it cannot be titrated.
The coking index (IC), according to Heithaus titration defines the stability of an atmospheric bottom in the interval of from 0,3 to 1[10], however studies carried out for vacuum bottoms indicate that this value is of from 0,6 to 1[9]. For the heavy crude oils, it was found that the stable interval corresponds at 0,1 - 1.
In figures 1 and 2, there are given the residence time and the temperature incidence over the VBB viscosity reduction with respect to the analyzed crudes.
86889092949698
100102
415 430 445 460
Temperature [°C]
Cas
tilla
and
Nar
e VB
B
0
5
10
15
20
25
30
Rubiales VB
B
Castilla Nare-Jazmin Rubiales
Figure 1. Reaction temperature vs. VBB viscosity reduction at 30°C.
Under conditions of severity by temperature, for the Castilla crude, there were reached VBB viscosity reductions of 88 % under the reaction temperature of 420 ºC, and almost of 100 % under the reaction temperature of 456 ºC. The Rubiales VBB, don't present considerable reductions in their viscosity, for effect of the increase in the temperature. The reduction of the viscosity of the Nare-jazmin VBB, oscillates between 88 and 97%.
Under conditions of severity by residence time, the biggest reduction in the viscosity, is obtained for the Castilla and Nare-Jazmin VBB, being presented a similarity between them although these last ones was obtained to a higher temperature operation. It is observed in the figure 2.
For the Rubiales bottoms, the reduction of the viscosity is smaller than 50% of the one registered for the other bottoms.
8486889092949698
0.9 1.2 1.5 1.8
Residence time [minutes]
Cas
tilla
and
Nar
e VB
B
05101520253035
Rub
iales VBB
Castilla Nare-Jazmin Rubiales
Figure 2. Residence time vs. VBB viscosity reduction at 30°C.
The conditions to be able to transport the crude ones by pipe line are: kinematic viscosity smaller or equal to 100 cSt at deformation velocities of between 10 and 100 s-1 at 40°C, and API gravity higher than 18. The FC3, FR3 and FN5, present viscosities of 3784, 3139 and 1171 cSt, respectively, reason why they cannot be transported without the addition of a diluter. One such way is to use naphtha that is usually available onsite, as diluents [11]. For this reason there is carried out a study adding to the VBB the naphtha fraction obtained by visbreaking reaction. These results are presented in the figures 3, 4 and 5.
Figure 3. Effect of the naphtha addition over the viscosity of the FC3.
1500
2000
2500
3000
3500
10 30 50 70 90 110
Deformation velocity [1/s]
Visc
osity
[cSt
]
FR3 FR3+NR3
Figure 4. Effect of the naphtha addition over the viscosity of the FR3.
250
500
750
1000
1250
10 30 50 70 90 110
Deformation velocity [1/s]
Visc
osity
[cSt
]
FN5 FN5+NN5
Figure 5. Effect of the naphtha addition over the viscosity of the FN5.
With the addition of visbreaking naphta to the VBB obtained
under the best operation conditions, there were reached viscosity reductions of 60% for FC3 and FN5 and of 20% for FR3, however, there are not reached require viscosities that allow their transportation by pipe line. For this reason it required the use of another diluter.
Conclusions
The crude Nare-jazmin 171+ gave high yields of gas oils and light products (naphta and gases) due to its high resin and parafinic hydrocarbon content. Crude Castile 171+, produced great amount of light and VBB because of its more aromatic character. Crude Rubiales 171+ produced gas oils mainly.
At pilot plant level it was determined that the crudes should be processed under conditions of severity by temperature, at the residence time of 1.2 minutes for the crudes Castilla 171+ and Rubiales 171+ and of 1.4 minutes for Nare-jazmin 171+. The found cocking index stability interval for the analyzed crudes was of from 0.1 to 1.0.
For the transport of the crudes by pipeline, there is not enough the viscosity reduction by thermal conversion, and there is required additional amount of diluents. Nomenclature FC1-5: Castilla VBB. Runs from 1 to 5 FR1-6: Rubiales VBB. Runs from 1 to 6 FN1-6: Nare-jazmin VBB. Runs from 1 to 6
Acknowledgment. This work was supported by the Division of No-Catalytic Process of the Colombian Petroleum Institute-ECOPETROL and by Universidad Industrial de Santander, under contract No. 003. References [1] Chaparro, M. ECOPETROL- ICP, 7 (1991). [2] Kuo,C. Oil and Gas Journal, (1984). [3] González, R. World Focus, (1998). [4] Treviño, A. Ingeniería Química, 65 (1982). [5] Speight, J. Taylor & Francis, 27 (1998). [6]Carrillo, J. PRE-PRINTS, Pap. - Am. Chem. Soc., Div. Fuel Chem., (1998). [7] Schabron, J., Pauli, A., y Rovani, J. PRE-PRINTS, Pap. - Am. Chem. Soc., Div. Fuel Chem., 44(2), (1999). [8] Savaya, Z., and et al. Fuel, 68, (1989). [9] Carrillo, J, Pantoja, F and et al. ECOPETROL- ICP, CT&F, 1(5), (1999). [10] Carrillo, J and et al. PRE-PRINTS, Pap. - Am. Chem. Soc., Div. Fuel Chem., (1999). [11] Asomaning, S, Yen, A and Weispfenning, K. PRE-PRINTS, Pap. - Am. Chem. Soc., Div. Fuel Chem., (2001).
THE PARADOX OF ASPHALTENE PRECIPITATION WITH N-PARAFFINS
Irwin A. Wiehe1, Harvey W. Yarranton2, Kamran Akbarzadeh2,
Parviz M. Rahimi3 and Alem Teclemariam3
1Soluble Solutions, 3 Louise Lane, Gladstone, NJ 07934 USA; 2Department of Chemical and Petroleum Engineering, University of Calgary, 2500 University Drive N.W., Calgary, Alberta, T2N 1N4
Canada; 3National Centre for Upgrading Technology (NCUT), 1 Oil Patch Drive, Suite A202, Devon, Alberta T9G 1A8 Canada
Introduction Hotier and Robin1 found that the volume of n-paraffin at the onset of asphaltene precipitation of a crude oil with increasing carbon number of the n-paraffin reaches a maximum at carbon number 7 (n-heptane). This suggests that higher carbon number n-paraffins can be poorer solvents for petroleum asphaltenes than lower carbon number n-paraffins even though the solubility parameters of n-paraffins increase continuously with increasing carbon number2. However, at high n-paraffin to oil volume ratios and with increasing n-paraffin carbon numbers, lower amounts of more aromatic asphaltenes are precipitated3. This indicates that n-paraffins are better solvents for asphaltenes with higher carbon numbers. This contradiction is the paradox of asphaltene precipitation by n-paraffins. Cimino et al.4 claimed this maximum is caused by the entropy of mixing of molecules of different sizes and used an approximation to the regular Flory-Huggins model (RF-HM). Other approximations to the RF-HM for petroleum oils have been used by Hirschberg et al5, Wang and Buckley6, and Yarranton et al.7,8. By including the pseodocomponents: n-paraffin, saturates, aromatics, resins, and associated asphaltenes with a molecular weight distribution, Yarranton et al. quantitatively described the fractional precipitation of asphaltenes from Athabasca and Cold Lake bitumens with volume fraction of n-paraffin from n-pentane through n-hexadecane. The oil compatibility model9 has proven to be useful in predicting incompatibility of oil mixtures for fouling mitigation. This model is based upon the assumption that the onset of asphaltene precipitation occurs at the same solubility parameter of the mixture that is dubious because of the data of Hotier and Robin. Experimental The onset of asphaltene precipitation for two crude oils and two bitumens were determined at room temperature for n-paraffins from n-pentane through n-hexadecane. Using the same procedure, one laboratory performed measurements on Maya crude and Cold Lake bitumen while a different laboratory performed measurements on an Alberta crude, an Athabasca bitumen, and a much different Cold Lake bitumen sample. The procedure used an optical microscope for detecting asphaltene precipitation. The recorded volume of n-paraffin at the onset of asphaltene precipitation was the average of the maximum volume of n-paraffin added without observing precipitation and the minimum volume of n-paraffin added when precipitation was observed. The volume fractions of n-paraffin at the onset of asphaltene precipitation are shown in Table 1 with properties of the oils in Table 2. Results and Discussion Maximum. Table 1 establishes that the volume of n-paraffins going through a maximum with n-paraffin carbon number at the onset of asphaltene precipitation is a general phenomenon for petroleum oils. However, where the maximum can be distinguished, it occurs at
n-paraffin carbon numbers of 8, 9, or 10 (for this study) rather than at carbon number 7, as observed by Hotier and Robin1.
Table 1. Volume Fractions of n-Paraffin at the Onset of
Asphaltene Precipitation for Five Oils n-Paraffin Cold Cold Athabasca Maya Alberta
- Density (g/ml) 1.203* 1.203 1.203 1.203* - Molecular Wt. 2850* 2850 2910 2600 Density (g/ml) 0.991 1.001 0.9952 0.876 0.9327 Toluene Equiv. 19 19.5 18.5 38 21.0 Insolubility No. 28.5 33 31.4 47 34 Sol. Blend. No. 76 99.7 95.5 71 94.5 * Not measured but assumed to be as same as Cold Lake Bitumen 2.
Yarranton Approximation to RF-HM. By approximating the RF-HM, Yarranton et al.6,7 determined that the ratio of the equilibrium mole fractions of each of the asphaltene and resin species in light (L) and heavy (H) phases is given by:
( )⎪⎭
⎪⎬⎫
⎪⎩
⎪⎨⎧
δ−δ+−+=2L
Mi
Li
LM
Li
LM
Li
Li
Hi
RTv
vv
1vv
lnexpxx
(1)
where: xi = mole fraction of component i vi = molar volume of component i R = gas constant T = absolute temperature δi = solubility parameter of component i δM = solubility parameter of the mixture = ∑φi δi vL
M = ∑xi vLi
Yarranton et al.8 calculated solubility parameters for n-paraffins from a correlation based on heat of vaporization and molar volume data while Wang and Buckley5 used a correlation with refractive index data. As is shown in Figures 1-3, the model of Yarranton et al.
correctly predicts the volume maximum with carbon number of n-paraffins at the onset of asphaltene precipitation (calculated for 0.5% precipitation) for three different oils with either the solubility parameters of Yarranton et al. or of Wang and Buckley. Therefore, this volume maximum is definitely a result of low entropy of mixing molecules of much different sizes.
Cold Lake Bitumen 1
0.50
0.55
0.60
0.65
0.70
0.75
4 5 6 7 8 9 10 11 12 13 14 15 16 17 18
n-Paraffin Carbon Number
Volu
me
Frac
tion
n-Pa
raffi
n
Experimental Data
Calculated with Average Effective Solubility BlendingNumberModel of Yarranton et al. with Solubility ParameterCorrelation
Figure 1. Volume fraction of n-paraffin at the onset of asphaltene precipitation for Cold Lake bitumen 1.
Alberta Crude
0.50
0.55
0.60
0.65
0.70
0.75
4 5 6 7 8 9 10 11 12 13 14 15 16 17 18
n-Paraffin Carbon Number
Volu
me
Frac
tion
n-Pa
raffi
n
Experimental DataCalculated with Average Effective Solubility Blending NumbersYarranton et al. Model, Solubility Parameter CorrelationsYarranton et al. Model, Buckley's Solubility Parameters
Figure 2. Volume fraction of n-paraffin at the onset of asphaltene precipitation for Alberta Crude.
Athabasca Bitumen
0.50
0.55
0.60
0.65
0.70
0.75
5 6 7 8 9 10 11 12 13 14 15 16
n-Paraffin Carbon Number
Volu
me
Frac
tion
n-Pa
raffi
n
Experimental Data
Calculated with Average Effective Solubility BlendingNumberYarranton et al. Model with Solubility Parameter Correlation
Yarranton et al. Model with Buckley's Solubility Parameters
Figure 3. Volume fraction of n-paraffin at the onset of asphaltene precipitation for Athabasca Bitumen.
Oil Compatibility Model Approximation. When the Oil Compatibility Model9 is applied to an oil without asphaltenes, this unknown oil is blended with five times the volume of a standard oil containing asphaltenes for which the insolubility number (IN) and the solubility blending number (SBN) have been determined. If this blend
is found to contain insoluble asphaltenes, the oil is termed a nonsolvent oil. The maximum volume (VNS) of the nonsolvent oil that can be blended with 5 ml of the standard oil without precipitating asphaltenes is determined and compared with a similar test previously run on the standard oil using n-heptane rather than the nonsolvent oil (called the heptane dilution test with result, VH). From the assumption of equal solubility parameter of the mixture at the onset of asphaltene precipitation, the solubility blending number of the nonsolvent oil is calculated by:
⎥⎦
⎤⎢⎣
⎡−=
NS
HNNS V
V1IS (2)
This equation is applied to the five oils in Table 1 using the insolubility numbers in Table 2 and treating all n-paraffins as nonsolvent oils except n-heptane. The calculated effective solubility blending numbers are in Table 3 along with the average values. These average effective solubility blending numbers of the n-paraffins are used to calculate the volume of n-paraffin at the onset of asphaltene precipitation using Eq. 2. As shown in Figures 1-3, the average effective solubility blending numbers can describe well the asphaltene onset data. This demonstrates why the oil compatibility model with compatibility numbers measured by asphaltene onset titrations has been successful at predicting oil compatibility even though the onset does not strictly occur at the same solubility parameter of the mixture. The effective solubility parameter (solubility blending number) of the oil measured with toluene and n-heptane is a good approximation of the effective solubility parameter of the oil when blended with other oils.
Table 3. Effective Solubility Blending Numbers for n-Paraffins
n-P. Cold Cold Athabasca Maya Alberta Average CNo Lake1 Lake2 Bitumen Crude Crude Eff. SBN
CATALYTIC DIRECT LIQUEFACTION OFHIGH SULFUR LIGNITES: TEMPERATURE
AND SOLVENT EFFECT ON PRODUCTDISTRIBUTIONS
Ömer Gül†, Pervane Gafarova†*, Arif Hesenov*,Harold H. Schobert†, Oktay Erbatur*
*Çukurova Üniversitesi, Fen Edebiyat Fakültesi,Kimya Bölümü, 01330 Adana, Turkey
†The Energy Institute, The Pennsylvania State University,University Park, PA 16802
IntroductionThe world’s population and energy consumption are
continuing to increase. While new energy resources are beingdeveloped, utilization of the present fossil resources in a cleanand efficient way should also be evaluated.
The low-rank coal reserves are around 8.1 billion tonnesin Turkey(1). However, the use of most of these low-rank coalswas abondoned because of their high sulfur content (5-10%wt). On the other hand, liquefaction of these high-sulfurlignites via direct catalytic hydrogenation is quitestraightforward.(2) This paper reports a continuation of a studyin which catalytic direct liquefaction of high-sulfur coals isbeing evaluated.
In this study, two lignites (Mengen from Bolu andKangal from Sivas) having high sulfur contents werehydroliquefied. In the liquefaction experiments, coal samplesimpregnated with ATTM as catalyst precursor were used.
ExperimentalThe proximate and ultimate analysis data of lignites are
given in Table 1. The coals were ground to pass 60 mesh,dried at 50 °C under reduced nitrogen pressure until moisturecontents fell below 3%, sealed in glass ampules undernitrogen gas and kept at -20 °C until utilization in theliquefaction experiment. All solvents and chemicals werebought from Merck and used as received.
Ammonium tetrathiomolybdate (ATTM: (NH4)2MoS4) isused as the catalyst precursor. It was synthesized in ourlaboratory as described by Naumann et al.(3). The catalyst (1%by wt based on Mo to daf coal ratio) was dissolved in 30 mLof distilled water and added dropwise onto 100 g of dry coalwhile the coal was effectively mixed with a spatula to achievea homogeneous mixture. Following addition of the catalystprecursor, the impregnated coal was dried at 50 °C underreduced nitrogen pressure until the moisture content fell below3 %.
In liquefaction experiments, mini bombs of 25 mLvolume were used. Following loading the coal and thesolvent, the reactor was sealed, and air inside the reactor wasswept out by successive pressurizing (6.9 MPa cold) anddepressurizing twice with nitrogen and twice with hydrogengases. Finally the reactor was pressurized with hydrogen gas(6.9 MPa cold) and submerged into a eutectic salt bath afterattaching it to a horizantally oscillating system. Thehorizantally oscillating
Table 1. Proximate and Ultimate Analytical Data of CoalsCoals
BM SKASTM classification Lignite A Lignite BCalorific value (kj/kg) 24586 20753Ash (wt % dry) 20.96 18.14V.M. (wt % dry) 45.42 53.37F.C. (wt % dry) 31.33 20.75Elemental analysis(wt % daf) a
C 74.72 66.58H 5.91 5.94N 1.86 1.88S 10.34 4.05O b 7,17 21,55Forms of sulfur(wt % dry)Total 13.02 5.62Pyritic 1.98 1.07Sulfatic 0.14 0.22Org b 8.18 3.31a daf: dry, ash-freeb calculated from difference
system shakes the reactor with an amplitude of 2 cm at 400cycles/min. In all of the liquefaction experiments, the durationof operation was 30 minutes. All liquefaction experimentswere repeated at least three times. Therefore, the numericalquantitative data relevant to liquefied material were the meanof three corresponding values. When the standard deviations ofthree replicate values for the conversion exceeded 2% of themean, a fourth replicate experiment was performed.
When the liquefaction reaction time was over, the reactorwas taken out of salt bath and immediately plunged into acold water bath. The slurry content of the reactor was removedwith n-hexane into an extraction thimble and successivelyextracted in a Soxhlet apparatus by using n-hexane, tolueneand tetrahydrofuran. Oil, asphaltene (AS) and pre-\asphaltene(PAS) were the materials solubilized in these three solvents,respectively. The mass of oil + gas products was calculated bysubtracting the total mass of asphaltene + preasphaltene + char(residue) from the mass of original dry coal subjected toliquefaction.
Results and DiscussionThe high-sulfur lignites Bolu-Mengen (BM) and Sivas-
Kangal (SK) were hydroliquefied in the presence of catalystand in the presence of solvents. Two different liquefactiontemperatures were investigated, namely 400°C and 450°C.Ammonium tetrathiomolybdate (ATTM) was used as acatalyst precursor. Reactions were carried out with differentliquefaction solvents and the results were compared regardingtemperature and solvent effects.
Tetralin, being a good hydrogen donor and showing goodsolvation behavior, has been used widely in coal liquefactionstudies.(4-8) Therefore, in this study, tetralin was the solvent ofmain choice. In liquefaction experiments with tetralin, theratios of solvent:coal were 2:1 and 1:1. Tetrahydroquinoline
(THQ), and coal-derived oil were also used in 1:1 ratio ofsolvent to coal in liquefaction experiments done with BMcoal. The coal-derived oil was obtained from liquefaction ofCayirhan lignite in the presence of molybdenum catalyst.Figure 1 shows catalytic liquefaction results of BM coal at400°C.. When tetralin was used as solvent, total conversionwas around 90%, regardless of solvent-to-coal ratio. Theoil+gas yield and the yield of asphaltene were slightly higherwhen equal amounts of tetralin
0
10
20
30
40
50
60
70
80
90
100
ns Tetralin(2:1)
Tetralin(1:1)
Coal-oil THQ
Co
nvers
ion
s (d
af)
Oil+Gas
Asphaltene
Preasphaltene
Total Conversion
Figure 1. Main product distribution of catalytic liquefactionof BM coal at 400°C in the presence of different solvents.
and coal were used. Overall conversion was highest whenTHQ was used as solvent, but the yield of oil+gas was lowerthan the case with tetralin. At this temperature it seems thatTHQ was more effective than tetralin as far as totalconversions were concerned. Similar observations by otherresearchers led them to conclude that THQ had more solvatingpower and also more effective in quenching radicals(9-11)
compared to tetralin. Coal-derived oil as solvent mainlyactivated reactions towards asphaltene formation but theoil+gas yield was less than the corresponding value obtainedwith tetralin. This coal-derived oil had less hydrogen donationability compared with tetralin and therefore could not quenchthe radicals formed as efficiently as tetralin. It rather plays therole of offering a liquid medium as discussed by others.(12)
0
10
20
30
40
50
60
70
80
90
100
ns Tetralin(2:1)
Tetralin(1:1)
Coal-oil THQ
Co
nvers
ion
s (d
af)
Oil+Gas
Asphaltene
Preasphaltene
Total Conversion
Figure 2. Main product distribution of catalytic liquefactionof BM-coal at 450°C in the presence of different solvents.
When the BM coal samples were liquefied at 450 °C theoverall conversions were all higher in all solvents compared tothe corresponding values obtained at 400 °C (Figure 2). Again1:1 tetralin-to-coal ratio yielded higher oil+gas and asphalteneyields compared to the 2:1 case. With this coal overallconversion and all specific yields in 1:1 tetralin case werealmost identical to the corresponding values obtained withTHQ though the yield of gas+oil was a little higher intetralin. At this temperature and pressure, tetralin could be insupercritical phase, but since there were relatively considerableamount of heavy components from coal in the same medium,this would not be a high possibility. Nevertheless, tetralinshould be more mobile at this temperature compared to THQsince the latter has relatively strong interactions with coalstructures via its -NH functional moiety, and in this waytetralin might be balancing the advantage of –NH inquenching radicals faster than –CH.
Tetralin has been used as the only solvent in theliquefaction experiments done with the other lignite, namelySivas Kangal (SK). The results obtained with the liquefactionexperiments done at 400 °C are given in Figure 3.
0
10
20
30
40
50
60
70
80
90
100
ns Tetralin (2:1) Tetralin (1:1)
Co
nvers
ion
s (d
af)
Oil+Gas
Asphaltene
Preasphaltene
Total Conversion
Figure 3. Main product distributions of catalytic liquefactionof SK-coal at 400°C in the presence of solvents.
Here, both the total conversion and the oil+gas yield werehighest in the run where the tetralin-to-coal ratio was 2:1.Oil+gas yield reached 70 % whereas the corresponding valuefor BM coal was only 45 %.
When the results obtained in liquefaction experimentsdone at 450 °C are investigated one can notice that again totalconversion and the oil+gas yield are highest in the run wheretetralin-to-coal ratio was 2:1. Actually, in this experimentthere was no preasphaltene, and only very little asphaltene hadformed, the remainder being oil+gas fraction where the yieldapproaches 90 %.
One important observation regarding liquefactionbehaviour of two lignites in tetralin was that 2:1 ratio oftetralin to coal had some detrimental effect in the liquefactionof BM coal when compared to 1:1 ratio case, but the reversewas true with the other coal (SK). The reason should lie in thestructural differences in these two coals. BM has a higher rankthan SK, i.e. more condensed aromatic structures are likelypresent in BM, while SK has more aliphatic structures that areprobably in substituted forms on aromatic ring systems .These differences in structures determine the extent of
interaction of tetralin molecules with the coal structures, suchthat tetralin would interact with the aromatic ring systems inBM more effectively than in SK. With 2:1 tetralin:coal ratio,too many tetralin molecules will solvate aromatic moietiesfrom BM and hinder the interaction of coal structures with theactive hydrogen sites on catalyst particles. On the other hand,the radical cleavage reactions in SK would be faster than inBM and more tetralin molecules (2:1 case) this time will bean advantage to quench more radicals compared to the 1:1case.
0
10
20
30
40
50
60
70
80
90
100
ns Tetralin (2:1) Tetralin (1:1)
Co
nvers
ion
s (d
af)
Oil+Gas
Asphaltene
Preasphaltene
Total Conversion
Figure 4. Main product distributions of catalytic liquefactionof SK-coal at 450°C in the presence of solvent.
ConclusionsThe liquefaction characteristics of a series of high-sulfur
lignites of Turkey with high volatile matter and high mineralmatter contents are being investigated, and this work hereconstitutes a part of these investigations. These lignites showquite different responses to similar liquefaction conditions dueto the structural differences in the main organic framework andalso due to the differences in mineral matter composition. Thetwo lignites whose liquefaction results are given here havequite different structural characteristics. BM has a considerablesulfur content (much more than SK) and most of these are partof the organic structures. The other lignite (SK) has a highoxygen content. The portion of the heteroatoms which are onthe peripheries of aromatic ring systems in the form ofcarboxyls, phenolics, or other functional groups could cleaveeasily in the beginning stages of liquefaction reactions.Possibly the 2:1 ratio of tetralin to coal effectively stabilizedthe radical sites formed due to these fast cleavages. On theother hand, these types of cleavages of oxygen functionalitiesand short alkyl chains from the periphery of aromatic systemsmainly produce gaseous products and do not help much in theformation of oils and asphaltene/preasphaltene products. Thisalso explains why more tetralin was necessary to hydrogenateand quench the radical sites being formed in the mainreactions leading to the formation of oil, asphaltene andpreasphaltenes during liquefaction of SK lignite.
AcknowledgementThis work was funded by Turkish Scientific and
Technical Research Council (TUBITAK). HHS also thanksNATO for funding for a visit to Çukurova University and thiscollaborative interchange.
References(1) Birön, C. In International Coal Technology Seminar; ITU:
Istanbul, 1983; pp 23-52.(2) Gözmen, B.; Artok, L.; Erbatur, G.; and Erbatur, O. Energy
Fuels, 2002, 16, 1040(3) Naumann, A. W. 1981; US Patent No. 4243554.(4) Curran, G. P.; Struct, R. T.; and Gorin, E. Prep. Pap.-Am.
Chem. Soc., Div. Petroleum Chem., 1966, 130.(5) Curtis, C. W.; Tsai, K. J.; Guin, J. A. Fuel Processing
Technology, 1987, 16, 71.(6) Derbyshire, F. J.; Davis, A.; Epstein, M. J.; and Stansberry, P.G. Fuel, 1986a. 70, 372.(7) Derbyshire, F. J.; Davis, A.; Epstein, M. J.; and Stansberry, P. G. Fuel, 1986b, 65, 1233.(8) Yoon, E.M.; Selveraj, L.; Song, C.; Stallman, J.B.; and Coleman, M.M. Energy Fuels, 1996, 10, 806(9) Yoon, E.M.; Selveraj, L.; Eser, S.; and Coleman, M.M.
Energy Fuels, 1996, 10, 812(10) Davies, G. O.; Derbyshire, F. J.; and Price, R. J. Inst. Fuel,
1977, 50,121.(11) Bockrath, B. C. In Coal Science,; Vol. II. Gorbaty, M. L.; J.
W. Larsen; J. Wender, Eds.; Academic Press: N. Y., 1983; p.65.
Primary Studies on Reaction Mechanism of TSRFCC Technology
Jian-Wen Wang, Yu-Dong Sun, Hong-Hong Shan, Chao-He Yang
and Jian-Fang Zhang
State Key Lab of Heavy Oil Processing, University of Petroleum, 271 North Second Road, Dongying 257061, China
Introduction
Fluid catalytic cracking process (FCC) is one of the most important processes for converting heavy oil into light fuels, and it provides nearly 85% of gasoline and 30% of the diesel oil in China. But the FCC feedstock becomes heavier and heavier and requirements of the environmentally-cleaner fuels are larger and larger, especially, the olefin, sulfur and benzene contents of gasoline are greatly limited. So it is a challenge to residue fluid catalytic cracking (RFCC) technology which has been developed in the recent decades. The RFCC technology has got great development around the reaction system [1-3], such as feeding atomization and stream stripping of high efficiency, fast separation of gas (oil vapor) and solid (spent catalyst) and reaction termination technology, and so on.
Although the feedstock of RFCC is different from that of distillate FCC and many technologies attached to the reactor have appeared, the reactor, riser, is the same for RFCC and FCC process yet. The disadvantages of the conventional riser reactor become more obvious, including too long reaction time, low catalyst activity and poor selectivity and harmful competition of different reactants [4]. In order to improve the product distribution, as well as reduce the olefin content and keep or raise the octane number of FCC gasoline and increase light oil yield and diesel oil/gasoline ratio, the two-stage riser FCC (TSRFCC) technology which is one of the advanced technologies in China was put into industrial test in May, 2002. The reaction mechanism of the commercial TSRFCC riser is studied according to commercial production data and analysis of products including oily catalyst, gas and liquid obtained by a special sampling system [4-5].
The Features of the TSRFCC-I technology
For the TSRFCC technology, the two optimized riser reactors replace the conventional single riser reactor, and the features are described as catalyst in relay, short reaction time, subsection reaction and high catalyst/oil (C/O) ratio. It can be classified by the different configurations and production schemes. For TSRFCC-I technology, the fresh feedstock is put into the first riser and react with the regenerated catalyst to a proper extent. The diesel distillate as the final product is separated from the first riser, and then the heavy oil (or the mixture of heavy oil and gasoline which need reduce the olefin content) is fed into the second riser reactor. Thus this operation can reduce over-cracking reactions of diesel oil and raise the ratio of diesel/gasoline. Because the regenerated catalyst replaces the spent catalyst, the average activity of catalyst can be enhanced, which results in increase of cracking, hydro-transfer and isomerization reactions of the olefin of gasoline. The olefin of gasoline decreases to a required criterion. If the olefin reduction of gasoline is not exigent,
the recycling heavy oil as the feedstock of the second stage contacts with high activity catalyst. The reaction result can increase the yield of light oil and the processing capacity of equipment.
There are five RFCC units modified by the TSRFCC-I technology, including the RFCC units of Shenghua refinery, Huabei, Changqing, Jinxi and Liaohe Petrochemical factories (ShRFCCU, HbRFCCU, CqFCCU, JxRFCCU and LhRFCCU).
Experimental.
For studies on reaction mechanism of the TSRFCC technology and understanding the true reaction behavior of the commercial riser reactor, a special sampling system is developed by the State Key Laboratory of Heavy Oil Processing, University of Petroleum. The configurations and work principle are offered by a few published papers [6-7]. So the oily catalyst, liquid and gas products of TSRFCC units are obtained from CqFCCU, JxRFCCU and LhRFCCU. From commercial production data and analysis of experiment results, the yields of exit products of the riser, production distribution and composition of gasoline are obtained.
The pressure-measuring points of the unit are used as the sampling points of the commercial TSRFCC riser. In general the sampling points are located near to the exit of riser. The sampling points of JxRFCCU and LhRFCCU are located on the horizontal section of the exit for the two-stage riser reactor. But for CqFCCU, the sampling point of the first stage is located one meter under the horizontal stage of the exit, and the sampling point of the second stage on the horizontal section.
For CqRFCCU, the atmospheric residue, AR, is the RFCC feedstock. The feedstock of the first stage riser (FSCq) is AR and a part of recycle oil, 2610 ton/day and 60 ton/day respectively, the second (SSCq) is recycle oil, 1179.7 ton/day. The oil vapor from two risers enters into the same settler. LhRFCCU processes the AR of the mixture of 70% Daqing crude oil and 30% Liaohe crude oil. The feedstock of the first stage (FSLh) is AR, 1857.21 ton/day, the light recycle oil (LRO), the heavy recycle oil (HRO) and recycle gasoline, 344.4, 119.52 and 480.96 ton/day, are injected into the second stage riser. The first stage feed of JxRFCCU (FSJx) is the atmospheric wax oil, 2422 ton/day, and the second stage feed is LRO and HRO, 1364.88 and 63.12 ton/day. Properties of the Different Feedstock are shown in Table 1.
Analysis of the sampling products Composition of the gaseous products. The composition of
gaseous product in the riser reactor reflects the cracking types and extent, which can be obtained from the dry gas. As the too large deviation of product distribution between sampling and unit material balance for CqRFCCU, only the results for JxRFCCU and LhRFCCU were obtained.
It is well shown in Table 2 that the ratio of (C1+C2)/(C3+C4), which describes the capacity of thermal cracking and catalyst cracking, increases a little at the second stage of JxRFCCU. This means that the extent of thermal cracking at the second stage is more exquisite. At the same time the ratio of (C3
=+C4=)/(C3+C4)
also increases. The main reason is that the reaction temperature of the second stage is 10K higher than that of the first stage. It is helpful for cracking reaction and bad to hydro-transfer reaction at high temperature. Thermal cracking reaction produces much (C1+C2) and olefin, as shown in Table 2.
Table 2 Composition of the gaseous products for JxRFCCU
For the main aim of the second stage of LhRFCCU is reducing the olefin content of gasoline, the reaction condition is a little tempered. Recycle gasoline possesses a large proportion of the feedstock of the second stage riser. The olefin cracking reaction of gasoline is very marked. So a lot of (C3+C4) and a little (C1+C2) are produced, which cause the enormous increase of LPG and (C3+C4)/(C1+C2). As the same time, a part of gasoline is consumed. This makes the actual production of gasoline smaller.
Table 3 Composition of the gaseous products for LhRFCCU*
Components 1st stage 2nd stage C1+C2 9.19 3.55
C3+C4 68.62 64.05 (C3+C4)/(C1+C2) 7.47 18.04
* Except recycle gasoline yield at the second stage, the yield of dry gas decreases by 1.13 percents from 3.13% to 2.00%, while the yield of LPG increases 6.98 percents from 9.27 to 16.25.
Composition of gasoline. From the theories mentioned above, the TSRFCC-I technology can reduce the olefin content of gasoline at the second stage riser obviously when the gasoline is recycled. The analysis results of sampling products of LhRFCCU are representative. Table 4 describes the result of olefin reduction of LhRFCCU after using TSRFCC-I technology. Compared with the first stage riser, the olefin content of gasoline at the exit of the second stage riser reduces by 7.96 percents from 35.66% to 27.70%, and the contents of aromatics, naphthalene and paraffin increase by 1.93, 0.76 and 5.16 percents respectively. Most of all, the content of iso-paraffin increase by 5.86 percents from 31.69% to 37.55%. The reasons are summarized as follows: (1) The function of olefin reduction of
gasoline is not marked at the second half of the conventional riser reactor because of the low activity and selectivity catalyst. But for the TSRFCC technology the gasoline contacts with the regenerated catalyst at the second stage riser, the olefin cracking, hydro-transfer and isomerization reactions of gasoline are promoted. (2) The feeding nozzle of gasoline is in the front of that of heavy oil at the second stage riser, which means that the gasoline firstly enters into the riser reactor and contacts with the fresh catalyst. Thus this operation avoids adsorption influence of the big molecular components on the reactions of gasoline. The environment is clean to make gasoline reduce olefin. What’s more, the hydro-transfer and isomerization reactions of gasoline induce the increase of iso-paraffin in gasoline. In spite of a big extent of the olefin content reduction, there is no significant change in RON, MON and anti-knock index of gasoline. The results can be explained by the increase of aromatics and iso-paraffin that make up the loss of octane number because of olefin reduction.
Table 4 Properties of Gasoline for LhRFCCU
FSLh,m% SSLh,m%
n- 6.21 3.80 Paraffin
iso- 31.69 30.90
Naphthene 9.28 10.04
Aromatics 17.10 19.03
Olefin 35.66 27.70
RON 92.0 92.3
MON 78.9 79.2
Anti-knock index 85.8 85.8 However, the olefin content of gasoline at the second stage exit
is a little more than that of the first stage exit for JxRFCCU (Table 5). This is result of the higher reaction temperature (by 10K), low catalyst/oil ratio and no recycle gasoline in the second stage riser.
Table 5 Properties of Gasoline for JxRFCCU*
FSJx, m% SSJx, m%
n- 4.25 3.80 Paraffin
iso- 31.87 30.90
Naphthene 9.81 7.50
Aromatics 16.38 17.56
Olefin 37.98 40.76
RON 93.9 94.6
MON 80.6 81.2
Anti-knock index 87.2 87.9 *Temperature of the first stage: 777K, Pressure: 300.97KPa,C/O=4.01; Temperature of the second stage: 787K, Pressure: 267.33KPa, C/O=3.74
Comparison of product distribution with the conventional
riser. The product distribution has been improved by TSRFCC technology. The commercial production data and the sampling analysis data can account for the advantages of TSRFCC. The production data of the conventional riser FCC (OSRFCC) and TSRFCC are shown in Table 6 for CqRFCCU and LhRFCCU.
Liquid products, m% 85.38 86.96 84.38 85.87 (*statistically average production data of Jan-Mar of 2003, ** statistically
average production data of Aug-Oct of 2002, *** (C1+C2+Coke+ Loss=13.5m%) For two RFCC units of CqRFCCU and LhRFCCU, the contents
of both dry gas and coke decrease while the yields of LPG, light oil and liquid products increase after the revampment. The studies on reaction mechanism of the conventional RFCC technology suggested that the change of product distribution was drastic at the initial stage of the conventional riser reactor [8], that is to say, most of the heavy oil are cracked into gas, liquid and coke, and most of gasoline and diesel oil produced at the initial stage, especially at the mixing zone of feedstock and catalyst. So at the later stage the over-cracking reactions of the intermediate products deteriorate the product distribution. By the revampment with TSRFCC-I technology, the high activity and selectivity regenerated catalyst used at the second stage riser strengthens the catalytic cracking reaction while reduces the disadvantageous reactions efficiently. In the meanwhile, the diesel oil is separated as part of the final products after the first stage riser, which avoids the over-cracking reactions and enhances the yield and selectivity of the diesel oil. In CqRFCCU, the diesel oil yield increases by 5.8 percents. The dry gas yield decreases by 0.48 percents and coke yield decreases by 0.49 percents, while LPG yield increases by 0.18 percents from 14.37m% to14.55m%. In LhRFCCU, the yields of diesel oil and LPG increase by 2.52 and 1.44 percents respectively. The gasoline yield reduces a little. But although the diesel oil yield increases and the light oil yield doesn’t reduce, the liquid products yield increases by 1.5 percents. Conclusion
From analysis of the sampling products, the product distribution, conversion and composition of gasoline for two riser reactors were achieved respectively. The olefin reduction of the gasoline and the increase of LPG content are very obvious when the gasoline was recycled at the second stage riser. TSRFCC technology could enhance the diesel oil and liquid yields compared with the conventional FCC.
Acknowledgements. This work was supported by the PetroChina and the Ministry of Education. Thanks Zhong-xiang Han, Jin-you Wang, Yong-shan Tu, Jun-sheng zheng for their work in analysis of products. References (1) Gen-Lin Niu, Xin-Yuan Wang. Petrochemical Technology&Application, 2001, 19(3): 169-173 (2) Ting-Zhao Yan. Oil and gas processing, 1997, 7(3): 40-44
(3) ZhanYou Cao, ChunXi Lu, MingXian Shi. Petroleum Refinery Engineering, 1999, 29(3):14-18 (4) Chao-He Yang, Hong-Hong Shan, Jian-Fang Zhang, Feng Du and Yu-Dong Sun. 2nd International Symposium on Better Understanding and Utilization of Havy Oil, 2003, Beijing (5) Chun-Ming Xu, Shi-Xiong Lin, Liang-Gong Lu. Petroleum Refinery Engineering, 1997, 27(3): 39-42 (6) Jian-Fang Zhang, Hong-Hong Shan, Chao-He Yang. US Patent, 2002,
Application Number:0108887A1 (7) Hong-Hong Shan, Wei Zhao, Chang-Zheng He, Jian-Fang Zhang and Chao-He Yang. Preprints, Division of Petroleum Chemistry, ACS. 2003, 48(2): 710-711 (8) Jun-Sheng Zheng, Chao-He Yang, Gen-lin Niu, Feng Du, Hong-Hong Shan and Jian-Fang Zhang. Preprints, Division of Petroleum Chemistry, ACS. 2003, 48(2): 704-705
The Influence of FCC Catalyst with Different Coke Deposition on the Reaction Mechanism
of Olefins in Gasoline
Yu-Xia Yuan, Chao-He Yang, Hong-Hong Shan, Jian-Fang Zhang, Zhong-Xiang Han
State Key Lab of Heavy Oil Processing, University of Petroleum, 271 North Second Road, Dongying 257061, China, Fax: 86-546-
8391971
Introduction With the increasing attentions to global environment, the olefin
content in specifications of gasoline product is limited. Because a lot of gasoline is produced by FCC process, so it becomes a new subject to reduce the olefin content and increase the content of isoalkane and aromatics with high Octane Number in catalytic cracking gasoline.
The key of reducing olefin is to favor H-transfer, isomerization and aromatization reactions. H-transfer can obviously reduce the olefin content, with the loss of the Octane Number of gasoline. Isomerization and aromatization reactions just could compensate the reduction of Octane Number. But compared with cracking reaction, the reaction rates of these three are slower. Because olefins in gasoline are middle products of FCC process, the catalysts in riser have partly lost selectivity and activity after initial reactions, which will handicap the secondary reactions of olefins [1]. Therefore studying the mechanisms of olefins reactions on the regenerated and spent catalysts with different coke deposition is very important to the developments of catalysts and technologies aiming reducing olefins.
Experimental
In this paper, pulsating reaction system (Fig 1) and a mini reactor with 1.5 mm i.d. (Fig 2) were employed to investigate the reaction of FCC gasoline. FCC gasoline was obtained from Shenghua Refinery, the catalyst is ZC-7300, which is produced in Zhoucun Catalyst Factory and also obtained from FCC unit of Shenghua Refinery.
Figure 1. Reaction System Figure 2. Structure of reactor
Results and Discussion
FCC reactions over ZC-7300 catalyst were carried on the fixed bed reactor, and spent catalysts with different coke deposition (0.5wt%,1.2wt%,2.5wt%) have been prepared previously. The data
of gasoline cracking results on different catalysts were given in Table 1.
Firstly, the results showed that olefin content was all reduced more or less after reaction on different kinds of catalyst. When the coke content in catalyst is less 0.5wt%, the olefin content was reduced by 17 percent (compared with that of feed gasoline); while when coke content on catalyst is 1.2wt% or 2.5wt%, olefin content reduced by about 10 percents.
Table 1 The reaction results of FCC gasoline at 773K
Note: C3,C4 ,which are not gasoline components, were not included in the olefin content.
Secondly, the content of naphthenes has nearly not changed after reactions, while isoalkane content and aromatics content have increased greatly. But the coke content on catalyst has no obvious influence on the latter both. The increase of contents of isoalkanes, aromatics and C3+C4, as the result of the processes of hydro-transfer, aromatization and cracking reaction, caused the reduction of olefins.
Selectivity of reactions. Selectivities are defined in order to
analyze the influence of the coke in catalyst on the different reactions of olefins. Here, the ratio of the yield of C3+C4 to the reacted olefin fraction was defined as the cracking selectivity (SC), and the increase of alkanes to the reacted olefin fraction was selectivity of hydro-transfer (SH), and the increase of aromatics to the reacted olefin fraction was aromatization selectivity (SA). Then the curves of the selectivities versus the coke content on catalyst were given in Fig 3.
0.0 0.5 1.0 1.5 2.0 2.50.0
0.1
0.2
0.3
0.4
0.5
0.6
0.7
0.8
0.9
the
sele
ctiv
ity o
f eac
h re
actio
n
the content of coke in catalyst wt%
SC SA SH
Figure 3. Changes of Selectivity with the Content of Coke
From Fig 3, with the increase of the coke in catalyst, the selectivity of cracking reaction decreases gradually, those of H-transfer and aromatization increase, and the selectivity of H-transfer reaches in a relatively stable level over 1.0% coke content on catalyst. The C3, C4 hydrocarbons in products can be looked as the outcome of straight cracking of olefins with above 7 carbons. The process of hydrocarbon reactions includes monomolecular and double-molecular reactions, and the ratio of the two kinds of reaction determines the distribution of products.
According to the Rideal’s Mechanism [2], the double-molecular reactions in cracking process occur between the Carbonium Ions adsorbed on the active sites and hydrocarbon molecules in gas phase, so it happens on single acid site. The ratio of monomolecular and double-molecular reactions is relative to the characters of acid centers and the concentration of hydrocarbons in gas phase. With coke deposition on catalyst, the concentration of active centers decreased, which caused the decrease of monomolecular cracking selectivity. But because of coke deposition, the smaller pores in catalyst were jammed, which caused the average pore radius of catalyst increase. As large pores are propitious to double-molecular reactions, so the selectivity of hydro-transfer and aromatization reactions increased.
It is a perfect reducing olefin result to farthest kill olefins, and keep high gasoline yield and high Octane Number at the same time. At the current reaction conditions (reaction temperature is 773K), the catalyst activity had better not be too high, as the higher the activity is, the higher the cracking selectivity is, this will result in the high yield of C3, C4 will be high, and the serious loss of gasoline yield. According to the primary research, using catalyst with 0.5-1.0(wt)% coke deposition, higher ratio of olefin reduction can be kept and high gasoline yield and high selectivity of hydro-transfer and aromatization reactions obtained.
Rules of olefin molecules reaction. It is important to study the
mechanism of olefin molecules reaction for clearing olefins conversion process and selecting proper operation conditions. As the activation energy of H-transfer increases with the chain length of olefins, while that of cracking reactions decreases. Then the cracking activity increased with the carbon number of olefins. However, it can be seen from the results (Table 2) that the reduction extent of C6-C8 olefins is little, but that of C5 olefins is the largest.
According to Corma [3], Carbonium Ions formed from the straight chain olefins bellow C6 will crack inβsite directly before isomerization or rearrangement. While Carbonium Ions larger than C6 will isomerize or rearrange beforeβ-Scission. This explains the dramatic decrease with carbon number of the cracking rates of C5-C8 olefins, as indicated by Buchanan et al. What’s more, the retaining time of this experiment is very short, and it has no time to isomerizes and rearrange. And the test result just proved the Corma’s conclusion.
And that, the ratio of C4=/C3
= (wt) (it’s 2.12 in products) indicated that C3, C4 were not all formed by direct β-Scission of heptene, then part of C3, C4 should be from direct β-Scission of olefins above C9, or from olefins’ cracking after polymerization. At
the same time, there is no C1 or C2 in products, which proved that pentenes can not straightly crack. And in olefins reaction study of pure compounds, there was no β-Scission for pentenes. All these phenomena suggested that pentenes should first polymerize with themselves or other olefins, and then crack.
The result of study to 1-heptene proved that 1-heptene mainly cracked at 773K, with more than 47(wt)% of yield of propylene and iso-butylene[4]. While in this experiment, C7
= in gasoline only decreased by 0.7 percent after reactions, much less than that for 1-heptene. And the change of alkanes and aromatics of C7 in gasoline also suggested that it is impossible for C7
= to directly aromatize and H-transfer, the same is C6
=. In a word, the coexistence of hydrocarbons will obviously influence the mechanisms of hydrocarbon molecules reaction, at least affect the product distribution. As it is impossible to reduce olefins in gasoline in molecule circumstance, then studying the mechanism of interactions among hydrocarbons has obviously realistic meanings.
Table 2 The hydrocarbons composition of upgraded gasoline
alkanes/wt% naphthenes/wt% olefins/wt% aromatics/wt% Carbon number before after before after before after before after
Quality of upgraded gasoline. It is the most ideal result to convert olefins in gasoline to iso-alkanes above C5 and aromatics, because they have high Octane Number and will not influence the gasoline yield. So the content of iso-alkanes and aromatics in gasoline is also one of aspects to upgrade. Fig. 4 gave the mutative curves of the content of iso-alkanes , aromatics and naphthene in upgraded gasoline with temperature on different catalysts.
The three hydrocarbon in products should be the outcomes of straightly H-transfer or H-transfer following isomerizations of olefins, and the yield will be influenced by H-transfer and isomerization reactions. From the Figure 4, the lower the coke content on catalyst is, the higher their content in upgraded gasoline is. And the content of them in upgrade gasoline increases with temperature increasing, reaching the culmination (about at the temperature of 673K), and then declines.
Figure 4. The content of iso-alkanes , aromatics and naphthene in
upgraded gasoline influenced by temperature As shown in Fig3, the selectivity of H-transfer increased with
the coke content on catalyst increased, it seems that this phenomenon of these curves in Fig 4 is in conflict with that conclusion. But it is because that the content of isoalkane, naphthene and aromatics is the integrated result of H-transfer, aromatization, isomerization reactions. Although higher coke content could favor H-transfer and aromatization, which also causes the increase of normal alkanes, it will restrain cracking reaction at the same time. Then the yield of gasoline increases, and the relative content of iso-alkanes, aromatics and naphthene in upgraded gasoline decreases with coke content.
In a word, in terms of gasoline yield and quality, Using the spent catalyst with 0.5~1.0(wt)% coke, and at lower temperature (673K-773K), we can effectively reduce the content of olefins, and keep high gasoline yield and high selectivity of H-transfer and aromatization.
Conclusions
Under the conditions of very short contact time between the gasoline and catalyst, naphthenes in gasoline hardly react, and olefins decrease mainly via cracking reactions, H-transfer and aromatization.
High temperature and low coke content in catalyst can favor the cracking activity of olefin. Using the spent catalyst with 0.5~1.0(wt)% coke, we can effectively reduce the content of olefins, and keep high gasoline yield and high selectivity of hydro-transfer and aromatization. And lower temperature (673K-773K) will improve the distribution of hydrocarbons in the upgrading gasoline.
The obvious interaction of different hydrocarbon compounds in the upgrading process was found, the mechanism does not agree with that of pure olefin compounds.
Acknowledgements. We greatly appreciate the financial support given by the Ministry of Education, PetroChina and Sinopec to the research of this subject. References (1) Jun-wu Chen, Han-chang Cao; Catalyst Cracking Technology and
Engineering, Sinopec Press: Beijing, 1995.
(2) Wojciechowski B.W. The Reaction Mechanism of Catalytic
Cracking:Quantifying Activity, Selectivity and Catalyst Decay. Catalysis
Review, 1998,40(3):209-328.
(3) Corma A, Orchilles A.V., Current views on the mechanism of catalytia
cracking Microporous and Mesoporous Materials 35-36 (2000) 21-30.
(4) Zheng-Li, Mechanistic Studies on Solid Acidic Catalyzed Reactions of
Alkenes and Its Application in TSRFCC Technology, Ph.D. Dissertation,