Argonne National Laboratory, Argonne, IL 60439, USA∗[email protected]
Abstract: We have employed ptychographic coherent diffractive imagingto completely characterize the focal spot wavefield and wavefront aberra-tions of a high-resolution diffractive X-ray lens. The ptychographic datafrom a strongly scattering object was acquired using the radiation coneemanating from a coherently illuminated Fresnel zone plate at a photonenergy of 6.2 keV. Reconstructed images of the object were retrieved with aspatial resolution of 8 nm by combining the difference-map phase retrievalalgorithm with a non-linear optimization refinement. By numericallypropagating the reconstructed illumination function, we have obtained theX-ray wavefield profile of the 23 nm round focus of the Fresnel zone plate(outermost zone width, Δr = 20 nm) as well as the X-ray wavefront atthe exit pupil of the lens. The measurements of the wavefront aberrationswere repeatable to within a root mean square error of 0.006 waves, andwe demonstrate that they can be related to manufacturing aspects of thediffractive optical element and to errors on the incident X-ray wavefrontintroduced by the upstream beamline optics.
References and links1. H. C. Kang, H. Yan, R. P. Winarski, M. V. Holt, J. Maser, C. Liu, R. Conley, S. Vogt, A. T. Macrander, and
G. B. Stephenson, “Focusing of hard X-rays to 16 nanometers with a multilayer Laue lens,” Appl. Phys. Lett. 92,221114 (2008).
2. H. Mimura, S. Handa, T. Kimura, H. Yumoto, D. Yamakawa, H. Yokoyama, S. Matsuyama, K. Inagaki, K. Ya-mamura, Y. Sano, K. Tamasaku, Y. Nishino, M. Yabashi, T. Ishikawa, and K. Yamauchi, “Breaking the 10 nmbarrier in hard-X-ray focusing,” Nat. Phys. 6, 122–125 (2010).
3. J. Vila-Comamala, S. Gorelick, E. Farm, C. M. Kewish, A. Diaz, R. Barrett, V. A. Guzenko, M. Ritala, andC. David, “Ultra-high resolution zone-doubled diffractive X-ray optics for the multi-kev regime.” Opt. Express19, 175–184 (2011).
#152217 - $15.00 USD Received 9 Aug 2011; revised 9 Sep 2011; accepted 12 Sep 2011; published 12 Oct 2011(C) 2011 OSA 24 October 2011 / Vol. 19, No. 22 / OPTICS EXPRESS 21333
4. P. Thibault and V. Elser, “X-ray diffraction microscopy,” Annu. Rev. Condens. Matter Phys. 1, 237–255 (2010).5. K. A. Nugent, “Coherent methods in the X-ray sciences,” Adv. Phys. 59, 1–99 (2010).6. H. N. Chapman and K. A. Nugent, “Coherent lensless X-ray imaging,” Nat. Photonics 4, 833–839 (2010).7. J. R. Fienup, “Phase retrieval algorithms: a comparison,” Appl. Opt. 21, 2758–2769 (1982).8. J. Miao, P. Charalambous, J. Kirz, and D. Sayre, “Extending the methodology of X-ray crystallography to allow
imaging of micrometre-sized non-crystalline specimens,” Nature 400, 342–344 (1999).9. H. M. Quiney, A. G. Peele, Z. Cai, D. Paterson, and K. A. Nugent, “Diffractive imaging of highly focused X-ray
fields,” Nat. Phys. 2, 101–104 (2006).10. G. J. Williams, H. M. Quiney, B. B. Dhal, C. Q. Tran, K. A. Nugent, A. G. Peele, D. Paterson, and M. D.
de Jonge, “Fresnel coherent diffractive imaging,” Phys. Rev. Lett. 97, 025506 (2006).11. J. M. Rodenburg, A. C. Hurst, A. G. Cullis, B. R. Dobson, F. Pfeiffer, O. Bunk, C. David, K. Jefimovs, and
I. Johnson, “Hard X-ray lensless imaging of extended objects,” Phys. Rev. Lett. 98, 034801 (2007).12. P. Thibault, M. Dierolf, A. Menzel, O. Bunk, C. David, and F. Pfeiffer, “High-resolution scanning X-ray diffrac-
tion microscopy,” Science 321, 379–382 (2008).13. P. Thibault, M. Dierolf, O. Bunk, A. Menzel, and F. Pfeiffer, “Probe retrieval in ptychographic coherent diffrac-
tive imaging,” Ultramicroscopy 109, 338–343 (2009).14. C. M. Kewish, M. Guizar-Sicairos, C. Liu, J. Qian, B. Shi, C. Benson, A. M. Khounsary, J. Vila-Comamala,
O. Bunk, J. R. Fienup, A. T. Macrander, and L. Assoufid, “Reconstruction of an astigmatic hard X-ray beam andalignment of K-B mirrors from ptychographic coherent diffraction data,” Opt. Express 18, 23420–23427 (2010).
15. C. M. Kewish, P. Thibault, M. Dierolf, O. Bunk, A. Menzel, J. Vila-Comamala, K. Jefimovs, and F. Pfeiffer,“Ptychographic characterization of the wavefield in the focus of reflective hard X-ray optics,” Ultramicroscopy110, 325–329 (2010).
16. A. Schropp, P. Boye, J. M. Feldkamp, R. Hoppe, J. Patommel, D. Samberg, S. Stephan, K. Giewekemeyer, R. N.Wilke, T. Salditt, J. Gulden, A. P. Mancuso, I. A. Vartanyants, E. Weckert, S. Schoder, M. Burghammer, andC. G. Schroer, “Hard X-ray nanobeam characterization by coherent diffraction microscopy,” Appl. Phys. Lett.96, 091102 (2010).
17. M. Guizar-Sicairos, S. Narayanan, A. Stein, M. Metzler, A. R. Sandy, J. R. Fienup, and K. Evans-Lutterodt,“Measurement of hard X-ray lens wavefront aberrations using phase retrieval,” Appl. Phys. Lett. 98, 111108(2011).
18. S. Honig, R. Hoppe, J. Patommel, A. Schropp, S. Stephan, S. Schoder, M. Burghammer, and C. G. Schroer, “Fulloptical characterization of coherent x-ray nanobeams by ptychographic imaging,” Opt. Express 19, 16324–16329(2011).
19. G. Ingold, M. Boege, W. Bulgheroni, A. Keller, J. Krempaski, C. Schulze-Briese, L. Schulz, T. Schmidt, D. Zi-moch, T. Hara, T. Tanaka, and H. Kitamura, “Performance of small-gap undulators at the SLS intermediateenergy storage ring,” AIP Conf. Proc. 879, 388–391 (2007).
20. A. Menzel, C. M. Kewish, P. Kraft, B. Henrich, K. Jefimovs, J. Vila-Comamala, C. David, M. Dierolf, P. Thibault,F. Pfeiffer, and O. Bunk, “Scanning transmission X-ray microscopy with a fast framing pixel detector,” Ultrami-croscopy 110, 1143–1147 (2010).
21. B. Henrich, A. Bergamaschi, C. Bronnimann, R. Dinapoli, E. F. Eikenberry, I. Johnson, M. Kobas, P. Kraft,A. Mozzanica, and B. Schmitt, “PILATUS: A single photon counting pixel detector for X-ray applications,”Nucl. Instrum. Meth. A 607, 247–249 (2009).
22. P. Kraft, A. Bergamaschi, C. Bronnimann, R. Dinapoli, E. F. Eikenberry, H. Graafsma, B. Henrich, I. Johnson,M. Kobas, A. Mozzanica, C. M. Schleputz, and B. Schmitt, “Characterization and calibration of PILATUSdetectors,” IEEE Trans. Nucl. Sci. 56, 758–764 (2009).
23. K. Jefimovs, J. Vila-Comamala, T. Pilvi, J. Raabe, M. Ritala, and C. David, “Zone-doubling technique to produceultrahigh-resolution X-ray optics,” Phys. Rev. Lett. 99, 264801 (2007).
24. J. Vila-Comamala, S. Gorelick, V. A. Guzenko, E. Farm, M. Ritala, and C. David, “Dense high aspect ratiohydrogen silsesquioxane nanostructures by 100 kev electron beam lithography,” Nanotechnology 21, 285305(2010).
25. F. van der Veen and F. Pfeiffer, “Coherent X-ray scattering,” J. Phys.: Condens. Matter 16, 5003–5030 (2004).26. T. Aaltonen, M. Ritala, V. Sammelselg, and M. Leskela, “Atomic layer deposition of iridium thin films,”
J. Electrochem. Soc. 151, G489–G492 (2004).27. O. Bunk, M. Dierolf, S. Kynde, I. Jonhson, O. Marti, and F. Pfeiffer, “Influence of the overlap parameter on the
convergence of the ptychographical iterative engine,” Ultramicroscopy 108, 481–487 (2008).28. M. Dierolf, P. Thibault, A. Menzel, C. M. Kewish, K. Jefimovs, I. Schlichting, K. von Konig, O. Bunk, and
F. Pfeiffer, “Ptychographic coherent diffractive imaging of weakly scattering specimens,” New J. Phys. 12,035017 (2010).
29. M. Guizar-Sicairos and J. R. Fienup, “Phase retrieval with transverse translation diversity: a nonlinear optimiza-tion approach,” Opt. Express 16, 7264–7278 (2008).
30. A. M. Maiden, M. J. Humphry, F. Zhang, and J. M. Rodenburg, “Superresolution imaging via ptychography,”J. Opt. Soc. Am. A 28, 604–612 (2011).
31. P. Thibault, V. Elser, C. Jacobsen, D. Shapiro, and D. Sayre, “Reconstruction of a yeast cell from X-ray diffrac-
#152217 - $15.00 USD Received 9 Aug 2011; revised 9 Sep 2011; accepted 12 Sep 2011; published 12 Oct 2011(C) 2011 OSA 24 October 2011 / Vol. 19, No. 22 / OPTICS EXPRESS 21334
tion data,” Acta Cryst. A 62, 248–261 (2006).32. H. N. Chapman, A. Barty, S. Marchesini, A. Noy, S. P. Hau-Riege, C. Cui, M. R. Howells, R. Rosen, H. He,
J. C. H. Spence, U. Weierstall, T. Beetz, C. Jacobsen, and D. Shapiro, “High-resolution ab initio three-dimensional X-ray diffraction microscopy,” J. Opt. Soc. Am. A 23, 1179–1200 (2006).
33. K. Giewekemeyer, P. Thibault, S. Kalbfleisch, A. Beerlink, C. M. Kewish, M. Dierolf, F. Pfeiffer, and T. Salditt,“Quantitative biological imaging by ptychographic X-ray diffraction microscopy,” Proc. Natl. Acad. Sci. USA107, 529–534 (2010).
34. W. O. Saxton and W. Baumeister, “The correlation averaging of regularly arranged bacterial cell envelop protein,”J. Microsc. 127, 127–138 (1982).
35. M. van Heel and M. Schatz, “Fourier shell correlation threshold criteria,” J. Struct. Biol 151, 250–262 (2005).36. M. Guizar-Sicairos, S. T. Thurman, and J. R. Fienup, “Efficient subpixel image registration algorithms,” Opt.
Lett. 33, 156–158 (2008).37. M. Guizar-Sicairos, A. Diaz, M. Holler, M. S. Lucas, A. Menzel, R. A. Wepf, and O. Bunk, “Phase tomography
from X-ray coherent diffractive imaging projections,” Opt. Express (to be published).38. J. W. Goodman, Introduction to Fourier Optics, 2nd ed., (The McGraw-Hill Companies, Inc., New York, 1996)
Chap. 3, Foundations of Scalar Diffraction Theory, pp. 55–62.
1. Introduction
Advances in the manufacture of high-resolution X-ray optics [1–3] capable of focusing X-raybeams into focal spots of a few tens of nanometers in size requires the development of newcharacterization methods. Conventional techniques such as the use of knife-edge scans or well-characterized test objects cannot achieve a full evaluation of the performance of the focus-ing device. Furthermore, such techniques can only provide limited feedback for improvementsin the fabrication technology and alignment routines of nanofocusing X-ray optics. Coherentdiffractive imaging (CDI) and phase retrieval techniques [4–6] offer the unique capability ofretrieving the complex-valued wavefield distribution of electron, visible light and X-ray wave-fronts from one or more far-field intensity measurements. Although CDI methods were initiallyintended to overcome the spatial resolution limitations of lens-based imaging of the sampleunder study [7, 8], they have also been proven as a very effective approach to gain insight ofthe incident X-ray beam illuminating the object [2, 9, 10]. In particular, ptychographic coher-ent diffractive imaging (PCDI) techniques [11–13] have been demonstrated as a compellingmethod to assess the quality of the nanofocused X-ray beams and evaluate the performance ofhigh-resolution X-ray optics such as mirrors [14, 15] and refractive lenses [16–18].
In this work we used PCDI to investigate the focusing capabilities of a high-resolutiondiffractive X-ray lens, i.e., a Fresnel zone plate (FZP), capable of focusing multi-keV X-raysinto a round focal spot 23 nm wide [3]. Ptychographic scans on a nanopatterned object wereemployed to reconstruct the X-ray complex-valued wavefield of the out-of-focus illuminationprovided by the high-resolution FZP. By numerically propagating the reconstructed wavefieldalong the optical axis to the focal plane, we have obtained a full characterization of the fo-cusing performance of the FZP. Furthermore, by propagating the wavefield to the exit pupilof the diffractive lens, we can evaluate the wavefront aberrations both related to its manufac-ture and the upstream beamline optics. These results demonstrate that PCDI is an excellentmethod to characterize high-resolution diffractive X-ray optics and provides valuable feedbackfor improvements of manufacturing and alignment procedures.
2. Experimental Methods
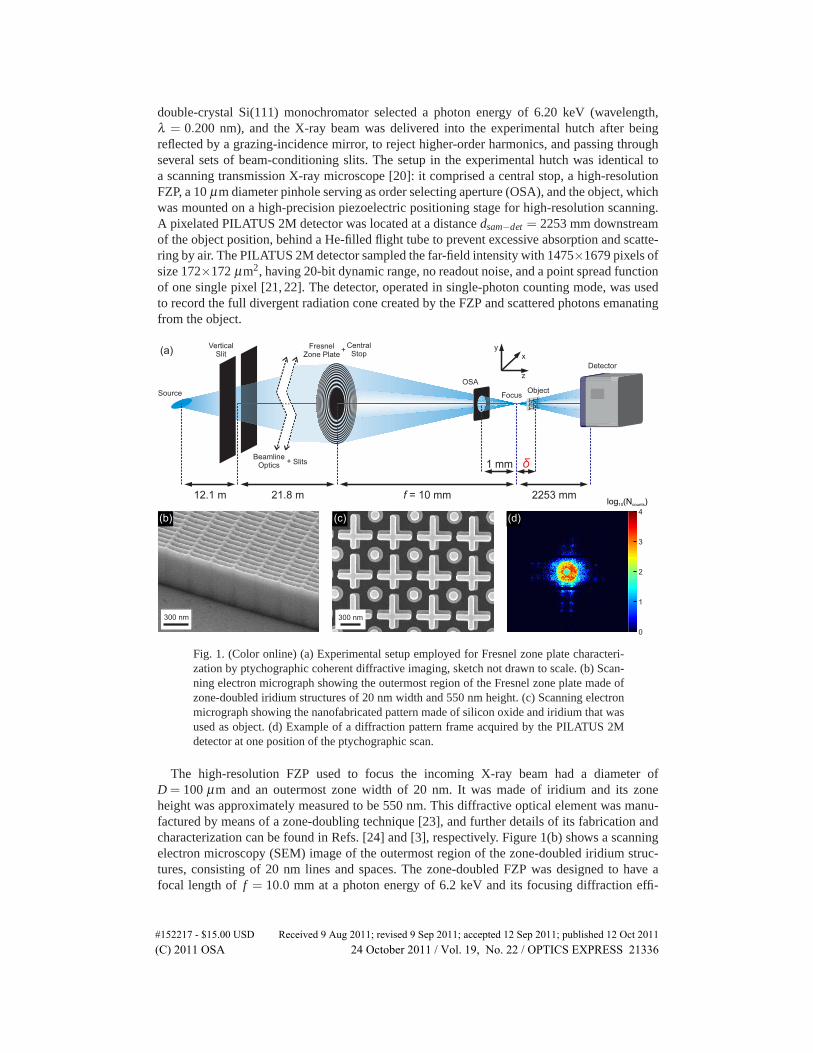
The experiments were carried out at the coherent small angle X-ray scattering (cSAXS)beamline of the Swiss Light Source, Paul Scherrer Institut. Figure 1(a) shows the schemeof the experimental setup employed to acquire the ptychographic data. The X-ray beamwas extracted from an U19 undulator insertion device [19] with an estimated photon sourcesize of 200×20 μm2 horizontal×vertical (H×V) full width at half maximum (FWHM). A
#152217 - $15.00 USD Received 9 Aug 2011; revised 9 Sep 2011; accepted 12 Sep 2011; published 12 Oct 2011(C) 2011 OSA 24 October 2011 / Vol. 19, No. 22 / OPTICS EXPRESS 21335
double-crystal Si(111) monochromator selected a photon energy of 6.20 keV (wavelength,λ = 0.200 nm), and the X-ray beam was delivered into the experimental hutch after beingreflected by a grazing-incidence mirror, to reject higher-order harmonics, and passing throughseveral sets of beam-conditioning slits. The setup in the experimental hutch was identical toa scanning transmission X-ray microscope [20]: it comprised a central stop, a high-resolutionFZP, a 10 μm diameter pinhole serving as order selecting aperture (OSA), and the object, whichwas mounted on a high-precision piezoelectric positioning stage for high-resolution scanning.A pixelated PILATUS 2M detector was located at a distance dsam−det = 2253 mm downstreamof the object position, behind a He-filled flight tube to prevent excessive absorption and scatte-ring by air. The PILATUS 2M detector sampled the far-field intensity with 1475×1679 pixels ofsize 172×172 μm2, having 20-bit dynamic range, no readout noise, and a point spread functionof one single pixel [21, 22]. The detector, operated in single-photon counting mode, was usedto record the full divergent radiation cone created by the FZP and scattered photons emanatingfrom the object.
OSAObject
Detector
FresnelZone Plate
CentralStop
+
Source
VerticalSlit
12.1 m f = 10 mm
1 mm
21.8 m 2253 mm
δ
Focus
(a)
(c)
300 nm300 nm
(b)
yx
z
BeamlineOptics Slits+
...
2
4
0
1
3
log (N )10 counts
(d)
Fig. 1. (Color online) (a) Experimental setup employed for Fresnel zone plate characteri-zation by ptychographic coherent diffractive imaging, sketch not drawn to scale. (b) Scan-ning electron micrograph showing the outermost region of the Fresnel zone plate made ofzone-doubled iridium structures of 20 nm width and 550 nm height. (c) Scanning electronmicrograph showing the nanofabricated pattern made of silicon oxide and iridium that wasused as object. (d) Example of a diffraction pattern frame acquired by the PILATUS 2Mdetector at one position of the ptychographic scan.
The high-resolution FZP used to focus the incoming X-ray beam had a diameter ofD = 100 μm and an outermost zone width of 20 nm. It was made of iridium and its zoneheight was approximately measured to be 550 nm. This diffractive optical element was manu-factured by means of a zone-doubling technique [23], and further details of its fabrication andcharacterization can be found in Refs. [24] and [3], respectively. Figure 1(b) shows a scanningelectron microscopy (SEM) image of the outermost region of the zone-doubled iridium struc-tures, consisting of 20 nm lines and spaces. The zone-doubled FZP was designed to have afocal length of f = 10.0 mm at a photon energy of 6.2 keV and its focusing diffraction effi-
#152217 - $15.00 USD Received 9 Aug 2011; revised 9 Sep 2011; accepted 12 Sep 2011; published 12 Oct 2011(C) 2011 OSA 24 October 2011 / Vol. 19, No. 22 / OPTICS EXPRESS 21336
ciency was experimentally measured to be 6.3% for this photon energy in previous experiments.An 18 μm-thick central stop roughly 35 μm in diameter was mounted on an additional stageabout 4 mm upstream of the FZP position. A relevant detail in the setup is that the zone-doubledFZP was located at about 34 m from the source, at which point the incident X-ray beam wasexpected [25] to have a transverse coherence area of 25×250 μm2 (H×V of FWHM). The hor-izontal dimension was thus too small to provide coherent illumination of the FZP aperture. Toovercome this limitation, at expense of a reduced photon flux, a vertical slit located at 12.1 mdownstream of the undulator source was used to create a secondary source and increase thetransverse coherence in the horizontal direction, as shown in Fig. 1(a). The nominal slit widthwas set to 25 μm while acquiring the ptychographic data. Thus, unlike in previous experi-ments [12], the zone-doubled FZP was fully rather than partially illuminated by the incidentcoherent X-ray beam, and it was expected to create a diffraction-limited focusing round spot of20.6 nm in size (FWHM). Notice that due to the use of the central stop and the OSA only the1st diffraction order of the FZP contributes to the illumination of the object. Thus, we are onlyinvestigating the focal spot and wavefield of the 1st diffraction order of the FZP.
The strongly scattering object was a nanofabricated pattern made of silicon oxide and iridiumby combining electron beam lithography and atomic layer deposition [26]. Initially, the siliconoxide structures were fabricated by electron beam lithography with a smallest feature size ofabout 50 nm. After that, the pattern was conformally coated with a 17 nm-thick layer of iridiumto enhance its X-ray scattering cross-section. As a result, the silicon oxide structures wereburied beneath a uniform iridium film covering both ridges and sidewalls of the original pattern.Figure 1(c) shows an SEM image of the object, in which only the uniform superficial iridiumlayer is revealed.
Prior to the ptychographic scans we used scanning transmission X-ray microscopy to deter-mine the focal plane position for the 1st diffraction order of the FZP. The position of the objectalong the optical axis could thus be precisely chosen. For the ptychographic scans the objectwas moved downstream from the focal plane by a distance δ = 75 μm. Scanning the objectwith an out-of-focus illumination function was convenient to increase the size of the illumi-nated area of the object to roughly S = δ D
f = 750 nm and allow larger scanning steps whilepreserving sufficient overlap of neighboring illuminated positions [27] and adequate samplingof the resulting speckle pattern by the PILATUS 2M detector. The diffraction patterns were col-lected by scanning a 2×2 μm2 area of the object in concentric circles [28], whose radii variedfrom 0.2 to 1 μm in steps of 0.2 μm. The scan started at the center position, and each circlecontained five more positions than the previous one. In this manner, 83 diffraction patterns, likethe one shown in Fig. 1(d), were collected with 0.5 s acquisition time each. A second scan wasrecorded immediately after translating the detector to a second position in order to acquire theinformation missing in the diffraction patterns due to the gaps between contiguous modules ofthe PILATUS 2M detector. In total, 166 diffraction patterns were collected in slightly less than2 min for each ptychographic scan.
From the original full frames acquired by the PILATUS 2M detector, we selected a squarewindow of 800×800 pixels centered at the radiation cone of the FZP as input data for the re-construction algorithm. The pixel size in the reconstructed image and probe, i.e., the complex-valued wavefield of the illumination function at the object position, was spixel =
λ · dsam−det800 · apixel
=
3.27 nm where apixel = 172 μm is the detector pixel size. The ptychographic reconstructionsof the object and probe were simultaneously obtained by the difference-map phase retrievalalgorithm [12, 13] after 300 iterations and an average computing time of 2 hours. The recon-structed object image was taken as the average of 20 reconstructions picked between the 200thand the 300th iteration [28]. This averaging reduced the contribution of fluctuating features thatwere not consistent as the iterations progressed. The result from the difference-map algorithm
#152217 - $15.00 USD Received 9 Aug 2011; revised 9 Sep 2011; accepted 12 Sep 2011; published 12 Oct 2011(C) 2011 OSA 24 October 2011 / Vol. 19, No. 22 / OPTICS EXPRESS 21337
was then refined through a maximum likelihood non-linear optimization [29]. This combinationexploits the ability of the difference-map algorithm to quickly explore the solution space, effec-tively converging to the neighborhood of the solution but usually oscillating around it. The op-timization is then used as a refinement step to retrieve an optimal solution in this neighborhoodby explicitly accounting for the Poisson statistics of the detection noise in the measurement.Additionally, for these reconstructions we used an optimization error metric that is insensitiveto fluctuations of the total beam intensity, such that these possible fluctuations bear no effecton reconstruction progress. This combination of the difference-map followed by optimizationrefinement yielded improved object image quality, reduced noise and increased reproducibil-ity in the reconstructed illumination function. Further details of this non-linear optimizationrefinement will be published elsewhere.
The two ptychographic scans, acquired at different lateral detector positions, were simul-taneously used by the phase retrieval algorithms. Using the known detector translation wematched the center of the diffraction patterns for both scans, and defined accordingly trans-lated binary masks that denoted where data from the module gaps was missing, i.e., the maskwas unity where data was measured and zero otherwise. The Fourier domain projection used bythe difference-map took into account these masks by imposing the measured intensity wherethe corresponding mask was unity and leaving the amplitude unchanged at the gaps, an ap-proach used in Ref. [12] to deal with detector dead pixels. For the optimization refinement weused a weighting function that excluded the pixels in the gaps from the computation of the er-ror metric, an approach that was described in Ref. [29] and experimentally proven in Ref. [14].Because the detector was moved between the two scans most of the data points lost due to thedetector gaps in the first position are measured in the second detector position. That is, mostpoints in Fourier domain were actually constrained by at least one measurement, thereby havingonly small (7x17 pixels) regions of missing data at relatively high diffraction angles. Given theability of PCDI to extrapolate measurements to achieve super-resolution [30] it is expected thatthese small regions of missing data bear a small effect on the reconstructions. This approachalso placed the adequate higher emphasis for the points in the diffraction patterns that weremeasured twice and avoids spurious edges that may appear for more conventional stitchingmethods and could have a detrimental effect on image quality.
3. Results and Discussion
3.1. Object Image Reconstruction
Although the main interest of this work is the characterization of the illumination function de-livered by the high-resolution FZP, the retrieved image of the nanopatterned object can be usedto assess the quality and reproducibility of the reconstruction method. Figure 2(a) shows the re-constructed phase image of the nanopatterned object. This image was obtained from the averageof two consecutive separate ptychographic scans that were acquired under the same conditionsbut independently reconstructed. As discussed below in detail, these two repeated images of thesame area of the object were retrieved to quantitatively assess image quality while accountingfor different noise realization in the measurements and experimental errors such as vibrationsor fluctuations in the illumination. The reconstructed phase image in Fig. 2(a) demonstratesvery good agreement with the SEM picture shown in Fig.1(c). The ptychographic reconstruc-tion can clearly resolve the smallest separation between sharp features, which is about 40 nm.In addition, the high contrast dark lines at the edges of the structure correspond to the 17 nmwide iridium layer conformally covering the buried silicon oxide structure that is not visiblein the SEM picture. The object image power spectrum, i.e., the squared-modulus of its Fouriertransform depicted in Fig. 2(b), shows that significant signal is obtained above the noise levelfor more than half of the computational window, corresponding to a half-cycle resolution of
#152217 - $15.00 USD Received 9 Aug 2011; revised 9 Sep 2011; accepted 12 Sep 2011; published 12 Oct 2011(C) 2011 OSA 24 October 2011 / Vol. 19, No. 22 / OPTICS EXPRESS 21338
0
- /10π
- /5π
π/10
π/5
(a)
[rad]
300 nm
40 nm
(b)
4
2
0
6
8
[log(PS)]
(c)
0 0.1 0.2 0.3 0.4 0.5 0.6 0.7 0.8 0.9 1.00
0.2
0.4
0.6
0.8
1.0
(Spatial Frequency)/Nyquist
Fourier
Rin
g C
orr
ela
tion
3 p
ixels
10 n
m≈
1.6
pix
els
5 n
m≈
FRC
1/2-bit threshold
1-bit threshold
Fig. 2. (Color online) (a) Ptychographic reconstructed phase image of the object consisitingof nanofabricated structures made of silicon oxide and iridium. (b) Power spectrum ofthe phase object image. (c) Fourier ring correlation (FRC) plot demonstrating a spatialresolution of 8 nm in the phase image of the object reconstruction.
2 pixels, or 6.6 nm, for both horizontal and vertical directions. However, a more accurate esti-mation of spatial resolution directly from the reconstructed image is difficult in this case sincethe actual sharpness of the features in the object is coarser than the spatial resolution.
In general, assessing the quality and the spatial resolution of reconstructed object images ob-tained by CDI algorithms is an important task. For CDI techniques involving a single diffrac-tion pattern a commonly used tool is the phase retrieval transfer function (PRTF) [31, 32],which gives a measure of the consistency of the retrieved phases in the Fourier domain for ei-ther different number of iterations or different random starting guesses of the object. In PCDI,the diffraction patterns are contributed by the two unknown functions that are being retrieved,namely the object and the probe, and it is then difficult to distinguish if the PRTF is associatedto the object or the probe. In addition, it has been pointed out that for PCDI the PRTF can besignificantly misleading for the reconstruction of weak scattering objects [28, 33].
Here, we have estimated the spatial resolution in the reconstructed object image using Fourierring correlation (FRC, also referred as Fourier shell correlation for its extension to three-dimensional imaging) [34, 35]. The FRC approach is a well-established technique for deter-mining the spatial resolution of two- and three-dimensional images in transmission electron
#152217 - $15.00 USD Received 9 Aug 2011; revised 9 Sep 2011; accepted 12 Sep 2011; published 12 Oct 2011(C) 2011 OSA 24 October 2011 / Vol. 19, No. 22 / OPTICS EXPRESS 21339
microscopy. It provides a curve of the normalized cross-correlation coefficient between two in-dependently acquired images at a given ring in the reciprocal space, hence giving a measure ofthe consistency of the image signal as a function of the spatial frequency, or resolution. As thesignal-to-noise ratio (SNR) for a particular spatial resolution is reduced, so is the FRC curve.To compute the FRC, two independent datasets were measured and reconstructed. Because thereconstructed object images can have a translation error between them, they were aligned withsubpixel precision using an efficient image registration method based on cross-correlation [36].Additionally, before the computation of the FRC a global and linear phase terms should bematched between the images, as these terms are inherent ambiguities for PCDI when both ob-ject image and illumination function are retrieved [37]. Finally, the edges of the object imageswere multiplied by a soft-edged mask in order to avoid the introduction of artificially sharp sim-ilarities at the edge of the computational window [35]. The FRC computed from these images,as function of spatial frequency, is shown with a solid line in Fig. 2(c). To give a quantitativeestimate of the image resolution from the FRC a threshold curve can be used. The thresholdcurve chosen here is an analytical expression independent of the image data for the expectedFRC for images with a SNR that is constant in the Fourier domain [35]. The threshold curveshown in Fig. 2(a) with a dotted line corresponds to the 1/2-bit criterion, that is, a flat SNR of0.41 in the Fourier domain. This criterion was introduced in Ref. [3] as a metric that producessimilar results as other tools currently used to estimate the resolution for X-ray crystallography.Figure 2(c) shows that the FSC cuts the threshold curve at a spatial frequency corresponding toa spatial resolution of about 8 nm, which indicates that at such resolution the SNR in the averageimage, shown in Fig. 2(a), drops below the threshold value. It is also remarkable that the FRCremains comparable to the 1/2-bit threshold curve at spatial frequencies down to 5 nm. A moreconservative estimate of 12 nm resolution is given by the 1-bit threshold curve in Fig. 2(c),which corresponds to a SNR of unity. From these FRC results and the image power spectrumwe estimate a spatial resolution of 8 nm in the reconstructed phase image of the object.
3.2. Focal Spot Wavefield and Wavefront Reconstruction
Ptychographic phase retrieval algorithms reconstruct both the object image, i.e., the complex-valued object transmission function, and the probe, the latter being the illuminating complex-valued wavefield at the object position. We can characterize the focal spot wavefield and lenswavefront aberrations corresponding to the 1st diffraction order of the high-resolution FZP byappropriately back-propagating the reconstructed probe along the optical axis.
As described in Sec. 2, the object was nominally located at a distance δ = 75 μm from thefocal plane. At this position, the X-ray beam was expected to be defocused with an expectedsize of S = 750 nm. Figure 3(a) shows the intensity distribution of the reconstructed wavefieldat this object position. Although the probe lacks uniformity and well-defined boundaries, wecan estimate the defocused X-ray beam size to be approximately 650 nm, thus slightly smallerthan expected. From the complex-valued wavefield at this position, the X-ray beam wavefield atthe vicinity of the focal plane can be numerically calculated by employing the angular spectrumapproach [38], which involves computing the Fourier spectrum of the wavefield by means of adiscrete Fourier transform (DFT), applying a multiplicative propagation transfer function andreturning to the real space using an inverse DFT. Figure 3(b) shows the intensity of the prop-agated wavefield of the planes XZ and YZ through the focus of the high-resolution FZP (theZ direction is taken along the optical axis of the experimental setup, as depicted in Fig. 1). Inthe plots, the intensity is shown on a logarithmic scale, to reveal more detail, and dashed linesmark the locations of the object and approximate focal plane (as labeled). The location of thepeak intensity in the propagated wavefield indicates that the actual distance of the focus to theobject was about 68 μm. This value, slightly shorter than the nominal δ = 75 μm, is consistent
#152217 - $15.00 USD Received 9 Aug 2011; revised 9 Sep 2011; accepted 12 Sep 2011; published 12 Oct 2011(C) 2011 OSA 24 October 2011 / Vol. 19, No. 22 / OPTICS EXPRESS 21340
-150 -75 0 75 150
0
0.25
0.50
0.75
-0.25
-0.50
-0.75
-150 -75 0 75 150
0
0.25
0.50
0.75
-0.25
-0.50
-0.75
Reconstructed Probeat Focal Plane
(c)
3
4
1
0
2
log (I)10
3
4
1
0
2
log (I)10
optical axis [ m]μ
optical axis [ m]μ
X a
xis
[m
]μ
Reconstructed Probeat Object Plane
(a) (b)
75
25
0
50
100
500 nm
11
2.75
0
5.50
8.25
30 nm
Ya
xis
[m
]μ
Plane XZ
FocalPlane
ObjectPlane
Plane YZ
I
I (·10 )3
Fig. 3. (Color online) (a) Intensity of the reconstructed illumination function at the objectplane. (b) Propagation along the optical axis of the X-ray beam at the vicinity of the focalplane of the high-resolution Fresnel zone plate. (c) Wavefield intensity distribution at thefocal plane. The size of the focal spot is estimated to be 22.5×23.8 nm2 (H×V of FWHM).
with the observed smaller size of the probe in the object plane. The discrepancy between thenominal and the retrieved values of δ can be explained by inaccuracies during the determina-tion of the focal position by scanning transmission X-ray microscopy, and it is within the rangeof the expected depth of focus (DOF) of 8 μm. Lens aberrations, in particular astigmatism, canhinder the determination of the focal plane by scanning transmission X-ray microscopy. Thewavefield intensity at the focal plane is shown in Fig. 3(c). The size of the focal spot is esti-mated to be 22.5×23.8 nm2 (H×V of FWHM). These retrieved values are close to the expectedsize of 20.6 nm (FWHM) for FZP with an outermost zone width, Δr, of 20 nm.
The imperfections on the focused wavefield, observed in Figs. 3(b) and 3(c), arise from aber-rations of the wavefront exiting the high-resolution FZP. To investigate these aberrations, weback-propagate the reconstructed wavefield upstream to the exit pupil of the lens. This is mostefficiently achieved, in terms of sampling requirements, by computing the Fresnel diffractionintegral [9, 38] using a single DFT. Propagating the reconstructed probe by 10 mm upstreamin this manner we obtain the wavefield at the exit pupil with a sampling of about 1.0 μm.The amplitude of the wavefield exiting the FZP is shown in Fig. 4(a). From the phase of thiscomplex-valued wavefield, one can subtract the constant, linear and quadratic phase terms. Theresulting phase profile, shown in Fig. 4(b), reveals the wavefront aberrations, i.e., the deviationsbetween the exit wave and a perfectly spherical wave which would be expected for an ideallens. By inspection of the wavefront aberrations one can distinguish high- and low-frequencyvariations. The low-frequency components are most likely introduced by the upstream opticalelements of the beamline. The beam-conditioning slits or imperfections of the monochromatorand mirror used for higher-order harmonic rejection are believed to create the non-uniform in-tensity and the vertical and horizontal stripes observed on the amplitude of the lens wavefield
#152217 - $15.00 USD Received 9 Aug 2011; revised 9 Sep 2011; accepted 12 Sep 2011; published 12 Oct 2011(C) 2011 OSA 24 October 2011 / Vol. 19, No. 22 / OPTICS EXPRESS 21341
(a)
15 mμ
0.025
0
0.005
0.020
0.010
0.015
Reconstructed
Wavefield at the FZP
Amplitude [a.u.]
1
2
3
4
5
6
(b)π
- /2π
-π
0
π/2
15 mμReconstructed
Wavefront Aberrations at the FZP
Phase [rad]
1
2
3
4
5
6
Fig. 4. (a) Amplitude and (b) wavefront aberrations at the exit pupil of the high-resolutionFresnel zone plate. The root mean square in the wavefront aberrations are found to be0.7213 rad (0.1148 waves). The numbering indicates the radial positions where buttressingperiodicity is changed and relates to Fig. 5.
in Fig. 4(a). The low-frequency components in the lens wavefront aberrations in Fig. 4(b) areclearly dominated by astigmatism, which is characterized by a curvature of opposite signs inorthogonal directions, i.e., a saddle shaped function. This astigmatism is produced by a slightvertical focusing of the higher-order harmonic rejection mirror, which then delivers a slightlyaberrated beam to the FZP. On the propagated X-ray beam, in Fig. 3(b), this astigmatism resultsin a slight difference in distance from the lens to the best focal planes in the X and Y directions.The latter difference made the determination of best focus difficult with the STXM, whereaswith the reconstructed beam the determination of the best focus becomes easier by using thecircle of least confusion, i.e., the plane where the area inside the FWHM intensity contour isminimized.
1 2
3 mμ
1 2 3 4 5 6
63 4 5
Fig. 5. Scanning electron micrographs of the high-resolution zone-doubled Fresnel zoneplate. Insets show magnified images at radial positions where the buttressing periodicity ischanged.
#152217 - $15.00 USD Received 9 Aug 2011; revised 9 Sep 2011; accepted 12 Sep 2011; published 12 Oct 2011(C) 2011 OSA 24 October 2011 / Vol. 19, No. 22 / OPTICS EXPRESS 21342
On the other hand, the high-frequency aberrations are more likely to originate from the FZPstructure. In the upper-left quadrant of both the amplitude and the phase aberration plots inFig. 4 one observes the shadows of a square grid with an approximate period of about 5 μm.This periodicity matches the writing field of the electron beam lithography tool that was usedto fabricate the FZP pattern. Such imperfections, usually not visible under SEM inspection,are due to small changes of the exposure parameters between contiguous writing fields. Theseerrors are known in the electron beam lithography community as sub-field stitching error. Asecond pattern that is obvious in the reconstructed wavefront aberrations are the six concentricrings occurring at increasing radii. They can be easily related to deviations from the ideal FZPstructure, i.e., any misplaced zones that will result on perturbations of the phase of the wavefieldexiting the FZP. However and due to the large pixel size, only the average effect of these phaseperturbations can be observed on the reconstructed wavefield. Figure 5 shows SEM picturesof the FZP, highlighting the buttresses which are necessary to create mechanically stable, highaspect ratio resist structures during the electron beam lithography step [3]. It was experimentallydetermined that the most stable structures to connect neighboring zones were buttresses radiallyaligned with the FZP pattern. However, to maintain sufficiently short azimuthal space betweenthe buttresses, their periodicity had to be adjusted as a function of the radial position. TheFZPs were fabricated containing six discrete buttressing periodicity changes as shown in Fig. 5.The reconstructed wavefront reveals that each of the buttressing periodicity changes createsa unique imperfection in the wavefront exiting the FZP. Closer to the edge of the FZP, thesimilarity between the azimuthal separation of the buttresses in neighboring regions createsa beating between the spatial frequencies, resulting in a discontinuous line in the wavefrontaberrations at the position of the rings. The latter effect is most noticeable in ring 5, as indicatedin Figs. 4 and 5. While the SEM inspection only demonstrates the deformation of about 4 to 6iridium zones at each buttressing periodicity change, the current analysis might suggest that alarger number of zones are misplaced. This information will be used in designing an improvedbuttressing pattern to reduce the aberrations in future fabrication of FZPs.
The wavefront aberrations exiting the FZP were found to have a root mean square (RMS)value of 0.7213 rad or 0.1148 waves. For comparison, the Marechal criterion establishes thatthe phase accuracy required for diffraction-limited performance is 1/14 = 0.072 waves RMS.This indicates that the reconstructed X-ray beam was not diffraction-limited and it is consistentwith the deviations in size and shape of the reconstructed focal spot with respect to an ideal Airyfunction. However, the wavefront analysis we have performed already points to a few issues inthe lens manufacture and in the incident X-ray beam conditioning that could be addressed toachieve diffraction-limited focusing. Upon comparison from two ptychographic reconstructionsof independently acquired datasets we found the wavefront aberration measurement to be re-peatable to within an RMS error of 0.04 rad (i.e., 0.006 waves), thus giving assurance of theeffectiveness and precision of the method. Such high degree of repeatibility on the wavefrontaberration measurement was only achieved after applying the non-linear optimization refine-ment. Upon comparison from the two ptychographic reconstructions using only the difference-map phase retrieval algorithm of the same datasets, the wavefront aberrations measurementswere only repeatable to within an RMS error of 0.145 rad (i.e., 0.023 waves), that is the non-linear optimization refinement accounted for more than a three-fold improvement in the con-sistency of the two wavefront aberration reconstructions of independently acquired data.
4. Summary and Conclusions
In this work we have demonstrated the feasibility of characterizing high-resolution diffractiveX-ray optics by PCDI. We have used this method to successfully reconstruct the 23 nm wide fo-cal spot delivered by a zone-doubled FZP. Simultaneously, we have investigated the wavefront
#152217 - $15.00 USD Received 9 Aug 2011; revised 9 Sep 2011; accepted 12 Sep 2011; published 12 Oct 2011(C) 2011 OSA 24 October 2011 / Vol. 19, No. 22 / OPTICS EXPRESS 21343
aberrations at the exit pupil of the lens, which are related both to manufacturing aspects of theFZP and imperfections on the incident X-ray wavefront introduced by the upstream beamlineoptics. Both sources of aberration affect negatively the quality of the focal spot. These resultsfurther consolidate PCDI as a robust and accurate method to measure aberrations of X-rayoptics [14, 17] and demonstrate that it is an excellent tool to assess the performance of FZP,while providing valuable feedback beyond conventional characterization techniques. Further-more, since the ptychographic scans can be realized in less than 2 min and the ptychographicreconstructions times can be shorten from 2 hours to about 20 min by taking a smaller win-dow of PILATUS frames (400×400 pixels), the technique is well-suited for in-situ and on-linealignment and optimization of the experimental setups.
Acknowledgments
We acknowledge the contributions of P. Thibault, M. Dierolf, and F. Pfeiffer (now at the Tech-nical University Munich) to the difference-map code for ptychographic reconstructions. Wewould like to thank A. Weber, B. Haas, V. A. Guzenko (Paul Scherrer Institut) for assistanceduring the substrate preparation and X. Donath (Paul Scherrer Institut) for technical assistanceat the beamline. Alexandre Mantion thanks the Adolf-Martens-Fonds e.V., the BAM FederalInstitute for Materials Research and Testings for financial support and the DFG grant for Ini-tiation and Intensification of Bilateral Cooperation under project number MA-5217/3-1. Theresearch leading to these results has received funding from the European Community’s SeventhFramework Programme (FP7/2007-2013) under grant agreement No. 226716.
#152217 - $15.00 USD Received 9 Aug 2011; revised 9 Sep 2011; accepted 12 Sep 2011; published 12 Oct 2011(C) 2011 OSA 24 October 2011 / Vol. 19, No. 22 / OPTICS EXPRESS 21344