Clays and Clay Minerals, Vol, 41, No. 4, 484-495, 1993. CHARACTERIZATION OF HYDROXY-INTERLAYERED VERMICULITE AND ILLITE/SMECTITE INTERSTRATIFIED MINERALS FROM THE WEATHERING OF CHLORITE IN A CRYORTHOD DOMINIQUE RIGHI, ~ SABINEPETIT, ~ AND ALAIN BOUCHET 2 UA 721, CNRS, Laboratoires de P6dologie et P&rologie de la Surface Facult6 des Sciences, 86022 Poitiers-Cedex, France 2 ERM, M6rov6e, BP25, 86320 Civaux, France Abstract--X-ray diffraction, FTIR, and chemical analyses were performed on clay fractions (1-2/~m, <0.1 pm), separated by means of size fractionations and high-gradient magnetic separation techniques, from a Cryorthod developed in a chlorite-mica schist saprolite. Weathering of large phyllosilicates pre- existing in the saprolite involves physical fragmentation and mineralogical transformations. Chloritic minerals in the coarse fractions were the most affected by physical breakdown, while micas were generally preserved. As a consequence, a concentration of mica layers occurred in the coarse clay fraction, while chloritic residues accumulated in the fine clays. These residues exhibited the typical XRD pattern of hydroxy-interlayered intergrade minerals, but the interlayered contaminants were found to be mainly hydroxy-Mg cations. Further mineralogical transformations of the intergrade minerals involved the pro- gressive removal of the hydroxide interlayered sheet and dissolution of chloritie layers. Illite/smectite mixed-layers were formed in the surface horizon of the soil profile. These processes were associated with a strong decrease in Fe and Mg contents in the clay fractions. Key Words--Chlorite, Hydroxy-interlayered intergrades, Illite/smectite mixed-layers, Soil clays, Spo- dosol. INTRODUCTION Simple transformation of mica is the process most often described for the formation of soil clays, es- pecially soil vermiculite and smectite (Borchardt, 1989; Douglas, 1989). In weakly acid soils, these clay min- erals would be affected by hydroxy-interlayering,which is responsible for their intergrade behavior when sub- jected to XRD analysis (Barnhisel and Bertsch, 1989). However, saprolite of crystalline rocks, as well as loess- ial materials from which many typical temperate soils have developed, commonly contain chlorite as primary minerals. Although less abundant than mica, these minerals should not be disregarded because they are easily weatherable and an important possible source for soil clays, especially during the early stages of pedo- genesis. Although DeConinck et al. (1983) has interpreted most of the intergrade minerals in acid soils as weath- ering products of chlorite rather than hydroxy-A1 in- terlayered vermiculite and smectite, studies on the weathering of chlorite in temperate acid soils are scarce (Bain, 1977; Churchman, 1980; Ross et al., 1982; Ad- ams and Kassim, 1983) and the characterization of its weathering products is not well documented, especially their X-ray diffraction (XRD) behavior. The difficulty in characterizing such chloritic minerals lies mainly in the inability to separate or isolate them from the nat- ural mixture of clays in which they occur. The aim of this paper was to separate and charac- Copyright 1993, The Clay Minerals Society 484 terize weathering products of chlorite from soil clays, using size fractionation followed by high gradient mag- netic separation (HGMS). Particle size fractionation helps to isolate large inherited mineral grains from their weathering products, generally of a smaller size. HGMS concentrates minerals on the basis of their Fe content and generally is an efficient tool for the separation of chloritic minerals (Ghabru et al., 1990; Weed and Bow- en, 1990). SOIL MATERIAL Clays were separated from a lithic, humic Cryorthod (Soil Taxonomy, USDA, 1986) or ochric podzosol (Rr- frrentiel Prdologique, INRA, 1992) developed from a chlorite-rich mica schist saprolite. The soil is from the Himalayas (Nepal) and located at the Matchembo pass at an elevation of 4020 m above sea level. A detailed description of this soil was given in previous papers (Righi and Lorphelin, 1986, 1987). Selected analytical data are listed in Table 1. Only a brief description is given below: 0-5 cm: A1. Dark reddish brown (5YR 2/2) silt loam, organic rich, strong fluffy structure, very fri- able, many fine roots, abrupt wavy boundary. 5-10 cm: A1/E. Reddish gray (5YR 5/2) silt loam, moderate fine subangular blocky structure, friable, many roots, clear broken boundary. 10-15 cm: Bh. Reddish brown (SYR 4/4) silt loam, moderate medium subangular blocky and fine gran-
Transcript
Clays and Clay Minerals, Vol, 41, No. 4, 484-495, 1993.
CHARACTERIZATION OF HYDROXY-INTERLAYERED VERMICULITE AND ILLITE/SMECTITE
INTERSTRATIFIED MINERALS FROM THE WEATHERING OF CHLORITE IN A CRYORTHOD
DOMINIQUE RIGHI, ~ SABINE PETIT, ~ AND ALAIN BOUCHET 2
UA 721, CNRS, Laboratoires de P6dologie et P&rologie de la Surface Facult6 des Sciences, 86022 Poitiers-Cedex, France
2 ERM, M6rov6e, BP25, 86320 Civaux, France
Abstract--X-ray diffraction, FTIR, and chemical analyses were performed on clay fractions (1-2/~m, <0.1 pm), separated by means of size fractionations and high-gradient magnetic separation techniques, from a Cryorthod developed in a chlorite-mica schist saprolite. Weathering of large phyllosilicates pre- existing in the saprolite involves physical fragmentation and mineralogical transformations. Chloritic minerals in the coarse fractions were the most affected by physical breakdown, while micas were generally preserved. As a consequence, a concentration of mica layers occurred in the coarse clay fraction, while chloritic residues accumulated in the fine clays. These residues exhibited the typical XRD pattern of hydroxy-interlayered intergrade minerals, but the interlayered contaminants were found to be mainly hydroxy-Mg cations. Further mineralogical transformations of the intergrade minerals involved the pro- gressive removal of the hydroxide interlayered sheet and dissolution of chloritie layers. Illite/smectite mixed-layers were formed in the surface horizon of the soil profile. These processes were associated with a strong decrease in Fe and Mg contents in the clay fractions. Key Words--Chlorite, Hydroxy-interlayered intergrades, Illite/smectite mixed-layers, Soil clays, Spo- dosol.
INTRODUCTION
Simple transformation of mica is the process most often described for the formation of soil clays, es- pecially soil vermiculite and smectite (Borchardt, 1989; Douglas, 1989). In weakly acid soils, these clay min- erals would be affected by hydroxy-interlayering, which is responsible for their intergrade behavior when sub- jected to XRD analysis (Barnhisel and Bertsch, 1989). However, saprolite of crystalline rocks, as well as loess- ial materials from which many typical temperate soils have developed, commonly contain chlorite as primary minerals. Although less abundant than mica, these minerals should not be disregarded because they are easily weatherable and an important possible source for soil clays, especially during the early stages of pedo- genesis.
Although DeConinck et al. (1983) has interpreted most of the intergrade minerals in acid soils as weath- ering products of chlorite rather than hydroxy-A1 in- terlayered vermiculite and smectite, studies on the weathering of chlorite in temperate acid soils are scarce (Bain, 1977; Churchman, 1980; Ross et al., 1982; Ad- ams and Kassim, 1983) and the characterization of its weathering products is not well documented, especially their X-ray diffraction (XRD) behavior. The difficulty in characterizing such chloritic minerals lies mainly in the inability to separate or isolate them from the nat- ural mixture of clays in which they occur.
The aim of this paper was to separate and charac-
Copyright �9 1993, The Clay Minerals Society 484
terize weathering products of chlorite from soil clays, using size fractionation followed by high gradient mag- netic separation (HGMS). Particle size fractionation helps to isolate large inherited mineral grains from their weathering products, generally of a smaller size. HGMS concentrates minerals on the basis of their Fe content and generally is an efficient tool for the separation of chloritic minerals (Ghabru et al., 1990; Weed and Bow- en, 1990).
SOIL MATERIAL
Clays were separated from a lithic, humic Cryorthod (Soil Taxonomy, USDA, 1986) or ochric podzosol (Rr- frrentiel Prdologique, INRA, 1992) developed from a chlorite-rich mica schist saprolite. The soil is from the Himalayas (Nepal) and located at the Matchembo pass at an elevation of 4020 m above sea level. A detailed description of this soil was given in previous papers (Righi and Lorphelin, 1986, 1987). Selected analytical data are listed in Table 1. Only a brief description is given below:
0-5 cm: A1. Dark reddish brown (5YR 2/2) silt loam, organic rich, strong fluffy structure, very fri- able, many fine roots, abrupt wavy boundary.
5-10 cm: A1/E. Reddish gray (5YR 5/2) silt loam, moderate fine subangular blocky structure, friable, many roots, clear broken boundary.
10-15 cm: Bh. Reddish brown (SYR 4/4) silt loam, moderate medium subangular blocky and fine gran-
Vol. 41, No. 4, 1993
Table 1. Analytical data for the s0il (% 105oc dry soil) from Matchembo Pass.
Interlayered and interstratified minerals from chlorite
OM = organic matter. Ox = oxalate extractable Fe and A1.
ular structure, friable, many roots, clear wavy boundary.
15-20 cm: Bw. Dark brown (7.5YR 4/4) silt loam, weak medium and fine granular structure, friable, few roots, clear wavy boundary.
20-40 cm: C. Yellowish brown (10YR 5/4) loam, gravelly, no roots.
The soil has developed from a homogeneous parent material derived from the weathering of chlorite-rich mica schist and exhibits typical podzolization features. Podzolizati0n has induced the most advanced trans- formation of the primary minerals, as compared with that in other soils of the area (Righi and Lorphelin, 1986).
SEPARATION AND ANALYTICAL METHODS
The clay and the silt fractions were obtained from the horizon samples by sedimentation after destruction of organic matter with diluted, Na-acetate buffered H202 (pH = 5) and dispersion in NaOH at pH = 9. The silt (2-5, 5-10, and 10-20 #m) and clay (<1, 1-2 /~m) fractions were then treated with citrate-bicarbonate- dithionite (CBD) to remove crystalline and amorphous iron oxides and oxyhydroxides (Mehra and Jackson, 1960), especially those associated with the phyllo- silicate surfaces that would interfere with the magnetic separation. However, that treatment may induce slight alteration of some Fe-bearing silicates (Douglas, 1967) and partial dissolution ofsmectites (Stucki et aL, 1984).
The < 1 tzm deferrated clay fraction was divided into <0.1, 0.1-0.2, and 0.2-1 /~m subfractions by centrif- ugation using a Beckman J2-21 centrifuge equipped with the JCF-Z continuous flow rotor. The clay subfractions were then subjected to high gradient mag- netic separation (HGMS) according to the method of Righi and Jadault (1988). A magnetic fraction (M), retained on the magnetic filter in a magnetic field of 2 T, and a non-retained tail fraction (N) were collected. The silt sub-fractions were separated using two values of magnetic field, 0.2 and 2 T; resulting in the collection of two sub-samples, a weakly and a strongly magnetic one.
X-ray diffraction (XRD) diagrams were obtained from parallel-oriented specimens using a Philips dif-
485
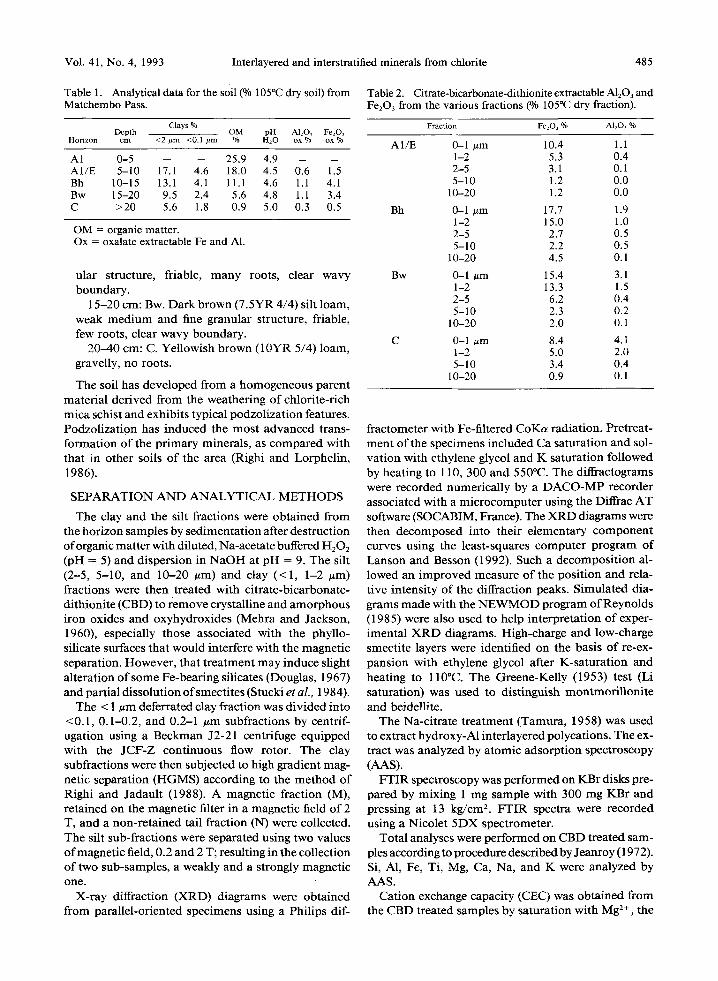
Table 2. Citrate-bicarbonate-dithionite extractable A1203 and Fe203 from the various fractions (% 105~ dry fraction).
fractometer with Fe-filtered CoKa radiation. Pretreat- ment of the specimens included Ca saturation and sol- vation with ethylene glycol and K saturation followed by heating to 110, 300 and 550~ The diffractograms were recorded numerically by a DACO-MP recorder associated with a microcomputer using the Diffrac AT software (SOCABIM, France). The XRD diagrams were then decomposed into their elementary component curves using the least-squares computer program of Lanson and Besson (1992). Such a decomposition al- lowed an improved measure of the position and rela- tive intensity of the diffraction peaks. Simulated dia- grams made with the NEWMOD program of Reynolds (1985) were also used to help interpretation of exper- imental XRD diagrams. High-charge and low-charge smectite layers were identified on the basis of re-ex- pansion with ethylene glycol after K-saturation and heating to l l0~ The Greene-Kelly (1953) test (Li saturation) was used to distinguish montmoril lonite and beidellite.
The Na-citrate treatment (Tamura, 1958) was used to extract hydroxy-A1 interlayered polycations. The ex- tract was analyzed by atomic adsorption spectroscopy (AAS).
FTIR spectroscopy was performed on KBr disks pre- pared by mixing 1 mg sample with 300 mg KBr and pressing at 13 kg/cm 2. FTIR spectra were recorded using a Nicolet 5DX spectrometer.
Total analyses were performed on CBD treated sam- ples according to procedure described by Jeanroy (1972). Si, A1, Fe, Ti, Mg, Ca, Na, and K were analyzed by AAS.
Cation exchange capacity (CEC) was obtained from the CBD treated samples by saturation with Mg 2+ , the
486 Righi, Petit, and Bouchet Clays and Clay Minerals
t~
I J
A I / E , 1 - 2 p t n , M
0
0 0
O
d
C , 1 - 2 I n l l , M
0 t'-
I
I
C, 10-20 lain, O.2M
ol tt~
~. o O
I
i i
10 20 30 ~ 2 0
Figure 1. XRD diagrams for magnetic (M) silt and coarse clay fractions (Ca saturated, ethylene glycol solvated) from the C and A1/E horizons. CoK~ radiation, d-spacings in nm.
excess of Mg salt (MgC12) being carefully washed out with ethanol. Mg z+ was then exchanged by N,NH4 + and analyzed by AAS in the exchange solution.
RESULTS A N D INTERPRETATION
Total clay (<2 urn) increased from 0.56 g/kg in the C horizon to 1.73 g/kg in the A1/E horizon, where the fine fractions (<0.2 #m) were 0.18 g/kg and 0.46 g/kg respectively (Table 1).
The CBD-extracted Fe and AI, expressed as Fe203 and A1203, are given in Table 2. These amounts de-
creased with the increase of particle size. Extractable Fe203 was the largest in the Bh and Bw horizons, and maximum extractable A1203 was found in the lowest part of the soil profile (Bw and C horizons). Such a depth distribution is typical for a Spodosol.
Ratios for the magnetic (M) to the non-magnetic (N) fractions were not quantified but the tendency was to find increasing amounts of N in the <0.1 ~m fraction from the C to the A1/E horizons.
Mineralogy of the silt and coarse clay fractions
The silt fractions retained on the magnetic filter for an applied magnetic field of 2.0 or 0.2 T were analyzed by XRD. All the samples exhibited the reflections of chlorite (d = 1.415, 0.706, 0.470, and 0.353 nm) and mica (d = 0.996, 0.498, and 0.333 nm) (see Figure 1). Additional reflections at d = 0.124 and 0.482 nm were attributed to mica/vermiculite interstratified minerals. Heat treatments (550~ induced a decrease of the re- flection at d = 1.415 nm with a parallel increase of that at 0.996 n m that was indicative of vermiculite layers. Reflections at d = 0.156 and 0.154, 0.152 nm (not shown) were attributed to chlorite and trioctahedral minerals respectively.
The XRD diagrams from the 2.0 and 0.2 M fractions were very similar, except for the relative intensities of the chlorite and mica reflections. The 0.2 M fraction contained more chlorite than the 2.0 M fraction which was mica-rich, and identical to the M coarse clay (1- 2 ~zm) fraction from the C horizon (Figure 1).
From the C to the A1/E horizons, the M coarse clay fraction was characterized by a decrease of the inten- sifies of the reflections from chlorite and intergrade minerals. The M coarse clay fraction from the A1/E sample was almost exclusively composed of a mica with a small amount of chlorite (Figure 1). The 060 reflection at d = 0.150 nm (not shown) indicated that the mica from the A1/E horizon sample was diocta- hedral.
Heat treatment (550~ on the coarse clay samples induced a decrease of the reflection at d = 1.415 rim, with a parallel increase of that at 0.996 nm and the disappearance of the reflection at d = 1.240 nm, which was indicative of vermiculite layers. However, the de- composition of the peak at d = 0.996 nm gave three basic curves, one of these sharp (maximum at d = 0.996 nm) and the others, broad and weak with a maximum at higher d-spacings, indicating uncoUapsed layers that could be attributed to interstratified chlorite (Figure 2). Moreover, the collapse of the coarse clay was obtained progressively as the heating temperature increased, leading to a typical intergrade behavior. Such a be- havior was attributed to an incomplete hydroxide in- terlayered sheet (Barnhisel and Bertsch, 1989). These uncollapsed layers were less abundant in the A 1/E coarse clay than in the C coarse clay sample.
Vol. 41, No. 4, 1993 Interlayered and interstratified minerals from chlorite 487
Mineralogy of the fine clay fractions
General No major differences were observed between the M and N subfractions; thus, only the results from the N subfractions are given below, the N subfraction being the most abundant. Compared with the N sub- fractions, M samples exhibited only slightly larger pro- portions of chlorite layers.
All the < 0.1 ~m fractions were composed primarily of dioctahedral minerals as indicated by the 060 re- flection at d = 0.150 nm (not shown).
The fine clay fractions (<0.1 #m) from the C horizon were not abundant enough to be separated by HGMS; thus, the whole <0.1 #m fraction was used for XRD. Except for some smectite layers, this fraction gave an X R D diagram identical to that of the coarse clay frac- tion. Especially, the behavior after K-saturation and heating was identical.
Bw horizon sample. For the Bw, <0.1 #m N fraction, the decomposition of the X R D diagram from the gly- colated sample in the 6-12 ~ 20 region gave three basic curves with maximum intensities at d = 1.422, 1.305 (broad) and 1.021 nm (Figure 3). That fraction was also characterized by a very strong relative intensity of the reflection in the 18-23 ~ 20 region, which was decomposed into two basic curves of quite equal in- tensities with their maxima at d = 0.495 and 0.480 nm (Figure 3). Four basic curves were required in the 28-33 ~ 20 region: three rather sharp curves with their maxima at d = 0.357, 0.352, and 0.334 nm and a broader one with its max imum at d = 0.345 nm (not shown).
The peak at d = 1.422 nm was attributed to ver-
C , 1 - 2 p m . M
g 550"C
3~
i...i
' I ' I i I ' I ' I ' I
6 7 8 9 1O 11 ~ 12
Figure 2. Decomposed XRD diagram for the magnetic (M) coarse clay fraction from the C horizon, K-saturated and heat- ed to 550~ CoKa radiation, d-spacings in nm. ( - - - ) = computed elementary curves; ( ) = experimental curve; ( i ) = best-fit computed curve.
0.480, and 0.345 observed for the Bw, <0.1 nm N sample. As experimental reflections were also found at d = 1.021, 0.495, and 0.334 nm, a good agreement was observed with another simulated illite/chlorite mixed- layers with 90% illite, giving peaks at d = 1 .:023, 0.495, and 0.334 nm (Figure 4). For these two simulated illite/ chlorite, the width and relative intensity o f the 2nd and 3rd order peaks also matched well with the experi- mental data. Only the width of the lrst order peaks (d
miculite and chlorite (associated with the peak at d = = 1.318, 1.021 nm) were far narrower in the simulated 0.352 nm). The peaks at d = 0.720 nm and d = 0.357 nm were attributed to kaolinite. Simulated X R D pat- terns were made with the N E W M O D program (Reyn- olds, 1985) in order to better characterize the other mineral phases.
According to Reynolds (1980), only illite/chlorite interstratified minerals give an intense reflection in the 18-23 ~ 20 (0.50-0.47 nm) region, as was observed in the Bw, < 0.1 nm N sample. The position of the peak moves from 0.501 to 0.473 nm with increasing pro- portion of the chlorite component, but that position is sensitive to the size of the coherent scattering domain (CSD), and it shifts toward higher d-spacings as CSD size decreases. Also the width of the peak is affected: it increases as CSD size decreases. Relative to that of the first order reflection (in the 1.00-1.40 nm region), the intensity of the peak near 0.50 nm is strongly de- creased when the hydroxide sheet of the chlorite com- ponent is not complete.
The simulated X R D pat tem ofil l i te/chlorite mixed- layers with 40% illite (Figure 4) gave three peaks at d = 1.318, 0.480, and 0.347 nm that matched reasonably well with the experimental reflections at d = 1.305,
diagrams than in the experimental patterns. This peak width problem, in that angular range, was also reported by Lanson and Besson (1992) for illite/smectite mixed- layers. Thus, decomposition of the X R D diagram, with the help of simulated patterns, allowed identification of two illite/chlorite mixed-layers: one illite-rich with 90% illite, the other chlorite-rich with 60% chlorite.
Following heat treatments, the X R D pattern from the Bw, < 0.1 /zm N fraction showed a very strongly expressed intergrade character (Figure 3). Collapse of the interlayers was very progressive and far from com- plete, leading (after heating at 550~ to a strongly asymmetrical reflection. In the 6-12 ~ 20 region, the diagram was decomposed into three basic curves with their maxima at d = 1.370, 1.137 and 1.019 nm. The first peak was attributed to chlorite. The most intense peak was at d = 1.137 nm and broad. It was interpreted as an interstratification of collapsed and uncollapsed layers, as was the third peak at d = 1.019 nm, but the proportion of uncollapsed layers was lower in that case.
After the Na-citrate treatment, the treated sample, K-saturated and heated to 550~ still gave an asym- metrical reflection (Figure 3). However, changes in the
488 Righi, Petit, and Bouchet Clays and Clay Minerals
Q u'~ ~- B w , < 0 . 1 p m , N .-~ I e t h y l e n e g l y c o l
'~ �9
U I I, " ~ �9 U3 r �9 - I \ ~ o. / ~ . , ~
I I I I t I 6 1 2 1 8 2 3 2 8 " 2 0 0 3
li | 1
"7 8 6 I'0 11 "20 I'9 2'0 2'1 22 "2e
"" . . . . " * ~"'~" " 2 0 + ; 1"o t l ~ ~ ; t o 11
Figure 3. XRD diagrams for the non magnetic (N) fine clay fraction from the Bw horizon. CoKa radiation, d-spacings in nm: A) experimental diagram, Ca saturated, ethylene glycol solvated; B) decomposed diagram in the 5-12 ~ 20 region, Ca saturated, ethylene glycol solvated; C) decomposed diagram in the 18-23 ~ 20, Ca saturated, ethylene glycol solvated; D) decomposed diagram in the 5-12 ~ 20 region, K-saturated and heated to 550~ E) decomposed diagram in the 5-12 ~ 20 region, Na-citrate treated, K-saturated and heated to 550~ ( - - - ) = computed elementary curves; ( ) = experimental curve; ( ~ ) = best-fit computed curve. Intensity scale is not identical for B, C, D and E.
re la t ive in tens i t i e s o f the bas ic cu rves were obse rved . Af te r the t r e a t m e n t , the m o s t i n t ense peak was f o u n d a t d = 0 .993 n m , b u t a peak at d = 1.401 n m was still present . T h e peak at d = 0 .993 n m was a t t r i b u t e d to co l lapsed ve rmicu l i t e layers. In the 18-23 ~ 2 0 region,
peaks at d = 0 .475 n m a n d 0 .490 n m were obse rved , i nd ica t ing t h a t ch lor i te a n d i l l i t e /ch lor i te were still p resen t af ter the c i t ra te t r e a t m e n t (no t shown) . H o w - ever , t he peak at 0 .480 n m was no t m a i n t a i n e d for the t r ea ted sample . Also the re la t ive in t ens i ty o f the peak
Vol. 41, No. 4, 1993 Interlayered and interstratified minerals from chlorite 489
A
a \
C
00
Q
t-,
D
E
o// 00
a,
o O
J ~r r
O
O b-
O
_ ~ l , l , ! ~ ! ~ ! l l , q , F , ! , ! , I , I I I , t , 1 $ 7 9 11 13 15 17 19 21 23 25 27 29 31 "2o
at d = 0.475 n m in the t reated sample was strongly decreased as compared with the 0.480 n m peak in the unt rea ted sample. Al though some vermicu l i t e layers have been produced dur ing that t rea tment , i t appeared that the Na-c i t ra te t r ea tment d id not greatly i m p r o v e the collapse o f the interlayers. The minera l phase mos t affected by the t r ea tment was the chlori te-rich, i l l i te/ chlori te interstrat if ied mineral , but chlori te was only slightly affected.
Mg, Fe, and A1 were analyzed in the extract (Table 3). Mg was far m o r e extracted than Al as indica ted by the A1/Mg a tomic rat ios in the extract (A1/Mg = 0.77). Extracted amoun t s o f K and Si indicated comple te d issolut ion o f some layers, including illite.
Bh horizon sample. For the Bh, <0.1 # m N fraction, the decompos i t i on o f the X R D diagram in the 6 -12 ~ 20 region gave four basic curves with their m a x i m a at d = 1.423, 1.270, 1.036, and 1.624 n m (Figure 5). In the 18-23 ~ 20 region, two peaks were ob ta ined at d = 0.493 and 0.482 n m (Figure 5), and three peaks were observed at d = 0.357, 0.345, and 0.335 n m (not shown) in the 28-33 ~ 20 region.
The peak at 1.423 n m was at t r ibuted to vermicul i te . The peak at d = 0.357 n m in the 28-33 ~ 20 region was taken as ev idence o f kaol ini te layers. As for the Bw sample and according to s imulat ions wi th the N E W - M O D program (Figure 4), the peak at d = 1.270 nm, associated with those at d = 0.482 and 0.345 nm, was a t t r ibuted to i l l i te /chlori te mixed- layers wi th 50% chlorite. The peak at d = 1.036 n m associated with those at d = 0.493 and 0.335 n m ma tched well wi th the s imulated pattern of i l l i te /chlor i te mixed layers with 85% illite (Figure 4). The peak at d = 1.624 n m could be s imula ted ei ther by chlor i te / smect i te or ve rmicu l i t e / smect i te m ixed layers wi th 40% o f vermicul i te or chlo- rite (Figure 4).
The Bh, < 0.1 izm N sample was K-satura ted, hea ted to 110~ ethylene glycol-solvated, and then subjected to X R D . Fol lowing that t rea tment , no swelling was observed (not shown), indicat ing that the smect i te lay- ers already identif ied in this sample were high-charge layers. Fol lowing the Greene-Kel ly (1953) test, a swell- ing up to d = 1.70 n m was observed, thus indicat ing that at least part o f the smect i te layers were beidel l i te (Figure 6).
490 Righi, Petit, and Bouchet Clays and Clay Minerals
~ ] .5 B h , < 0 . 1 p m , N '~ -- [ ethylene g l y c o l
-" / \ z
l \ 1 i i :~ l |
, , I I I I I I 5 1 2 1 8 2 3 2 8 3 3
i I m 7 8 9 1 0 ! 1 "20 1'9 210 21 ~ "23
~Q K550*C
~ 7 9 ~ 1'1
Figure 5. XRD diagrams for the non-magnetic (N) fine clay fraction from the Bh horizon, with CoKa radiation, d-spacings in nm: A) experimental diagram, Ca saturated, ethylene glycol solvated; B) decomposed diagram in the 5-12 ~ 20 region, Ca saturated, ethylene glycol solvated; C) decomposed diagram in the 18-23 ~ 20, Ca saturated, ethylene glycol solvated; D) decomposed diagram in the 5-12 ~ 20 region, K-saturated and heated to 550~ ( - - - ) = computed elementary curves; ( ) = experimental curve; (-----) = best-fit computed curve. Intensity scale is not identical for B, C and D.
In response to heat t reatments , the collapse o f the interlayers was obta ined far more easily than for the Bw sample. Collapse was qui te comple te after heat ing at 300~ and it led, after heat ing at 550~ to a peak at d = 1.022 n m and to a broader one at d = 1.126 n m (Figure 5). C o m p a r e d with the Bw sample, the
p ropor t ion o f uncol lapsed layers in this sample was drastically decreased. After the Na-c i t ra te t rea tment , the X R D diagram pat tern was no t changed, especially in the 18-23 ~ 20 region for which the decompos i t i on gave the same basic curves for ei ther the t reated or unt rea ted sample.
Vol. 4 l, No. 4, 1993 Interlayered and interstratified minerals from chlorite 491
In the Na-citrate extracts, lower amounts of Mg than in the extract from the Bw, <0.1 ~m N fraction were analyzed (Table 3).
A1/E horizon sample. From the A1/E horizon, <0.1 ~tm N fraction, only three basic curves were obtained by decomposition in the 4-12 ~ 20 region, their maxima being at d = 1.631, 1.384, and 0.985 nm (Figure 7). The peak at d = 0.985 nm was attributed to illite/ smectite interstratified minerals and the peak at d = 1.384 nm to illi te/vermiculite (or chlorite). The peak at d = 1.631 nm could be given by vermiculite/smectite mixed layers (60% smectite) or illite/smectite (60% smectite) as suggested by the N E W M O D simulations (Figure 4).
In the 18-23 ~ 20 region, three peaks were obtained at d = 0.505, 0.527, and 0.551 nm and attributed to iUite and illite/smectite interstratified minerals (Figure 7). According to the simulations, the two peaks at d = 0.527 and 0.551 nm indicated two types of illite/smec- rite mixed layer minerals: 1) d = 0.551 nm, with a high ratio o f illite layers (72%); 2) d = 0.527 nm, with a lower ratio of illite layers (40%) (Figure 4). The peak at d = 0.505 nm indicated illite. A peak at d = 0.480 nm was present, indicating illite/chlorite mixed layers as in the previous samples. In the 28-33 ~ 20 region, four peaks at d = 0.357 nm (attributed to kaolinite), d = 0.332 and 0.335 nm (attributed to illite and illite/ smectite), and d = 0.355 nm (attributed to illite/ver- miculite) were obtained (not shown). The peak at d = 0.344 nm, which was present in the Bw and Bh sam- pies, has disappeared.
The A1/E, <0.1 #m N fractions were K-saturated, heated to 1 I0~ ethylene glycol-solvated, and then subjected to XRD. Following that treatment, no swell- ing was observed (not shown), indicating that the smec- tite layers were high-charge layers. In response to the Greene-Kelly (1953) test, no swelling was obtained. So, in the A1/E sample, smectite layers would be mont- morillonite (Figure 6).
F T I R spectroscopy
Three main absorption bands were observed on the FTIR spectra in the 3800-3000 cm-~ region, The broad, poorly expressed band at about 3440 c m - ~ was attrib- uted to OH-stretching vibrations o f hydroxide in the interlayer sheets (Makumbi and Herbillon, 1972; Sen- kayi et aL, 1981). The strongest band at 3630 cm 1 and the weaker one at 3700 cm- ~ were assigned to OH- stretching in the octahedral sheet of aluminous min- erals like mica or kaolinite.
The band at 3440 cm-~ was most intense and best defined in the C, 1-2 #m M sample, related to well organized brucite layers in this sample.
Although X R D showed far more interlayered ma- terial in the Bw, <0.1 #m N sample than in the Bh, <0.1 pm N sample, no obvious differences were ob-
P ~ B h , < 0 . 1 p tm, N
i ~ i l i i i i i i i L i i i i i I
3 4 5 6 7 8 9 10 11 12. ~
AI/E, <0.I ~a, N o ~
L i 300"C e t h y l e n e g l y c o l , , ,q
i i i i i ~ i t i i i i i
4 5 5 7 8 9 10 11 12 ~
Figure 6. XRD diagrams for the non-magnetic (N) fine clay fractions from the Bh and A1/E horizons. Experimental dia- grams, Li saturated, heated to 300~ and ethylene glycol sol- rated. CoKa radiation, d-spacings in nm.
served on the FTIR spectra. The same features were observed by Senkayi et al. (1981) for experimentally altered chlorite and would be explained by assuming that the regularity of atomic ordering in the interlay- ered hydroxide sheet was greatly disturbed, leading to poorly defined IR adsorption bands.
Heating the KBr disk up to 500~ caused the band at 3700 cm -] to disappear (this was attributed to ka- olinite) and to the improvement of the 3440 cm-~ band. Further heating to 600~ induced the disappearance of the 3630 cm -1 band, but that at 3440 cm -~ was pre- served. The low thermal stability of 2:1 mica layer (3630 cm -1) was attributed to a rather high ratio of Fe in the octahedral sheet. From the greater thermal sta- bility of the hydroxide sheet, it was concluded that it was mainly magnesian (Caillrre and Hrnin, 1960). Only the A1/E, <0. l #m N sample did not exhibit any ab- sorption band after heating to 600~ which was in agreement with the X R D results showing only very small amounts o f interlayered material in this sample (Figure 8).
492 Righi, Petit, and Bouchet Clays, and Clay Minerals
A t / E , <0.1 tam, N o~
e t h y l e n e g lyco l
/ 1
I I , ! 5 12 18 2~ 28 " 2 0 33
, | . , O . , . �9 .
6 7 8 9 1'0 11 18 19 20 21 22 "20"
? �9 " 2 0
Figure 7. XRD diagrams for the non-magnetic (N) fine clay fraction from the A 1/E horizon, with CoKa radiation, d-spacings in nm: A) experimental diagram, Ca saturated, ethylene glycol solvated; B) decomposed diagram in the 5-12 ~ 20 region, Ca saturated, ethylene glycol solvated; C) decomposed diagram in the 18-23 ~ 20, Ca saturated, ethylene glycol solvated; D) decomposed diagram in the 5-12 ~ 20 region, K-saturated and heated to 550~ ( - - - ) = computed elementary curves; ( ) = experimental curve; ( ~ ) = best-fit computed curve. Intensity scale is not identical for B, C and D.
The same heat t r ea tment (500~ was appl ied on Na- citrate t reated samples. C o m p a r e d wi th the unt rea ted samples, no obv ious differences were shown. I t was conc luded that the Na-c i t ra te t r ea tment did no t selec- t ively extract in ter layered materials , especially i f they are Mg-hydroxide .
Cation exchange capacity
The highest CEC (65 and 68 cmolo/kg) (Table 4) was
obta ined for the Bw, <0.1 and 0 .1-0 .2 ~m N fractions,
in spite o f large amoun t s o f in te r l aye red contaminants .
Moreover , the same CEC was found for the A l /E , < 0.1
Vol. 41, No. 4, 1993 Interlayered and interstratified minerals from chlorite 493
#m N sample, which exhibited far less interlayering. CECs were shown to be decreasing with increasing par- ticle sizes. The strong correlation between CEC and the K20 content observed in a previous study (Righi and Meunier, 1991) was not found here. That agrees with the fact that, for the present samples, the CEC value is controlled by the proportion ofillite, chlorite, vermiculite, and smecti te--and not only by illite and vermiculite or smectite as in the previous study.
Total chemical analysis
Total chemical analysis of some selected fractions are given in Table 5. The 0.2 T magnetic fraction which is mainly chloritic showed larger amounts of Mg and Fe and lower amounts of K than the 2 T magnetic fraction, which is mica-rich. The composition of the C, 1-2 #m M sample was intermediate between these two extremes. Compared with the C horizon coarse clays, those from the A1/E horizon showed strongly decreased amounts of Mg and Fe, but K was not rel- atively increased as one would have expected from the XRD data indicating relative concentration of mica in this sample.
For the fine clay samples (<0.1 and 0.1-0.2 ~m) the most important feature was the strong decrease in the Mg content from the Bw to the Bh and A1/E samples. For the coarse clays (1-2 ~zm), the decrease in the Mg content was observed from the C to the Bw sample, which agreed with the decrease of chlorite as shown by XRD. The K20 content increased from the Bw, < 0.1 #m N to the A 1/E, < 0.1 #m N fraction, indicating increasing proportions of illite layers.
DISCUSSION
The silt and coarse clay magnetic fractions from the C horizon contained a mixture of chlorite and mica layers that were not possible to separate completely by HGMS because these two minerals are probably partly associated in the same particles. A third mineral phase was also collected from the coarse clays: a randomly interstratified mica/chlorite mineral for which the heat treatment indicated a low thermal stability of the chlo- rite component. Such a low thermal stability could be related to an incomplete hydroxide sheet (Barnhisel and Bertsch, 1989).
For the coarse clays (1-2 #m) the major change from the C to the A1/E horizon was the decrease of the proportion of the chlorite and mica/chlorite compo- nents. The A1/E horizon coarse clay was almost ex- clusively constituted of mica layers. This demonstrated the preferential physical fragmentation of chlorite and mica/chlorite particles leading in the concentration of more resistant mica layers in the coarse clay fractions. The same was observed in the pedogenic weathering of clays in a soil developed in a granitic saprolite (Righi and Meunier, 1991). In good agreement was the de-
crease of the 0.154 nm XRD reflection intensity (trioc- tahedral minerals) from the C to the A1/E samples.
The decrease in Mg and Fe content is also well ex- plained by the preferential weathering of the Fe, Mg- rich chloritic layers. Although mica layers were rela- tively accumulated in the A 1/E horizon sample, the K content was not strongly increased in this sample, this would indicate K-depletion of the mica (vermiculiti- zation). The rather large amounts of CBD-extractable iron indicated that the release of iron from the Fe, Mg- rich phyllosilicates and its subsequent precipitation as amorphous and/or crystalline oxides are important steps of the weathering process.
The Bw fine fraction (<0.1 #m, N) was dominated by minerals with a strongly expressed XRD intergrade behavior. So, the greatest concentration of hydroxy- interlayered minerals was found in the fine clay fraction from the Bw, a sub-surface horizon, but not in the A 1/E horizon, a fine clay sample. This was in disagreement with the results of Weed and Bowen (1990), who stated
494 Righi, Petit, and Bouchet Clays and Clay Minerals
A 1/E Bh Bw I-2 ~tm, M ll .0 1-2 ~m, M 21.6 1-2 tzm, M 17.5 0.1-0.2/~m, N 42.4 0.1-0.2 ~tm, N 32.1 0.1-0.2 um, N 68.2 <0.1 ~m, N 57.6 <0.1 ~m, N 48.2 <0.1 t~m, N 65.5
that maximum concentration of hydroxy-interlayered minerals would be found in the surface horizon and in the coarse clays.
The intergrade X R D behavior is generally attributed to hydroxy-A1 interlayered polycations (Barnhisel and Bertsch, 1989), which can be removed by the Na-ci- trate treatment. In the present study, the Na-citrate treatment did not actually improve the collapse of the intergrade minerals. Moreover, the Na-citrate extract was rich in Mg, especially for the Bw, <0.1 #m N sample. This is a strong indication that, in the present case, interlayered materials are not aluminous but mostly magnesian. Another confirmation was given by FTIR spectroscopy showing a hydroxide interlayered sheet stable upon heating up to 600~ Such a thermal stability is related to a hydroxide sheet with Mg as the dominant cation. Ghabru et aL (1990) also reported an intergrade hydroxy-intedayered vermiculite in which the interlayered contaminant was not A1 but Fe cations.
From the Bw to the Bh and A1/E horizons, these intergrade minerals were progressively transformed into interstratified minerals that included a smectitic com- ponent. These appeared to be randomly interstratified chlorite/smectite or vermiculite/smectite minerals in the Bh horizon and illite/smectite in the A 1/E horizon. Decreasing abundance of interlayered material was shown by the decrease o f the relative intensity of the XRD reflection in the 0.50 nm region, in good agree- ment with the improved collapse of the minerals in response to heat treatments. Thus a decrease in the proportion of chlorite layers (or layers with interlay-
ered contaminants) was observed in the fine clays from the bot tom to the top of the soil profile. In good agree- ment with the X R D diagram patterns was the chemical composition of these fine clay fractions: from the Bw to the A1/E horizon, a decrease in the Mg and Fe contents was observed with a parallel increase in the K content.
The smectitic component of these interstratified minerals appeared to be first beidellitic (tetrahedral charge) in the Bh and then montmoril lonit ic (octahe- dral charge) in the A1/E horizon. Proust et al. (1986) made a similar observation and stated a decrease of the Al-for-Si tetrahedral substitutions with chlorite weathering.
The illite/smectite interstratified minerals that were found in the A 1/E horizon might come from either the transformation of the chlorite and illite/chlorite mixed- layers present in the lower horizons through the pref- erential dissolution of the brucite sheet or from the transformation of illite or mica through exchange of K for hydrated exchangeable cations. The first possibility is supported by the suspected formation of chlorite/ smectite interstratified mineral in the Bh horizon and by illite/chlorite mixed layers associated with the illite/ smectite in the A I / E horizon. I f this is true, one must assume that part of the smectite layers has finally dis- solved in order to explain the increase in K content in the A1/E, <0.1 #m N sample, indicating a higher pro- portion of illite layers. The formation of illite/smectite through transformation o f illite is also a possibility, K-depletion in the mica from the 1-2 ~m coarse clays
Table 5. Total analyses of selected fractions as percentage of dry sample.
Samples SiO~ AI20~ Fe20~ MnO MgO CaO Na20 K20 TiO2
Vol. 4t, No. 4, 1993 Interlayered and interstratified minerals from chlorite 495
in the A 1 / E hor izon being a first stage o f that trans- format ion .
C O N C L U S I O N
The clays in a podzol ized soil deve loped in a chlo- r i te -mica schist saproli te were p roduced by weather ing o f the pre-exist ing phyUosilicates. Physical f ragmen- tat ion and mineralogical t ransformat ion were i n v o l v e d for the fo rmat ion o f soil clays. Chlor i te and mica /ch lo - rite mixed- layers in the larger particles o f pre-exist ing phyllosil icates were more strongly affected by physical f ragmenta t ion than mica layers. A concent ra t ion o f mica layers took place in the coarse clay fractions, as chlori t ic residues were accumula ted in the fine clays. These were responsible for a typical X R D intergrade behavior , the inter layered con taminan t being most ly hydroxy-Mg cations. Fur ther mineralogical t ransfor- mat ions induced by soil fo rma t ion were the r emova l o f the inter layered contaminant , leading to i l l i te /smec- t i te mixed- layer minera ls as end products o f the weath- ering processes.
R E F E R E N C E S
Adams, W. A. and Kassim, J. K. (1983) The origin of ver- miculite developed from lower palaeozoic sedimentary rocks in Mid Wales: Soil Sci. Soc. Am. J. 47, 316-320.
Bain, D.C. (1977) The weathering of chloritic minerals in some scottish soils: J. Soil Sci. 28, 144-164.
Barnhisel, R. I. and Bertsch, P. M. (1989) Chlorites and hydroxy interlayered vermiculite and smectite: in Minerals in Soil Environments: 2nd ed., J. B. Dixon and S. B. Weed, eds., Soil Sci. Soc. Am., Madison, Wisconsin, 729-788.
Borchardt, G. (1989) Smectites: in Minerals in Soil Envi- ronments: 2nd ed., J. B. Dixon and S. B. Weed, eds., Soil Sci. Soc. Am., Madison, Wisconsin, 675-727.
Caill~re, S. and Hrnin, S. (1960) Relationship between the crystallochemical constitution of phyllites and their dehy- dration temperature application in the case of chlorites: Bull. Soc. Ft. Ceram. 48, 63-67.
Churchman, G.J . (1980) Clay minerals formed from micas and chlorite in some New Zealand soils: Clay Miner. 15, 59-76.
DeConinck, F., van Ranst, E., and Jensen, W. (1983) Trioc- tabedral and dioctahedral chlorite in soils: Examples of a Dystrochrept (Corsica), a Cryortbod (Norway) and a Ha- pludatf (France): in P~trologie des Alterations et des Sols, D. Nahon and Y. Noack, eds., Sciences Grologiques, Stras- bourg, 74-84.
Douglas, L. A. (1967) Sodium citrate-dithionite induced alteration of biotite: Soil Sci. 103, 191-195.
Douglas, L.A. (1989) Vermiculites: in Minerals in SoilEn- vironments: 2nd ed., J. B. Dixon and S. B. Weed, eds., Soil Sci. Soc. Am., Madison, Wisconsin, 635-674.
Ghabru, S. K., Mermut, A. R., and St. Arnaud, R.J . (1990) Isolation and characterization of an iron-rich chlorite-like mineral from soil clays: Soil Sci. Soc. Am. J. 54, 281-287.
Greene-Kelly, R. (1953) The identification of montmoril- lonoids in days. J. Soil Sci. 4, 233-237.
Jeanroy, E. (1972) Analyse totale des silicates naturels par spectrophotom&rie d'absorption atomique. Application au sol et ~ ses constituants: Chim. Anal. 54, 159-166.
Lanson, B. and Besson, G. (1992) Characterization of the end of srnectite-to-illite transformation: Decomposition of X-ray patterns: Clays & Clay Minerals 40, 40-52.
Makumbi, L. and Herbillon, A.J . (1972) Vermiculitisation exprrimentale d'une chlorite: Bull. Groupe Fr. Argiles XXIV, 153-164.
Mehra, O. P. and Jackson, M.L. (1960) Iron oxide removal from soils and clays by a dithionite-citrate system buffered with sodium bicarbonate: Clays & Clay Minerals 7, 3 l 7- 327.
Proust, D., Eymery, J.-P., and Beaufort, D. (1986) Super- gene vermiculitization of a magnesian chlorite: Iron and magnesium removal processes: Clays & Clay Minerals 34, 572-580.
Reynolds, R. C. (1980) Interstratified clay minerals: in Crys- tal Structures of Clay Minerals and Their X-ray Identifi- cation, G. W. Brindley and G. Brown, eds., Miner. Soc., London, 249-359.
Reynolds, R.C. (1985) Description of Program N E W M O D for the Calculation of the One-dimensional X-ray Diffrac- tion Patterns of Mixed-layered Clays: R. C. Reynolds, 8 Brook Road, Hanover, New Hampshire, 24 pp.
Righi, D. and Jadault, P. (1988) Improving soil clay min- erals studies by high-gradient magnetic separation: Clay Miner. 23, 225-232.
Righi, D. and Lorphelin, L. (1986) Weathering of silt and clay in soils of a toposequence in the Himalayas, Nepal: Geoderma 39, 141-155.
Righi, D. and Lorpbelin, L. (1987) The soils of a typical slope in the Himalayas (Nepal): Their main characteristics and distribution: Catena 14, 533-551.
Righi, D. and Meunier, A. (1991) Characterization and ge- netic interpretation of clays in an acid brown soil (Dystro- chrept) developed in a granitic saprolite: Clays & Clay Min- erals 39, 519-530.
Ross, G. J., Wang, C., Ozkan, A. I., and Rees, H. W. (1982) Weathering of chlorite and mica in a New Brunswick podzol developed on till derived from chlorite-mica schist: Geo- derma 27, 255-267.
Senkayi, A. L., Dixon, J. B., and Hossner, L. R. (1981) Transformation of chlorite to smectite through regularly interstratified intermediates: Soil Sci. Soc. Am. J. 45, 650- 656.
Stucki, J. W., Golden, D. C., and Roth, C.B. (1984) Effects of reduction and reoxidation of structural iron on the sur- face charge and dissolution of dioctahedral smectites: Clays & Clay Minerals 32, 350-356.
Tamura, T. (1958) Identification of clay minerals from acid soils: J. Soil Sci. 9, 141-147.
USDA (1986) Cl~s de la taxonomy des sols: Monographie technique n~ 3. Coruell University, Ithaca, New York, 347 pp.
Weed, S. B. and Bowen, L. H. (1990) High-gradient mag- netic concentration of chlorite and hydroxy-interlayered minerals in soil clays: Soil Sci. Soc. Am. J. 54, 274-280.
(Received 9 February 1993; accepted 23 June 1993; Ms. 2323)