Edinburgh Research Explorer Characterization of multifocal T2*-weighted MRI hypointensities in the basal ganglia of elderly, community-dwelling subjects Citation for published version: Glatz, A, Valdés Hernández, MC, Kiker, AJ, Bastin, ME, Deary, IJ & Wardlaw, JM 2013, 'Characterization of multifocal T2*-weighted MRI hypointensities in the basal ganglia of elderly, community-dwelling subjects', NeuroImage, vol. 82, pp. 470-480. https://doi.org/10.1016/j.neuroimage.2013.06.013 Digital Object Identifier (DOI): 10.1016/j.neuroimage.2013.06.013 Link: Link to publication record in Edinburgh Research Explorer Document Version: Publisher's PDF, also known as Version of record Published In: NeuroImage Publisher Rights Statement: This is an open-access article distributed under the terms of the Creative Commons Attribution License, which permits unrestricted use, distribution, and reproduction in any medium, provided the original author and source are credited. General rights Copyright for the publications made accessible via the Edinburgh Research Explorer is retained by the author(s) and / or other copyright owners and it is a condition of accessing these publications that users recognise and abide by the legal requirements associated with these rights. Take down policy The University of Edinburgh has made every reasonable effort to ensure that Edinburgh Research Explorer content complies with UK legislation. If you believe that the public display of this file breaches copyright please contact [email protected] providing details, and we will remove access to the work immediately and investigate your claim. Download date: 23. Nov. 2021
Transcript
Edinburgh Research Explorer
Characterization of multifocal T2*-weighted MRI hypointensitiesin the basal ganglia of elderly, community-dwelling subjects
Citation for published version:Glatz, A, Valdés Hernández, MC, Kiker, AJ, Bastin, ME, Deary, IJ & Wardlaw, JM 2013, 'Characterization ofmultifocal T2*-weighted MRI hypointensities in the basal ganglia of elderly, community-dwelling subjects',NeuroImage, vol. 82, pp. 470-480. https://doi.org/10.1016/j.neuroimage.2013.06.013
Digital Object Identifier (DOI):10.1016/j.neuroimage.2013.06.013
Link:Link to publication record in Edinburgh Research Explorer
Document Version:Publisher's PDF, also known as Version of record
Published In:NeuroImage
Publisher Rights Statement:This is an open-access article distributed under the terms of the Creative Commons Attribution License, whichpermits unrestricted use, distribution, and reproduction in any medium, provided the original author and sourceare credited.
General rightsCopyright for the publications made accessible via the Edinburgh Research Explorer is retained by the author(s)and / or other copyright owners and it is a condition of accessing these publications that users recognise andabide by the legal requirements associated with these rights.
Take down policyThe University of Edinburgh has made every reasonable effort to ensure that Edinburgh Research Explorercontent complies with UK legislation. If you believe that the public display of this file breaches copyright pleasecontact [email protected] providing details, and we will remove access to the work immediately andinvestigate your claim.
Contents lists available at SciVerse ScienceDirect
NeuroImage
j ourna l homepage: www.e lsev ie r .com/ locate /yn img
Characterization of multifocal T2*-weighted MRI hypointensities in thebasal ganglia of elderly, community-dwelling subjects☆
Andreas Glatz a,b,⁎, Maria C. Valdés Hernández a,b,c, Alexander J. Kiker a, Mark E. Bastin a,b,c,Ian J. Deary c,d, Joanna M. Wardlaw a,b,c
a Brain Research Imaging Centre (BRIC), Neuroimaging Sciences, University of Edinburgh, Western General Hospital, Crewe Road, Edinburgh EH4 2XU, UKb SINAPSE Collaboration, Brain Research Imaging Centre (BRIC), Neuroimaging Sciences, Western General Hospital, Crewe Road, Edinburgh EH4 2XU, UKc Centre for Cognitive Ageing and Cognitive Epidemiology, University of Edinburgh, Edinburgh, EH8 9JZ, UKd Department of Psychology, University of Edinburgh, Edinburgh, EH8 9JZ, UK
☆ This is an open-access article distributed under the tAttribution License, which permits unrestricted use, disany medium, provided the original author and source a⁎ Corresponding author at: Brain Research Imaging C
Sciences, University of Edinburgh, Western General HoEH4 2XU, UK. Fax: +44 131 537 2661.
Multifocal T2*-weighted (T2*w) hypointensities in the basal ganglia, which are believed to arise predomi-nantly from mineralized small vessels and perivascular spaces, have been proposed as a biomarker for cere-bral small vessel disease. This study provides baseline data on their appearance on conventional structuralMRI for improving and automating current manual segmentation methods. Using a published thresholdingmethod, multifocal T2*w hypointensities were manually segmented from whole brain T2*w volumesacquired from 98 community-dwelling subjects in their early 70s. Connected component analysis wasused to derive the average T2*w hypointensity count and load per basal ganglia nucleus, as well as the mor-phology of their connected components, while nonlinear spatial probability mapping yielded their spatialdistribution. T1-weighted (T1w), T2-weighted (T2w) and T2*w intensity distributions of basal gangliaT2*w hypointensities and their appearance on T1w and T2w MRI were investigated to gain further insightsinto the underlying tissue composition. In 75/98 subjects, on average, 3 T2*w hypointensities with a mediantotal volume per intracranial volume of 50.3 ppm were located in and around the globus pallidus. Individualhypointensities appeared smooth and spherical with a median volume of 12 mm3 and median in-plane areaof 4 mm2. Spatial probability maps suggested an association between T2*w hypointensities and the pointof entry of lenticulostriate arterioles into the brain parenchyma. T1w and T2w and especially the T2*w inten-sity distributions of these hypointensities, which were negatively skewed, were generally not normally dis-tributed indicating an underlying inhomogeneous tissue structure. Globus pallidus T2*w hypointensitiestended to appear hypo- and isointense on T1w and T2w MRI, whereas those from other structures appearediso- and hypointense. This pattern could be explained by an increased mineralization of the globus pallidus.In conclusion, the characteristic spatial distribution and appearance of multifocal basal ganglia T2*whypointensities in our elderly cohort on structural MRI appear to support the suggested association withmineralized proximal lenticulostriate arterioles and perivascular spaces.
In the brain, as in the other parts of the body, trace metals, such asiron, are essential for many cellular functions. Iron is specificallyneeded for dopaminergic neurotransmitter synthesis, myelination ofaxons and is involved in adenosine triphosphate (ATP) production.Brain iron is present in low-molecular weight complexes, medium-molecular weight complexes, such as transferrin, and high-molecular
erms of the Creative Commonstribution, and reproduction inre credited.entre (BRIC), Neuroimagingspital, Crewe Road, Edinburgh
blished by Elsevier Inc. All rights re
weight complexes, such as the soluble iron storage protein ferritinand, increasingly with age, the insoluble storage iron-complex hemo-siderin. Mineralization of iron and its storage in the form of ferritinare believed to protect the brain from its toxic effects (Mills et al.,2010; Rouault and Cooperman, 2006; Zecca et al., 2004).
Multifocal hypointensities in the basal ganglia are a typical findingon T2*-weighted (T2*w) structural MRI of elderly, otherwise healthysubjects (Penke et al., 2012). They are believed to arise from mineral-ized tissue predominantly associated with iron encrustations(ferrunginations) and calcifications of lenticulostriate (perforating)arterioles and perivascular spaces (Casanova and Araque, 2003).T2*w hypointensities in the basal ganglia have generally been consid-ered asymptomatic features of aging and only a few studies havedocumented their chemical composition. Slager and Wagner (1956)analyzed paraffin-embedded autopsy tissue from 200 brains and
Table 1Relevant LBC1936 MRI sequences and their parameters. The complete LBC1936 MRIprotocol is described in Wardlaw et al. (2011).
Sequence IR-prep FGRE (3D) FSE (2D) GRASS (2D)
Contrast type T1-weighted T2-weighted T2*-weightedFOV in mm2 256 × 256 256 × 256 256 × 256Orientation Coronal Axial AxialSlice thickness in mm 1.3 2 2Acquisition matrix 256 × 256a 256 × 256 256 × 256a
Flip angle in degrees 8 – 20TI/TE/TR in ms 500/4/9.8 –/102/11,320 –/15/940Bandwidth in kHz 15.63 20.83 12.5
a After interpolation by the scanner software.
471A. Glatz et al. / NeuroImage 82 (2013) 470–480
reported that iron is typically deposited in an organic matrix, whichis then followed by the deposition of other trace metals, such ascalcium. Morris et al. (1992) visualized iron encrustations aroundthe lenticulostriate arteries of the basal ganglia in frozen samplesfrom 14 brains using Perl's staining method with diaminobenzidinintensification. They reported that iron encrustations did not seemto originate from leaking blood vessels, since they were mostlyfound in perivascular areas.
Histochemical and chemical methods are still considered the “goldstandard” for assessing trace metals in tissue. Brain iron, for example,is commonly visualized with Perl's Prussian Blue tissue stain and canbe quantified with the orthophenanthroline method combined with acolorimetrical technique (Hallgren and Sourander, 1958). However,MRI has become the de facto standard for non-invasively visualizingiron and mineral deposits in the brain (Drayer et al., 1986; Schenckand Zimmerman, 2004; Valdés Hernández et al., 2012). In this modal-ity, endogenous magnetic particle deposits accelerate the realign-ment of water proton spins along the main magnetic field directionas well as their dephasing in the transverse plane. However, their pre-dominant effect depends on their chemical environment (Brass et al.,2006; Schenck and Zimmerman, 2004). This is characterized by alocalized shortening of T1, T2 and T2* relaxation times and can leadto focal hyperintensities on T1-weighted (T1w), and hypointensitieson T2-weighted (T2w) and T2*w MRI. The T2* relaxation time isdefined as 1/T2* = 1/T2 + 1/T2′, where T2′ accounts for additionalproton spin dephasing due to gradients in the main magnetic field,magnetic susceptibility differences among tissues, chemical shifteffects and imaging gradients applied for spatial encoding (Chavhanet al., 2009). T1 and T2 shortening caused by microscopic magneticparticles is explained by the inner and outer sphere theories,reviewed by Caravan et al. (2009) for example. T2 and T2* shorteningdue to micro- and mesoscopic particles (Kennan et al., 1994;Weisskoff et al., 1994) depends on the radius r of the particle relativeto the average proton diffusion coefficient D (diffusive correlationtime τD = r2/D) and its magnetic susceptibility, described by theequatorial Lamor frequency change δω. If the particle radius is rela-tively small (outer sphere regime; δωτD ≪ 1) proton spins are irre-versibly dephased, which causes a similar shortening of T2 and T2*,and hence hypointensities on T2w and T2*wMRI. If the particle radiusis relatively large (static dephasing regime; δωτD ≪ 1) protons arereversibly dephased, which causes a shortening of T2* but not T2,and hypointensities on T2*w but not T2w MRI, since proton spinscan be fully rephased by the 180° pulse of a spin-echo sequence. A re-view of the different regimes, including the intermediate regime, canbe found in Yung (2003). Notably, flow (Reichenbach et al., 1997)can also cause focal hypointensities on T2*w MRI that mimic iron ormineral deposits. Local changes in tissue composition (Henkelmanet al., 1991; Kruer et al., 2012; Valdés Hernández et al., 2012;Vymazal et al., 2000), such as a decrease in the water proton density,can cause hypointensities on T1w MRI.
MRI sequences and post-processing methods for identifying andquantifying iron and mineral stores in the brain were reviewed inHaacke et al. (2005), Ropele et al. (2011) and Valdés Hernándezet al. (2012). Novel methods include susceptibility weighted imaging(SWI; Haacke et al., 2009), and quantitative techniques that measurethe T2 (Bartzokis et al., 2007), T2* (Aquino et al., 2009; Langkammeret al., 2010) and magnetic susceptibility Δχ (De Rochefort et al., 2010;Schweser et al., 2010) parameters of brain tissue directly. However,daily clinical practice still relies mostly on conventional structuralMRI sequences.
In this study, we characterize the appearance of basal gangliaT2*w hypointensities in a group of community-dwelling subjectsin their early 70s. This study provides statistics of their count,load and morphological properties per basal ganglia nuclei andtheir spatial distribution, discusses potential difficulties in their seg-mentation, and derives their multimodal appearance as a first step
towards their application as a possible biomarker for small vesseldisease.
Materials and methods
Subjects and MRI protocol
T1w, T2w and T2*w whole brain volumes were acquired from theLothian Birth Cohort 1936 (LBC1936; Deary et al., 2007; Deary et al.,2011; Wardlaw et al., 2011). All participants were imaged using aGE Signa HDxt 1.5 T clinical scanner (Milwaukee, WI, USA) equippedwith a self-shielding gradient set (33 mT m−1 maximum gradientstrength) and manufacturer supplied 8-channel phased-array headcoil; relevant scan parameters are listed in Table 1. The LBC1936is a longitudinal study of cognitive aging that originally recruiteda group of 1091 community-dwelling individuals resident in theEdinburgh and Lothian areas of Scotland who were born in 1936. Ap-proximately three years after they were first recruited into the study,700 subjects underwent brain MRI at a mean age of 72.5 years(SD 0.7 years). The MRI scans of all participants were categorizedaccording to the General and Putaminal Visual Rating Scale (ValdésHernández et al., 2011). For our study, a sample was generatedcontaining 100 randomly selected subjects from each category ofthe General and Putaminal Visual Rating Scale. Two subjects of thesample were excluded due to missing MRI data, which left 98 subjects(45 females) for further analysis.
A representative LBC1936 subject, without major artifacts, signifi-cant white matter lesion load or any incidental findings on structuralMRI, was chosen as a reference for spatial normalization and intensitystandardization. This subject was selected based on head size, brainshape and spatial intensity distribution criteria using the Mahalanobisdistance (De Maesschalck et al., 2000).
Semi-automated segmentation of focal T2*w hypointensities
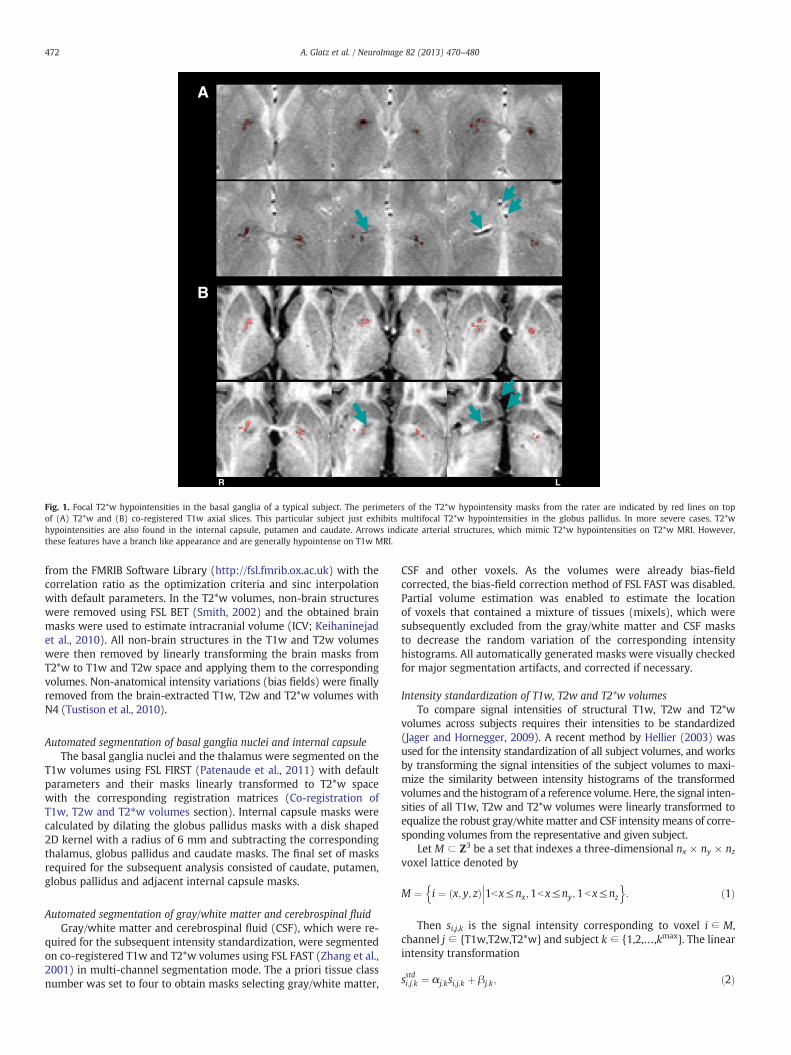
A trained rater (AJK) used Analyze 10.0 (Mayo Clinic, Rochester, MN,USA) to semi-automatically segment focal hypointensities (Fig. 1) in allbrain regions on the T2*w volumes with a local thresholding methoddescribed in Valdés Hernández et al. (2011). The rater also delineatedregions within the T2*w hypointensities that appeared hypointenseon T1wMRI, since they potentially relate to a change in the compositionof the underlying tissue (Kruer et al., 2012; Valdés Hernández et al.,2012). The rater segmented 29 subjects twice to estimate the intra-rater variability. The similarity between the T2*w hypointensity masksof the first and second passes was measured using the Jaccard index(Shattuck et al., 2009).
Preprocessing
Co-registration of T1w, T2w and T2*w volumesAll T1w and T2w volumes were affine registered to the corre-
sponding T2*w volumes using FSL FLIRT (Jenkinson et al., 2002)
R L
A
B
Fig. 1. Focal T2*w hypointensities in the basal ganglia of a typical subject. The perimeters of the T2*w hypointensity masks from the rater are indicated by red lines on topof (A) T2*w and (B) co-registered T1w axial slices. This particular subject just exhibits multifocal T2*w hypointensities in the globus pallidus. In more severe cases, T2*whypointensities are also found in the internal capsule, putamen and caudate. Arrows indicate arterial structures, which mimic T2*w hypointensities on T2*w MRI. However,these features have a branch like appearance and are generally hypointense on T1w MRI.
472 A. Glatz et al. / NeuroImage 82 (2013) 470–480
from the FMRIB Software Library (http://fsl.fmrib.ox.ac.uk) with thecorrelation ratio as the optimization criteria and sinc interpolationwith default parameters. In the T2*w volumes, non-brain structureswere removed using FSL BET (Smith, 2002) and the obtained brainmasks were used to estimate intracranial volume (ICV; Keihaninejadet al., 2010). All non-brain structures in the T1w and T2w volumeswere then removed by linearly transforming the brain masks fromT2*w to T1w and T2w space and applying them to the correspondingvolumes. Non-anatomical intensity variations (bias fields) were finallyremoved from the brain-extracted T1w, T2w and T2*w volumes withN4 (Tustison et al., 2010).
Automated segmentation of basal ganglia nuclei and internal capsuleThe basal ganglia nuclei and the thalamus were segmented on the
T1w volumes using FSL FIRST (Patenaude et al., 2011) with defaultparameters and their masks linearly transformed to T2*w spacewith the corresponding registration matrices (Co-registration ofT1w, T2w and T2⁎w volumes section). Internal capsule masks werecalculated by dilating the globus pallidus masks with a disk shaped2D kernel with a radius of 6 mm and subtracting the correspondingthalamus, globus pallidus and caudate masks. The final set of masksrequired for the subsequent analysis consisted of caudate, putamen,globus pallidus and adjacent internal capsule masks.
Automated segmentation of gray/white matter and cerebrospinal fluidGray/white matter and cerebrospinal fluid (CSF), which were re-
quired for the subsequent intensity standardization, were segmentedon co-registered T1w and T2*w volumes using FSL FAST (Zhang et al.,2001) in multi-channel segmentation mode. The a priori tissue classnumber was set to four to obtain masks selecting gray/white matter,
CSF and other voxels. As the volumes were already bias-fieldcorrected, the bias-field correction method of FSL FAST was disabled.Partial volume estimation was enabled to estimate the locationof voxels that contained a mixture of tissues (mixels), which weresubsequently excluded from the gray/white matter and CSF masksto decrease the random variation of the corresponding intensityhistograms. All automatically generated masks were visually checkedfor major segmentation artifacts, and corrected if necessary.
Intensity standardization of T1w, T2w and T2*w volumesTo compare signal intensities of structural T1w, T2w and T2*w
volumes across subjects requires their intensities to be standardized(Jager and Hornegger, 2009). A recent method by Hellier (2003) wasused for the intensity standardization of all subject volumes, and worksby transforming the signal intensities of the subject volumes to maxi-mize the similarity between intensity histograms of the transformedvolumes and the histogramof a reference volume. Here, the signal inten-sities of all T1w, T2w and T2*w volumes were linearly transformed toequalize the robust gray/white matter and CSF intensity means of corre-sponding volumes from the representative and given subject.
Let M ⊂ Z3 be a set that indexes a three-dimensional nx × ny × nzvoxel lattice denoted by
M ¼ i ¼ x; y; zð Þ 1b x≤nx;1bx≤ny;1b x≤nz
��� o:
nð1Þ
Then si,j,k is the signal intensity corresponding to voxel i ∈ M,channel j ∈ {T1w,T2w,T2*w} and subject k ∈ {1,2,…,kmax}. The linearintensity transformation
of the original T1w, T2w and T2*w signal intensities provides thestandardized signal intensities si,j,kstd . The coefficients αj.k and βj.k wereestimated by solving the following linear regression model
Stj;refP
¼ αj;k Stj;k
P
þ βj;k þ ɛj;k with ɛj;k ∼iidN 0;σ2
j;k
� �ð3Þ
where Sj,reft = {si,j,ref|i ∈ Mref
t } and Sj,kt = {si,j,k|i ∈ Mk
t} with t ∈ {GM,WM,CSF} are the gray/white matter and CSF signal intensities of therepresentative and given subject, which were selected by the corre-sponding masks Mref
t ⊂ M and Mkt ⊂ M. The robust means were esti-
mated with M-estimators of location with the psi-function (LIBRAtoolbox; Verboven and Hubert, 2005).
Connected component labeling of focal T2*w hypointensitiesThe locations of individual T2*w hypointensities, i.e. the connected
components of the T2*w hypointensity masks from the rater (six-connected neighborhood), that intersected at least 50% with thebasal ganglia and internal capsule masks (Automated segmentationof basal ganglia nuclei and internal capsule section) were labeledautomatically. The remaining individual T2*w hypointensities werelabeled manually and excluded from further processing. T2*whypointensities that intersected with the internal capsule maskswere not excluded because the border between globus pallidus andinternal capsule was hard to define and the rater found a markedamount of T2*w hypointensities in this region. All labels were manu-ally checked and corrected if necessary.
Mathematically, the labels were defined as follows. Let Hk ={1,2, …,hkmax} be the set with the indices of all T2*w hypointensitiesfrom the basal ganglia and internal capsule of a subject. The label lhk ;kof an individual T2*w hypointensity hk ∈ Hk is then defined by themaximal intersection between its mask MHypo
hk ;k⊂M and the structural
masks Ml,kBG ⊂ M
lhk ;k ¼ maxl∈L
MHypohk
∩MBGl;k
��� ���; ð4Þ
where L = {11,12,13,14,50,51,52,55} denoted the FSL FIRST labelsfor the left and right basal ganglia nuclei with two additional labels,14 and 55, for the left and right internal capsules. In the case ofan ambiguous maximum, for example if exactly half of the T2*whypointensity volume extended into two adjacent structures, thestructure label that corresponded to the most hypointense part ofthe T2*w hypointensity was chosen.
Analysis of basal ganglia T2*w hypointensity masks
T2*w hypointensity masks from the rater were analyzed with aprocessing pipeline that was mainly implemented in Matlab 2011b(The MathWorks Inc., Natick, MA). The pipeline for generating thespatial distribution map of basal ganglia T2*w hypointensities wasimplemented in Bash (http://www.gnu.org).
Count and load of basal ganglia T2*w hypointensitiesThe count and load of basal ganglia T2*w hypointensities were de-
rived automatically with the T2*w hypointensity labels (Connectedcomponent labeling of focal T2⁎w hypointensities section), andwere determined as follows. Let the set with all indices of T2*whypointensities from a structure be
Hl;k ¼ hk lhk ;k ¼ l��� o
:n
ð5Þ
Then the T2*w hypointensity count per structure is
nl;k ¼ Hl;k
�� ��; ð6Þ
and the total T2*w hypointensity load Vl,knorm per structure is
Vnorml;k ¼ Vl;k
VICVk
¼MHypo
l;k
��� ���VICVk =Vvox ; ð7Þ
where Vl,m is the total volume of T2*w hypointensities in a structure,VkICV is the ICV, Vvox is the volume of a single voxel and
MHypol;k ¼ ∪
h∈Hl;k
MHypoh;k ; ð8Þ
is the mask of all T2*w hypointensities from a structure. The volumeswere normalized by ICV since this accounts for the variation of T2*whypointensity volume with head size (Penke et al., 2012). Thetwo-sided Wilcoxon rank sum test was used to determine the signif-icance of T2*w hypointensity count and load differences in the leftand right hemisphere structures.
Morphology of individual basal ganglia T2*w hypointensitiesMorphological properties of individual T2*w hypointensities that
were quantified included their volume, maximum in-plane extent(maximum area), and roundness and sphericity. Roundness andsphericity measures (Wadell, 1932) were originally developed forcontinuous 3D objects. Therefore similar measures, i.e. the compact-ness (Bribiesca, 2008) and relative anisotropy, were developed forcharacterizing discrete 3D objects, and have recently been used tocharacterize brain microbleeds (Barnes et al., 2011). The compactnessand relative anisotropy range from 0 to 1, with perfectly smooth andround discrete 3D objects having a compactness of 1 and relativeanisotropy of 0. The morphological properties were calculated withthe masks Mh,k
Hypo of individual T2*w hypointensities after nearestneighbor interpolation to a 1 mm isotropic voxel lattice.
Spatial probability distribution of basal ganglia T2*w hypointensitiesThe spatial probability distribution of basal ganglia T2*w
hypointensities was estimated by linearly aggregating the spatialprobability maps of all subjects pk
spat (Stone, 1961)
pspat ¼Xkmax
k¼1
wkpspatk ¼ 1
kmax
Xkmax
k¼1
pspatk with wk ¼
1kmax : ð9Þ
Non-linear transformation of the T2*w hypointensity mask from asubject
MHypok ¼ ∪
h∈Hk
MHypoh;k ; ð10Þ
to the T1w reference space of the representative subject (Subjects andMRI protocol section) and normalization yielded the corresponding
spatial probability map pspatk ¼ pspat1;k ; pspat2;k ;…; pspatimax;k
� �T, where pi,k
spat
represent the estimated probability densities associated with a refer-ence space voxel. To obtain the warp fields for the non-linear registra-tion, the T1w volume from the representative subject was first rigidlyregistered to the MNI152 2 mm template using FSL FLIRT (Jenkinsonet al., 2002). Then the T2*w volumes were non-linearly registeredto the T1w volume from the representative subject using FSL FNIRT(Andersson et al., 2008).
Analysis of signal intensities selected by focal T2*w hypointensity masks
Segmentation thresholds of basal ganglia T2*w hypointensitieswere derived to identify factors influencing their segmentation. Then
Table 2Spatial distribution of focal T2*w hypointensities. This table shows the anatomicallocations of the individual T2*w hypointensities, i.e. the connected components(six-connected neighborhood) of the T2*w hypointensity masks from the rater. Addi-tionally, it shows how many individual T2*w hypointensities were marked as partlyor completely hypointense on T1wMRI. Regionswithin individual T2*w hypointensitiesthat appeared hypointense on T1w might potentially indicate a change in the under-lying tissue composition, such as calcification (Kruer et al., 2012; Valdés Hernándezet al., 2012).
Anatomical structure Total count Marked as partlyhypointense onT1w MRI
Outside the basal ganglia and internal capsuleChoroid plexus 325 4 317Pineal gland 55 2 52Substantia nigra 32 0 0Other structures 137 3 9Total 549 9 378
474 A. Glatz et al. / NeuroImage 82 (2013) 470–480
the average T1w, T2w and T2*w intensity probability distributionsof these hypointensities and their appearance on T1w and T2w MRIrelative to normal-appearing tissueweremeasured to infer further in-formation about the underlying tissue structure and its composition.This part of the analysis pipeline was fully implemented in Matlab2011b.
Segmentation thresholds of basal ganglia T2*w hypointensitiesThe segmentation thresholds of the rater sl,k
Thresh were defined asthe 97th-percentiles of the standardized T2*w hypointensities froma structure that were selected by the mask Ml,k
Hypo
sThreshl;k ¼ Sstd;Hypol;T2�w;k
� �0:97
with Sstd;Hypol;j;k ¼ si;j;k i∈MHypol;k
��� o:
nð11Þ
The median T2*w intensities of corresponding normal-appearingtissue were used as a reference and given by the median of the stan-dardized T2*w intensities that were selected by the normal-appearingtissue maskMl,k
NABG = Ml,kBG ∩ (Ml,k
Hypo)c
sNABGl;j;k ¼ Sstd;NABGl;j;k
� �0:5
with Sstd;NABGl;j;k ¼ si;j;k i∈MNABGl;k
��� o:
nð12Þ
The normal-appearing tissue masks were visually checked andmanually corrected if segmentation artifacts were present to ensurea consistent reference across subjects.
Signal intensity distributions of basal ganglia T2*w hypointensitiesThe T1w, T2w and T2*w intensity distributions of basal ganglia
T2*w hypointensities were estimated by linearly aggregating the in-tensity histograms of all subjects pj,k
int (Stone, 1961)
pintj ¼
Xkmax
k¼1
wkpintj;k ¼ 1
kmax
Xkmax
k¼1
pintj;k with wk ¼
1kmax : ð13Þ
The intensity histogramof a subject pintj;k ¼ pint1;j;k;p
int2;j;k;…; pint
bmaxj ;j;k
� �T
,
where pb,j,kint represents the estimated probability density of histo-
gram bin b, were calculated with the standardized signal intensitiesSj,kstd,Hypo = {si,j,k|i ∈ Mk
Hypo} and bin widths, which were optimizedwith all signal intensities Sjstd,Hypo = ∪∀k Sj,k
std,Hypo and the method fromShimazaki and Shinomoto (2007).
The estimated average distributions were characterized in termsof their modality and skewness. The skewness was quantified withthe Bowley skewness coefficient (Qj
int,1 − 2Qjint,2 + Qj
int,3)/IQRj, wherethe quartiles Qj
int,q with q ∈ {1,2,3,4} and interquartile ranges IQRjwere estimated from pj
int.
Appearance of basal ganglia T2*w hypointensities on T1w and T2w MRIT2*w hypointensities of a structure with the masks Ml,k
Hypo wereconsidered hyper- or hypointense on the T1w and T2w volumes if(i) their signal intensities Sl,j,k
std,Hypo were significantly different fromthe signal intensities of normal tissue Sl,j,k
std,NABG, and (ii) their mediansignal intensities (Sl,j,kstd,Hypo)0.5 were brighter or darker than themediansignal intensities of normal tissue intensities (Sl,j,kstd,NABG)0.5. The Mann–Whitney U test was used to assess condition (i) at a significance levelof α = 0.05.
Results
Intra-rater variability and spatial distribution of T2*w hypointensities
The intra-rater variability between 29 T2*w hypointensity maskssegmented on two separate occasions was 0.51 ± 0.20, as assessedby the Jaccard similarity index.
As shown in detail in Table 2, the expert rater segmented 867individual T2*w hypointensities in all subjects, 36% inside and 63%outside the region selected by the basal ganglia and internal capsulemasks. Of the 549 individual T2*w hypointensities found outside thebasal ganglia and internal capsule, 59% were in the choroid plexus,10% in the pineal gland, 6% in the substantia nigra and the rest inother structures. Of the 318 individual T2*w hypointensities foundinside the basal ganglia and internal capsule, 72% were in the globuspallidus, 18% in the internal capsule, 8% in the putamen and 2% inthe caudate.
Count and load of basal ganglia T2*w hypointensities
As shown in Fig. 2, each subject with basal ganglia T2*whypointensities had on average one hypointensity in each globuspallidus, two hypointensities in the left and one in the right hemi-sphere structures, and 3 hypointensities in all structures. The averagehypointensity load in the left and right globus pallidus, in the leftand right hemisphere structures, and in all structures was 21.1,15.9, 28.9, 21.2 and 50.3 ppm, respectively. No significant (p b 0.05)differences were found between the number of hypointensities andhypointensity loads in the left and right hemisphere structures, how-ever, Fig. 2 suggests that slightly more hypointensities were countedin the left than right hemisphere structures.
Morphology of individual basal ganglia T2*w hypointensities
The volume, maximum in-plane area, compactness and relativeanisotropy of individual basal ganglia T2*w hypointensities are shownin Table 3. These properties were significantly different for inter-slicehypointensities, which extend across more than one MRI slice, andintra-slice hypointensities, which are contained within one MRI slice.Generally, inter-slice hypointensities were very small, with a smoothsurface and a round shape. Due to the limited resolution, intra-slicehypointensities appeared as squares, rectangles and L-shaped elementsformed by 1 to 4 voxels.
Spatial probability distribution of T2*w hypointensities
The spatial distribution map in Fig. 3 indicates a high probabilitydensity of T2*w hypointensities within central regions of the globuspallidus in all MRI slices where this structure is evident. From thisregion the density decreases predominantly not only towards the
Fig. 2. Average count and load of basal ganglia T2*w hypointensities. The anatomical structures include the left caudate (CL), left putamen (PL), left globus pallidus (GL), left internalcapsule (IL), right caudate (CR), right putamen (PR), right globus pallidus (GR) and right internal capsule (IR). Additionally, the boxplots show the T2*w hypointensity count in theleft and right basal ganglia structures, and in all basal ganglia structures. T2*w hypointensity count and load were especially elevated in the globus pallidus. Although the upper plotsuggests a difference between the T2*w hypointensity count in the left and right hemisphere structures, this difference was not significant at α = 0.05.
475A. Glatz et al. / NeuroImage 82 (2013) 470–480
posterior limb of the internal capsule and putamen, but also the ante-rior limb of the internal capsule and caudate. T2*w hypointensitiesalso coincide with the posterior putamen. Anatomically, the regionwith the highest density of T2*w hypointensities coincides withthe vascular territories of the lenticulostriate arterioles that supplythe globus pallidus (Donzelli et al., 1998; Feekes et al., 2005;Marinkovic et al., 1985).
Segmentation thresholds of basal ganglia T2* hypointensities
The segmentation thresholds of T2*w hypointensities and thecorresponding median signal intensities of normal-appearing tissue,which were similar for the corresponding left and right hemispherestructures, are shown in Fig. 4. The variation in the average segmen-tation threshold across the different brain structures indicates thatthe rater adjusted the threshold, which was initially the same for allstructures, specifically for each structure. The segmentation thresholdsof the caudate, putamen, globus pallidus and adjacent internal capsulewere on average 27.3 ± 2.4, 30.0 ± 6.8, 16.5 ± 5.5 and 19.4 ± 5.8%lower than the median signal intensities of normal-appearing tissue,respectively. These values suggest that the rater typically used twodifferent thresholds, one for segmenting T2*w hypointensities in thecaudate and putamen, and one for segmenting T2*w hypointensities
Table 3Morphological properties of individual basal ganglia T2*w hypointensities. The propertiesare significantly different (p b 0.05) for inter- (Nslice > 1) and intra-slice (Nslice = 1) basalganglia T2*w hypointensities.
in the globus pallidus and internal capsule. The normal tissue intensitiesof the putamen, globus pallidus and adjacent internal capsule were3.4 ± 2.1, 14.0 ± 2.3 and 15.6 ± 1.7% lower than the normal tissueintensities of the caudate, respectively. These values confirm that thecaudate appears brightest on T2*w MRI followed by the putamen,globus pallidus and internal capsule.
Signal intensity distributions of basal ganglia T2*w hypointensities
Fig. 5 shows the estimated average T1w, T2w and T2*w intensitydistributions of basal ganglia T2*w hypointensities from the cohort.The T1w, T2w and T2*w intensity distributions are all unimodalwith Bowley skewness coefficients of 0.044, 0.042 and −0.193. Theskewness coefficients confirm that the T1w and T2w distributionsare slightly positively skewed, whereas the T2*w distribution is nega-tively skewed. These average distribution shapes as well as theirskewness indicate that the T1w and T2w distributions, and especiallythe T2*w distributions are generally not normally distributed. The lefttail of the T2*w distributions confirms the observation that there aresmaller, darker hypointense regions within individual hypointensities,which are surrounded by larger, brighter hypointense regions.
Appearance of basal ganglia T2*w hypointensities on T1w and T2w MRI
Fig. 6 shows that the appearance of T2*w hypointensities in theglobus pallidus on T1w and T2w MRI differs from the appearanceof T2*w hypointensities seen in other structures. In 77% of subjectswith globus pallidus T2*w hypointensities, these features appearedhypointense on T1w MRI, whereas in 20% they appeared isointenseand in 3% hyperintense. Conversely, in 51% of subjects, these globuspallidus T2*w hypointensities appeared isointense on T2w MRI,whereas in 22% they appeared hypointense and in 26% hyperintense.These results are in agreement with the rater (Table 2) who predom-inantly marked globus pallidus T2*w hypointensities as partly orcompletely hypointense on T1w MRI. T2*w hypointensities in theinternal capsule and putamen appeared isointense on T1w MRI in61% and 55% of subjects, and hypointense on T2w volumes in 61%and 64% of subjects.
R L R L
Probability density in mm-3
2.85*10-41.00*10-6
Fig. 3. Spatial probability distribution of basal ganglia T2*w hypointensities. The generated spatial distribution maps of T2*w hypointensities are shown overlaid on axial andcoronal slices of the 2 mm isotropic T1w reference volume of the representative subject used for non-linear registration. For comparison, the coronal slices approximately correspondto the coronal slices in Feekes et al. (2005), which show the vascular territories of the lenticulostriate arteries (LSA), recurrent arteries of Heubner (RHA), and anterior choroidalarteries (AChA). The spatial probability distribution of these focal T2*w hypointensities indicates a high density inside the globus pallidus (green region), which coincides withthe point of entry of the lenticulostriate arterioles into the brain parenchyma; however, their density tends to decrease towards the internal capsule, putamen and caudate.
476 A. Glatz et al. / NeuroImage 82 (2013) 470–480
Discussion
T2*W hypointensities are frequently observed in the basal gangliaof healthy, older subjects, are associated with age-related cognitivedecline, and may provide a useful biomarker of cerebral small vesseldisease (Penke et al., 2012). These features are believed to arise frommineralization in and around the small lenticulostriate arterioles inthe inferior basal ganglia (Casanova and Araque, 2003; Morris et al.,1992). In this study, we document their spatial and intensity distribu-tions, morphology and appearances on T1w and T2w MRI in an older,community dwelling cohort with narrow age range with the aim ofimproving current manual segmentation methods.
Fig. 4. Segmentation thresholds of T2*w hypointensities and median T2*w intensitiesof corresponding normal-appearing basal ganglia tissue. This figure shows that therater chose different segmentation thresholds for T2*w hypointensities from differentanatomical structures. This systematic variation suggests that the manual segmenta-tion of T2*w hypointensities was potentially influenced by a difference in appearanceof T2*w hypointensities from different basal ganglia structures. An additional influencemight be the difference in appearance of the normal-appearing tissue intensities ofthe caudate, putamen, globus pallidus and internal capsule which look increasinglydark on T2*w volumes.
Harder et al. (2008) analyzed focal hypointensities in the globuspallidus and putamen of subjects with a wide age range and foundthat their SWI signal intensities decreased with age. A rating schemefor counting and classifying hypointensities in the putamen and globuspallidus was also proposed and an increase of the hypointensitygrade with age was reported. However, the suggested regularity of thehypointensity pattern and relation with age could not be confirmed inthe current study. The former can be, at least partly, attributed to thehigher sensitivity of the SWI sequence to iron compared to the T2*wsequence used here (Haacke et al., 2009), and the latter to the verynarrow age range of the participants enrolled in this study.
Van Es et al. (2008) investigated hypointensity patterns in thebasal ganglia of non-demented elderly subjects and assessed associa-tions between age-related changes in the brain. A method was devel-oped for classifying the hypointensity of the whole caudate, putamenand globus pallidus on T2*wMRI. The study reported that hypointensecaudate nuclei are a frequent finding in non-demented elderly sub-jects and that this change is significantly associated with more atro-phy and increased white matter load. However, most of the focalT2*w hypointensities that were found in this study were located inthe globus pallidus and far less were observed in the putamen andcaudate. This can be attributed to the different analysis methods,variations in subject population as well as differences in imaging pa-rameters, since the TE of the T2*w sequence employed in this studywas lower and hence the T2*w volumes were less T2*-weighted(Conijn et al., 2010) than those collected by Van Es et al.
The spatial probability map of basal ganglia T2*w hypointensities(Fig. 3) is consistent with observations in a larger sample of theLBC1936 and shows a high density of T2*w hypointensities at thecenter of the globus pallidus coinciding with the point of entry ofthe lenticulostriate arterioles into the basal ganglia (Donzelli et al.,1998; Feekes et al., 2005; Marinkovic et al., 1985). This finding is sup-ported by histological studies (Morris et al., 1992; Slager andWagner,1956), which report iron-encrusted vessels in the globus pallidus.Morris et al. (1992) speculated that encrustations make such vesselsprone to rupture or cause constriction to the blood flow. Notably,mineralization with a similar spatial distribution pattern as thatseen in the T2*w hypointensities studied here was found in the brains
T2*wT2wT1w
Fig. 5. T1w, T2w and T2*w intensity distributions of basal ganglia T2*w hypointensities. The bin-width optimized histograms estimate the distributions of T2*w, T2w and T1wintensities of basal ganglia T2*w hypointensities. The solid vertical lines indicate median and the dashed vertical lines the 25th- and 75th-percentiles. The vertical boxplots ofthe bottom figures indicate the ranges of normal-appearing intensities of the globus pallidus (G), the putamen (P) and caudate (C). The histograms suggest that the T2*w, T2wand T1w intensity distributions of basal ganglia T2*w hypointensities are unimodal but their shapes generally do not resemble normal distributions and potentially indicate anunderlying inhomogeneous tissue structure.
477A. Glatz et al. / NeuroImage 82 (2013) 470–480
of cynomolgus monkeys (Wadsworth et al., 1995). In that study,the authors confirmed that ferrunginations and calcifications weredirectly related to arterioles of the globus pallidus. Such a relationshipcould be confirmed in humans in further post-mortem studies wherehistological findings may be correlated with MRI (Langkammer etal., 2010), or MRI combined with MR angiography, which is able tovisualize small vessels in the basal ganglia (Okuchi et al., 2013; Seoet al., 2012).
T1w
Per
cent
age
of s
ubje
cts
with
T2*
w h
ypoi
nten
sitie
s
Anatomical location
Fig. 6. Appearance of basal ganglia T2*w hypointensities on T1w and T2w MRI. This figure shinternal capsule region that appeared hypo-, iso- and hyperintense on T1w and T2w MRI. Thinternal capsule (I). There is a notable difference in appearance on T1w and T2w MRI betwT2*w hypointensities tend to appear hypo- and isointense on T1w and T2w MRI.
Brain microbleeds (Cordonnier, 2010) also appear as focalhypointensities on T2*wMRIwith a prevalence of 9% in older, otherwisehealthy subjects (Cordonnier et al., 2007). Brainmicrobleeds havemax-imum diameter between 5 and 10 mm on T2*w volumes and are com-monly assumed to be spherical in shape. Barnes et al. (2011) establishedstatistics about their compactness and relative anisotropy. Comparingbasal ganglia T2*w hypointensities and brain microbleeds with regardto volume ranges and values of compactness and relative anisotropy
T2w
Per
cent
age
of s
ubje
cts
with
T2*
w h
ypoi
nten
sitie
s
Anatomical location
ows the percentage of subjects with T2*w hypointensities in a specific basal ganglia ore anatomical structures include the caudate (C), putamen (P), globus pallidus (G) andeen T2*w hypointensities in the globus pallidus and other structures. Globus pallidus
478 A. Glatz et al. / NeuroImage 82 (2013) 470–480
suggests that brain microbleeds and hypointensities have a similar ap-pearance and morphology on T2*w MRI although they likely arise dueto fundamentally different biological mechanisms and affect differentparts of the brain (Charidimou et al., 2012).
The rater typically used different thresholds for segmenting T2*whypointensities from the caudate and putamen, and globus pallidusand internal capsule. This difference potentially arises from themanual refinement of the initial T2*w hypointensity masks fromthresholding (Valdés Hernández et al., 2011), where the rater waslikely influence by the appearance of the T2*w hypointensities inthe different structures. T2*w hypointensities from the globus pallidusand internal capsule tended to appear uniformly dark with sharperboundaries than T2*w hypointensities from the caudate and putamen,which often appeared more shaded with fuzzier boundaries. Harderet al. (2008) also accounted for this difference in appearance sincethey proposed alternative classification schemes for the putamenand globus pallidus.
The average T1w, T2w and T2*w intensity distributions of basalganglia T2*w hypointensities do not resemble normal distributions.In particular, T2*w intensity distributions resemble negatively skeweddistributions, such as Beta or reversed Weibull distributions. Thefinding that T1w, T2w and T2*w signal intensities of MRI features,such as T2*w hypointensities, are not normally distributed is scarcelydocumented in theMRI literature. For example, current MRI segmenta-tion methods, such as SPM (Statistical Parametric Mapping; http://www.fil.ion.ucl.ac.uk/spm) or FSL FAST, typically model lesions eitheras a finite mixture of normal distributions (Seghier et al., 2008) or as auniform distribution (Zhang et al., 2001). Both approaches approximatethe signal intensity distributions of hypointense lesions and the seg-mentation results can deviate significantly frommanual segmentations.Alternative data models, such as the Gamma and Beta distributions,have been used by Ho et al. (2002), for example, to model and segmentbrain tumors on MRI and by Rexilius and Peitgen (2008) to developa method for the accurate volumetry of small lesions. However, seg-mentation methods that do not model lesion intensities explicitly butconsider them as outliers of the normal-appearing intensity distribu-tions (García-Lorenzo et al., 2011)might producemore accurate results.
The results of the analysis of T1w, T2w and T2*w signal intensitiesof focal basal ganglia T2*w hypointensities suggest that they mightbe associated with an inhomogeneous underlying tissue structure,which could be explained by increased mineral deposition. Signalintensities of normal-appearing brain tissue, such as gray and whitematter, are generally assumed to be normally distributed (Ashburnerand Friston, 2005; Zhang et al., 2001). The fact that T1w, T2w, andespecially, T2*w signal intensities of these T2*w hypointensities aregenerally not normally distributed might be due to irregular changesin tissue structure and composition, such as mineralization in theform of aggregation of trace metals and calcification, as describedby Slager and Wagner (1956). These changes can be detected withMRI and could lead to their hypointense appearance on T2*wand T1w MRI (Henkelman et al., 1991; Valdés Hernandéz et al.,2012), as found here in the globus pallidus. Globus pallidus T2*whypointensities also tend to appear iso- and hypointense on T2wand T2*wMRI. This finding could also be explained by increased min-eralization, which could entail increased aggregation of magnetic par-ticles, increased magnetic susceptibility and decreased water protondiffusion around magnetic particles. All these changes (Weisskoffet al., 1994) lead to increased reversible water proton spin dephasing(static dephasing regime) and hence to a more isointense appearanceon T2w MRI.
The subjects employed in this study were randomly selectedfrom all participants of the LBC1936, a large longitudinal study of cog-nitive aging. Because these subjects have a very narrow age rage, thisallows individual differences to be identified and analyzed withoutthe major confound of age. The experienced rater was not involvedin the selection process and was presented only with the MRI
data required to segment T2*w hypointensities with the semi-automated segmentation method described in the Semi-automatedsegmentation of focal T2⁎w hypointensities section. The masks ofthe rater were then analyzed independently with the automatedmethods described above. The study design was therefore chosen tominimize systematic bias, especially from the rating, identificationand analysis of the T2*w hypointensities. The results of this studyshould therefore closely reflect the characteristic appearance ofT2*w hypointensities across the whole cohort.
This study has several limitations. Firstly, the T2*w hypointensitieswere analyzed on gradient-echo magnitude volumes, where the seg-mentation of T2*w hypointensities was not only complicated by par-tial volume effects but also blooming artifacts. Focal hypointensitieson gradient-echo volumes caused by magnetic particles or complexesgenerally do not reflect the true particle size because the magneticfield gradients around magnetic particles also cause dephasing andhence hypointensities in voxels adjacent to the particle. For example,studies have shown that brain microbleeds typically appear approxi-mately 1.57 and 2.5 to 5 times bigger in vivo than in post-mortembrains on standard SWI volumes collected from a 3 T scanner andT2*w volumes from a 7 T scanner (De Reuck et al., 2011; Schraget al., 2010). The apparent size increase of magnetic particles dependson the geometry and magnetic properties of the particle, as well asimaging parameters, such as the echo time (Pintaske et al., 2006). Inthis study, the echo time of the T2*w sequence (Table 1) was chosenshorter than standard T2*w echo times, which are typically around40 ms at 1.5 T, to reduce the blooming artifacts at the expense of adecreased sensitivity to magnetic particles (Conijn et al., 2010). Abetter estimate of the true particle size could be derived from gradientecho phase volumes (McAuley et al., 2011), whichwere not part of theLBC1936 imaging protocol.
The second limitation is that T2*w hypointensities were just seg-mented by a single rater, as their segmentation is very time consuming.Therefore no information is available about the exact values of theinter-rater variability. However, the inter-rater variability is expectedto be similar to values reported in a previous study, which used thesame data for comparing the performance of twomanual segmentationmethods (Valdés Hernández et al., 2011).
A further limitation is that the bias field correction method N4(Tustison et al., 2010) was applied to the T1w, T2w and T2*w volumeswith the default parameters. N4 is especially suited for bias-fieldcorrection on MRI data acquired from elderly subjects, as it does notrequire a priori information, such as the number of tissue classes.However, it has been suggested (Vovk et al., 2007) that the perfor-mance of N4 can potentially be improved by optimizing the input pa-rameters of the algorithm, such as the number of histogram bins.
In conclusion, this study finds that focal T2*w hypointensities inthe basal ganglia have a characteristic spatial and signal intensity dis-tribution. Their spatial distribution indicates that they appear to beassociated with small vessels, especially those of the globus pallidus,while their signal intensities generally do not resemble normal distri-butions. These findings as well as their difference in appearance onT1w and T2w MRI further support the hypothesis of mineralizedsmall vessels and perivascular spaces. The evaluation of basal gangliaT2*w hypointensities as a potential biomarker for cerebral small ves-sel or other vascular disease requires further study in different subjectpopulations ideally with post-mortem data, and is currently limitedby a lack of an accurate automated mineral deposit segmentationmethod.
Acknowledgments
This work is part of the “Disconnected Mind: LBC1936” project(http://www.disconnectedmind.ed.ac.uk), which is funded by theAge UK, the UK Medical Research Council, the Centre for Cogni-tive Ageing and Cognitive Epidemiology (http://www.ccace.ed.ac.uk;
G0700704/84698), and SINAPSE (http://www.sinapse.ac.uk).We thankthe LBC1936 study participants; the study secretaries Paula Davies,Janie Corley, Catherine Murray, Alison Pattie, Caroline Brett and RossHenderson for data collection and data entry; the nurses, radiographersand other staff at the Wellcome Trust Clinical Research Facility and theBrain Research Imaging Centre (http://www.bric.ed.ac.uk). Additionalfunding came from the Biotechnology and Biological Sciences ResearchCouncil (BBSRC), the Engineering and Physical Sciences Research Coun-cil (EPSRC) and the Economic and Social Research Council (ESRC).Funding of AG by SINAPSE through a SINAPSE-SPIRIT PhD scholarship,of MCVH by the Row Fogo Charitable Trust, of AJK by the University ofEdinburgh College of Medicine through a Vacation Scholarship, andpart-funding of JMW by the Scottish Funding Council as part of theSINAPSE Collaboration is also gratefully acknowledged.
Conflict of interest statementAll authors certify that no conflict of interest exists regarding this
Aquino, D., Bizzi, A., Grisoli, M., Garavaglia, B., Bruzzone, M.G., Nardocci, N., Savoiardo,M., Chiapparini, L., 2009. Age-related iron deposition in the basal ganglia: quanti-tative analysis in healthy subjects. Radiology 252, 165–172.
Ashburner, J., Friston, K.J., 2005. Unified segmentation. NeuroImage 26, 839–851.Barnes, S.R.S., Haacke, E.M., Ayaz, M., Boikov, A.S., Kirsch, W., Kido, D., 2011.
Semiautomated detection of cerebral microbleeds in magnetic resonance images.Magn Reson Imaging 29, 844–852.
Bartzokis, G., Tishler, T.A., Lu, P.H., Villablanca, P., Altshuler, L.L., Carter, M., Huang, D.,Edwards, N., Mintz, J., 2007. Brain ferritin iron may influence age- and gender-related risks of neurodegeneration. Neurobiol Aging 28, 414–423.
Brass, S.D., Chen, N., Mulkern, R.V., Bakshi, R., 2006. Magnetic resonance imaging of irondeposition in neurological disorders. Top. Magn. Reson. Imaging 17, 31.
Bribiesca, E., 2008. An easy measure of compactness for 2D and 3D shapes. PatternRecognit. 41, 543–554.
Caravan, P., Farrar, C.T., Frullano, L., Uppal, R., 2009. Influence of molecular parametersand increasing magnetic field strength on relaxivity of gadolinium- andmanganese-based T1 contrast agents. Contrast Media Mol. Imaging 4, 89–100.
Casanova, M.F., Araque, J.M., 2003. Mineralization of the basal ganglia: implications forneuropsychiatry, pathology and neuroimaging. Psychiatry Res. 121, 59–87.
Charidimou, A., Jäger, H.R., Werring, D.J., 2012. Cerebral microbleed detection andmapping: principles, methodological aspects and rationale in vascular dementia.Exp. Gerontol. 47, 843–852.
Chavhan, G.B., Babyn, P.S., Thomas, B., Shroff, M.M., Haacke, E.M., 2009. Principles,techniques, and applications of T2*-based MR imaging and its special applications.Radiographics 29, 1433–1449.
Conijn, M.M.A., Geerlings, M.I., Luijten, P.R., Zwanenburg, J.J.M., Visser, F., Biessels,G.J., Hendrikse, J., 2010. Visualization of cerebral microbleeds with dual-echoT2*-weighted magnetic resonance imaging at 7.0 T. J. Magn. Reson. Imaging 32,52–59.
systematic review, subgroup analyses and standards for study design and reporting.Brain 130, 1988–2003.
De Maesschalck, R., Jouan-Rimbaud, D., Massart, D.L., 2000. The mahalanobis distance.Chemom. Intell. Lab. Syst. 50, 1–18.
De Reuck, J., Auger, F., Cordonnier, C., Deramecourt, V., Durieux, N., Pasquier, F., Bordet,R., Maurage, C.A., Leys, D., 2011. Comparison of 7.0-T T2*-magnetic resonanceimaging of cerebral bleeds in post-mortem brain sections of Alzheimer patientswith their neuropathological correlates. Cerebrovasc. Dis. 31, 511–517.
De Rochefort, L., Liu, T., Kressler, B., Liu, J., Spincemaille, P., Lebon, V., Wu, J., Wang, Y.,2010. Quantitative susceptibility map reconstruction from MR phase data usingBayesian regularization: validation and application to brain imaging. Magn. Reson.Med. 63, 194–206.
Deary, I.J., Gow, A.J., Taylor, M.D., Corley, J., Brett, C., Wilson, V., Campbell, H., Whalley,L.J., Visscher, P.M., Porteous, D.J., Starr, J.M., 2007. The Lothian Birth Cohort 1936: astudy to examine influences on cognitive ageing from age 11 to age 70 and beyond.BMC Geriatr. 7, 28.
Deary, I.J., Gow, A.J., Pattie, A., Starr, J.M., 2012. Cohort profile: the Lothian Birth Cohortsof 1921 and 1936. Int. J. Epidemiol. 41, 1576–1584.
Donzelli, R., Marinkovic, S., Brigante, L., de Divitiis, O., Nikodijevic, I., Schonauer, C.,Maiuri, F., 1998. Territories of the perforating (lenticulostriate) branches of themiddle cerebral artery. Surg. Radiol. Anat. 20, 393–398.
Drayer, B., Burger, P., Darwin, R., Riederer, S., Herfkens, R., Johnson, G., 1986. MRI ofbrain iron. AJR Am. J. Roentgenol. 147, 103–110.
Feekes, J.A., Hsu, S.W., Chaloupka, J.C., Cassell, M.D., 2005. Tertiary microvascular terri-tories define lacunar infarcts in the basal ganglia. Ann. Neurol. 58, 18–30.
García-Lorenzo, D., Prima, S., Arnold, D.L., Collins, D.L., Barillot, C., 2011. Trimmed-likelihood estimation for focal lesions and tissue segmentation in multisequenceMRI for multiple sclerosis. IEEE Trans. Med. Imaging 30, 1455–1467.
Haacke, E.M., Cheng, N.Y.C., House, M.J., Liu, Q., Neelavalli, J., Ogg, R.J., Khan, A., Ayaz,M., Kirsch, W., Obenaus, A., 2005. Imaging iron stores in the brain using magneticresonance imaging. J. Magn. Reson. Imaging 23, 1–25.
Haacke, E.M., Mittal, S., Wu, Z., Neelavalli, J., Cheng, Y.C.N., 2009. Susceptibility-weightedimaging: technical aspects and clinical applications, part 1. AJNR Am. J. Neuroradiol.30, 19–30.
Hallgren, B., Sourander, P., 1958. The effect of age on the non-haemin iron in thehuman brain. J. Neurochem. 3, 41–51.
Harder, S.L., Hopp, K.M., Ward, H., Neglio, H., Gitlin, J., Kido, D., 2008. Mineralizationof the deep gray matter with age: a retrospective review with susceptibility-weighted MR imaging. AJNR Am J Neuroradiol 29, 176–183.
Hellier, P., 2003. Consistent intensity correction of MR images. Proc. IEEE ICIP 1, 1109–1112.Henkelman, R., Watts, J., Kucharczyk, W., 1991. High signal intensity in MR images of
calcified brain tissue. Radiology 179, 199–206.Ho, S., Bullitt, E., Gerig, G., 2002. Level-set evolution with region competition: automatic
3-D segmentation of brain tumors. Proc. IEEE ICPR 1, 532–535.Jager, F., Hornegger, J., 2009. Nonrigid registration of joint histograms for intensity stan-
dardization in magnetic resonance imaging. IEEE Trans. Med. Imaging 28, 137–150.Jenkinson, M., Bannister, P., Brady, M., Smith, S., 2002. Improved optimization for the
robust and accurate linear registration and motion correction of brain images.NeuroImage 17, 825–841.
Keihaninejad, S., Heckemann, R.A., Fagiolo, G., Symms, M.R., Hajnal, J.V., Hammers, A.,Alzheimer's Disease Neuroimaging Initiative, 2010. A robust method to estimatethe intracranial volume across MRI field strengths (1.5 T and 3 T). NeuroImage50, 1427–1437.
Kruer, M.C., Boddaert, N., Schneider, S.A., Houlden, H., Bhatia, K.P., Gregory, A.,Anderson, J.C., Rooney, W.D., Hogarth, P., Hayflick, S.J., 2012. Neuroimaging fea-tures of neurodegeneration with brain iron accumulation. AJNR Am J Neuroradiol33, 407–414.
Langkammer, C., Krebs, N., Goessler, W., Scheurer, E., Ebner, F., Yen, K., Fazekas, F.,Ropele, S., 2010. Quantitative MR imaging of brain iron: a postmortem validationstudy. Radiology 257, 455–462.
Marinkovic, S.V., Milisavljevic, M.M., Kovacevic, M.S., Stevic, Z.D., 1985. Perforatingbranches of the middle cerebral artery. Microanatomy and clinical significance oftheir intracerebral segments. Stroke 16, 1022–1029.
McAuley, G., Schrag, M., Barnes, S., Obenaus, A., Dickson, A., Holshouser, B., Kirsch, W.,2011. Iron quantification of microbleeds in postmortem brain. Magn. Reson. Med.65, 1592–1601.
Mills, E., Dong, X., Wang, F., Xu, H., 2010. Mechanisms of brain iron transport: insightinto neurodegeneration and CNS disorders. Future Med. Chem. 2, 51–64.
Morris, C., Candy, J., Oakley, A., Bloxham, C., Edwardson, J., 1992. Histochemical distri-bution of non-haem iron in the human brain. Acta Anat. (Basel) 144, 235–257.
Okuchi, S., Okada, T., Ihara, M., Gotoh, K., Kido, A., Fujimoto, K., Yamamoto, A., Kanagaki,M., Tanaka, S., Takahashi, R., Togashi, K., 2013. Visualization of lenticulostriatearteries by flow-sensitive black-blood MR angiography on a 1.5 T MRI system:a comparative study between subjects with and without stroke. AJNR Am JNeuroradiol 34, 780–784.
Patenaude, B., Smith, S.M., Kennedy, D.N., Jenkinson, M., 2011. A Bayesian model ofshape and appearance for subcortical brain. NeuroImage 56, 907–922.
Penke, L., Valdés Hernandéz, M.C., Maniega, S.M., Gow, A.J., Murray, C., Starr, J.M.,Bastin, M.E., Deary, I.J., Wardlaw, J.M., 2012. Brain iron deposits are associatedwith general cognitive ability and cognitive aging. Neurobiol. Aging 33, 510–517.
Pintaske, J., Müller-Bierl, B., Schick, F., 2006. Geometry and extension of signal voids inMR images induced by aggregations of magnetically labelled cells. Phys. Med. Biol.51, 4707–4718.
Reichenbach, J., Venkatesan, R., Schillinger, D., Kido, D., Haacke, E., 1997. Small vesselsin the human brain: MR venography with deoxyhemoglobin as an intrinsic con-trast agent. Radiology 204, 272.
Rexilius, J., Peitgen, H.O., 2008. Evaluation of accuracy in partial volume analysis ofsmall objects. Proc. SPIE Med. Imaging: Image Processing 6914, 169.
Ropele, S., de Graaf, W., Khalil, M., Wattjes, M.P., Langkammer, C., Rocca, M.A., Rovira,A., Palace, J., Barkhof, F., Filippi, M., et al., 2011. MRI assessment of iron depositionin multiple sclerosis. J. Magn. Reson. Imaging 34, 13–21.
Schenck, J.F., Zimmerman, E.A., 2004. High-field magnetic resonance imaging of brainiron: birth of a biomarker? NMR Biomed. 17, 433–445.
Schrag, M., McAuley, G., Pomakian, J., Jiffry, A., Tung, S., Mueller, C., Vinters, H.V.,Haacke, E.M., Holshouser, B., Kido, D., et al., 2010. Correlation of hypointensitiesin susceptibility-weighted images to tissue histology in dementia patients withcerebral amyloid angiopathy: a postmortem MRI study. Acta Neuropathol. 119,291–302.
Schweser, F., Deistung, A., Lehr, B.W., Reichenbach, J.R., 2010. Quantitative imagingof intrinsic magnetic tissue properties using MRI signal phase: an approach to invivo brain iron metabolism? NeuroImage 54, 2789–2807.
Seghier, M.L., Ramlackhansingh, A., Crinion, J., Leff, A.P., Price, C.J., 2008. Lesion identi-fication using unified segmentation–normalisation models and fuzzy clustering.NeuroImage 41, 1253–1266.
Seo, S.W., Kang, C.-K., Kim, S.H., Yoon, D.S., Liao, W., Wörz, S., Rohr, K., Kim, Y.-B., Na,D.L., Cho, Z.-H., 2012. Measurements of lenticulostriate arteries using 7 T MRI:new imaging markers for subcortical vascular dementia. J. Neurol. Sci. 322, 200–205.
480 A. Glatz et al. / NeuroImage 82 (2013) 470–480
Shattuck, D.W., Prasad, G., Mirza, M., Narr, K.L., Toga, A.W., 2009. Online resource forvalidation of brain segmentation methods. NeuroImage 45, 431–439.
Shimazaki, H., Shinomoto, S., 2007. A method for selecting the bin size of a time histo-gram. Neural Comput. 19, 1503–1527.
Slager, C.T., Wagner, J.A., 1956. The incidence, composition, and pathological signifi-cance of intracerebral vascular deposits in the basal ganglia. J. Neuropathol. Exp.Neurol. 15, 417–431.
Stone, M., 1961. The opinion pool. Ann. Math. Stat. 32, 1339–1342.Tustison, N.J., Avants, B.B., Cook, P.A., Zheng, Y., Egan, A., Yushkevich, P.A., Gee,
Valdés Hernández, M.C., Jeong, T.H., Murray, C., Bastin, M.E., Chappell, F.M., Deary, I.J.,Wardlaw, J.M., 2011. Reliability of two techniques for assessing cerebral irondeposits from structural MRI. J. Magn. Reson. Imaging 33, 54–61.
Valdés Hernández, M.C., Maconick, L.C., Tan, E.M.J., Wardlaw, J.M., 2012. Identificationof mineral deposits in the brain on radiological images: a systematic review. Eur.Radiol. 22, 2371–2381.
Van Es, A.C.G.M., van der Grond, J., de Craen, A.J.M., Admiraal-Behloul, F., Blauw, G.J.,van Buchem, M.A., 2008. Caudate nucleus hypointensity in the elderly is associatedwith markers of neurodegeneration on MRI. Neurobiol Aging 29, 1839–1846.
Verboven, S., Hubert, M., 2005. LIBRA: a Matlab library for robust analysis. Chemom.Intell. Lab. Syst. 75, 127–136.
Vovk, U., Pernus, F., Likar, B., 2007. A review of methods for correction of intensityinhomogeneity in MRI. IEEE Trans. Med. Imaging 26, 405–421.
Vymazal, J., Urgosik, D., Bulte, J., et al., 2000. Differentiation between hemosiderin- andferritin-bound brain iron using nuclear magnetic resonance and magnetic reso-nance imaging. Cell. Mol. Biol. (Noisy-le-grand) 46, 835–842.
Wadell, H., 1932. Volume, shape, and roundness of rock particles. J. Geol. 40, 443–451.Wadsworth, P.F., Jones, H.B., Cavanagh, J.B., 1995. The topography, structure and inci-
dence of mineralized bodies in the basal ganglia of the brain of cynomolgusmonkeys (Macaca fascicularis). Lab. Anim. 29, 276–281.
Wardlaw, J.M., Bastin, M.E., Valdés Hernández, M.C., Maniega, S.M., Royle, N.A., Morris,Z., Clayden, J.D., Sandeman, E.M., Eadie, E., Murray, C., Starr, J.M., Deary, I.J., 2011.Brain aging, cognition in youth and old age and vascular disease in the LothianBirth Cohort 1936: rationale, design and methodology of the imaging protocol.Int. J. Stroke 6, 547–559.
Weisskoff, R.M., Zuo, C.S., Boxerman, J.L., Rosen, B.R., 1994. Microscopic susceptibilityvariation and transverse relaxation: theory and experiment. Magn. Reson. Med.31, 601–610.
Yung, K.-T., 2003. Empirical models of transverse relaxation for spherical magneticperturbers. Magn Reson Imaging 21, 451–463.
Zhang, Y., Brady, M., Smith, S., 2001. Segmentation of brain MR images through ahidden Markov random field model and the expectation–maximization algorithm.IEEE Trans. Med. Imaging 20, 45–57.