Characterization of Proteorhodopsin 2D crystals by Electron Microscopy and Solid State Nuclear Magnetic Resonance Dissertation zur Erlangung des Doktorgrades der Naturwissenschaften vorgelegt dem Fachbereich Biochemie, Chemie, Pharmazie Institut für Biophysikalische Chemie Johann Wolfgang Goethe Universität Frankfurt am Main Zentrum für Biomolekulare Magnetische Resonanz Spektroskopie von Sarika Shastri aus Dewas, Indien Frankfurt am Main 2008
Transcript
Characterization of Proteorhodopsin 2D crystals by Electron Microscopy and Solid State Nuclear
Magnetic Resonance
Dissertation zur Erlangung des Doktorgrades der Naturwissenschaften
vorgelegt dem Fachbereich Biochemie, Chemie, Pharmazie Institut für Biophysikalische Chemie
Johann Wolfgang Goethe Universität Frankfurt am Main Zentrum für Biomolekulare Magnetische Resonanz Spektroskopie
glycerol)] (POPG); Archeal lipid, E. coli Polar Lipid Extract were obtained from Avanti Polar
Lipids (Alabaster, USA). Detergents like n-Dodecyl- ß-D maltoside (DDM) was purchased from
Applichem GmbH (Darmstadt, Germany) and n-ßoctyl-D-glucopyranoside (OG) was obtained
from Glycon Biochemicals (Luckenwalde, Germany). SM-2 Biobeads were obtained from
BioRAD (München, Germany).
2.1.2 Equipment For estimation of protein concentration, an ultraviolet (UV) and visible Jasco V-550
spectrophotometer (Jasco, Gross-Umstadt, Germany) was used. For preparative
ultracentrifugation an Optima™ LE-80K ultracentrifuge from Beckman Coulter (Fullerton,
USA) was used with Ti70 rotor. Bruker style 4 mm zirconium rotor, KEL-F caps and bottom
inserts were obtained from RototecSpintec (Biebesheim, Germany). Experiments were measured
using 4 mm MAS DVT probeheads. 4 mm Bruker style zirconium rotors were sealed by HR
MAS inserts. For long-term measurements silicon rubber discs were placed between the top
insert and the cap to avoid dehydration. The probeheads were obtained from Bruker Biospin
(Rheinstetten, Germany). 400 MHz, 600 MHz and 850 MHz spectrometers, used for NMR
measurements were purchased from Bruker (Karlsruhe, Germany). Philips CM120 electron
microscope with an accelerating voltage of 120 kV was used for screening. Freeze-fracture
replicas were produced in the freeze-fracture unit BAF400T (Bal-TEC Inc., Principality of
Liechtenstein) and were analysed in an EM208S electron microscope (FEI Company). The CD
Chapter 2-Materials and Methods ----------------------------------------------------------------------------------------------------
46 | 174
spectra were acquired on Jasco 720 CD Spectrometer and FTIR data was collected on IFS66
spectrometer.
Individual experimental settings specific to each experiment shall be indicated in the figure
legends and specific pulse sequence used for acquiring data shall be described.
2.1.3 Software Acquisition and analysis software used for NMR includes Topspin 1.3 Topspin 2.0 and XWIN-
NMR Version 3.5 all from Bruker Biospin (Rheinstetten, Germany), Sparky 3 from Goddard and
Kneller at the University of California (San Francisco, USA). Typical chemical shifts of amino
acids were obtained from the Biological Magnetic Resonance Bank (BMRB) webpage. Topology
models were generated using TMPres2D [56]. The electron micrographs were processed with
MRC program package [93].
2.2 Methods
2.2.1 Expression and purification
2.2.1.1 Host organism For over expression of PR, the E.coli expression system was used. The host organism used was
E. coli C41 (DE3) strain with PR expression gene encoded in the pET27 (b+) vector. The protein
had Kannamycin as resistance marker and HSV and 6x His tags on the C terminal end. The
plasmid was a generous gift from M.Engelhard from Dortmund, Germany.
2.2.1.2 Culture maintenance
The cryo stock of a log phase culture was prepared by shock freezing in liquid nitrogen in final
concentration of 40% glycerol. These culture aliquots were stored at -80°C. A loopful of these
aliquots was used for inoculation in the fresh medium. Repeated freeze thawing was however
avoided.
2.2.1.3 Expression
Chapter 2-Materials and Methods ----------------------------------------------------------------------------------------------------
47 | 174
Depending on the intended use, the expression of wild type PR was done in different media. E.g.
LB medium for crystallization screens, defined medium for specific labeling or minimal medium
for uniform labeling.
Typically, preculture was inoculated in Luria Bertani (LB) medium overnight at 37°C at 200
rpm. Next day about 10-15 ml of actively growing cells were added to 1 litre of autoclaved
medium (LB/ defined medium/minimal medium) with 50 μg/ml kanamycin. The cells were
collected when an OD578 of 0.8 was reached. After spinning down, cells were resuspended in
fresh medium. In case of labeled preparations, fresh medium containing labeled amino acids was
introduced at this stage. After 15 min of incubation, 1 mM IPTG and 0.7 mM of all-trans retinal
dissolved in ethanol were added. Over expression was achieved by a further incubation at 37°C
for 3–4 h and was visually observed by a pink color change of the cells. The cells were harvested
by centrifugation at 6,000 rpm at 4°C for 10 mins.
While making specifically labeled sample e.g. Tryptophan labeling for REDOR measurements,
defined media with labeled amino acid was used. The composition of defined medium is given
below.
Table:1 Composition of Defined medium for selective labeling
Components Amount for 1 LiterAlanine 0.50 g Arginine 0.40 g Aspartic Acid 0.40 g Cystine 0.05 g Glutamine 0.40 g Glumatic Acid 0.65 g Glycine 0.55 g Histidine 0.10 g Isoleucine 0.23 g Leucine 0.23 g Lysine hydrochloride 0.42 g Methionine 0.25 g Phenylalanine 0.13 g Proline 0.10 g Serine 2.10 g Threonine 0.23 g Tyrosine 0.17 g Valine 0.23 g
Chapter 2-Materials and Methods ----------------------------------------------------------------------------------------------------
48 | 174
Others Adenine 0.50 g Guanosine 0.65 g Thymine 0.20 g Uracil 0.50 g Cytosine 0.20 g Sodium acetate 1.50 g Succinic acid 1.50 g NH4Cl 0.50 g NaOH 0.85 g K2HPO4 10.50 g
After autoclaving add:
Compoments Volume for 1 liter 40% Glucose 50 ml 1M MgSO4 4 ml 0.01M FeCl3 1 ml Trace elements 10 ml Antibiotic ( 100 µg/ml) 1 ml
Composition of trace elements
Compoment Amount for 10 ml of trace elements CaCl2*2 H2O 2 mg ZnSO4*7 H2O 2 mg MnSO4*H2O 2 mg L-Tryptophan 50 mg Thiamine (B1) 50 mg Niacin 50 mg Biotin 1 mg
Add the required amount after filter sterilization to the medium
The final pH of the solution is around 7.2
2.2.1.4 Membrane preparation and solubilization
Cells were harvested and disrupted with a cell disrupter (Constant cell system, UK) at 1-2 kbar.
To remove the contamination from earlier usage the cell disrupter was washed thoroughly with
about 300 ml of water then with 300 ml of 0.1 M NaOH and then again equal amount of water /
buffer. The homogeneous cell pellet in MES buffer pH 6, was then subjected to the disrupter.
The membrane fraction was collected by centrifugation at 45,000 g at 4°C for 30 mins.
Chapter 2-Materials and Methods ----------------------------------------------------------------------------------------------------
49 | 174
Membranes were solubilized in solubilization buffer (1.5% -D-Dodecyl maltoside (DDM), 300
mM NaCl, 50 mM MES, 5 mM Imidazole, pH 6.0 for 48 hours minutes at 4°C. The insoluble
fraction was removed by ultracentrifugation at 45,000 g for 15 mins at 4°C.
2.2.1.5 Protein purification The NiNTA was equilibrated with equilibration buffer (300 mM NaCl, 50 mM MES, pH 6.0)
with at least 10 volumes of the column in a disposable syringe. After equilibration, the
disposable syringe was inverted over a glass beaker and with the help of airflow and the NiNTA
was transferred to the beaker. The supernatant (slightly red in color) after ultra centrifugation
was incubated with this NiNTA for at least 2 hours at 4°C. After incubation (most likely the
NiNTA beads turn red), the NiNTA column was again packed, followed by slow washing step
with about 100 ml of washing buffer (Trition X -100= 200 µl / 200 ml), 300 mM NaCl, 50 mM
MES, 50 mM Imidazole, pH 6.0). The detergent concentration in wash buffer was lower than
CMC. The protein was finally eluted in a elution buffer (Triton X -100 = 200 mg/ 100ml), 300
mM NaCl, 50 mM MES, 200 mM Imidazole, pH 7.5).
2.2.1.6 Protein estimation The quantitative estimation of protein was carried out using UV-Vis Spectroscopy. UV-Vis
absorption spectra in the range of 250 nm up to 600 nm wavelength were acquired. The total
protein content was determined from the two different peaks. The retinylidine peak was observed
at 520 nm, which was further used for calculation of protein concentration whereas total protein
content was estimated from the peak at 280 nm. The relative purity of protein preparation was
estimated by the ratio of Abs 280 nm/ Abs 520 nm. For a decently pure protein preparation it was
between 1.6 -2.2. The absorption value at 520 nm was used to calculate the amount of PR in
mg/ml quantities. Usually 1:10 dilution of protein was used and referenced against the elution
buffer.
(Abs 520nm * dilution factor) / (1.6* 0.3) = concentration of protein mg/ml
Extinction coefficient of PR =1.6
Thickness of quartz cuvette=0.3 mm
Chapter 2-Materials and Methods ----------------------------------------------------------------------------------------------------
50 | 174
The typical yield of protein was 2-3 mg/lit from LB medium, 15-18 mg/lit for defined medium
and 10 g/lit for minimal medium.
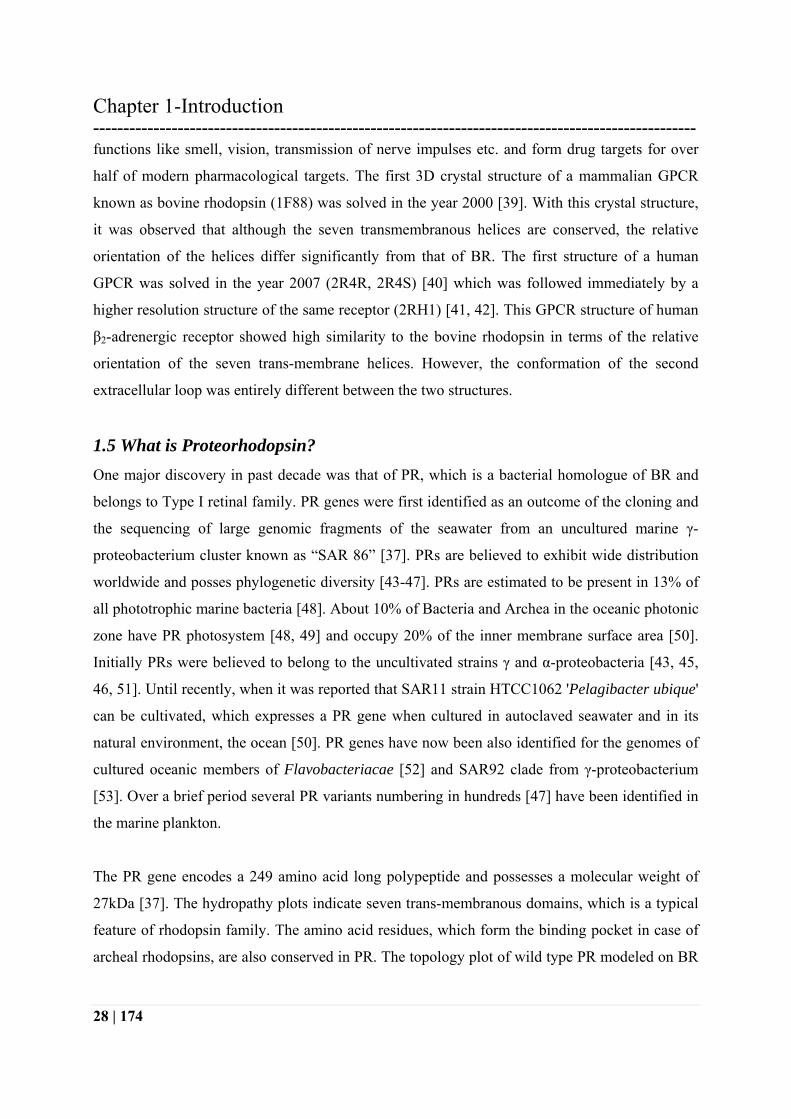
Figure 13 : UV-Vis spectra in the range of 250-600 nm for the Triton X-100 solubilized wild type GPR with typical
retinylidine peak of ~100 nm at 520 nm and total protein content at 280 nm.
2.2.1.7 Protein purity The purified protein was evaluated for the purity of preparation by using SDS PAGE, where a
single band of monomer at 27 kDa was clearly observed after coomarsie staining. For further
verification, the protein was run on Superdex 200 column. However, it was performed only for
initial standardization. The purity of protein as judged by SDS PAGE was over 95%, was
adequate for setting up the 2D crystallization trials, and hence gel filtration was not a routine for
every preparation.
NOTE: The homogeneity of the reconstituted sample was further checked on 60-80% sucrose
gradient. For an ideal preparation a single sharp band was obtained.
Wavelength ( nm )
Abso
rban
ce
Chapter 2-Materials and Methods ----------------------------------------------------------------------------------------------------
51 | 174
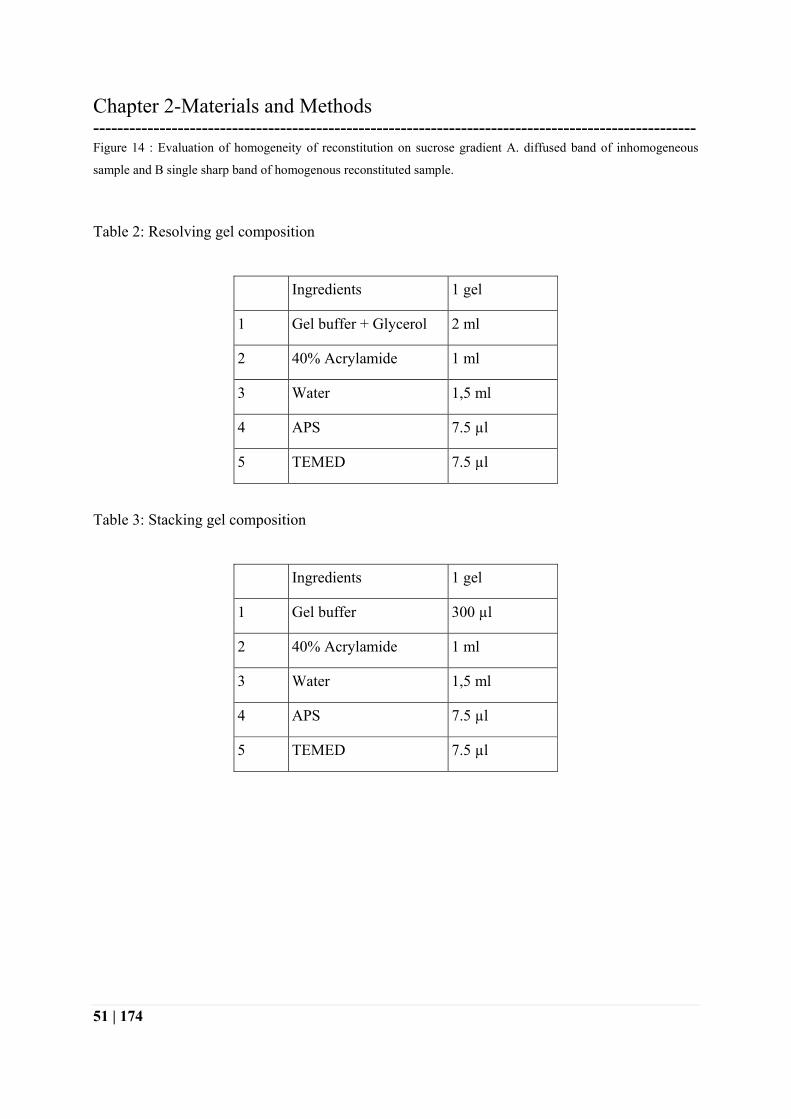
Figure 14 : Evaluation of homogeneity of reconstitution on sucrose gradient A. diffused band of inhomogeneous
sample and B single sharp band of homogenous reconstituted sample.
Table 2: Resolving gel composition
Ingredients 1 gel
1 Gel buffer + Glycerol 2 ml
2 40% Acrylamide 1 ml
3 Water 1,5 ml
4 APS 7.5 µl
5 TEMED 7.5 µl
Table 3: Stacking gel composition
Ingredients 1 gel
1 Gel buffer 300 µl
2 40% Acrylamide 1 ml
3 Water 1,5 ml
4 APS 7.5 µl
5 TEMED 7.5 µl
Chapter 2-Materials and Methods ----------------------------------------------------------------------------------------------------
52 | 174
Figure 15 : A: SDS PAGE of purified PR after single step NiNTA purification showing a single monomeric band. B
Major fractions from analytical Gel filtration of detergent solubilized PR. Gel filtration was carried out using
Superadex 200.
2.2.1.8 DNA sequence AATAATTTTGTTTAACTTTAAGAAGGAGATATACATATGAAATTATTACTGATATTAGGTAGTGTTATT
removal by dialysis with the aid of dialysis tubes against excess of dialysis buffer (50 mM
Tricine, 100 mM NaCl, 10 mM MgCl2, 3 mM NaN3, 5 mM DTT, pH 8.5, 7.5% MPD). The
dialysis buffer was changed every day and the crystalline samples were obtained after 7 days.
These samples were then used either for electron microscopy or for NMR measurements.
Chapter 2-Materials and Methods ----------------------------------------------------------------------------------------------------
54 | 174
2.2.1.12 Preparation of samples for EM For EM screening the expression was done using readymade Luria Bertani medium (Carl roth
GmbH art no:X968.3) and purification was carried out as described earlier. After reconstitution,
about 5 µl of samples were put out on the carbon coated copper grids (400 mesh) and allowed to
incubate at room temperature for 2 min. The grids were placed upside down on 2% uranylacetate
(pH 4.5) and held for 30 sec to remove excess of sample. The grid was finally air-dried.
Additionally freeze-fracture replicas produced in the freeze-fracture unit BAF400T (Bal-TEC
Inc., Principality of Liechtenstein) were analysed in an EM208S electron microscope (FEI
Company).
2.2.1.13 Electron microscopy and image processing Grids were examined in a Philips CM120 electron microscope with an accelerating voltage of
120 kV at a magnification of 45,000× or 60,000×. Images were collected on a 2K × 2K slow-
scan CCD camera (Gatan Inc.).
The crystal images were processed using the MRC program package [94]. A Fourier transform
of crystalline area was calculated. The diffraction spots were indexed and the unit cell
parameters were calculated. A filtered image of the 2D crystal was created by extracting the
phase and the amplitude information from the diffraction spots. Then the image was subjected to
lattice unbending by cross correlation of the image with a small central part of the filtered image
as a reference and subsequent interpolation of the image to the ideal lattice from the reference.
The amplitude and phases from the Fourier transform of the unbent image could be used to
calculate the projection map.
2.2.1.14 Preparation of samples for NMR measurements The reconstituted samples after the dialysis duration were pelleted down in an eppendorf at
25,000 rpm at 4ºC for 30 mins in an ultracentrifuge. The pellet was subjected to 8-10 subsequent
washes with fresh dialysis buffer without the salts, DTT and MPD. Finally it was packed in 4
mm rotor with a top and bottom insert. The samples were stored at 4ºC until measured.
2.2.1.15 Specifically labeled samples
Chapter 2-Materials and Methods ----------------------------------------------------------------------------------------------------
55 | 174
For specific labeling of the amino acid, defined medium was used for expression. The amino
acid, which needed to be labeled, was replaced with the appropriate label. The expression and
purification was done in the same manner as described earlier. The 15N ζ lysine, 15N Tryptophan, 13C Cysteine, 13C Histidine samples were prepared in this way.
2.2.1.16 REDOR samples For REDOR measurements, doubly labeled samples were prepared using the defined media,
where 15N Tryptophan label was used for (i) position along with and 13C label for the appropriate
(i-1) residue.
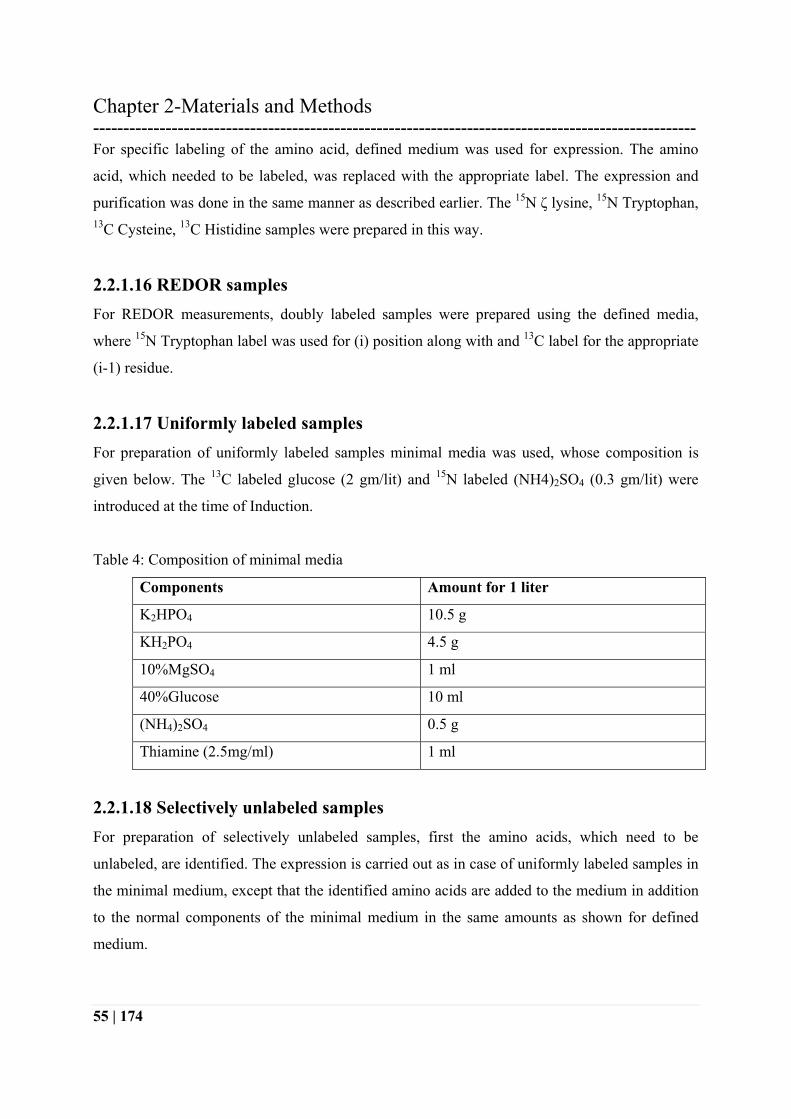
2.2.1.17 Uniformly labeled samples For preparation of uniformly labeled samples minimal media was used, whose composition is
given below. The 13C labeled glucose (2 gm/lit) and 15N labeled (NH4)2SO4 (0.3 gm/lit) were
introduced at the time of Induction.
Table 4: Composition of minimal media
Components Amount for 1 liter
K2HPO4 10.5 g
KH2PO4 4.5 g
10%MgSO4 1 ml
40%Glucose 10 ml
(NH4)2SO4 0.5 g
Thiamine (2.5mg/ml) 1 ml
2.2.1.18 Selectively unlabeled samples For preparation of selectively unlabeled samples, first the amino acids, which need to be
unlabeled, are identified. The expression is carried out as in case of uniformly labeled samples in
the minimal medium, except that the identified amino acids are added to the medium in addition
to the normal components of the minimal medium in the same amounts as shown for defined
medium.
Chapter 2-Materials and Methods ----------------------------------------------------------------------------------------------------
56 | 174
Table 5: List of labled/unlabeled amino acids for NMR samples
Amino Acids labeled Amino Acids unlabeled
Arginine Alanine
Aspartic acid Glycine
Asparagine Isoleucine
Cysteine Leucine
Glutamine Phenylalanine
Glutamic acid Serine
Histidine Threonine
Lysine Valine
Proline Tyrosine
Tryptophan
Chapter 3-Reconstitution and 2D Electron Microscopy ---------------------------------------------------------------------------------------
57 | 174
Chapter 3 : Reconstitution and 2D Electron Microscopy
3.1 Motivation Our 2D crystallization screen was initially motivated by the similarities between BR and PR, and
the fact that BR is arranged in 2D arrays within the Halobacterium salinarium membrane [93].
However, nothing is known about the arrangement of PR protobacterial membranes. The first
goal was therefore to find suitable 2D crystallization conditions. The projection map of well
diffracting 2D crystals would help in understanding the structural details of the protein in the
membrane and at the same time could also be used for detailed mechanistic studies by SSNMR
as natural 2D crystals of BR (purple membrane) did yield very well resolved spectra [95]. Major
benefits of 2D crystals for SSNMR study are high sample concentration and homogeneity.
Furthermore, it is assumed that crystal packing would reduce internal molecular motions, which
might interfere with coherent averaging by magic angle sample spinning. In view of advantages
conferred by 2D crystals, the trials were attempted.
3.2 Background The simplest definition of 2D crystals is arrangement of single layers of ordered membrane
protein molecules in two planes. Broadly the membrane protein 2D crystals are classified into
Type I crystals and Type II comprise of soluble proteins. The need of 2D crystals for membrane
proteins arise because of the following reasons:
• The orderly arrangement of the protein has a preferred identical orientation.
• The Fourier transformation of 2D crystal is discrete and the structural information is
contained in the form of defined reflection or “spots” because the Fourier transform of
the 2D crystal is the FT of the molecules sampled at positions of reciprocal lattice points.
This explains the reason for the discreteness.
• The amplitude and phase of each reflection is calculated from the FT of the images.
• If appropriate crystalline condition is screened then various intermediates can also be
crystallized with similar conditions.
However, like any other technique there are some limitations associated with the 2D
crystallization trials.
Chapter 3-Reconstitution and 2D Electron Microscopy ---------------------------------------------------------------------------------------
58 | 174
• Obtaining a 2D crystal is a matter of luck and can take very long time with or without
success.
• Significant amount of time can be invested in improving the quality of 2D crystal.
• The crystalline arrangement of the protein is achieved in vesicles, membranes or tubes. In
all these cases, each image provides only single view of the molecule. Nevertheless, in
order to reconstruct the overall view of the protein arrangement in the crystalline packing
the tilted data from random orientations needs to be collected. This gives the biggest
challenge.
• From biochemical point of view, although the protein is reconstituted into the membrane
but may not be active. This is because the crystalline packing offers limited flexibility,
which might be required for the functionality of the protein.
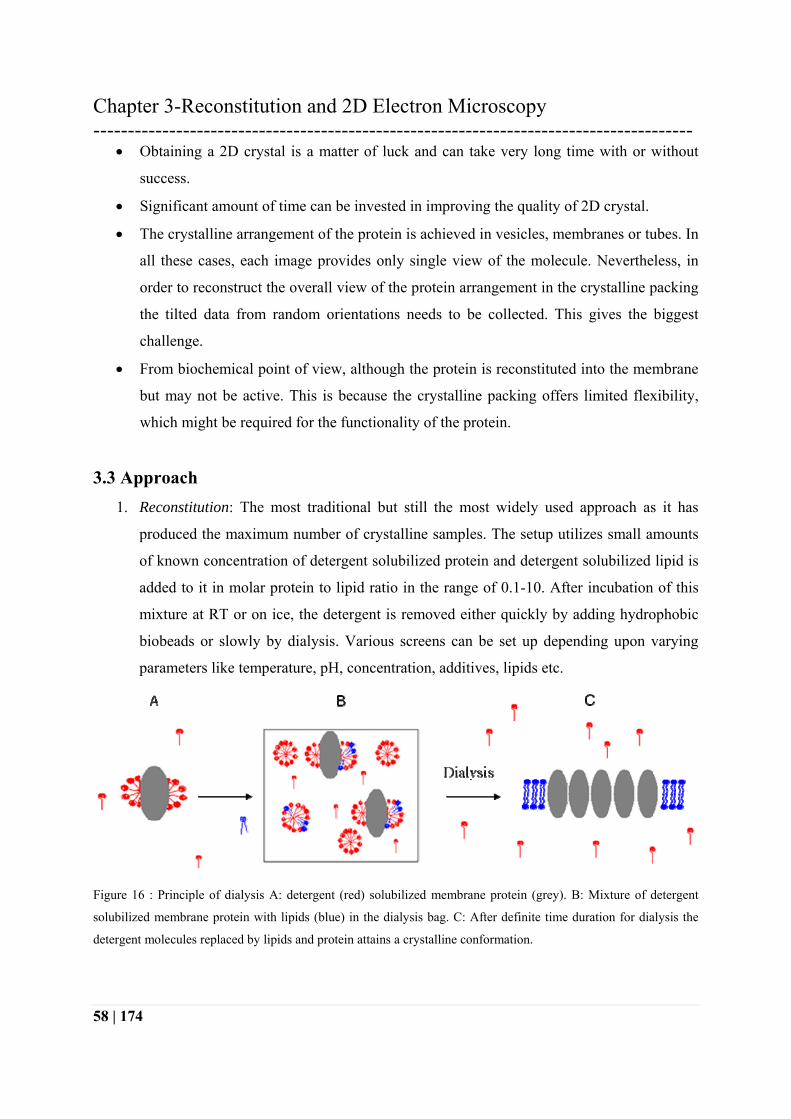
3.3 Approach 1. Reconstitution: The most traditional but still the most widely used approach as it has
produced the maximum number of crystalline samples. The setup utilizes small amounts
of known concentration of detergent solubilized protein and detergent solubilized lipid is
added to it in molar protein to lipid ratio in the range of 0.1-10. After incubation of this
mixture at RT or on ice, the detergent is removed either quickly by adding hydrophobic
biobeads or slowly by dialysis. Various screens can be set up depending upon varying
parameters like temperature, pH, concentration, additives, lipids etc.
Figure 16 : Principle of dialysis A: detergent (red) solubilized membrane protein (grey). B: Mixture of detergent
solubilized membrane protein with lipids (blue) in the dialysis bag. C: After definite time duration for dialysis the
detergent molecules replaced by lipids and protein attains a crystalline conformation.
Chapter 3-Reconstitution and 2D Electron Microscopy ---------------------------------------------------------------------------------------
59 | 174
2. In situ Approach: This approach is used for those proteins, which constitute the dominant
fraction of the entire membrane protein fraction. The underlined principle is to raise the
concentration of desired protein above the critical threshold required for the lattice
formation by extracting excess of bulk lipids from the membranes. The choice of
detergent for lipid extraction should be such that it does not dissolve the membrane
protein. Typically, a membrane suspension of known concentration is prepared and
extraction of lipid is done by incubation with detergents for hours at different
temperatures. The detergent is removed mostly by dialysis. This method is least
disruptive as protein always resides in its membrane. However, this preparation is prone
to contamination with non crystalline membrane material and hence the unit cell may
vary from batch to batch.
3. Surface Crystallization: Especially suited for membrane proteins, which have a natural
tendency to form arrays at interface between the 2 phases. The phases referred to are air–
water or carbon water interface. This type of approach can also be extended to the
substrate induced 2D crystallization. It requires less time and may yield large crystalline
arrays with very little protein requirement. If carbon-water interface is chosen then it can
directly be done on carbon-coated grid and can be observed directly. However, there may
exist a possibility of inhomogeneity in larger patches. Additives used for inducing the
crystallization may contribute to the background noise.
3.4 Theory and image processing The electron microscopy technique is well suited for studying the 2D crystals. The major credit
for development and refinement this technique for the study of membrane proteins goes to
Henderson et al [4, 96]. Recent developments of electron crystallography using a combination of
electron diffraction and electron imaging has made structure determination of biomolecules
reach atomic resolution.
Electron microscopy is based on strong scattering power of electrons. The atomic scattering
intensities are 100,000 times larger than the X-Rays and because of these strong interactions, it is
possible to obtain a high quality diffraction pattern from very small samples which permit the
Chapter 3-Reconstitution and 2D Electron Microscopy ---------------------------------------------------------------------------------------
60 | 174
usage of very thin samples such as biomembranes, which have a thickness of one or two
molecules. The electrons are scattered by the shielded coulomb potential and as a result, the
density maps in electron microscopy represent the coulomb potential. The electrons can be
focused to produce a high-resolution image.
Fourier transformation of the electron microscopic image shows a diffraction pattern from which
the reciprocal vectors are determined. A filtered image is created by using the information from
the diffraction spots, which originate from the periodic structure from which the intensities and
phases on the reciprocal lattice points are used for back transform. The signal to noise ratio of the
primary data from two-dimensional crystals is initially low because of lattice imperfections and
beam damage. For the purpose of increasing the signal to noise ratio, the data is usually filtered
in digital format (filtering) and lattice imperfections are computationally corrected (unbending).
This results in an image, which shows the average over multiple unit cells. The optical
diffraction pattern thus obtained from the crystalline arrays contains information about the
symmetry and the quality of the specimen.
After image processing for the crystal improvement, a projection map is calculated. For the
acquisition of high-resolution data on biomolecules the samples are usually studied in the frozen-
hydrated state (electron cryo-microscopy), which resembles the natural hydration state of the
proteins. The cryo conditions also prevent the radiation damage to the sample.
3.5 Results and Discussion
3.5.1 Biochemical analysis and crystallization screens There are many parameters, which need to be optimized to obtain a perfectly well ordered and
highly diffracting 2D crystal. However, considering the feasibility of the screening, these
parameters need to be prioritized. Multiple parameters were tested simultaneously and most
important parameters are discussed under different headings.
3.5.1.1 Effect of detergent By definition, detergents are amphipatic molecules which have a polar head group region and a
Chapter 3-Reconstitution and 2D Electron Microscopy ---------------------------------------------------------------------------------------
61 | 174
non polar side chain. The purpose of detergent is to cover the hydrophobic residues of the helical
region, which span the membrane such that it is properly folded and is functional outside the
membrane. Detergent is expected to ape the physical properties of lipid bilayer in anticipation
that the structural properties of the protein will be restored. In case of membrane proteins, the
detergents orient in such a manner that the hydrophobic tail region surrounds the hydrophobic
region of the protein and the polar head groups interact with the aqueous external environment in
a thermodynamically stable conformation. These detergents are characterized by the critical
miceller concentration, aggregation number, head groups, side chains and degree of saturation or
unsaturation of the bonds in the side chain. Based on the charge carried the head group these
detergents behave differently and have different impact on the membrane protein which is briefly
discussed.
In short, Ionic detergents have a net charge, which can be positive, or negative. Ionic detergents
are more sensitive to pH, ionic strength, and the nature of the counter ion, and can interfere with
charge-based analytical methods. E.g. SDS.
Non-ionic detergents consist of uncharged hydrophilic head group are non-denaturing, but are
less effective at disrupting protein aggregation. They have mild properties, which are strong
enough for breaking lipid–lipid interactions and lipid–protein interactions but are not capable of
disrupting the protein-protein interactions. Such detergents preserve the native conformational
state of membrane protein. E.g. OG.
Zwitterionic detergents possess intermediate properties, which can efficiently disrupt protein
aggregation, offer slow denaturing and net-zero charge. E.g. CHAPS.
Considering all these aspects, different detergent screens were set. The detergents were evaluated
based on the stability of the protein monitored by the UV-Vis spectra and the ease of detergent
removal with dialysis. For this LDAO, C12H8, Hecameg, Triton-X, CHAPS, DPC, DDM, CTAB,
Sodium Cholate, DTAC and combination of detergents was analyzed. These detergents were
known to have BR in functional state hence were shortlisted. It was observed that PR was
definitely more stable in Triton-X 100, DDM and OG, which belong to the class of non ionic
detergents. Once the protein was stable, considering the effect of the CMC on the duration of the
dialysis, the detergent screen was further expanded to the use of different combinations of
Chapter 3-Reconstitution and 2D Electron Microscopy ---------------------------------------------------------------------------------------
62 | 174
detergents for protein elution and lipid solubilization. The best combination was achieved with
PR eluted in non-ionic Triton X-100 (CMC of 0.25–0.3 mM) and lipid solubilization in OG
(CMC of 20–25 mM ) [97].
NOTE: The detergent screen was also evaluated for the ease of removal from the system. It was
found that the presence of extra detergent in the system causes loss of resolution in SSNMR
spectra. In order to regain the resolution additional washing steps with dialysis buffer were
introduced.
3.5.1.2 Effect of additives Amphiphiles are generally used in 2D and 3D crystallization. They aid in crystallization by
various mechanisms. Some are believed to reduce the size of the protein detergent micelle and
provide assistance in increasing the interaction between the extramembranous segments [98].
Another hypothesis says that they make the detergent miceller collar more flexible, which in turn
helps in crystal growth [99] and in the absence of lipids cover the transmembranous part. Some
small additives can directly act on the extra membranous part of the protein as seen in
Ca++ATPase. The use of additives is more frequent in case of 3D crystallography; however, for
2D it is still not a routine yet. The list of common additives used for crystallization screens is
also available [100, 101].
In case of PR, MPD, which is an amphiphile and has nonpolar character, enhanced the growth of
2D crystals. Several different concentrations were tested and the best was found with 7.5%
concentration in the dialysis buffer. It is known that MPD binds to the hydrophobic sites and
prefers leucine side chains. Binding of MPD involves amino acid residues in the helical or β
sheet regions. MPD binding to protein is penetrative and leads to displacement of the water
molecules in the grooves and cavities on the protein surface, which in turn reduces the solvent
accessible areas and has implications on the solubility of the protein. MPD, normally expected to
be a strong denaturant but in this case it promotes stabilization of protein by preferential
hydration, which is due to binding of MPD molecules to the hydrophobic surface.
3.5.1.3 Effect of buffer The buffer, which is used to dialyze out the detergent from the reconstitution mixture, plays a
Chapter 3-Reconstitution and 2D Electron Microscopy ---------------------------------------------------------------------------------------
63 | 174
key role for crystallization. This is because the buffer has salt, additives, temperature and
specific pH and most important it interacts directly with the protein and alters the solubility.
After screening different divalent salts e.g. MgCl2, NiCl2, CoCl2, BaCl2, MgCl2, CaCl2 and
monovalant salts e.g. KCl, LiCl, NaCl, in different combinations and concentrations, the best
condition was obtained in combination with 100 mM NaCl and 10 mM MgCl2.
NOTE: The concentration of salts in the dialysis buffer was optimized considering the
requirements for the NMR measurements. The NMR samples with high concentration of salt are
known to have arching problems. In order to avoid this problem the concentration of salts was
restricted to minimum required.
3.5.1.4 Effect of pH Protein has a net charge and the buffer has a specific pH. This implies that there will be
alteration of interactions, which may influence the crystallization. The effect of pH on the
solubility will be much stronger at low ionic concentration of the buffer. Apart from this, PR has
shown a pH dependent vectorality for the pumping of protons [67]. Since pH has important role
in the functioning of PR, a pH rage of 4-10 was screened. The quality of crystals improved
slightly towards the alkaline pH, while it deteriorated at acidic pH 4. The lowest pH value for the
crystal formation was pH 6 and the best crystals were obtained at pH 10.
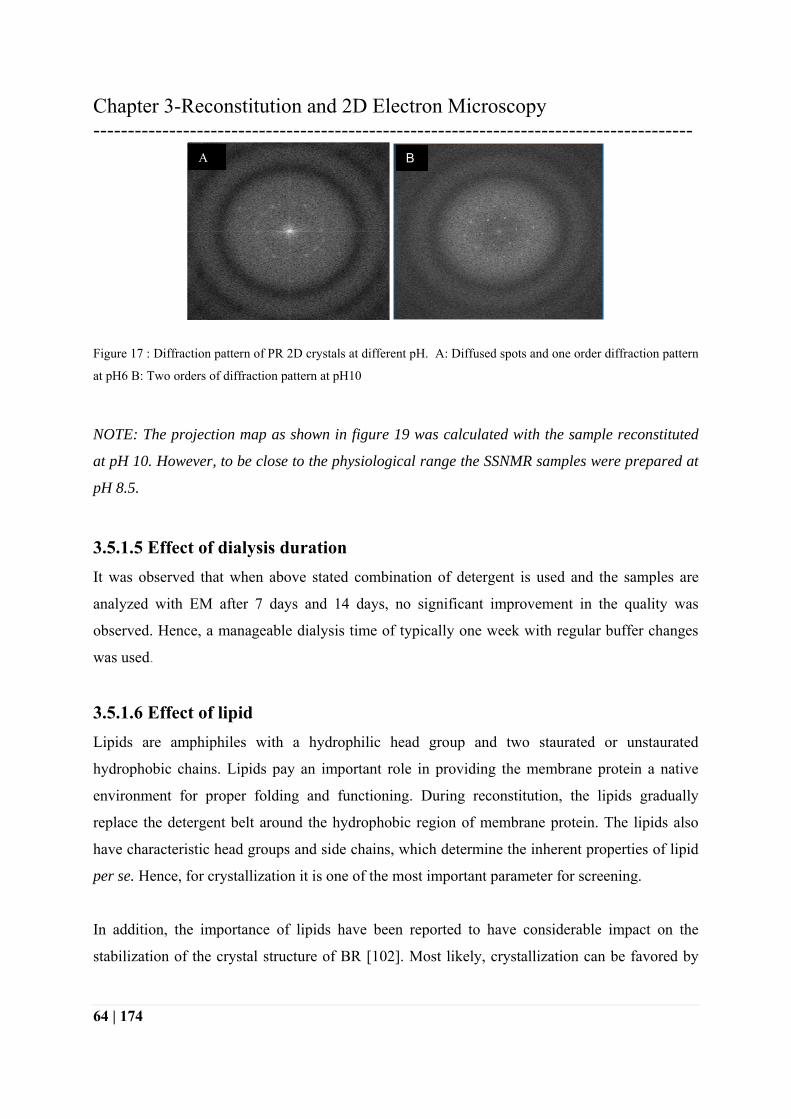
Reconstitution under acidic condition (pH 6) led to diffused, low order diffraction spots,
compared to those obtained under physiological condition (pH 7). At alkaline pH (up to 11), the
quality of crystals improved slightly (figure 17 B). The pH of seawater is around 7.2–8.5 which
means that most PR molecules in a marine bacterium under native conditions are pumping
protons from inside the cell to the outside. As the pKa of the proton acceptor is 7.2, PR is either
inactive or transports protons in opposite direction at acidic pH, which could lead to a
heterogeneous mixture of the molecules in different conformational states, leading to the
diffused diffraction spots.
Chapter 3-Reconstitution and 2D Electron Microscopy ---------------------------------------------------------------------------------------
64 | 174
Figure 17 : Diffraction pattern of PR 2D crystals at different pH. A: Diffused spots and one order diffraction pattern
at pH6 B: Two orders of diffraction pattern at pH10
NOTE: The projection map as shown in figure 19 was calculated with the sample reconstituted
at pH 10. However, to be close to the physiological range the SSNMR samples were prepared at
pH 8.5.
3.5.1.5 Effect of dialysis duration It was observed that when above stated combination of detergent is used and the samples are
analyzed with EM after 7 days and 14 days, no significant improvement in the quality was
observed. Hence, a manageable dialysis time of typically one week with regular buffer changes
was used.
3.5.1.6 Effect of lipid Lipids are amphiphiles with a hydrophilic head group and two staurated or unstaurated
hydrophobic chains. Lipids pay an important role in providing the membrane protein a native
environment for proper folding and functioning. During reconstitution, the lipids gradually
replace the detergent belt around the hydrophobic region of membrane protein. The lipids also
have characteristic head groups and side chains, which determine the inherent properties of lipid
per se. Hence, for crystallization it is one of the most important parameter for screening.
In addition, the importance of lipids have been reported to have considerable impact on the
stabilization of the crystal structure of BR [102]. Most likely, crystallization can be favored by
A B
Chapter 3-Reconstitution and 2D Electron Microscopy ---------------------------------------------------------------------------------------
65 | 174
using native lipid environment as in case of BR, Photosystem II, Ca++-ATPase, Na+ and K+-
ATPase, Rhodopsins and Light harvesting complex II. In some cases, combination of lipids have
also proved to be essential [103]. DMPC has a significant success associated with it. It was found
to be successful for Photosystem I/II, aquaporin, porin, and mixture of DMPC with other lipid
for e.g. lactose permease. For crystallization, it is important to consider the hydrophilic and
hydrophobic balance of the protein. The lipid to protein ratio is known to have been influenced
with this parameter [23].
The dependence of BR assembly on the membrane lipid content have been investigated earlier
by conventional kinetics, equilibrium methods [104, 105] and neutron diffraction [106]. The
reports support the fact that the change of lipids during reconstitution affects the membrane
protein assembly of BR. Lipid environment may be influential in deciding the oligomeric state of
the protein. The contribution of the head group moieties for the stabilization of the BR trimers is
also well documented [4, 107].
In context to the importance of lipids for crystallization, a series of lipids were screened based on
different chain lengths and head groups. These included POPC, POPG, Soy PC, DOPC, Archeal
Lipids, E.coli Lipids, Egg PC and DMPC. Different combinations and different ratios of these
lipids were tested. It was observed that the crystals of comparable diffraction pattern as shown in
figure 17 B were obtained with almost all the lipids except for DMPC. The inability of
crystallization with DMPC could be explained based on its short side chain. The best diffraction
was obtained with DOPC as shown in figure 17 B and hence was standardized. The Protein to
Lipid ratio range for obtaining crystals was 1:0.25 - 0.16 (w/w). A low lipid to protein ratio of
about 0.20 (w/w) was essential for the formation of homogenous 2D crystalline samples.
Increasing the amount of lipids to more than 0.25 (w/w) led to formation of isolated crystalline
patches that apparently prevented further growth of these areas.
3.5.1.7 Effect of protein concentration It is important to begin the crystallization with the protein of substantial purity. In case of PR, the
purity was over 95% as judged by SDS PAGE, which was a good starting point. The
concentration of protein in the crystallization setup was usually 1 mg/ml. However a complete
Chapter 3-Reconstitution and 2D Electron Microscopy ---------------------------------------------------------------------------------------
66 | 174
range from 100 µg/ml up to 5 mg/ml was screened but no significant effect of protein
concentration was observed.
3.5.1.8 Other parameters Reducing agents: Different reducing agents and combination in different concentration were also
experimented with β-mercaptoethanol, DTT and isopropanol in order to reduce the disulphide
bonds. No significant difference was observed.
Temperature: An entire temperature range from 4ºC up to 60ºC was screened with different
modifications like ramp. The temperature screening did not help much and finally room
temperature of 20ºC+ 2ºC was chosen for routine crystallization.
The different parameters, which were varied, and the range of testing conditions have been
summarized in the following table. However, it should be noted that multiple combinations of
these parameters were tested at a given time.
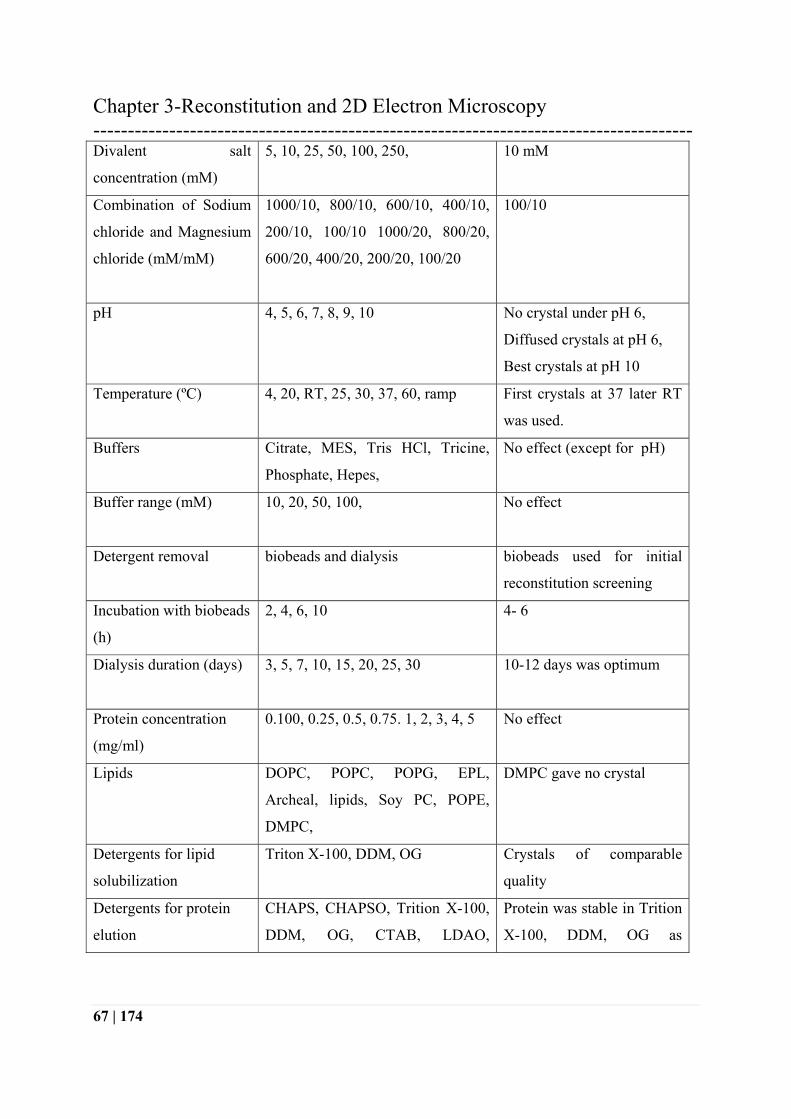
Table 6: Brief summary of conditions screened for 2D crystallization of PR
Type of screen Range screened Comments / best condition
Protein:Lipid Ratio
(w/w)
1:5, 1:2.5, 1:1.25, 1:0.83, 1:0.41,
1:0.166, 1:0.083
First diffraction pattern with
1: 0.83 and the best with
1:1.20
Monovalent salts Sodium chloride, Potassium
chloride, Lithium chloride
Lithium Chloride no
crystals
Monovalent salt
concentration (mM)
50, 100, 250, 500, 750, 1000 100 mM
Divalent salts Manganese chloride(MnCl2),
Calcium chloride (CaCl2,) Nickel
chloride(NiCl2), Cobalt chloride
(CoCl2), Magnesium chloride
(MgCl2), Barium chloride (BaCl2)
Magnesium chloride
(MgCl2)
Chapter 3-Reconstitution and 2D Electron Microscopy ---------------------------------------------------------------------------------------
67 | 174
Divalent salt
concentration (mM)
5, 10, 25, 50, 100, 250, 10 mM
Combination of Sodium
chloride and Magnesium
chloride (mM/mM)
1000/10, 800/10, 600/10, 400/10,
200/10, 100/10 1000/20, 800/20,
600/20, 400/20, 200/20, 100/20
100/10
pH 4, 5, 6, 7, 8, 9, 10 No crystal under pH 6,
Diffused crystals at pH 6,
Best crystals at pH 10
Temperature (ºC) 4, 20, RT, 25, 30, 37, 60, ramp First crystals at 37 later RT
was used.
Buffers Citrate, MES, Tris HCl, Tricine,
Phosphate, Hepes,
No effect (except for pH)
Buffer range (mM) 10, 20, 50, 100, No effect
Detergent removal biobeads and dialysis biobeads used for initial
reconstitution screening
Incubation with biobeads
(h)
2, 4, 6, 10 4- 6
Dialysis duration (days) 3, 5, 7, 10, 15, 20, 25, 30 10-12 days was optimum
Protein concentration
(mg/ml)
0.100, 0.25, 0.5, 0.75. 1, 2, 3, 4, 5 No effect
Lipids DOPC, POPC, POPG, EPL,
Archeal, lipids, Soy PC, POPE,
DMPC,
DMPC gave no crystal
Detergents for lipid
solubilization
Triton X-100, DDM, OG Crystals of comparable
quality
Detergents for protein
elution
CHAPS, CHAPSO, Trition X-100,
DDM, OG, CTAB, LDAO,
Protein was stable in Trition
X-100, DDM, OG as
Chapter 3-Reconstitution and 2D Electron Microscopy ---------------------------------------------------------------------------------------
68 | 174
Hecameg, DTAC, Sodium choleate,
C12H8,
observed by UV Vis spectra
Reducing agents and
concentration (mM)
DTT(2,4)
β-mercaptoethanol, (2,4),
Isopropanol (1.5%, 2.5%, 5%)
No effect
Additives Glycerol, MPD MPD better than glycerol
Concentration of
additives (MPD %)
2.5, 5, 7.5, 10, 12.5,15 ,17.5, 20 7.5%
In all over 1000 conditions were screened in order to obtain well diffracting 2D crystals, which
were suited for cryo electon microscopy analysis. The first diffraction pattern was be observed in
the condition number 24 (Condition number 24: Protein concentration in elution buffer =
1mg/ml, protein to lipid (w/w) ratio of 1: 0.83, detergent removal with biobeads (ratio of
biobeads to detergent = 40:1), incubation time = 2 h, temperature = 37ºC and lipid used was
E.coli polar extract. Further screening gave a better diffraction pattern in condition number 142
(protein to lipid (w/w) ratio =1:0.2 , lipids used were E.coli polar extract, temperature = 37ºC,
dialysis duration 5 days and dialysis buffer consisted of 250 mM Sodium chloride in Hepes
buffer at pH7 ). These conditions which later remained constant throughout the rest of the
screening conditions.
Based on high reproducibility and reliability of the reconstitution approach, the 2D crystals of
PR were attempted with dialysis. In addition, the sample preparation is discussed earlier in
chapter 2. Unfortunately, highly ordered 2D crystalline sheets or vesicles which would be ideal
for 2D crystallography were not obtained under any conditions tested. Interestingly, the pH of
the reconstitution buffer and the detergent used for solubilization of lipid and for the elution of
protein played a crucial role for the quality of the diffraction pattern. The use of appropriate
detergents for membrane protein stabilization and crystallization played a crucial role and has
been discussed extensively [108].
3.5.2 EM analysis
Chapter 3-Reconstitution and 2D Electron Microscopy ---------------------------------------------------------------------------------------
69 | 174
The best 2D crystals were obtained using synthetic lipids (DOPC) at pH 10 using an initial lipid
to protein ratio of 0.25 (w/w) as described in figure 18.
Figure 18 : EM Micrographs of PR 2D crystals. A : Overview of the PR 2D crystalline preparation (bar 1mm). B :
Best 2D crystals of PR were obtained in DOPC at pH 10. C : Fourier transformation of (B) shows two orders of
diffraction spots. D : Freeze-fracture EM image depicts the 2D crystalline arrangement of PR samples.
The conditions under which these crystals were prepared include following parameters. Protein
to lipid ratio (w/w) of 1:0.25, PR eluted in 0.02% Triton X-100, DOPC solubilzed in 2% OG,
protein concentration of 1 mg/ml, dialysis buffer containing 100 mM NaCl, 10 mM MgCl2, 7.5%
MPD, 5 mM DTT, 3mM NaN3, 50 mM Tricin buffer with pH adjusted to 10).
Figure 18 A shows the overview of the crystalline proteoliposomes. The size of the crystalline
vesicles was in the order of 0.5 μm as seen in figure 18 B and the best diffraction pattern is
shown in figure 18 C. The crystalline arrangement of PR becomes especially clear using freeze-
fracture electron microscopy (figure 18 D).
A B
C D
Chapter 3-Reconstitution and 2D Electron Microscopy ---------------------------------------------------------------------------------------
70 | 174
Figure 19 : Projection map in negative stain has been calculated at a resolution of 37 Å. The parts of the protein
protruding out of the membrane correspond to high density regions (solid contours) in the map. The unit cell
dimensions are 87 Å×87 Å. Two by two unit cells are shown. PR oligomerizes into a donut shaped ring-shaped
assembly. The scalebar is ~50 Å and is indicated in black solid line.
A projection map as shown in figure 19 was calculated from a negatively stained sample.
Because the negative stain does not penetrate in the membrane, the projection map only depicts
parts of the protein sticking out of the membrane. As can be seen in the Fourier transform (figure
18 C), the protein has a hexagonal packing as in the case of BR. However, the resolution of 37 Å
does not allow distinguishing between 3-fold or 6-fold symmetry. A comparison with the well
resolved structure of BR could indicate a trimeric arrangement [4] but a higher oligomer would
be possible as well. The calculated size of the unit cell of 87 Å×87 Å is too large for an
individual PR molecule and supports this assumption. The protomers assemble into a ring like
structure with an average diameter of 42 Å. The role of electrostatic interactions in guiding the
assembly of PR towards 2D and 3D arrays has been recently described by Liang et al [109].
Their conclusions about a hexagonal lattice arrangement are consistent with presented electron
microscopy data.
In search of the best crystallization conditions, a systematic variation of parameters was carried
out as described in detail in the biochemical analysis. All together over thousand conditions were
tested initially with biobeads and then with dialysis and checked for sample homogeneity by
density gradient centrifugation and for formation of 2D crystals by electron microscopy. This
Chapter 3-Reconstitution and 2D Electron Microscopy ---------------------------------------------------------------------------------------
71 | 174
systematic screen resulted finally in more than 900 successful crystallization conditions with
comparable sample quality but low diffraction. This means that the success rate of obtaining at
least low diffracting 2D crystals is relatively high. The formation of any ordered protein
arrangements within the membrane could be driven by entropy, protein–protein or protein–lipid
interactions. In case of PR, the same low-resolution 2D crystals were obtained under a wide
range of conditions, which would hint towards dominating protein–protein interactions. It could
also indicate, that PR might form protein patches in the native membrane.
One reason for the limited crystal growth is undesired obstruction or discontinuity in the
crystalline plane of growth. The formation of small patches of crystals can also be discussed in
light of the recent AFM data. For obtaining best projection map, the ideal requirement is well-
separated and single sheet of well-ordered 2D crystalline patch. The AFM data as discussed in
chapter – 4, indicates the formation of hexamers in majority of the densely reconstituted region
and the crystalline patch. With electron microscopy, only the crystalline patches could be
observed with the corresponding diffraction pattern and in the absence of diffraction pattern, the
rest would be unnoticed.
However, with the aid of AFM small proportion (<10%) of pentamers is also observed since it is
possible to select the crystalline patch individually. This means that the sample possess inherent
inhomogeneity, which obstructs the growth of crystalline patches. To determine the proportion of
2D crystalline to the non-crystalline region with electron microscopy is very challenging and
attempts to separate these two inhomogeneous fractions with sucrose gradient were unsuccessful
because the density of both the regions was similar. This hindered the separation of purely
crystalline patches and further calculation of projection map for EM analysis.
Another possible explanation for obtaining plenty but small crystalline patches is simultaneous
presence of multiple nucleation sites and dislocation of lattice. Various nucleation sites initiated
the 2D crystal formation, which grew to small crystalline region from a densely reconstituted
region. However, before these small crystalline patches could fuse to yield a larger patch, the
continuity was probably broken due to presence of pentamers. With multiple nucleation sites, the
crystal has a tendency to grow very fast but is limited to smaller size. Experiments to slow down
Chapter 3-Reconstitution and 2D Electron Microscopy ---------------------------------------------------------------------------------------
72 | 174
the crystallization to get bigger patches, using low temperatures and different detergents failed.
Under such conditions, the PR molecule has limited growth. The growth of crystalline patches
has been reported for BR using special detergents [110]. Similar attempts to grow these small
crystalline patches with the aid of specific detergent were also unfruitful.
3.5.3 Conclusions In conclusion, it is possible to crystallize PR under wide variety of conditions. The poorly
diffracting low quality 2D crystals were highly reproducible. The pH of the dialysis buffer and
detergent for solubilization of lipid and the protein played a crucial role. The interesting aspect of
the 2D crystal of PR was the ability to crystallize under wide range of different conditions and
produce similar quality of diffraction pattern. The most likely explanation could be that the
protein has the tendency to associate or adhere by itself. Such a case is suggestive of strong
protein protein interaction. The high number of PR molecules per cells, relatively bigger unit cell
size of the 2D crystals and the donut shaped assembly of the PR molecules as observed with the
projection map hint towards the higher oligomeric state of the protein.
3.5.4 Perspective In case of PR obtaining the 2D crystals was relatively faster than its improvement. At this stage it
is not conclusive, whether the inherent inhomogeneity of the crystalline sample or the quality of
crystals in itself is the reason for the limited growth and poor diffraction quality of the crystal.
The improvement of the crystal would definitely be advantageous for better resolution of the
projection map, which will enrich the structural information but at the same time could also
prove beneficial for the better correlation with the AFM and the SSNMR data. There are
increased chances of all these techniques to prove complimentary to each other to get an
improved overview of PR.
Probable ways of improving the crystal in the light of the recent oligomerization information
would be to have the homogenous population to begin with. MALDI data on the detergent
solubilized protein hinted towards the monomeric state of the protein (data not shown) but the
state of art techniques like LILBID and analytical centrifugation could help in knowing the
Chapter 3-Reconstitution and 2D Electron Microscopy ---------------------------------------------------------------------------------------
73 | 174
oligomeric state prior to crystallization. This would also indicate the presence of any other
impurities if present and might interfere with the crystallization process.
In case of PR, the same low-resolution 2D crystals were obtained under a wide range of
conditions, which hints towards dominating protein–protein interactions. It could also indicate,
that PR might form protein patches in the native membrane. It would be worthwhile to check for
the different growth conditions if they have any impact on the natural assembly of the protein.
Chapter 4-Functional characterization of PR 2D crystals ---------------------------------------------------------------------------------------
74 | 174
Chapter 4 : Functional Characterization of PR 2D crystals
Circular dichorism is well known spectroscopic technique for determination of folded state of the
protein, conformational state of the protein under different conditions and for determination of
involvement of protein-protein interaction for the related conformation change of the protein. In
this chapter, the focus is on CD spectroscopy measurements, which were carried out for
accessing the thermal stability of PR 2D crystals and comparison with detergent solubilized state.
The second part of the chapter deals with Fourier Transform Infra Red Spectroscopy, which has
been extensively used to probe into the photocycle of BR, where the characteristic structural
changes and photointermediates are determined with the help of typical FTIR bands in the
difference spectra. In this section, attempts for the presence of the photocycle and then later for
identification of different photointermediates of the PR photocycle have been discussed.
4.1 Stability of PR 2D crystals: CD spectroscopy
4.1.1 Motivation Reconstitution of the membrane protein in lipids outside the natural environment always
questions the correct folding of the protein. In context to this, the purpose of studying the 2D
crystals with CD spectroscopy is to determine the difference or compare the differences in the
protein folding behavior in detergent solubilized and 2D crystalline form and help in further
functional characterization of the protein.
4.1.2 Approach CD spectroscopy is used routinely for the characterization of the folded state of the protein, its
secondary or tertiary structure. It also finds its application to observe the patterns obtained from
different members of a family of proteins or groups. Application of CD to study the effect of
temperature, pH, reversibility of folding, effect of denaturants, protein protein interactions is also
well known.
Circular dichroism is defined as the difference in the absorbance of left circularly polarized light
Chapter 4-Functional characterization of PR 2D crystals ---------------------------------------------------------------------------------------
75 | 174
(LCPL) and right circularly polarized light (RCPL).
CD = Abs (LCPL) – Abs (RCPL).
CD is generally reported in units of absorbance miliabsorbance units (mA) or ellipticity (mdeg or
m°), which are a thousand of a degree. For any molecule to be “CD active”, a molecule must be
structurally asymmetric and exhibit absorbance. In case of protein samples, asymmetry results
from chiral molecules such as the peptide backbone of proteins, a non-chiral molecule covalently
attached to a chiral molecule (aromatic amino acid side chains), or a non-chiral molecule in an
asymmetric environment (e.g., a chromophore bound to a protein). Proteins are CD active (all
amino acids except glycine contain a chiral carbon, thus are asymmetrical), and the resulting CD
signals are sensitive to protein secondary and tertiary structure. Secondary structure can be
determined by CD spectroscopy in the "far-uv" spectral region (190-250 nm). At these
wavelengths, the chromophore is the peptide bond, and the signal arises when it is located in a
regular, folded environment. CD signals for pure alpha helix, beta sheet, and random coil structures each give rise to a
characteristic shape and magnitude of CD spectrum. For obtaining the information regarding the
secondary structure and the stability of the protein with respect to the temperature, the CD
spectra were carried out at Institute for Biophysics, in collaboration with of Prof. Mantele and
measurements were done by Ms. Gabriela Schäfer.
4.1.3 Sample preparation The CD spectra form 2D crystalline preparation was obtained at a concentration of 1 mg/ml and
this liquid sample was used for CD measurements. The CaF2 cuvettees with 4-5 µl sample and a
path length of ~60 µm were used. For comparison, spectra of the detergent solubilized protein
were also measured. The temperature range of 20°C up to 90°C was analyzed for stability and
the melting point measurements. The temperature was manually adjusted using the water bath.
Data was collected in the range of 185 nm - 260 nm. The typical CD spectrum from the
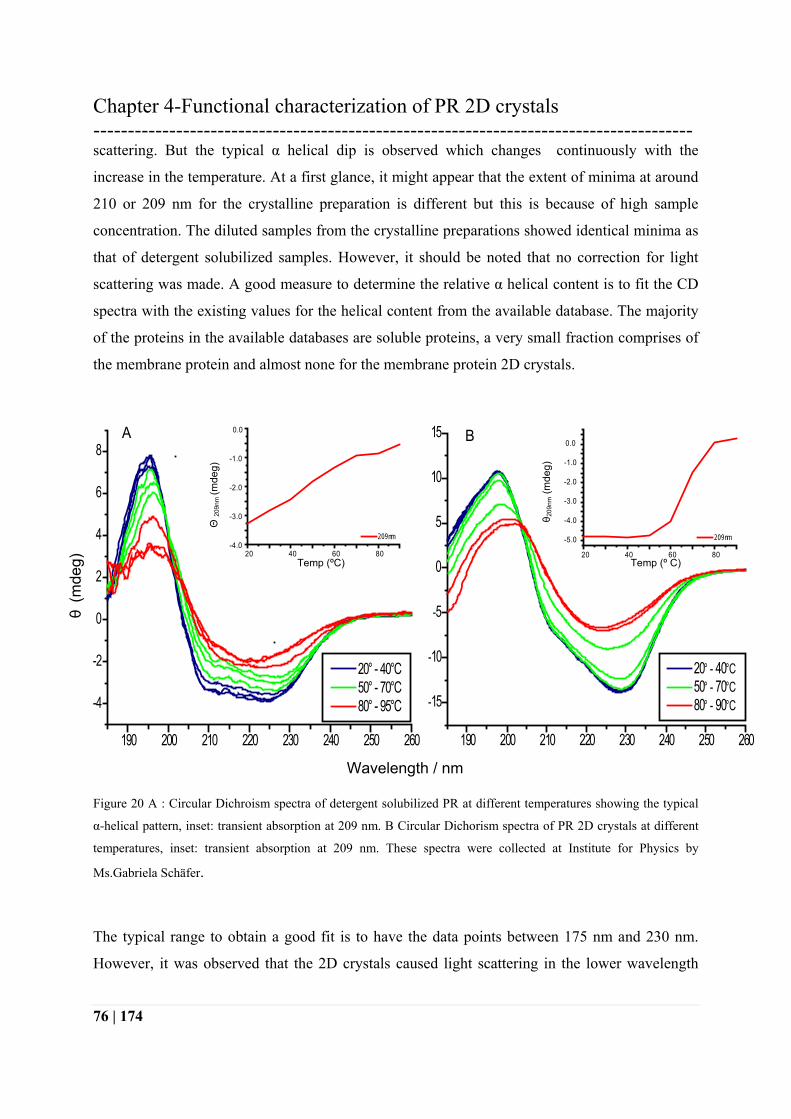
crystalline as well as the detergent solubilized protein is shown below in figure 20 A and B.
The detergent sample shows a typical alpha helix pattern in figure 20 A. Where as the CD
spectra from the crystalline preparations in figure 20 B indicate presence of additional
interactions. It was difficult to acquire the data for the crystalline preparations due to light
Chapter 4-Functional characterization of PR 2D crystals ---------------------------------------------------------------------------------------
76 | 174
scattering. But the typical α helical dip is observed which changes continuously with the
increase in the temperature. At a first glance, it might appear that the extent of minima at around
210 or 209 nm for the crystalline preparation is different but this is because of high sample
concentration. The diluted samples from the crystalline preparations showed identical minima as
that of detergent solubilized samples. However, it should be noted that no correction for light
scattering was made. A good measure to determine the relative α helical content is to fit the CD
spectra with the existing values for the helical content from the available database. The majority
of the proteins in the available databases are soluble proteins, a very small fraction comprises of
the membrane protein and almost none for the membrane protein 2D crystals.
190 200 210 220 230 240 250 260
-4
-2
0
2
4
6
8
20° - 40°C50° - 70°C80° - 95°C
190 200 210 220 230 240 250 260
-15
-10
-5
0
5
10
15
20° - 40°C50° - 70°C80° - 90°C
20 40 60 80
-5.0
-4.0
-3.0
-2.0
-1.0
0.0
209nm
20 40 60 80-4.0
-3.0
-2.0
-1.0
0.0
209nm
A B
Figure 20 A : Circular Dichroism spectra of detergent solubilized PR at different temperatures showing the typical
α-helical pattern, inset: transient absorption at 209 nm. B Circular Dichorism spectra of PR 2D crystals at different
temperatures, inset: transient absorption at 209 nm. These spectra were collected at Institute for Physics by
Ms.Gabriela Schäfer.
The typical range to obtain a good fit is to have the data points between 175 nm and 230 nm.
However, it was observed that the 2D crystals caused light scattering in the lower wavelength
Wavelength / nm
θ (m
deg)
Temp (ºC) Temp (º C)
Θ 20
9nm
(mde
g)
θ 209
nm (m
deg)
Chapter 4-Functional characterization of PR 2D crystals ---------------------------------------------------------------------------------------
77 | 174
region. Hence, it was not possible to obtain the exact value for the α-helical content for the PR
2D crystals.
The transient absorption curve is plotted with values for 209 nm for both the sample
preparations. This data clearly shows transition of states with increasing temperature. However,
the mode of transition is different. In case of detergent solubilized PR, the slope is gradual but
for 2D crystals, it is steeper. Both spectra show two different forms at different temperatures. In
case of detergent solubilized protein, there is a gradual degradation of the protein with slight
increase in the temperature. This can be attributed to the increasing solubility of the detergent
with increasing temperature, which makes the local environment less stable. However, 2D
crystals are stable up to 50°C and then cooperatively start to dissimilate. This change of state can
be due to the sudden disruption of a more stable local environment for the protein in 2D form.
4.1.5 Conclusion The CD spectra in the detergent solubilzed form and 2D crystalline form suggests similar folding
pattern, which resembles the helical pattern as shown in figure 20 Nevertheless, the transient
absorption spectra indicate a more stable conformation for the protein in 2D crystals. The
crystals are stable upto 50ºC and the melting point for the PR 2D crystals can be calculated to be
around 70º. This stability information is very important from long term NMR measurements
point of view. The stability of protein at these temperture ensures that the protein is in proper
conformation state while the NMR measurements are recorded
4.2 Functionality of PR 2D crystals PR: FTIR time resolved spectroscopy.
4.2.1 Motivation Crystallization of protein in 2D always questions the functional state of the protein in the
relatively restricted environment. In this context, the purpose of applying FTIR on the 2D
crystals is to determine the functional state of the protein. In case the protein is functional, it
should be possible to observe the photocycle with repeated cycles of photo excitation and
relaxation. PR is a retinal protein; hence, it is important to identify the different photo states of
the photocycle, if the protein enters the photocycle and if there exists any photocycle.
Chapter 4-Functional characterization of PR 2D crystals ---------------------------------------------------------------------------------------
78 | 174
4.2.2 Background Microbial rhodopsin comprises a family of photoactive seven trans membranous helical retinal
proteins, which is found in diverse microorganisms [32, 37, 111]. The most well studied member
of this family is BR and a homologue of archeal rhodopsin is PR. The cascade of cyclic
reactions, which follow the retinal photo isomerization, is known as the “photocycle” and is
characterized by presence of distinct and spectroscopically identifiable intermediates and has
been discussed in chapter 1. The pH dependent color changes are attributed to the protonation
state of the counter ion of the retinal Schiff base. For BR, such changes were linked to the
protonation state of Asp85 [112]. The corresponding residue for Asp85 in PR is Asp97, whose
protonation state can be followed by pH dependent FTIR difference spectroscopy for
identification of the photocycle intermediates. These measurements were carried out at Institute
for Biophysics, in collaboration with of Prof. Mantele and measurements were done by Ms.
Gabriela Schäfer.
4.2.3 Sample preparation Prior to the measurement, the dialysis buffer was exchanged to a simple phosphate buffer with
the pH 8.5 and concentrated using centrifugation. 5 μl of this solution was dried with stream of
N2 on a CaF2 window with a shallow groove. A second window was placed on top and a final
sample thickness of 10 μm was achieved. The consistency of the sample was similar to highly
concentrated liquid sample. This window then was placed in a temperature controlled sample
holder inside an IFS66v/s FTIR spectrometer. A series of 50 Rapid Scan spectra were collected
and averaged to obtain a better signal to noise ratio. The measurements were performed at 4ºC
mainly to slow down the photocycle to obtain better resolution especially in the fast decaying
steps of photocycle (K intermediate step). The interference due to formation of ice crystals can
also be avoided while measuring at 4ºC.
4.2.4 Results and Discussion The protonation state of Asp97 in the 2D crystalline state at pH 8.5, (which is above the pKa of
the proton acceptor) was followed by rapid scan infrared difference spectroscopy as shown in
figure 21. The time resolution obtained for rapid scan measurements depends on the velocity of
Chapter 4-Functional characterization of PR 2D crystals ---------------------------------------------------------------------------------------
79 | 174
the moving mirror and the number of scans averaged per measurement. For these measurements,
the fastest time resolution achieved was 76 msec. The largest negative band observed at ~1541
cm-1 and positive band at ~1523 cm-1 can be assigned to the C=C stretching vibration of the
retinal in the alkaline pH [113]. The negative band at 1541 cm-1 shows the depopulation of the
ground state and the positive band at 1523 cm-1 represents an arising K intermediate. The
positive band at 1200 cm-1 and negative bands at position 1235 cm-1 and 1250 cm-1 show the 13
cis isomerisation of the retinal and arise from C-C stretching vibrations. The bands ~1300 cm-1
/1400 cm-1 can be due to the stretching of N-H and C-H. The C=N stretching vibration of Schiff
base of PR comes at ~1651 cm-1. The positive band at ~1189 cm-1 can be assigned to C14-C15
stretch of retinal in K state. Thus, it is after photo excitation, that the 13 cis state of retinal is
observed. The band pattern in this range is also useful for tracking the right isomerization of the
retinal. Basically this band arises from the photoproduct of the 13 cis portion of retinal [114] and
can be observed in acidic as well as alkaline form of PR [67]. Occurrence of the characteristic
peaks in the fingure print region of retinal after photo excitation indicate presence of K state in
the 2D crystalline form.
Further the C=C stretching of the retinal in the M state is difficult to detect with infrared
spectroscopy owing to its small dipole moment. The presence of M state for PR is marked by
appearance of positive band in the range of 1700 cm-1 in the reconstituted sample. This is
observed at 1755 cm-1 and is assigned to the C=O stretching vibration from Asp97. In case of the
2D crystalline samples, the similar band at 1755 cm-1 is observed and is attributed to the
protonation of Asp97 [67].
After the successful assignment of the retinal band further following the retinal C=C band at
1540 cm-1, it can be observed, that the protein exhibits the M intermediate as observed by
transient absorption spectroscopy. The major peaks identified are listed in the following table.
Chapter 4-Functional characterization of PR 2D crystals ---------------------------------------------------------------------------------------
80 | 174
180 0 170 0 160 0 150 0 140 0 130 0 120 0-0.010
-0.005
0.000
0.005
0.010
Diff
eren
ceA
bsor
ban
ceC
hang
e
wavenu mber / cm-1
A B C D
Figure 21 : Infrared light and dark difference spectra of PR2D crystals after 75 msec of excitation at pH 8.5. The
spectra show vibration bands in the Aspartate region photo excitation at 532 nm BigSky Ultra Nd:YAG laser. The
bands around 1200 cm-1 indicate that the 13 cis isomerization of the retinal has occurred and a positive band at 1755
cm-1 shows the presence of M state. The bands around 1200 cm-1 indicate that the 13 cis isomerization of the retinal
has occurred and a disappearing band at 1523 cm-1 shows the decline of the K state. This spectrum was acquired by
Ms. Gabriela Schaefer at Institute of Physics, Frankfurt.
The measurements indicate the retinal band at 1540 cm-1 undergoes photo kinetics upon
excitation and relaxes to the initial normal base line. It should be noted that that the negative
band at 1540 cm-1 is the ground state depopulation and the ground state is therefore repopulated
as shown in figure 22. Comparable spectra could be obtained after repeated photo excitation and
relaxation, which indicate that the photocycle is iterative and is not hindered. This is an
indication of active protein state in the 2D crystalline form
Chapter 4-Functional characterization of PR 2D crystals ---------------------------------------------------------------------------------------
81 | 174
Table 7: List of identified FTIR band position for PR 2D crystals
label Band position
(positive)
Band position
(negative)
Indication
~1523 ~1541 C=C stretching vibration of retinal at alkaline
Figure 22 : Transient absorption of the ground state depopulation at 1541cm-1 and its re population after the
photocycle. This spectrum was acquired by Ms. Gabriela Schaefer at Institute of Physics, Frankfurt.
4.2.5 Conclusions
Chapter 4-Functional characterization of PR 2D crystals ---------------------------------------------------------------------------------------
82 | 174
Based on the preliminary FTIR measurements, it is obvious that the PR in 2D crystalline form
does enter the photocycle and K and M intermediates could be identified. The identification of
the N and O intermediate is difficult, due to an ongoing discussion about the band positions and
shape of a true N or O spectra. Furthermore, the low time resolution of the rapid scan technique
leads to the observation of mixed states, which cannot easily be decomposited into the true
spectra. Since the difference bands of the photoproduct disappear over time, and the baseline is
recovered, the protein crystals undergo photocycle. This concludes that the 2D crystalline
packing does not affect the functionality of the PR but as expected slight changes in the time,
constants of the photocycle are visible due to the rigid environment in the 2D crystals.
The activity of PR in vivo has been as shown before by monitoring single cells of E. coli and
their observed response to light due to the proton motive force (pmf) that bacteria use as the
energy source to power the rotary flagellar motor which enables them to swim [83]. Suspensions
of E.coli membranes containing PR were also observed with laser flash-induced absorbance
changes to determine the activity of the protein. Light-mediated proton translocation was
determined by measuring pH changes in a cell suspension exposed to light, where the net
outward transport of protons was observed only in PR containing E.coli cells and only in the
presence of retinal and light [37]. Time resolved FTIR spectroscopy has been used to study the
photo intermediates of PR which are involved in fast transient proton release in reconstituted
state [115]. The light induced proton currents in the PR reconstituted samples were also
measured in a compound membrane system where proteoliposomes were adsorbed to planar lipid
bilayers [67].
Considering the sparse amount of lipids in the 2D crystalline preparations, it was difficult to
adsorb the proteoliposomes to the planar lipid bilayers and hence the spectroscopic analysis for
identification of intermediates was opted to show the functionality of the protein.
4.3 Functionality of PR 2D crystals PR : SSNMR
An indirect evidence of active functionality was also judged by measuring the chemical shift
values for the 15N-ζ-labeled lysine samples. It was observed that the chemical shift values for
such labled lysine had similar chemical shift values as for the fully functional reconstituted
Chapter 4-Functional characterization of PR 2D crystals ---------------------------------------------------------------------------------------
83 | 174
sample. This suggested that the local chemical environment of the Schiff base lysine for both
sample preparations is similar and may have similar active functionality.
The details of these experiments are described in Chapter 6.
Chapter 5-Assembly of PR : An AFM study ---------------------------------------------------------------------------------------
84 | 174
Chapter 5 : Assembly of PR: An AFM study
5.1 Scope AFM has emerged as a powerful tool for biologists in terms of providing the ability to study
biological samples in their native environment and has the capability to illustrate the
topographical features at sub molecular level [116, 117]. It shows a unique way for
characterization of structure function relationship of the native membrane proteins. AFM
provides sub nanometer resolution of the substructures as well as associated conformational
changes, oligomerization state, dynamics and assembly.
SMFS (single molecule force spectroscopy) permits detection of inter as well as intra molecular
interactions. This method is able to unearth the interactions which are primarily involved in the
stabilization of secondary structure [118]. It represents a multifunctional tool that finds its
application in the oligomeric state and conformational change determination for better
understanding of structural and functional characteristics of the protein. The unique technique
helps simultaneous monitoring of the varied parameters, which aid in the determination of
flexibility or rigidity of the protein. It can be used to determine the folding and the unfolding
pathways of the membrane proteins and finds its application in studying the association patterns
of membrane proteins, which lead to higher oligomerization states. Time dependent SMFS can
also probe into the kinetics of these processes [119, 120].
This work was done in collaboration with Prof. Daniel Mueller and Adriana L. Klyszejko from
Biotechnology Center, University of Technology, Dresden, Germany. The results of this study
have been published in Journal of Molecular Biology (2008) 376, 35–41.
5.2 Approach Different kind of information can be obtained with AFM technique depending upon the mode of
operation:
Contact mode: This mode is especially used to study membrane proteins where the probing tip is
gently touched at the surface of the protein with a constant force while scanning. These probing
tips are known as cantilevers with very small force constants (~0.1 N/m).
Chapter 5-Assembly of PR : An AFM study ---------------------------------------------------------------------------------------
85 | 174
Tapping and oscillating mode: Usually this mode is used to record the topography of a weakly
immobilzed specimen and where the tip undergoes a vertical oscillation.
For the purpose of high-resolution structural data collection, AFM is the mode of choice in
contact mode. The effective forces contributing to the deformation of the specimen may be
overall sum of force applied to the stylus, the electrostatic repulsion and Van der Waal attraction
between the two surfaces. This feature has been extensively discussed in aqueous environment
[121]. However higher forces may prove to be of an additional benefit of studying the hidden
feature in a protein as in case of AB loop in BR [122]. These weak Van der Waals and
electrostatic forces can be minimized by optimizing the pH and ionic concentration of the buffer.
The force distance curves between the tip and the sample under different buffer conditions
determine the best imaging conditions. While recording the AFM data the vibrations in the
microscope should be considerably minimized. To increase the chances of adsorption for the
crystalline patches significantly, various buffer related parameters need to be optimized. E.g
incubation time between the application of the sample and the washing step, concentration of
ions in the buffer etc.
5.3 Advantages for membrane proteins Like all techniques, AFM too has its own advantages and disadvantages. The benefit of working
with AFM is very high signal to noise ratio which enables every single protein to be observed
[123]. It does not require any specific labeling but analyzes the samples under normal buffer
conditions. This applies not only to the field of polymers and inorganic crystals but has profound
application in the field of biology and the specimens are widely diverse. These range from fibers,
DNA, cells, viruses and bacteria. The information obtained in terms of lateral and vertical
resolution with high signal to noise of the topographs make significant contribution to
understanding of the single biomolecules. The AFM probe interacts directly with the protein
surface and measures the electrostatic potential, detects current (pA) and this contribution in any
case cannot be overlooked when trying to acquire high-resolution structural information from
membrane proteins in their native environment. This technique can be applied on reconstituted as
well as 2D crystalline samples. The biggest advantage with 2D crystal is of flat surface of the
crystalline patches, which provide an excellent specimen quality for the AFM measurements. But
to avoid any structural damage to the biological sample, utmost care should taken to reduce the
Chapter 5-Assembly of PR : An AFM study ---------------------------------------------------------------------------------------
86 | 174
applied friction forces between tip and the sample.
5.4 Motivation The structure and function relationship of BR and its homologs, the light-driven chloride pump
halorhodopsin [124] and sensory rhodopsin [125], have been studied at molecular resolution.
However, for PR the structural information is limited. Like the other members of this family, by
virtue of being a membrane protein, PR is expected to possess additional stability due to the inter
as well as intra molecular interactions [126].
PR is relatively new and the structural aspects need to be explored. The electron microscopy data
reveals a donut shaped assembly of PR molecules and a bigger unit cell size. The bigger unit cell
size of PR, which is 87Å*87Å, when compared to BR unit cell size of 64Å* 64Å, suggests an
oligomeric state of the protein. However, the poor resolution of the 2D crystals limited further
detailed information especially about the oligomeric state by electron microscopy. Hence, in
order to probe into the oligomeric state of the protein single image AFM analysis was attempted.
In contrast to this, detailed information is available for other retinal proteins e.g rhodospin and in
particular BR under optimum conditions for the assembly, conformation changes,
oligomerization and dynamic aspects of these proteins [127-129]. This becomes relevant when
observing the 2D crystals of our protein, which is in crystalline arrangement and may exhibit
similar behavior of oligomerization, stability and (un) folding pattern. The major aim of this
study was to observe if the protein exhibits similar structural oligomerization patterns as other
retinal proteins such as BR or are there striking differences ?
5.5 High-resolution AFM imaging Reconstituted proteorhodopsin membranes were adsorbed onto freshly cleaved mica in buffer
solution (300 mM KCl, 10 mM MgCl2, 20 mM Tris-HCl, pH 8.0). After this, the sample was
washed with imaging buffer (150 mM KCl, 10 mM MgCl2, 20 mM Tris-HCl, pH 8.5) to remove
weakly attached membranes. The AFM used was a Nanoscope III (Digital Instruments, Santa
Barbara, California) equipped with a J-scanner (≈100 μm) and oxide sharpened Si3N4 stylus on a
cantilever with a nominal spring constant of ≈0.1 N/m (OMCLTR-400-PS, Olympus, Tokyo,
Chapter 5-Assembly of PR : An AFM study ---------------------------------------------------------------------------------------
87 | 174
Japan). Contact mode AFM imaging performed by electrostatically dampening the forces applied
locally between the AFM stylus and protein membrane to ≈50 pN [130]. Such low forces
prevented possible deformations of the protein by the scanning AFM stylus [131]. Topographs
recorded in trace and retrace scanning directions showed no significant differences confirming
that the scanning process of the AFM did not disturb the protein surface. All measurements were
carried out at room temperature.
5.6 Single-molecule force spectroscopy The motivation for single molecule force spectroscopy was to determine the (un)folding pattern
of the PR helices from the crystalline arrangement. This is typically performed with the aid of
force distance spectra (F-D curve). To calculate the F-D spectra, a single protein is tethered
between the tip of the micromachined AFM cantilever and a supporting surface. The tip-surface
separation is then continuously increased using a piezoelectric actuator while the forces applied
to the molecule by the cantilever are detected with an accuracy of a few pN. The continuous
extension of an individual protein molecule results in subsequent unfolding of the protein
domains. Plotting force against tip-surface separation produces a characteristic force-distance (F-
D) curve from which the unfolding force as well as the unfolding pathway of a single protein
domain is derived [132, 133].
To mechanically unfold individual PR using SMFS, the protein membrane was first imaged by
AFM. Then the AFM stylus was brought into contact with the membrane protein surface.
Applying a constant force of ≈1-1.5 nN for ≈1s ensured that one terminal end of the protein
attached to the stylus via nonspecific interactions [130, 134, 135]. Separation of stylus and
membrane stretched this molecular bridge and exerted a force at the protein leading to its
unfolding. The F-D spectra recorded during the unfolding process showed characteristic patterns
similar to those previously assigned to the unfolding of one BR molecule [128, 130] or to the
unfolding of one halorhodopsin molecule [134] by pulling from the C-terminal end. The first 20
nm of the F-D traces exhibited higher noise compared to the remaining trace due to non-specific
AFM stylus-sample interactions [128, 130]. Thus, force peaks lying within this region are
masked by noise and show higher deviations compared to the peaks detected at separations
Chapter 5-Assembly of PR : An AFM study ---------------------------------------------------------------------------------------
88 | 174
above 20 nm. SMFS was conducted in buffer solution (150 mM KCl, 20 mM Tris-HCl, pH7.8)
at a pulling velocity of 87 nm/s.
5.7 Results and Discussion Although the given resolution was not sufficient to differentiate between the cytoplasmic and
extracelluar sides of the PR in the 2D crystals, but AFM imaging of reconstituted PR membranes
in buffer solution showed two different packing regions. One was crystalline (*) and the other
densely packed (**) region as shown in figure 23. At high-resolution the surface of the 2D PR
crystals revealed donut-like structures arranged in a hexagonal lattice of 8.8 ± 0.7 nm (ave±SD;
n=30) side length. These donut-like structures exhibited protrusions extending 0.9 ± 0.3 nm
(n=50) above the lipid surface. In contrast to BR, the total area covered by the unit cell of the
hexagonal proteorhodopsin lattice corresponds is 33.53 nm2 which is twice that of BR. This
indicated higher chance of adjusting six PR molecules in a unit cell.
5.7.1 Comparison of PR AFM data with BR For BR, AFM studies under optimum conditions the diameter of the crystalline patches varied
between 0.5-0.15 μm. In the extracellular side, a typical feature of protrusions extending up to
0.5 nm was observed for which the major contribution is the β sheet between the trans-membrane
domain B and C. On the cytoplasmic side, the flexible EF loop provided the force dependent
conformational changes. These EF loops were observed as sharp protrusions of ~0.8 nm in
height with 100 pN force applied on the AFM stylus. However, when the force applied increased
3 times, this feature becomes less conspicuous. The AB loops become more visible with an
applied force of 300 pN and reveal to have a height of ~0.6 nm. The hexagonal lattice of BR
trimers in native purple membrane patches shows a side length of ≈ 6.2 nm [4] with single BR
molecule protruding between ≈ 0.5 and 0.8 nm from the lipid bilayer [131]. The area covered by
the hexagonal unit cell of the purple membrane lattice is 16.64 nm2 which accommodated three
BR molecules [57]. These results are further discussed under different sub headings.
Chapter 5-Assembly of PR : An AFM study ---------------------------------------------------------------------------------------
89 | 174
Figure 23 : AFM of 2D crystals and densely packed PR membranes. A, Survey showing crystalline (*) and densely
packed (**) patches of PR embedded in the lipid (DOPC) bilayer. The lipid bilayer protruded 4.5 ± 0.5 nm (n=10)
from the support, the crystals 7.1 ± 0.5 nm (n=10) and the densely packed proteorhodopsins 6.3 ± 0.5 nm (n=10). B,
High-resolution topography showing the hexagonal lattice (a = 8.8 ± 0.7 nm) of donut shaped oligomers formed by
PR. C, Calculated diffraction pattern of (B) documents spots (red circles) suggesting a lateral resolution of ≈1.5 nm.
D, Correlation average of (B). The symmetrized average showed a 9% deviation from six-fold symmetry. AFM
topographs recorded in buffer solution exhibit a full gray level corresponding to vertical scale of 20 nm (A) and 2
nm (B and D).
This data was collected by Adriana L. Klyszejko in Prof. Daniel Mueller lab at biotechnology Center, University of
Technology, Dresden, Germany and figure is taken from [136].
Note: When compared with the electron microscopy data, the size of the unit cell correlates very
well. However, with electron microscopy the distinction between the crystalline part and the
non-crystalline part was not achieved. The probable reason is that only the crystalline areas
would provide the diffraction pattern and in the absence of diffraction pattern from the non-
crystalline part, this region would be unnoticed.
5.7.2 Oligomerization Approximate calculation suggests ≈ 24.000 PR molecules per SAR86 cell [59]. When in a
densely packed crystalline lattice, as in case of BR, this would refer to a circular flat circular
patch of 600 nm in diameter occupying a major portion of a cell surface. This implies that with
half packing density of PR the area covered would be twice the area of the cell membrane.
Hence, the larger unit size of the PR donuts pose a question on the oligomeric state of the
protein. In this case may point towards trimers, tetramers, pentamers or hexamers.
Chapter 5-Assembly of PR : An AFM study ---------------------------------------------------------------------------------------
90 | 174
Figure 24: High-resolution AFM of densely packed proteorhodopsin oligomers. A,PR molecules could assemble
into different oligomeric forms. Galleries show individual hexameric (B) and pentameric (C) proteorhodopsin
oligomers. The last oligomers shown with black background represent correlation averages. Scale bars in (B) and
(C) correspond to 5 nm. AFM topographs recorded in buffer olution exhibit a full gray level corresponding to
vertical scale of 2 nm.
The data was collected at Technische Universität Dresden, Center of Biotechnology in collaboration with Dr. Daniel
Muller by Adriana L. Klyszejnko and figure is taken from [136].
5.7.3 Assembly The oligomeric dimensions of BR trimers and PR in 2D crystalline form exhibited a hexagonal
lattice. The superimposition of BR molecules indicated a tangential assembly. However, for
hexameric PR in the crystalline state, the PR molecules did not have sufficient space to
accommodate in the tangential manner. The unique way to place these 6 PR molecules in the
Chapter 5-Assembly of PR : An AFM study ---------------------------------------------------------------------------------------
91 | 174
lattice is to arrange them in a radially symmetric fashion. Averaging of several topographs
indicated that all the molecules in the lattice were equal with respect to each other. It means that
it is cooperative process, either all of them pointing towards inside or outside. However, the
resolution was insufficient to determine the direction of the arrangement.
Figure 25 : Correlation averaged AFM topographs showing the hexagonal assembly of BR trimers of native purple
membrane (A) and of reconstituted proteorhodopsin hexamers (B). A, Cytoplasmic purple membrane surface: The
highest protrusion of each bacteriorhodopsin molecule corresponds to the polypeptide loop connecting
transmembrane α-helices E and F[131]. The outlined BR shapes were adapted from sections close to the cytoplasmic
surface of BR trimers obtained from electron crystallographic analyses[4]. B, Crystallized proteorhodopsin
hexamers: Assuming each of the six protrusions to represent one proteorhodopsin molecule, the proton pumps must
be assembled radially to fit into the oligomer. Outlines in white and blue show two of many possible orientations of
the PR molecules. Averaged topographs exhibit a full gray level corresponding to vertical scale of 2 nm.
This data was collected by Adriana L. Klyszejko in Prof. Daniel Mueller lab at biotechnology Center, University of
Technology, Dresden, Germany and figure is taken from [136].
5.7.4 (Un)folding pattern with SMFS and F-D spectra The proper folding of the membrane protein is important for the protein to be functionally active.
This is governed by intermolecular interactions which are responsible for appropriate folding and
are decisive in the functional and structural properties of the membrane protein [137]. The
mechanical unfolding of the membrane protein was conventionally approached by varying the
physical parameters of temperature or chemical parameters like detergents [138, 139]. The
stability of the protein may depend on either monomeric interaction or oligomeric interaction or
on both. This constitutes an important area for further investigation and is subject to study.
Chapter 5-Assembly of PR : An AFM study ---------------------------------------------------------------------------------------
92 | 174
BR in purple membrane and PR in 2D crystalline form represent a relatively stable conformation
in the membrane. However the stability of any membrane protein is determined by overall
interaction of the protein with the lipid bilayer as well as the inter and intra molecular
interactions [126]. The nature of molecular interactions, which are responsible for providing the
stability to the structural components within a protein can be measured by force spectra. The
force spectra are a plot of the applied force and the distance and are correlated to the extraction
of individual protein from the membrane. Each curve requires a detailed analysis for measuring
the probability of unfolding for an individual structural element and the amount of unfolding
force. The individual peaks of the single force extension curves is generally fit with worm like
chain model. The force spectrum may be correlated to the actual unfolding of individual residues
in a membrane protein. F-D spectra contain information about the unfolding process and the last
peak shows the completion of the extraction procedure.
The forces that stabilize or destabilize the stable conformation include those, which are involved
in positioning the membrane protein and interactions, which stabilize the secondary structure.
However, it is known that the intra molecular forces have higher contribution as compared to the
intermolecular forces to maintain the functional and structural integrity of membrane protein
5.7.4.1 Comparison of PR unfolding pattern with BR
For PR, application of moderate force (~1nN) for 1sec for calculation of the force distance
curves indicated unfolding pattern was similar. Considering the number of amino acids that
comprise the PR sequence, the stretched polypeptide chain lengths of 88, 148 and 219 matches
with the pair wise unfolding of the helices. This strongly indicates a similar secondary structure
with transmembranous region.
In case of BR it was concluded that length and position of polypeptide chains responsible for
unfolding pattern within the BR molecule remain unaffected irrespective of the oligomeric state
of the protein. However, the mechanical stability and strength of the molecular interactions of
structural segments were dependent on BR assembly. The mechanical stability of the unfolding
pattern of the paired helices E (5th) and D (4th) was maximum and minimum for monomeric
arrangement. Amongst the members of the retinal family, the probability of transmembranous
Chapter 5-Assembly of PR : An AFM study ---------------------------------------------------------------------------------------
93 | 174
helix to unfold in a paired manner was found to be highest for BR [127].The unfolding in a
paired fashion has been reported earlier [128, 132, 134, 140].
The unfolding pattern of BR, as studied by force distance spectra in SMFS suggests that the
unfolding is very characteristic [128]. The helices G (7th) and F(6th) along with E (5th) and D (4th)
always unfold pair wise and helices B (2nd) and C (3rd) occasionally fold in sequential manner.
An average of several different unfolding spectra indicated 4 pronounced peaks in descending
order [132]. Previous studies on BR and halorhodopsin indicated a sequential mode of unfolding
of the transmembranous helices of the loops [128, 134, 135].
Figure 26 : Unfolding pattern of single PR embedded within membranes. A, Individual F-D curves each one
recorded upon unfolding a single proteorhodopsin molecule by SMFS Force -Distance curve exhibit a maximum
length of ≈70 nm. B, Superimposition of 30 F-D spectra enhances common patterns. Red curves are fits using the
worm-like-chain (WLC) model. The three main peaks detected at pulling distances correspond to stretched
polypeptide lengths of 88, 148 and 219 amino acids. These distances denote that the unfolding intermediates of PR
structure match exactly with those measured for BR.
The data was collected at Technische Universität Dresden, Center of Biotechnology in collaboration with Dr. Daniel
Muller by Adriana L. Klyszejnko and figure is an taken from [136].
Chapter 5-Assembly of PR : An AFM study ---------------------------------------------------------------------------------------
94 | 174
5.8 Comparison of BR and PR from Electron Microscopy Under native conditions BR assembles into trimers which are in turn arranged into 2D hexagonal
lattice [141]. Recrystallization of BR in presence of detergent yield 2D crystals with p22121
symmetry and show dimeric arrangement and an orthorhombic lattice[142]. BR forms highly
ordered 2D crystals naturally in the native membrane of H. salinarium. BR has trigonal lattice
(a=b=6.2 nm, γ=60 ) [141]. The retinal lies in the intra membranous cavity formed by 7 trans
membranous helices generally denoted by A to G. The main portion that protrude out of the
membrane are the loops connecting the trans-membranous A and B as well as E and F on the
cytoplasmic side and between B and C inter helical loop on the extracellular side. The latter
forms a twisted anti parallel β sheet and is more stable than the flexible EF loop [143].
In case of PR, comparison with the well resolved structure of BR, could indicate a trimeric
arrangement [4] and suggest the bigger size of the unit cell. This indicates a possibility of a
higher oligomer. The protein has a hexagonal packing as in the case of BR. However, the
resolution of 37 Å does not allow distinguishing between 3-fold or 6-fold symmetry. The
calculated size of the unit cell of 87 Å×87 Å is too large for an individual PR molecule and
supports this assumption. The protomers assemble into a ring like structure with an average
diameter of 42 Å. The formation of any ordered protein arrangements within the membrane is
driven by entropy, protein–protein or protein–lipid interactions. In case of PR, the same low-
resolution 2D crystals were obtained under a wide range of conditions, which would hint towards
dominating protein–protein interactions. It could also indicate, that PR might form protein
patches in the native membrane.
5.9 Conclusion This study provides important conclusions about the oligomeric state and the unfolding pattern
of PR in the crystalline arrangement. The major conclusions from this study are be listed as
below.
• The sample is actually a mixture of small 2D crystalline patches as well as non crystalline
but densely packed areas.
• The protein in the 2D crystalline area exhibits hexameric oligomeric state.
• The non crystalline but densely packed regions of protein are also hexamers, a small
Chapter 5-Assembly of PR : An AFM study ---------------------------------------------------------------------------------------
95 | 174
roportion shows presence of pentameric oligomeric state.
• The observed unfolding pattern was similar to the other members of the rhodopsin
family.
Figure 27 : Comparison of Projection map of PR 2D crystals with AFM micrographs. A: Projection map with one
unit cell displayed in red dotted lines. B: AFM topographs showing hexameric oligomeric state in PR 2D crystals.
Inset showing a monomers as observed with Electron Microscopy and AFM topographs.
The AFM topographs indicate that the PR exists mainly as hexamers in reconstituted as well as
in 2D crystalline state. However, a small proportion of pentamers is also observed. Unlike AFM
which can select and observe individual molecules and gives a diffraction pattern, electron
microscopy needs larger and more ordered crystalline area for detailed structural information.
Presence of different oligomeric states also suggests existence of an inherent inhomogeniety in
the reconstituted sample, which might have implications in the analysis of electron microscopy
and SSNMR data that involve sample averaging.
Chapter 5-Assembly of PR : An AFM study ---------------------------------------------------------------------------------------
96 | 174
The hint for the coexistence of the higher oligomer state was an outcome of the electron
microscopy data where the unit cell size was relatively large for a monomer. Other in house
biochemical techniques used for characterization such as gel filtration and SDS PAGE were
suggestive of only monomeric state. The oligomerization of PR but in the form of trimers is
suggested by SDS–PAGE and the broad peaks generated from size exclusion chromatography
[144].
5.10 Functional implication Stable structural segments of BR monomeric suggest appreciable contribution from the intra
molecular interactions. However, oligomerization can also contribute significantly to the
stabilization. In context to PR which is spectrally tuned to different wavelengths and has
potential of generating energy from the solar energy, the relatively high number of PR molecules
and slower photocycle suggest a dense packing. Obtaining the 2D crystals under wide range of
conditions with varying parameters indicate dominant protein-protein interactions, which
indirectly hint towards favorable oligomerization. Similar indication is also provided by presence
of huge number of PR molecules present per bacterial cell. This dense packing suggests that the
oligomerization process might be favored in nature.
The AFM topographs further show a uniform arrangement of individual PR molecules in the
hexamers as well as in pentamers. However, with the available information about PR, it is still
unclear whether PR portrays a cooperative phenomenon of photo excitation for the individual
molecules in the oligomeric state or it is specific for an individual.
Various spectroscopic studies have been carried out to gain insight into the functional aspect of
PR. Most of these studies were performed in the detergent solubilized state where the protein
exists as monomer and have shown the active functionality of the protein. If in the detergent
solubilized state, the protein is functional it means that the monomeric form of the protein is
active. However, the effect of oligomerization on the degree of activity and for what reason the
hexamers be useful, is still unknown.
Chapter 6-Solid State NMR characterization of PR 2D crystals ---------------------------------------------------------------------------------------
97 | 174
Chapter 6 : Solid State NMR characterization of PR 2D crystals
6.1 Motivation
The SSNMR studies on PR were motivated with the idea of solving the 3D structure by SSNMR.
The similarities between BR and PR, and the fact that BR is arranged in 2D arrays within the
Halobacterium salinarium membrane [93] provided additional support to the motivation.
However, information about the PR protobacterial membranes is scarce. After obtaining the
suitable 2D crystallization conditions, it was hypothesized that the 2D crystals would provide
well-resolved NMR spectra for the structural and detailed mechanistic studies by SSNMR. From
earlier work, it is known that the natural 2D crystals of BR did yield very well resolved spectra
[95]. Major benefits of applying SSNMR on PR 2D crystals are high sample concentration and
homogeneity, which have been used to study various aspects of BR e. g. surface dynamics of BR
[145], interactions between the various tryptophans [146], retinal-Schiff base photo
isomerization [147], studying the dynamics [148] to cite a few. Furthermore, crystal packing
would reduce internal molecular motions, which might interfere with coherent averaging by
magic angle sample spinning. Considering the above stated facts the SSNMR was applied on PR
2D crystals for investigation of structural information, preliminary assignments and dynamics of
PR in crystalline arrangement. The entire SSNMR data shall be discussed from application
perspective for these crystals under the following broad titles:
1. Investigation of lipids in the 2D crystalline samples with 31P measurements from the lipid
head groups.
2. Selective 15N isotopic labeling
• Lysines : Schiff Base chemical shift
• Methionines : Resolution and dynamics with HETCOR and LG-CP
• Tryptophans : Assignment with REDOR
3. Selective 13C isotopic labeling
• Cysteines
• Histidines
4. Uniform 13C labeling schemes
• 2- 13C Glycerol labeling
Chapter 6-Solid State NMR characterization of PR 2D crystals ---------------------------------------------------------------------------------------
98 | 174
• 13C Selective unlabeling
• U-13C labeling
6.2 Background
SSNMR has provided atomic-level structural constraints for biomolecules like peptides and
proteins which pose challenges for other biophysical techniques based on insolubility, molecular
weight, non crystallinity, or other biological characteristics [149]. It has emerged as a powerful
tool for resolving structural information of large molecular complexes with the aid of specific
methods such as specific labeling schemes. The complexity of the spectra increases with the
increasing molecular weight but the technological advancements such as well-designed pulses
sequences and multidimensional measurements coupled with higher field strengths aid in either
reducing the spectral overlap or increasing the spectral resolution. Recently the structure of nano
crystalline protein was determined up to atomic resolution [150]. However, this needs to be
combined with optimal sample preparation especially for membrane proteins as was
demonstrated for SH3 domain [151, 152].
The NMR spectrum in both solid and solution state result from observed interactions between the
nuclear spins in presence of an external magnetic field. The spectral resolution of solution state
NMR spectrum is solely based on the averaging of the anisotropic interactions due to the fast
tumbling of the molecules. However, this restricts the application of solution state NMR with
respect to the molecular weight of the molecules for study. SSNMR on the other hand is not
limited with restriction on the molecular weight but widely applicable to such molecules or
complexes of biological origin. SSNMR utilizes anisotropic nuclear spin interactions for
understanding of structural and functional aspects. Interactions such as chemical shift anisotropy,
quadrupolar coupling and dipole dipole coupling are exploited for quantitative information on
molecular structure, dynamics and conformation in space. This technique can be applied for
structural measurements such as determination of bond length and bond angles without the need
of crystal on amorphous and hetergenous biological samples. The additional advantage conferred
by SSNMR is the flexibility to study the molecular dynamics of the protein.
Chapter 6-Solid State NMR characterization of PR 2D crystals ---------------------------------------------------------------------------------------
99 | 174
6.3 Basic SSNMR Methods
6.3.1 Magic angle spinning (MAS)
Majority of the experiments adopt the MAS in order to remove effects of chemical shift
anisotropy and to aid suppression of dipolar coupling effects. It is known that the average of
molecular orientation dependence of the nuclear spin interaction is given by a factor of (3 cos2θ-
1), where θ is the angle between the interaction and the magnetic field. Rapid sample rotation
projects all interactions on the rotational axis and when the rotation is with respect to the
magnetic field then the interaction can be averaged out. To achieve this, the spinning axis of the
rotor is oriented at an angle of 54.74º with respect the static magnetic field B0. When the value of
θ is set to 54.74º, the average of (3 cos2θ-1) becomes 0 and the anisotropy interaction averages to
zero.
B0
Figure 28 : MAS Picture showing the orientation of the rotor with respect to the external magnetic field of strength
B0.The rotor is inclined at magic angle, which has a value of 54.7º.
6.3.2 Decoupling
For MAS experiments, the spinning speed widely used is generally below 15 kHz. This spinning
frequency is inefficient to eliminate the 13C-1H, 15N-1H and 1H-1H interactions. To eliminate this
undesired effect, the carbons or nitrogens are decoupled from protons by means of heteronuclear
decoupling. 1H-1H or homonulear decoupling can be achieved by use of special sequences such
54.7º
Chapter 6-Solid State NMR characterization of PR 2D crystals ---------------------------------------------------------------------------------------
100 | 174
as Lee Goldberg [153]. The common decoupling method is constant wave irradiation (CW),
which switches the orientation of protons faster than the NMR time scales. This results in
averaged dipolar coupling of zero. Associated with CW are the demerits of sample heating and
reduced MAS efficiency. As an improvement over this method, other decoupling methods such
as Two Pulse Phase Modulation (TPPM) and Spinal 64 have been introduced. TPPM is the most
efficient broadband decoupling method for solids which is based on 2-step phase shifting [154].
The step wise increase in the phase angle of the TPPM sequence in combination with phase
cycling proves better for solid samples and is known as small phase incremental alteration with
64 steps or Spinal 64 [155].
6.3.3 Cross polarization (CP)
CP is a technique to aid observation of the rare spin systems for biological samples. Spins of
special interest are 13C and 15N which have a low natural abundance of 1.1% and 0.37%
respectively and have less gyromagnetic ratio of γ13C= 67*106 rad/sT and γ15N= -27*106 MHz/T
respectively, but are the core building blocks of biomolecules. In contrast, the natural abundance
of 1H is 99.99% but the high gyromagnetic ratio of γ1H=267*10 6 rad/sT makes them difficult to
detect due to stronger homonuclear dipolar coupling which results in line broadening.
Observation of rare spins such as 13C directly confronts the problems of poor signal with respect
to noise and longer relaxation time. These issues are overcome by use of cross polarization
where a network of abundant spin transfers the magnetization to the rare spin. Usually 1H are
used for the sensitivity enhancement of rare spins such as 13C and 15N because of their high
natural abundance and shorter relaxation time. This polarization transfer is accomplished through
the dipolar interaction between the rare and abundant spins and is mediated by Hartmann Hahn
match, which permits the magnetization transfer when larmor frequency of the rare and the
abundant spins are exactly matched. This in turn is achieved by adjusting the applied
radiofrequency on the two spins as the gyromagnetic ratios are inherent properties.
γH B1H= γC B1C
where γ represents the gyromagnetic ratios of the two spins and B1, the applied radio frequency.
Chapter 6-Solid State NMR characterization of PR 2D crystals ---------------------------------------------------------------------------------------
101 | 174
This 1D experiment offers high sensitivity spectra for rare spins by eliminating broadening from
chemical shift anisotropy and dipolar coupling. This technique does not consider the effect of
dipolar coupling between the abundant spin system and hence decoupling is applied while the
signal from the rare spin is recorded. When coupled with MAS, the spinning should not be too
fast with respect the dipolar coupling which mediate the transfer of magnetization. The basic
pulse sequence of CP is shown below.
DECOUPLINGCP
CP
1H
X
90o
Figure 29 : The pulse sequence of cross polarization. The magnetization is induced with a 90º pulse on 1H and then
the bulk magnetization is transferred to the rare spin via Hartmann Hahn match. The 1H are decoupled while the free
induction decay of the rare spin is acquired.
6.3.4 Recoupling
It is a method to reintroduce the dipolar couplings under MAS condition. The reintroduction is
achieved with the help of rational resonance, REDOR or symmetry based pulse sequences. The
sequence is used to measure the dipolar couplings between the spins in a spin pair system. The
most practical example is the suppression of the natural abundance in a specifically labeled
amino acid. In practice, this is accomplished with the help of rotor synchronized C type
sequences (CNnv). These sequences have blocks of 360º pulses, which are applied over fixed
rotor periods with a definite phase increment [156].
Chapter 6-Solid State NMR characterization of PR 2D crystals ---------------------------------------------------------------------------------------
102 | 174
6.4 Investigation of lipids in the 2D crystalline samples with 31P measurements
from the lipid head groups
6.4.1 Motivation Lipid protein interactions are essential for successful 2D crystallization and for protein activity.
The lipids are known to provide stability to the crystal of BR and the composition of lipid and
density is shown to be variable for the cytoplasmic and extracellular sides [157]. The crystal
structure of BR at 1.55 Å resolution indicates a bilayer of 18 tightly bound lipid chains, which
forms a ring like structure around the protein in the crystal. It also indicates that the contacts
between the trimers in the membrane plane are mediated almost exclusively by lipids [158]. In
some other membrane proteins like the aquaporin where the structure is determined by electron
crystallography of 2D crystals and by X-Ray crystallography of 3D crystals, reveals presence of
nine lipids per aquaporin monomer, which adopt a wide variety of conformations and tightly fill
the space between the adjacent aquaporin tetramers [159]. In order to gain an insight into the
arrangement of the lipid and to characterize DOPC, the lipid used for crystallization for PR, was
investigated.
6.4.2 Importance of lipids Lipids, which are amphipathic in nature, form the major components of the biological
membranes. The amphipatic nature of the lipids is responsible for the structural basis of the
biomembranes and hence form an integral part of the membrane protein characterization. The
lipids typically consist of a glycerol backbone and attached to this are the 2 organic fatty acid
side chains with varying degree of unsaturation and chain length with ester bond and one
phosphate group. All lipids have 2 phases, an ordered gel phase (Lβ) and a disordered liquid
crystalline phase (Lα). The lipids are characterized by specific phase transition temperature. It is
defined as a temperature, which induces change from one phase to the other. The kind of fatty
acid side chains play an important role in the membrane protein reconstitution and
crystallization. The appropriate selection of lipid and phase appears to be very important for
crystallographic and NMR studies. E.g. the structure of the BR-trimer lipid complex suggests
complementary ways in which the lipids stabilize oligomeric rings of membrane proteins and
achieve an asymmetric distribution in biological membranes [107]. The involvement of lipids is
also known to influence certain properties in BR, such as the regulation of the pK for the purple
Chapter 6-Solid State NMR characterization of PR 2D crystals ---------------------------------------------------------------------------------------
103 | 174
to blue transition caused by deionization, and the reformation of trimers from monomers after
exposure of the purple membrane to detergent. An important role for the neutral lipid known as
squalene is found to provide the functional stability of the fast-decaying M-intermediate [102].
Study of Lipids, known as ‘lipidomics‘ constitutes a vast area for detailed investigation due to
the involvement of lipids in various aspects of structural biology. There are various techniques
used for the analysis of lipids like Chromatography (HPLC and TLC) and for separation of lipid
mixtures [160], Mass spectrometry (ESI /APCI/ MALDI) for estimation of lipid composition of
complex mixtures with negligible amount of fragmentation, FTIR for biochemical processes e.g.
hydration and conformational changes [161, 162], studies based on characteristic band position
[163], Neutron and X-Ray diffraction to determine the phospholipids structures [164] and
fluorescence by chemical modification with a flurophore. Amongst all these techniques FTIR,
diffraction [165], and florescence [166] have been shown to aid the study related to the
membrane lipid interactions. However, the modern technique, which annuls in terms of obtaining
structural information, is the 31P SSNMR.
6.4.3 Advantages of 31P for lipid investigation The phosphorous head group in the lipid molecule confers several advantages. It is NMR active
isotope with a natural abundance of 100% along with 1H and 19F and possesses high positive
gyro magnetic ratio. The sensitivity of 31P detection is next to 1H. The higher sensitivity means
detection under dilute concentration and lower field strengths. Each molecule of lipid has just
one 31P molecule hence it provides unique isotropic chemical shift. By virtue of relatively less
number of 31P nuclei, the spectra is less complicated and overlapping as compared to 1H or 13C
[167]. The chemical shift anisotropy values for 31P are also indicative of the phase of lipid and
dispersion.
6.4.4 Results and Discussion The lipids are characterized by transition temperatures and exhibit different properties and
behavior depending on the temperature of measurement. The lipid used for characterization is
DOPC and has a phase transition temperature of -24ºC. All the measurements were carried out at
280 K, which is above the DOPC main phase transition temperature. Figure 30 a shows direct
Chapter 6-Solid State NMR characterization of PR 2D crystals ---------------------------------------------------------------------------------------
104 | 174
polarized 31P spectra under proton decoupling at low spinning speed (3 kHz) where two major
resonances were observed at 3.6 ppm and −0.6 ppm. While the less shielded resonance is rather
narrow and disappears under cross polarization (figure 30 b), the peak at −0.6 ppm shows
significant line-broadening (2.5 ppm) and is surrounded by spinning sidebands indicating large
chemical shift anisotropy.
The CP spectrum of the PR 2D crystals shows increased line broadening. This increased line
width in figure 30 b can be attributed to the fast chemical exchange between protein-bound and
non-bound lipids or altered lipid dynamics within the 2D crystal. The line broadening may also
be caused due to the inhomogeneity in the sample. The narrow lipid signals in figure 30 a, found
at around 3.6 ppm do not show any significant anisotropy. These could be co-purified E.coli
lipids or lipids in residual amounts of small unilamellar vesicles.
For control measurements, a comparison with a spectrum of DOPC bilayers at the same
temperature and spinning speed was acquired. The spectra shows comparable isotropic and
anisotropic chemical shifts but reduced line-broadening (0.1 ppm) (figure 30 c). The spinning
sidebands in figure 30 c correspond to an axially symmetric CSA tensor typical for fluid lipid
bilayers. The rotational diffusion of lipids is not restricted despite the very small lipid to protein
ratio in the 2D crystalline preparation.
The 31P MAS NMR control experiments at above (280 K) and below (220 K) the main lipid
phase transition temperature (-24°C) on pure DOPC bilayers and on 2D crystal samples were
also carried out. The direct polarization as well as cross polarization spectra for both the
temperatures were comparable as shown in figure 31. In all cases, the 31P CSA was always
comparable between 2D crystals and DOPC bilayers. This also supports the hypothesis that the
lipids in the 2D crystalline arrangement behave lipid bilayers as seen in figure 31.
Chapter 6-Solid State NMR characterization of PR 2D crystals ---------------------------------------------------------------------------------------
105 | 174
Figure 30 : 31P 1D MAS spectra of PR 2D crystals and DOPC bilayers. 31P direct polarized MAS spectrum (3 kHz
spinning) of PR 2D crystals prepared in DOPC (a). The main species at −0.6 ppm shows a large CSA (CSA=33
ppm, η=0.1), while a minor population at 3.6 ppm is rather narrow and disappears under cross-polarization (b). It
could arise from other lipids copurified with PR. For comparison, DOPC lipid bilayers are shown in (c) which show
a similar axial symmetric CSA tensor (CSA=33 ppm, η=0) but reduced line width. Spectra were acquired with 40 k
scans at 162 MHz for 31P. The temperature was adjusted to 280 K to ensure a fully fluid lipid bilayer. The chemical
shift values are indicated in ppm.
6.4.5 Conclusion Since the amount of lipid used for the 2D crystallization is infinitesimal and the fact that the type
of lipid does not affect the crystallization process, it was important to know their contribution to
the overall crystalline arrangement. The likelihood of involvement of lipids in the stabilization of
the monomers by forming a tight belt around the individual monomer was high. However, from
the 31P data presented for lipids, it is highly suggestive that they behave more like lipid bilayer.
Whether DOPC forms a bound belt around PR or whether other bound lipids have been co-
Chapter 6-Solid State NMR characterization of PR 2D crystals ---------------------------------------------------------------------------------------
106 | 174
purified together with PR and contribute to the 31P signal cannot be decided at this point but is
subject to further studies.
Figure 31 : Comparison spectra of DOPC and PR 2D crystals at different temperatures. A: Cross polarization spectra
of DOPC 220 K with line broadening of 50, B: Cross polarization spectra of PR crystals at 220 K with line
broadening of 150. C: Direct polarization spectra of DOPC 280 K and line broadening of 50 and D: Direct
polarization spectra of PR 2D crystals at 280 K with line broadening of 150. The spectra were collected on 400 MHz
spectrometer with spinning speed of 3 kHz. Approx. 9000 scans were collected per spectra. The chemical shift is
indicated in ppm.
Further from AFM and EM data, it is evident that there exists an inherent inhomogeneity in the
crystalline samples, which is represented by the presence of equally dense reconstituted samples.
Chapter 6-Solid State NMR characterization of PR 2D crystals ---------------------------------------------------------------------------------------
107 | 174
It is possible that the 31P spectra are representative of the bulk lipids in the reconstituted samples
as the amount of lipids in the reconstituted region is relatively more than the crystalline region
and broad line shapes mask the resonances representing the crystalline part.
6.5 Schiff Base characterization with MAS NMR on 15N-ζ-Lys labeled PR
6.5.1 Motivation A remarkable feature observed in case of retinal proteins especially in BR is a large protein
induced shift of the absorption spectra of the chromophore, which gives them characteristic
colour. This spectral shift is referred to as opsin shift and is defined as the difference in the
energies of maximum visible absorption of the free potonated retinal Schiff base in solution and
the light adapted retinal protein complex. The opsin shift is investigated in detail with several
approaches [168-170] including SSNMR [171, 172]. This effect refers to the important
interactions between chromophore and protein. It is shown that the deionization or acidification
affects the opsin shift for BR [173, 174] and is also suggested that the change in the surface pH,
affects the chromophore.
In case of PR, the chromophore retinal is bound to the protein via a Schiff base to lysine 231 and
in context to these reports; it is highly probable that it might be involved in the similar
interactions. In order to investigate such sensitive interactions, it is important to check the proper
folding of protein and to ensure the native environment of the Schiff base. To ensure the correct
folding and functionality of the protein the 15N -ζ-Lysine CPMAS spectra were measured in 2D
crystalline samples.
6.5.2 Results and Discussion The 15N CPMAS spectra of 15N labeled lysine was measured at 280 K. Lysine is the most
conserved residue within the retinal binding pocket of proteins from the rhodopsin family. In PR,
the chromophore retinal is covalently linked via a Schiff base to lysine231. The 15N chemical
shift of this Schiff base is highly responsive to its protonation state [147] and an accurate reporter
of photocycle intermediates [175]. It has been studied extensively for photoisomerization of
retinal proteins [176].
Chapter 6-Solid State NMR characterization of PR 2D crystals ---------------------------------------------------------------------------------------
108 | 174
The spectrum in figure 32 reveals a chemical shift of 185 ppm for the protonated Schiff base and
36.6 ppm for the other lysine side chains. The Schiff base chemical shift is almost identical to
that in non-crystalline, reconstituted samples which are fully functional as reported previously
[68]. In dark-adapted BR, the PSB of the all-trans retinal resonates at 171 ppm and shows a λmax
at 568 nm which is different from PR (185 ppm and 520 nm). While the correlation between
chemical shift and λmax [177], it deviates significantly for PR indicating very strong
chromophore–opsin interactions [68, 177]. It is important to note, that Schiff base, backbone
amides and lysine side chains cross polarize in non-frozen 2D crystalline samples while low
temperatures (230 K) had to be used for the non-crystalline, reconstituted samples [68]. The line
width has improved as well from 4.5 ppm to 0.5 ppm for the lysine side chains as a result of 2D
crystallization.
For 15N assignment purposes, sample with 15N labeled lysine and 15N histidine was prepared
initially at pH 7 and the spectrum obtained is displayed in figure 33. The figure 33 A shows the
entire spectrum and gives a clear picture of the side chain resonances. The chemical shift value
for the resonance from the free lysines comes at 36.6 ppm and backbone region around 120 ppm.
However, the side chain region exhibits more than expected resonances. In all, there were five
peaks in the side chain region. The observed resonances had chemical shift values of 184.3 ppm,
178.7 ppm, 175.9 ppm, 170.4 ppm and 164.8 ppm respectively. From our earlier measurement of 15N lysine at pH 8.5, it is known that the chemical shift value for the Schiff base is about 186
ppm. In addition, from BMRB database, the standard 15N chemical shift values for histidine are
given as follows: backbone 119.59, δ1= 189.93 and δ2= 176.78. These chemical shift values are
based on solution state measurements and are likely to show deviation for the reconstituted
samples especially in crystalline environment. The possible explanation to account for additional
peaks is the co-existence of more than one conformational state at pH 7 and resonances arising
from mobile 6xHis tag. If the pH of the surrounding environment is below the pKa of proton
acceptor, which happens to be in the range of 7.1-7.6, there is a possibility of vectorality of the
proton pumping for the protein. From the structural point of view, it indicates that the protein has
heterogeneous arrangement, which gives rise to the additional peaks in the SSNMR.
Chapter 6-Solid State NMR characterization of PR 2D crystals ---------------------------------------------------------------------------------------
109 | 174
200 150 100 5015N chemical shift
SB BB
SC
Figure 32 : 15N-CP-MAS spectrum of 15N- ζ-Lysine 2D crystalline PR shows the protonated Schiff base (SB) at 185
ppm. The spectra recorded on 600 MHz at 11 K Hz spinning speed and 30 k scans were accumulated at 280 K. The
free lysine or the side chains (SC) appear at 36.6 ppm and the backbone resonance at 120 ppm. The spectra is
processed with line broadening of 25.
For improved spectral resolution, the 15N uniformly labeled samples were measured on 850 MHz
spectrometer and spectra was collected as shown in figure 33 B. The spectra shows free lysines
at 36.6 ppm and backbone resonances show better resolution. Resonances from the aromatic
region could also be seen but it was not possible to differentiate due to spectral overlap. The
most interesting region in the spectrum is shown in the inset, which compares well with the
earlier 15N lysine spectra. This is the region, where the resonances from the side chains of
histidine and lysines are expected. The region shows similarity with the multiple peaks as has
been shown in figure 33 A. The peaks at 185 and 165 ppm are relatively sharp and well defined.
The peak at 185 ppm is from the Schiff base and most likely the other peak at 165 ppm is
originating from the structured location of histidine 75. The resonances which lie in between
these two peaks are probably because of the 6xHis tag, which displays mobility and hence the
reason for the broadening of the peaks. However, this can only be confirmed with 15N spectra of
histidine75 mutant.
Chapter 6-Solid State NMR characterization of PR 2D crystals ---------------------------------------------------------------------------------------
110 | 174
1 50
15
A
N Chem ical Shift
6080100120140160180
180
40 20
160
15N Chemical Shift
100150200
B
Figure 33 : A: 15N CPMAS of lysine and histidine labeled sample at pH 7. The observed resonances appear at
purple: 184.3 ppm, red: 178.7 ppm, black: 176 ppm , grey: 170.4 ppm and blue at 164.8 ppm respectively in the side
chain region. The spectra were acquired at 280 K with 10 kHz spinning frequency and ~100 K scans were
accumulated on 400 MHz spectrometer. Line broadening of 25 is applied. B: 15N CPMAS from uniformly labeled
samples of PR 2D crystals at pH 8.5. The spectra was collected at 850 MHz Bruker spectrometer with a spinning
speed of 10 kHz and temperature of 280 K. 23 K scans were collected and line broadening of zero is applied.
6.6 15N characterization of Methionines
6.6.1 Motivation
Chapter 6-Solid State NMR characterization of PR 2D crystals ---------------------------------------------------------------------------------------
111 | 174
Magic angle sample spinning for determination of set of oriental constraints for specifically
labeled samples was used for BR. The advantage conferred is of improved resolution and
sensitivity. This approach was applied for BR for characterization of methionines where 6 out of
9 residues are located in the helical region [29]. The 15N CPMAS allowed the resolution of 7
methionines and further their assignment [95]. In case of PR, there are 10 methionines out of
which 9 are located in the helical region as shown in figure 34. This distribution of methionines
is quite similar to the arrangement in BR. It also suggests that the information so obtained will be
reflective of the behavior of helical region. On the basis of above available literature and the
feasibility of isotope labeling the 15N methionine in PR 2D crystals, methionines were
investigated.
The initial investigation aimed to observe the extent of resolution by means of CPMAS and later
to obtain a greater insight into the resolution, 2D experiments such as 2D Heteronuclear
correlation were performed. Attempts to measure helix mobility by 15N–1H dipolar couplings
using Lee–Goldberg cross-polarization were also made.
Some results of this section are published in Biochimica et Biophysica Acta 1768 (2007) 3012–
3019.
6.6.2 Approach The experiments used for characterization of Methionines were 15N CPMAS, 15N-1H
Heteronuclear experiment and 15N-1H Lee-Goldberg Cross Polarization. The basic principle of
CPMAS has been discussed before and the principle of HETCOR and LG-CP shall be discussed
in the following paragraphs.
6.6.3 15N-1H Heteronuclear experiment HETCOR experiments display spatial correlation between 2 heteronuclear species. Here in this
case it was used for 1H-15N correlation. HETCOR is a 2 dimensional experiment where 1H
evolution takes place during 1H-1H decoupling which is achieved with FSLG. This is followed
by a CP step to transfer the magnetization to 15N and further by 15N detection.
Chapter 6-Solid State NMR characterization of PR 2D crystals ---------------------------------------------------------------------------------------
112 | 174
Figure 34 : Topology model of PR showing the location of methionines in the amino acid sequence. Methionines at
positions 77, 79, 134, 140, 146, 162, 189, 190, 210 are located in the helical region. The Methionines are circled in
red.
6.6.3.1 HETCOR experimental parameters 15N-1H 2D Heteronuclear spectroscopy was performed using frequency switched Lee–Goldburg
decoupling [178] as described in [179] at an effective proton decoupling field of 85 kHz during
the evolution period and two pulse phase modulation proton decoupling at 64 kHz during the
acquisition period. 2 k scans in the ω2 dimension and 64 rows in the ω1 dimension were acquired
using time-proportional phase increments. Here 1H evolve under homonuclear 1H-1H decoupling
using FSLG and 15N detection is done by CP. The scaling factor for the ω1 dimension was
determined to be 0.57. A spinning rate of 14 kHz was used. HETCOR experiments were carried
out using a Bruker Avance 400.
6.6.4 15N-1H LG-CP experiment
The LG-CP experiment refers to 1H-15N CP measurement while 1H are decoupled from each
other during the Hartmann Hahn transfer step. By variations of the CP contact time, a 2D
spectum can be acquired, which correlates 1H-15N dipolar couplings to 15N chemical shifts and
the dipolar coupling is scaled to 0.57[178].
Chapter 6-Solid State NMR characterization of PR 2D crystals ---------------------------------------------------------------------------------------
113 | 174
Cross polarization Lee Goldberg is an example of chemical shift dipolar correlation experiment
for studying molecular dynamics. In 2D LG-CP method, the CP contact time is incremented to
produce 2D spectrum, which contains the 15N high-resolution spectrum along one spectral
dimension and corresponding 15N-1H dipolar powder pattern along the other axis. For this
measurement, a normal CP measurement is coupled with homonuclear 1H-1H decoupling
method. The effective magnetization transfer during CP is mediated via strong homo nuclear
dipolar coupling. Motionally averaged 1H-15N dipolar couplings can be used to access the
molecular dynamics at the site of 15N label in the protein. The 1H-1H interactions are largely
suppressed by applying off resonance radio frequency field that results in an effective field
pointing along an axis tilted by magic angle with respect to the direction of external magnetic
field at the same time proton carbon dipolar interaction is reintroduced via Hartmann Hahn
condition imposed on effective radiofrequency fields experienced by nuclei.
6.6.4.1 15N-1H LG-CP experimental parameters 15N chemical shift -15N–1H dipolar correlation spectra were acquired using LG-CP. The contact
time was incremented by 30 μs 128 times resulting in a t1 evolution time of 3.84 ms.
Experiments were carried out at 12 kHz sample spinning. The 15N spin-lock field was adjusted to
the first order sideband condition. Only cosine-modulated data were collected and a real Fourier
transformation was applied to the indirect dimension. To remove the dominant zero frequency
peak caused by the signal increase with increasing contact time, an exponential baseline
correction was applied prior to Fourier transformation. LG-CP experiments were carried out
using a Bruker Avance 400.
6.6.5 Results and Discussion
Nuclear spin relaxation times provide a direct and unambiguous measure of the presence of
molecular dynamics in “solid samples”. The most widely used approach is to study deuterium
NMR line shape and measure relaxation rates. Measurements of 15N-nuclear longitudinal
relaxation rates in microcrystalline sample of the protein have provided a qualitative description
of the site-specific backbone dynamics in the solid state [180]. With recent advances in SSNMR,
it became possible to obtain dynamic information on a per-residue basis using uniformly labeled
Chapter 6-Solid State NMR characterization of PR 2D crystals ---------------------------------------------------------------------------------------
114 | 174
protein samples [181]. And here we have made similar attempt to measure the protein dynamics
with 15N specifically labeled samples of methionines.
In 15N–1H HETCOR experiments as shown in figure 35 a, most peaks are found around 120 ppm
but cross-peak intensities are also seen at 123 ppm and 117.5 ppm. This data indicates that highly
ordered protein samples in 2D crystalline form in a non-frozen state provide well resolved
spectra even of side chain resonance. 9 out of 10 methionines (77, 79, 134, 140, 146, 162, 189,
190, 210) are buried inside the transmembranous region and only methionine189 is located at the
interface as shown in the topology model in figure 34. Compared to BR, these resonances did
show a similar line width of 0.7 ppm but a smaller chemical shift dispersion of (6 ppm vs. 11
ppm) [95]. Cross-polarization at 280 K is possible, which indicates restricted protein dynamics.
The LG-CP experiment has been carried out first on crystalline 15N-acetyl-leucine, where a rigid-
limit, scaled dipolar splitting of 4.7 kHz is found (figure 35 b). In PR, at 280 K, all 15N–1H
methionine dipolar couplings are smaller with variations from residue to residue (in average 3.7
kHz). This corresponds to an order parameter of 0.8. A comparison between 1D slice through the
spectra of 15N-acetyl-leucine and15N-Met labeled PR is shown in the figure 35 d and e. It has
been shown earlier that the rigid segments exhibit strong dipolar couplings and thus large
splittings in the LG-CP spectra whereas the mobile groups show diminished coupling strengths
[182]. To obtain an overall view, the same experiment was carried out on uniformly 15N labeled
PR. The spectrum obtained at 280 K figure 35 f deviates clearly from the rigid-limit case shown
in figure 35 d but also from the selectively labeled sample in figure 35 e. The spectrum in figure
35 e shows a reduction in splitting but not a significant change in line shape compared to the
rigid-limit case, while figure 35 f reveals a line shape expected.
The determination of molecular dynamics of proteins is one of the major challenges in
understanding their structure-function relationship of a membrane protein. Relationships
SSNMR spectroscopy is a powerful method for studying internal dynamics for motions typically
on the 10-2 to 10-12 s time scale. Correlation times and activation energies for specific models of
motion have been determined using this technique. Previous models have shown that internal
dynamics are very sensitive and subjective to packing in crystalline amino acids [183].
Chapter 6-Solid State NMR characterization of PR 2D crystals ---------------------------------------------------------------------------------------
115 | 174
Figure 35 : 15N–1H HETCOR experiment of 15N-Met PR reveals major intensities around 120 ppm but also at 123
and 117.5 ppm. The spectra was acquired with 1100 points in the direct dimension and 128 points in the indirect
dimension. 1096 transients were accumulated per slice and acquisition time of 49 msec was used (a). The 2D 15N–1H
LG-CP spectrum of 15N-acetyl-leucine shows a rigid-limit dipolar splitting of 4.7 kHz. The spectrum was acquired
with 684 points in the direct dimension and 128 points in the indirect dimension. 2 transients were accumulated per
slice and acquisition time of 48 msec was used (b), while the 15N-Met resonances in PR show reduced dipolar
splitting with an average value of 3.7 kHz indicating helix mobility despite 2D crystalline arrangement. The
spectrum was acquired with 684 points in the direct dimension and 128 points in the indirect dimension. 4096
transients were accumulated per slice and acquisition time of 48 msec was used. (c). A slice through the 15N-acetyl-
leucine spectrum at 130 ppm is shown in (d) and compared with 15N-Met PR at 120 ppm in (e). The LG-CP
spectrum of U–15N PR (slice taken at 120 ppm) (f) deviates significantly from (e) indicating motions in PR caused
by nonuniaxially motional averaging. Upon lowering the temperature to 220 K, the spectrum approaches a line
shape expected for the rigid-limit case (d). All spectra are acquired at a 400 MHz for 15N and 280 K except (e)
where the temperature was adjusted to 220 K. All the chemical shifts are indicated in ppm and dipolar coupling in
Hz.
Chapter 6-Solid State NMR characterization of PR 2D crystals ---------------------------------------------------------------------------------------
116 | 174
The reduced splitting observed for methionines could partially be explained by their involvement
in strong hydrogen bonds within the PR α-helices. However, must contain some motional
averaging due to small angle wobbling of these individual residues, liberation of the peptide
plane, or general fluctuations of the helices around their axis. The dependence of Lee–Goldberg
cross-polarization line shapes on molecular motions had been discussed extensively [153].
Uniaxially motional averaging would just reduce the observed dipolar splitting while non
uniaxially dipolar averaging causes alterations in the spectral line shape such as broadening and
additional wings on both sites of the spectrum.
6.6.6 Conclusions The 15N-1H HETCOR measurements show that it is possible to resolve individual methionines in
second dimension, which was not possible with 15N methionine labeled 1D spectra. The major
conclusion from the 15N-1H LG-CP measurements is the presence of helix mobility despite the
crystalline packing of the protein. The helix mobility, which is observed, in effect may be the
representation of the bulk mobility of the inherently inhomogeneous samples and is open to
further investigation.
6.7 15N Tryptophan assignments with Rotational Echo double Resonance
(REDOR)
6.7.1 Motivation
Biochemically tryptophan is highly hydrophobic residue and has potential of hydrogen bonding.
This residue has a large indole (benzopyrrole) side chain, which is comprised of two fused
aromatic rings. Due to its aromatic nature character, it can form π -π interactions. The indole ring
is considerably separated from the hydrogen bonding part of the molecule. Such a spatial
arrangement allows hydrophobic as well as hydrogen bonding interactions [184].
Membrane proteins have significantly higher content of tryptophan as compared to soluble
proteins. Within the subunits, they form hydrogen bonds with carboxyl oxygen of the main chain
and thereby conferring stability to the protein. On the surface, these are positioned to form
Chapter 6-Solid State NMR characterization of PR 2D crystals ---------------------------------------------------------------------------------------
117 | 174
hydrogen bonds with the lipid head groups. This indicates involvement of tryptophan in
anchoring of the protein subunits within the bilayer.
PR has 10 tryptophans in the entire sequence and the 15N tryptophan CPMAS spectra showed a
significant resolution of resonances as shown in the figure 38. The resonances from the side
chain as well as backbone were very well separated. Previous attempts made on 15N methionines
labeled preparations on BR [95] and recent reports on 15N tryptophan in rhodopsin [185] have
suggested the possibility of the assignment of well separated resonances with Rotational echo
double resonance. Considering the comparable resolution of 15N tryptophan spectra in PR with
the above reported assignments for BR and Rhodopsin, similar measurements were attempted.
Another reason for this attempt was to assign the tryptophan 197, which is highly conserved and
if assigned might provide an anchor point for the assignment purposes in the spectra from fully
labeled samples in multi dimensional experiments.
6.7.2 Approach
REDOR is a high-resolution SSNMR heteronuclear MAS recoupling method, which employs
MAS and CP to measure the distance between two selected labeled heteronuclei, such as 13C–15N
in the molecule or can be used for assignment purpose of a selected spin pair in a specifically
labeled sample. This method is particularly used here for recoupling of C’i-1-Ni dipolar coupling
for assignment purpose. The pulse sequence of REDOR is given in figure 36.
Using CP, the 15N magnetization is enhanced. A set of 180° pulses on 13C channel, which are
separated with the rotor rotation (as shown in figure 36) interfere with the averaging of the 13C-15N dipolar coupling by MAS. Experimentally, 2 data sets are acquired with (S) and without
dephasing (S0) in order to conpensate for the spin relaxation during recoupling. The difference
between a 15N NMR spectrum obtained with 13C π pulses and one obtained with no 13C π pulses,
measures the 13C-15N coupling. The difference signals for the 15N spectra of the sample are
comparable, but weaker than that for the carbon directly bonded to 13C [186]. These C-N
distances are generally of the order of 4-6 Å. This is of particular interest in special cases like
amide bond, where carbonyl is 13C labeled and amide has 15N label. In general, maximizing a
Chapter 6-Solid State NMR characterization of PR 2D crystals ---------------------------------------------------------------------------------------
118 | 174
REDOR difference signal for a given dipolar coupling requires selection of both pulse location
and number of rotor cycles. The signal intensity reduces for the dephased spectrum because of
incomplete refocusing and this reduction in the signal intensity is given by
∆S/S=KD2N2v2
where ∆S= (S-S0), N is the number of rotor cycles during the evolution period, v is the spinning
speed, D is the dipolar coupling constant and K is the dimensionless constant whose value is
1.066 [187]. The pulse program of the REDOR is depicted below in figure 36.
CP
CP
90o
180o 180o
180o
DECOUPLING
τR2
τR2
τR2
τR2
τR2 τR2
1H
13C
15N
lolo
Figure 36 : Pulse sequence for REDOR. 15N magnetization is prepared by a cross-polarization transfer from protons
and then evolves under proton decoupling and the influence of two 13C π pulses per rotor period. The first 13C π
pulse is placed at one-half the rotor period and the second 13C π pulse occurs at the completion of each rotor period.
A single 15N π pulse replaces the 13C π pulse in the middle of the evolution period and refocuses isotropic chemical
shifts. The 13C channel is turned on while acquiring spectrum with dephasing. The arrows indicate the no of cycles
(lo) which corresponds to 51.
Chapter 6-Solid State NMR characterization of PR 2D crystals ---------------------------------------------------------------------------------------
119 | 174
6.7.3 Results and Discussion
Tryptophans in the PR sequence are present at positions 34, 58, 74, 83, 98, 149, 159, 127, 197
and 239. Out of these, tryptophans at residue number 58, 98 and 149 are located in the loop
region and rest all are in the helical region as shown in figure 37.
Figure 37 : The topology plot of PR amino acid sequence with 10 tryptophans circled in red. The tryptophans in the
loop region are indicated with a star.
The primary requirement for assignment with REDOR, the samples need to be specifically
labeled with 13C at the carbonyl carbon of the (i-1) residue and 15N of the N-H in the amide bond
of the ith residue, which is tryptophan. With reference to the amino acid sequence, the following
unique pairs were identified and specifically labeled.
Table 8: Details of the tryptophan residues in wildtype GPR sequence.
References [1] H.R. Bigelow, D.S. Petrey, J. Liu, D. Przybylski, B. Rost, Predicting transmembrane
beta-barrels in proteomes, Nucleic Acids Res 32 (2004) 2566-2577. [2] J.L. Popot, D.M. Engelman, Membrane protein folding and oligomerization: the two-
stage model, Biochemistry 29 (1990) 4031-4037. [3] S.H. White, G. von Heijne, The machinery of membrane protein assembly, Curr Opin
Struct Biol 14 (2004) 397-404. [4] N. Grigorieff, T.A. Ceska, K.H. Downing, J.M. Baldwin, R. Henderson, Electron-
crystallographic refinement of the structure of bacteriorhodopsin, JMB 259 (1996) 393-421.
[5] Y. Kimura, D.G. Vassylyev, A. Miyazawa, A. Kidera, M. Matsushima, K. Mitsuoka, K. Murata, T. Hirai, Y. Fujiyoshi, Surface of bacteriorhodopsin revealed by high-resolution electron crystallography, Nature 389 (1997) 206-211.
[6] R. Henderson, The purple membrane from Halobacterium halobium, Annu Rev Biophys Bioeng 6 (1977) 87-109.
[7] W. Kuhlbrandt, D.N. Wang, Y. Fujiyoshi, Atomic model of plant light-harvesting complex by electron crystallography, Nature 367 (1994) 614-621.
[8] E. Nogales, S.G. Wolf, K.H. Downing, Structure of the alpha beta tubulin dimer by electron crystallography, Nature 391 (1998) 199-203.
[9] K. Murata, K. Mitsuoka, T. Hirai, T. Walz, P. Agre, J.B. Heymann, A. Engel, Y. Fujiyoshi, Structural determinants of water permeation through aquaporin-1, Nature 407 (2000) 599-605.
[10] A. Krebs, P.C. Edwards, C. Villa, J. Li, G.F. Schertler, The three-dimensional structure of bovine rhodopsin determined by electron cryomicroscopy, JBC 278 (2003) 50217-50225.
[11] A. Davies, B.E. Gowen, A.M,. Krebs, G.F. Schertler, H.R. Saibil, Three-dimensional structure of an invertebrate rhodopsin and basis for ordered alignment in the photoreceptor membrane, JMB 314 (2001) 455-463.
[12] G.F. Schertler, P.A. Hargrave, Projection structure of frog rhodopsin in two crystal forms, PNAS 92 (1995) 11578-11582.
[13] W. Kuhlbrandt, Bacteriorhodopsin--the movie, Nature 406 (2000) 569-570. [14] H. Luecke, B. Schobert, H.T. Richter, J.P. Cartailler, J.K. Lanyi, Structural changes in
bacteriorhodopsin during ion transport at 2 angstrom resolution, Science (New York, N.Y 286 (1999) 255-261.
[15] S. Subramaniam, R. Henderson, Molecular mechanism of vectorial proton translocation by bacteriorhodopsin, Nature 406 (2000) 653-657.
[16] S. Subramaniam, M. Gerstein, D. Oesterhelt, R. Henderson, Electron diffraction analysis of structural changes in the photocycle of bacteriorhodopsin, EMBO J 12 (1993) 1-8.
[17] B.G. Han, J. Vonck, R.M. Glaeser, The bacteriorhodopsin photocycle: direct structural study of two substrates of the M-intermediate, Biophys J 67 (1994) 1179-1186.
[18] N. Unwin, Acetylcholine receptor channel imaged in the open state, Nature 373 (1995) 37-43.
[19] J. Vonck, A three-dimensional difference map of the N intermediate in the bacteriorhodopsin photocycle: part of the F helix tilts in the M to N transition, Biochemistry 35 (1996) 5870-5878.
[20] K.R. Vinothkumar, S.H. Smits, W. Kuhlbrandt, pH-induced structural change in a sodium/proton antiporter from Methanococcus jannaschii, EMBO J 24 (2005) 2720-2729.
[21] J.L. Rigaud, G. Mosser, J.J. Lacapere, A. Olofsson, D. Levy, J.L. Ranck, Bio-Beads: an efficient strategy for two-dimensional crystallization of membrane proteins, J. Struct. Biol 118 (1997) 226-235.
[22] J. Rigaud, M. Chami, O. Lambert, D. Levy, J. Ranck, Use of detergents in two-dimensional crystallization of membrane proteins, Biochim Biophys Acta 1508 (2000) 112-128.
[23] G. Mosser, Two-dimensional crystallogenesis of transmembrane proteins, Micron 32 (2001) 517-540.
[24] B.K. Jap, M. Zulauf, T. Scheybani, A. Hefti, W. Baumeister, U. Aebi, A. Engel, 2D crystallization: from art to science, Ultramicroscopy 46 (1992) 45-84.
[25] T. Walz, N. Grigorieff, Electron Crystallography of Two-Dimensional Crystals of Membrane Proteins, J. Struct. Biol 121 (1998) 142-161.
[26] L.A. Amos, R. Henderson, P.N. Unwin, Three-dimensional structure determination by electron microscopy of two-dimensional crystals, Prog Biophys Mol Biol 39 (1982) 183-231.
[27] Y. Kim, K. Valentine, S.J. Opella, S.L. Schendel, W.A. Cramer, Solid-state NMR studies of the membrane-bound closed state of the colicin E1 channel domain in lipid bilayers, Protein Sci 7 (1998) 342-348.
[28] K.J. Shon, Y. Kim, L.A. Colnago, S.J. Opella, NMR studies of the structure and dynamics of membrane-bound bacteriophage Pf1 coat protein, Science (New York, N.Y 252 (1991) 1303-1305.
[29] A.J. Mason, S.L. Grage, S.K. Straus, C. Glaubitz, A. Watts, Identifying anisotropic constraints in multiply labeled bacteriorhodopsin by 15N MAOSS NMR: a general approach to structural studies of membrane proteins, Biophys J 86 (2004) 1610-1617.
[30] Y. Zhou, J.H. Morais-Cabral, A. Kaufman, R. MacKinnon, Chemistry of ion coordination and hydration revealed by a K+ channel-Fab complex at 2.0 A resolution, Nature 414 (2001) 43-48.
[31] D.C. Gadsby, Ion transport: spot the difference, Nature 427 (2004) 795-797. [32] J.L. Spudich, C.S. Yang, K.H. Jung, E.N. Spudich, Retinylidene proteins: structures and
functions from archaea to humans, Annu Rev Cell Dev Biol 16 (2000) 365-392. [33] D. Oesterhelt, W. Stoeckenius, Rhodopsin-like protein from the purple membrane of
Halobacterium halobium, Nat New Biol 233 (1971) 149-152. [34] W.D. Hoff, K.H. Jung, J.L. Spudich, Molecular mechanism of photosignaling by archaeal
sensory rhodopsins, Annu Rev Biophys Biomol Struct 26 (1997) 223-258. [35] J.K. Lanyi, Understanding structure and function in the light-driven proton pump
bacteriorhodopsin, J Struct Biol 124 (1998) 164-178. [36] M.X. Ruiz-Gonzalez, I. Marin, New insights into the evolutionary history of type 1
rhodopsins, J Mol Evol 58 (2004) 348-358. [37] O. Beja, L. Aravind, E.V. Koonin, M.T. Suzuki, A. Hadd, L.P. Nguyen, S.B. Jovanovich,
C.M. Gates, R.A. Feldman, J.L. Spudich, E.N. Spudich, E.F. DeLong, Bacterial rhodopsin: evidence for a new type of phototrophy in the sea, Science (New York, N.Y 289 (2000) 1902-1906.
[38] J.M. Baldwin, G.F. Schertler, V.M. Unger, An alpha-carbon template for the
transmembrane helices in the rhodopsin family of G-protein-coupled receptors, JMB 272 (1997) 144-164.
[39] K. Palczewski, T. Kumasaka, T. Hori, C.A. Behnke, H. Motoshima, B.A. Fox, I. Le Trong, D.C. Teller, T. Okada, R.E. Stenkamp, M. Yamamoto, M. Miyano, Crystal structure of rhodopsin: A G protein-coupled receptor, Science (New York, N.Y 289 (2000) 739-745.
[40] S.G. Rasmussen, H.J. Choi, D.M. Rosenbaum, T.S. Kobilka, F.S. Thian, P.C. Edwards, M. Burghammer, V.R. Ratnala, R. Sanishvili, R.F. Fischetti, G.F. Schertler, W.I. Weis, B.K. Kobilka, Crystal structure of the human beta2 adrenergic G-protein-coupled receptor, Nature 450 (2007) 383-387.
[41] V. Cherezov, D.M. Rosenbaum, M.A. Hanson, S.G. Rasmussen, F.S. Thian, T.S. Kobilka, H.J. Choi, P. Kuhn, W.I. Weis, B.K. Kobilka, R.C. Stevens, High-resolution crystal structure of an engineered human beta2-adrenergic G protein-coupled receptor, Science (New York, N.Y 318 (2007) 1258-1265.
[42] D.M. Rosenbaum, V. Cherezov, M.A. Hanson, S.G. Rasmussen, F.S. Thian, T.S. Kobilka, H.J. Choi, X.J. Yao, W.I. Weis, R.C. Stevens, B.K. Kobilka, GPCR engineering yields high-resolution structural insights into beta2-adrenergic receptor function, Science (New York, N.Y 318 (2007) 1266-1273.
[43] G. Sabehi, O. Beja, M.T. Suzuki, C.M. Preston, E.F. DeLong, Different SAR86 subgroups harbour divergent proteorhodopsins, Environ Microbiol 6 (2004) 903-910.
[44] D. Man-Aharonovich, G. Sabehi, O.A. Sineshchekov, E.N. Spudich, J.L. Spudich, O. Beja, Characterization of RS29, a blue-green proteorhodopsin variant from the Red Sea, Photochem Photobiol Sci 3 (2004) 459-462.
[45] J.R. de la Torre, L.M. Christianson, O. Beja, M.T. Suzuki, D.M. Karl, J. Heidelberg, E.F. DeLong, Proteorhodopsin genes are distributed among divergent marine bacterial taxa, PNAS 100 (2003) 12830-12835.
[46] G. Sabehi, R. Massana, J.P. Bielawski, M. Rosenberg, E.F. Delong, O. Beja, Novel Proteorhodopsin variants from the Mediterranean and Red Seas, Environ Microbiol 5 (2003) 842-849.
[47] J.C. Venter, K. Remington, J.F. Heidelberg, A.L. Halpern, D. Rusch, J.A. Eisen, D. Wu, I. Paulsen, K.E. Nelson, W. Nelson, D.E. Fouts, S. Levy, A.H. Knap, M.W. Lomas, K. Nealson, O. White, J. Peterson, J. Hoffman, R. Parsons, H. Baden-Tillson, C. Pfannkoch, Y.H. Rogers, H.O. Smith, Environmental genome shotgun sequencing of the Sargasso Sea, Science (New York, N.Y 304 (2004) 66-74.
[48] G. Sabehi, A. Loy, K.H. Jung, R. Partha, J.L. Spudich, T. Isaacson, J. Hirschberg, M. Wagner, O. Beja, New insights into metabolic properties of marine bacteria encoding proteorhodopsins, PLoS Biol 3 (2005) e273.
[49] N.U. Frigaard, A. Martinez, T.J. Mincer, E.F. DeLong, Proteorhodopsin lateral gene transfer between marine planktonic Bacteria and Archaea, Nature 439 (2006) 847-850.
[50] S.J. Giovannoni, L. Bibbs, J.C. Cho, M.D. Stapels, R. Desiderio, K.L. Vergin, M.S. Rappe, S. Laney, L.J. Wilhelm, H.J. Tripp, E.J. Mathur, D.F. Barofsky, Proteorhodopsin in the ubiquitous marine bacterium SAR11, Nature 438 (2005) 82-85.
[51] D. Man, W. Wang, G. Sabehi, L. Aravind, A.F. Post, R. Massana, E.N. Spudich, J.L. Spudich, O. Beja, Diversification and spectral tuning in marine proteorhodopsins, EMBO J 22 (2003) 1725-1731.
[52] L. Gomez-Consarnau, J.M. Gonzalez, M. Coll-Llado, P. Gourdon, T. Pascher, R. Neutze,
C. Pedros-Alio, J. Pinhassi, Light stimulates growth of proteorhodopsin-containing marine Flavobacteria, Nature 445 (2007) 210-213.
[53] U. Stingl, R.A. Desiderio, J.C. Cho, K.L. Vergin, S.J. Giovannoni, The SAR92 clade: an abundant coastal clade of culturable marine bacteria possessing proteorhodopsin, Appl. Envir. Micro 73 (2007) 2290-2296.
[54] A.K. Dioumaev, L.S. Brown, J. Shih, E.N. Spudich, J.L. Spudich, J.K. Lanyi, Proton transfers in the photochemical reaction cycle of proteorhodopsin, Biochemistry 41 (2002) 5348-5358.
[55] E.S. Imasheva, K. Shimono, S.P. Balashov, J.M. Wang, U. Zadok, M. Sheves, N. Kamo, J.K. Lanyi, Formation of a long-lived photoproduct with a deprotonated Schiff base in proteorhodopsin, and its enhancement by mutation of Asp227, Biochemistry 44 (2005) 10828-10838.
[56] I.C. Spyropoulos, T.D. Liakopoulos, P.G. Bagos, S.J. Hamodrakas, TMRPres2D: high quality visual representation of transmembrane protein models, Bioinformatics 20 (2004) 3258-3260.
[57] S. Shastri, J. Vonck, N. Pfleger, W. Haase, W. Kuehlbrandt, C. Glaubitz, Proteorhodopsin: Characterisation of 2D crystals by electron microscopy and solid state NMR, Biochim Biophys Acta Biomem 1768 (2007) 3012-3019.
[58] J. McCarren, E.F. DeLong, Proteorhodopsin photosystem gene clusters exhibit co-evolutionary trends and shared ancestry among diverse marine microbial phyla, Environ Microbiol 9 (2007) 846-858.
[59] O. Beja, E.N. Spudich, J.L. Spudich, M. Leclerc, E.F. DeLong, Proteorhodopsin phototrophy in the ocean, Nature 411 (2001) 786-789.
[60] G. Sabehi, B.C. Kirkup, M. Rozenberg, N. Stambler, M.F. Polz, O. Beja, Adaptation and spectral tuning in divergent marine proteorhodopsins from the eastern Mediterranean and the Sargasso Seas, The ISME journal 1 (2007) 48-55.
[61] B.J. Campbell, L.A. Waidner, M.T. Cottrell, D.L. Kirchman, Abundant proteorhodopsin genes in the North Atlantic Ocean, Environ Microbiol 10 (2008) 99-109.
[62] G.G. Kochendoerfer, S.W. Lin, T.P. Sakmar, R.A. Mathies, How color visual pigments are tuned, Trends Biochem Sci 24 (1999) 300-305.
[63] S. Subramaniam, D.A. Greenhalgh, P. Rath, K.J. Rothschild, H.G. Khorana, Replacement of leucine-93 by alanine or threonine slows down the decay of the N and O intermediates in the photocycle of bacteriorhodopsin: implications for proton uptake and 13-cis-retinal----all-trans-retinal reisomerization, PNAS 88 (1991) 6873-6877.
[64] B.R. Kelemen, M. Du, R.B. Jensen, Proteorhodopsin in living color: diversity of spectral properties within living bacterial cells, Biochim Biophys Acta 1618 (2003) 25-32.
[65] J.R. Hillebrecht, J. Galan, R. Rangarajan, L. Ramos, K. McCleary, D.E. Ward, J.A. Stuart, R.R. Birge, Structure, function, and wavelength selection in blue-absorbing proteorhodopsin, Biochemistry 45 (2006) 1579-1590.
[66] B. Scharf, B. Pevec, B. Hess, M. Engelhard, Biochemical and photochemical properties of the photophobic receptors from Halobacterium halobium and Natronobacterium pharaonis, European journal of biochemistry / FEBS 206 (1992) 359-366.
[67] T. Friedrich, S. Geibel, R. Kalmbach, I. Chizhov, K. Ataka, J. Heberle, M. Engelhard, E. Bamberg, Proteorhodopsin is a light-driven proton pump with variable vectoriality, JMB 321 (2002) 821-838.
[68] N. Pfleger, M. Lorch, A.C. Woerner, S. Shastri, C. Glaubitz, Characterisation of Schiff
base and chromophore in green proteorhodopsin by solid-state NMR, J Biomol NMR 40 (2008) 15-21.
[69] W.W. Wang, O.A. Sineshchekov, E.N. Spudich, J.L. Spudich, Spectroscopic and photochemical characterization of a deep ocean proteorhodopsin, JBC 278 (2003) 33985-33991.
[70] V. Bergo, J.J. Amsden, E.N. Spudich, J.L. Spudich, K.J. Rothschild, Structural changes in the photoactive site of proteorhodopsin during the primary photoreaction, Biochemistry 43 (2004) 9075-9083.
[71] M. Lakatos, G. Varo, The influence of water on the photochemical reaction cycle of proteorhodopsin at low and high pH, J Photochem Photobiol B 73 (2004) 177-182.
[72] M. Lakatos, J.K. Lanyi, J. Szakacs, G. Varo, The photochemical reaction cycle of proteorhodopsin at low pH, Biophys J 84 (2003) 3252-3256.
[73] G. Varo, L.S. Brown, M. Lakatos, J.K. Lanyi, Characterization of the photochemical reaction cycle of proteorhodopsin, Biophys J 84 (2003) 1202-1207.
[74] R. Huber, T. Kohler, M.O. Lenz, E. Bamberg, R. Kalmbach, M. Engelhard, J. Wachtveitl, pH-dependent photoisomerization of retinal in proteorhodopsin, Biochemistry 44 (2005) 1800-1806.
[75] R.H.B. Clayton, Spectrophotometric seawater pH measurements :total hydrogen ion concentration scale caliberation of m-cresol purple and at sea results., Deep-Sea Res. 40 (1993) 2115-2129
[76] P.C. Mowery, R.H. Lozier, Q. Chae, Y.W. Tseng, M. Taylor, W. Stoeckenius, Effect of acid pH on the absorption spectra and photoreactions of bacteriorhodopsin, Biochemistry 18 (1979) 4100-4107.
[77] S.P. Balashov, E.S. Imasheva, R. Govindjee, T.G. Ebrey, Titration of aspartate-85 in bacteriorhodopsin: what it says about chromophore isomerization and proton release, Biophys J 70 (1996) 473-481.
[78] A.K. Dioumaev, J.M. Wang, Z. Balint, G. Varo, J.K. Lanyi, Proton transport by proteorhodopsin requires that the retinal Schiff base counterion Asp-97 be anionic, Biochemistry 42 (2003) 6582-6587.
heterologous host, PNAS 104 (2007) 5590-5595. [87] A. Royant, P. Nollert, K. Edman, R. Neutze, E.M. Landau, E. Pebay-Peyroula, J.
Navarro, X-ray structure of sensory rhodopsin II at 2.1-A resolution, PNAS 98 (2001) 10131-10136.
[88] R. Rangarajan, J.F. Galan, G. Whited, R.R. Birge, Mechanism of spectral tuning in green-absorbing proteorhodopsin, Biochemistry 46 (2007) 12679-12686.
[89] Y. Mukohata, K. Ihara, T. Tamura, Y. Sugiyama, Halobacterial rhodopsins, J Biochem 125 (1999) 649-657.
[90] R.J. Dunn, N.R. Hackett, J.M. McCoy, B.H. Chao, K. Kimura, H.G. Khorana, Structure-function studies on bacteriorhodopsin. I. Expression of the bacterio-opsin gene in Escherichia coli, JBC 262 (1987) 9246-9254.
[91] I.P. Hohenfeld, A.A. Wegener, M. Engelhard, Purification of histidine tagged bacteriorhodopsin, pharaonis halorhodopsin and pharaonis sensory rhodopsin II functionally expressed in Escherichia coli, FEBS lett 442 (1999) 198-202.
[92] E.F. DeLong, C.M. Preston, T. Mincer, V. Rich, S.J. Hallam, N.U. Frigaard, A. Martinez, M.B. Sullivan, R. Edwards, B.R. Brito, S.W. Chisholm, D.M. Karl, Community genomics among stratified microbial assemblages in the ocean's interior, Science (New York, N.Y 311 (2006) 496-503.
[93] P.N. Unwin, R. Henderson, Molecular structure determination by electron microscopy of unstained crystalline specimens, JMB 94 (1975) 425-440.
[95] A.J. Mason, G.J. Turner, C. Glaubitz, Conformational heterogeneity of transmembrane residues after the Schiff base reprotonation of bacteriorhodopsin: 15N CPMAS NMR of D85N/T170C membranes, FEBS 272 (2005) 2152-2164.
[96] R. Henderson, J.M. Baldwin, T.A. Ceska, F. Zemlin, E. Beckmann, K.H. Downing, Model for the structure of bacteriorhodopsin based on high-resolution electron cryo-microscopy, JMB 213 (1990) 899-929.
[97] G.G. Prive, Detergents for the stabilization and crystallization of membrane proteins, Methods 41 (2007) 388-397.
[98] H. Michel, crystallization of memebrane proteins, Trends Biochem. Sci. 8 (1983) 3. [99] R.M. Garavito, J.P. Rosenbusch, Isolation and crystallization of bacterial porin, Methods
Enzymol 125 (1986) 309-328. [100] C. Sauter, additives for crystallization of proteins and nucleic acids J Crys Grow 196
(1999) 365-376. [101] W. Kuehlbrandt, Three dimensional crystallization of membrane protein, Quat Rev
Biophys 21 (1988) 48. [102] R.W. Hendler, S. Dracheva, Importance of lipids for bacteriorhodopsin structure,
photocycle, and function, Biochemistry (Mosc) 66 (2001) 1311-1314. [103] S. Nussberger, K. Dorr, D.N. Wang, W. Kuhlbrandt, Lipid-protein interactions in crystals
of plant light-harvesting complex, JMB 234 (1993) 347-356. [104] A.K. Mukhopadhyay, S. Dracheva, S. Bose, R.W. Hendler, Control of the integral
membrane proton pump, bacteriorhodopsin, by purple membrane lipids of Halobacterium halobium, Biochemistry 35 (1996) 9245-9252.
[105] C.D. Heyes, M.A. El-Sayed, The role of the native lipids and lattice structure in bacteriorhodopsin protein conformation and stability as studied by temperature-
dependent Fourier transform-infrared spectroscopy, JBC 277 (2002) 29437-29443. [106] M. Weik, H. Patzelt, G. Zaccai, D. Oesterhelt, Localization of glycolipids in membranes
by in vivo labeling and neutron diffraction, Mol Cell 1 (1998) 411-419. [107] L. Essen, R. Siegert, W.D. Lehmann, D. Oesterhelt, Lipid patches in membrane protein
oligomers: crystal structure of the bacteriorhodopsin-lipid complex, PNAS 95 (1998) 11673-11678.
[108] I. Schmidt-Krey, Electron crystallography of membrane proteins: two-dimensional crystallization and screening by electron microscopy, Methods (San Diego, Calif 41 (2007) 417-426.
[109] H. Liang, G. Whited, C. Nguyen, G.D. Stucky, The directed cooperative assembly of proteorhodopsin into 2D and 3D polarized arrays, PNAS 104 (2007) 8212-8217.
[110] J. Baldiwin, R. Henderson, Measurement and evaluation of electron diffraction pattern from 2 dimensional crystals., Ultramicroscopy 14 (1984) 16.
[111] O.A. Sineshchekov, K.H. Jung, J.L. Spudich, Two rhodopsins mediate phototaxis to low- and high-intensity light in Chlamydomonas reinhardtii, PNAS 99 (2002) 8689-8694.
[112] G. Metz, F. Siebert, M. Engelhard, Asp85 is the only internal aspartic acid that gets protonated in the M intermediate and the purple-to-blue transition of bacteriorhodopsin. A solid-state 13C CP-MAS NMR investigation, FEBS lett 303 (1992) 237-241.
[113] B. Aton, A.G. Doukas, R.H. Callender, B. Becher, T.G. Ebrey, Resonance Raman studies of the purple membrane, Biochemistry 16 (1977) 2995-2999.
[114] P.D. Roepe, P.L. Ahl, J. Herzfeld, J. Lugtenburg, K.J. Rothschild, Tyrosine protonation changes in bacteriorhodopsin. A Fourier transform infrared study of BR548 and its primary photoproduct, JBC 263 (1988) 5110-5117.
[115] Y. Xiao, R. Partha, R. Krebs, M. Braiman, Time-resolved FTIR spectroscopy of the photointermediates involved in fast transient H+ release by proteorhodopsin, J Phys Chem 109 (2005) 634-641.
[116] J.H. Hoh, R. Lal, S.A. John, J.P. Revel, M.F. Arnsdorf, Atomic force microscopy and dissection of gap junctions, Science (New York, N.Y 253 (1991) 1405-1408.
[117] B. Drake, C.B. Prater, A.L. Weisenhorn, S.A. Gould, T.R. Albrecht, C.F. Quate, D.S. Cannell, H.G. Hansma, P.K. Hansma, Imaging crystals, polymers, and processes in water with the atomic force microscope, Science (New York, N.Y 243 (1989) 1586-1589.
[118] H. Janovjak, A. Kedrov, D.A. Cisneros, K.T. Sapra, J. Struckmeier, D.J. Muller, Imaging and detecting molecular interactions of single transmembrane proteins, Neurobiol Aging 27 (2006) 546-561.
[119] A. Kedrov, C. Ziegler, H. Janovjak, W. Kuhlbrandt, D.J. Muller, Controlled unfolding and refolding of a single sodium-proton antiporter using atomic force microscopy, JMB 340 (2004) 1143-1152.
[120] A. Kedrov, D.J. Muller, Characterizing folding, structure, molecular interactions and ligand gated activation of single sodium/proton antiporters, Naunyn Schmiedebergs Arch Pharmacol 372 (2006) 400-412.
[121] J.P. Rossell, S. Allen, M.C. Davies, C.J. Roberts, S.J. Tendler, P.M. Williams, Electrostatic interactions observed when imaging proteins with the atomic force microscope, Ultramicroscopy 96 (2003) 37-46.
[122] D. Fotiadis, A. Engel, High-resolution imaging of bacteriorhodopsin by atomic force microscopy, Meth Mol Biol (Clifton, N.J 242 (2004) 291-303.
[123] D.J. Muller, K.T. Sapra, S. Scheuring, A. Kedrov, P.L. Frederix, D. Fotiadis, A. Engel,
Single-molecule studies of membrane proteins, Curr Opin Struct Biol 16 (2006) 489-495. [124] M. Kolbe, H. Besir, L.O. Essen, D. Oesterhelt, Structure of the light-driven chloride
pump halorhodopsin at 1.8 A resolution, Science (New York, N.Y 288 (2000) 1390-1396.
[125] H. Luecke, B. Schobert, J.K. Lanyi, E.N. Spudich, J.L. Spudich, Crystal structure of sensory rhodopsin II at 2.4 angstroms: insights into color tuning and transducer interaction, Science (New York, N.Y 293 (2001) 1499-1503.
[126] T. Haltia, E. Freire, Forces and factors that contribute to the structural stability of membrane proteins, Biochim Biophys Acta 1228 (1995) 1-27.
[127] K.T. Sapra, H. Besir, D. Oesterhelt, D.J. Muller, Characterizing molecular interactions in different bacteriorhodopsin assemblies by single-molecule force spectroscopy, JMB 355 (2006) 640-650.
[128] D.J. Muller, M. Kessler, F. Oesterhelt, C. Moller, D. Oesterhelt, H. Gaub, Stability of bacteriorhodopsin alpha-helices and loops analyzed by single-molecule force spectroscopy, Biophys J 83 (2002) 3578-3588.
[129] D. Fotiadis, Y. Liang, S. Filipek, D.A. Saperstein, A. Engel, K. Palczewski, The G protein-coupled receptor rhodopsin in the native membrane, FEBS lett 564 (2004) 281-288.
[130] D.J. Muller, D. Fotiadis, S. Scheuring, S.A. Muller, A. Engel, Electrostatically balanced subnanometer imaging of biological specimens by atomic force microscope, Biophys J 76 (1999) 1101-1111.
[131] D.J. Muller, H.J. Sass, S.A. Muller, G. Buldt, A. Engel, Surface structures of native bacteriorhodopsin depend on the molecular packing arrangement in the membrane, JMB 285 (1999) 1903-1909.
[132] F. Oesterhelt, D. Oesterhelt, M. Pfeiffer, A. Engel, H.E. Gaub, D.J. Muller, Unfolding pathways of individual bacteriorhodopsins, Science (New York, N.Y 288 (2000) 143-146.
[133] H. Janovjak, D.J. Muller, A.D. Humphris, Molecular force modulation spectroscopy revealing the dynamic response of single bacteriorhodopsins, Biophys J 88 (2005) 1423-1431.
[134] D.A. Cisneros, D. Oesterhelt, D.J. Muller, Probing origins of molecular interactions stabilizing the membrane proteins halorhodopsin and bacteriorhodopsin, Structure 13 (2005) 235-242.
[135] A. Kedrov, H. Janovjak, K.T. Sapra, D.J. Muller, Deciphering molecular interactions of native membrane proteins by single-molecule force spectroscopy, Annu Rev Biophys Biomol Struct 36 (2007) 233-260.
[136] A.L. Klyszejko, S. Shastri, S.A. Mari, H. Grubmuller, D.J. Muller, C. Glaubitz, Folding and assembly of proteorhodopsin, JMB 376 (2008) 35-41.
[137] D.M. Engelman, T.A. Steitz, The spontaneous insertion of proteins into and across membranes: the helical hairpin hypothesis, Cell 23 (1981) 411-422.
[138] M. Rief, M. Gautel, F. Oesterhelt, J.M. Fernandez, H.E. Gaub, Reversible unfolding of individual titin immunoglobulin domains by AFM, Science (New York, N.Y 276 (1997) 1109-1112.
[139] M. Carrion-Vazquez, A.F. Oberhauser, S.B. Fowler, P.E. Marszalek, S.E. Broedel, J. Clarke, J.M. Fernandez, Mechanical and chemical unfolding of a single protein: a comparison, PNAS 96 (1999) 3694-3699.
[140] H. Janovjak, M. Kessler, D. Oesterhelt, H. Gaub, D.J. Muller, Unfolding pathways of native bacteriorhodopsin depend on temperature, EMBO J 22 (2003) 5220-5229.
[141] A.E. Blaurock, W. Stoeckenius, Structure of the purple membrane, Nat New Biol 233 (1971) 152-155.
[142] H. Michel, D. Oesterhelt, R. Henderson, Orthorhombic two-dimensional crystal form of purple membrane, PNAS 77 (1980) 338-342.
[143] J.B. Heymann, D.J. Muller, E.M. Landau, J.P. Rosenbusch, E. Pebay-Peyroula, G. Buldt, A. Engel, Charting the surfaces of the purple membrane, J Struct Biol 128 (1999) 243-249.
[144] P. Gourdon, A. Alfredsson, A. Pedersen, E. Malmerberg, M. Nyblom, M. Widell, R. Berntsson, J. Pinhassi, M. Braiman, O. Hansson, N. Bonander, G. Karlsson, R. Neutze, Optimized in vitro and in vivo expression of proteorhodopsin: a seven-transmembrane proton pump, Prot Exp Puri 58 (2008) 103-113.
[145] H. Saito, Y. Kawase, A. Kira, K. Yamamoto, M. Tanio, S. Yamaguchi, S. Tuzi, A. Naito, Surface and dynamic structures of bacteriorhodopsin in a 2D crystal, a distorted or disrupted lattice, as revealed by site-directed solid-state 13C NMR, Photochem Photobiol 83 (2007) 253-262.
[146] A.T. Petkova, M. Hatanaka, C.P. Jaroniec, J.G. Hu, M. Belenky, M. Verhoeven, J. Lugtenburg, R.G. Griffin, J. Herzfeld, Tryptophan interactions in bacteriorhodopsin: a heteronuclear solid-state NMR study, Biochemistry 41 (2002) 2429-2437.
[147] M.R. Farrar, K.V. Lakshmi, S.O. Smith, R.S. Brown, J. Raap, J. Lugtenburg, R.G. Griffin, J. Herzfeld, Solid state NMR study of [epsilon-13C]Lys-bacteriorhodopsin: Schiff base photoisomerization, Biophys J 65 (1993) 310-315.
[148] H. Saito, S. Yamaguchi, H. Okuda, A. Shiraishi, S. Tuzi, Dynamic aspect of bacteriorhodopsin as a typical membrane protein as revealed by site-directed solid-state 13C NMR, Solid state nuclear magnetic resonance 25 (2004) 5-14.
[149] R. Tycko, Biomolecular solid state NMR: advances in structural methodology and applications to peptide and protein fibrils, Ann. Rev. Phys.Chem. 52 (2001) 575-606.
[150] W.T. Franks, B.J. Wylie, H.L. Schmidt, A.J. Nieuwkoop, R.M. Mayrhofer, G.J. Shah, D.T. Graesser, C.M. Rienstra, Dipole tensor-based atomic-resolution structure determination of a nanocrystalline protein by solid-state NMR, PNAS 105 (2008) 4621-4626.
[151] A. Watts, S.K. Straus, S.L. Grage, M. Kamihira, Y.H. Lam, X. Zhao, Membrane protein structure determination using solid-state NMR, Meth Mol Biol (Clifton, N.J 278 (2004) 403-473.
[152] F. Castellani, B. van Rossum, A. Diehl, M. Schubert, K. Rehbein, H. Oschkinat, Structure of a protein determined by solid-state magic-angle-spinning NMR spectroscopy, Nature 420 (2002) 98-102.
[153] M. Hong, K. Jakes, D. Huster, Investigation of molecular motions by Lee–Goldburg cross-polarizationNMRspectroscopy, J Phys Chem ,B 106 (2002) 7355–7364.
[154] A. Bennett, C.M. Reinstra, R.G. Griffin, hetronuclear decoupling in rotating solids, J Chem Phys 103 (1995) 6951.
[155] B.M. Fung, A.K. Khitrin, K. Ermolaev, An improved broadband decoupling sequence for liquid crystals and solids, JMR 142 (2000) 97-101.
[156] A. Brinkmann, M. Edén, M. Levitt, Synchronous helical pulse sequences in magic-angle spinning nuclear magnetic resonance: Double quantum recoupling of multiple-spin
systems, J Chem Phys 112 (2000) 8539-8554. [157] K. Voitchovsky, S. Antoranz Contera, M. Kamihira, A. Watts, J.F. Ryan, Differential
stiffness and lipid mobility in the leaflets of purple membranes, Biophys J 90 (2006) 2075-2085.
[158] H. Luecke, B. Schobert, H. Richter, J. Cartailler, J. Lanyi, Structure of bacteriorhodopsin at 1.55 A resolution, JMB 291 (1999) 899-911.
[159] R.K. Hite, T. Gonen, S.C. Harrison, T. Walz, Interactions of lipids with aquaporin-0 and other membrane proteins, Pflugers Arch (2007).
[160] B.L. Peterson, B.S. Cummings, A review of chromatographic methods for the assessment of phospholipids in biological samples, Biomed Chromatogr 20 (2006) 227-243.
[161] D. Amia, A. Natalelloa, G. Taylorc, G. Tononc , S.M. Doglia, Structural analysis of protein inclusion bodies by Fourier transform infrared microspectroscopy, Biochimica et Biophysica Acta (BBA) - Proteins & Proteomics 1764 (2006) 793.
[162] S.A. Tatulian, Attenuated total reflection Fourier transform infrared spectroscopy: a method of choice for studying membrane proteins and lipids, Biochemistry 42 (2003) 11898-11907.
[163] S.A. Tatulian, Toward understanding interfacial activation of secretory phospholipase A2 (PLA2): membrane surface properties and membrane-induced structural changes in the enzyme contribute synergistically to PLA2 activation, Biophys J 80 (2001) 789-800.
[164] J.F. Nagle, S. Tristram-Nagle, Structure of lipid bilayers, Biochim Biophys Acta 1469 (2000) 159-195.
[165] T. Salditt, Lipid-peptide interaction in oriented bilayers probed by interface-sensitive scattering methods, Curr Opin Struct Biol 13 (2003) 467-478.
[166] D. Marguet, P.F. Lenne, H. Rigneault, H.T. He, Dynamics in the plasma membrane: how to combine fluidity and order, EMBO J 25 (2006) 3446-3457.
[167] I.D. Campbell, C.M. Dobson, The application of high resolution nuclear magnetic resonance to biological systems, Meth Biochem Anal 25 (1979) 1-133.
[168] B. Honig, A.D. Greenberg, U. Dinur, T.G. Ebrey, Visual-pigment spectra: implications of the protonation of the retinal Schiff base, Biochemistry 15 (1976) 4593-4599.
[169] J.L. Spudich, D.A. McCain, K. Nakanishi, M. Okabe, N. Shimizu, H. Rodman, B. Honig, R.A. Bogomolni, Chromophore/protein interaction in bacterial sensory rhodopsin and bacteriorhodopsin, Biophys J 49 (1986) 479-483.
[170] S.O. Smith, I. Hornung, R. van der Steen, J.A. Pardoen, M.S. Braiman, J. Lugtenburg, R.A. Mathies, Are C14-C15 single bond isomerizations of the retinal chromophore involved in the proton-pumping mechanism of bacteriorhodopsin?, PNAS 83 (1986) 967-971.
[171] G.S. Harbison, J. Herzfeld, R.G. Griffin, Solid-state nitrogen-15 nuclear magnetic resonance study of the Schiff base in bacteriorhodopsin, Biochemistry 22 (1983) 1-4.
[172] S.O. Smith, I. Palings, V. Copie, D.P. Raleigh, J. Courtin, J.A. Pardoen, J. Lugtenburg, R.A. Mathies, R.G. Griffin, Low-temperature solid-state 13C NMR studies of the retinal chromophore in rhodopsin, Biochemistry 26 (1987) 1606-1611.
[173] Y. Kimura, A. Ikegami, W. Stoeckenius, Salt and pH-dependent changes of the purple membrane absorption spectrum, Photochem Photobiol 40 (1984) 641-646.
[174] C.H. Chang, J.G. Chen, R. Govindjee, T. Ebrey, Cation binding by bacteriorhodopsin, PNAS 82 (1985) 396-400.
[175] J. Herzfeld, J.C. Lansing, Magnetic resonance studies of the bacteriorhodopsin pump
cycle, Annu Rev Biophys Biomol Struct 31 (2002) 73-95. [176] H.J. de Groot, S.O. Smith, J. Courtin, E. van den Berg, C. Winkel, J. Lugtenburg, R.G.
Griffin, J. Herzfeld, Solid-state 13C and 15N NMR study of the low pH forms of bacteriorhodopsin, Biochemistry 29 (1990) 6873-6883.
[177] J.G. Hu, B.Q. Sun, A.T. Petkova, R.G. Griffin, J. Herzfeld, The predischarge chromophore in bacteriorhodopsin: a 15N solid-state NMR study of the L photointermediate, Biochemistry 36 (1997) 9316-9322.
[178] M. Lee, W.I. Goldburg, Nuclear magnetic resonance line naorrowing by a rotating Rf field, Phys Rev 140 (1965) 1261.
[179] B.J. Rossum, H. Förster, H.J.M. de Groot, High-field and high-speed CP-MAS13C NMR heteronuclear dipolar-correlation spectroscopy of solids with frequency-switched Lee–Goldburg homonuclear decoupling, JMR 124 (1997) 516-519.
[180] N. Giraud, A. Lesage, F. Penin, M. Blackledge, L. Emsley, Site-Specific Backbone Dynamics from a Crystalline Protein by Solid-State NMR Spectroscopy, J Am Chem Soc 126 (2004) 11423-11424.
[181] B. Reif, Y. Xue, V. Agarwal, M.S. Pavlova, M. Hologne, A. Diehl, Y.E. Ryabov, N.R. Skrynnikov, Protein side-chain dynamics observed by solution- and solid-state NMR: comparative analysis of methyl 2H relaxation data, J Am Chem Soc 128 (2006) 12354-12355.
[182] X.L. Yao, V.P. Conticello, M. Hong, Investigation of the dynamics of an elastin-mimetic polypeptide using solid-state NMR, Magn Reson Chem 42 (2004) 267-275.
[183] D.A. Torchia, Solid state NMR studies of protein internal dynamics, Ann. Rev. Biophys. Bioeng 13 (1984) 125-144.
[184] M. Schiffer, C.H. Chang, F.J. Stevens, The functions of tryptophan residues in membrane proteins, Protein engineering 5 (1992) 213-214.
[185] K. Werner, I. Lehner, H.K. Dhiman, C. Richter, C. Glaubitz, H. Schwalbe, J. Klein-Seetharaman, H.G. Khorana, Combined solid state and solution NMR studies of alpha,epsilon-15N labeled bovine rhodopsin, J Biomol NMR 37 (2007) 303-312.
[186] T. Gullion , J. Schaefer, Rotational-Echo Double-Resonance NMR, JMR 81 (1989) 196-200.
[187] S.O. Smith, O.B. Peersen, Solid-state NMR approaches for studying membrane protein structure, Annu Rev Biophys Biomol Struct 21 (1992) 25-47.
[188] R.A. Krebs, U. Alexiev, R. Partha, A.M. DeVita, M.S. Braiman, Detection of fast light-activated H+ release and M intermediate formation from proteorhodopsin, BMC physiology 2 (2002) 5.
[189] M. Hong, K. Jakes, Selective and extensive 13C labeling of a membrane protein for solid-state NMR investigations, J Biomol NMR 14 (1999) 71-74.
[190] P. Hodgkinson, L. Emsley, The accuracy of distance measurements in solid-state NMR, JMR 139 (1999) 46-59.
[191] S. Kiihne, M.A. Mehta, J.A. Stringer, D.M. Gregory, J.C. Shiels, G.P. Drobny, Distance Measurements by Dipolar Recoupling Two-Dimensional Solid-State NMR J Phys Chem A 102 (1998).
[192] M. Hong, Determination of multiple ***φ***-torsion angles in proteins by selective and extensive (13)C labeling and two-dimensional solid-state NMR, JMR 139 (1999) 389-401.
[193] Geerten W. Vuister, Soon-Jong Kim, C. Wu, A. Bax'li, 2D and 3D Nmr-Study of
Phenylalanine Residues in Proteins by Reverse Isotopic Labeling, JACS 116 (1994) 9206-9210.
[194] S.O. Smith, B.J. Bormann, Determination of helix-helix interactions in membranes by rotational resonance NMR, PNAS 92 (1995) 488-491.
[195] E. Crocker, A.B. Patel, M. Eilers, S. Jayaraman, E. Getmanova, P.J. Reeves, M. Ziliox, H.G. Khorana, M. Sheves, S.O. Smith, Dipolar assisted rotational resonance NMR of tryptophan and tyrosine in rhodopsin, J Biomol NMR 29 (2004) 11-20.
[196] K. Takegoshi, S. Nakamura, T. Terao, 13C-1H dipolar assisted rotional resonancein magic angle spinning NMR, Chem Phys Letters 344 (2001) 631-637.
[197] T.G. Oas, R.G. Grifin, M.H. Levitt, Rotatory resonance recoupling of dipolar interactions in solid state nuclear magnetic resonance, J Chem Phys 89 (1988) 692-695.
[198] C.R. Loomis, J.P. Walsh, R.M. Bell, sn-1,2-Diacylglycerol kinase of Escherichia coli. Purification, reconstitution, and partial amino- and carboxyl-terminal analysis, JBC 260 (1985) 4091-4097.
[199] W.J. van Blitterswijk, B. Houssa, Properties and functions of diacylglycerol kinases, Cellular signalling 12 (2000) 595-605.
[200] O. Vinogradova, P. Badola, L. Czerski, F.D. Sonnichsen, C.R. Sanders, 2nd, Escherichia coli diacylglycerol kinase: a case study in the application of solution NMR methods to an integral membrane protein, Biophys J 72 (1997) 2688-2701.
[201] C.A. Smith, I. Rayment, Active site comparisons highlight structural similarities between myosin and other P-loop proteins, Biophys J 70 (1996) 1590-1602.
[202] D. Schaap, J. van der Wal, W.J. van Blitterswijk, Consensus sequences for ATP-binding sites in protein kinases do not apply to diacylglycerol kinases, Biochem J 304 ( Pt 2) (1994) 661-662.
[203] F.W. Lau, J.U. Bowie, A method for assessing the stability of a membrane protein, Biochemistry 36 (1997) 5884-5892.
[204] M. Lorch, S. Fahem, C. Kaiser, I. Weber, A.J. Mason, J.U. Bowie, C. Glaubitz, How to prepare membrane proteins for solid-state NMR: A case study on the alpha-helical integral membrane protein diacylglycerol kinase from E. coli, Chembiochem 6 (2005) 1693-1700.
[205] M. Hiller, L. Krabben, K.R. Vinothkumar, F. Castellani, B.J. van Rossum, W. Kuhlbrandt, H. Oschkinat, Solid-state magic-angle spinning NMR of outer-membrane protein G from Escherichia coli, Chembiochem 6 (2005) 1679-1684.
[206] D.S. Waugh, Genetic tools for selective labeling of proteins with alpha-15N-amino acids, J Biomol NMR 8 (1996) 184-192.
[207] P. Badola, C.R. Sanders, 2nd, Escherichia coli diacylglycerol kinase is an evolutionarily optimized membrane enzyme and catalyzes direct phosphoryl transfer, JBC 272 (1997) 24176-24182.