Page 1
Characterization of Satellite Frequency Up-Converters Application Note
Products:
ı R&S®ZVA
ı R&S®FSW
ı R&S®NRP
ı R&S®SMB100A
Frequency converters e.g. in satellite transponders need to be characterized in terms of amplitude
transmission but also for phase transmission or group delay performance.
Other parameters such as phase noise, 1dB compression point, conversion gain, spurious outputs and 3rd
order intermodulation are interesting too for the quality of traditional analog as well as for modern digital
modulation schemes used for RF signal transmission systems.
Often access to the internal local oscillator is not provided.
This application note describes methods using an R&S®ZVA network analyzer, one or two R&S®SMB100A
signal generators and an R&S®FSW signal analyzer to accurately measure all the key parameters of
frequency converters with embedded local oscillator. A commercial satellite up-converter is used as a
device under test example.
Note:
Please find up to date document on our homepage http://www.rohde-schwarz.com/appnote/1MA224
App
licat
ion
Not
e
M. N
asee
f, R
. Min
ihol
d
4.
2015
– 1
MA
224_
02e
Page 2
Table of Contents
1MA224_02e Rohde & Schwarz Characterization of Satellite Frequency Up-Converters
2
Table of Contents
1 Abstract ............................................................................................... 4
2 Theoretical Background ..................................................................... 6
2.1.1 Group Delay Measurements .......................................................................................... 6
2.1.2 Two tone method using the ZVA ................................................................................... 8
2.2 Harmonics and Intermodulation ................................................................................. 9
2.2.1 Harmonic signals .........................................................................................................10
2.2.2 Intermodulation as a result of harmonic signals ..........................................................10
2.2.3 Characterizing IMD ......................................................................................................12
2.3 Conversion loss measurements ..............................................................................13
2.4 Phase Noise ................................................................................................................14
2.5 Noise power density ..................................................................................................15
2.6 Single sideband noise ...............................................................................................15
2.7 Compression Point ....................................................................................................16
2.8 Unwanted Emissions .................................................................................................17
3 Measurement Setup for Measurements on a Satellite Up-converter
using the ZVA .................................................................................... 19
4 Satellite Up-Converter Measurements ............................................ 22
4.1 LO frequency offset correction for Frequency Converters under test without
access to the time base ............................................................................................22
4.2 Group Delay measurement on Satellite Up-Converters with the ZVA ..................24
4.2.1 Instrument Settings ......................................................................................................24
4.3 Calibration ..................................................................................................................26
4.3.1 Power Calibration.........................................................................................................26
4.3.2 Mixer Delay Calibration ................................................................................................29
4.4 Group Delay Measurement and Results ..................................................................32
4.5 Extracting Linear, Parabolic and Ripple Group Delay by MATLAB ......................33
4.5.1 MATLAB code for group delay and corresponding plots: ............................................34
4.6 Conversion Gain Measurement ................................................................................38
4.7 Intermodulation measurements using the ZVA ......................................................39
4.7.1 Measurement Results ..................................................................................................41
4.8 1 dB-Compression point measurement with the ZVA............................................43
4.9 Intermodulation test setup using the Signal and Spectrum Analyzer FSW and two
Signal Generators SMB .............................................................................................45
4.10 Phase Noise measurement using FSW ...................................................................47
Page 3
Table of Contents
1MA224_02e Rohde & Schwarz Characterization of Satellite Frequency Up-Converters
3
4.11 Spurious Outputs Measurements ............................................................................50
5 Literature ........................................................................................... 54
6 Ordering information ........................................................................ 55
Page 4
Abstract
1MA224_02e Rohde & Schwarz Characterization of Satellite Frequency Up-Converters
4
1 Abstract
Frequency converters which use one or more mixers are fundamental for any
communication- or electronic ranging system to down-convert an RF signal to IF or
baseband or to up-convert a baseband or IF signal to RF. They include filters, normally
selective band pass filters, to get rid of strong adjacent channel signals, local oscillator
feed-through, image responses and other mixing products. For not to degrade
transmission quality of a communication system these filters must have well -controlled
amplitude, phase and group-delay responses. Especially phase- and group-delay
linearity is essential for low bit error rates of communication systems or high target
resolution for radar systems. In order to characterize a frequency converter, a key
characteristic is the relative and/or absolute group delay. In addition intermodulation
products (3rd order), phase noise, 1dB compression point, conversion gain and
spurious outputs are also interesting parameters to consider for measurement.
Relative phase and group delay can be measured using the so-called reference or
golden mixer technique, as long as the local oscillator is accessible. However, due to
increasing integration and miniaturization often neither the local oscillator (LO) nor a
common reference frequency signal is accessible.
This application note describes a new technique for measurements on frequency
converters with an embedded LO source and without direct access to a common
reference signal. Central to this new technique is that the device under test (DUT) is
stimulated with a two-tone signal.
Treated first are measurements using an R&S®ZVA vector network analyzer. By
measuring phase differences between the two signals at the input and the output the
analyzer calculates the phase transfer function and in a further step, the various
components of group delay of the DUT.
It is shown that measurement accuracy does not depend on the DUT's embedded LO
frequency stability as long as that deviation is within the measurement bandwidth of
the analyzer's receiver.
The test and measurement procedures described include group delay measurements,
Intermodulation product- (3rd order), 1dB compression point- and, conversion gain-
measurements.
In addition, a detailed description of test and measurement procedures for
Intermodulation product- (3rd order), phase noise-and spurious outputs using one or
two R&S® SMB as a stimulating signal and an FSW Signal and Spectrum analyzer is
included in this application note.
A commercial satellite up-converter from Work Microwave company type SCU-
C70/140 -50 which up-converts an IF signal of 70/140 MHz to the L-band 5.85 to 6.45
GHz is used as an example device under test for the described measurements in this
application note. All the measurements are carried out at 5.98 GHz output frequency
and a conversion gain of 15 dB.
Page 5
Abstract
1MA224_02e Rohde & Schwarz Characterization of Satellite Frequency Up-Converters
5
Fig. 1-1: LO-Band satellite up-converter from Work Micowave company as device under test
characterized by R&S®ZVA40 Vector Network analyzer
The following abbreviations are used in this Application Note for Rohde & Schwarz test
equipment:
The R&S®ZVA vector network analyzer is referred to as the ZVA
The R&S®FSW signal and spectrum analyzer is referred to as the FSW.
The R&S®SMB100A signal generator is referred to as the SMB
The R&S®NRP-Z21/Z11 three-path power sensor is referred to as the NRP-Z21/Z11
Page 6
Theoretical Background
1MA224_02e Rohde & Schwarz Characterization of Satellite Frequency Up-Converters
6
2 Theoretical Background
2.1.1 Group Delay Measurements
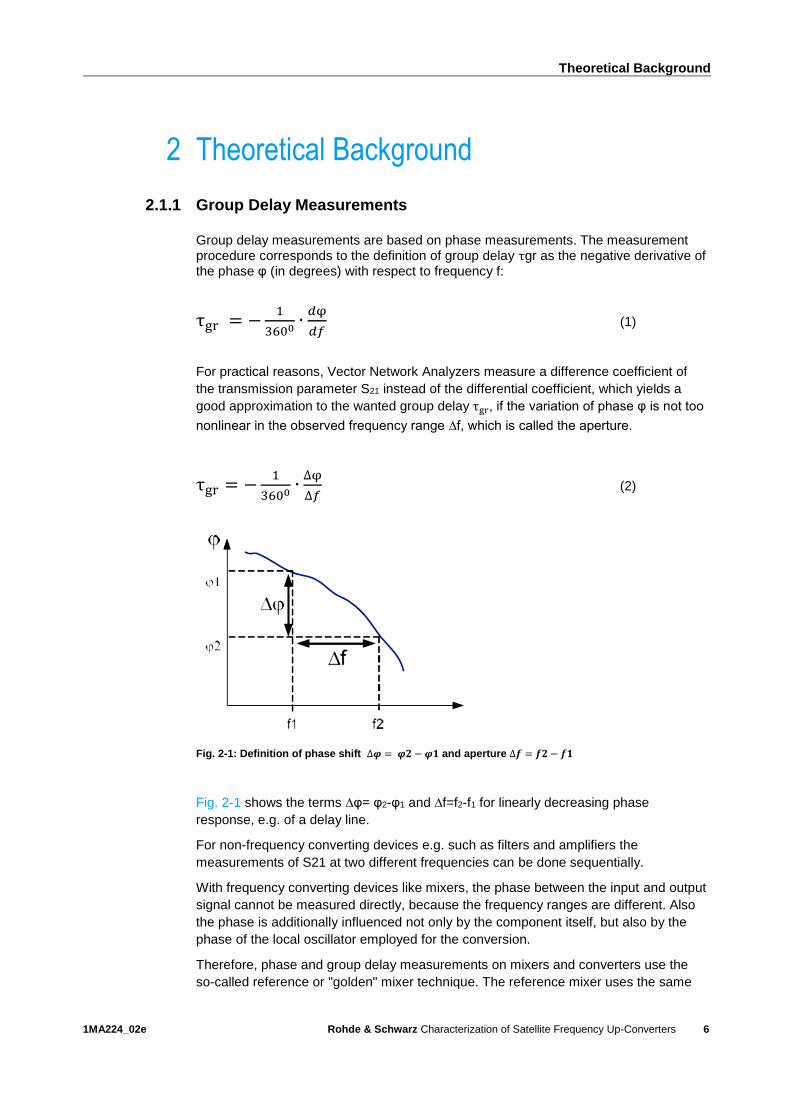
Group delay measurements are based on phase measurements. The measurement procedure corresponds to the definition of group delay τgr as the negative derivative of the phase φ (in degrees) with respect to frequency f:
τgr = −1
3600∙
𝑑φ
𝑑𝑓 (1)
For practical reasons, Vector Network Analyzers measure a difference coefficient of
the transmission parameter S21 instead of the differential coefficient, which yields a
good approximation to the wanted group delay τgr, if the variation of phase φ is not too
nonlinear in the observed frequency range ∆f, which is called the aperture.
τgr = −1
3600∙
∆φ
∆𝑓 (2)
Fig. 2-1: Definition of phase shift ∆𝝋 = 𝝋𝟐 − 𝝋𝟏 and aperture ∆𝒇 = 𝒇𝟐 − 𝒇𝟏
Fig. 2-1 shows the terms ∆φ= φ2-φ1 and ∆f=f2-f1 for linearly decreasing phase
response, e.g. of a delay line.
For non-frequency converting devices e.g. such as filters and amplifiers the
measurements of S21 at two different frequencies can be done sequentially.
With frequency converting devices like mixers, the phase between the input and output
signal cannot be measured directly, because the frequency ranges are different. Also
the phase is additionally influenced not only by the component itself, but also by the
phase of the local oscillator employed for the conversion.
Therefore, phase and group delay measurements on mixers and converters use the
so-called reference or "golden" mixer technique. The reference mixer uses the same
Page 7
Theoretical Background
1MA224_02e Rohde & Schwarz Characterization of Satellite Frequency Up-Converters
7
local oscillator as the device under test to re-convert either the RF or IF signal in order
to get identical frequencies at the reference and measurement receivers of the Vector
Network Analyzer (VNA).
The technique is designed to reduce the effect of LO phase instabilities.
Fig. 2-2: Block diagram of conventional test setup for mixer/converter phase and group delay
measurement using a reference mixer
This measurement delivers phase and group delay relative to a golden mixer that was
measured for calibration instead of the mixer under test (MUT). The measurement
result of the MUT shows the phase and group delay difference with respect to this
golden mixer. Typically, the golden mixer is assumed to be ideal.
Normally a MUT like e.g. a satellite up- or down converter has one or more internal
filters in its signal path which have considerable group delay. Therefore it can be
assumed that:
group delay(MUT)>>group delay(ref mixer)
If the LO of the device under test is not accessible, group delay measurements with a
reference mixer are not possible. AM or FM modulated stimulus signals may be used
as an alternative. Other methods try to reconstruct the LO. They use an external signal
generator as LO for the reference mixer and aim to tune the generator frequency until
the phase drift versus time of the IF is minimized.
These techniques have limitations in terms of dynamic range, measurement accuracy,
and throughput. In addition, internal local oscillators of the device under test often are
not very stable, which makes it hard for the external generator to follow or "track" the
inaccessible LO.
Page 8
Theoretical Background
1MA224_02e Rohde & Schwarz Characterization of Satellite Frequency Up-Converters
8
The R&S ZVA offers a different approach, which overcomes problems of the more
traditional techniques outlined above.
2.1.2 Two tone method using the ZVA
The measurement of Group Delay of converters without access to the internal LO, and
without access to a common reference frequency signal means a challenge to the test
equipment: Typically the internal LO shows an offset, is drifting versus time, and its
unknown phase impacts the group delay. Option ZVA-K9 provides a rugged and
reliable solution to overcome this problem: Based on the ZVA/ZVTs unique dual digital
frontend, the phase difference of a two tone signal is measured before and after the
DUT. This allows directly to calculate the group delay, As any drift of the internal LO
signal or phase noise affects both carriers, it is simple cancelled out. Thus the drift of
the internal LO can be up to the width of the selected IFBW of ZVA, typically 1 kHz or
10 kHz.
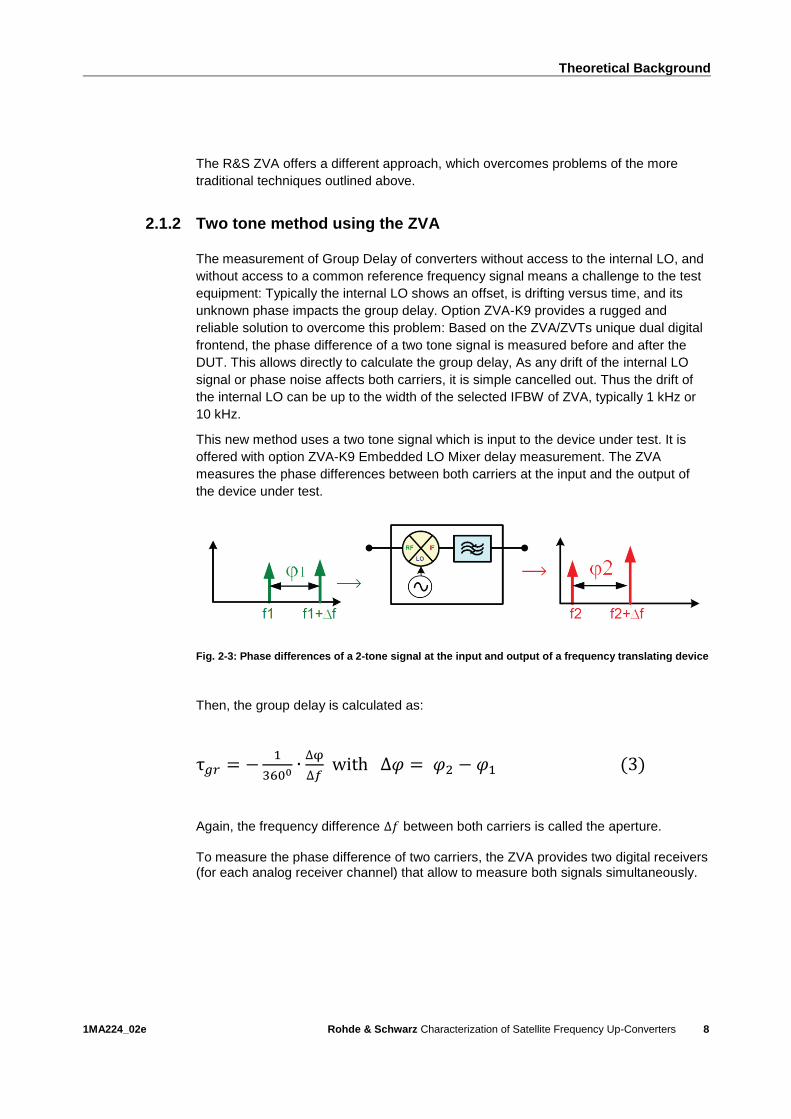
This new method uses a two tone signal which is input to the device under test. It is
offered with option ZVA-K9 Embedded LO Mixer delay measurement. The ZVA
measures the phase differences between both carriers at the input and the output of
the device under test.
Fig. 2-3: Phase differences of a 2-tone signal at the input and output of a frequency translating device
Then, the group delay is calculated as:
τ𝑔𝑟 = −1
3600∙
∆φ
∆𝑓 with ∆𝜑 = 𝜑2 − 𝜑1 (3)
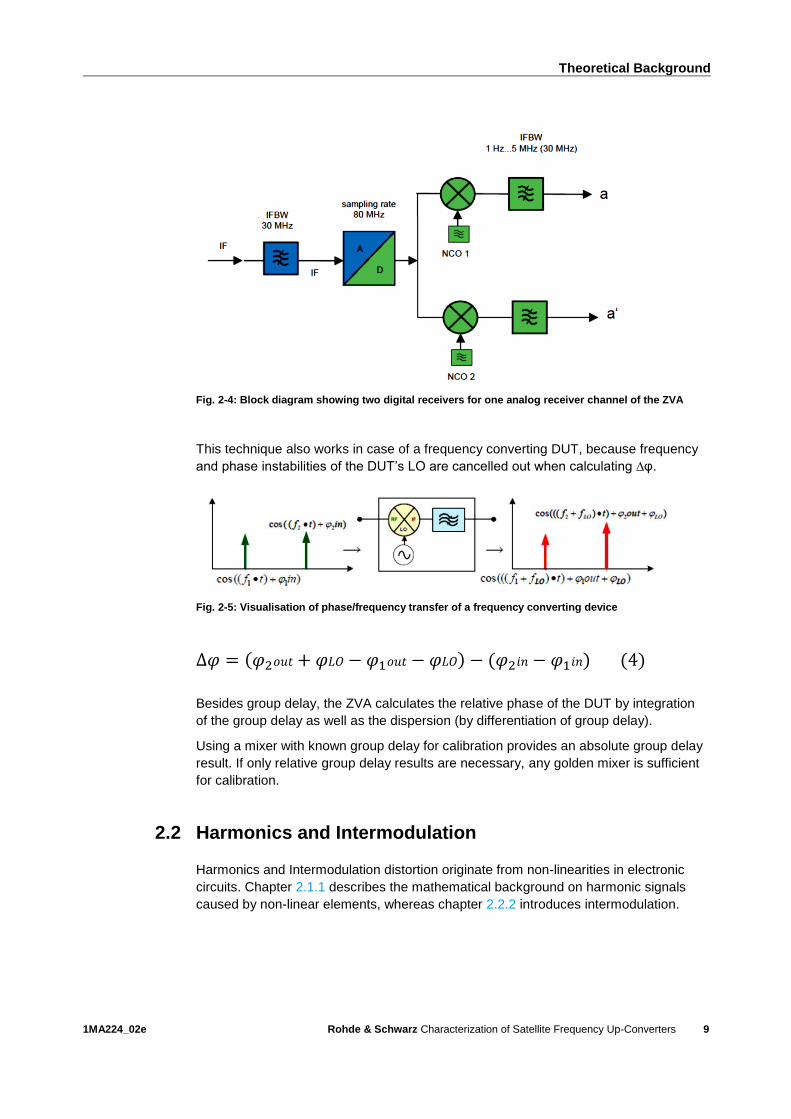
Again, the frequency difference ∆𝑓 between both carriers is called the aperture. To measure the phase difference of two carriers, the ZVA provides two digital receivers (for each analog receiver channel) that allow to measure both signals simultaneously.
Page 9
Theoretical Background
1MA224_02e Rohde & Schwarz Characterization of Satellite Frequency Up-Converters
9
Fig. 2-4: Block diagram showing two digital receivers for one analog receiver channel of the ZVA
This technique also works in case of a frequency converting DUT, because frequency
and phase instabilities of the DUT’s LO are cancelled out when calculating ∆φ.
Fig. 2-5: Visualisation of phase/frequency transfer of a frequency converting device
∆𝜑 = (𝜑2𝑜𝑢𝑡 + 𝜑𝐿𝑂 − 𝜑1𝑜𝑢𝑡 − 𝜑𝐿𝑂) − (𝜑2𝑖𝑛 − 𝜑1𝑖𝑛) (4)
Besides group delay, the ZVA calculates the relative phase of the DUT by integration
of the group delay as well as the dispersion (by differentiation of group delay).
Using a mixer with known group delay for calibration provides an absolute group delay
result. If only relative group delay results are necessary, any golden mixer is sufficient
for calibration.
2.2 Harmonics and Intermodulation
Harmonics and Intermodulation distortion originate from non-linearities in electronic
circuits. Chapter 2.1.1 describes the mathematical background on harmonic signals
caused by non-linear elements, whereas chapter 2.2.2 introduces intermodulation.
Page 10
Theoretical Background
1MA224_02e Rohde & Schwarz Characterization of Satellite Frequency Up-Converters
10
2.2.1 Harmonic signals
This section will show the basic equations for harmonics created in a single tone
scenario.
Given the case that a single CW tone is applied to a non-linear element, additional
signals, the so-called harmonics, will be generated at n times of the original frequency,
with n being the order of the harmonic.
Any non-linear element can be described by a Taylor-series:
3
3
2
210 sasasaasP.
(5)
with P(s) being its transfer function and s being the input signal. We will not look in
detail on the factors an, but focus on the powers of s.
Assuming a CW input signal without DC component, the general formula for a signal s
as a function of time t is:
tfBts 2cos.
(6)
Using the addition theorem for the cosine function, it is straight forward to figure out
that the square term in Eq. (5) creates a signal with twice the original frequency (the
second harmonic), the cube term the third harmonic and so on.
For a more in-depth look, please refer to Rohde & Schwarz Application Note 1EF78.
2.2.2 Intermodulation as a result of harmonic signals
Clearly, harmonics of a single tone are outside the usable band of an application, since
they are at multiples of the original frequency. Once a second tone joins the input
signal at a small frequency offset – the resulting output signal looks different. In
contrast to the single tone scenario above, the signal s is now:
222111 2cos2cos tfBtfBts.
(7)
Since the dominating intermodulation products typically are third order products, the
following equations focus only on those. Calculating the third power terms (responsible
for the third order intermodulation and third order harmonics) of the Taylor series (Eq.
1) with the two tone input signal from Eq. 3 yields the following result:
22
2
11
2
21
2211
2
2
2
1
22
33
2
11
33
1
3
2cos2cos3
2cos2cos3
2cos
2cos)(
tftfBB
tftfBB
tfB
tfBts
(8)
The first two lines describe the third order harmonics for each of the input tones
(cos3-terms), whereas lines 3 and 4 represent the third order intermodulation terms
(mixed terms). From the above equation, the third order intermodulation (TOI)
frequencies can be derived using the addition theorem (for trigonometric functions) as;
Page 11
Theoretical Background
1MA224_02e Rohde & Schwarz Characterization of Satellite Frequency Up-Converters
11
12TOI2
211TOI
2
2
fff
fff
.
(9)
While the 3rd order harmonics (3*f1 and 3*f1) of the individual input tones can be easily
suppressed by a low-pass filter, the third order intermodulation terms are often more
critical for the application. The resulting frequencies are often in-band for a given
application and therefore interfere with the wanted signal. Additionally, under the
assumption B1 = B2, i.e. both tones have the same level, the intermodulation terms
exceed the harmonic terms by a factor of 3 in amplitude (Eq. 8); i.e. 9.54 dB difference
between the third order harmonics of the individual tones and the third order
intermodulation products.
Page 12
Theoretical Background
1MA224_02e Rohde & Schwarz Characterization of Satellite Frequency Up-Converters
12
2.2.3 Characterizing IMD
There are a number of ways to visualize intermodulation distortion. Fortunately, the
measurement method is identical and the results can be converted.
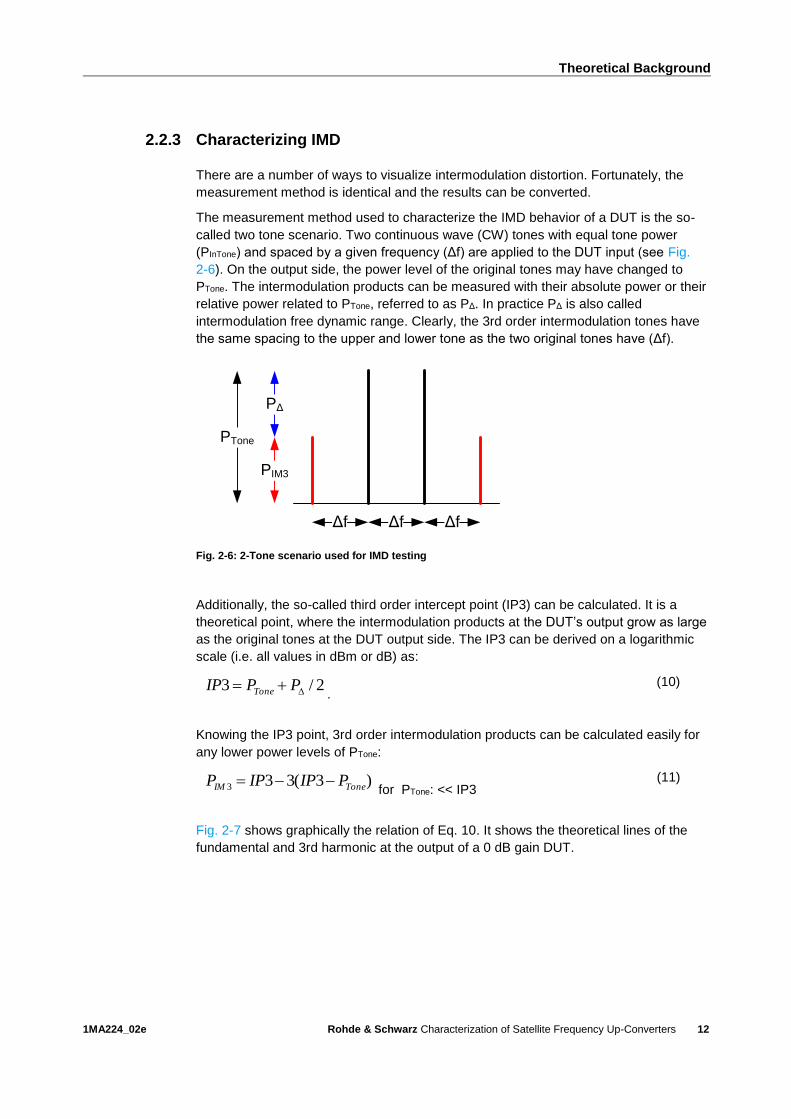
The measurement method used to characterize the IMD behavior of a DUT is the so-
called two tone scenario. Two continuous wave (CW) tones with equal tone power
(PInTone) and spaced by a given frequency (Δf) are applied to the DUT input (see Fig.
2-6). On the output side, the power level of the original tones may have changed to
PTone. The intermodulation products can be measured with their absolute power or their
relative power related to PTone, referred to as PΔ. In practice PΔ is also called
intermodulation free dynamic range. Clearly, the 3rd order intermodulation tones have
the same spacing to the upper and lower tone as the two original tones have (Δf).
ΔfΔf Δf
PIM3
PTone
PΔ
Fig. 2-6: 2-Tone scenario used for IMD testing
Additionally, the so-called third order intercept point (IP3) can be calculated. It is a
theoretical point, where the intermodulation products at the DUT’s output grow as large
as the original tones at the DUT output side. The IP3 can be derived on a logarithmic
scale (i.e. all values in dBm or dB) as:
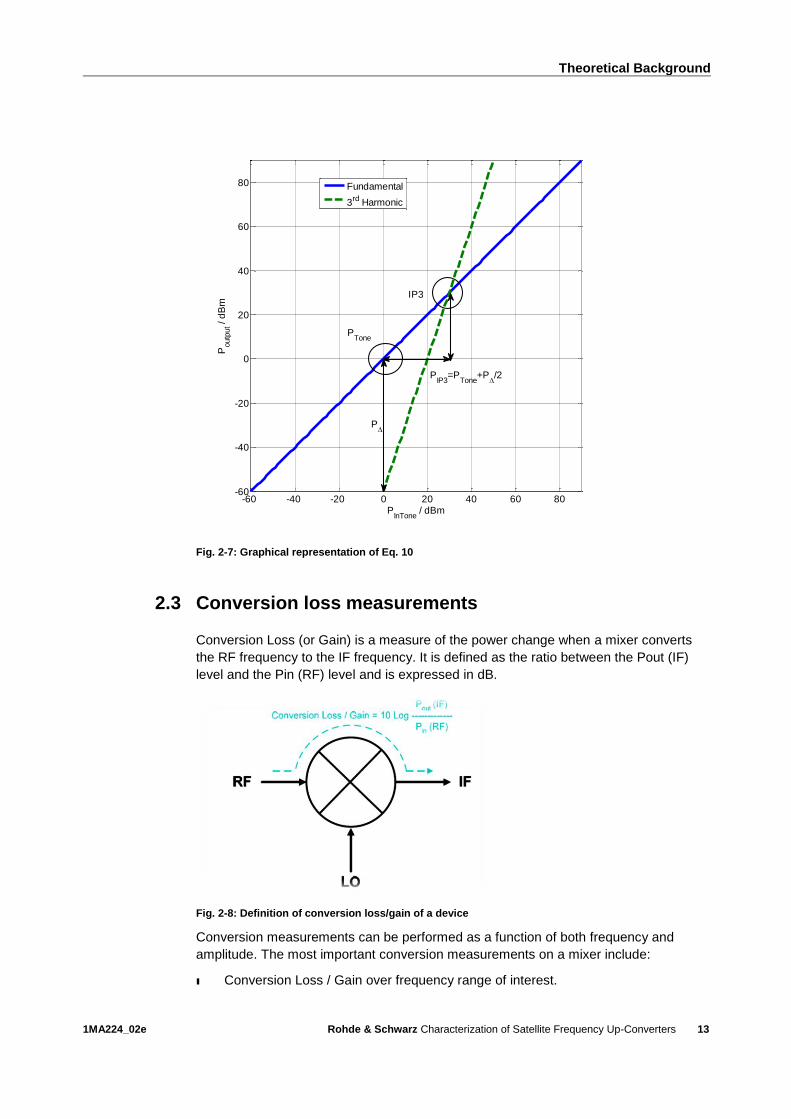
2/3 PPIP Tone . (10)
Knowing the IP3 point, 3rd order intermodulation products can be calculated easily for
any lower power levels of PTone:
)3(333 ToneIM PIPIPP for PTone: << IP3
(11)
Fig. 2-7 shows graphically the relation of Eq. 10. It shows the theoretical lines of the
fundamental and 3rd harmonic at the output of a 0 dB gain DUT.
Page 13
Theoretical Background
1MA224_02e Rohde & Schwarz Characterization of Satellite Frequency Up-Converters
13
Fig. 2-7: Graphical representation of Eq. 10
2.3 Conversion loss measurements
Conversion Loss (or Gain) is a measure of the power change when a mixer converts
the RF frequency to the IF frequency. It is defined as the ratio between the Pout (IF)
level and the Pin (RF) level and is expressed in dB.
Fig. 2-8: Definition of conversion loss/gain of a device
Conversion measurements can be performed as a function of both frequency and
amplitude. The most important conversion measurements on a mixer include:
ı Conversion Loss / Gain over frequency range of interest.
-60 -40 -20 0 20 40 60 80-60
-40
-20
0
20
40
60
80
PInTone
/ dBm
Poutp
ut /
dB
m
Fundamental
3rd
Harmonic
P
PIP3
=PTone
+P/2
PTone
IP3
Page 14
Theoretical Background
1MA224_02e Rohde & Schwarz Characterization of Satellite Frequency Up-Converters
14
ı Mixer dynamic range / compression of the RF input signal.
ı Conversion Loss / Gain as a function of LO power level.
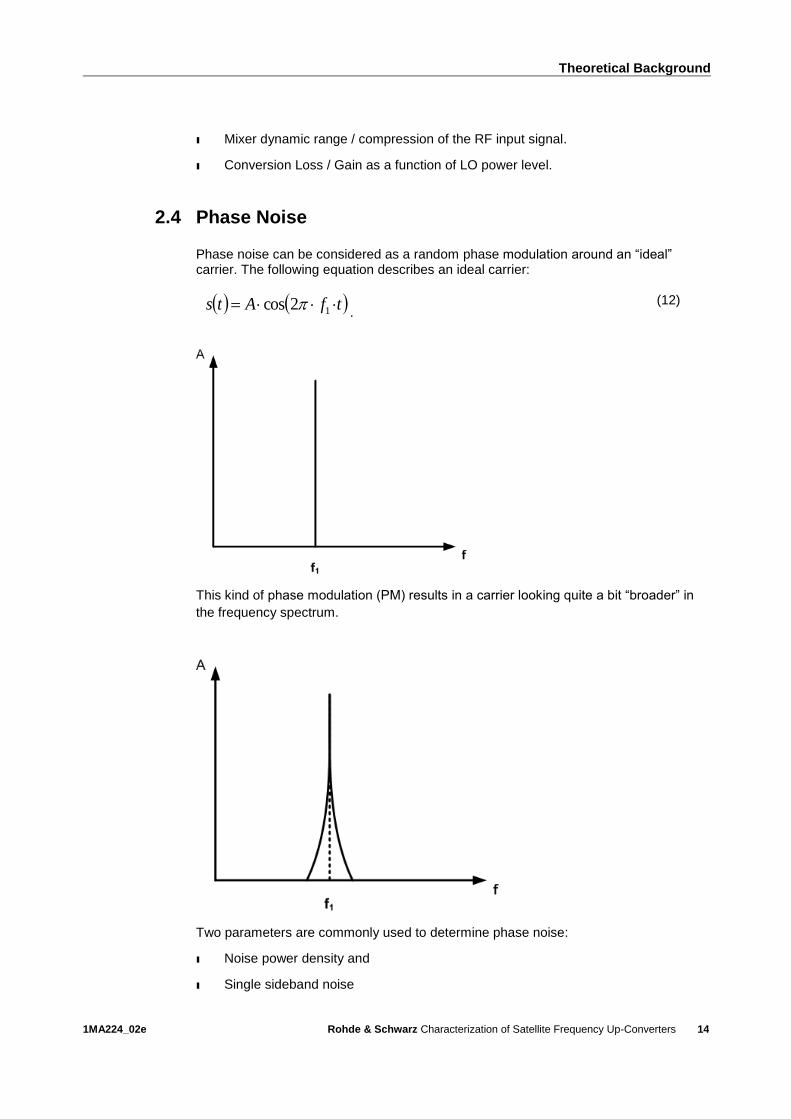
2.4 Phase Noise
Phase noise can be considered as a random phase modulation around an “ideal” carrier. The following equation describes an ideal carrier:
tfAts 12cos .
(12)
This kind of phase modulation (PM) results in a carrier looking quite a bit “broader” in
the frequency spectrum.
Two parameters are commonly used to determine phase noise:
ı Noise power density and
ı Single sideband noise
Page 15
Theoretical Background
1MA224_02e Rohde & Schwarz Characterization of Satellite Frequency Up-Converters
15
2.5 Noise power density
One measure of phase noise is the one-sided noise power density of the phase
fluctuations rms with reference to 1 Hertz bandwidth:
Hz
radfS
rms22
1)(
(13)
2.6 Single sideband noise
In practice, single sideband (SSB) phase noise L is usually used to describe an oscilla-
tor's phase-noise characteristics. L is defined as the ratio of the noise power in one
sideband (measured over a bandwidth of 1 Hz) PSSB to the signal power Pcarrier at a
frequency offset fm from the carrier.
Carrier
SSBm
P
HzPfL
1)(
(14)
If the modulation sidebands are very small due to noise, i.e. if phase deviation is much
smaller than 1 rad, the SSB phase noise can be derived from the noise power density:
)(2
1)( mm fSfL
(15)
The SSB phase noise is commonly specified on a logarithmic scale [dBc / Hz]:
))((log10)( mmc fLfL
(16)
Page 16
Theoretical Background
1MA224_02e Rohde & Schwarz Characterization of Satellite Frequency Up-Converters
16
2.7 Compression Point
The output power of an amplifier typically exhibits a linear correspondence to the input
power as it changes (Fig. 2-9): the gain, i.e. the ratio or quotient of output power to
input power remains constant over the linear range.
Fig. 2-9: Definition of the 1 dB compression point at the amplifier input and the amplifier output
If the input signal level is successively raised above a certain point, the output power is
no longer linear proportional to the input power. Typically this deviation increases the
closer output level comes to the amplifier's maximum output power: the amplifier
compresses. The 1 dB compression point specifies the output power of an amplifier at
which the output signal lags behind the expected/wanted output signal by 1 dB.
An alternative representation of amplifier compression characteristics is shown in Fig.
2-10, where gain is plotted versus output power. Less common is a plot of gain versus
input level.
Page 17
Theoretical Background
1MA224_02e Rohde & Schwarz Characterization of Satellite Frequency Up-Converters
17
Fig. 2-10: Gain versus output power of the 1 dB compression point at the amplifier output
A linear gain, i.e. a gain as observed at a sufficiently low driving signal, would yield the
expected/wanted output signal. The difference of the expected output signal level to
the output signal level as observed, can be at least qualitatively be explained by the
over-proportional rise in harmonic output signal components towards high input level.
Harmonics may not be the only mechanism at play, but in order to prevent the power of
harmonic signal content from corrupting the measurement result of the wanted
components, the output power needs to be selectively measured.
2.8 Unwanted Emissions
An ideal transmitter emits its signal only on the operating frequency in use and
nowhere else. However, in reality, all transmitters emit undesired signals, known as
"unwanted emissions", in their output spectrum. For the purpose of this paper, it can be
said that unwanted emissions are typically measured at the RF output port.
A "spurious emission" can be defined as any signal produced by equipment that falls
outside of the band in which the equipment is meant to be operating (wanted band).
Spurious emissions are caused by unwanted side effects such as harmonic emissions,
parasitic emissions, intermodulation products and frequency conversion products, but
exclude the so-called out-of-band emissions.
"Out-of-Band emission" describes emissions of unwanted signals immediately outside
adjacent to the wanted channel bandwidth, but also not overlapping the range of bands
defined for spurious emissions.
Out of band emissions result from the modulation process and non-linearity.
Page 18
Theoretical Background
1MA224_02e Rohde & Schwarz Characterization of Satellite Frequency Up-Converters
18
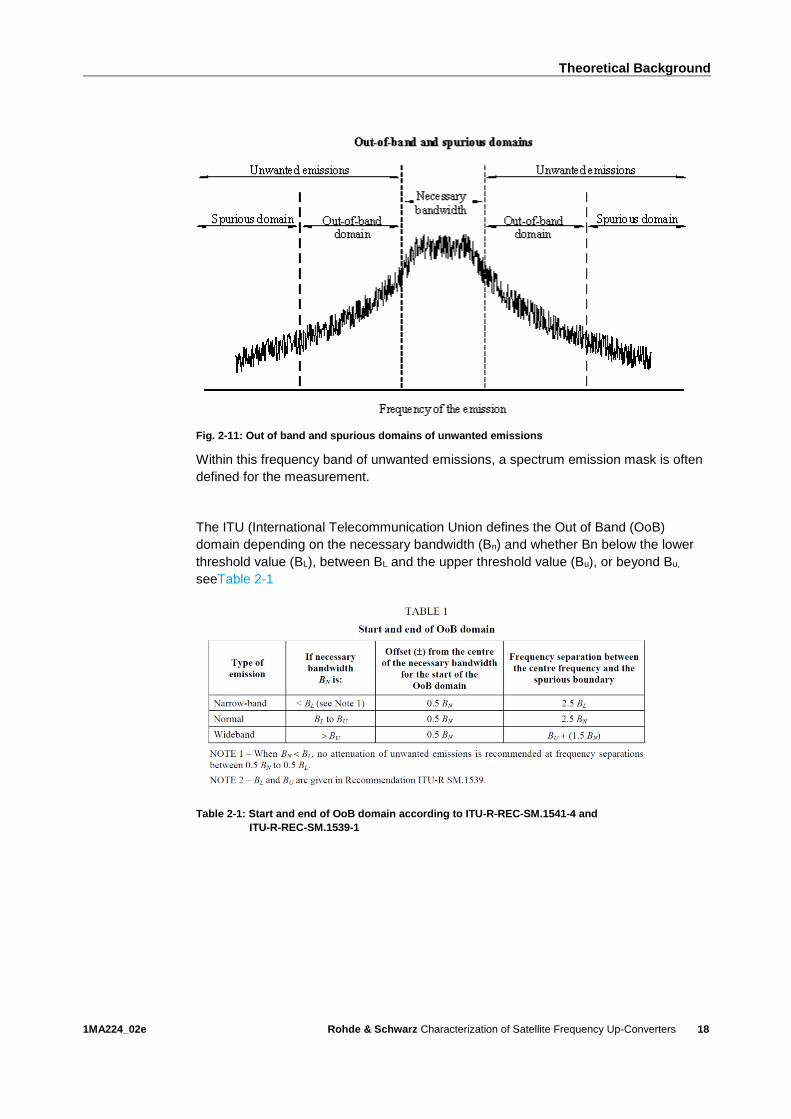
Fig. 2-11: Out of band and spurious domains of unwanted emissions
Within this frequency band of unwanted emissions, a spectrum emission mask is often
defined for the measurement.
The ITU (International Telecommunication Union defines the Out of Band (OoB)
domain depending on the necessary bandwidth (Bn) and whether Bn below the lower
threshold value (BL), between BL and the upper threshold value (Bu), or beyond Bu,
seeTable 2-1
Table 2-1: Start and end of OoB domain according to ITU-R-REC-SM.1541-4 and
ITU-R-REC-SM.1539-1
Page 19
Measurement Setup for Measurements on a Satellite Up-converter using the ZVA
1MA224_02e Rohde & Schwarz Characterization of Satellite Frequency Up-Converters
19
3 Measurement Setup for Measurements on a
Satellite Up-converter using the ZVA
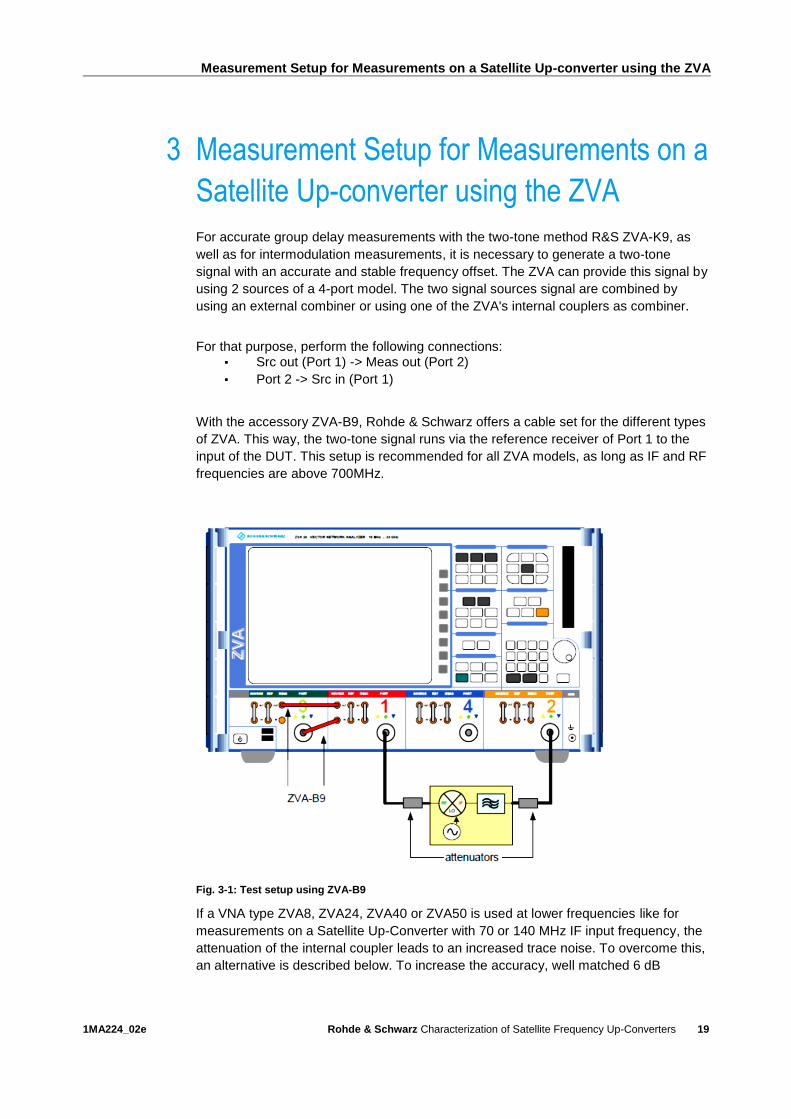
For accurate group delay measurements with the two-tone method R&S ZVA-K9, as
well as for intermodulation measurements, it is necessary to generate a two-tone
signal with an accurate and stable frequency offset. The ZVA can provide this signal by
using 2 sources of a 4-port model. The two signal sources signal are combined by
using an external combiner or using one of the ZVA's internal couplers as combiner.
For that purpose, perform the following connections:
▪ Src out (Port 1) -> Meas out (Port 2)
▪ Port 2 -> Src in (Port 1)
With the accessory ZVA-B9, Rohde & Schwarz offers a cable set for the different types
of ZVA. This way, the two-tone signal runs via the reference receiver of Port 1 to the
input of the DUT. This setup is recommended for all ZVA models, as long as IF and RF
frequencies are above 700MHz.
Fig. 3-1: Test setup using ZVA-B9
If a VNA type ZVA8, ZVA24, ZVA40 or ZVA50 is used at lower frequencies like for
measurements on a Satellite Up-Converter with 70 or 140 MHz IF input frequency, the
attenuation of the internal coupler leads to an increased trace noise. To overcome this,
an alternative is described below. To increase the accuracy, well matched 6 dB
Page 20
Measurement Setup for Measurements on a Satellite Up-converter using the ZVA
1MA224_02e Rohde & Schwarz Characterization of Satellite Frequency Up-Converters
20
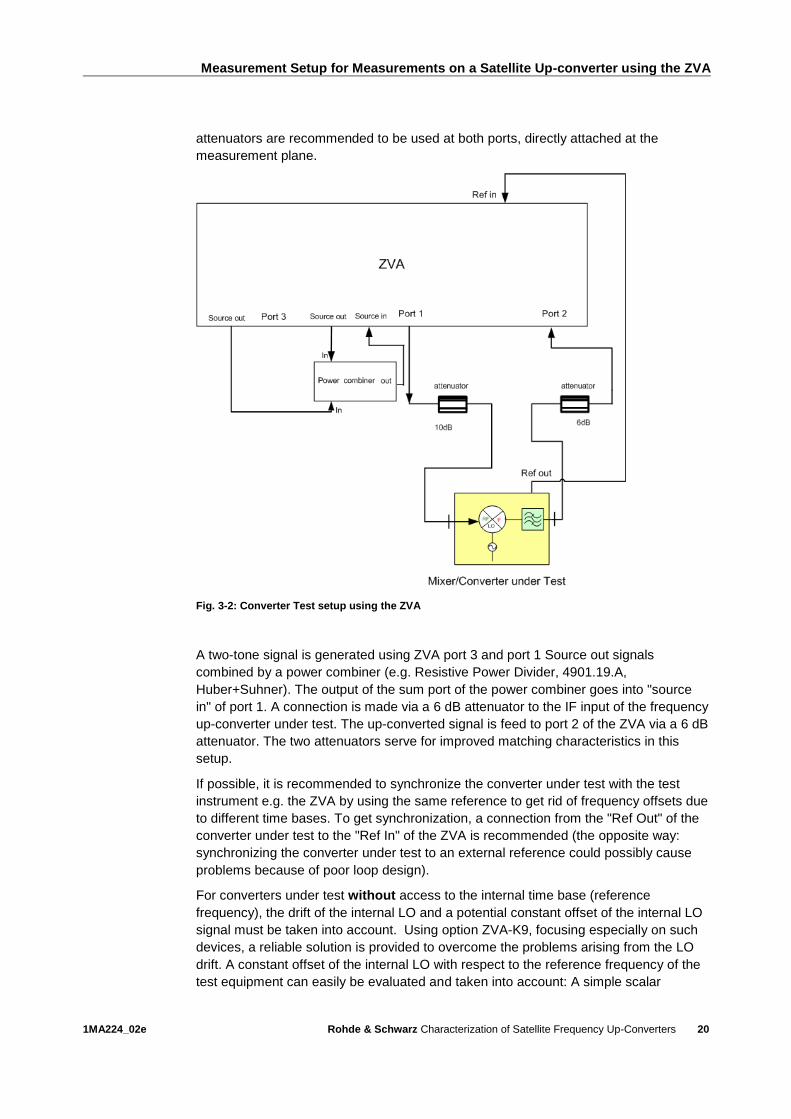
attenuators are recommended to be used at both ports, directly attached at the
measurement plane.
Fig. 3-2: Converter Test setup using the ZVA
A two-tone signal is generated using ZVA port 3 and port 1 Source out signals
combined by a power combiner (e.g. Resistive Power Divider, 4901.19.A,
Huber+Suhner). The output of the sum port of the power combiner goes into "source
in" of port 1. A connection is made via a 6 dB attenuator to the IF input of the frequency
up-converter under test. The up-converted signal is feed to port 2 of the ZVA via a 6 dB
attenuator. The two attenuators serve for improved matching characteristics in this
setup.
If possible, it is recommended to synchronize the converter under test with the test
instrument e.g. the ZVA by using the same reference to get rid of frequency offsets due
to different time bases. To get synchronization, a connection from the "Ref Out" of the
converter under test to the "Ref In" of the ZVA is recommended (the opposite way:
synchronizing the converter under test to an external reference could possibly cause
problems because of poor loop design).
For converters under test without access to the internal time base (reference
frequency), the drift of the internal LO and a potential constant offset of the internal LO
signal must be taken into account. Using option ZVA-K9, focusing especially on such
devices, a reliable solution is provided to overcome the problems arising from the LO
drift. A constant offset of the internal LO with respect to the reference frequency of the
test equipment can easily be evaluated and taken into account: A simple scalar
Page 21
Measurement Setup for Measurements on a Satellite Up-converter using the ZVA
1MA224_02e Rohde & Schwarz Characterization of Satellite Frequency Up-Converters
21
frequency converting measurement, with fixed RF, but with the IF swept in the
frequency range of the expected DUT IF output, delivers directly the LO offset. See
chapter 4.1 how to measure and correct the offset.
Precondition of the following measurements is that this offset remains constant within
the used measurement bandwidth e.g. 1 kHz.
The test setup shown in Fig. 3-2 can be used for group delay measurements,
conversion loss measurement as well as for intermodulation measurement and 1-dB
compression point measurement.
Page 22
Satellite Up-Converter Measurements
1MA224_02e Rohde & Schwarz Characterization of Satellite Frequency Up-Converters
22
4 Satellite Up-Converter Measurements
4.1 LO frequency offset correction for Frequency Converters
under test without access to the time base
Skip this chapter for converters under test with reference frequency output!
As mentioned before, option ZVA-K9 is a unique solution for embedded LO
measurements and allows reliable measurements even with a significant frequency
drift of the internal LO (which can be within the IFBW, selected in the ZVA). An
additional constant frequency offset of the LO can be identified by a scalar frequency
converting measurement: A fixed RF is applied, but the DUT IF output is measured
with a center frequency at the expected IF, and a frequency sweep span in the range
of the estimated LO offset. Once the offset is known, it can easily be corrected in the
ZVA settings. .
ı To do this set the source frequency of port 1 to a fixed frequency (e.g. 70 MHz)
in the middle of the channel in the “Port Configuration” dialog of the ZVA. The
receive frequency of port 2 is swept with a small span e.g. 10 kHz which covers
the expected frequency offset of the converters output frequency. See Fig. 4-1 for
the according settings within the Port Configurations menu of the ZVA.
Fig. 4-1: Port configuration for measuring the frequency offset of non-synchronized frequency
converters
To use the ZVA as a kind of spectrum analyzer, use an IF filter with high selectivity
(Pwr BW AVG : Fine Adjust: Selectivity High) and a bandwidth of 1 kHz or below, see
Fig. 4-2.
Fig. 4-2: Bandwidth setting of the ZVA
Page 23
Satellite Up-Converter Measurements
1MA224_02e Rohde & Schwarz Characterization of Satellite Frequency Up-Converters
23
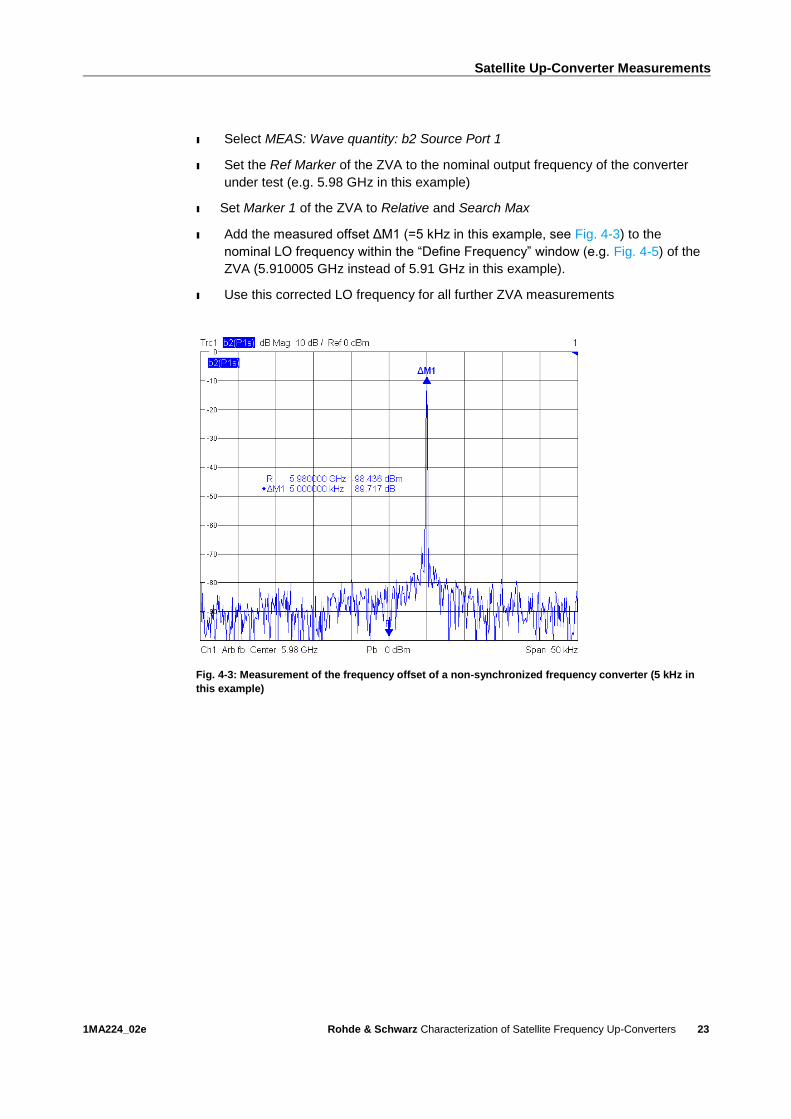
ı Select MEAS: Wave quantity: b2 Source Port 1
ı Set the Ref Marker of the ZVA to the nominal output frequency of the converter
under test (e.g. 5.98 GHz in this example)
ı Set Marker 1 of the ZVA to Relative and Search Max
ı Add the measured offset ΔM1 (=5 kHz in this example, see Fig. 4-3) to the
nominal LO frequency within the “Define Frequency” window (e.g. Fig. 4-5) of the
ZVA (5.910005 GHz instead of 5.91 GHz in this example).
ı Use this corrected LO frequency for all further ZVA measurements
Fig. 4-3: Measurement of the frequency offset of a non-synchronized frequency converter (5 kHz in
this example)
Page 24
Satellite Up-Converter Measurements
1MA224_02e Rohde & Schwarz Characterization of Satellite Frequency Up-Converters
24
4.2 Group Delay measurement on Satellite Up-Converters
with the ZVA
4.2.1 Instrument Settings
First, generate a two-tone signal with 5 MHz aperture (difference in frequency)
ı Channel: Mode: Mixer Delay Measurement: Define mixer Delay Meas
ı Configure the window as shown in the Fig. 4-4 below
Fig. 4-4: Define Mixer Delay Measurement Window
ı Click on Define mixer Measurement and then Set Frequencies and configure as
shown in Fig. 4-5
Fig. 4-5: Define Frequencies Window
ı Click OK to save the settings
Page 25
Satellite Up-Converter Measurements
1MA224_02e Rohde & Schwarz Characterization of Satellite Frequency Up-Converters
25
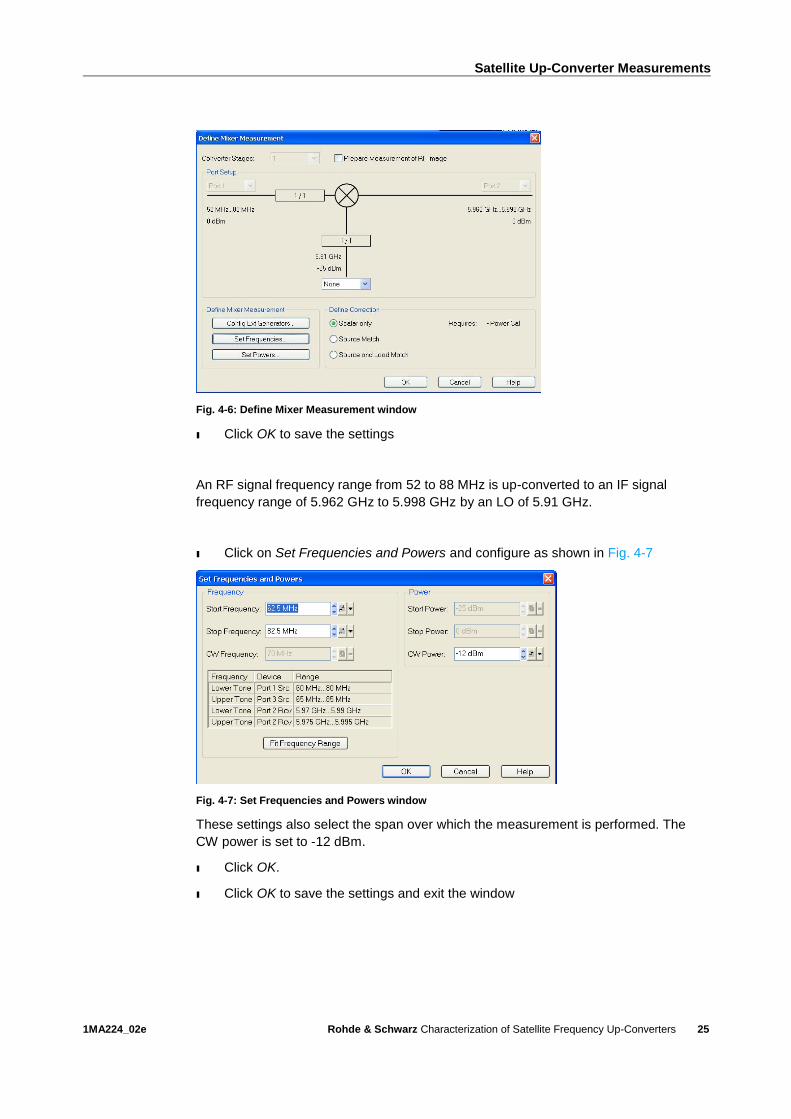
Fig. 4-6: Define Mixer Measurement window
ı Click OK to save the settings
An RF signal frequency range from 52 to 88 MHz is up-converted to an IF signal
frequency range of 5.962 GHz to 5.998 GHz by an LO of 5.91 GHz.
ı Click on Set Frequencies and Powers and configure as shown in Fig. 4-7
Fig. 4-7: Set Frequencies and Powers window
These settings also select the span over which the measurement is performed. The
CW power is set to -12 dBm.
ı Click OK.
ı Click OK to save the settings and exit the window
Page 26
Satellite Up-Converter Measurements
1MA224_02e Rohde & Schwarz Characterization of Satellite Frequency Up-Converters
26
4.3 Calibration
For group delay measurements two different calibrations are required
ı Power calibration
ı Power calibration is performed by using an appropriate R&S NRP-Zxx Power
Sensor (e.g. R&S NRP-Z21, R&S NRP-Z11) connected to an USB port of the
ZVA.
ı Mixer delay calibration
The calibrations done in the following chapters 4.3.1 and 4.3.2 are used for all
described measurements executed with the ZVA.
4.3.1 Power Calibration
ı Click Channel> mode> Scalar mixer Measurement > Mixer Power Cal
Fig. 4-8: Scalar Mixer Measurement Power Calibration window
ı Connect the power sensor via the USB port of the ZVA
ı Click to Power Meter Config…
Click to Refresh Tables. A connected power sensor should appear as Pmtr 1 (power
meter 1) in the Configured field of Fig. 4-9.
Page 27
Satellite Up-Converter Measurements
1MA224_02e Rohde & Schwarz Characterization of Satellite Frequency Up-Converters
27
Fig. 4-9: An NRP-Z21 power sensor connected to the ZVA via USB is recognized
ı and configure as in Fig. 4-10 (Cal Offset = sum of attenuation of power Click on
Modify Settings combiner and 6 dB attenuator, Max. Number of Readings,
Tolerance and Power Meter Readings)
Fig. 4-10: Modify Source Power Cal settings
Page 28
Satellite Up-Converter Measurements
1MA224_02e Rohde & Schwarz Characterization of Satellite Frequency Up-Converters
28
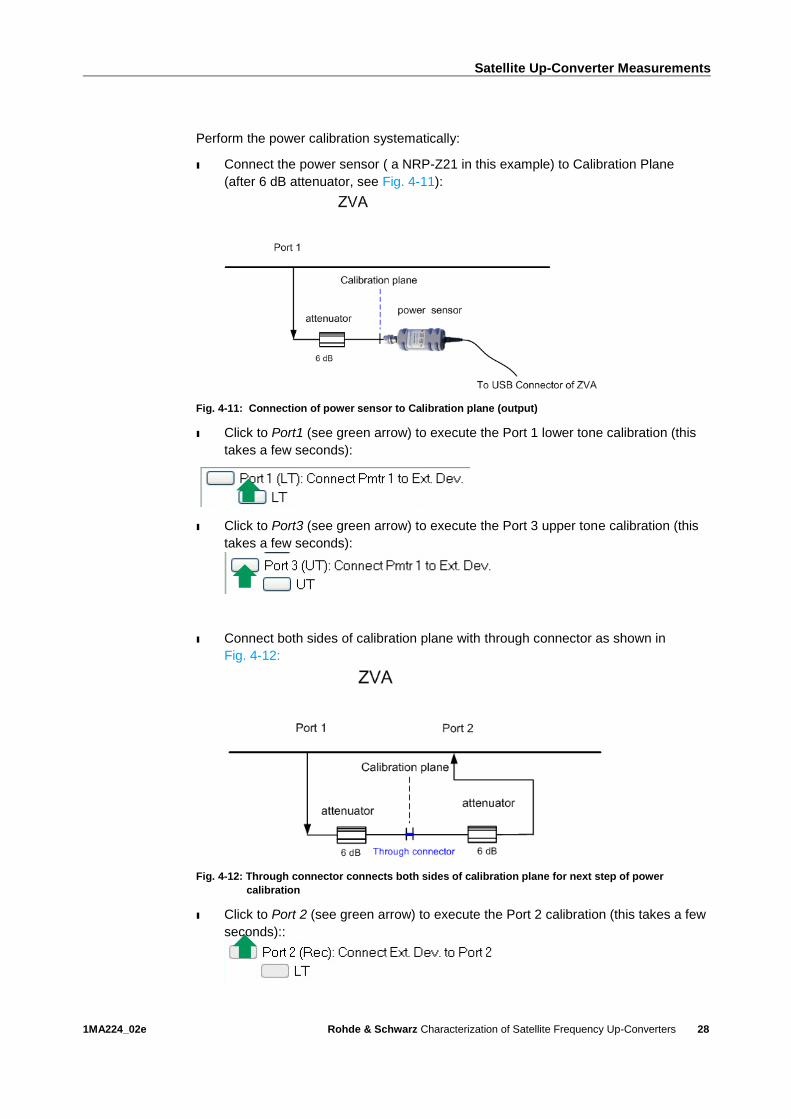
Perform the power calibration systematically:
ı Connect the power sensor ( a NRP-Z21 in this example) to Calibration Plane
(after 6 dB attenuator, see Fig. 4-11):
Fig. 4-11: Connection of power sensor to Calibration plane (output)
ı Click to Port1 (see green arrow) to execute the Port 1 lower tone calibration (this
takes a few seconds):
ı Click to Port3 (see green arrow) to execute the Port 3 upper tone calibration (this
takes a few seconds):
ı Connect both sides of calibration plane with through connector as shown in
Fig. 4-12:
Fig. 4-12: Through connector connects both sides of calibration plane for next step of power
calibration
ı Click to Port 2 (see green arrow) to execute the Port 2 calibration (this takes a few
seconds)::
Page 29
Satellite Up-Converter Measurements
1MA224_02e Rohde & Schwarz Characterization of Satellite Frequency Up-Converters
29
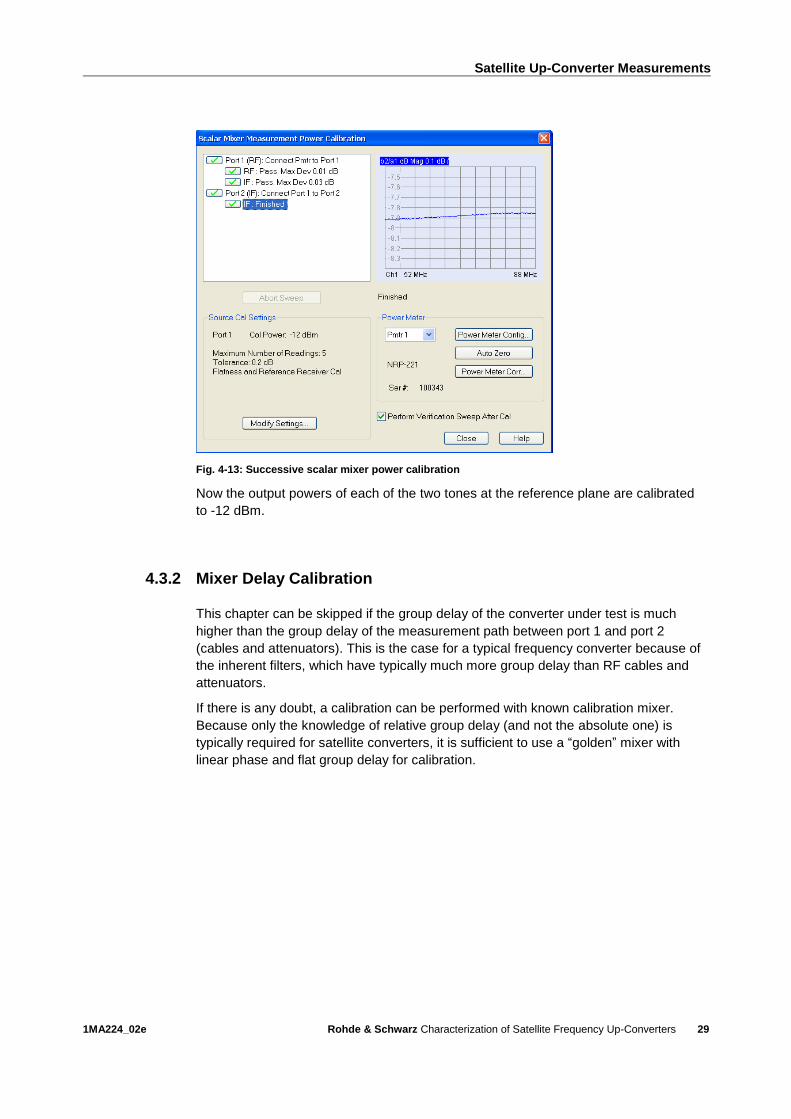
Fig. 4-13: Successive scalar mixer power calibration
Now the output powers of each of the two tones at the reference plane are calibrated
to -12 dBm.
4.3.2 Mixer Delay Calibration
This chapter can be skipped if the group delay of the converter under test is much
higher than the group delay of the measurement path between port 1 and port 2
(cables and attenuators). This is the case for a typical frequency converter because of
the inherent filters, which have typically much more group delay than RF cables and
attenuators.
If there is any doubt, a calibration can be performed with known calibration mixer.
Because only the knowledge of relative group delay (and not the absolute one) is
typically required for satellite converters, it is sufficient to use a “golden” mixer with
linear phase and flat group delay for calibration.
Page 30
Satellite Up-Converter Measurements
1MA224_02e Rohde & Schwarz Characterization of Satellite Frequency Up-Converters
30
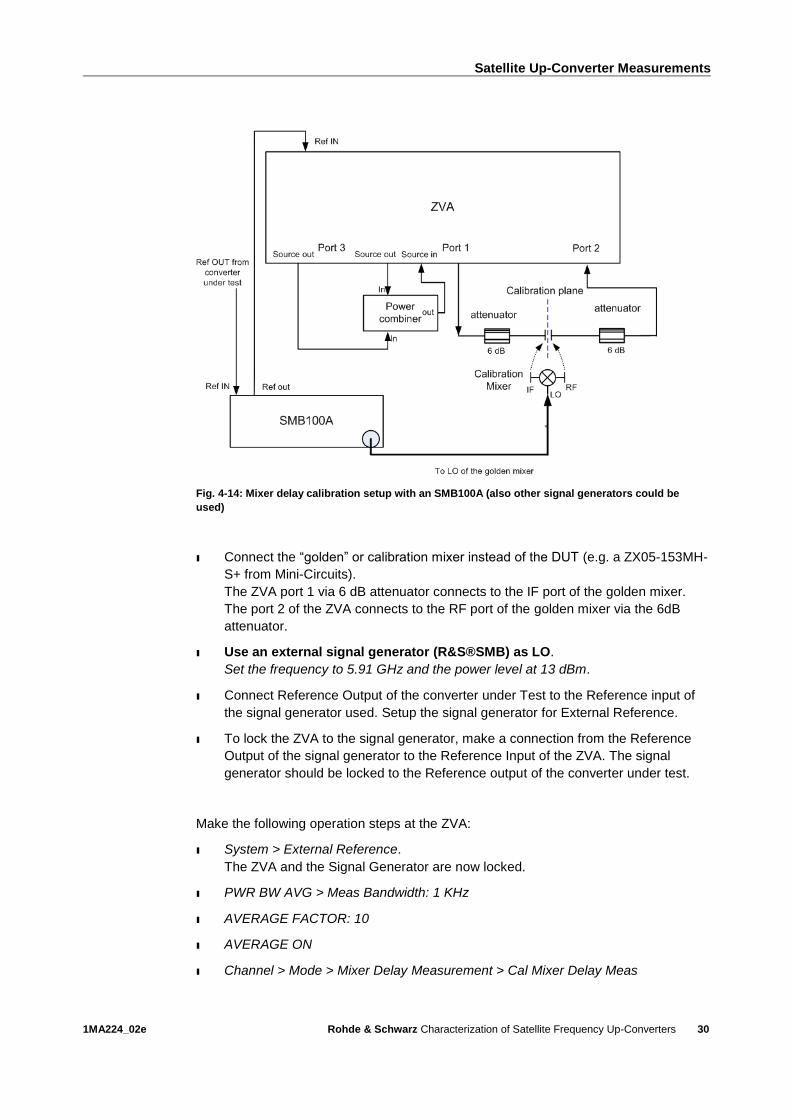
Fig. 4-14: Mixer delay calibration setup with an SMB100A (also other signal generators could be
used)
ı Connect the “golden” or calibration mixer instead of the DUT (e.g. a ZX05-153MH-
S+ from Mini-Circuits).
The ZVA port 1 via 6 dB attenuator connects to the IF port of the golden mixer.
The port 2 of the ZVA connects to the RF port of the golden mixer via the 6dB
attenuator.
ı Use an external signal generator (R&S®SMB) as LO.
Set the frequency to 5.91 GHz and the power level at 13 dBm.
ı Connect Reference Output of the converter under Test to the Reference input of
the signal generator used. Setup the signal generator for External Reference.
ı To lock the ZVA to the signal generator, make a connection from the Reference
Output of the signal generator to the Reference Input of the ZVA. The signal
generator should be locked to the Reference output of the converter under test.
Make the following operation steps at the ZVA:
ı System > External Reference.
The ZVA and the Signal Generator are now locked.
ı PWR BW AVG > Meas Bandwidth: 1 KHz
ı AVERAGE FACTOR: 10
ı AVERAGE ON
ı Channel > Mode > Mixer Delay Measurement > Cal Mixer Delay Meas
Page 31
Satellite Up-Converter Measurements
1MA224_02e Rohde & Schwarz Characterization of Satellite Frequency Up-Converters
31
Fig. 4-15: Mixer Delay Meas Calibration window
ı For relative group delay, select Constant Delay and input Const. Delay: 0s
ı Click Take Cal Sweep.
ı Wait until the message "Finished" appears (this takes a few seconds) and close
the dialog.
If necessary, the calibration data can be saved and recalled using the "Save" and
"Load" buttons. The entire calibration process is now complete and the group delay
measurements can now be made.
Page 32
Satellite Up-Converter Measurements
1MA224_02e Rohde & Schwarz Characterization of Satellite Frequency Up-Converters
32
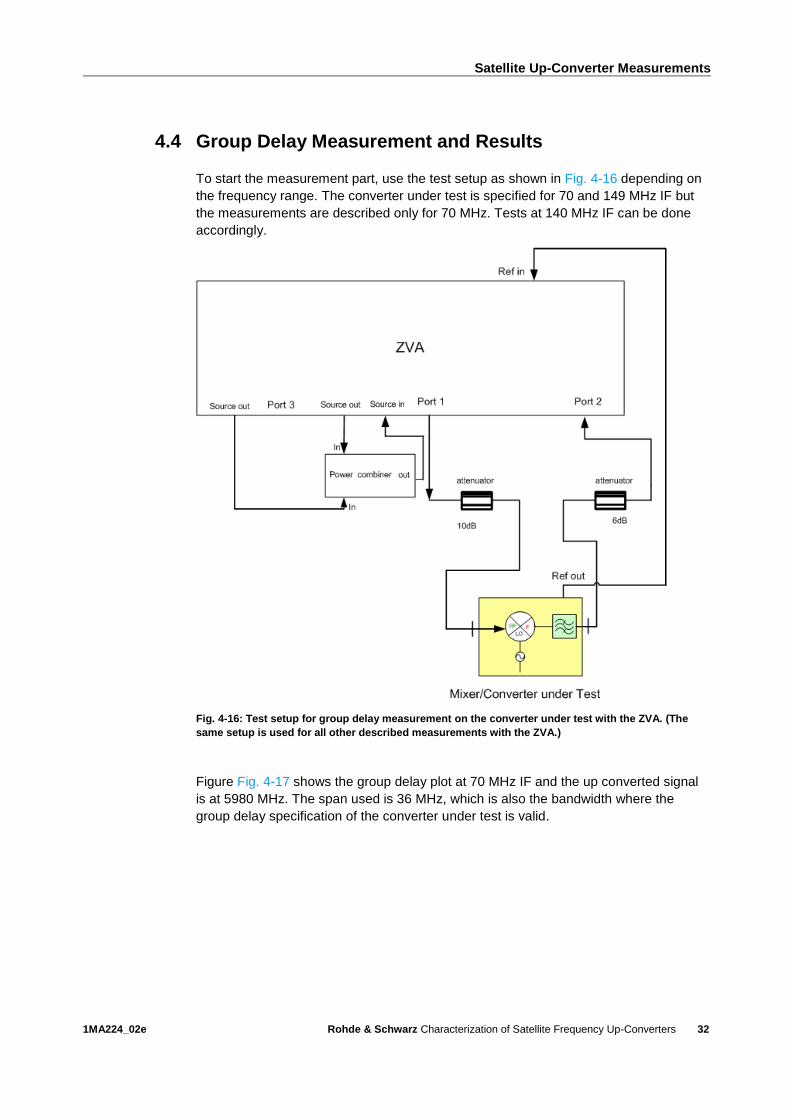
4.4 Group Delay Measurement and Results
To start the measurement part, use the test setup as shown in Fig. 4-16 depending on
the frequency range. The converter under test is specified for 70 and 149 MHz IF but
the measurements are described only for 70 MHz. Tests at 140 MHz IF can be done
accordingly.
Fig. 4-16: Test setup for group delay measurement on the converter under test with the ZVA. (The
same setup is used for all other described measurements with the ZVA.)
Figure Fig. 4-17 shows the group delay plot at 70 MHz IF and the up converted signal
is at 5980 MHz. The span used is 36 MHz, which is also the bandwidth where the
group delay specification of the converter under test is valid.
Page 33
Satellite Up-Converter Measurements
1MA224_02e Rohde & Schwarz Characterization of Satellite Frequency Up-Converters
33
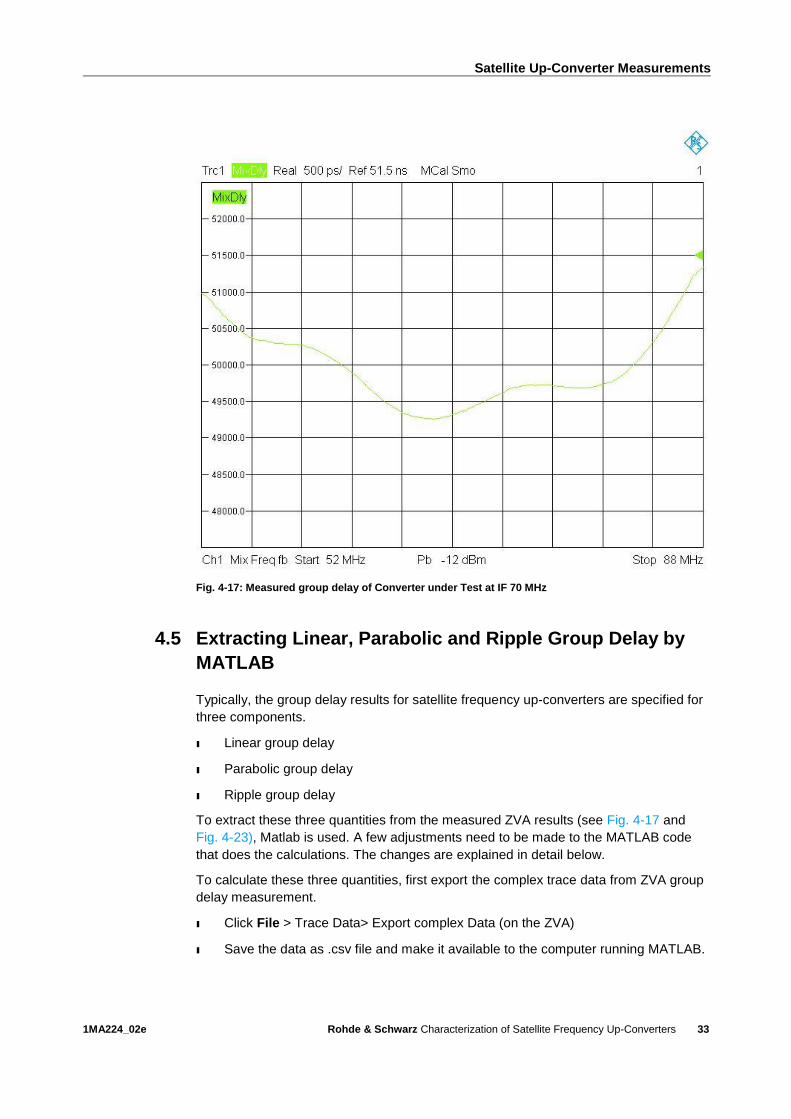
Fig. 4-17: Measured group delay of Converter under Test at IF 70 MHz
4.5 Extracting Linear, Parabolic and Ripple Group Delay by
MATLAB
Typically, the group delay results for satellite frequency up-converters are specified for
three components.
ı Linear group delay
ı Parabolic group delay
ı Ripple group delay
To extract these three quantities from the measured ZVA results (see Fig. 4-17 and
Fig. 4-23), Matlab is used. A few adjustments need to be made to the MATLAB code
that does the calculations. The changes are explained in detail below.
To calculate these three quantities, first export the complex trace data from ZVA group
delay measurement.
ı Click File > Trace Data> Export complex Data (on the ZVA)
ı Save the data as .csv file and make it available to the computer running MATLAB.
Page 34
Satellite Up-Converter Measurements
1MA224_02e Rohde & Schwarz Characterization of Satellite Frequency Up-Converters
34
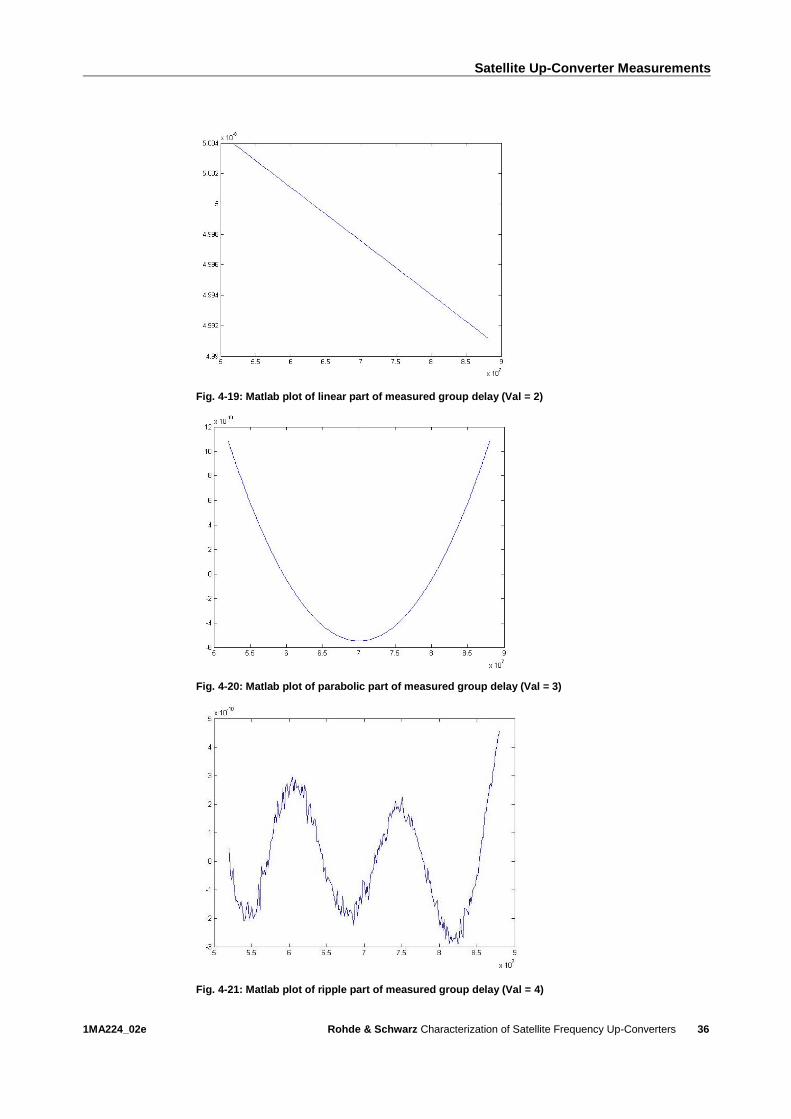
4.5.1 MATLAB code for group delay and corresponding plots:
To calculate a specific Group Delay (ripple, parabolic or linear), change the value
on line 7 accordingly:
Page 35
Satellite Up-Converter Measurements
1MA224_02e Rohde & Schwarz Characterization of Satellite Frequency Up-Converters
35
ı Val = 1 to see the trace plot as exported from the ZVA
ı Val = 2 to see the linear group delay plot and linear group delay (on command
window of MATLAB)
ı Val = 3 to see the parabolic group delay plot and parabolic group delay (on
command window of MATLAB)
ı Val = 4 to see the ripple group delay plot and ripple group delay (on command
window of MATLAB)
ı After inputting the value of desired group delay, copy and paste the code on
MATLAB command window.
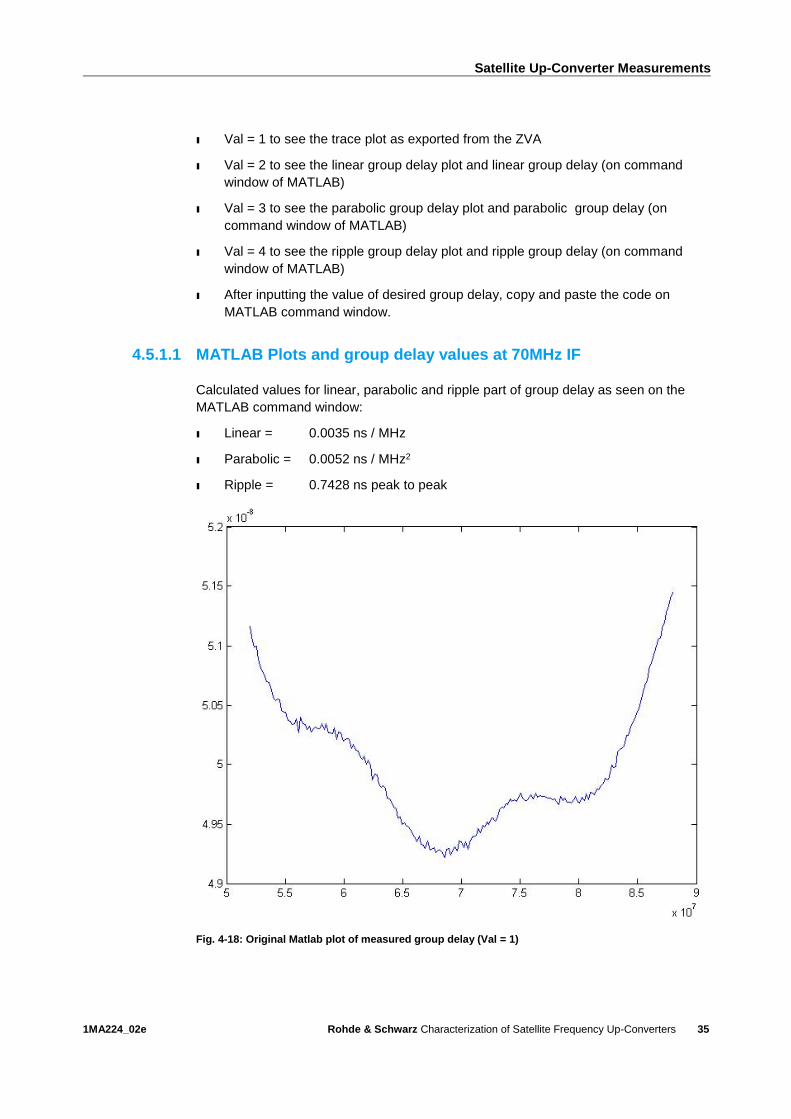
4.5.1.1 MATLAB Plots and group delay values at 70MHz IF
Calculated values for linear, parabolic and ripple part of group delay as seen on the
MATLAB command window:
ı Linear = 0.0035 ns / MHz
ı Parabolic = 0.0052 ns / MHz2
ı Ripple = 0.7428 ns peak to peak
Fig. 4-18: Original Matlab plot of measured group delay (Val = 1)
Page 36
Satellite Up-Converter Measurements
1MA224_02e Rohde & Schwarz Characterization of Satellite Frequency Up-Converters
36
Fig. 4-19: Matlab plot of linear part of measured group delay (Val = 2)
Fig. 4-20: Matlab plot of parabolic part of measured group delay (Val = 3)
Fig. 4-21: Matlab plot of ripple part of measured group delay (Val = 4)
Page 37
Satellite Up-Converter Measurements
1MA224_02e Rohde & Schwarz Characterization of Satellite Frequency Up-Converters
37
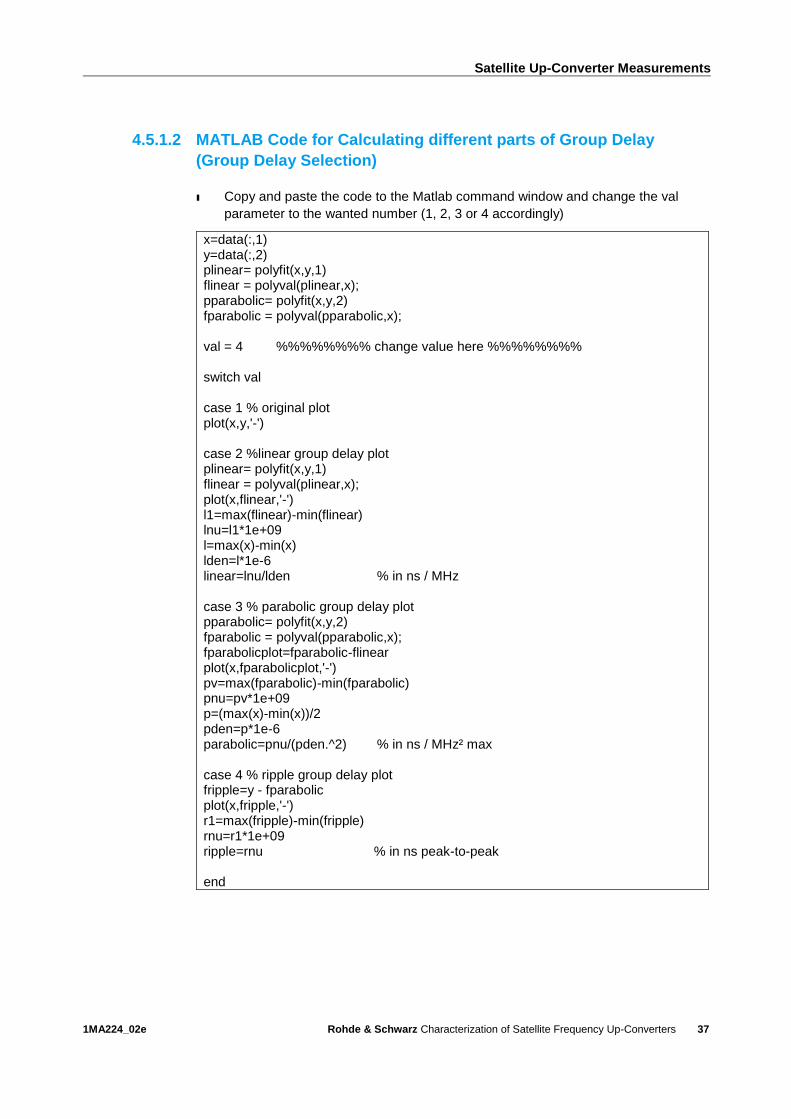
4.5.1.2 MATLAB Code for Calculating different parts of Group Delay
(Group Delay Selection)
ı Copy and paste the code to the Matlab command window and change the val
parameter to the wanted number (1, 2, 3 or 4 accordingly)
x=data(:,1) y=data(:,2) plinear= polyfit(x,y,1) flinear = polyval(plinear,x); pparabolic= polyfit(x,y,2) fparabolic = polyval(pparabolic,x); val = 4 %%%%%%%% change value here %%%%%%%% switch val case 1 % original plot plot(x,y,'-') case 2 %linear group delay plot plinear= polyfit(x,y,1) flinear = polyval(plinear,x); plot(x,flinear,'-') l1=max(flinear)-min(flinear) lnu=l1*1e+09 l=max(x)-min(x) lden=l*1e-6 linear=lnu/lden % in ns / MHz case 3 % parabolic group delay plot pparabolic= polyfit(x,y,2) fparabolic = polyval(pparabolic,x); fparabolicplot=fparabolic-flinear plot(x,fparabolicplot,'-') pv=max(fparabolic)-min(fparabolic) pnu=pv*1e+09 p=(max(x)-min(x))/2 pden=p*1e-6 parabolic=pnu/(pden.^2) % in ns / MHz² max case 4 % ripple group delay plot fripple=y - fparabolic plot(x,fripple,'-') r1=max(fripple)-min(fripple) rnu=r1*1e+09 ripple=rnu % in ns peak-to-peak end
Page 38
Satellite Up-Converter Measurements
1MA224_02e Rohde & Schwarz Characterization of Satellite Frequency Up-Converters
38
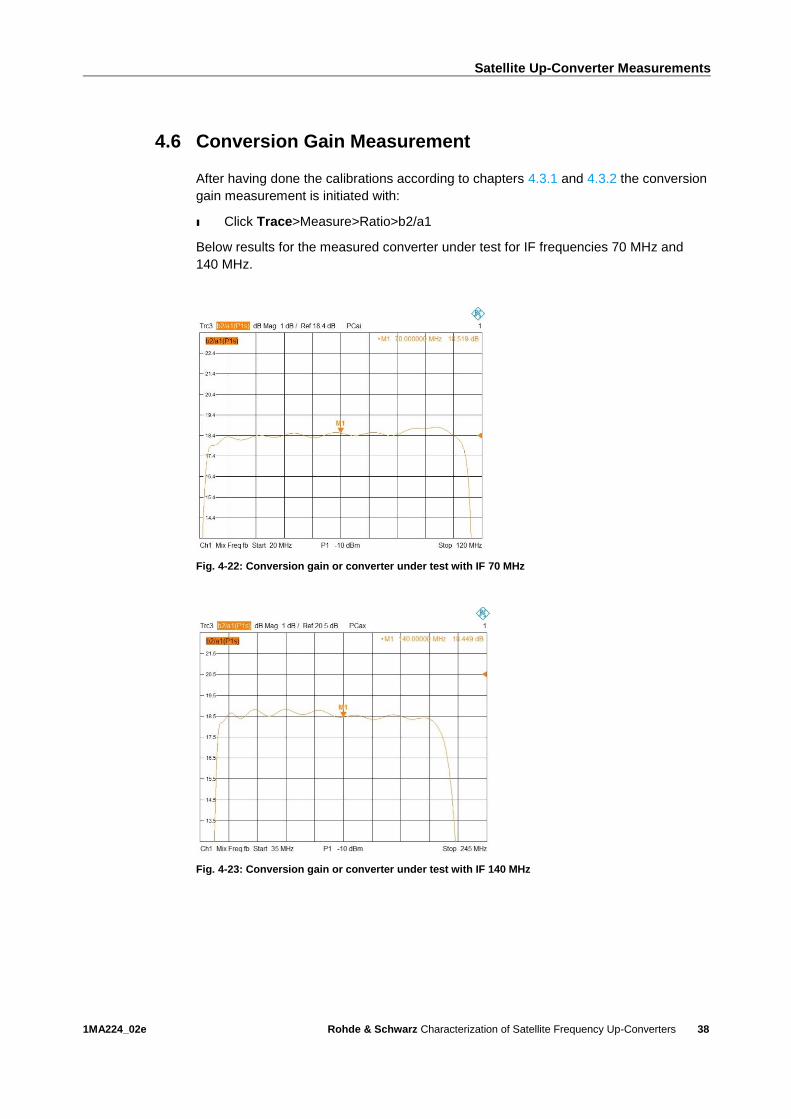
4.6 Conversion Gain Measurement
After having done the calibrations according to chapters 4.3.1 and 4.3.2 the conversion
gain measurement is initiated with:
ı Click Trace>Measure>Ratio>b2/a1
Below results for the measured converter under test for IF frequencies 70 MHz and
140 MHz.
Fig. 4-22: Conversion gain or converter under test with IF 70 MHz
Fig. 4-23: Conversion gain or converter under test with IF 140 MHz
Page 39
Satellite Up-Converter Measurements
1MA224_02e Rohde & Schwarz Characterization of Satellite Frequency Up-Converters
39
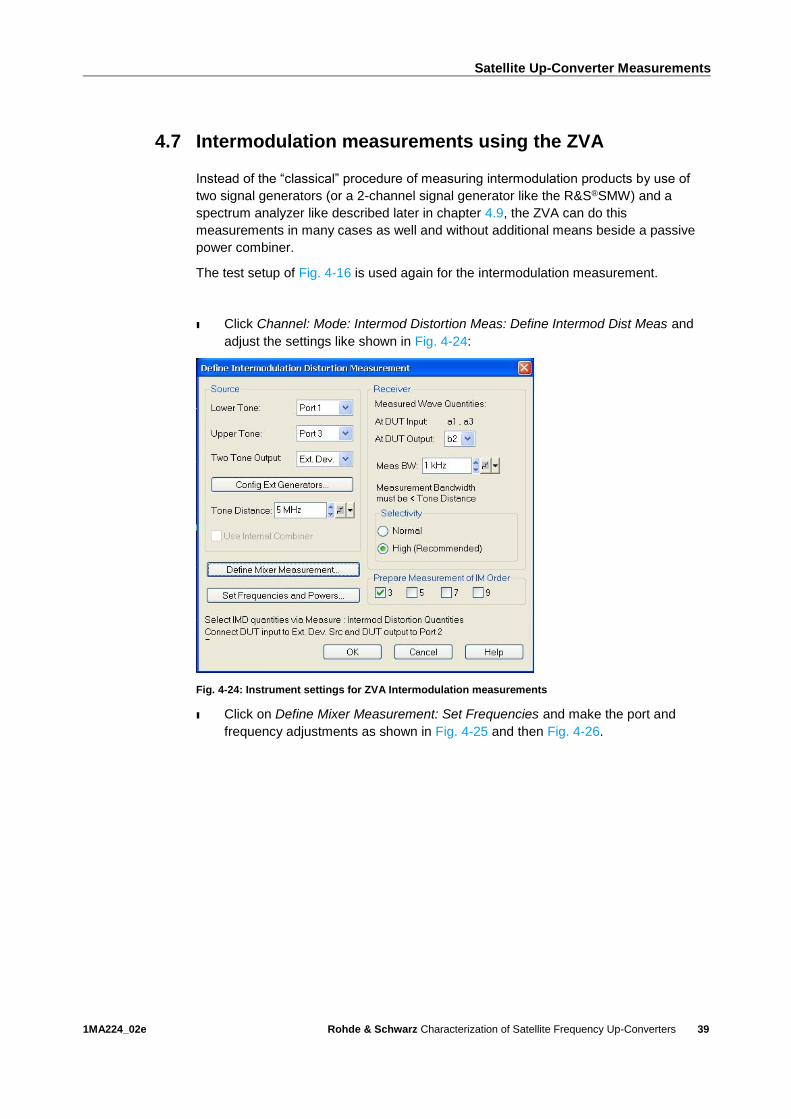
4.7 Intermodulation measurements using the ZVA
Instead of the “classical” procedure of measuring intermodulation products by use of
two signal generators (or a 2-channel signal generator like the R&S®SMW) and a
spectrum analyzer like described later in chapter 4.9, the ZVA can do this
measurements in many cases as well and without additional means beside a passive
power combiner.
The test setup of Fig. 4-16 is used again for the intermodulation measurement.
ı Click Channel: Mode: Intermod Distortion Meas: Define Intermod Dist Meas and
adjust the settings like shown in Fig. 4-24:
Fig. 4-24: Instrument settings for ZVA Intermodulation measurements
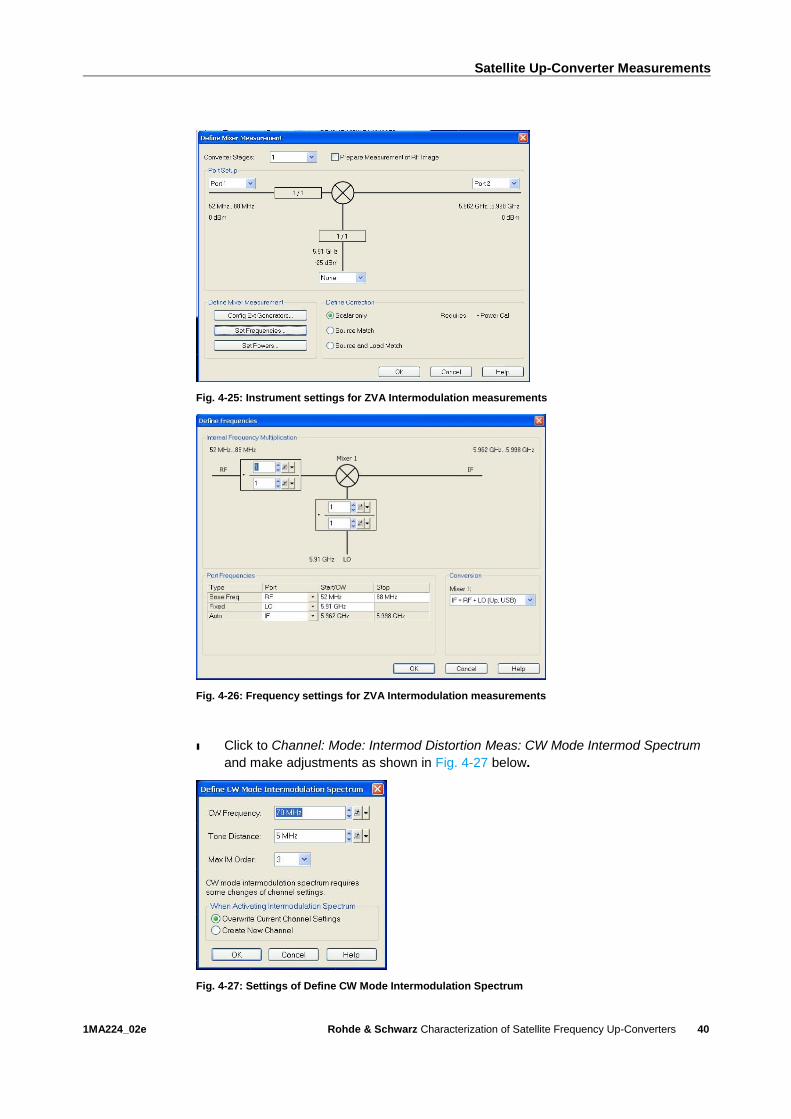
ı Click on Define Mixer Measurement: Set Frequencies and make the port and
frequency adjustments as shown in Fig. 4-25 and then Fig. 4-26.
Page 40
Satellite Up-Converter Measurements
1MA224_02e Rohde & Schwarz Characterization of Satellite Frequency Up-Converters
40
Fig. 4-25: Instrument settings for ZVA Intermodulation measurements
Fig. 4-26: Frequency settings for ZVA Intermodulation measurements
ı Click to Channel: Mode: Intermod Distortion Meas: CW Mode Intermod Spectrum
and make adjustments as shown in Fig. 4-27 below.
Fig. 4-27: Settings of Define CW Mode Intermodulation Spectrum
Page 41
Satellite Up-Converter Measurements
1MA224_02e Rohde & Schwarz Characterization of Satellite Frequency Up-Converters
41
ı Click Channel: Mode: Port Config and make the adjustments as shown in Fig.
4-28
(Cal Power Offset: Sum of attenuation of resistive power combiner + attenuation
of 6 dB Attenuator about 12 dB. A Power Result of -25 dBm gives an output power
of the converter under test of approximately 0 dBm, which is the specified power
for intermodulation product)
Fig. 4-28: Port Configurations Settings
ı Click on Stimulus and make adjustments as in Fig. 4-29
Fig. 4-29: Stimulus Settings
ı Sweep: Number of points 201
ı Power BW AVG
ı Deselect Average On
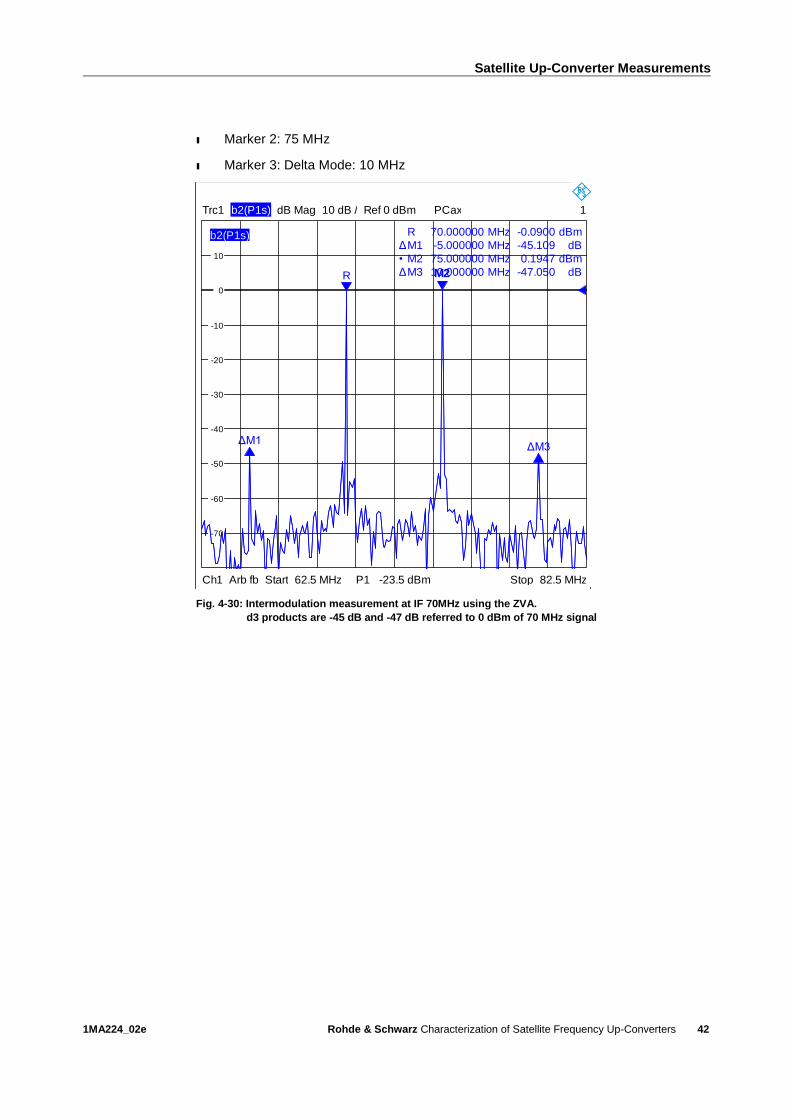
4.7.1 Measurement Results
Fig. 4-30 shows the intermodulation measurement results of the converter under test at
IF 70 MHz using the two tone method. The tone spacing used is 5MHz, the frequency
span is 20 MHz.
ı Adjust level of 2-tone signal for exactly 0 dBm per tone with
Power BW AVG: Power using the rotary knob.
Marker Settings:
ı Marker: Ref Marker 70 MHz
ı Marker 1: Delta Mode: -5 MHz
Page 42
Satellite Up-Converter Measurements
1MA224_02e Rohde & Schwarz Characterization of Satellite Frequency Up-Converters
42
ı Marker 2: 75 MHz
ı Marker 3: Delta Mode: 10 MHz
Fig. 4-30: Intermodulation measurement at IF 70MHz using the ZVA.
d3 products are -45 dB and -47 dB referred to 0 dBm of 70 MHz signal
-70
-60
-50
-40
-30
-20
-10
0
10
0
1
P1 -23.5 dBm Ch1 Arb fb Start 62.5 MHz Stop 82.5 MHz
Trc1 b2(P1s) dB Mag 10 dB / Ref 0 dBm PCax
Δ
•
Δ
R
M1
M2
M3
70.000000
-5.000000
75.000000
10.000000
MHz
MHz
MHz
MHz
-0.0900
-45.109
0.1947
-47.050
dBm
dB
dBm
dB
b2(P1s)
R
ΔM1
M2
ΔM3
8/8/2013, 3:42 PM
Page 43
Satellite Up-Converter Measurements
1MA224_02e Rohde & Schwarz Characterization of Satellite Frequency Up-Converters
43
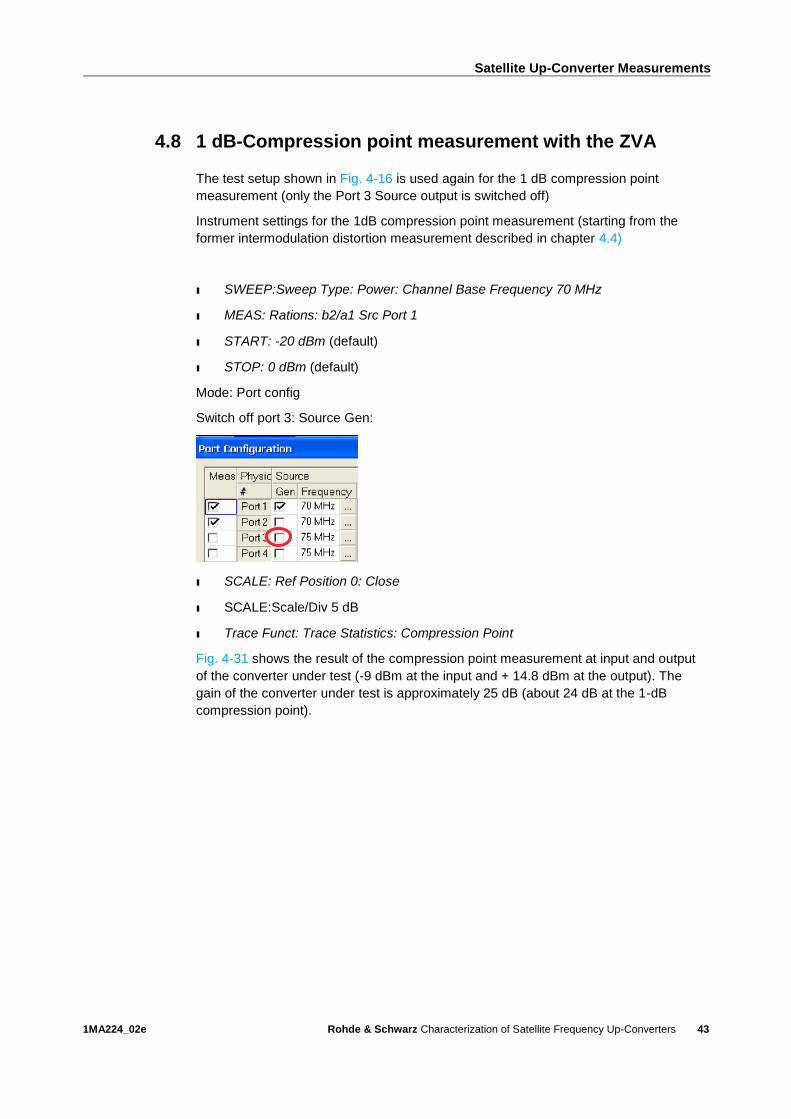
4.8 1 dB-Compression point measurement with the ZVA
The test setup shown in Fig. 4-16 is used again for the 1 dB compression point
measurement (only the Port 3 Source output is switched off)
Instrument settings for the 1dB compression point measurement (starting from the
former intermodulation distortion measurement described in chapter 4.4)
ı SWEEP:Sweep Type: Power: Channel Base Frequency 70 MHz
ı MEAS: Rations: b2/a1 Src Port 1
ı START: -20 dBm (default)
ı STOP: 0 dBm (default)
Mode: Port config
Switch off port 3: Source Gen:
ı SCALE: Ref Position 0: Close
ı SCALE:Scale/Div 5 dB
ı Trace Funct: Trace Statistics: Compression Point
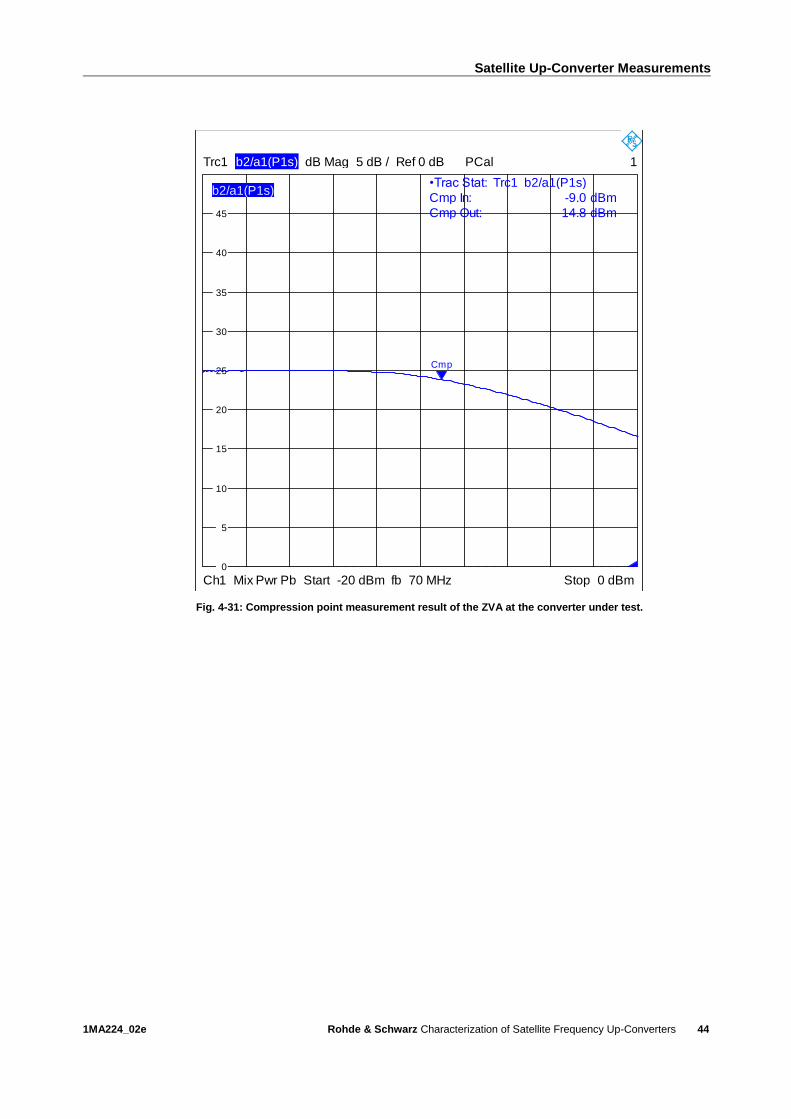
Fig. 4-31 shows the result of the compression point measurement at input and output
of the converter under test (-9 dBm at the input and + 14.8 dBm at the output). The
gain of the converter under test is approximately 25 dB (about 24 dB at the 1-dB
compression point).
Page 44
Satellite Up-Converter Measurements
1MA224_02e Rohde & Schwarz Characterization of Satellite Frequency Up-Converters
44
Fig. 4-31: Compression point measurement result of the ZVA at the converter under test.
5
10
15
20
25
30
35
40
45
0
1
fb 70 MHzCh1 Mix Pwr Pb Start -20 dBm Stop 0 dBm
Trc1 b2/a1(P1s) dB Mag 5 dB / Ref 0 dB PCal
•Trac Stat:
Cmp In:
Cmp Out:
Trc1 b2/a1(P1s)
-9.0
14.8
dBm
dBm
b2/a1(P1s)
Cmp
8/8/2013, 1:53 PM
Page 45
Satellite Up-Converter Measurements
1MA224_02e Rohde & Schwarz Characterization of Satellite Frequency Up-Converters
45
4.9 Intermodulation test setup using the Signal and Spectrum
Analyzer FSW and two Signal Generators SMB
Fig. 4-32: Test setup using an FSW and two SMB for intermodulation measurement
To perform intermodulation measurements using the FSW and two SMB, the test setup
is implemented as shown in Fig. 4-32. Tests are to be performed at both IF 70 MHz
and IF 140 MHz; setup the converter under test respectively. Synchronizing the R&S
test instruments to the reference output of the converter under test is optional.
Page 46
Satellite Up-Converter Measurements
1MA224_02e Rohde & Schwarz Characterization of Satellite Frequency Up-Converters
46
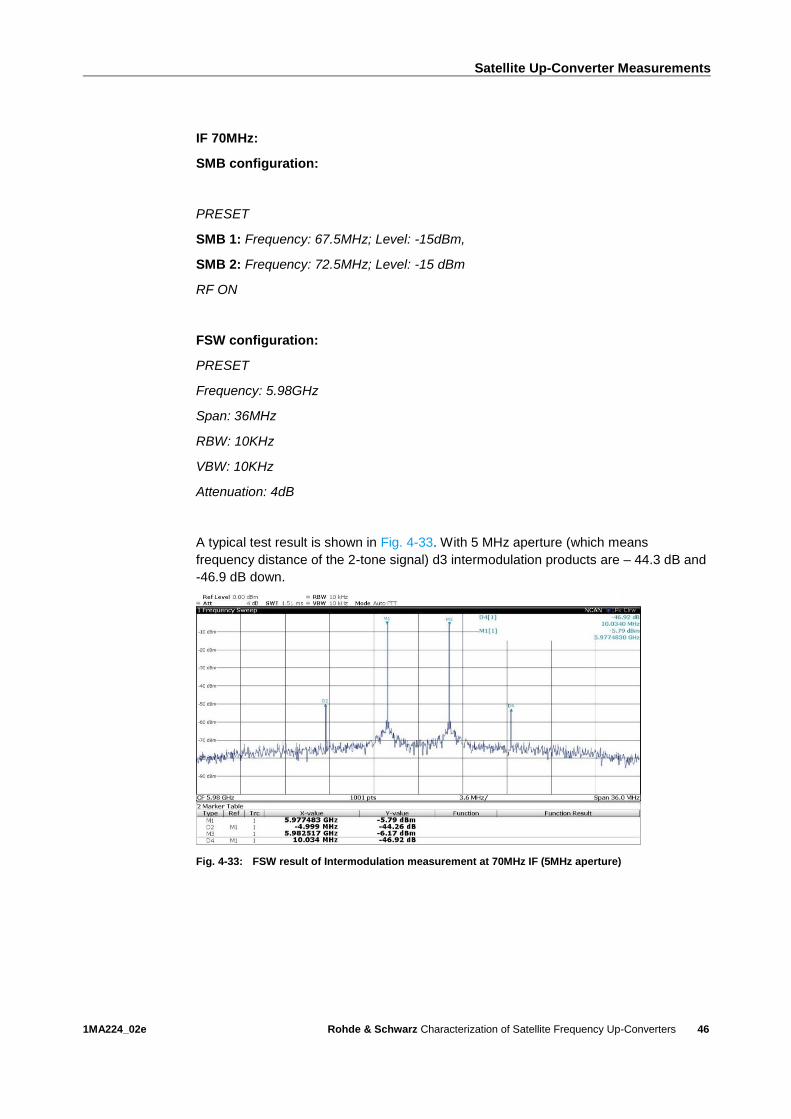
IF 70MHz:
SMB configuration:
PRESET
SMB 1: Frequency: 67.5MHz; Level: -15dBm,
SMB 2: Frequency: 72.5MHz; Level: -15 dBm
RF ON
FSW configuration:
PRESET
Frequency: 5.98GHz
Span: 36MHz
RBW: 10KHz
VBW: 10KHz
Attenuation: 4dB
A typical test result is shown in Fig. 4-33. With 5 MHz aperture (which means
frequency distance of the 2-tone signal) d3 intermodulation products are – 44.3 dB and
-46.9 dB down.
Fig. 4-33: FSW result of Intermodulation measurement at 70MHz IF (5MHz aperture)
Page 47
Satellite Up-Converter Measurements
1MA224_02e Rohde & Schwarz Characterization of Satellite Frequency Up-Converters
47
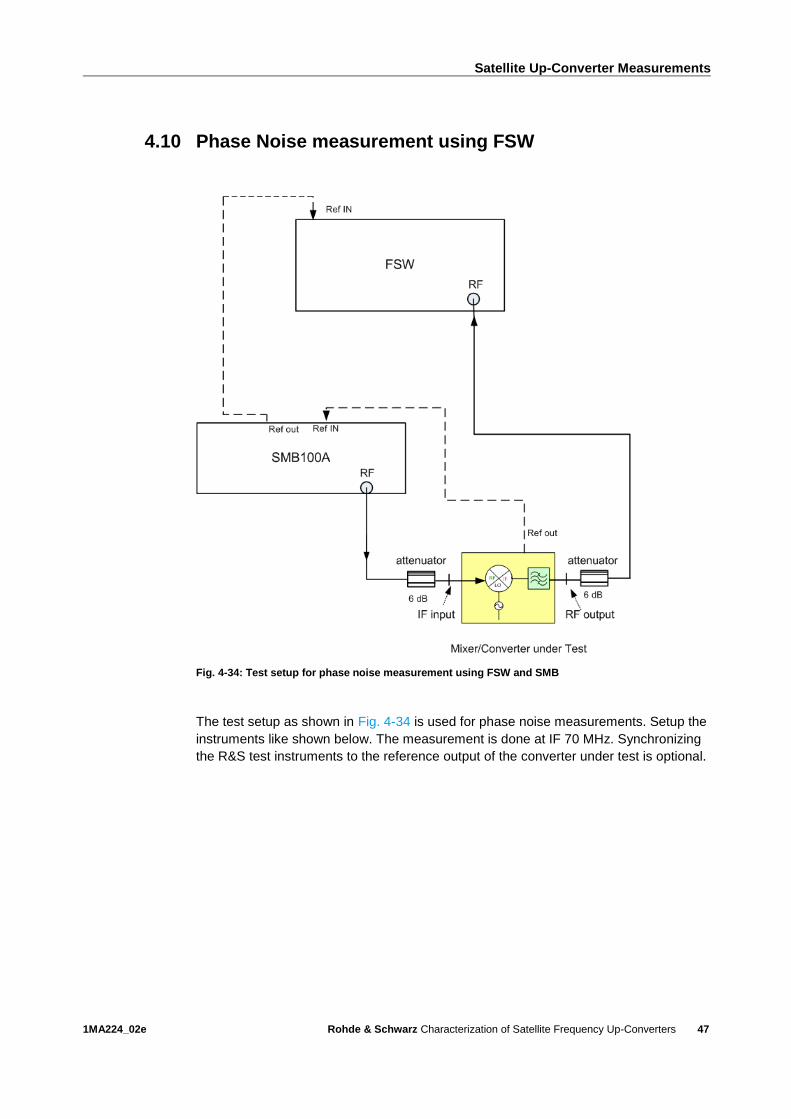
4.10 Phase Noise measurement using FSW
Fig. 4-34: Test setup for phase noise measurement using FSW and SMB
The test setup as shown in Fig. 4-34 is used for phase noise measurements. Setup the
instruments like shown below. The measurement is done at IF 70 MHz. Synchronizing
the R&S test instruments to the reference output of the converter under test is optional.
Page 48
Satellite Up-Converter Measurements
1MA224_02e Rohde & Schwarz Characterization of Satellite Frequency Up-Converters
48
IF 70 MHz:
ı SMB:
ı PRESET
ı Frequency: 70 MHz; Level: -19dBm
ı RF ON
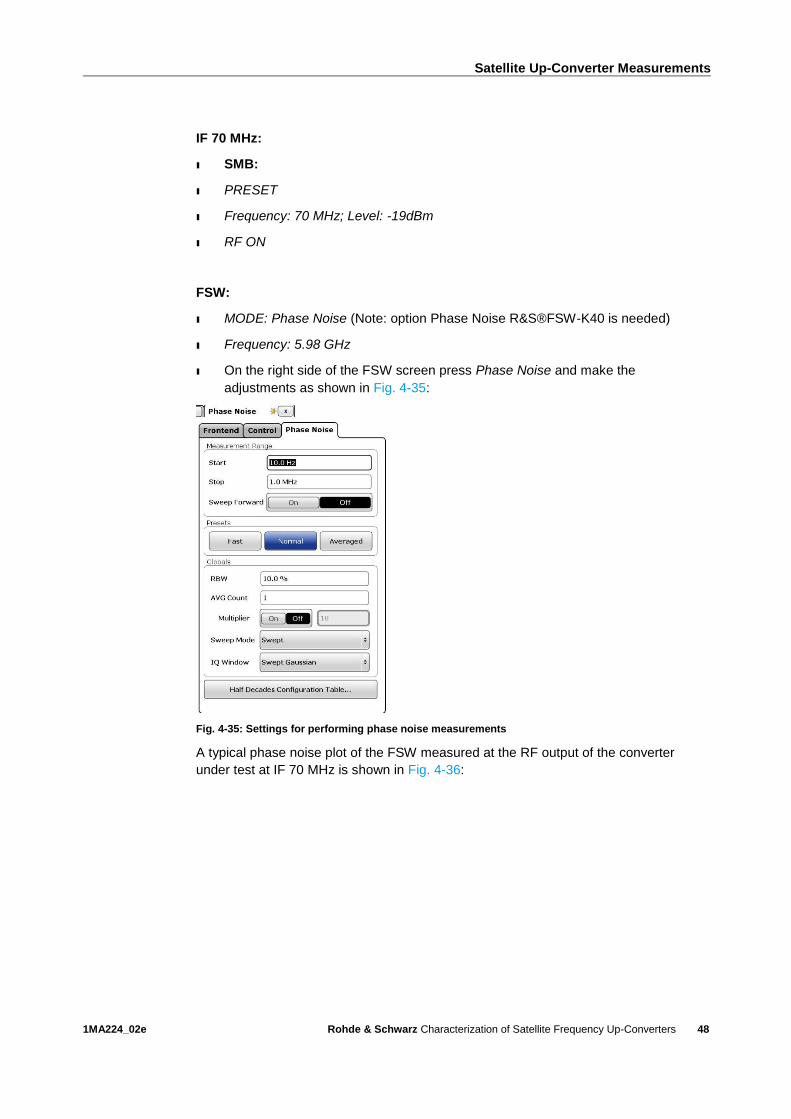
FSW:
ı MODE: Phase Noise (Note: option Phase Noise R&S®FSW-K40 is needed)
ı Frequency: 5.98 GHz
ı On the right side of the FSW screen press Phase Noise and make the
adjustments as shown in Fig. 4-35:
Fig. 4-35: Settings for performing phase noise measurements
A typical phase noise plot of the FSW measured at the RF output of the converter
under test at IF 70 MHz is shown in Fig. 4-36:
Page 49
Satellite Up-Converter Measurements
1MA224_02e Rohde & Schwarz Characterization of Satellite Frequency Up-Converters
49
Fig. 4-36: FSW Phase noise plot of converter under test at 70MHz IF
A limit line “converter1” is activated to get a pass/fail information. The marker table
shows at the lower screen shows phase noise values at several frequency offsets.
Note: The specified phase noise values of both SMB and FSW are much lower
than the measured values of the converter under test and therefore can be
neglected. Below typical phase noise plots of an FSW for different RF
frequencies:
Fig. 4-37: Typical phase noise plots of a FSW for different RF frequencies
Page 50
Satellite Up-Converter Measurements
1MA224_02e Rohde & Schwarz Characterization of Satellite Frequency Up-Converters
50
4.11 Spurious Outputs Measurements
For measuring spurious outputs, the test setup in Fig. 4-34 is used (same test setup as
for phase noise measurements). Normally there are two types of spurious output
signals defined for frequency up-converters:
ı Signal related spurious signals specified in dBc (referred to level of output signal).
For the measurement, a spurious free input signal at nominal power is input into
the up-converter in this case.
ı Signal independent spurious specified in dBm (absolute level). For the
measurement, the input signal is switched off.
For the converter under test the signal related spurious are specified to -60 dBc for
frequency offsets < 1MHz and -70 dBc for frequency offsets >= 1MHz. The signal
independent spurious are specified to < - 70 dBm. A maximum offset of +-500 MHz is
defined for the spurious measurement.
For the spurious measurement according to the converter specification, the spectrum
emission mask function of the FSW is recommended which can handle both absolute
and relative limits.
SMB configuration (for signal related spurious outputs)
ı Frequency: 70 MHz; Level: -19dBm
ı RF ON
FSW configuration:
ı Frequency: 5.98GHz
ı Span: 1 GHz
ı Ref Level Offset: 6 dB (6 dB attenuator in front of the FSW RF input)
ı Adjust SMB level for indication of 0 dBm at the FSW
ı MEAS: Spectrum Emission Mask
ı TRACE:Trace1: Detector Type: Positive Peak
ı Reference Range: Power Reference Typ Peak Power
ı MEAS CONFIG: Sweep List
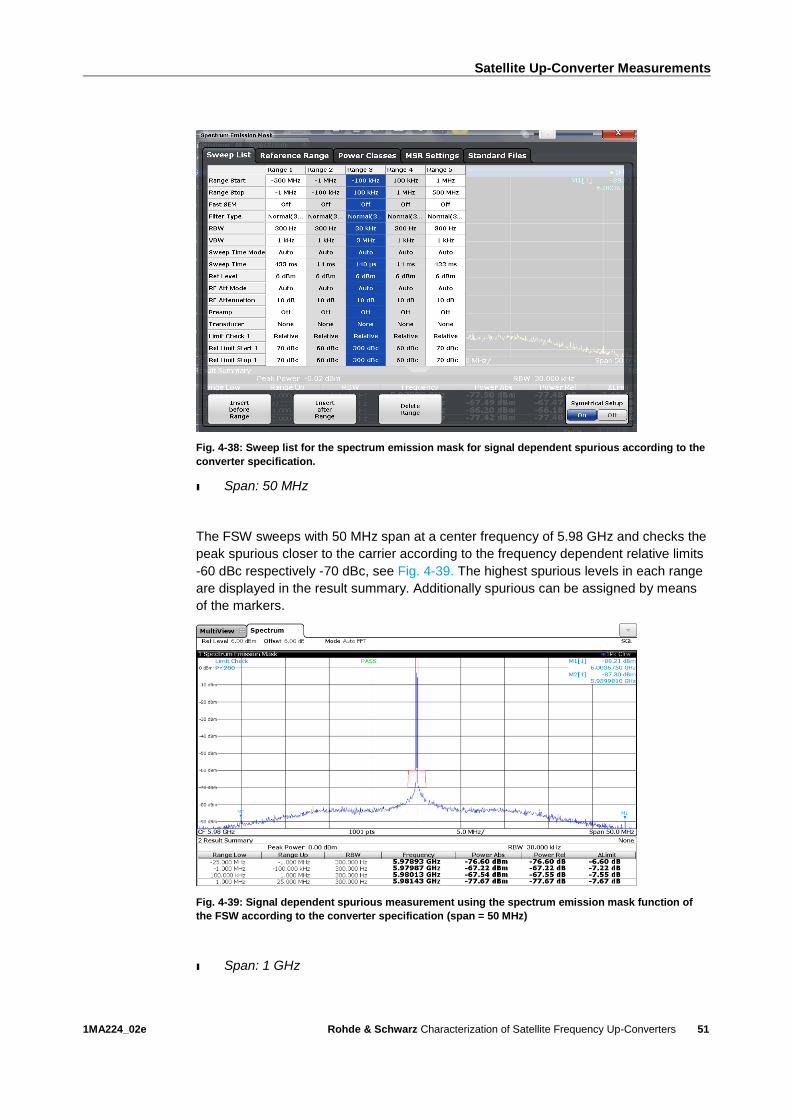
ı Edit a sweep list according to that of Fig. 4-38 (insert 2 ranges, change start and
stop frequencies of ranges, change bandwidths and set relative limits)
Page 51
Satellite Up-Converter Measurements
1MA224_02e Rohde & Schwarz Characterization of Satellite Frequency Up-Converters
51
Fig. 4-38: Sweep list for the spectrum emission mask for signal dependent spurious according to the
converter specification.
ı Span: 50 MHz
The FSW sweeps with 50 MHz span at a center frequency of 5.98 GHz and checks the
peak spurious closer to the carrier according to the frequency dependent relative limits
-60 dBc respectively -70 dBc, see Fig. 4-39. The highest spurious levels in each range
are displayed in the result summary. Additionally spurious can be assigned by means
of the markers.
Fig. 4-39: Signal dependent spurious measurement using the spectrum emission mask function of
the FSW according to the converter specification (span = 50 MHz)
ı Span: 1 GHz
Page 52
Satellite Up-Converter Measurements
1MA224_02e Rohde & Schwarz Characterization of Satellite Frequency Up-Converters
52
The FSW sweeps now with 1 GHz span and checks also the spurious farer away from
the carrier, see Fig. 4-40.
Fig. 4-40: Signal dependent spurious measurement using the spectrum emission mask function of
the FSW according to the converter specification (span = 1000 MHz).
To measure the signal independent spurious outputs make the following settings on
the instruments:
SMB:
ı RF OFF
FSW:
ı MEAS CONFIG: Sweep List
ı Edit the sweep list according to Fig. 4-41 (delete ranges, change limits to absolute
values)
Page 53
Satellite Up-Converter Measurements
1MA224_02e Rohde & Schwarz Characterization of Satellite Frequency Up-Converters
53
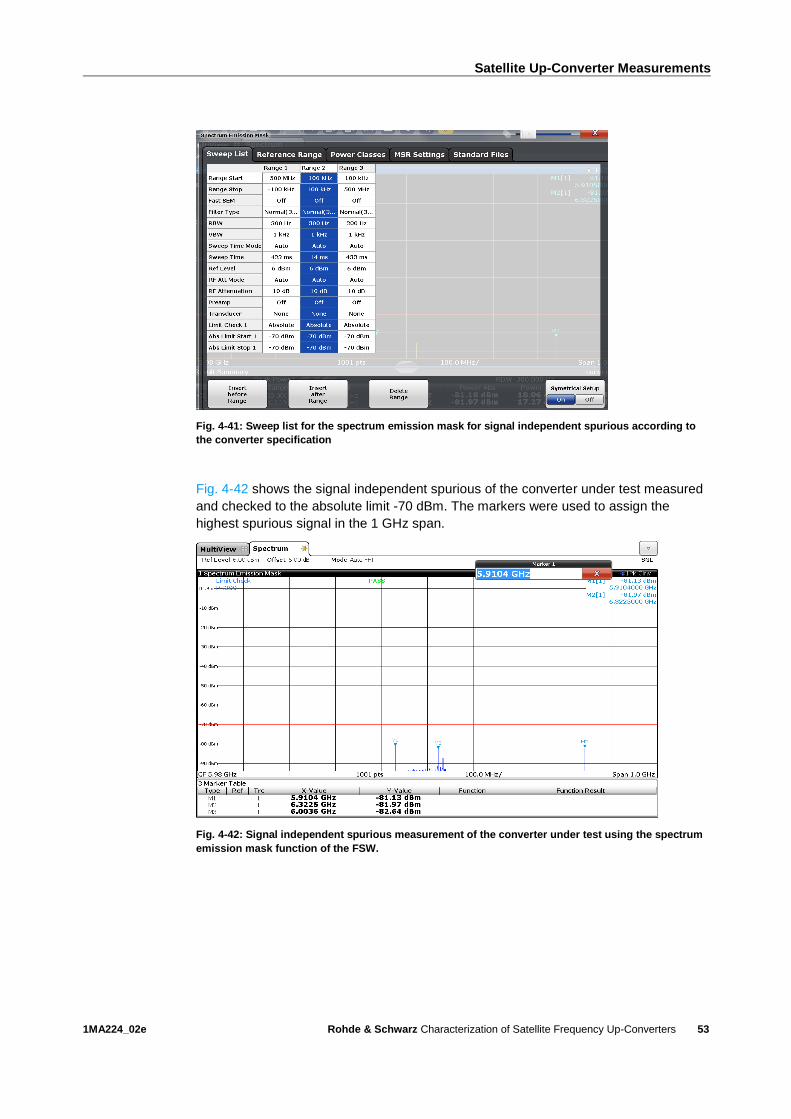
Fig. 4-41: Sweep list for the spectrum emission mask for signal independent spurious according to
the converter specification
Fig. 4-42 shows the signal independent spurious of the converter under test measured
and checked to the absolute limit -70 dBm. The markers were used to assign the
highest spurious signal in the 1 GHz span.
Fig. 4-42: Signal independent spurious measurement of the converter under test using the spectrum
emission mask function of the FSW.
Page 54
Literature
1MA224_02e Rohde & Schwarz Characterization of Satellite Frequency Up-Converters
54
5 Literature
1. ZVA_ZVB_ZVT_Operating.pdf, Rohde&Schwarz
2. FSW_UserManual_en_14.pdf, Rohde&Schwarz
3. SMB100A Operating Manual, Rohde&Schwarz
4. Application Card ZVA-K9.pdf, Rohde&Schwarz
5. 1EZ58: Mixer-Measurements_ZVA-K4.pdf, Application Note, Rohde&Schwarz
6. 1EZ60: Group Delay and Phase Measurement on Frequency Converters,
Application Note, Rohde&Schwarz
7. 1MA201: Measuring with Modern Spectrum Analyzers, Application Note,
Rohde&Schwarz
8. Satellite Upconverter Type SCU/HCU User Manual, Work Microwave GmbH
9. Recommendation ITU-R SM.1541-4 “Unwanted emissions in the out-of-band
domain”
10. Recommendation ITU-R SM.329-12 “Unwanted emissions in the spurious
domain”
Page 55
Ordering information
1MA224_02e Rohde & Schwarz Characterization of Satellite Frequency Up-Converters
55
6 Ordering information
Please note that a very complete range of network analyzers, signal generators, power amplifiers, spectrum analyzers and power sensors is available from Rohde & Schwarz. For additional information about these instruments, see the Rohde & Schwarz website
www.rohde-schwarz.com or contact your local representative.
Product Ordering Information
Type of instrument Designation and range Order No.
Vector Network Analyzer
ı R&S® ZVA 8* Vector Network Analyzer, 300 KHz..8GHz, 4 Port 1145.1110.10
ı R&S® ZVA-K9 Embedded LO Mixer delay measurement 1311.3128.02
ı R&S® ZVA-K4 Frequency Conversion 1164.1863.02
ı R&S® ZVA8-B16 Direct Generator/Receiver
Access for the R&S® ZVA 8.
1164.0209.08
ı R&S®ZVA8-B21 Generator Step Attenuator Port 1 1164.0009.02
ı R&S®ZVA8-B22 Generator Step Attenuator Port 2 1164.0015.02
ı R&S®ZVA8-B23 Generator Step Attenuator Port 3 1164.0021.02
ı R&S®ZVA8-B24 Generator Step Attenuator Port 4 1164.0038.02
ı R&S®ZVA8-B31 Receiver Step Attenuator Port 1 1164.0044.02
ı R&S®ZVA8-B32 Receiver Step Attenuator Port 2 1164.0050.02
ı R&S®ZVA8-B33 Receiver Step Attenuator Port 3 1164.0067.02
ı R&S®ZVA8-B34 Receiver Step Attenuator Port 4 1164.0073.02
Power Sensor
ı R&S® NRP-Z21* Three-Path Diode Sensor, 200 pW to 200 mW, 10 MHz to 18 GHz
1137.6000.02
ı R&S® NRP-Z4 USB Adapter(Passive) 1146.8001.02
Signal Generator
ı R&S®SMB100A* RF and Microwave Signal Generator 1406.6000.02
ı R&S®SMB-B101 RF Path/Frequency Option 9 kHz to 1.1 GHz 1407.2509.02
ı R&S®SMB-B106
RF Path/Frequency Option 9 kHz to 6 GHz 1407.2909.02
Signal and Spectrum Analyzer
ı R&S®FSW8* Signal and spectrum analyzer 2 Hz to 8 GHz 1312.8000.08
ı R&S®FSW-K40 Phase Noise Measurements 1313.1397.02
* Other ZVA models, Power Sensors, Signal Generators and Signal and Spectrum
Analyzers are suitable as well. More options are available. The instrument minimum
configuration for this application is shown in the table. Please ask your local
representative for a suitable configuration according to all your needs.
Page 56
Rohde & Schwarz
The Rohde & Schwarz electronics group offers
innovative solutions in the following business fields:
test and measurement, broadcast and media, secure
communications, cybersecurity, radiomonitoring and
radiolocation. Founded more than 80 years ago, this
independent company has an extensive sales and
service network and is present in more than 70
countries.
The electronics group is among the world market
leaders in its established business fields. The
company is headquartered in Munich, Germany. It
also has regional headquarters in Singapore and
Columbia, Maryland, USA, to manage its operations
in these regions.
Regional contact
Europe, Africa, Middle East +49 89 4129 12345 [email protected] North America 1 888 TEST RSA (1 888 837 87 72) [email protected] Latin America +1 410 910 79 88 [email protected] Asia Pacific +65 65 13 04 88 [email protected]
China +86 800 810 82 28 |+86 400 650 58 96 [email protected]
Sustainable product design
ı Environmental compatibility and eco-footprint
ı Energy efficiency and low emissions
ı Longevity and optimized total cost of ownership
This application note and the supplied programs
may only be used subject to the conditions of use
set forth in the download area of the Rohde &
Schwarz website.
R&S® is a registered trademark of Rohde & Schwarz GmbH & Co.
KG; Trade names are trademarks of the owners.
Rohde & Schwarz GmbH & Co. KG
Mühldorfstraße 15 | 81671 Munich, Germany
Phone + 49 89 4129 - 0 | Fax + 49 89 4129 – 13777
www.rohde-schwarz.com
PA
D-T
-M: 3573.7
380.0
2/0
2.0
5/E
N/