Clays and Clay Minerals, Vol.44, No. 6, 791-800, 1996. CHARACTERIZATION OF SOIL CLAY MINERALS: DECOMPOSITION OF X-RAY DIFFRACTION DIAGRAMS AND HIGH-RESOLUTION ELECTRON MICROSCOPY DOMINIQUE RIGHI 1 AND FRAN(~OISE ELSASS 2 1 URA 721 CNRS "Argiles, Sols et Alt&ations", Facult6 des Sciences, 86022 Poitiers Cedex, France 2 Station de Science du Sol, INRA, 78026 Versailles Cedex, France Abstract--Fine clays (<0.1 Ixm) extracted from an acid soil developed in a granite saprolite from the Massif Central, France, were characterized by X-ray diffraction (XRD) using a curve decomposition program, and high-resolution transmission electron microscopy (HRTEM) associated with a method of impregnation of moist samples. Direct measurement of d-spacings were performed on HRTEM photo- graphs. Decomposition of XRD patterns indicated 5 to 6 different clay phases including chlorite (and/or hydroxy-interlayered vermiculite), vermiculite/smeetite, illite/vermiculite and illite/smectite mixed layers. Expandable phases with decreasing layer charge (vermiculite, high- and low-charge smectite) were shown in the clay assemblage. When performed on K-saturated samples subjected to wetting and drying cycles, HRTEM observations were consistent with the XRD results. The major clay mineral phases identified by the decomposition of XRD patterns were also found by direct measurement of d-spacings on HRTEM images. Vermiculite and high-charge smectite appeared to be impregnated with preservation of their initial hydration state, whereas low-charge smectite interlayers were penetrated by the resin molecules during the impregnation procedure. It was concluded that the decomposition of XRD patterns gave a realistic analysis of the clay phases present in a complex soil clay sample, as well as the direct measurement of a limited number (50) of clay crystals on HRTEM images. Key Words--Acid Soil, Decomposition of X-ray Patterns, High-Charge Smectite, High-Resolution Elec- tron Microscopy, Illite/Smectite Mixed Layers, Illite/Vermiculite Mixed Layers, Low-Charge Smectite, Soil Clays, X-ray Diffraction. INTRODUCTION Because in temperate soils the clay fractions are complex mixtures of numerous clay mineral phases, including mixed-layer minerals of different types, their characterization is generally a difficult task. These mixtures exhibit complex XRD bands combining sev- eral poorly individualized maxima. As a result, com- parison of experimental diffraction peak positions with reference tables does not permit precise identification of the constituting clay minerals. Analysis of XRD patterns using a curve decomposition program (Lan- son 1993) greatly improves identification of the dif- ferent clay phases. However, decomposition is no more than a mathematical treatment of the XRD dia- gram, and elementary curves which have no mineral- ogical signification may be computed in fitting with the experimental diagram. Validation of the decom- position procedure was made (Lanson and Besson 1992; Lanson and Velde 1992), but essentially for dia- genetic series with illite/smectite mixed-layer clays, a simpler case than a soil clay assemblage. To date, no attempt has been made to validate the results obtained by decomposition of XRD patterns when performed on soil clay fractions. HRTEM was also used to characterize soil clay min- erals (Elsass and Robert 1992; Romero et al. 1992; Aoudjit et al. 1995). Representativity of HRTEM ob- servations is questionable according to the very small number of clay particles that can be observed, as com- pared with the millions of those "seen" by XRD. An- other problem with HRTEM is the dehydration of the clay during sample preparation and subsequent col- lapse of vermiculite and smectite layers to d-spacings of 1.00 nm. This results in ambiguity in differentiation between illite-, vermiculite- and/or smectite-like lattice fringes. Tessier (1984) developed a method of impreg- nation of moist samples that maintains layer staking sequences and causes smectites to be permanently ex- panded for HRTEM observations. The method was re- cently tested by Kim et al. (1995), and appeared to allow unambiguous identification of illite and smectite interlayers in lattice fringe images. The purpose of this study was to compare the in- formation obtained on fine clay fractions (<0.1 Ixm) extracted from an acid soil developed from a granite saprolite, using either decomposed XRD patterns or HRTEM, SOIL MATERIAL Clays were separated from an Ochric Podzosol (R6- f&entiel P6dologique, INRA 1992) or Entic Haplor- thod (Soil Taxonomy) developed from a granite sap- rolite of the Plateau de Millevaches, Massif Central, France. The soil, located on a summit position at an elevation of 925 m, was selected as a good example of those widely distributed in this region. Some char- Copyright 1996, The Clay Minerals Society 791
Transcript
Clays and Clay Minerals, Vol. 44, No. 6, 791-800, 1996.
CHARACTERIZATION OF SOIL CLAY MINERALS: DECOMPOSITION OF X-RAY DIFFRACTION D I A G R A M S A N D HIGH-RESOLUTION ELECTRON
M I C R O S C O P Y
DOMINIQUE RIGHI 1 AND FRAN(~OISE ELSASS 2
1 URA 721 C N R S "Argiles, Sols et Alt&ations", Facult6 des Sciences, 86022 Poitiers Cedex, France
2 Station de Science du Sol, INRA, 78026 Versailles Cedex, France
Abstract--Fine clays (<0.1 Ixm) extracted from an acid soil developed in a granite saprolite from the Massif Central, France, were characterized by X-ray diffraction (XRD) using a curve decomposition program, and high-resolution transmission electron microscopy (HRTEM) associated with a method of impregnation of moist samples. Direct measurement of d-spacings were performed on HRTEM photo- graphs. Decomposition of XRD patterns indicated 5 to 6 different clay phases including chlorite (and/or hydroxy-interlayered vermiculite), vermiculite/smeetite, illite/vermiculite and illite/smectite mixed layers. Expandable phases with decreasing layer charge (vermiculite, high- and low-charge smectite) were shown in the clay assemblage. When performed on K-saturated samples subjected to wetting and drying cycles, HRTEM observations were consistent with the XRD results. The major clay mineral phases identified by the decomposition of XRD patterns were also found by direct measurement of d-spacings on HRTEM images. Vermiculite and high-charge smectite appeared to be impregnated with preservation of their initial hydration state, whereas low-charge smectite interlayers were penetrated by the resin molecules during the impregnation procedure. It was concluded that the decomposition of XRD patterns gave a realistic analysis of the clay phases present in a complex soil clay sample, as well as the direct measurement of a limited number (50) of clay crystals on HRTEM images.
Because in temperate soils the clay fractions are complex mixtures of numerous clay mineral phases, including mixed- layer minerals of different types, their characterization is generally a difficult task. These mixtures exhibit complex X R D bands combining sev- eral poorly individualized maxima. As a result, com- parison of experimental diffraction peak positions with reference tables does not permit precise identification of the constituting clay minerals. Analysis of X R D patterns using a curve decomposi t ion program (Lan- son 1993) greatly improves identification of the dif- ferent clay phases. However , decomposi t ion is no more than a mathematical treatment of the X R D dia- gram, and e lementary curves which have no mineral- ogical signification may be computed in fitting with the experimental diagram. Validation of the decom- posit ion procedure was made (Lanson and Besson 1992; Lanson and Velde 1992), but essentially for dia- genetic series with il l i te/smectite mixed- layer clays, a s impler case than a soil clay assemblage. To date, no attempt has been made to validate the results obtained by decomposi t ion of X R D patterns when performed on soil clay fractions.
H R T E M was also used to characterize soil clay min- erals (Elsass and Robert 1992; Romero et al. 1992; Aoudji t et al. 1995). Representativity of H R T E M ob- servations is quest ionable according to the very small
number of clay particles that can be observed, as com- pared with the mil l ions of those " s e e n " by XRD. An- other problem with H R T E M is the dehydration of the clay during sample preparation and subsequent col- lapse of vermiculi te and smecti te layers to d-spacings of 1.00 nm. This results in ambiguity in differentiation between illite-, vermiculi te- and/or smecti te-l ike lattice fringes. Tessier (1984) developed a method of impreg- nation of moist samples that maintains layer staking sequences and causes smectites to be pe rmanen t ly ex- panded for H R T E M observations. The method was re- cently tested by Kim et al. (1995), and appeared to al low unambiguous identification of illite and smectite interlayers in lattice fringe images.
The purpose of this study was to compare the in- formation obtained on fine clay fractions (<0.1 Ixm) extracted f rom an acid soil developed f rom a granite saprolite, using either decomposed X R D patterns or HRTEM,
SOIL M A T E R I A L
Clays were separated f rom an Ochric Podzosol (R6- f&entiel P6dologique, I N R A 1992) or Entic Haplor- thod (Soil Taxonomy) developed f rom a granite sap- rolite o f the Plateau de Mil levaches, Mass i f Central, France. The soil, located on a summit posit ion at an elevation of 925 m, was selected as a good example of those widely distributed in this region. Some char-
Copyright �9 1996, The Clay Minerals Society 791
792 Righi and Elsass Clays and Clay Minerals
Table 1. Some characteristics of the soil horizons.
Horizon A 1 Bh Bw C
Depth cm 0-15 15-35 35-50 >50 pH (H~O) 4.8 5.1 5.1 5.1 Clay (<2 p.m) g kg ~ 116 96 79 73 Organic carbon g kg 1 77 43 22 11 Fe203 CBD g kg i 13.3 12.0 8.4 6.8 A1203 CBD g kg -1 13.7 18.2 14.7 9.1 CEC cmolc kg 1 24.4 15.7 16.5 7.1
acteristics of the soil horizons are listed in Table 1. A short description of the profile is given below.
0-15 cm: A1, very dark brown (10YR 2/2) sandy loam, organic rich, strong fluffy structure, friable, many roots, clear wavy boundary.
15-35 cm: Bh, dark brown (10YR 3/3) sandy loam, weak, subangular blocky structure, friable, few roots, clear wavy boundary.
35-50 cm: Bw, dark yellowish brown (10YR 3/4) sandy loam, weak subangular blocky structure, granite gravels, few roots, diffuse smooth boundary.
>50 cm: C, dark yellowish brown (10YR 4/4) gravelly material.
METHODS
The clay fractions (<2 p,m) were obtained from the soil samples by sedimentation after destruction of or- ganic matter with diluted, Na-acetate-buffered H202 and dispersion at pH = 9 (NaOH). After treatment with citrate-bicarbonate-dithionite to remove iron ox- ides and oxyhydroxides, the bulk clay fraction was divided into fine (<0.1 p~m) and coarse (0.1-2 p,m) clay subfractions using a Beckman J2-21 centrifuge equipped with the JCF-Z continuous flow rotor.
X-ray Diffraction
XRD diagrams were obtained from oriented speci- mens using a Philips diffractometer with Fe-filtered CoKc( radiation. The diffractograms were recorded nu- merically by a DACO-MP recorder associated with a microcomputer using the Diffrac AT software (SO- CABIM, France). The XRD diagrams were then de- composed into their elementary component curves us- ing the DECOMPXR program of Lanson (1993). By run- ning a large series of tests, Lanson (1990) demonstrat- ed that the standard deviation on curve characteristics determination is induced mostly by the experimental equipment and that the calculated characteristics are representative of the sample studied. Lanson and Bes- son (1992) indicated also that a minimum difference of 0.3 ~ on peak position and 0.2 ~ on width is necessary for DECOMPXR to separate the contributions of 2 phases. The difference required for one parameter may be smaller if the difference for the other is larger, even though the elementary curve parameters (width, position, intensity) are computed independently. Back-
ground intensities were subtracted, assuming they were distributed as a straight-line curve joining the limits of the portion of the experimental diagram sub- jected to decomposition. The XRD patterns were de- composed by progressively increasing the number of elementary curves, in order to obtain a good fit with the smallest number of curves.
Pretreatments of the specimens included Ca-satura- tion and solvation with ethylene glycol and K-satura- tion and heating at 350 ~ High-charge to low-charge smectites layers were identified on the basis of re-ex- pansion with glycerol of K-saturated samples (Malla and Douglas 1987) subjected to wetting and drying cycles. Wetting and drying cycles (W/D) in the pres- ence of K ions were conducted by mixing 100 rnL of 1 M KC1 solution with 100 mg of fine clay in glass beakers, and then by drying them at 60 ~ After dry- ing, distilled water was added, and the drying cycle repeated. Sixty cycles were performed. After reaction, samples were thoroughly washed until chloride-free.
Chemical Analysis
Bulk chemical analyses were performed on the <0.1-p.m subfractions according to the procedure de- scribed by Jeauroy (1972). Si, A1, Fe, Ti, Mg, Ca, Na and K were analyzed by atomic absorption spectros- copy (AAS), Loss on ignition at 1100 ~ was mea- sured by thermogravimetric analysis (TGA) (Netzsch STA 409 EP). Accessible structural charge was mea- sured using the Cs-adsorption method developed by Anderson and Sposito (1991).
Microscopy and Image Interpretation
The K-saturated samples subjected to W/D cycles were used for HRTEM observations. The samples were processed using the technique of Tessier (1984). Randomly oriented pastes of fine clay fractions coated with agar were equilibrated at 32 hPa with pure water for 24 to 48 h. After rehydration, water was removed with methanol, and the methanol was removed with LR White resin, a polymer of low viscosity. After po- lymerization of the resin at 60 ~ the samples were sectioned at 50 nm by ultramicrotomy using a Reichert Ultracut E microtome.
One-dimensional HRTEM and bright-field lattice fringe imaging was performed on numerous fields for each sample. The microscope was a Philips 420 STEM working at 120-kV accelerating voltage with a 40-p.m objective aperture, eliminating lattice periodicities smaller than 0.35 nm. Photographs were taken in un- derfocus conditions, the optimal defocus being deter- mined between 100 and 150 nm in order to visualize simultaneously both 1.0- and 1.4-nm periodicities with a favorable transfer efficiency in the microscope. Zero focus is obtained on the carbon support. The preset magnification of • 51,000 was applied (accuracy of magnification is regularly checked with a standard
Vol. 44, No. 6, 1996 Decomposition of X-ray patterns and HRTEM 793
g
b C a - E G
i 4
~b 2b sb ~174
0 3
i !
6 8 10 ~174
e K - 3 5 0 ~
!
7 9 11 !
~174
d K - W / D cyc les
f 1 5 '7 9 020
e K - g l y c e r o l
! I I
5 7 9 ~174
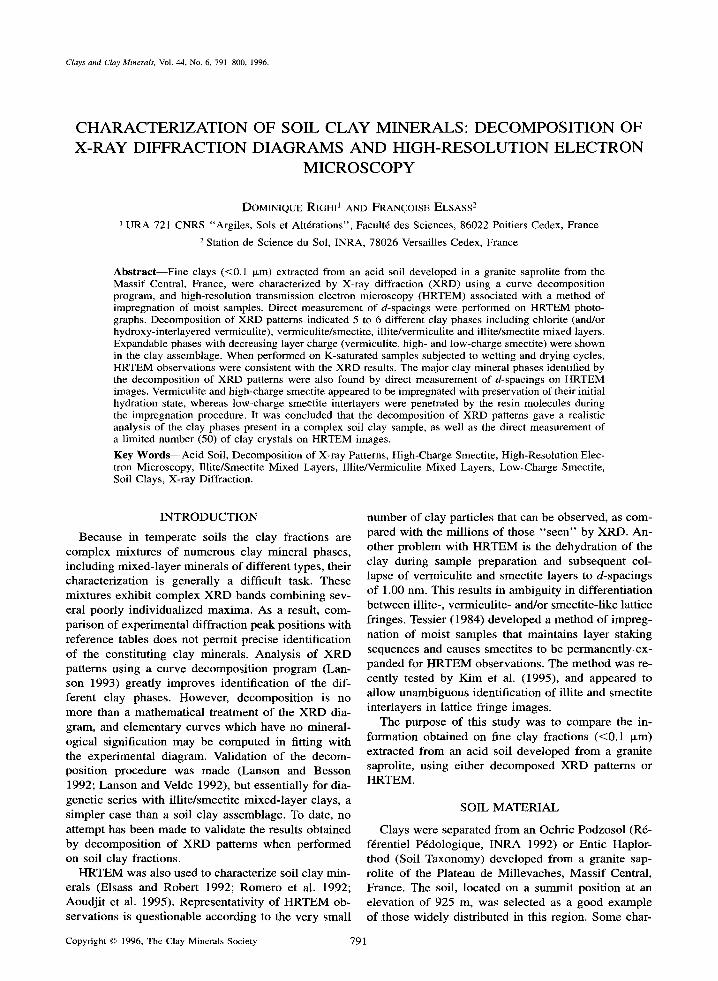
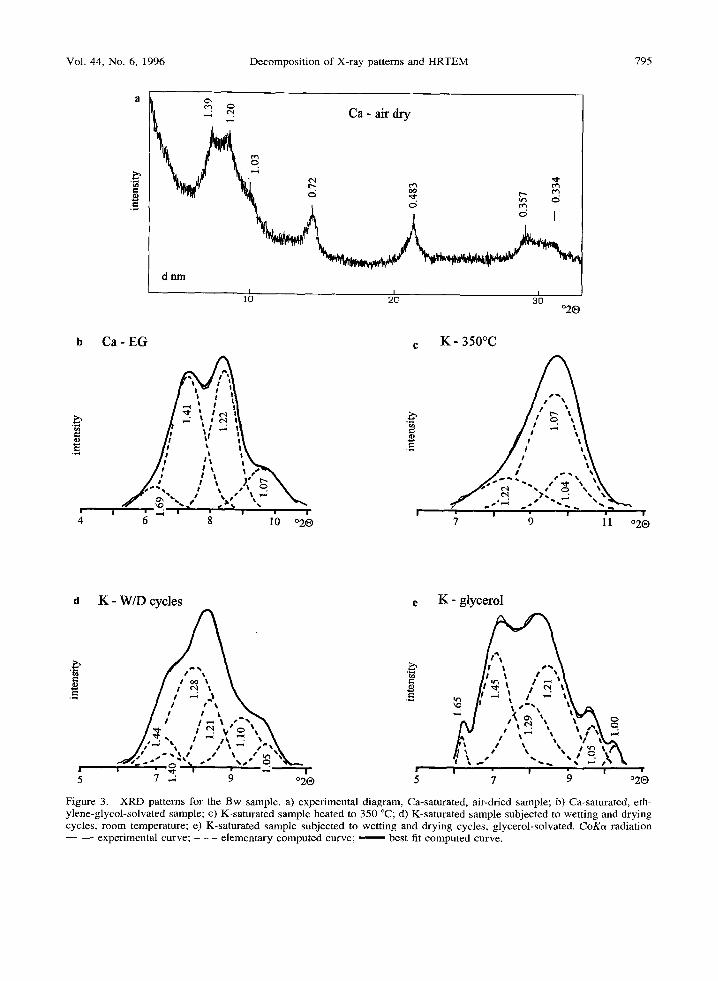
Figure I. XRD patterns for the A1 sample, a) experimental diagram, Ca-saturated, air-dried sample; b) Ca-saturated, ethylene- glycol-solvated sample; c) K-saturated sample heated to 350 ~ d) K-saturated sample subjected to wetting and drying cycles, room temperature; e) K-saturated sample subjected to wetting and drying cycles, glycerol-solvated. CoKt~ radiation experimenta/curve; - - - elementary computed curve; ' best fit computed curve.
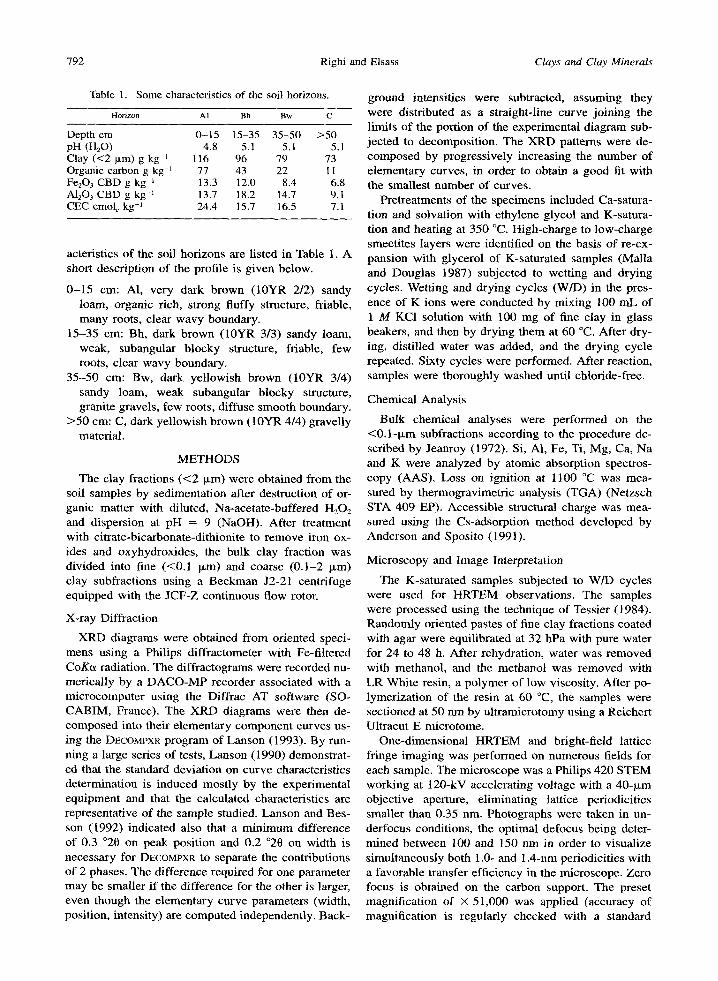
Figure 2. XRD patterns for the Bh sample, a) experimental diagram, Ca-saturated, air-dried sample; b) Ca-saturated, ethylene- glycol-solvated sample; c) K-saturated sample heated to 350 ~ d) K-saturated sample subjected to wetting and drying cycles, room temperature; e) K-saturated sample subjected to wetting and drying cycles, glycerol-solvated. CoKc~ radiation - - experimental curve; - - - elementary computed curve; best fit computed curve.
Vol. 44, No. 6, 1996 Decomposition of X-ray patterns and HRTEM 795
~ Ca- air dry
" 6 ~ , ~
d n m I
~
b C a - E G c K - 350~
._~
! " I " " �9 !
6 8 10 ~ 7 9 11 o20
d K - W/D cycles e K - glycerol
; " , ; , , 7 ~ 9 020 7 ~ i
i
~174
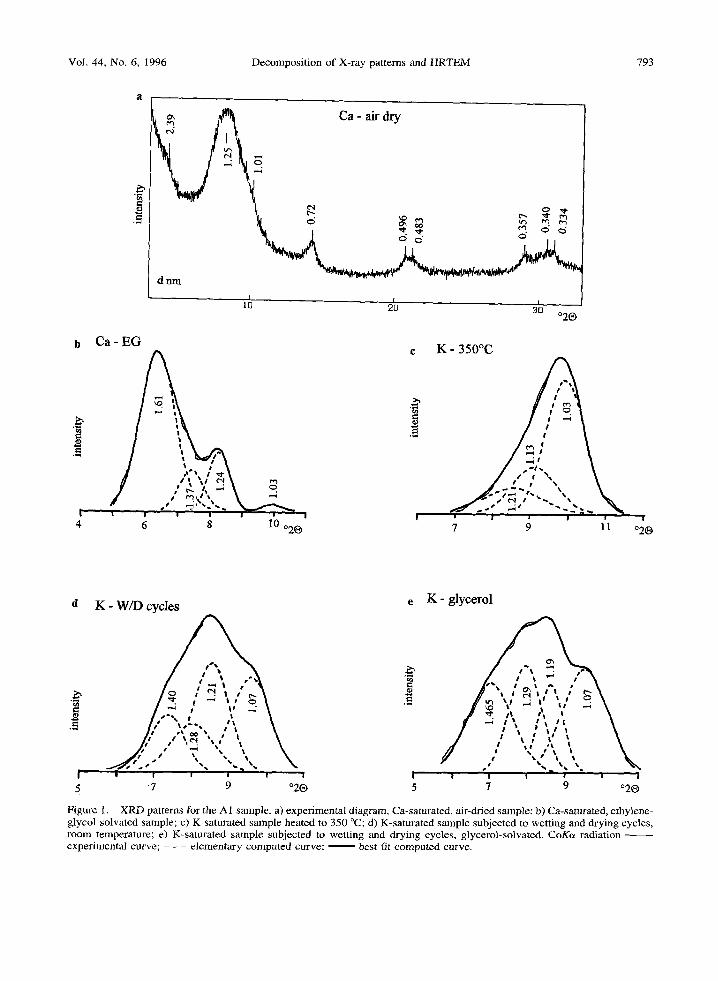
Figure 3. XRD patterns for the Bw sample, a) experimental diagram, Ca-saturated, air-dried sample; b) Ca-saturated, eth- ylene-glycol-solvated sample; c) K-saturated sample heated to 350 ~ d) K-saturated sample subjected to wetting and drying cycles, room temperature; e) K-saturated sample subjected to wetting and drying cycles, glycerol-solvated. CoK~x radiation
experimental curve; - - - elementary computed curve; best fit computed curve.
r - ~ x - - x - - x - - x - x - - x - - ~ - - ~ ~ x - -
d (nm)
Bh horizon
,,, I,,,l,,,I v - ~ ~ ~ x - - x - - x - - ~ - x - - x - - ~ x - - x - -
d (nm)
Bw horizon
,i,i1,1,,, , , I I I I I ; I , I I i i , , l l , l , l l l l l l l l , l l t . l l l ~
v - x - - ~ v - - v - - x - - v - v - v - x - - v - . r
d Into)
mica sample). Measurements of the images were made directly from the negatives by means of a stereo-mi- croscope equiped with a rnicrometric scale. Error on one measurement was estimated to 0.02 nm.
Values of interlayer spacings were obtained by di- viding the thickness of the stack of layers by the num- ber of interlayers. Thickness was measured between the centers of the 2 external layers, at the maximum intensity of the lattice fringe. Only stacks of layers of strictly parallel orientation (called "crystals" accord- ing to the nomenclature of Tessier 1984, and regarded as the coherent scattering domains from the viewpoint of XRD), either present as individual small particles or as sub-units of larger quasi-crystals, were measured. At least 50 crystals were measured for each sample.
RESULTS
XR Diffraction
A1 HORIZON SAMeLE. The decomposition of the XRD diagram for the glycolated sample in the 4-11 ~ re- gion gave 4 basic curves with maximum intensities at d = 1.610, 1.384, 1.240 and 1.033 nm (Figure lb). In the 18-23 ~ region, 5 peaks were obtained at d = 0.542, 0.520, 0.496, 0.483 and 0.471 nm (not shown) and 5 peaks were observed at d = 0.357, 0.350, 0.340, 0.334 and 0.326 nm in the 28-33 ~ region (not shown).
According to simulations with the NEWMOD program (Reynolds 1985), the peak at 1.610 nm associated with that at 0.340 nm was attributed to vermiculite (or chlo- rite)/smectite mixed layers with approximately 80% smectite. Associated with those at d = 0.483 and 0.350 nm, the peak at 1.384 nm indicated illite/verrniculite (or chlorite) mixed layers with 80% vermiculite. The peak at 0.124 nm associated with the superstructure reflection near 2.450 nm was taken as evidence for a fully ordered interstratified illite/vermiculite (or chlo- rite) mineral with 50% illite. The peaks at d = 1.033, 0.496 and 0.334 nm indicated illitic layers and those at d = 0.542 and 0.521 nm in the 18-23 ~ region were typical of illite/smectite mixed layers with either 50 or 80% illite. The peak at 0.471 nm in the 18-23 ~ region indicated chlorite layers, and that at 0.357 in the 28-33 ~ region indicated kaolinite layers.
Three basic curves with their maximum at 1.207, 1.129 and 1.035 nm were obtained from the XRD di- agram of the sample K-saturated and heated to 350 ~ (Figure lc) indicating interstratification with uncol- lapsed layers with a hydroxide sheet (chlorite and/or hydroxy-A1 vermiculite layers). The lack of peak near
(----
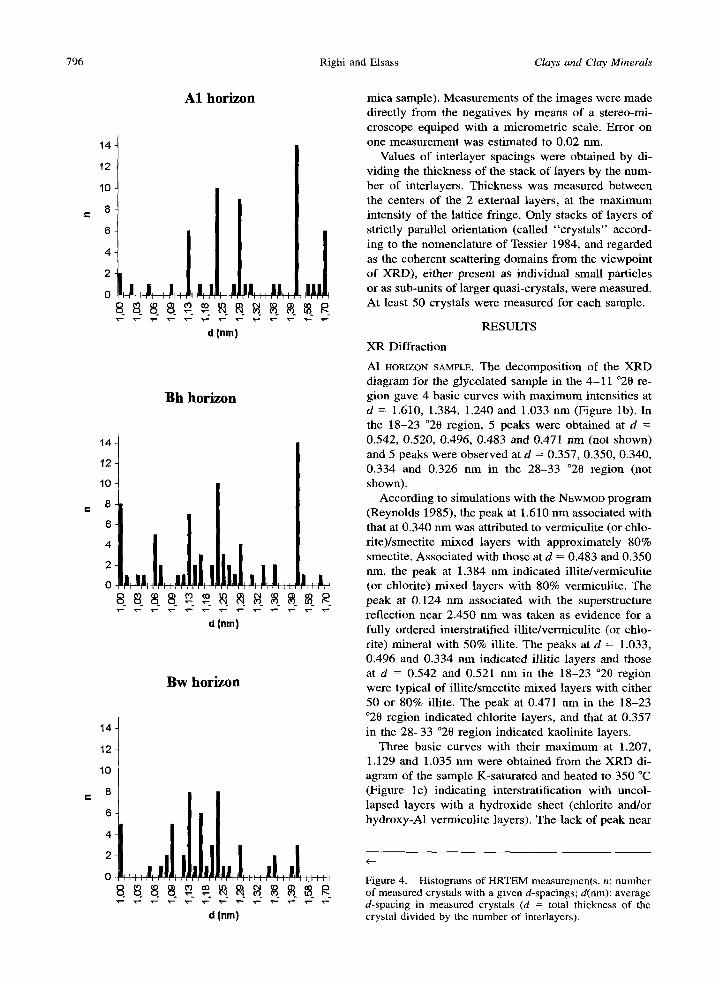
Figure 4. Histograms of HRTEM measurements, n: number of measured crystals with a given d-spacings; d(nm): average d-spacing in measured crystals (d = total thickness of the crystal divided by the number of interlayers).
Vol. 44, No. 6, 1996 Decomposition of X-ray patterns and HRTEM 797
Table 2. Data obtained from measurements of HRTEM im- ages.
A1 horizon ? d (nm) 1.13 1.21 1.29 1.45 1.70 5; n crystals 6 10 9 14 6 w Nm~,; Nma x 4; 7 2; 9 4; 7 2; 8 3; 5
t d(nm): average d-spacings in measured crystals (d = total thickness of the crystal divided by the number of interlayers).
n: number of measured crystals with a given d-spacing. w Nmi,; Nmax: minimum and maximum number of layers in
measured crystals.
1.40 n m was a t t r ibuted to a low thermal stabil i ty of the chlorite, as of ten obse rved for wea thered chlor i te (Righi et al. 1993).
The X R D d iagram f rom the K-satura ted sample sub- j ec ted to W / D cycles was decomposed in the 5 -11 ~ region. Four bas ic curves were obta ined wi th thei r m a x i m a at d = 1.400, 1.284, 1.210 and 1.075 n m (Fig- ure ld) . The peak at 1.400 n m indicated uncol lapsed layers o f chlor i te and /or hydroxy- in te r layered vermic- ulite. The peak at 1.210 n m was taken as ev idence for s ingle- layer water smecti te , but par t of its in tensi ty could be g iven by interstrat i f icat ion of unco l lapsed layers (1.400 nm) wi th illitic layers. The 1.075-rim peak was a t t r ibuted to interstrat i f icat ion o f illitic layers and/or fully col lapsed vermicu l i t e wi th smect i te or ver- micul i te layers in the s ingle- layer wate r hydra ta t ion state (d = 1.210 to 1.160 nm). The peak at d = 1.284 n m was in terpre ted as s ingle- layer water smect i te /un-
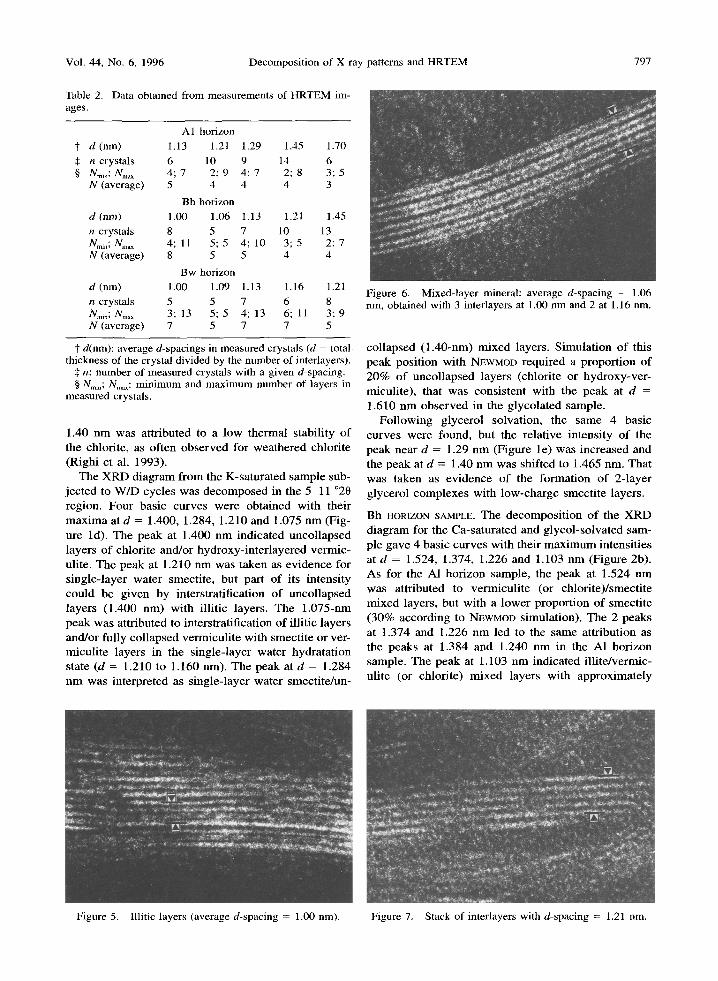
Figure 6. Mixed-layer mineral: average d-spacing - 1.06 nm, obtained with 3 interlayers at 1.00 nm and 2 at 1.16 nm.
col lapsed (1 .40-nm) mixed layers. S imula t ion of this peak posi t ion wi th NEWMOD required a p ropor t ion of 20% of uncol lapsed layers (chlori te or hydroxy-ver - micul i te) , that was cons is ten t wi th the peak at d = 1.610 n m obse rved in the glycola ted sample.
Fo l lowing glycerol solvat ion, the same 4 basic cu rves were found, bu t the relat ive in tensi ty of the peak near d = 1.29 n m (Figure l e ) was increased and the peak at d = 1.40 n m was shif ted to 1.465 nm. Tha t was taken as ev idence of the fo rmat ion o f 2- layer glycerol complexes wi th low-charge smect i te layers.
B h HORIZON SAMPLE. The decompos i t ion o f the X R D d iagram for the Ca-sa tura ted and g lycol -so lva ted sam- ple gave 4 basic cu rves wi th thei r m a x i m u m intensi t ies at d = 1.524, 1.374, 1.226 and 1.103 n m (Figure 2b). As for the A1 hor i zon sample, the peak at 1.524 n m was at t r ibuted to vermicul i te (or chlor i te ) / smect i te mixed layers, but wi th a lower propor t ion o f smect i te (30% accord ing to NEWMOD simulat ion) . The 2 peaks at 1.374 and 1.226 n m led to the same at t r ibut ion as the peaks at 1.384 and 1.240 n m in the AI hor izon sample. The peak at 1.103 n m indica ted i l l i te /vermic- uli te (or chlori te) mixed layers wi th approx imate ly
Figure 5. Illitic layers (average d-spacing = 1.00 nm), Figure 7, Stack of interlayers with d-spacing = 1.21 nm.
798 Righi and Elsass Clays and Clay Minerals
Figure 8. Mixed-layer mineral: average d-spacing = 1.29 rim, obtained with 2 interlayers at 1.36 nm and one at 1.18 r i m .
80% illite. In the 18-23 ~ region (not shown), no peak characteristic of illite/smectite mixed layers was observed in this sample.
The XRD diagram from the K-saturated and heated sample was identical to that of the equivalent sample from the AI horizon (Figure 2c).
The decomposition of XRD diagram from the K-sa- turated sample subjected to W/D cycles gave quite the same basic curves (Figure 2d) as the equivalent A1 horizon sample, except that 2 basic curves were found with their maximum near 1.40 rim, indicating 2 dif- ferent mineral phases that could be chlorite (1.408 nm) and hydroxy-vermiculite (1.440 rim). In this sample, the 1.281 nm peak was the most intense, but not the one at 1.210 nm, as with the A1 sample. That could be attributed to a greater amount of uncollapsed (1.40- rim) layers in the Bh sample. Following glycerol sol- vation, a curve with its maximum at d > 1.40 nm, indicating low-charge smectite layers (2-layer glycerol complexes), was also observed in this sample (Figure 2e). The peak at 1.281 nm present in the K-saturated W/D sample was absent after glycerol solvatation, but a peak at 1.399 nm was observed. That could be in- terpreted by the transformation in the 1.281-nm mixed-layer phase of the single-layer water smectite component by a single-layer glycerol smectite com- plex (d = 1.39 nm); therefore, this smectite would be of a high-charge type.
Bw HORIZON SAMPLE. The decomposition of XRD di- agram from the Ca-saturated, glycol-solvated sample gave 4 basic curves with their maxima at d = 1.634, 1.407, 1.221 and 1.066 nm (Figure 3b). The intensity of the 1.634 peak was very low, with the 2 most in- tense peaks at d = 1.047 and 1.221 nm. Compared to the Bh sample, the relative intensity of the peak be- tween 1.00 and 1.10 nm (illite-rich phase) was greater in this sample. Attribution of the peak at 1.407 and 1.221 nm was the same as for the equivalent peaks in the AI and Bh samples.
Three basic curves were obtained by decomposition of the XRD diagram from the K-saturated and heated sample (Figure 3c). Compared to the 2 other equiva- lent samples, the position of the most intense peak (1.067 nm) was shifted toward small 20 angles, indi- cating a larger proportion of uncollapsed layers (chlo- rite and/or hydroxy-A1 vermiculite) in this sample.
The decomposition of the XRD diagram from the K-saturated W/D sample (Figure 3d) gave the same basic curves as for the equivalent Bh sample. Peak positions were not affected by glycerol solvation. Only the relative intensities of the peaks near 1.28 and 1.44 nm were changed; the first one decreased, while the second increased (Figure 3e). As for the Bh sample, this suggested the occurrence of high-charge smectite layers.
HRTEM Observations
The number of interlayers measured in one crystal varied from 1 (bi-layer crystal) to a maximum of 15. The average number ranged from 4 (A1 horizon sam- ple) to 6 (Bw horizon). The lateral extent of the crys- tals was rather short, the average size being 30-40 rim.
Figure 10. Two interlayers with 1.70 nm d-spacing.
Vol. 44, No. 6, 1996 Decomposition of X-ray patterns and HRTEM 799
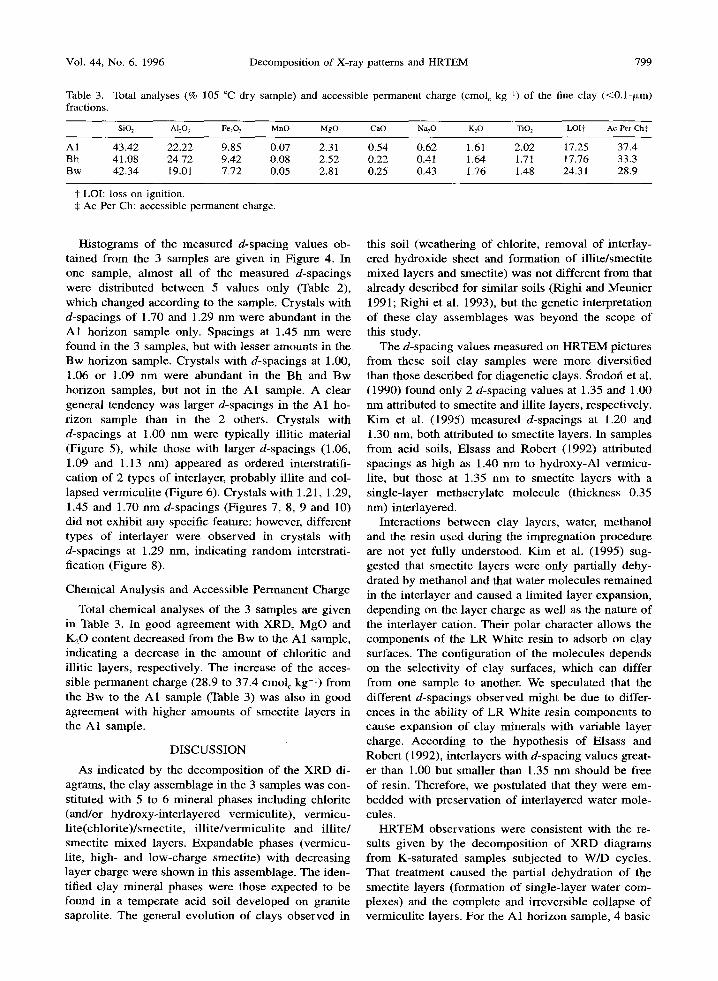
Table 3. Total analyses (% 105 ~ dry sample) and accessible permanent charge (cmol c kg -l) of the fine clay (<0.1-p~m) fractions.
S i t 2 AI203 Fe203 MnO MgO C a t Na20 KzO T i t 2 LOlt Ac Per ChJ;
? LOI: loss on ignition. $ Ac Per Ch: accessible permanent charge.
Histograms of the measured d-spacing values ob- tained from the 3 samples are given in Figure 4. In one sample, almost all of the measured d-spacings were distributed between 5 values only (Table 2), which changed according to the sample. Crystals with d-spacings of 1.70 and 1.29 nm were abundant in the A1 horizon sample only. Spacings at 1.45 nm were found in the 3 samples, but with lesser amounts in the. Bw horizon sample. Crystals with d-spacings at 1.00, 1.06 or 1.09 nm were abundant in the Bh and Bw horizon samples, but not in the AI sample. A clear general tendency was larger d-spacings in the A1 ho- rizon sample than in the 2 others. Crystals with d-spacings at 1.00 nm were typically illitic material (Figure 5), while those with larger d-spacings (1.06, 1.09 and 1.13 nm) appeared as ordered interstratifi- cation of 2 types of interlayer, probably illite and col- lapsed vermiculite (Figure 6). Crystals with 1.21, 1.29, 1.45 and 1.70 nm d-spacings (Figures 7, 8, 9 and 10) did not exhibit any specific feature: however, different types of interlayer were observed in crystals with d-spacings at 1.29 nm, indicating random interstrati- fication (Figure 8).
Chemical Analysis and Accessible Permanent Charge
Total chemical analyses of the 3 samples are given in Table 3. In good agreement with XRD, MgO and KzO content decreased from the Bw to the A1 sample, indicating a decrease in the amount of chloritic and illitic layers, respectively. The increase of the acces- sible permanent charge (28.9 to 37.4 cmol~ kg 1) from the Bw to the AI sample (Table 3) was also in good agreement with higher amounts of smectite layers in the A 1 sample.
DISCUSSION
As indicated by the decomposition of the XRD di- agrams, the clay assemblage in the 3 samples was con- stituted with 5 to 6 mineral phases including chlorite (and/or hydroxy-interlayered vermiculite), vermicu- lite(chlorite)/smectite, illite/vermiculite and illite/ smectite mixed layers. Expandable phases (vermicu- lite, high- and low-charge smectite) with decreasing layer charge were shown in this assemblage. The iden- tified clay mineral phases were those expected to be found in a temperate acid soil developed on granite saprolite. The general evolution of clays observed in
this soil (weathering of chlorite, removal of interlay- ered hydroxide sheet and formation of illite/smectite mixed layers and smectite) was not different from that already described for similar soils (Righi and Meunier 1991; Righi et al. 1993), but the genetic interpretation of these clay assemblages was beyond the scope of this study.
The d-spacing values measured on HRTEM pictures from these soil clay samples were more diversified than those described for diagenetic clays. ~rodofi et al. (1990) found only 2 d-spacing values at 1.35 and 1.00 nm attributed to smectite and illite layers, respectively. Kim et al. (1995) measured d-spacings at 1.20 and 1.30 nm, both attributed to smectite layers. In samples from acid soils, Elsass and Robert (1992) attributed spacings as high as 1.40 nm to hydroxy-Al vermicu- lite, but those at 1.35 nm to smectite layers with a single-layer methacrylate molecule (thickness 0.35 nm) interlayered.
Interactions between clay layers, water, methanol and the resin used during the impregnation procedure are not yet fully understood. Kim et al. (1995) sug- gested that smectite layers were only partially dehy- drated by methanol and that water molecules remained in the interlayer and caused a limited layer expansion, depending on the layer charge as well as the nature of the interlayer cation. Their polar character allows the components of the LR White resin to adsorb on clay surfaces. The configuration of the molecules depends on the selectivity of clay surfaces, which can differ from one sample to another. We speculated that the different d-spacings observed might be due to differ- ences in the ability of LR White resin components to cause expansion of clay minerals with variable layer charge. According to the hypothesis of Elsass and Robert (1992), interlayers with d-spacing values great- er than 1.00 but smaller than 1.35 nm should be free of resin. Therefore, we postulated that they were em- bedded with preservation of interlayered water mole- cules.
HRTEM observations were consistent with the re- sults given by the decomposition of XRD diagrams from K-saturated samples subjected to W/D cycles. That treatment caused the partial dehydration of the smectite layers (formation of single-layer water com- plexes) and the complete and irreversible collapse of vermiculite layers. For the A1 horizon sample, 4 basic
800 Righi and Elsass Clays and Clay Minerals
curves with their maxima at 1.40, 1.28, 1.21 and 1.075 nm were obtained by decomposi t ion of the X R D dia- gram. These peaks could be attributed to the crystals with d-spacings measured at 1.45, 1.29, 1.21 and 1.13 nm on H R T E M pictures. According to H R T E M ob- servations, crystals with d-spacings at 1.70 nm were a major component of the clay assemblage. They could be attributed to smecti te layers with molecules of resin interlayered. In this sample, solvation with glycerol has shown that a 2-layer glycerol complex was formed with the low-charge K-saturated smecti te layers. Al- though the organic molecule was not the same, that supported the hypothesis of possible penetration of resin components in the interlayer of low-charge smec- tite saturated with monovalent cation.
Identical remarks could be made for the Bh and Bw horizon samples. Moreover , the lower proportion of smecti te layers, which were mainly high-charge layers (XRD result) in these 2 samples, was in good agree- ment with the lack of crystals with d-spacings at 1.70 nm on their H R T E M pictures. The greater amount of crystals with d-spacings at 1.00 nm in the Bh and Bw samples was also consistent with the X R D peaks near 1.03 nm found by decomposi t ion in these samples, but not in the A1 horizon. Both techniques, H R T E M and decomposi t ion of X R D diagrams, indicated more illitic layers and less smecti te (especially low-charge) layers in the Bh and Bw horizon samples than in the A1 one.
C O N C L U S I O N
Characterization o f clay minerals in the fine clay (<0.1-p~m) fraction of a temperate acid soil, either by H R T E M or decomposi t ion of X R D diagrams, gave consistent results. Expandable layers (vermiculite, high- and low-charge smectite) behave differently when subjected to the Tessier 's impregnat ion proce- dure needed for H R T E M observations. In K-saturated samples, the resin molecules would penetrate low- charge smecti te interlayers only, but vermiculi te and high-charge smecti te layers appeared to have been em- bedded in the resin with preservat ion of their initial hydration state. This behavior was more or less similar to that o f K-saturated samples solvated with glycerol.
Peak positions for the basic curves obtained by de- composi t ion of the X R D diagrams indicated d-spac- ings in good agreement with those measured directly on crystals by HRTEM. Therefore, it appeared that decomposi t ion of X R D diagrams gave a realistic anal- ysis o f complex clay assemblages. F rom the other side, H R T E M observations with the measurement of a lim- ited number of crystals (about 50) also led to a valu- able est imation of the different components in the clay mixture. Moreover, the chemical composi t ion of the
main components might be obtained using analytical electron microscopy.
R E F E R E N C E S
Anderson S J, Sposito G. 1991. Cesium-adsorption method for measuring accessible structural surface charge. Soil Sci Soc Am J 55:1569-1576.
Aoudjit H, Robert M, Elsass E Curmi P 1995. Detailed study of smectite genesis in granite saprolites by analytical elec- tron microscopy. Clay Miner 30:135 148.
Elsass E Robert M. 1992. Application of high resolution electron microscopy to soil clay origin and organization in a temperate climate. Geologica Carpathica Ser Clays 2:55- 61.
INRA 1992. Rrfrrentiel Prdologique. Principaux sols d'Eu- rope. Paris: Institut National de la Recherche Agronomique (INRA). 222 p.
Jeanroy E. 1972. Analyse totale des silicates naturels par spectrophotometrie d'absorption atomique. Application au sol et ~t ses constituants. Chim Anal 54:159-166.
Kim J-W, Peacor DR, Tessier D, Elsass E 1995. A technique for maintaining texture and permanent expansion of smec- rite interlayers for TEM observations. Clays Clay Miner 43:51-57.
Lanson B. 1990. Mise en 6vidence des m~canismes de trans- formation des interstratifirs illite/smectite au cours de la diagenrse [thesis]. Paris: Univ of Paris VL 366 p.
Lanson B. 1993. DECOMPXR, X-ray diffraction pattern de- composition program. Poitiers, France: ERM. 48 p.
Lanson B, Besson G. 1992. Characterization of the end of smectite-to-illite transformation: decomposition of the X-ray patterns. Clays Clay Miner 40:40-52.
Lanson B, Velde B. 1992. Decomposition of X-ray diffrac- tion patterns: a convenient way to describe complex US diagenetic evolution. Clays Clay Miner 40:629-643.
Malla PB, Douglas LA. 1987. Identification of expanding layer silicates: layer charge vs. expansion properties. In: Schultz LG, van Olphen H, Mumpton FA, editors. Pro- ceedings of the International Clay Conference; 1985; Den- ver. Bloomington, Indiana: The Clay Minerals Society. p 227-283.
Reynolds RC. 1985. Description of program NEWMOD for the calculation of the one-dimensional X-ray diffraction patterns of mixed-layered Clays. Hanover, New Hampshire: Reynolds RC, 8 Brook Road. 24 p.
Righi D, Meunier A. 1991. Characterization and genetic in- terpretation of clays in an acid brown soil (Dystrochrept) developed in a granitic saprolite. Clays Clay Miner 39: 519-530.
Righi D, Petit S, Bouchet A. 1993. Characterization of by- droxy-interlayered vermiculite and illite/smectite interstra- tiffed minerals from the weathering of chlorite in a Cryor- thod. Clays Clay Miner 41:484-495.
Romero R, Robert M, Elsass E Garcia C. 1992. Abundance of halloysite in soils developed from crystalline rocks. Con- tribution of transmission microscopy. Clay Miner 39:137- 141.
grodofi J, Andreoli C, Elsass E Robert M. 1990. Direct high- resolution transmission electron microscopic measurement of expandability of mixed-layer illite/smectite in bentonite rock. Clays Clay Miner 38:373-379.
Tessier D. 1984. Etude exprrimentale de l'organisation des matrriaux argileux [thesis]. Paris: Univ of Paris VII. Ver- sailles, France: INRA. 361 p. (Received 26 October 1995; accepted 15 February 1996;


![Finale 2004 - [Showtime I - Fullscore Harmonie.MUS]£ ã ã bb bb bb # # # # b b bb bb bb bb bb bb 44 44 44 44 44 44 44 44 44 44 44 44 44 44 44 44 44 44 44 44 44 44 4 4 4 4 4 4 4 4](https://static.documents.pub/doc/80x56/5b08e3307f8b9a520e8d5803/finale-2004-showtime-i-fullscore-bb-bb-bb-b-b-bb-bb-bb-bb-bb-bb-44.jpg)
