1 A REPORT TO NOAA DEEP-SEA CORAL RESEARCH AND TECHNOLOGY PROGRAM A CHARACTERIZATION OF THE SPONGE COMMUNITY IN THE REGION OF GRAYS CANYON, WA FROM A SURVEY USING AN AUTONOMUS UNDERWATER VEHICLE OCTOBER 2010 M. Elizabeth Clarke 1 and Erica Fruh 2 1 NOAA Fisheries, NWFSC, Seattle, WA 2 NOAA Fisheries, NWFSC, Newport, OR Contact Information NOAA NWFSC [email protected]Purpose Survey sponge area in region near Gray’s Canyon, WA Vessel OSU Vessel Pacific Storm Science Observers Elizabeth Clarke, Erica Fruh, Jeremy Taylor, Russell Haner, Chris Murphy External Video Tapes None Internal Video Tapes None Digital Still Photos 22561 Positioning System Ship: GPS; AUV: USBL CTD Sensors Yes O 2 Sensor No pH Sensor No Specimens collected No Report Authors Elizabeth Clarke, Erica Fruh
Transcript
1
CHARACTERIZATION OF SPONGE SITE STUDY SITE: GRAYS CANYON A REPORT TO NOAA DEEP-SEA CORAL RESEARCH AND TECHNOLOGY PROGRAM
A CHARACTERIZATION OF THE SPONGE COMMUNITY IN THE REGION OF GRAYS CANYON, WA FROM A SURVEY USING AN
AUTONOMUS UNDERWATER VEHICLE OCTOBER 2010
M. Elizabeth Clarke1 and Erica Fruh2
1 NOAA Fisheries, NWFSC, Seattle, WA
2 NOAA Fisheries, NWFSC, Newport, OR
Contact Information NOAA NWFSC [email protected] Purpose Survey sponge area in region near Gray’s Canyon, WA Vessel OSU Vessel Pacific Storm
Science Observers Elizabeth Clarke, Erica Fruh, Jeremy Taylor, Russell Haner, Chris Murphy
External Video Tapes None Internal Video Tapes None Digital Still Photos 22561 Positioning System Ship: GPS; AUV: USBL CTD Sensors Yes O2 Sensor No pH Sensor No Specimens collected No Report Authors Elizabeth Clarke, Erica Fruh
2
CHARACTERIZATION OF SPONGE SITE STUDY SITE: GRAYS CANYON
INTRODUCTION AND SCIENTIFIC OBJECTIVES
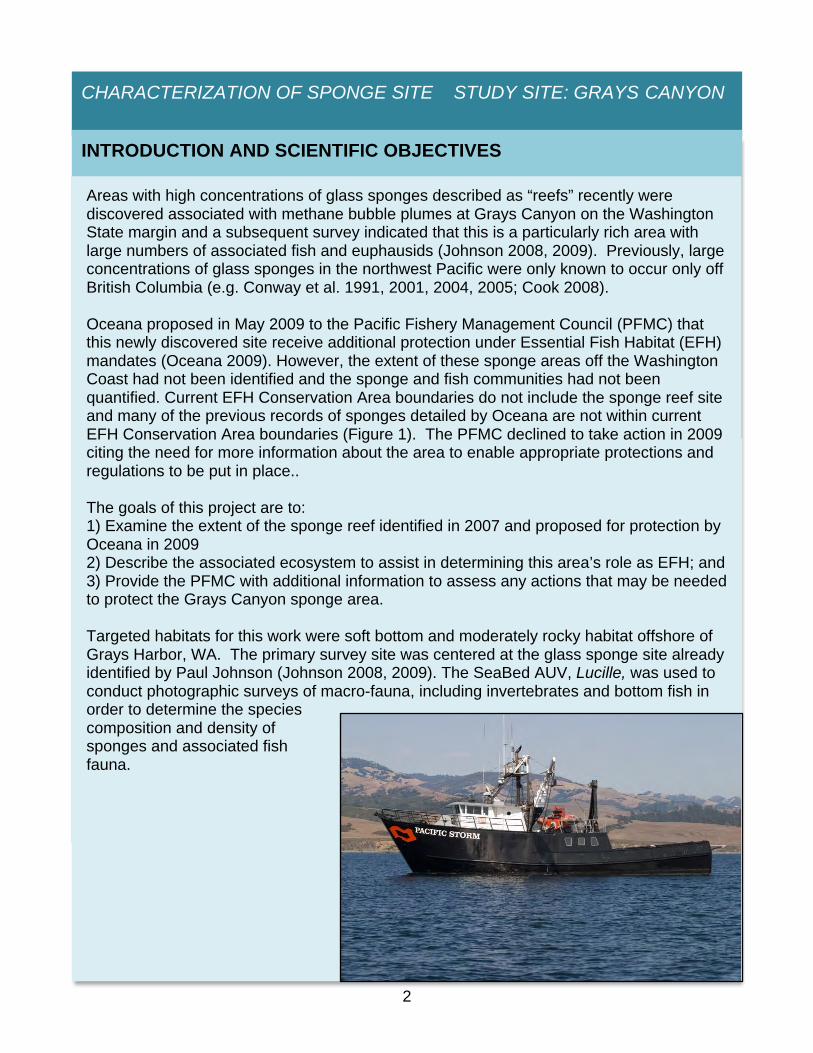
Areas with high concentrations of glass sponges described as “reefs” recently were discovered associated with methane bubble plumes at Grays Canyon on the Washington State margin and a subsequent survey indicated that this is a particularly rich area with large numbers of associated fish and euphausids (Johnson 2008, 2009). Previously, large concentrations of glass sponges in the northwest Pacific were only known to occur only off British Columbia (e.g. Conway et al. 1991, 2001, 2004, 2005; Cook 2008). Oceana proposed in May 2009 to the Pacific Fishery Management Council (PFMC) that this newly discovered site receive additional protection under Essential Fish Habitat (EFH) mandates (Oceana 2009). However, the extent of these sponge areas off the Washington Coast had not been identified and the sponge and fish communities had not been quantified. Current EFH Conservation Area boundaries do not include the sponge reef site and many of the previous records of sponges detailed by Oceana are not within current EFH Conservation Area boundaries (Figure 1). The PFMC declined to take action in 2009 citing the need for more information about the area to enable appropriate protections and regulations to be put in place.. The goals of this project are to: 1) Examine the extent of the sponge reef identified in 2007 and proposed for protection by Oceana in 2009 2) Describe the associated ecosystem to assist in determining this area’s role as EFH; and 3) Provide the PFMC with additional information to assess any actions that may be needed to protect the Grays Canyon sponge area. Targeted habitats for this work were soft bottom and moderately rocky habitat offshore of Grays Harbor, WA. The primary survey site was centered at the glass sponge site already identified by Paul Johnson (Johnson 2008, 2009). The SeaBed AUV, Lucille, was used to conduct photographic surveys of macro-fauna, including invertebrates and bottom fish in order to determine the species composition and density of sponges and associated fish fauna.
3
CHARACTERIZATION OF SPONGE SITE STUDY SITE: GRAYS CANYON
Study Site
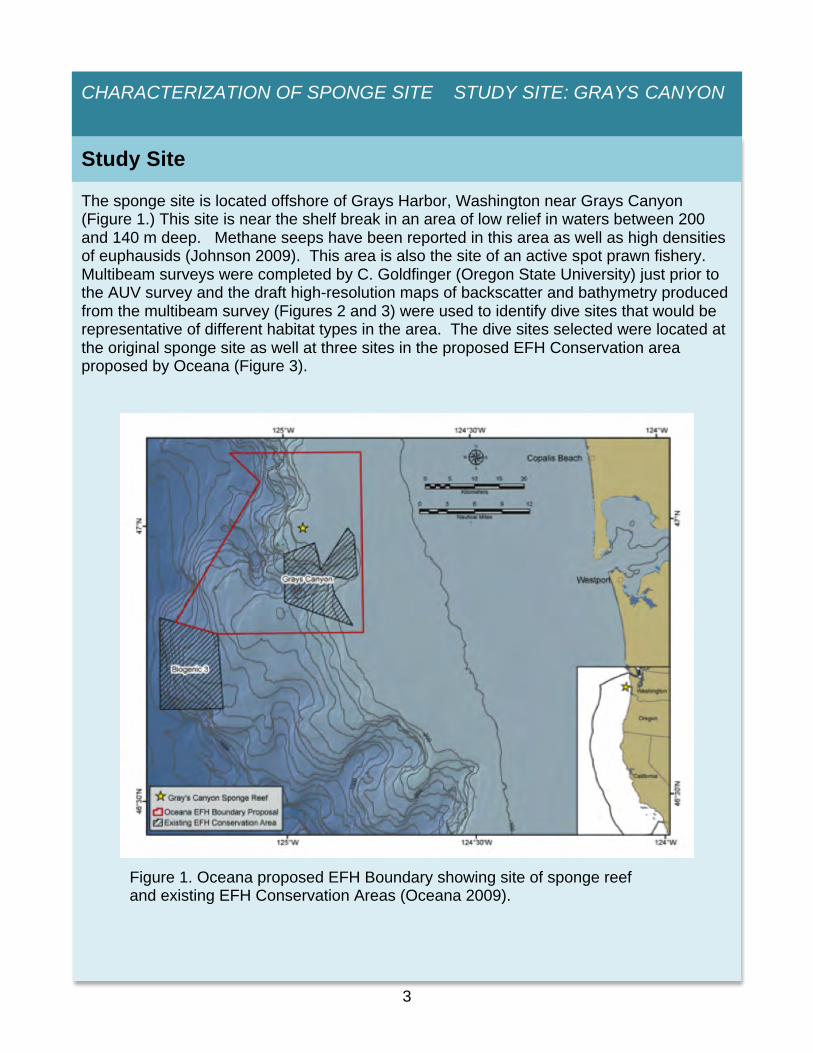
Figure 1. Oceana proposed EFH Boundary showing site of sponge reef and existing EFH Conservation Areas (Oceana 2009).
The sponge site is located offshore of Grays Harbor, Washington near Grays Canyon (Figure 1.) This site is near the shelf break in an area of low relief in waters between 200 and 140 m deep. Methane seeps have been reported in this area as well as high densities of euphausids (Johnson 2009). This area is also the site of an active spot prawn fishery. Multibeam surveys were completed by C. Goldfinger (Oregon State University) just prior to the AUV survey and the draft high-resolution maps of backscatter and bathymetry produced from the multibeam survey (Figures 2 and 3) were used to identify dive sites that would be representative of different habitat types in the area. The dive sites selected were located at the original sponge site as well at three sites in the proposed EFH Conservation area proposed by Oceana (Figure 3).
4
CHARACTERIZATION OF SPONGE SITE STUDY SITE: GRAYS CANYON
Figure 2. Draft map of backscatter of the area around the sponge site. (provided by C. Goldfinger, Oregon State University)
5
CHARACTERIZATION OF SPONGE SITE STUDY SITE: GRAYS CANYON
!!"#$!%!
!!"#$!&!
!!"#$!'!
!!"#$!(!
!!"#$!)!
Figure 3. Survey sites on draft map of high resolution bathymetry of the area. (map provided by C. Goldfinger, Oregon State University)
6
CHARACTERIZATION OF SPONGE SITE STUDY SITE: GRAYS CANYON
Field Survey Methods
Underwater surveys of sponges, habitats and associated fishes were conducted using the SeaBed type Autonomous Underwater Vehicle (AUV) Lucille deployed from Oregon State University’s Vessel Pacific Storm 20 September - 23 September 2010. Images of the seafloor were collected using two 5 Megapixel,12 bit dynamic range Prosilica GigE cameras. One camera was mounted to look directly downward and the second camera was angled forward at 30°. Lighting was provided by a strobe synced with the cameras. Two downward parallel lasers were used to estimate the sizes of organisms in photographs. The AUV was equipped with two navigational sensors: the RDI 1200 kHz Doppler Velocity Log and the iXSea OCTANS Inertial Navigation. The AUV was tracked using a Link Quest TrackLink 1510 MAH USBL navigation system. Subsurface communication was provided by the WHOI 256008 acoustic micromodem and surface communication used a FreeWave FGR-115 RCRF radio modem. Depth was determined using a Paroscientific Depth Sensor. Salinity, temperature and pressure were collected using a Seabird model 49 FastCat CTD mounted on the AUV. An Imagenex Delta-T profiling sonar was used on dive 005. Five sites were sampled during 3 days (Figure 3). The AUV was programmed to take photographs once every 4.5 - 5 seconds and to maintain a height of 3 meters from the bottom. Images were down-loaded at the end of each dive and each image was color-corrected.
7
CHARACTERIZATION OF SPONGE SITE STUDY SITE: GRAYS CANYON
Locations of the AUV during each dive were estimated by using USBL tracking information, the xy coordinates of the vehicle position, and the shipboard GPS coordinates of the start of the dive. All non-overlapping color-corrected digital photographs from the downward-looking camera were reviewed following the cruise and corals and sponges as well as associated fishes were identified and counted from all images. The area of each image was estimated using the measured distance from the bottom. Since the AUV was programmed to maintain a height of 3 meters from the seabed and did so with little variation (Figure 4) there was limited variability in the size of the field of view of each image. Sea floor habitats were categorized in each photograph using a two code system. The categories are rock ridge (R, high to low relief), boulder (B diameter > 25.5 cm), cobble (C diameter > 6.5 and < 25.5 cm), pebble (P > 2 and < 6.5 cm), gravel (G > 4 mm and < 2 cm), flat rock (F, continuous, low relief), sand (S, grains distinguishable), and mud (M, noticeable organic particles). The first code signified the habitat type that covered greater than 50% of the area, and second code the habitat type covering between 20% and 50% of the area.
Post-Dive Analyses
Figure 4. Depth Track of dive AUV 001 showing sea bottom (———) and depth of vehicle (———).
8
CHARACTERIZATION OF SPONGE SITE STUDY SITE: GRAYS CANYON
Temperature and salinity were processed, plotted, and analyzed using Sea-Bird Electronics’ data processing software. Large spikes in the data were edited by hand. Corals, sponges, and fishes were identified to the lowest possible taxonomic level from every non-overlapping image collected on each dive. In many cases fauna were grouped into morphological types only. Physical condition of sponges was noted by indicating if sponges were broken or covered by sediment. Fishes were considered to be associated with sponges if they were less than one body length away form or in direct contact with structure forming sponges. Occurrences of man-made marine debris were noted.
9
CHARACTERIZATION OF SPONGE SITE STUDY SITE: GRAYS CANYON
Date Dive #
End Time End Time Start Lat (N) Start Long (W) End Lat (N)
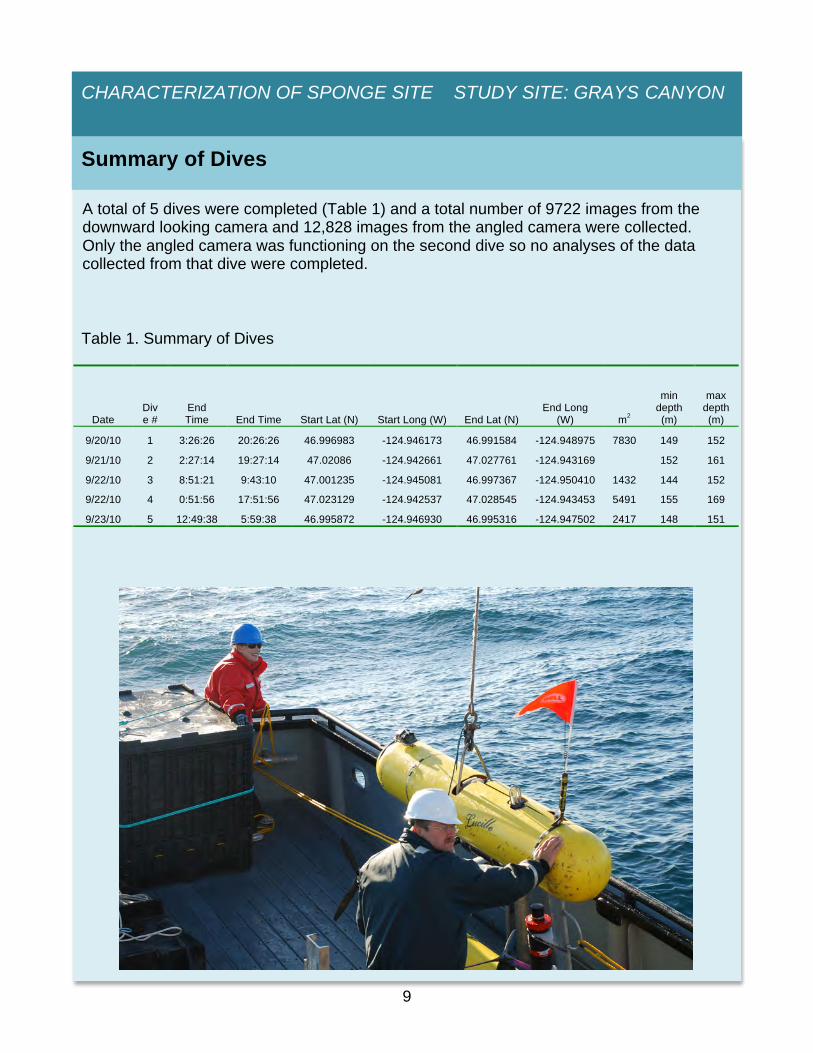
A total of 5 dives were completed (Table 1) and a total number of 9722 images from the downward looking camera and 12,828 images from the angled camera were collected. Only the angled camera was functioning on the second dive so no analyses of the data collected from that dive were completed.
Table 1. Summary of Dives
10
CHARACTERIZATION OF SPONGE SITE STUDY SITE: GRAYS CANYON
0
10
20
30
40
50
60
70
80
Mud/Sediment Mixed Hard
17,170 m2 surveyed
Approximately 17,170 m2 of sea floor habitat was classified. A two character code was used to identify the habitat type and the two codes then were aggregated into three habitat categories: sediment/mud, mixed (which included various proportions of rock, boulder, cobble, flat rock and mud), and hard rock (that was primarily a combination of boulder and/or flat rock). Sixty-eight percent of the area surveyed was sediment/mud, 25% mixed and the remainder was hard (Figure 5). There were many instances where it was possible that sediment covered mounds of an unknown consolidated material, however it was not possible to confirm the underlying structure of the mounds from the photographs and therefore in these instances the habitat was only classified as sediment.
Figure 5. Percentage of habitat categories seen in all dives
11
CHARACTERIZATION OF SPONGE SITE STUDY SITE: GRAYS CANYON
Mud covered mounds with evidence of possible underlying consolidated material and classified as sediment
Cobble and sediment classified as mixed
Boulder classified as hard Boulder and sediment classified as mixed
Mud covered seafloor classified as sediment
12
CHARACTERIZATION OF SPONGE SITE STUDY SITE: GRAYS CANYON
Heterochone calyx and mud covered sponge and sponge debris
Heterochone calyx, Aphrocallistes sp., Acanthascus spp. and mud covered
sponge and debris
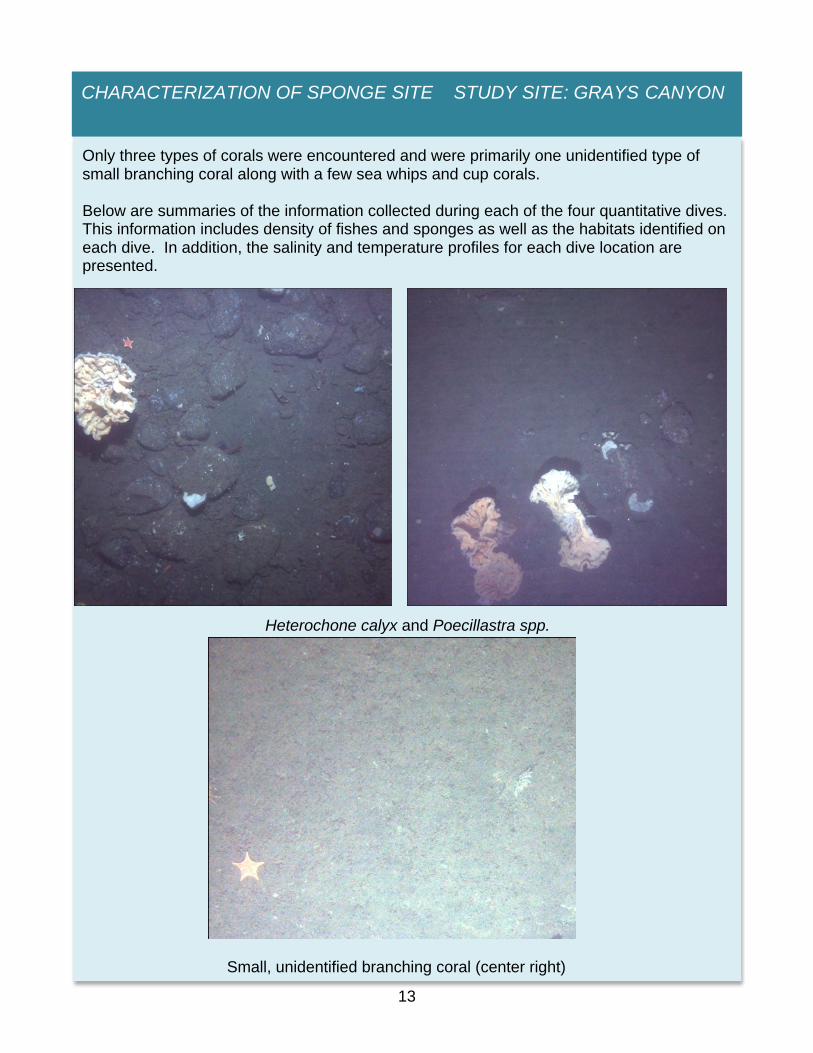
Quantitative information was collected for 34 taxa of sponges and fishes. Fish and sponges were identified to the lowest possible taxon and enumerated. A total of 10,634 sponges were enumerated with an overall density 620 per 1,000 m2. Ten groups of sponges were identified and the predominant structure forming sponges were the vase sponges Aphrocallistes sp. (possibly A. vastus) and Heterochrone calyx, as well as the fringed demosponge, Poecillastra spp. There were many unidentified sponges but they were primarily broken remnants or small encrusting sponges and generally not structure forming. A total of 3,112 fishes were enumerated for an overall density of 182 per 1,000 m2. Many of the sponges had fishes associated with them. Fish were categorized as being associated with sponges when they were within one body length of the structure forming sponges. Twenty-eight percent of the fishes overall were associated with sponges. These fish were predominantly rockfishes.
13
CHARACTERIZATION OF SPONGE SITE STUDY SITE: GRAYS CANYON
Heterochone calyx and Poecillastra spp.
Only three types of corals were encountered and were primarily one unidentified type of small branching coral along with a few sea whips and cup corals. Below are summaries of the information collected during each of the four quantitative dives. This information includes density of fishes and sponges as well as the habitats identified on each dive. In addition, the salinity and temperature profiles for each dive location are presented.
CHARACTERIZATION OF SPONGE SITE STUDY SITE: GRAYS CANYON
References
Conway, K. W., J. V. Barrie, W. C. Austin, and J. L. Luternauer. (1991). Holocene sponge bioherms on the western Canadian continental shelf. Continental Shelf Research 11: 771-790. Conway, K. W., M. Krautter, J. V. Barrie, and M. Neuweiler. 2001. Hexactinellid sponge reefs on the Canadian continental shelf: A unique "living fossil". Geoscience Canada 28: 71-78. Conway, K. W., J. V. Barrie, and M. Krautter. (2004). Modern siliceous sponge reefs in a turbid, siliciclastic setting: Fraser River delta, British Columbia, Canada. N. Jb. Geol. Palaont. Mh. 2004: 335-350. Conway, K., M. Krautter, J. V. Barrie, F. Whitney, R. E. Thomson, H. Reiswig, H. Lehnert, G. Mongov, and M. Bertram. (2005). Sponge reefs in the Queen Charlotte Basin, Canada: controls on distribution, growth and development. Pages 601-617 in A. Freiwald and J. M. Roberts, eds. Cold-water Corals and Ecosystems. Springer-Verlag, Berlin Heidelberg. Cook, S. E., K. W. Cook, and B. Burd (2008). Status of glass sponge reefs in the Georgia Basin. Mar. Env. Res. 66: S80-S86. Johnson, H. P. (2008). Washington Sea Grant Progress Report Project R/NP-6 for the period 2/1/2007 – 1/31/2008 “Glass Sponge Reef Habitat in the Pacific Northwest” Available at: http://www.wsg.washington.edu/research/ecohealth/ecosystem/glass_sponge.html Johnson, H. P. (2009). Washington Sea Grant Progress Report Project R/NP-6 “Glass Sponge Reef Habitat in the Pacific Northwest” for period or the period 2/1/2008 – 1/31/2009. Available at: http://www.wsg.washington.edu/research/ecohealth/ecosystem/glass_sponge.html Oceana (2009). Letter to Don Hansen, Chair, Pacific Fishery Management Council. May 27, 2009, RE: Agenda Item E.1. Groundfish Essential Fish Habitat Review. Available at www.pcouncil.org/bb/2009/0609/E1d_PC_0609.pdf
15
DIVE NUMBER: AUV 001 STUDY SITE: GRAYS CANYON SPONGE AREA
GENERAL LOCATION AND DIVE TRACK
Figure 6. Survey Pattern of during dive AUV 001
Figure 7. Depth track of AUV during dive AUV 001
16
DIVE NUMBER: AUV 001 STUDY SITE: GRAYS CANYON SPONGE AREA
DIVE DATA
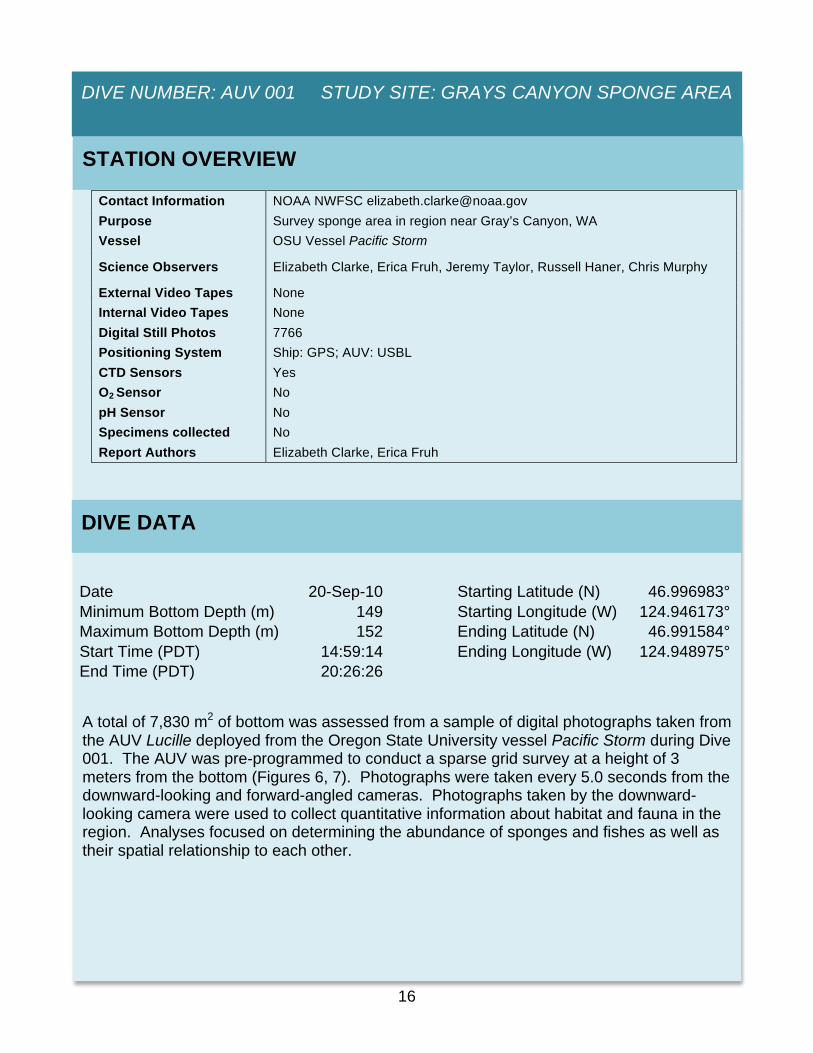
Contact Information NOAA NWFSC [email protected] Purpose Survey sponge area in region near Gray’s Canyon, WA Vessel OSU Vessel Pacific Storm
Science Observers Elizabeth Clarke, Erica Fruh, Jeremy Taylor, Russell Haner, Chris Murphy
External Video Tapes None Internal Video Tapes None Digital Still Photos 7766 Positioning System Ship: GPS; AUV: USBL CTD Sensors Yes O2 Sensor No pH Sensor No Specimens collected No Report Authors Elizabeth Clarke, Erica Fruh
STATION OVERVIEW
Date 20-Sep-10 Starting Latitude (N) 46.996983° Minimum Bottom Depth (m) 149 Starting Longitude (W) 124.946173° Maximum Bottom Depth (m) 152 Ending Latitude (N) 46.991584° Start Time (PDT) 14:59:14 Ending Longitude (W) 124.948975° End Time (PDT) 20:26:26
A total of 7,830 m2 of bottom was assessed from a sample of digital photographs taken from the AUV Lucille deployed from the Oregon State University vessel Pacific Storm during Dive 001. The AUV was pre-programmed to conduct a sparse grid survey at a height of 3 meters from the bottom (Figures 6, 7). Photographs were taken every 5.0 seconds from the downward-looking and forward-angled cameras. Photographs taken by the downward-looking camera were used to collect quantitative information about habitat and fauna in the region. Analyses focused on determining the abundance of sponges and fishes as well as their spatial relationship to each other.
17
DIVE NUMBER: AUV 001 STUDY SITE: GRAYS CANYON SPONGE AREA
PHYSICAL ENVIRONMENT
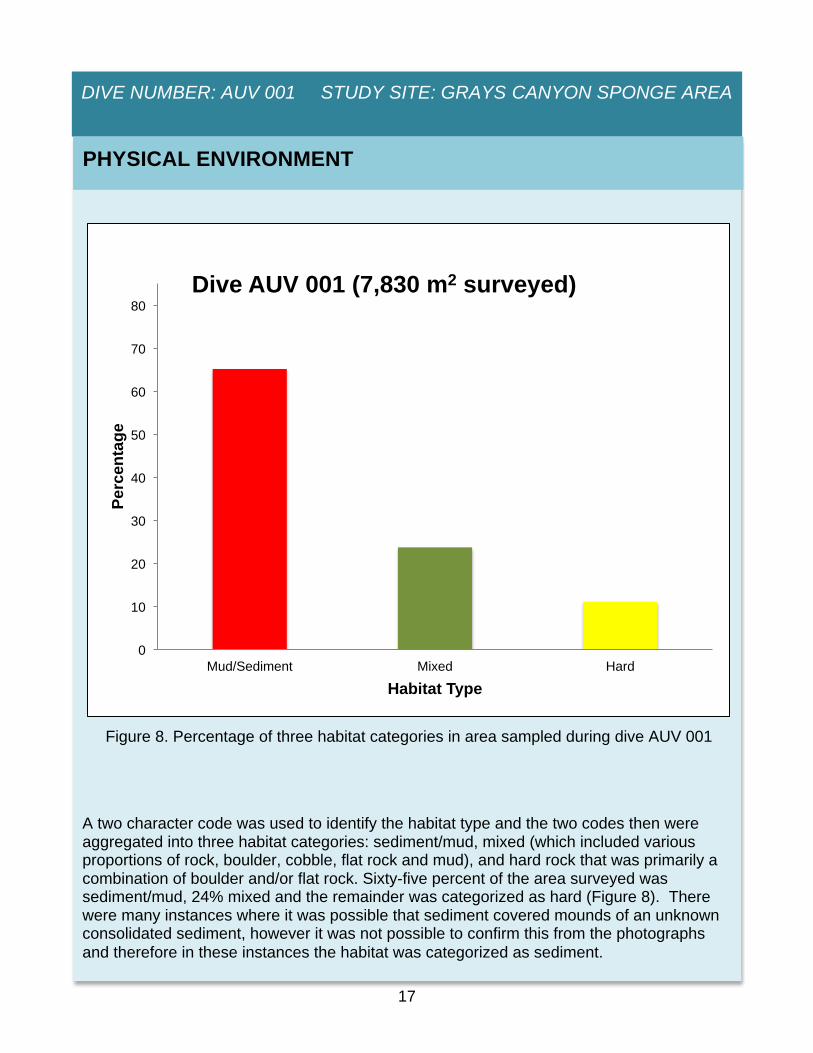
A two character code was used to identify the habitat type and the two codes then were aggregated into three habitat categories: sediment/mud, mixed (which included various proportions of rock, boulder, cobble, flat rock and mud), and hard rock that was primarily a combination of boulder and/or flat rock. Sixty-five percent of the area surveyed was sediment/mud, 24% mixed and the remainder was categorized as hard (Figure 8). There were many instances where it was possible that sediment covered mounds of an unknown consolidated sediment, however it was not possible to confirm this from the photographs and therefore in these instances the habitat was categorized as sediment.
0
10
20
30
40
50
60
70
80
Mud/Sediment Mixed Hard
Perc
enta
ge
Habitat Type
Dive AUV 001 (7,830 m2 surveyed)
Figure 8. Percentage of three habitat categories in area sampled during dive AUV 001
18
DIVE NUMBER: AUV 001 STUDY SITE: GRAYS CANYON SPONGE AREA
AUV 001
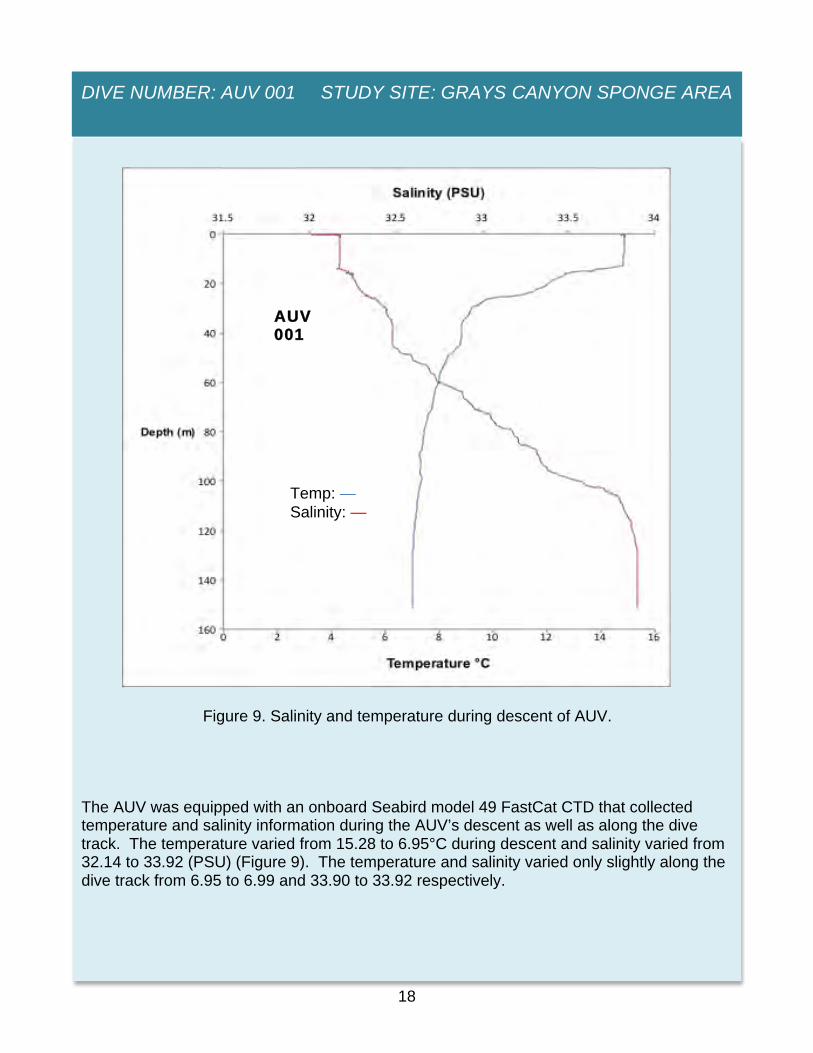
The AUV was equipped with an onboard Seabird model 49 FastCat CTD that collected temperature and salinity information during the AUV’s descent as well as along the dive track. The temperature varied from 15.28 to 6.95°C during descent and salinity varied from 32.14 to 33.92 (PSU) (Figure 9). The temperature and salinity varied only slightly along the dive track from 6.95 to 6.99 and 33.90 to 33.92 respectively.
Figure 9. Salinity and temperature during descent of AUV.
Temp: — Salinity: —
19
DIVE NUMBER: AUV 001 STUDY SITE: GRAYS CANYON SPONGE AREA
BIOLOGICAL ENVIRONMENT: SPONGES AND CORALS
A total of 5,925 sponges from 10 taxonomic and morphometric groups were enumerated from 1821 photos covering 7,830 m2 during Dive 001 (Table 2). Photos were collected from the AUV Lucille deployed from the Oregon State University vessel Pacific Storm. An overall density of 757 sponges per 1,000 m2 of seafloor was estimated from analysis of photographs. The identified sponges with the highest densities were the vase sponges Heterochone calyx. and Aphrocallistes sp (16%) followed by ball/mound sponges (10%), the fringed demosponge Poecillastra spp. (9%) and the barrel sponges including Acanthascus spp. (8%) (Figure 10). Fifty-five percent of the sponges were unidentified were primarily fragments of sponges and small non-structure forming encrusting sponges. Two percent of the sponges were mud covered/dead sponges primarily consisting of vase sponges. Corals were much less abundant (a total of 220 were enumerated) and primarily were an unidentified small white branching coral and a small number of sea whips and cup corals.
AUV 001 Common Name Scientific name Number
Vase Sponge Aphrocallistes sp. (possibily A. vastus) 358
Table 2. Number of sponges enumerated from dive 001
20
DIVE NUMBER: AUV 001 STUDY SITE: GRAYS CANYON SPONGE AREA
AUV 001 Density of sponges (757 per 1000 m2)
Vase sponges
Fringed demosponge
Barrel sponges
Ball and mound sponges
Cloud or lace sponges
Mud covered/dead sponges
Unidentified sponges
Figure 10. Percentage of sponge density by group. Colors in pie diagram match colors in list of sponge taxa (Table 2).
21
DIVE NUMBER: AUV 001 STUDY SITE: GRAYS CANYON SPONGE AREA
BIOLOGICAL ENVIRONMENT: FISHES
AUV 01 Common name Common name Number
Unidentified rockfish including young of the year Sebastes spp. 887
Rosethorn Sebastes helvomaculatus 217 Greenstriped Sebastes elongatus 126 Pacific Ocean Perch Sebastes alutus 2 Yellowtail Sebastes flavidus 1 Splitnose Sebastes diploproa 5 Redstripe Sebastes proriger 1 Rougheye Sebastes aleutianus 1 Redbanded Sebastes babcocki 1 Rex sole Glyptocephalus zachirus 27 Slender sole Lyopsetta exilis 94 Dover sole Microstomus pacificus 24 Petrale sole Eopsetta jordani 4 Unidentified flatfish Pleuronectiformes 37 Lingcod Ophiodon elongatus 12 Unidentified sculpins Cottidae 16 Unidentified poachers Agonidae 14 Spotted ratfish Hydrolagus collieri 3 Unidentified eel pout Zoarcidae 1 Longnose skate Raja rhina 1 Unidentified fish 94
Table 3. Number of fishes enumerated from dive 001
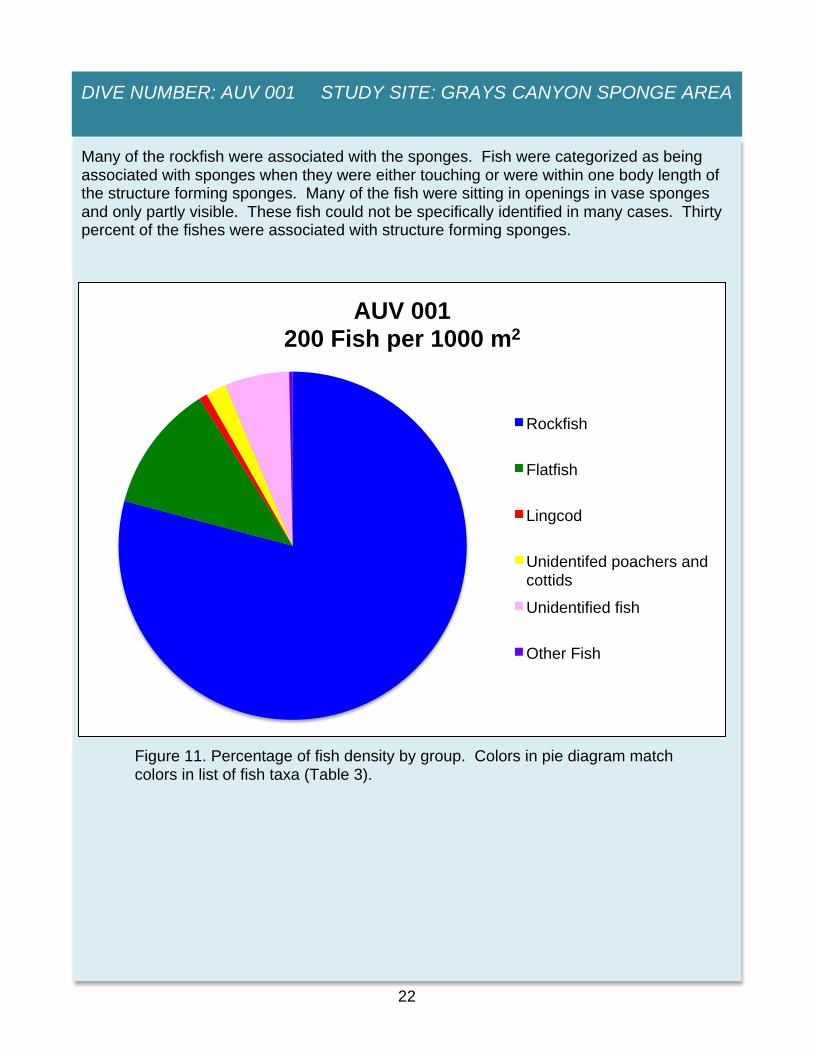
Twenty-one groups of fishes were identified in Dive 001 (Table 3). 1,568 fishes were enumerated for an overall density of 200 per 1000 m2. Rockfish comprised 79% of the total fish density (Figure 11). A group of unidentified rockfish that included juvenile rockfish and a suite of rockfish primarily S. zacentrus, S. wilsoni, S. proriger, S. diploproa, or S. alutus that in many cases could not be easily distinguished from each other in the photographs were the most abundant, followed by rosethorn rockfish, and greenstriped rockfish. Rosethorn rockfish and other rockfish except greenstriped rockfish were mostly found on mixed or hard habitat associated with sponges. Greenstriped rockfish were found primarily on muddy habitat along with an assemblage of flatfish including Dover sole, slender sole, rex sole, and petrale sole. The flatfish assemblage comprised 2% of the total density of fishes. Other fishes seen included lingcod, ratfish, longnose skate, and unidentified poachers, cottids and eelpouts.
22
DIVE NUMBER: AUV 001 STUDY SITE: GRAYS CANYON SPONGE AREA
AUV 001 200 Fish per 1000 m2
Rockfish
Flatfish
Lingcod
Unidentifed poachers and cottids
Unidentified fish
Other Fish
Figure 11. Percentage of fish density by group. Colors in pie diagram match colors in list of fish taxa (Table 3).
Many of the rockfish were associated with the sponges. Fish were categorized as being associated with sponges when they were either touching or were within one body length of the structure forming sponges. Many of the fish were sitting in openings in vase sponges and only partly visible. These fish could not be specifically identified in many cases. Thirty percent of the fishes were associated with structure forming sponges.
23
DIVE NUMBER: AUV 001 STUDY SITE: GRAYS CANYON SPONGE AREA
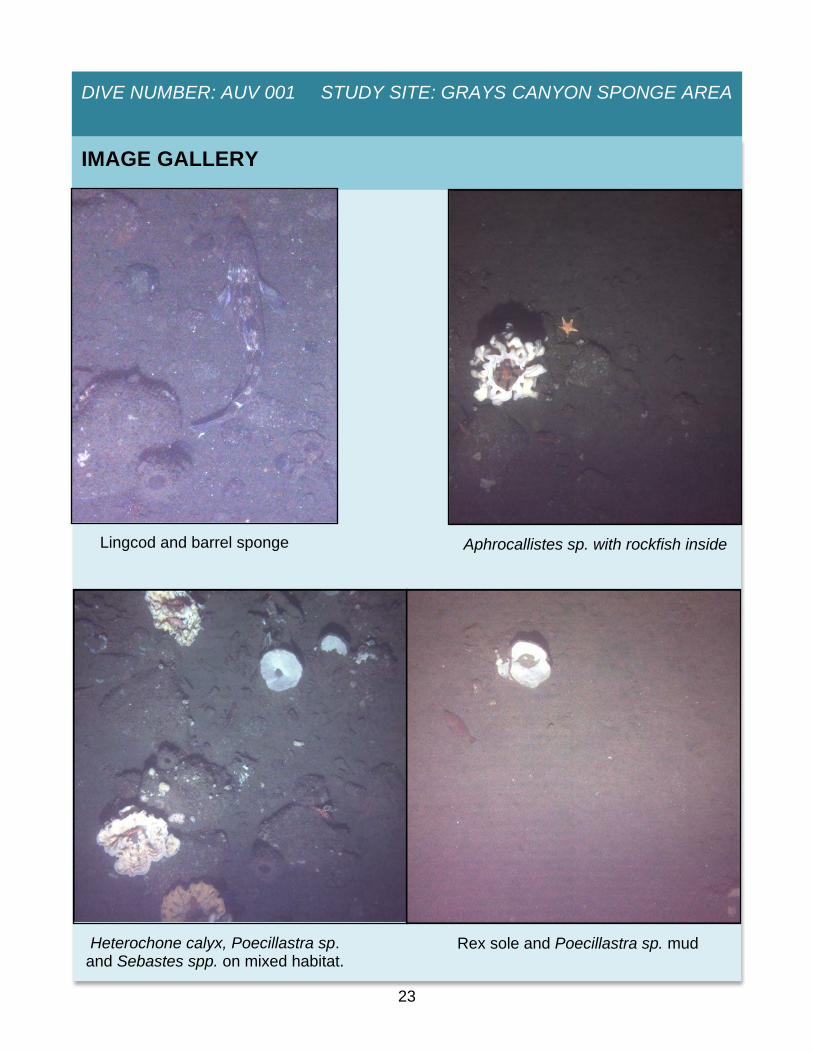
IMAGE GALLERY
Rex sole and Poecillastra sp. mud Heterochone calyx, Poecillastra sp. and Sebastes spp. on mixed habitat.
Aphrocallistes sp. with rockfish inside Lingcod and barrel sponge
24
DIVE NUMBER: AUV 001 STUDY SITE: GRAYS CANYON SPONGE AREA
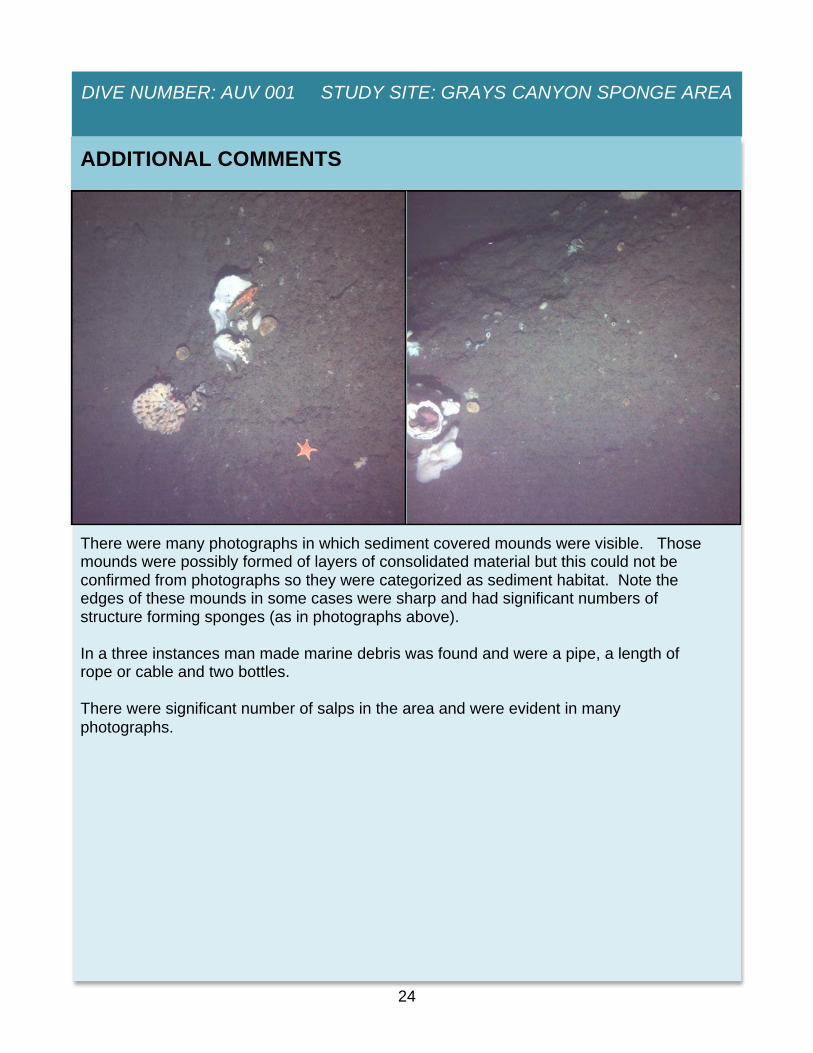
There were many photographs in which sediment covered mounds were visible. Those mounds were possibly formed of layers of consolidated material but this could not be confirmed from photographs so they were categorized as sediment habitat. Note the edges of these mounds in some cases were sharp and had significant numbers of structure forming sponges (as in photographs above). In a three instances man made marine debris was found and were a pipe, a length of rope or cable and two bottles. There were significant number of salps in the area and were evident in many photographs.
ADDITIONAL COMMENTS
25
DIVE NUMBER: AUV 001 STUDY SITE: GRAYS CANYON SPONGE AREA
Salps in water column over sediment covered habitat. Salps were commonly seen in during all
dives
Marine debris: a metal pipe Marine debris: a length of rope
Marine debris: two bottles
26
DIVE NUMBER: AUV 003 STUDY SITE: GRAYS CANYON SPONGE AREA
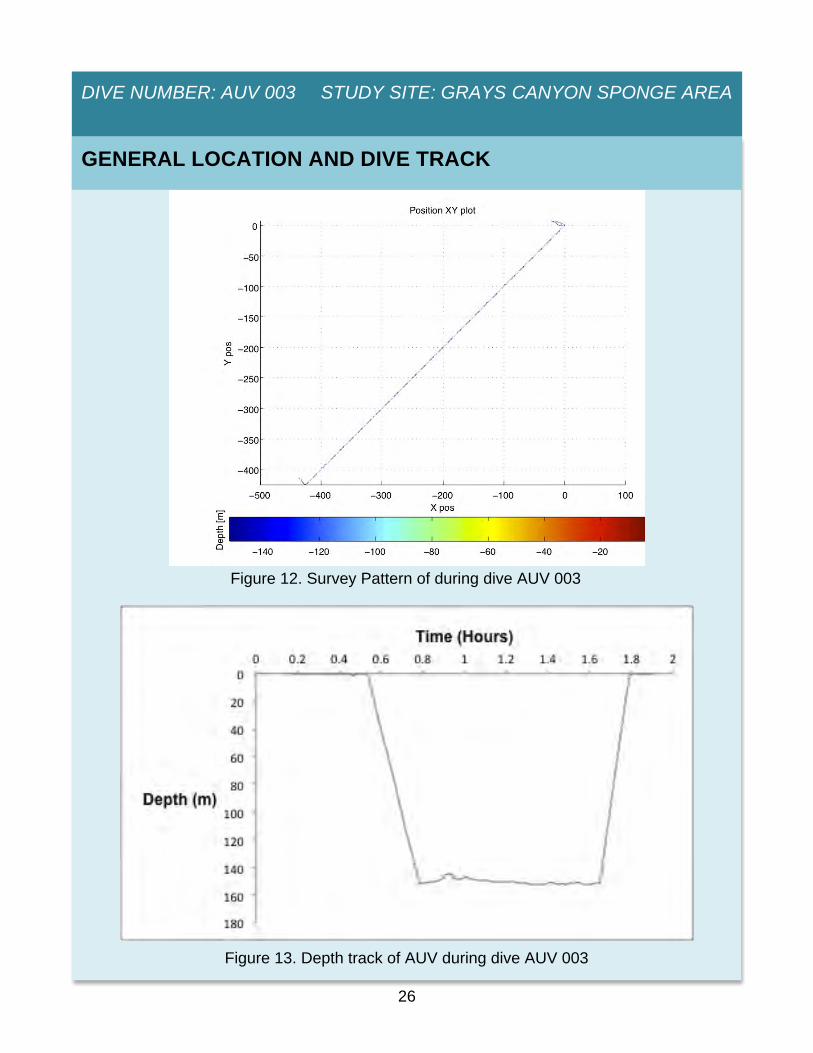
Figure 12. Survey Pattern of during dive AUV 003
GENERAL LOCATION AND DIVE TRACK
Figure 13. Depth track of AUV during dive AUV 003
27
DIVE NUMBER: AUV 003 STUDY SITE: GRAYS CANYON SPONGE AREA
DIVE DATA
Contact Information NOAA NWFSC [email protected] Purpose Survey sponge area in region near Gray’s Canyon, WA Vessel OSU Vessel Pacific Storm
Science Observers Elizabeth Clarke, Erica Fruh, Jeremy Taylor, Russell Haner, Chris Murphy
External Video Tapes None Internal Video Tapes None Digital Still Photos 1381 Positioning System Ship: GPS; AUV: USBL CTD Sensors Yes O2 Sensor No pH Sensor No Specimens collected No Report Authors Elizabeth Clarke, Erica Fruh
STATION OVERVIEW
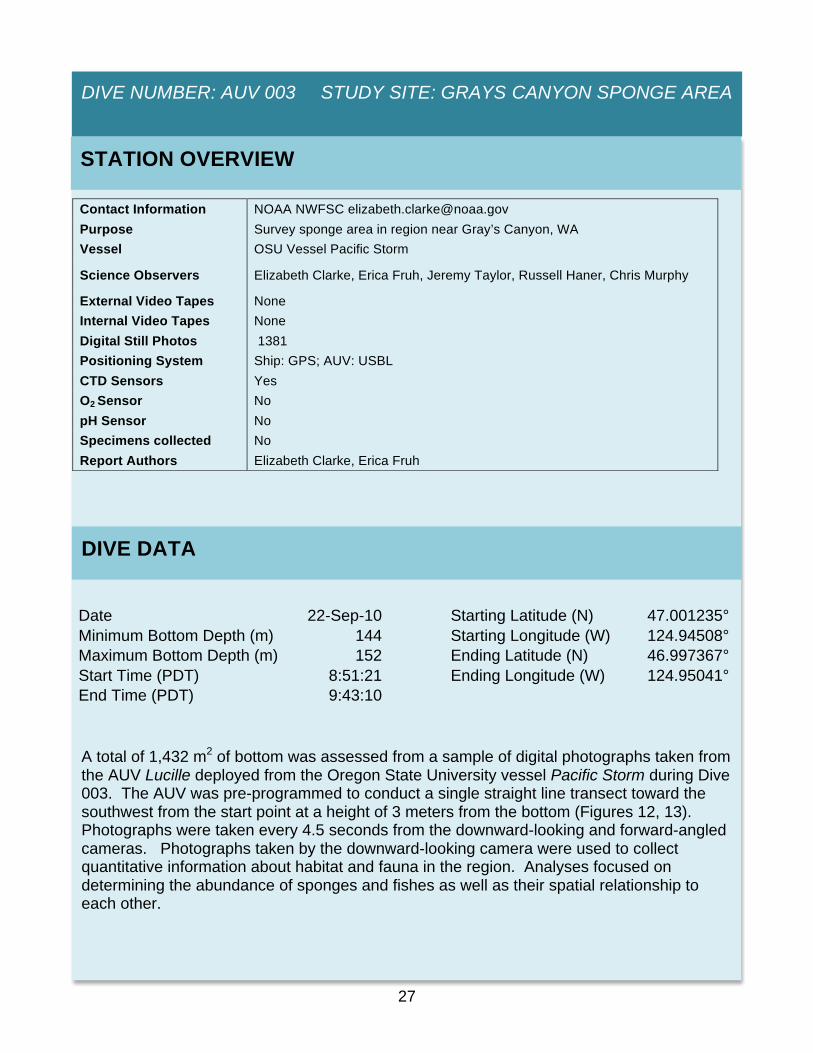
Date 22-Sep-10 Starting Latitude (N) 47.001235° Minimum Bottom Depth (m) 144 Starting Longitude (W) 124.94508° Maximum Bottom Depth (m) 152 Ending Latitude (N) 46.997367° Start Time (PDT) 8:51:21 Ending Longitude (W) 124.95041° End Time (PDT) 9:43:10
A total of 1,432 m2 of bottom was assessed from a sample of digital photographs taken from the AUV Lucille deployed from the Oregon State University vessel Pacific Storm during Dive 003. The AUV was pre-programmed to conduct a single straight line transect toward the southwest from the start point at a height of 3 meters from the bottom (Figures 12, 13). Photographs were taken every 4.5 seconds from the downward-looking and forward-angled cameras. Photographs taken by the downward-looking camera were used to collect quantitative information about habitat and fauna in the region. Analyses focused on determining the abundance of sponges and fishes as well as their spatial relationship to each other.
28
DIVE NUMBER: AUV 003 STUDY SITE: GRAYS CANYON SPONGE AREA
PHYSICAL ENVIRONMENT
0
10
20
30
40
50
60
70
80
Mud/Sediment Mixed Hard
Perc
enta
ge
Habitat Type
Dive AUV 003 (1,432 m2 surveyed)
A two character code was used to identify the habitat type and the two codes then were aggregated to identify three habitat categories : sediment/mud, mixed (which included various proportions of rock, boulder, cobble, flat rock and mud), and hard rock that was primarily a combination of boulder and/or flat rock. Sixty-seven percent of the area surveyed was sediment/mud, 28% mixed and the remainder was categorized as hard (Figure 14). There were many instances where it was possible that sediment covered mounds of consolidated material, however it was not possible to confirm this from the photographs and therefore in these instances the habitat was identified as sediment.
Figure 14. Percentage of habitat categories seen in dive AUV 003
29
DIVE NUMBER: AUV 003 STUDY SITE: GRAYS CANYON SPONGE AREA
Temp: — Salinity: —
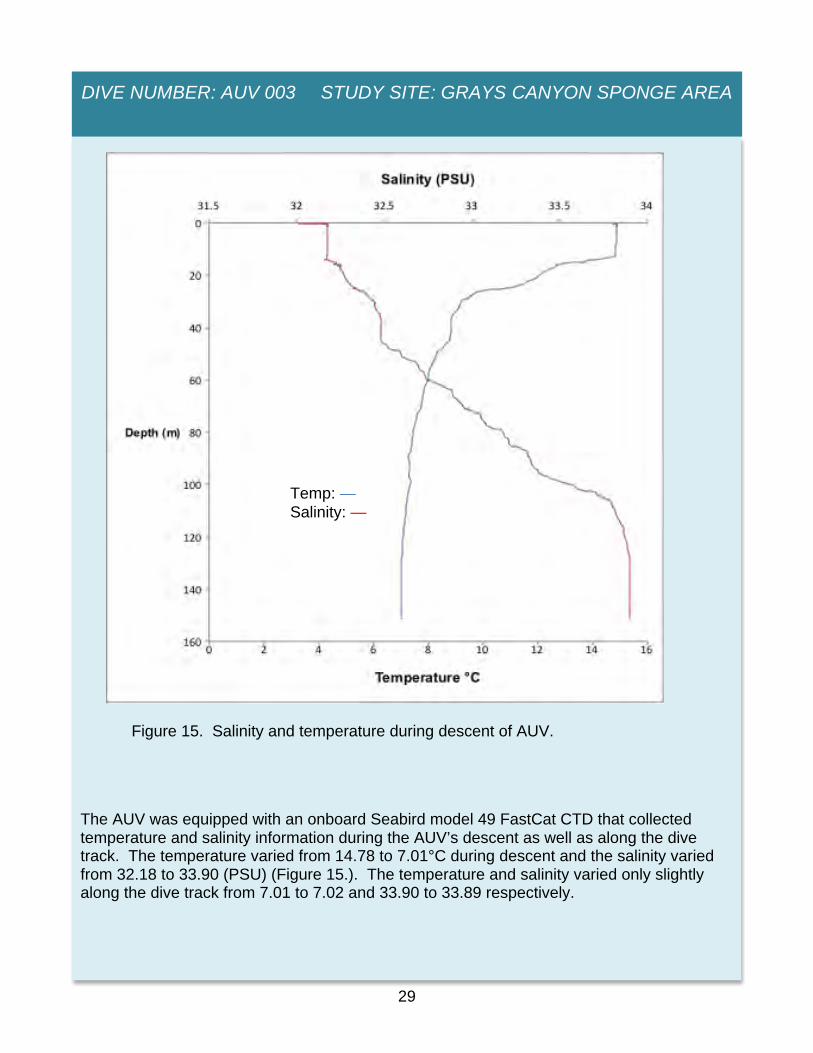
Figure 15. Salinity and temperature during descent of AUV.
The AUV was equipped with an onboard Seabird model 49 FastCat CTD that collected temperature and salinity information during the AUV’s descent as well as along the dive track. The temperature varied from 14.78 to 7.01°C during descent and the salinity varied from 32.18 to 33.90 (PSU) (Figure 15.). The temperature and salinity varied only slightly along the dive track from 7.01 to 7.02 and 33.90 to 33.89 respectively.
30
DIVE NUMBER: AUV 003 STUDY SITE: GRAYS CANYON SPONGE AREA
BIOLOGICAL ENVIRONMENT: SPONGES AND CORALS
AUV 003 Common name Scientific name Number
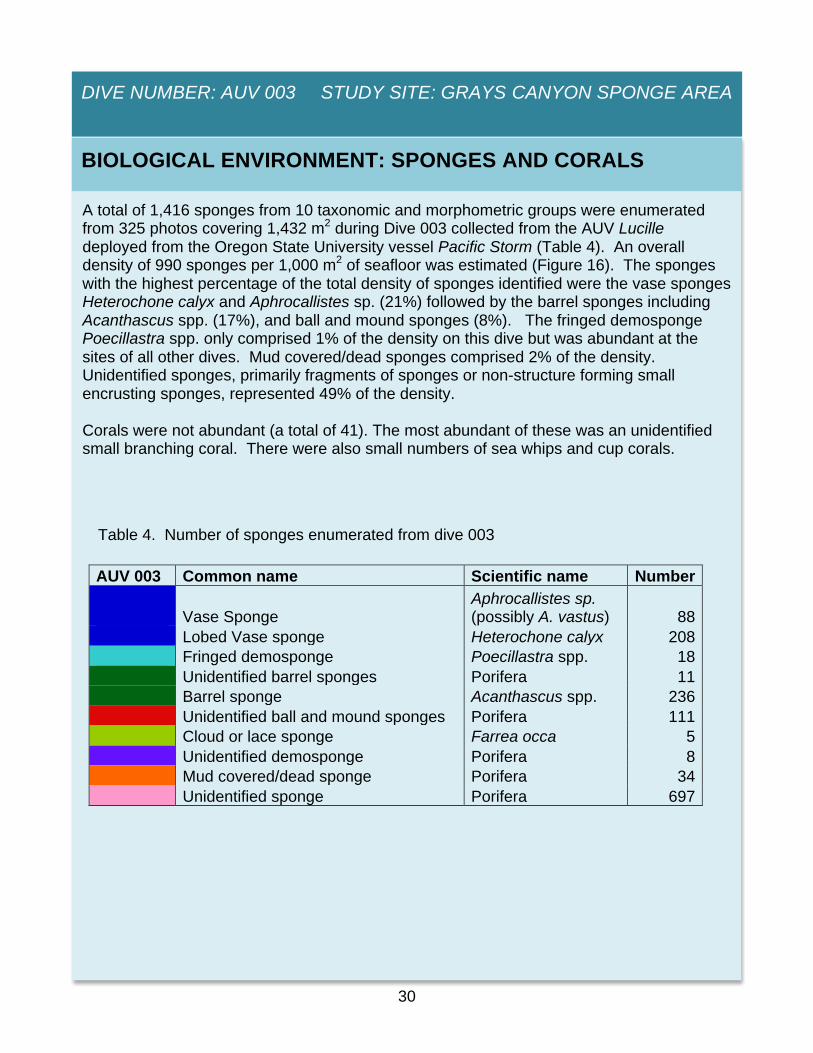
Vase Sponge Aphrocallistes sp. (possibly A. vastus) 88
A total of 1,416 sponges from 10 taxonomic and morphometric groups were enumerated from 325 photos covering 1,432 m2 during Dive 003 collected from the AUV Lucille deployed from the Oregon State University vessel Pacific Storm (Table 4). An overall density of 990 sponges per 1,000 m2 of seafloor was estimated (Figure 16). The sponges with the highest percentage of the total density of sponges identified were the vase sponges Heterochone calyx and Aphrocallistes sp. (21%) followed by the barrel sponges including Acanthascus spp. (17%), and ball and mound sponges (8%). The fringed demosponge Poecillastra spp. only comprised 1% of the density on this dive but was abundant at the sites of all other dives. Mud covered/dead sponges comprised 2% of the density. Unidentified sponges, primarily fragments of sponges or non-structure forming small encrusting sponges, represented 49% of the density. Corals were not abundant (a total of 41). The most abundant of these was an unidentified small branching coral. There were also small numbers of sea whips and cup corals.
Table 4. Number of sponges enumerated from dive 003
31
DIVE NUMBER: AUV 003 STUDY SITE: GRAYS CANYON SPONGE AREA
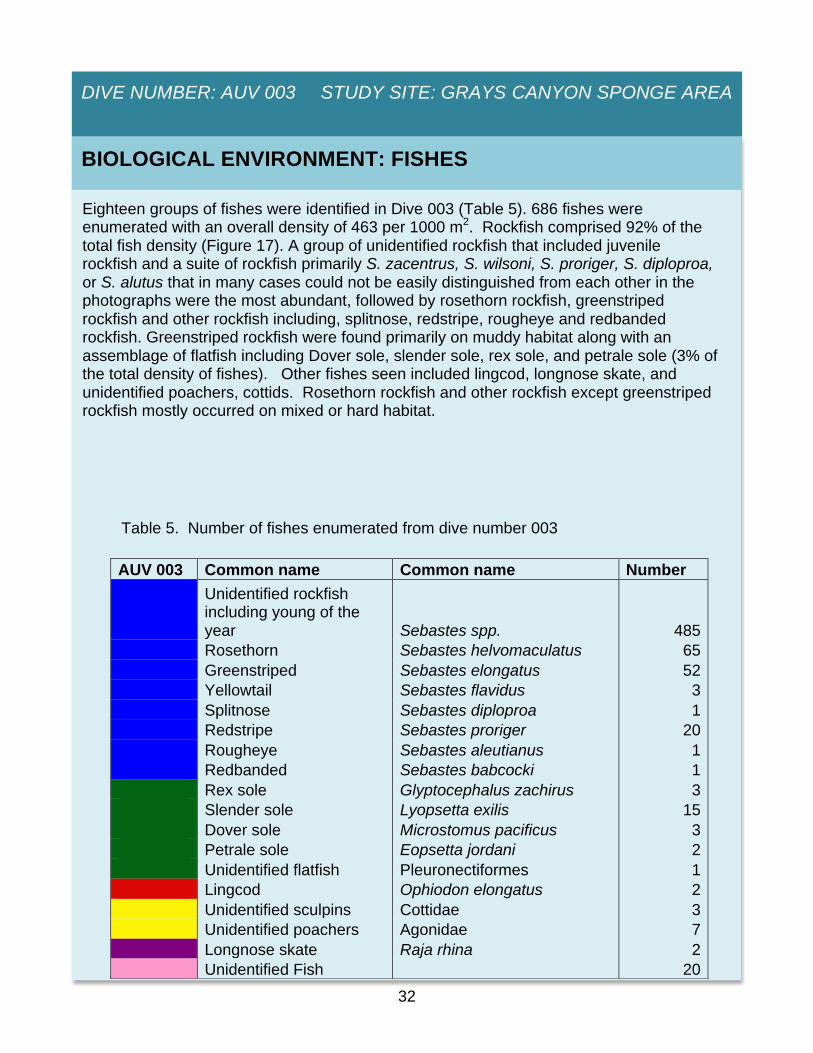
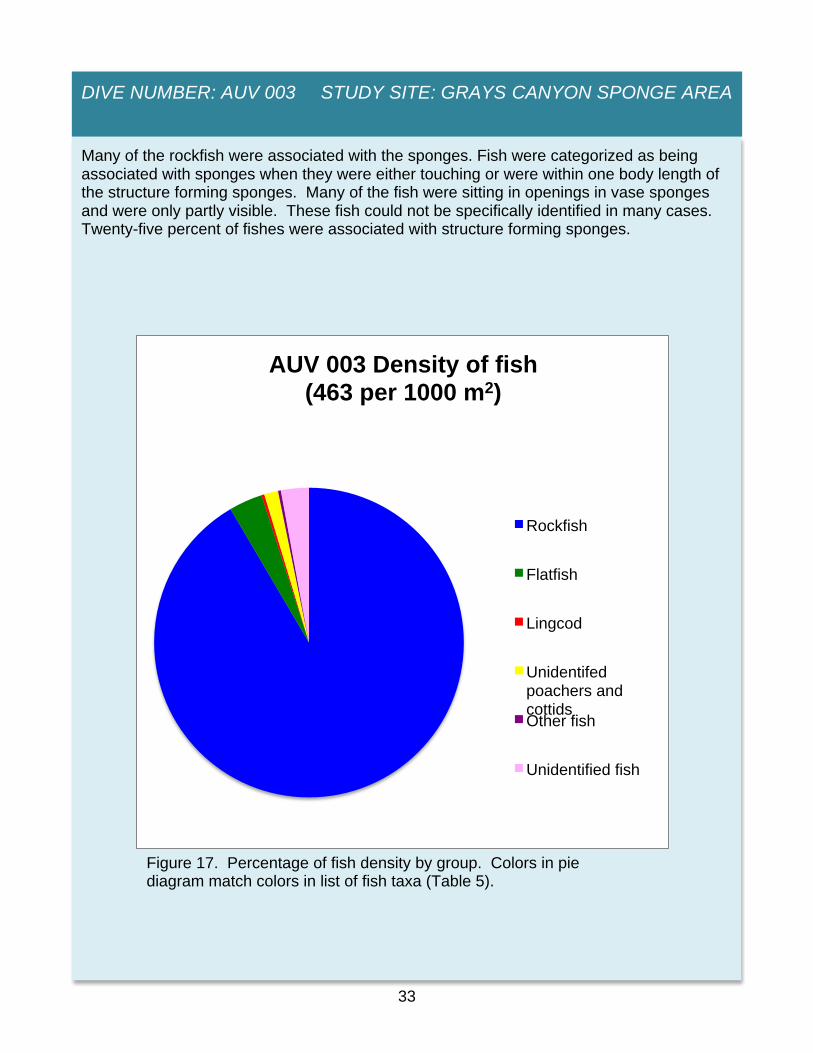
Eighteen groups of fishes were identified in Dive 003 (Table 5). 686 fishes were enumerated with an overall density of 463 per 1000 m2. Rockfish comprised 92% of the total fish density (Figure 17). A group of unidentified rockfish that included juvenile rockfish and a suite of rockfish primarily S. zacentrus, S. wilsoni, S. proriger, S. diploproa, or S. alutus that in many cases could not be easily distinguished from each other in the photographs were the most abundant, followed by rosethorn rockfish, greenstriped rockfish and other rockfish including, splitnose, redstripe, rougheye and redbanded rockfish. Greenstriped rockfish were found primarily on muddy habitat along with an assemblage of flatfish including Dover sole, slender sole, rex sole, and petrale sole (3% of the total density of fishes). Other fishes seen included lingcod, longnose skate, and unidentified poachers, cottids. Rosethorn rockfish and other rockfish except greenstriped rockfish mostly occurred on mixed or hard habitat.
Table 5. Number of fishes enumerated from dive number 003
33
DIVE NUMBER: AUV 003 STUDY SITE: GRAYS CANYON SPONGE AREA
AUV 003 Density of fish (463 per 1000 m2)
Rockfish
Flatfish
Lingcod
Unidentifed poachers and cottids Other fish
Unidentified fish
Figure 17. Percentage of fish density by group. Colors in pie diagram match colors in list of fish taxa (Table 5).
Many of the rockfish were associated with the sponges. Fish were categorized as being associated with sponges when they were either touching or were within one body length of the structure forming sponges. Many of the fish were sitting in openings in vase sponges and were only partly visible. These fish could not be specifically identified in many cases. Twenty-five percent of fishes were associated with structure forming sponges.
34
DIVE NUMBER: AUV 003 STUDY SITE: GRAYS CANYON SPONGE AREA
IMAGE GALLERY
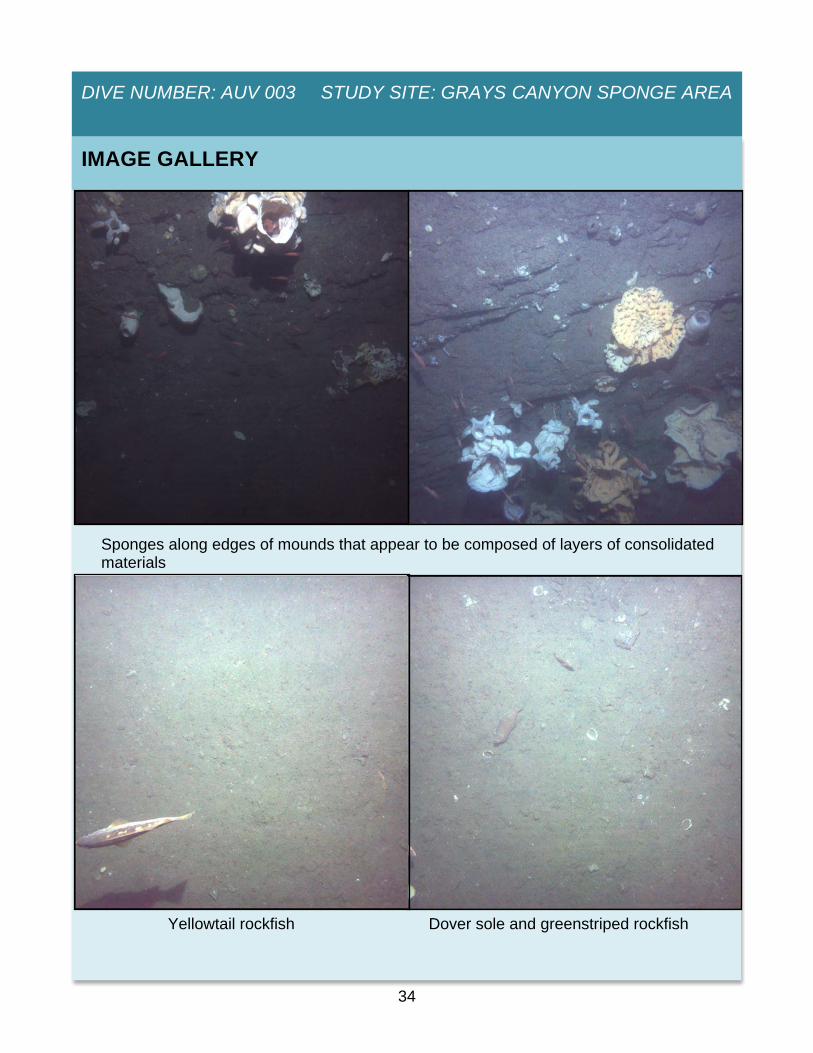
Dover sole and greenstriped rockfish Yellowtail rockfish
Sponges along edges of mounds that appear to be composed of layers of consolidated materials
35
DIVE NUMBER: AUV 003 STUDY SITE: GRAYS CANYON SPONGE AREA
ADDITIONAL COMMENTS
Slender sole, greenstriped rockfish and marine debris (brown bottle)
Heterochone calyx tipped on side but still attached to cobble
On this dive mad-made debris was found twice and in both cases the debris was bottles. Dead and mud covered sponges were evident throughout the dive and in some cases while sponges were in good condition they were tipped over. Again on this dive there were instances where mounds covered by sediments were evident. The edges of these mounds indicated that the mounds could consist of layers of consolidated materials.
36
DIVE NUMBER: AUV 004 STUDY SITE: GRAYS CANYON SPONGE AREA
AUV 004
GENERAL LOCATION AND DIVE TRACK
Figure 18. Survey pattern of during dive AUV 004
Figure 19. Depth track of AUV during dive AUV 004
37
DIVE NUMBER: AUV 004 STUDY SITE: GRAYS CANYON SPONGE AREA
DIVE DATA
Contact Information NOAA NWFSC [email protected] Purpose Survey sponge area in region near Gray’s Canyon, WA Vessel OSU Vessel Pacific Storm
Science Observers Elizabeth Clarke, Erica Fruh, Jeremy Taylor, Russell Haner, Chris Murphy
External Video Tapes None Internal Video Tapes None Digital Still Photos 5094 Positioning System Ship: GPS; AUV: USBL CTD Sensors Yes O2 Sensor No pH Sensor No Specimens collected No Report Authors Elizabeth Clarke, Erica Fruh
STATION OVERVIEW
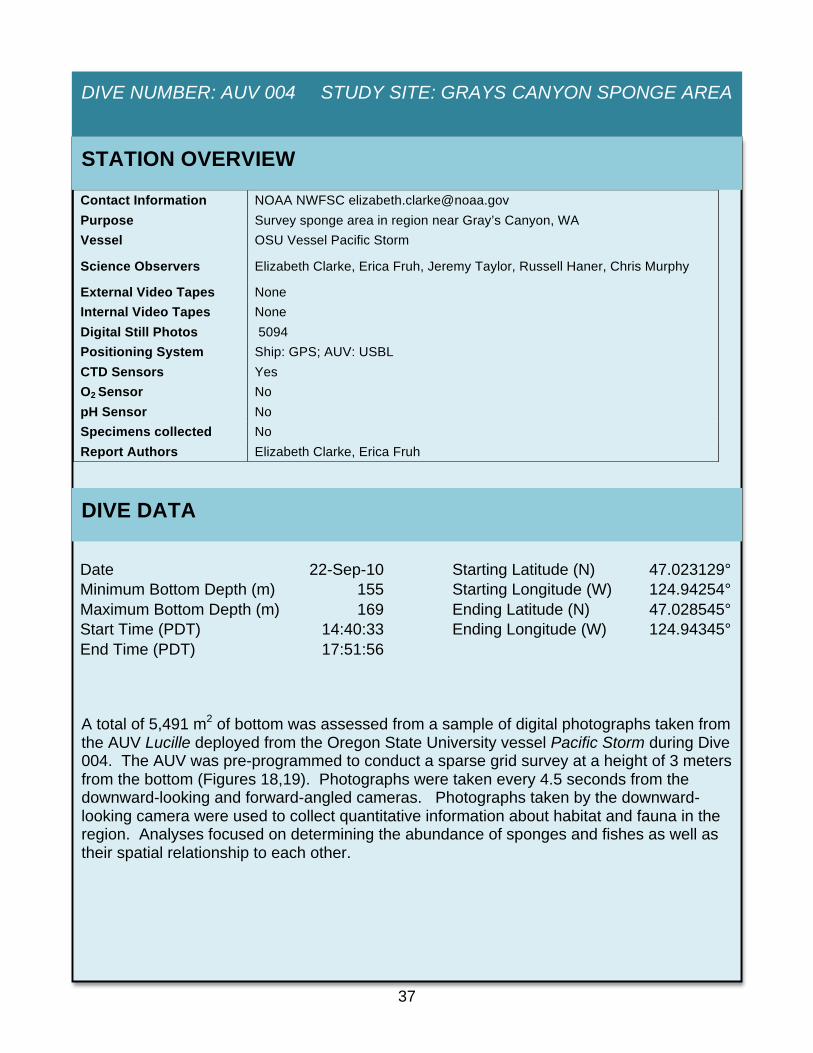
Date 22-Sep-10 Starting Latitude (N) 47.023129° Minimum Bottom Depth (m) 155 Starting Longitude (W) 124.94254° Maximum Bottom Depth (m) 169 Ending Latitude (N) 47.028545° Start Time (PDT) 14:40:33 Ending Longitude (W) 124.94345° End Time (PDT) 17:51:56
A total of 5,491 m2 of bottom was assessed from a sample of digital photographs taken from the AUV Lucille deployed from the Oregon State University vessel Pacific Storm during Dive 004. The AUV was pre-programmed to conduct a sparse grid survey at a height of 3 meters from the bottom (Figures 18,19). Photographs were taken every 4.5 seconds from the downward-looking and forward-angled cameras. Photographs taken by the downward-looking camera were used to collect quantitative information about habitat and fauna in the region. Analyses focused on determining the abundance of sponges and fishes as well as their spatial relationship to each other.
38
DIVE NUMBER: AUV 004 STUDY SITE: GRAYS CANYON SPONGE AREA
PHYSICAL ENVIRONMENT
A two character code was used to identify the habitat type and the two codes then were aggregated to identify three habitat categories: sediment/mud, mixed (which included various proportions of rock, boulder, cobble or flat rock and mud), and hard rock that was primarily a combination of boulder and/or flat rock. Sixty-seven percent of the area surveyed was sediment/mud, 30% mixed and the remainder was categorized as hard (Figure 20). There were many instances where it was possible that sediment had covered mounds of consolidated material, however it was not possible to confirm this from the photographs and therefore in these instances the habitat was identified as sediment.
0
10
20
30
40
50
60
70
80
Mud/Sediment Mixed Hard
Perc
enta
ge
Habitat Type
Dive AUV 004 (5,491 m2 surveyed)
Figure 20. Percentage of habitat categories seen in dive 004
39
DIVE NUMBER: AUV 004 STUDY SITE: GRAYS CANYON SPONGE AREA
AUV 004
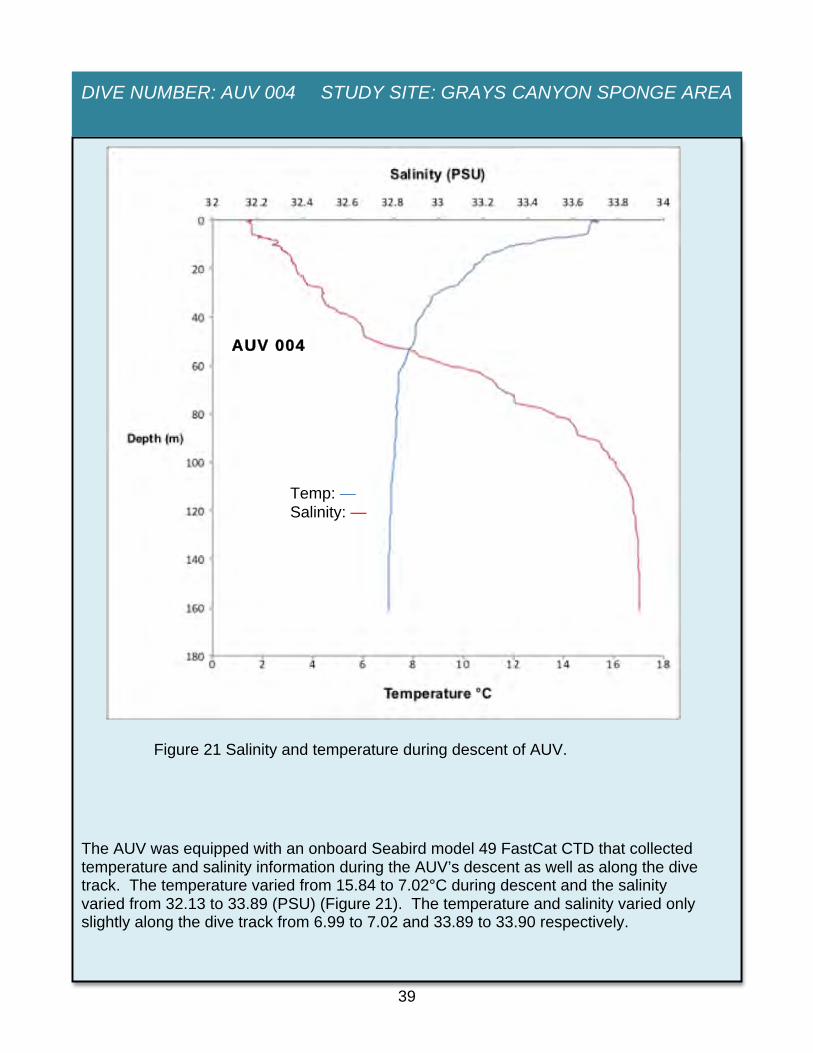
The AUV was equipped with an onboard Seabird model 49 FastCat CTD that collected temperature and salinity information during the AUV’s descent as well as along the dive track. The temperature varied from 15.84 to 7.02°C during descent and the salinity varied from 32.13 to 33.89 (PSU) (Figure 21). The temperature and salinity varied only slightly along the dive track from 6.99 to 7.02 and 33.89 to 33.90 respectively.
Temp: — Salinity: —
Figure 21 Salinity and temperature during descent of AUV.
40
DIVE NUMBER: AUV 004 STUDY SITE: GRAYS CANYON SPONGE AREA
BIOLOGICAL ENVIRONMENT: SPONGES AND CORALS
AUV 04 Common name Scientific name Number
Vase Sponge Aphrocallistes sp. (possibly A. vastus) 173
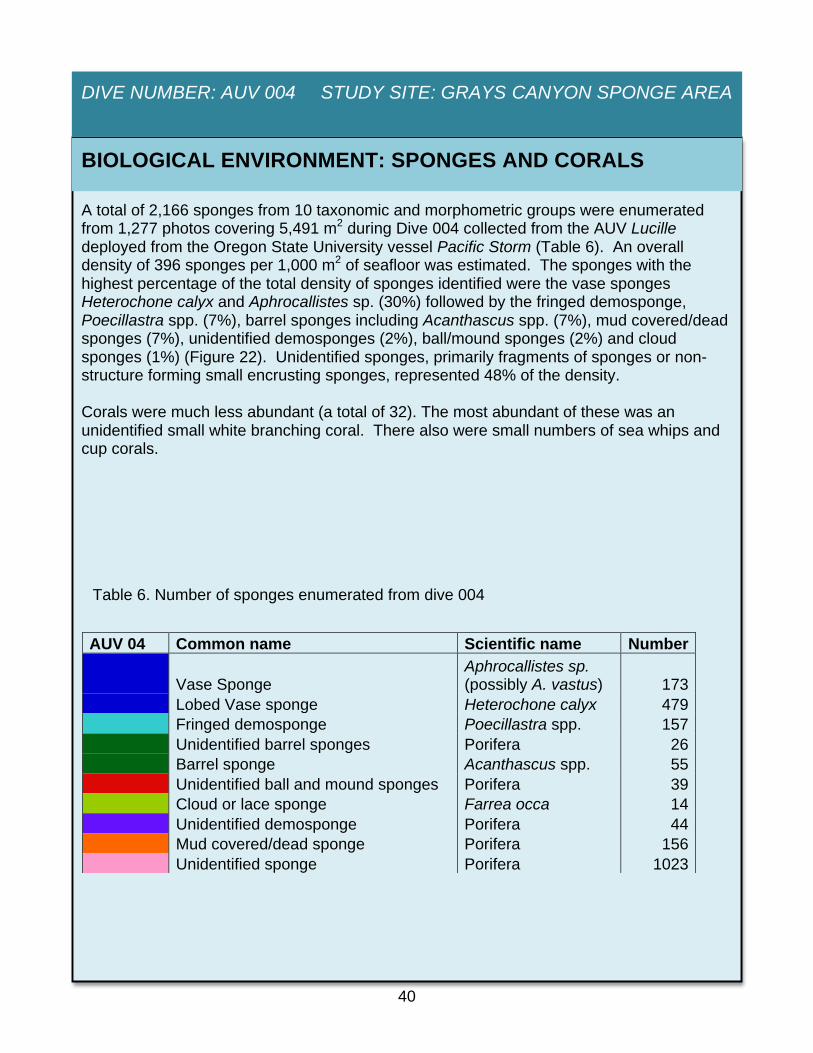
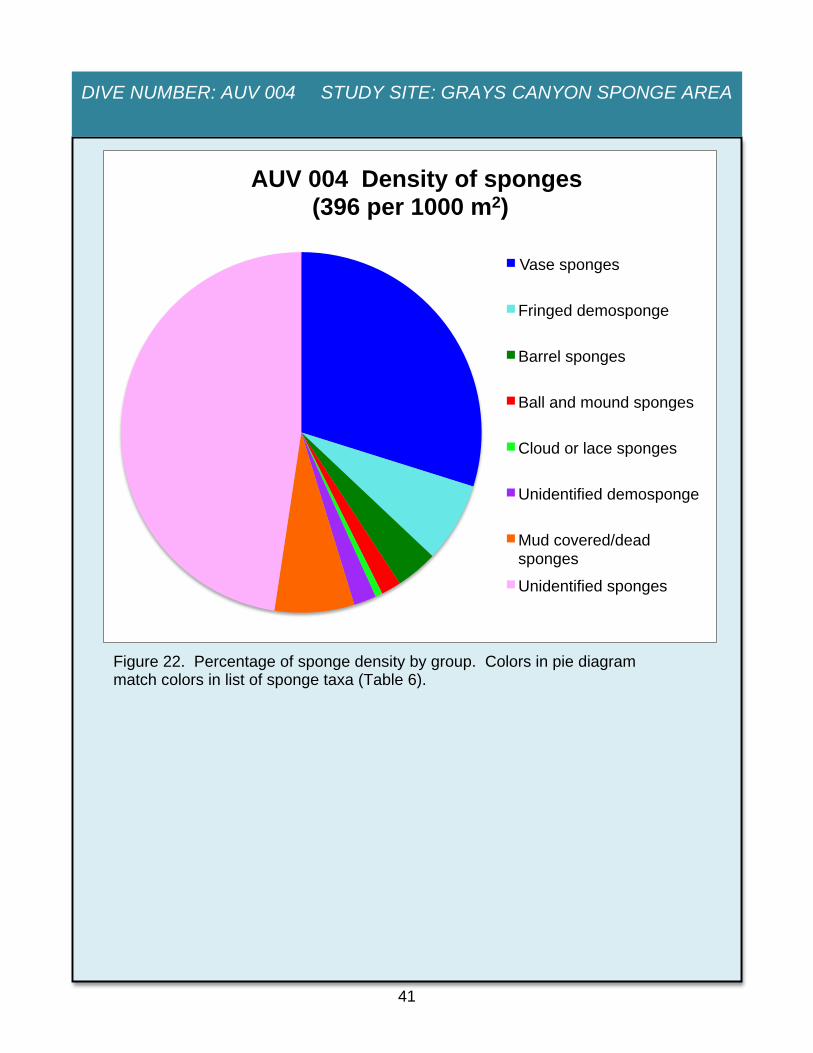
A total of 2,166 sponges from 10 taxonomic and morphometric groups were enumerated from 1,277 photos covering 5,491 m2 during Dive 004 collected from the AUV Lucille deployed from the Oregon State University vessel Pacific Storm (Table 6). An overall density of 396 sponges per 1,000 m2 of seafloor was estimated. The sponges with the highest percentage of the total density of sponges identified were the vase sponges Heterochone calyx and Aphrocallistes sp. (30%) followed by the fringed demosponge, Poecillastra spp. (7%), barrel sponges including Acanthascus spp. (7%), mud covered/dead sponges (7%), unidentified demosponges (2%), ball/mound sponges (2%) and cloud sponges (1%) (Figure 22). Unidentified sponges, primarily fragments of sponges or non-structure forming small encrusting sponges, represented 48% of the density. Corals were much less abundant (a total of 32). The most abundant of these was an unidentified small white branching coral. There also were small numbers of sea whips and cup corals.
Table 6. Number of sponges enumerated from dive 004
41
DIVE NUMBER: AUV 004 STUDY SITE: GRAYS CANYON SPONGE AREA
AUV 004 Density of sponges (396 per 1000 m2)
Vase sponges
Fringed demosponge
Barrel sponges
Ball and mound sponges
Cloud or lace sponges
Unidentified demosponge
Mud covered/dead sponges
Unidentified sponges
Figure 22. Percentage of sponge density by group. Colors in pie diagram match colors in list of sponge taxa (Table 6).
42
DIVE NUMBER: AUV 004 STUDY SITE: GRAYS CANYON SPONGE AREA
BIOLOGICAL ENVIRONMENT: FISHES
AUV 04 Common name Common name Number
Unidentified rockfish including young of the year Sebastes spp. 104
Rosethorn Sebastes helvomaculatus 79 Greenstriped Sebastes elongatus 98 Splitnose Sebastes diploproa 2 Redstripe Sebastes proriger 8 Redbanded Sebastes babcocki 1 Rex sole Glyptocephalus zachirus 26 Slender sole Lyopsetta exilis 81 Dover sole Microstomus pacificus 28 Petrale sole Eopsetta jordani 18 bothid 1 English sole Parophrys vetulus 1 Unidentified flatfish Pleuronectiformes 7 Lingcod Ophiodon elongatus 3 Unidentified sculpins Cottidae 12 Unidentified poachers Agonidae 61 Longnose skate Raja rhina 1 Pacific Hagfish Epatatretus stoutii 3 Unidentified Fish 14
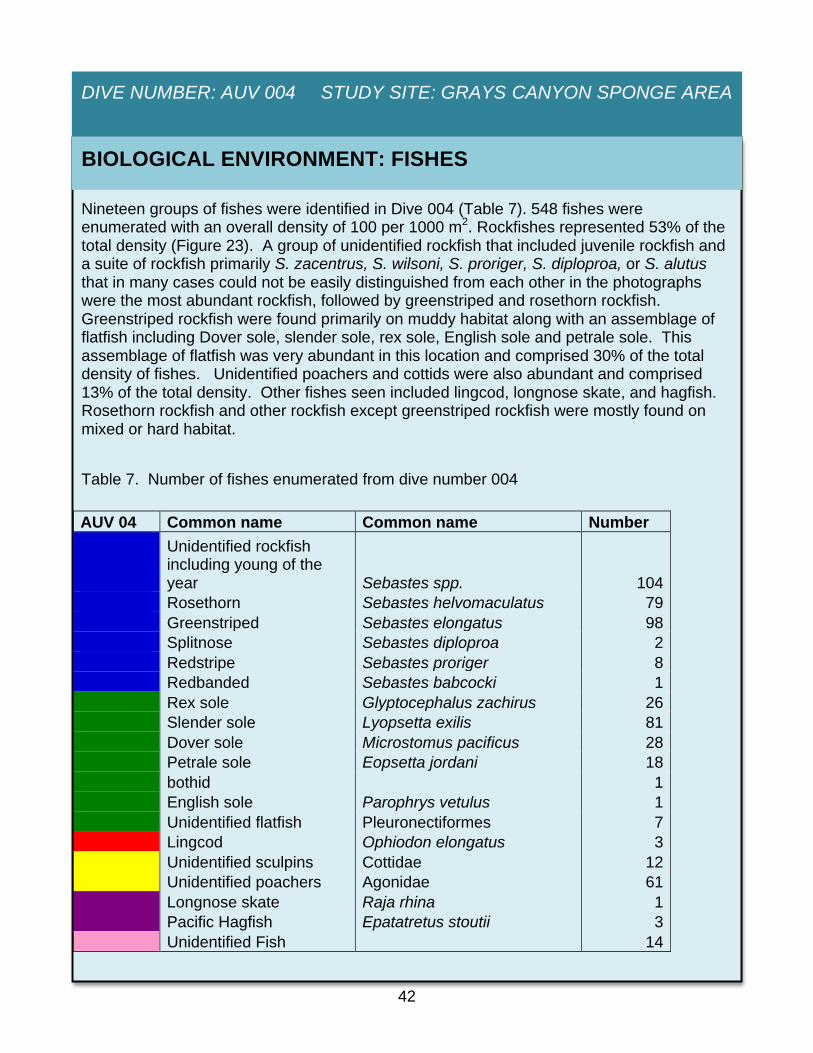
Nineteen groups of fishes were identified in Dive 004 (Table 7). 548 fishes were enumerated with an overall density of 100 per 1000 m2. Rockfishes represented 53% of the total density (Figure 23). A group of unidentified rockfish that included juvenile rockfish and a suite of rockfish primarily S. zacentrus, S. wilsoni, S. proriger, S. diploproa, or S. alutus that in many cases could not be easily distinguished from each other in the photographs were the most abundant rockfish, followed by greenstriped and rosethorn rockfish. Greenstriped rockfish were found primarily on muddy habitat along with an assemblage of flatfish including Dover sole, slender sole, rex sole, English sole and petrale sole. This assemblage of flatfish was very abundant in this location and comprised 30% of the total density of fishes. Unidentified poachers and cottids were also abundant and comprised 13% of the total density. Other fishes seen included lingcod, longnose skate, and hagfish. Rosethorn rockfish and other rockfish except greenstriped rockfish were mostly found on mixed or hard habitat.
Table 7. Number of fishes enumerated from dive number 004
43
DIVE NUMBER: AUV 004 STUDY SITE: GRAYS CANYON SPONGE AREA
AUV 004 Density of fish (100 per 1000 m2)
Rockfish
Flatfish
Lingcod
Unidentifed poachers and cottids
Other fish
Unidentified fish
Many of the rockfish were associated with the sponges. Fish were categorized as being associated with sponges when they were either touching structure forming sponges or were within one body length of the structure forming sponges. Many of the fish were sitting in openings of vase sponges and were only partly visible. These fish could not be specifically identified in many cases. Nineteen percent of fishes were associated with sponges.
Figure 23. Percentage of fish density by group. Colors in pie diagram match colors in list of fish taxa (Table 7).
44
DIVE NUMBER: AUV 004 STUDY SITE: GRAYS CANYON SPONGE AREA
IMAGE GALLERY
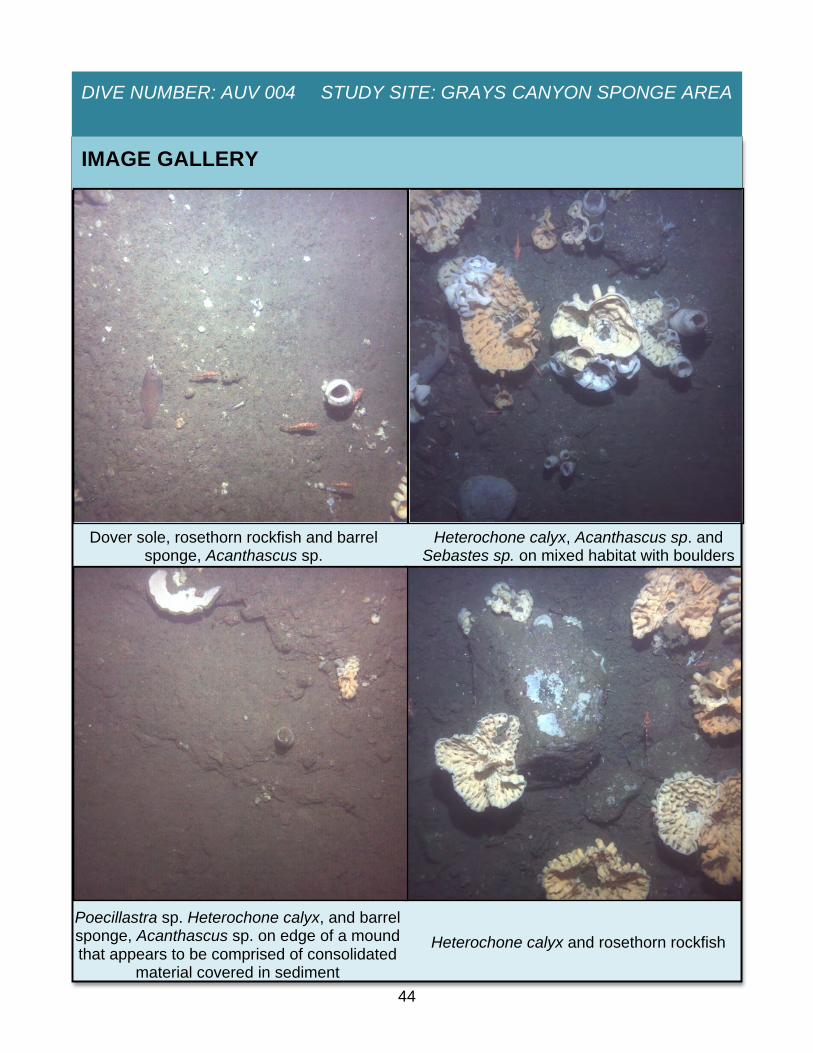
Heterochone calyx and rosethorn rockfish
Dover sole, rosethorn rockfish and barrel sponge, Acanthascus sp.
Poecillastra sp. Heterochone calyx, and barrel sponge, Acanthascus sp. on edge of a mound that appears to be comprised of consolidated
material covered in sediment
Heterochone calyx, Acanthascus sp. and Sebastes sp. on mixed habitat with boulders
45
DIVE NUMBER: AUV 004 STUDY SITE: GRAYS CANYON SPONGE AREA
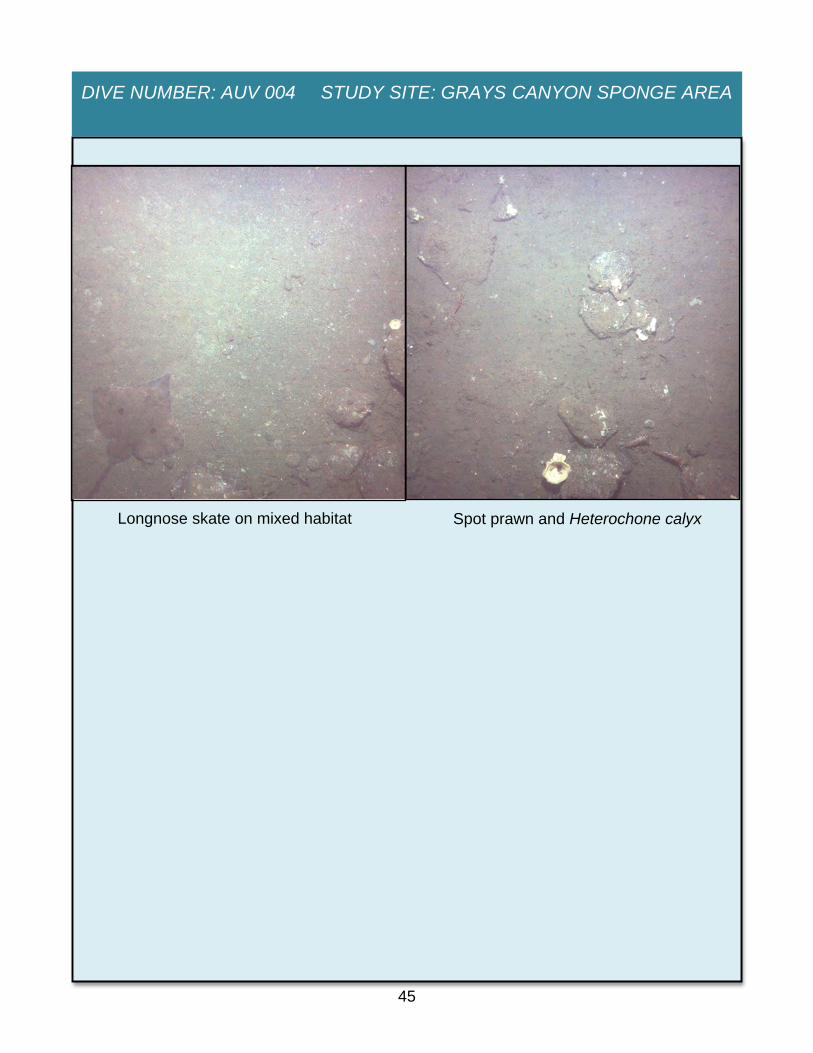
Longnose skate on mixed habitat Spot prawn and Heterochone calyx
46
DIVE NUMBER: AUV 004 STUDY SITE: GRAYS CANYON SPONGE AREA
ADDITIONAL COMMENTS
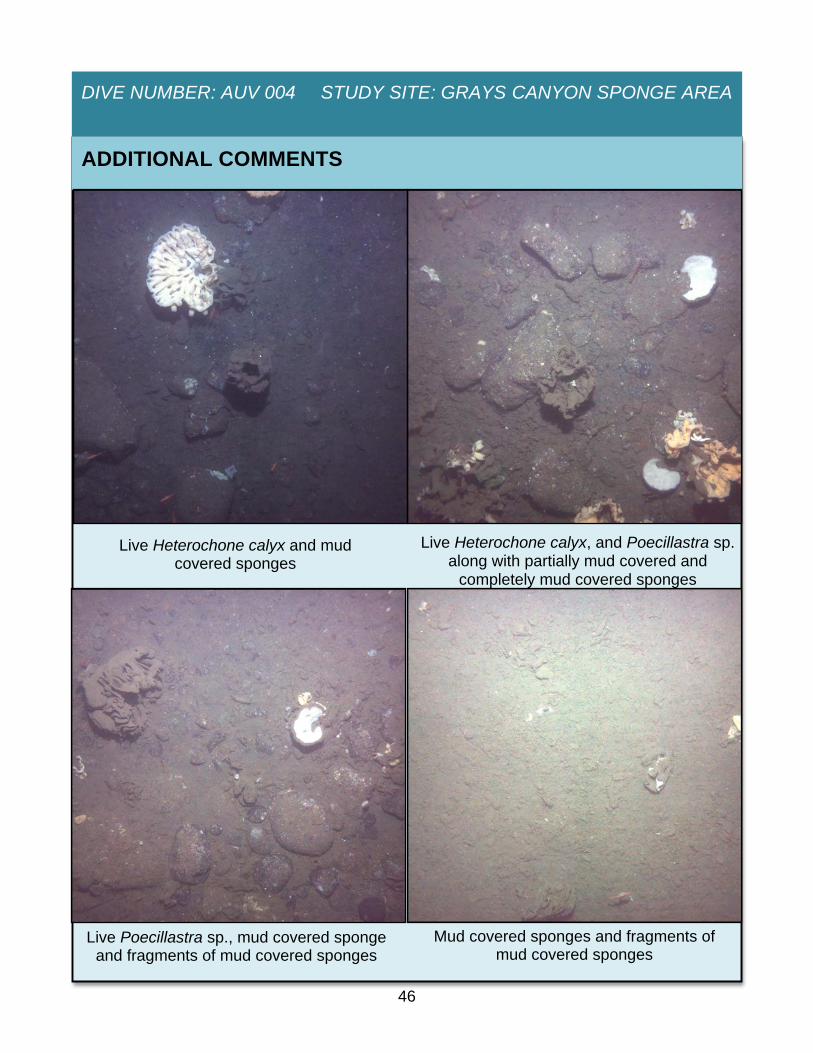
Live Heterochone calyx and mud covered sponges
Live Heterochone calyx, and Poecillastra sp. along with partially mud covered and
completely mud covered sponges
Live Poecillastra sp., mud covered sponge and fragments of mud covered sponges
Mud covered sponges and fragments of mud covered sponges
47
DIVE NUMBER: AUV 004 STUDY SITE: GRAYS CANYON SPONGE AREA
There was a high density of mud covered, broken sponges on this dive. In some cases these mud covered sponges were near live sponges and in other photographs an entire area was predominantly covered with mud covered sponges and mud covered sponge fragments. This dive also had the highest density of flatfish and unidentified poachers and cottids. Many of these were associated with areas where there were also broken mud covered sponges. There was only one instance when man-made debris was found. This debris was a small amount of monofilament line.
48
DIVE NUMBER: AUV 005 STUDY SITE: GRAYS CANYON SPONGE AREA
GENERAL LOCATION AND DIVE TRACK
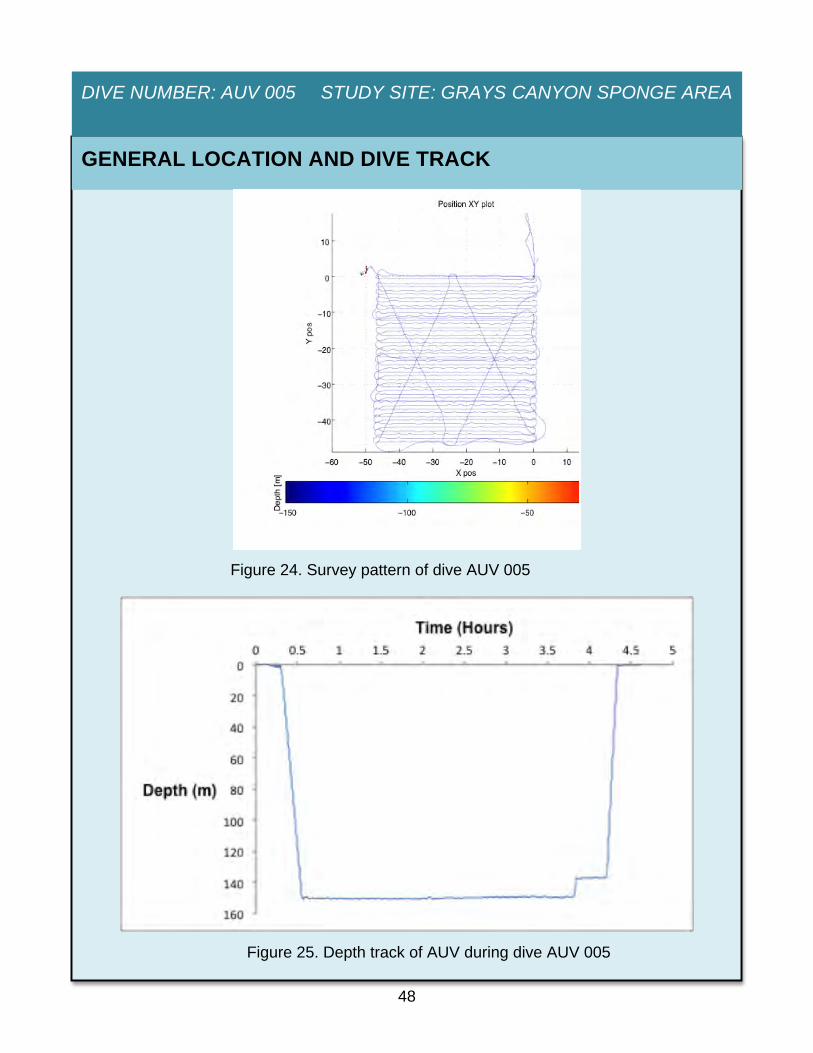
Figure 24. Survey pattern of dive AUV 005
Figure 25. Depth track of AUV during dive AUV 005
49
DIVE NUMBER: AUV 005 STUDY SITE: GRAYS CANYON SPONGE AREA
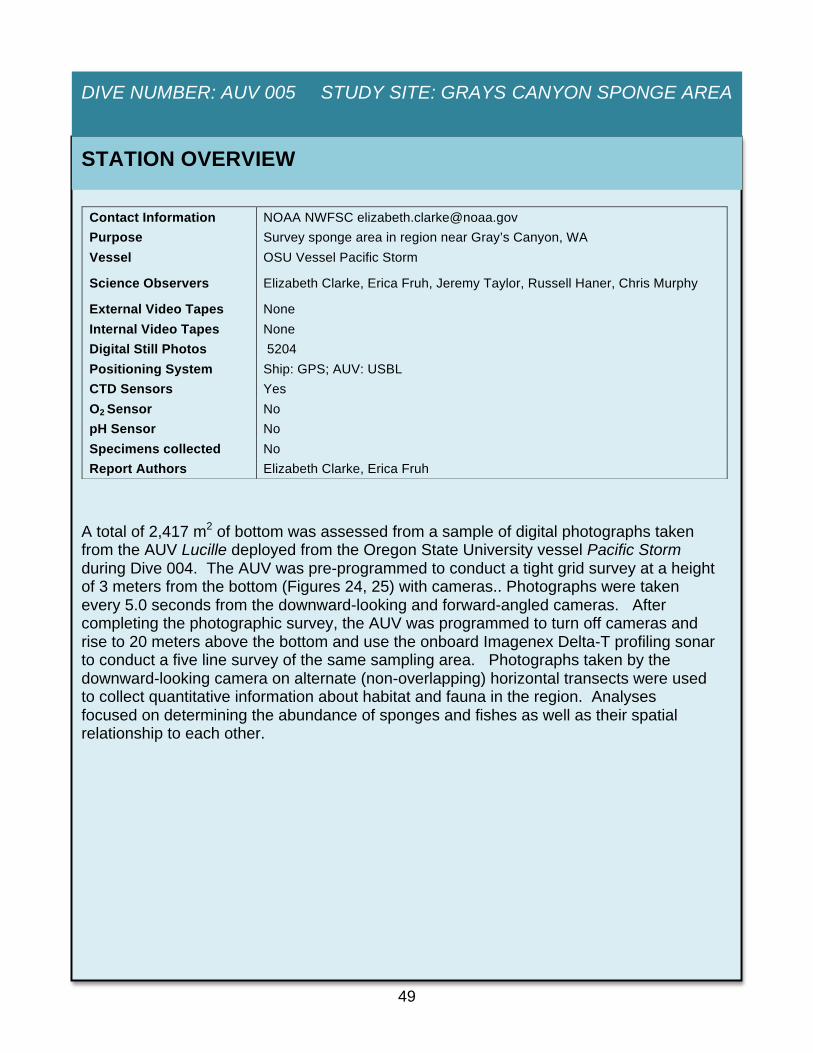
Contact Information NOAA NWFSC [email protected] Purpose Survey sponge area in region near Gray’s Canyon, WA Vessel OSU Vessel Pacific Storm
Science Observers Elizabeth Clarke, Erica Fruh, Jeremy Taylor, Russell Haner, Chris Murphy
External Video Tapes None Internal Video Tapes None Digital Still Photos 5204 Positioning System Ship: GPS; AUV: USBL CTD Sensors Yes O2 Sensor No pH Sensor No Specimens collected No Report Authors Elizabeth Clarke, Erica Fruh
STATION OVERVIEW
A total of 2,417 m2 of bottom was assessed from a sample of digital photographs taken from the AUV Lucille deployed from the Oregon State University vessel Pacific Storm during Dive 004. The AUV was pre-programmed to conduct a tight grid survey at a height of 3 meters from the bottom (Figures 24, 25) with cameras.. Photographs were taken every 5.0 seconds from the downward-looking and forward-angled cameras. After completing the photographic survey, the AUV was programmed to turn off cameras and rise to 20 meters above the bottom and use the onboard Imagenex Delta-T profiling sonar to conduct a five line survey of the same sampling area. Photographs taken by the downward-looking camera on alternate (non-overlapping) horizontal transects were used to collect quantitative information about habitat and fauna in the region. Analyses focused on determining the abundance of sponges and fishes as well as their spatial relationship to each other.
50
DIVE NUMBER: AUV 005 STUDY SITE: GRAYS CANYON SPONGE AREA
DIVE DATA
Date 23-Sep-10 Starting Latitude (N) 46.995872° Minimum Bottom Depth (m) 148 Starting Longitude (W) 124.942693° Maximum Bottom Depth (m) 151 Ending Latitude (N) 46.995316° Start Time (PDT) 14:34:01 Ending Longitude (W) 124.94750° End Time (PDT) 17:59:38
51
DIVE NUMBER: AUV 005 STUDY SITE: GRAYS CANYON SPONGE AREA
PHYSICAL ENVIRONMENT
0
10
20
30
40
50
60
70
80
Mud/Sediment Mixed Hard
Perc
enta
ge
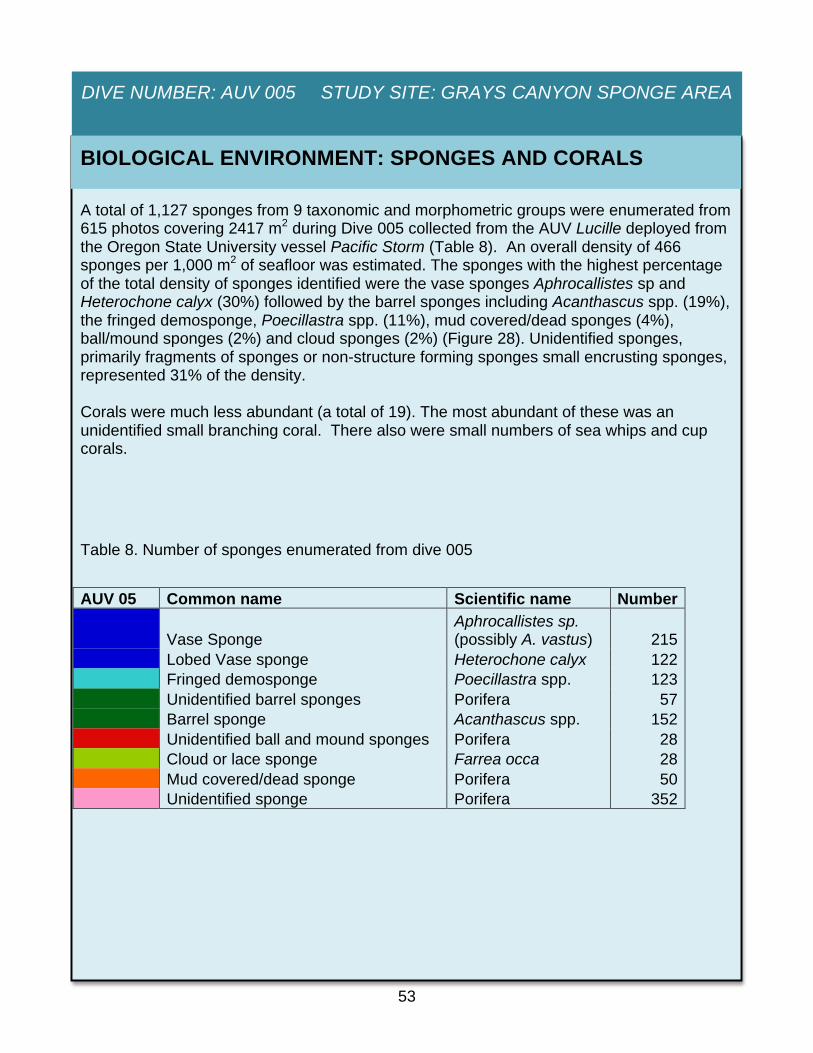
Habitat Type
Dive AUV 005 (2,417 m2 surveyed)
A two character code was used to identify the habitat type and the two codes were aggregated to identify three habitat types: sediment/mud, mixed (which included various proportions of rock, boulder, cobble or flat rock) and mud, and hard rock that was primarily a combination of boulder and/or flat rock. Eighty-three percent of the area surveyed was sediment/mud, 14% mixed and the remainder was categorized as hard (Figure 26). There were many instances where it was possible that sediment had covered hard rock, however it was not possible to confirm this from the photographs and therefore in these instances the habitat was identified as sediment.
Figure 26. Percentage of habitat types seen in dive 005
52
DIVE NUMBER: AUV 005 STUDY SITE: GRAYS CANYON SPONGE AREA
AUV 005
The AUV was equipped with an onboard Seabird model 49 FastCat CTD that collected temperature and salinity information during the AUV’s descent as well as along the dive track. The temperature varied from 14.90 to 7.03°C during descent and the salinity varied from 32.07 to 33.89 (PSU) (Figure 27). The temperature and salinity varied along the dive track from 6.96 to 7.01 and 32.14 to 33.93 respectively.
Temp: — Salinity: —
Figure 27. Salinity and temperature during descent of AUV.
53
DIVE NUMBER: AUV 005 STUDY SITE: GRAYS CANYON SPONGE AREA
BIOLOGICAL ENVIRONMENT: SPONGES AND CORALS
AUV 05 Common name Scientific name Number
Vase Sponge Aphrocallistes sp. (possibly A. vastus) 215
A total of 1,127 sponges from 9 taxonomic and morphometric groups were enumerated from 615 photos covering 2417 m2 during Dive 005 collected from the AUV Lucille deployed from the Oregon State University vessel Pacific Storm (Table 8). An overall density of 466 sponges per 1,000 m2 of seafloor was estimated. The sponges with the highest percentage of the total density of sponges identified were the vase sponges Aphrocallistes sp and Heterochone calyx (30%) followed by the barrel sponges including Acanthascus spp. (19%), the fringed demosponge, Poecillastra spp. (11%), mud covered/dead sponges (4%), ball/mound sponges (2%) and cloud sponges (2%) (Figure 28). Unidentified sponges, primarily fragments of sponges or non-structure forming sponges small encrusting sponges, represented 31% of the density. Corals were much less abundant (a total of 19). The most abundant of these was an unidentified small branching coral. There also were small numbers of sea whips and cup corals.
Table 8. Number of sponges enumerated from dive 005
54
DIVE NUMBER: AUV 005 STUDY SITE: GRAYS CANYON SPONGE AREA
AUV 005 Density of sponges (466 per 1000 m2)
Vase sponges
Fringed demosponge
Barrel sponges
Ball and mound sponges
Cloud or lace sponges
Mud covered/dead sponges
Unidentified sponges
Figure 28. Percentage of sponge density by group. Colors in pie diagram match colors in list of sponge taxa (Table 8).
55
DIVE NUMBER: AUV 005 STUDY SITE: GRAYS CANYON SPONGE AREA
BIOLOGICAL ENVIRONMENT: FISHES
AUV 05 Common name Common name
Unidentified rockfish including young of the year Sebastes spp. !"!#
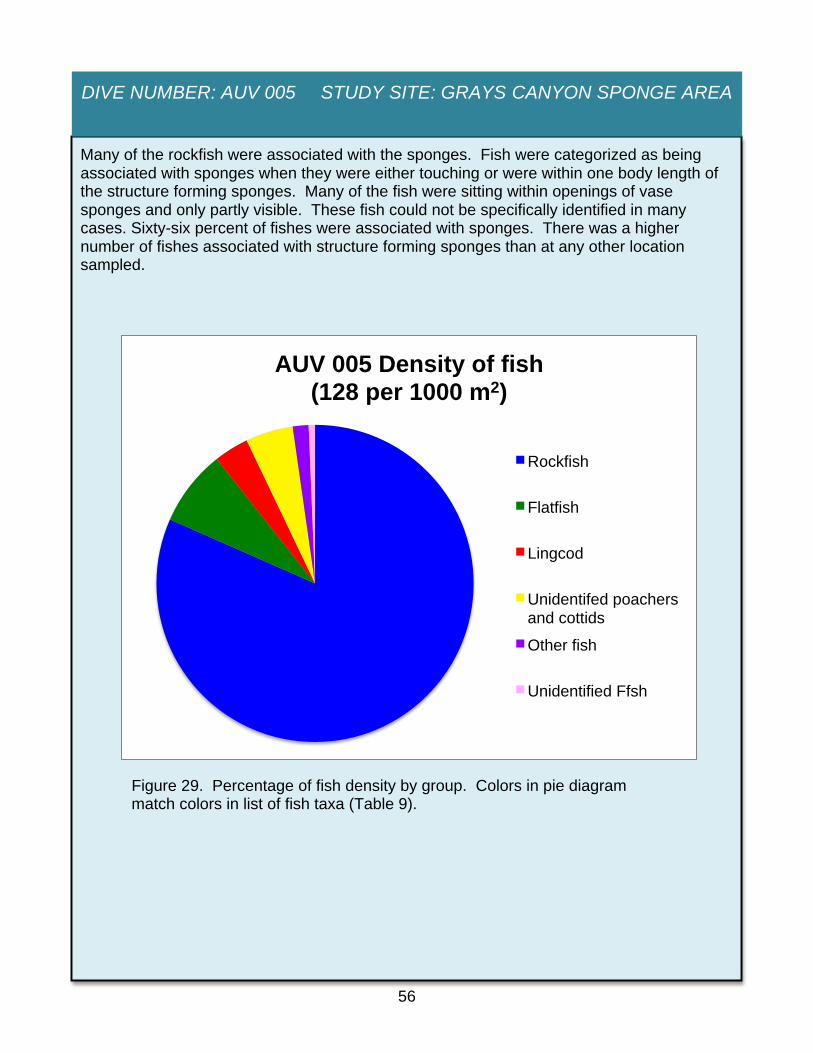
Seventeen groups of fishes were identified in Dive 005 (Table 9). 310 fishes were enumerated with an overall density of 128 per 1000 m2. Rockfish represented 82% of the total fish density (Figure 29). A group of unidentified rockfish that included juvenile rockfish and a suite of rockfish primarily S. zacentrus, S. wilsoni, S. proriger, S. diploproa, or S. alutus that in many cases could not be easily distinguished from each other in the photographs were the most abundant rockfish followed by rosethorn rockfish, and greenstriped rockfish and other rockfish including splitnose, redstripe, redbanded and rougheye rockfish. Greenstriped rockfish were found primarily on muddy habitat along with an assemblage of flatfish including Dover sole, slender sole, and rex sole that represented 8% of the total density of fishes. Other fishes seen included lingcod, longnose skate, hagfish and unidentified poachers, cottids. Rosethorn rockfish and other rockfish except greenstriped rockfish were mostly found on mixed or hard habitat associated with sponges.
Table 9. Number of fishes enumerated from dive number 005
56
DIVE NUMBER: AUV 005 STUDY SITE: GRAYS CANYON SPONGE AREA
AUV 005 Density of fish (128 per 1000 m2)
Rockfish
Flatfish
Lingcod
Unidentifed poachers and cottids
Other fish
Unidentified Ffsh
Figure 29. Percentage of fish density by group. Colors in pie diagram match colors in list of fish taxa (Table 9).
Many of the rockfish were associated with the sponges. Fish were categorized as being associated with sponges when they were either touching or were within one body length of the structure forming sponges. Many of the fish were sitting within openings of vase sponges and only partly visible. These fish could not be specifically identified in many cases. Sixty-six percent of fishes were associated with sponges. There was a higher number of fishes associated with structure forming sponges than at any other location sampled.
57
DIVE NUMBER: AUV 005 STUDY SITE: GRAYS CANYON SPONGE AREA
IMAGE GALLERY
Sebastes spp. in structure forming sponges
Greenstriped rockfish on mud habitat
58
DIVE NUMBER: AUV 005 STUDY SITE: GRAYS CANYON SPONGE AREA
ADDITIONAL COMMENTS
Sponges on sediment that may cover mounds of consolidated material
59
DIVE NUMBER: AUV 005 STUDY SITE: GRAYS CANYON SPONGE AREA
This dive was a high density sampling grid of the area in the vicinity of the reported sponge reef (Johnson 2008, 2009). Although the species composition of fishes was similar to those at other dives, the highest number of fishes associated with sponges was at this site. No man-made debris was identified.
60
CHARACTERIZATION OF SPONGE SITE STUDY SITE: GRAYS CANYON
1
Figure 1. Oceana proposed EFH Boundary showing site of sponge reef and existing EFH Conservation Areas Figure 2. Draft backscatter used to inform selection of survey sites (provided by C. Goldfinger, Oregon State University) Figure 3. Survey sites on draft map of high resolution bathymetry of the area. (map provided by C. Goldfinger, Oregon State University) Figure 4. Depth Track of dive AUV 001 showing sea bottom (———) and depth of vehicle (———). Figure 5. Percentage of habitat categories seen in all dives Figure 6. Survey Pattern of during dive AUV 001 Figure 7. Depth track of AUV during dive AUV 001 Figure 8. Percentage of three habitat categories in area sampled during dive AUV 001 Figure 9. Salinity and temperature during descent of AUV. Figure 10. Percentage of sponge density by group. Colors in pie diagram match colors in list of sponge taxa (Table 2). Figure 11. Percentage of fish density by group. Colors in pie diagram match colors in list of fish taxa (Table 3). Figure 12. Survey Pattern of during dive AUV 003 Figure 13. Depth track of AUV during dive AUV 003 Figure 14. Percentage of habitat categories seen in dive AUV 003 Figure 15. Salinity and temperature during descent of AUV. Figure 16. Percentage of sponge density by group. Colors in pie diagram match colors in list of sponge taxa (Table 4). Figure 17. Percentage of fish density by group. Colors in pie diagram match colors in list of fish taxa (Table 5). Figure 18. Survey pattern of during dive AUV 004
List of Figures
61
CHARACTERIZATION OF SPONGE SITE STUDY SITE: GRAYS CANYON
2
Figure 19. Depth track of AUV during dive AUV 004 Figure 20. Percentage of habitat categories seen in dive 004 Figure 21. Salinity and temperature during descent of AUV. Figure 22. Percentage of sponge density by group. Colors in pie diagram match colors in list of sponge taxa (Table 6). Figure 23. Percentage of fish density by group. Colors in pie diagram match colors in list of fish taxa (Table 7). Figure 24. Survey pattern of dive AUV 005 Figure 25. Depth track of AUV during dive AUV 005 Figure 27. Salinity and temperature during descent of AUV. Figure 28. Percentage of sponge density by group. Colors in pie diagram match colors in list of sponge taxa (Table 8). Figure 29. Percentage of fish density by group. Colors in pie diagram match colors in list of fish taxa (Table 9).
62
CHARACTERIZATION OF SPONGE SITE STUDY SITE: GRAYS CANYON
List of Tables Table 1. Summary of Dives Table 2. Number of sponges enumerated from dive 001 Table 3. Number of fishes enumerated from dive 001 Table 4. Number of sponges enumerated from dive 003 Table 5. Number of fishes enumerated from dive number 003 Table 6. Number of sponges enumerated from dive 004 Table 7. Number of fishes enumerated from dive number 004 Table 8. Number of sponges enumerated from dive 005 Table 9. Number of fishes enumerated from dive number 005