+ All Categories
Home > Documents > CHARACTERIZATION OF TENSILE AND HARDNESS PROPERTIES …

CHARACTERIZATION OF TENSILE AND HARDNESS PROPERTIES …

Date post: 16-Oct-2021
Category:
Upload: others
View: 3 times
Download: 0 times
Share this document with a friend
83
CHARACTERIZATION OF TENSILE AND HARDNESS PROPERTIES AND MICROSTRUCTURE OF 3D PRINTED BRONZE METAL CLAY A Thesis Submitted to the Faculty of Purdue University by Michael Golub In Partial Fulfillment of the Requirements for the Degree of Master of Science in Mechanical Engineering August 2017 Purdue University Indianapolis, Indiana
Transcript

CHARACTERIZATION OF TENSILE AND HARDNESS PROPERTIES AND

MICROSTRUCTURE OF 3D PRINTED BRONZE METAL CLAY

A Thesis

Submitted to the Faculty

of

Purdue University

by

Michael Golub

In Partial Fulfillment of the

Requirements for the Degree

of

Master of Science in Mechanical Engineering

August 2017

Purdue University

Indianapolis, Indiana

ii

THE PURDUE UNIVERSITY GRADUATE SCHOOL

STATEMENT OF COMMITTEE APPROVAL

Dr. Jing Zhang, Chair

Department of Mechanical Engineering

Dr. Hazim El-Mounayri

Department of Mechanical Engineering

Dr. Andres Tovar

Department of Mechanical Engineering

Approved by:

Dr. Sohel Anwar

Chair of the Graduate Program

iii

Dedicated to my mother.

iv

ACKNOWLEDGMENTS

This thesis would not be possible without the constant support from my advi-

sor Dr. Jing Zhang. I also would like to extend thanks to Dr. Andres Tovar and

Dr. Hazim El-Mounayri for serving on my thesis committee. The overarching theme

of who is responsible for my commitment to get this completed are current and future

engineering students. This research has many beneficial outcomes, but I think it is

especially useful to give future engineers more knowledge with the various and future

materials that will exist. Allowing students to test various alloys will enrich their

education.

v

TABLE OF CONTENTS

Page

LIST OF TABLES . . . . . . . . . . . . . . . . . . . . . . . . . . . . . . . . . . vii

LIST OF FIGURES . . . . . . . . . . . . . . . . . . . . . . . . . . . . . . . . . viii

ABBREVIATIONS . . . . . . . . . . . . . . . . . . . . . . . . . . . . . . . . . . x

ABSTRACT . . . . . . . . . . . . . . . . . . . . . . . . . . . . . . . . . . . . . xi

1 INTRODUCTION . . . . . . . . . . . . . . . . . . . . . . . . . . . . . . . . 1

1.1 Background . . . . . . . . . . . . . . . . . . . . . . . . . . . . . . . . . 1

1.2 Metal 3D Printing Review . . . . . . . . . . . . . . . . . . . . . . . . . 4

1.3 Objective of Thesis . . . . . . . . . . . . . . . . . . . . . . . . . . . . . 8

1.4 Problem Statement . . . . . . . . . . . . . . . . . . . . . . . . . . . . . 10

1.5 Structure of Thesis . . . . . . . . . . . . . . . . . . . . . . . . . . . . . 10

2 MATERIAL PROPERTIES AND PREPARATION . . . . . . . . . . . . . . 12

2.1 Copper . . . . . . . . . . . . . . . . . . . . . . . . . . . . . . . . . . . . 12

2.2 Material Selection, Metal Clay . . . . . . . . . . . . . . . . . . . . . . . 14

2.3 Molding . . . . . . . . . . . . . . . . . . . . . . . . . . . . . . . . . . . 17

2.4 3D Printing . . . . . . . . . . . . . . . . . . . . . . . . . . . . . . . . . 20

2.5 Sintering . . . . . . . . . . . . . . . . . . . . . . . . . . . . . . . . . . . 20

3 TENSILE TEST . . . . . . . . . . . . . . . . . . . . . . . . . . . . . . . . . 32

3.1 Experimental Details . . . . . . . . . . . . . . . . . . . . . . . . . . . . 32

3.2 Test . . . . . . . . . . . . . . . . . . . . . . . . . . . . . . . . . . . . . 33

3.3 Tensile Test Equations . . . . . . . . . . . . . . . . . . . . . . . . . . . 34

3.4 Results and Discussion . . . . . . . . . . . . . . . . . . . . . . . . . . . 38

3.5 Comparison of Selected Tensile Data . . . . . . . . . . . . . . . . . . . 38

4 HARDNESS TEST . . . . . . . . . . . . . . . . . . . . . . . . . . . . . . . . 42

4.1 Experimental Details . . . . . . . . . . . . . . . . . . . . . . . . . . . . 42

vi

Page

4.2 Test . . . . . . . . . . . . . . . . . . . . . . . . . . . . . . . . . . . . . 43

4.3 Results and Discussion . . . . . . . . . . . . . . . . . . . . . . . . . . . 43

5 MICROSTRUCTURE ANALYSIS . . . . . . . . . . . . . . . . . . . . . . . 54

5.1 Results . . . . . . . . . . . . . . . . . . . . . . . . . . . . . . . . . . . . 54

5.2 Bronze Metal Clay . . . . . . . . . . . . . . . . . . . . . . . . . . . . . 54

5.3 Alloys C52100 and C90700 . . . . . . . . . . . . . . . . . . . . . . . . . 54

6 CONCLUSIONS AND RECOMMENDATIONS . . . . . . . . . . . . . . . . 60

6.1 Summary . . . . . . . . . . . . . . . . . . . . . . . . . . . . . . . . . . 60

6.2 Conclusions . . . . . . . . . . . . . . . . . . . . . . . . . . . . . . . . . 60

6.2.1 Ultimate Tensile Strength . . . . . . . . . . . . . . . . . . . . . 60

6.2.2 Young’s Modulus . . . . . . . . . . . . . . . . . . . . . . . . . . 60

6.2.3 Yield Stress . . . . . . . . . . . . . . . . . . . . . . . . . . . . . 61

6.2.4 Best Specimen . . . . . . . . . . . . . . . . . . . . . . . . . . . 61

6.3 Recommendations . . . . . . . . . . . . . . . . . . . . . . . . . . . . . . 61

REFERENCES . . . . . . . . . . . . . . . . . . . . . . . . . . . . . . . . . . . . 63

PUBLICATIONS . . . . . . . . . . . . . . . . . . . . . . . . . . . . . . . . . . . 68

vii

LIST OF TABLES

Table Page

2.1 Popular Tin-Bronze Alloys . . . . . . . . . . . . . . . . . . . . . . . . . . . 12

2.2 XRF Delta Element Results . . . . . . . . . . . . . . . . . . . . . . . . . . 17

2.3 Stress values of several copper alloys . . . . . . . . . . . . . . . . . . . . . 18

2.4 Temperature Profile . . . . . . . . . . . . . . . . . . . . . . . . . . . . . . 22

3.1 Stress Tests Results . . . . . . . . . . . . . . . . . . . . . . . . . . . . . . . 37

viii

LIST OF FIGURES

Figure Page

1.1 Syringe capable 3D printer [3]. . . . . . . . . . . . . . . . . . . . . . . . . . 2

1.2 Copper and alloying metals [4]. . . . . . . . . . . . . . . . . . . . . . . . . 3

1.3 Select laser melt process schematic overview at the machine and powderscales [15]. . . . . . . . . . . . . . . . . . . . . . . . . . . . . . . . . . . . 5

1.4 Electron Beam Schematic [18]. . . . . . . . . . . . . . . . . . . . . . . . . 7

1.5 Layout and flow paths for a LENS R©system [21]. . . . . . . . . . . . . . . 9

2.1 A 100g pouch of BRONZclayTM [35]. . . . . . . . . . . . . . . . . . . . . . 15

2.2 Phase diagram of CuSn [37]. . . . . . . . . . . . . . . . . . . . . . . . . . 16

2.3 Delta Element [38]. . . . . . . . . . . . . . . . . . . . . . . . . . . . . . . . 19

2.4 Delta Element Built-in library. . . . . . . . . . . . . . . . . . . . . . . . . 23

2.5 XRF results using Ready-Allow software . . . . . . . . . . . . . . . . . . . 24

2.6 Stress Strain Curve of several copper alloys. . . . . . . . . . . . . . . . . . 25

2.7 3D Printed Mold and Clay tensile bar. . . . . . . . . . . . . . . . . . . . . 25

2.8 Ball of clay on tortilla press. . . . . . . . . . . . . . . . . . . . . . . . . . 26

2.9 Flatten clay on tortilla press. . . . . . . . . . . . . . . . . . . . . . . . . . 26

2.10 Tensile strip partially cut out from the clay. . . . . . . . . . . . . . . . . . 27

2.11 3D printed sample. . . . . . . . . . . . . . . . . . . . . . . . . . . . . . . 28

2.12 3D printed specimens after firing. . . . . . . . . . . . . . . . . . . . . . . 29

2.13 Settings for the Createbot. . . . . . . . . . . . . . . . . . . . . . . . . . . 30

2.14 Stainless steel tray sits in the center of the tube furnace. . . . . . . . . . . 30

2.15 Control panel of tube furnace. . . . . . . . . . . . . . . . . . . . . . . . . 31

2.16 Stainless steel dish with charcoal and bronze tensile bar. . . . . . . . . . . 31

3.1 Dog bone Tensile bar shape. . . . . . . . . . . . . . . . . . . . . . . . . . 32

3.2 ASTM standard E8 flowchart [55]. . . . . . . . . . . . . . . . . . . . . . . 33

ix

Figure Page

3.3 Stress Strain example curve. . . . . . . . . . . . . . . . . . . . . . . . . . 36

3.4 Stress Strain test curve. . . . . . . . . . . . . . . . . . . . . . . . . . . . . 39

3.5 Molded specimen after break. . . . . . . . . . . . . . . . . . . . . . . . . . 40

3.6 Printed specimen after break. . . . . . . . . . . . . . . . . . . . . . . . . . 40

3.7 Printed specimen K. Top photo shows the specimen after being printedand before firing. The middle photo shows the fired specimen at 80%smaller. Bottom photo shows the same specimen after tensile test fracture. 41

4.1 Rockwell Dial Indicator. . . . . . . . . . . . . . . . . . . . . . . . . . . . . 42

4.2 A diamond tip and other tips that use different size balls for hardnesstesting. . . . . . . . . . . . . . . . . . . . . . . . . . . . . . . . . . . . . . 44

4.3 HRC [58]. . . . . . . . . . . . . . . . . . . . . . . . . . . . . . . . . . . . . 45

4.4 HRB [58]. . . . . . . . . . . . . . . . . . . . . . . . . . . . . . . . . . . . 46

4.5 Rockwell Hardness test method [58]. . . . . . . . . . . . . . . . . . . . . . 47

4.6 Sample ‘P’. . . . . . . . . . . . . . . . . . . . . . . . . . . . . . . . . . . . 48

4.7 Sample ‘O’. . . . . . . . . . . . . . . . . . . . . . . . . . . . . . . . . . . . 49

4.8 Sample ‘G’. . . . . . . . . . . . . . . . . . . . . . . . . . . . . . . . . . . . 50

4.9 Sample ‘M’. . . . . . . . . . . . . . . . . . . . . . . . . . . . . . . . . . . . 51

4.10 Sample ‘N’. . . . . . . . . . . . . . . . . . . . . . . . . . . . . . . . . . . . 52

4.11 Rockwell hardness testing . . . . . . . . . . . . . . . . . . . . . . . . . . . 52

4.12 Wrought metal comparison . . . . . . . . . . . . . . . . . . . . . . . . . . 53

5.1 200x magnification of Molded BMC. . . . . . . . . . . . . . . . . . . . . . 55

5.2 200x magnification of Printed BMC. Specimen ‘K’. . . . . . . . . . . . . . 56

5.3 200x magnification of C52100. . . . . . . . . . . . . . . . . . . . . . . . . 57

5.4 200x magnification of C90700. Specimen ‘G’. . . . . . . . . . . . . . . . . 58

5.5 200x magnification of C90700. Specimen ‘M’. Heat treated 300◦C for 20minutes. . . . . . . . . . . . . . . . . . . . . . . . . . . . . . . . . . . . . 59

x

ABBREVIATIONS

3D Three Dimensional

ASTM American Society for Testing and Materials International

BMC Bronze Metal Clay

DED Directed Energy Deposit

DMLS Direct Metal Laser Sintering

EBM Electron Beam Melting

FDM Fused deposition modeling

HRB Hardness Rockwell Scale B

HRC Hardness Rockwell Scale C

MRSA Methicillin-resistant Staphylococcus aureus

PBFP Powder Bed Fusion Process

PM Powder Metallurgy

PMC Precious Metal Clay

PMC+ Precious Metal Clay Plus

PV Present Value

SLM Selective Laser Melting

SV Seek Value

UNS Unified Numbering Systems

VRE Vancomycin-resistant enterococcus

xi

ABSTRACT

Golub, Michael M.S.M.E., Purdue University, August 2017. Characterization of Ten-sile and Hardness Properties and Microstructure of 3d Printed Bronze Metal Clay.Major Professor: Jing Zhang.

Bronze is a popular metal for many important uses. Currently, there are no

economical 3D printers that can print Bronze powders. A recent product, Bronze

Metal Clay (BMC) has arrived. Additionally, commercial metal 3D printers require

laser or electron beam sources, which are expensive and not easily accessible. The

objective of this research is to develop a new two-step processing technique to produce

3D printed metallic component. The processing step includes room temperature

3D printing followed by high-temperature sintering. Since no material data exists

for this clay, the tensile strength and hardness properties of BMC are compared to

wrought counterpart. In this research tests are completed to determine the mechanical

properties of Cu89Sn11 Bronze Metal Clay. The author of this thesis compares the

physical properties of the same material in two different formats: 3D printed clay and

molded clay. Using measured stress-strain curves and derived mechanical properties,

including Young’s modulus, yield strength, and ultimate tensile strength, the two

formats demonstrate inherit differences.

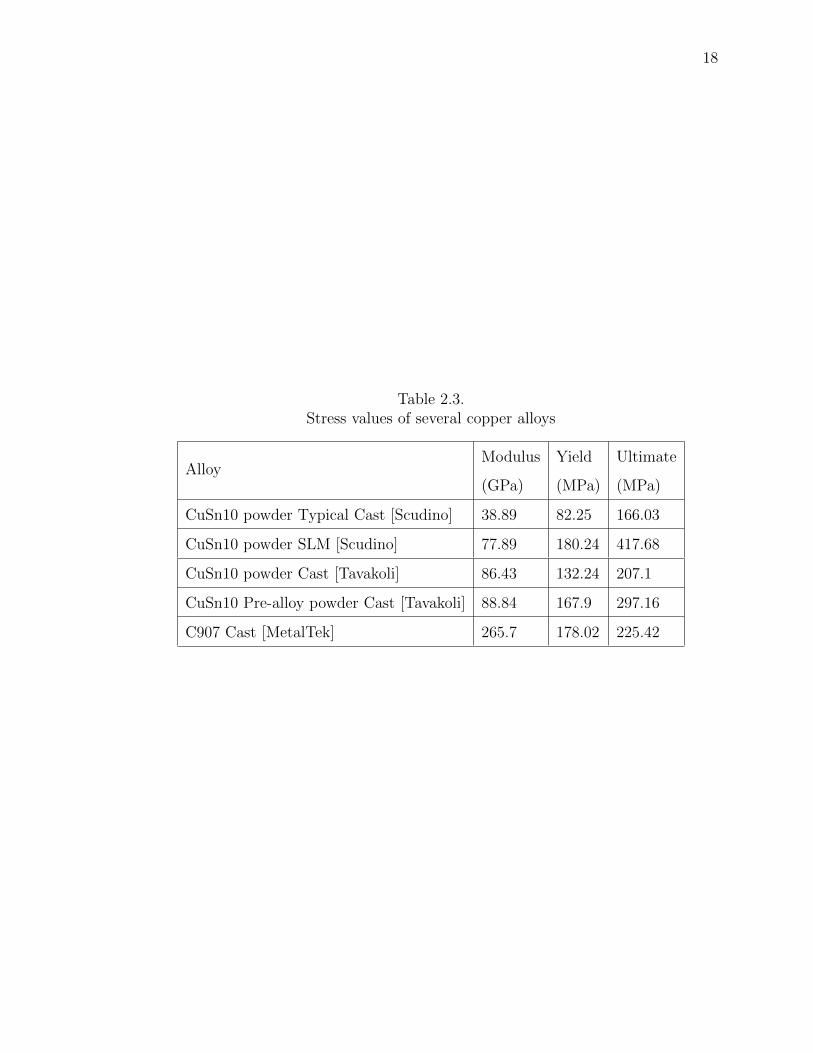
The Ultimate tensile strength for molded BMC and 3D-printed specimens sin-

tered at 960◦C was 161.94 MPa and 157 MPa, respectively. A 3D printed specimen

which was fired at 843◦C had 104.32 MPa tensile strength. Factory acquired C90700

specimen had an ultimate stress of 209.29 MPa. The Young’s modulus for molded

BMC and 3D-printed specimens sintered at 960◦C was 36.41 GPa and 37.05 GPa,

respectively. The 843◦C 3D-printed specimen had a modulus of 22.12 GPa. C90700

had the highest modulus of 76.81 GPa. The Yield stress values for molded BMC and

xii

3D-printed specimens sintered at 960◦C was 77.81 MPa and 72.82 MPa, respectively.

The 3D-printed specimen had 46.44 MPa. C90700 specimen had 115.21 MPa.

Hand molded specimens had a Rockwell hardness HRB85, while printed samples

had a mean of HRB69. Also, molded samples recorded a higher Young’s Modulus

of 43 GPa vs. 33 GPa for the printed specimens. Both samples were weaker than

the wrought Cu88.8Sn11P0.2 which had a 72 GPa. Cu88.8Sn11P0.2 also was a harder

material with an HRC45. The property difference between 3D printed, molded, and

wrought samples was explained by examining their micro structures. It shows that

3D printed sample had more pores than the molded one due to printing process. This

study demonstrates the flexibility and feasibility of using 3D printing to produce

metallic components, without laser or electron beam source.

Keywords: Bronze Metal Clay (BMC), additive manufacturing, 3D printing, ten-

sile, hardness

1

1. INTRODUCTION

1.1 Background

“Wilderness is the raw material out of which man has hammered the artifact called

civilization [1].” Production of metal materials is a relevant undertaking. There are

many fabrication choices when making metals parts. When selecting material for your

workpiece you can select a relevant metal object which comes in rod, bar, or plate.

This piece of metal can be cut with tools to make your finished part. This process

is called subtractive manufacturing. Powder Metallurgy(PM) [2] has been around

awhile and is one of the most elemental forms of metal manufacturing. Utilizing

previous PM raw ingredients, metal powders, hammering artifacts may not be the

only way to make civilizations. A slip can be created with metal powder, binder, and

water. A three dimensional (3D) syringe printer (Fig. 1.1) [3] can place the liquid

onto the tray and form printed parts.

Anywhere from 10% to 20% of clay volume is water added to make the slip.

The syringe contains metal slip. A vacuum-tube furnace is used to burn the binder

out and then finally sinter the metal. Creating metal in this way has many future

possibilities. This work brings us closer to looking at what effects this research will

have on future metal making processes. Artisans and engineers have always wanted

better materials for their craft and profession. Meanwhile, human civilization is

gauged by the sophistication of materials manipulation. Stone, bronze, and iron use

marked man’s Infantry years, while new materials and 3D printing technology define

current time. As pointed by Cowen, during the Bronze Age, bronze was alloyed with

other metals not through the hands of men but through the act of nature, whatever

metals appeared in the copper ores available. Tin Bronze is created from a mixture

of copper and tin (Fig. 1.2) [4]. The alloy setting by large plastic deformation

2

Fig. 1.1. Syringe capable 3D printer [3].

3

Fig. 1.2. Copper and alloying metals [4].

obtained by hammering a hot or cold alloy progressively declined during the Roman

period [5, 6].

The ancient Egyptians, Greeks, Romans, and Aztecs all utilized copper for ill-

ness management. British naval ship’s hulls were enclosed in copper to guard against

biofouling. In support of the historical anecdotal indications, recent laboratory test-

ing has shown that copper and copper alloys are effective antimicrobial materials.

Copper, brass, and bronze work effectively against the most troublesome antibiotic-

resistant bacteria including Methicillin-resistant Staphylococcus aureus (MRSA) and

Vancomycin-resistant Enterococcus (VRE), as well as other common harmful bac-

teria [4, 7, 8] . Copper’s flexibility, machinability, and conductivity have made it a

preferred metal for manufacturers and engineers. Copper’s antimicrobial property

has continued its popularity. Copper alloys biocidal ability offers more practical ways

to make parts that have medical community benefits [9].

In modern times, humans not only make alloys with great precision of their compo-

nents, but also manipulate them through different technological methods: smashing,

4

melting, casting, and 3D printing. It is of great significance to conduct research in

intricate material science in for future human civilization [10].

Creating a metal using 3D technology is possible, but is expensive and time-

consuming. Three-D printing technology is progressing from weaker materials such

as wax to plastics to harder ones such as metals.

The wax could be used in the lost wax process to make molds for metal parts.

Nowadays, popular 3D printing technology has advanced.

Many FDM printers utilize spools of 1.7 mm plastic filament and a heated nozzle

to produce parts one layer at a time. Although plastic printed parts are usable, their

functionality is mostly limited by rapid prototyping.

FDM has limitations, but options are expanding. However, the idea of metal 3D

printed parts is highly attractive, because of the stronger mechanical properties of

metal, and the cost-savings in making intricate parts.

1.2 Metal 3D Printing Review

Some of the forms of current metal printing include: (1) Powder Bed Fusion

Process (PBFP); (2) Selective laser melting (SLM) and direct metal laser sintering

(DMLS), and (3) Directed Energy Deposit (DED).

Powder Bed Fusion Process (PBFP) creates metal with a laser or electron beam

energy source. Either method repeatedly spreads a layer of loose powder onto the

build platform which is then melted and fused with the preceding layer. Then the

platform drops to a lower location and this sequence is repeated. Depending on the

operating energy source, different atmospheres are required. The laser system uses

an inert atmosphere and the area is filled with nitrogen or argon.

The electron beam process requires a vacuum. This is necessary because of the

short mean free path of electrons. The vacuum also prevents oxidization. During

the melting phase a partial pressure of about 10−2mbar helium is concentrated to

the build platform. This improves heat transfer and component cooling [11]. Many

5

reviews exist of both the laser and electron beam PBFP and can offer comparison

material [12,13].

Many Metal laser powder bed fusion additive manufacturing systems have similar

designs (Fig. 1.3). The method is composed of a powder delivery system and an

energy delivery system. The powder delivery system uses a piston to supply powder.

It also uses a coater to create each layer. Lastly, it also uses a piston to hold the part.

Using a single-mode continuous wave Ytterbium fiber laser, operating at 1075 nm

wavelength, an optical scanner creates a focused spot to the necessary points of the

platform.

Nitrogen or used over the powder bed helps protect the part from oxygen and clear

possible spray and metal exhaust. Several systems have a local monitoring ability that

images the melt pool. It uses a high-speed camera or a temperature sensor with the

laser system [14].

Fig. 1.3. Select laser melt process schematic overview at the machineand powder scales [15].

Electron Beam Melting (EBM) is comparable to the Selective Laser Melting (SLM)

process (see Fig. 1.3, Fig. 1.4) Both processes create parts layer by layer. There are

6

some differences between EBM and SLM process. An electron beam melts the powder

particles as an alternative of a laser beam. The powder bed is kept at temperatures

higher than 600◦C, and the powder bed cools with time. The EBM process encom-

passes additional procedure parameters. The procedures are: “beam power, beam

scanning velocity, beam focus, beam diameter, beam line spacing, plate temperature,

pre-heat temperature, contour strategies, and scan strategy [16].”

Parameters optimization is more complex than the SLM process and there are

only few materials available for EBM [17].

EBM is slow process which adds to cost of the part. There are also part size

restrictions and the matrix structure cell minimum size. Larger parts than the sub-

strate plate can be built, but the part’s initial layers need to be less wide than the

substrate plate. The EBM process uses a near vacuum atmosphere, which is different

from the inert–atmosphere–SLM process. Oxidized parts are not generated. Any

adsorbed gases on the powder particles do not cause porosity in the EBM process. It

is not recommended to use volatile elements alloys such as Zn, Mg, Pb, and Bi. [16]

While SLM process particles are completely melted together, meanwhile, the

DMLS processed particles are only sintered. These techniques use a strong laser.

The SLM process (invented by ArcamEBM, a GE additive Company) melts the pow-

der using an electron beam melting (EBM).

With any Additive Manufacturing process, support material is needed to make

large holes or cavities. FDM processes have used dissolvable materials to alleviate

this issue. However, it can take several hours to clear the support material. Metal

3D printing requires subtractive manufacturing techniques to remove the support

material. Although the machining can be streamlined for the same part, machining

one-off parts can be untimely, difficult and expensive. Directed Energy Deposit (DED)

is another popular method of 3D metal printing. Here powder or wire is inserted into

the energy source and simultaneously deposited to make the workpiece shown in

Fig. 1.5. One critical advantage is that this process can be used to repair metal

parts. Also, features can be added to regular SM parts that are more intricate. This

7

Fig. 1.4. Electron Beam Schematic [18].

process also allows for different materials to be printed at the same time. DED uses

focused energy to generate a melt pool into which metal is deposited. The process

utilizes an arc, laser or electron beam heat source. The metal can be wire or powder.

This is similar to welding technology, because material can be placed outside a build

environment by using a shield gas over the liquid metal. The most popular DED

uses a laser heat source to melt the powder feedstock stream. DED was developed at

8

Sandia National Laboratories and is the patented LENS R© process. Other DED are

extensions of welding technology. Modified welding machines can make DED parts by

multi-pass welding. Wire-fed, arc heat source DED can build large geometries because

of the lower heat input that could cause porosity generation. The machine software

automatically checks most sensors which simplifies the use. Powder hoppers are filled

and a build substrate is used. Three or more axes can be used. The more axes used

allows for additional complex geometries to be printed. The feed rate is critical and

must verified. Nozzle cleaning is required if flow is obstructed. The build chamber is

enclosed and sometimes filled with inert gas. A shield gas directed at the melt pool

provides resistance to oxidation for nonreactive metals. When printing titanium and

niobium, the chamber is flooded with argon or nitrogen. To reduce oxygen partial

pressure a vacuum pump and purge cycles are run. The build chamber is larger than

PBFP systems because of the inert gas usage [19,20].

1.3 Objective of Thesis

Creating metal objects, from the simple to the complex, there are several pro-

cesses. Today, more and more techniques have been developed. The objective of this

thesis is to conduct the design and fabrication of 3D printed bronze using the two-

step process utilizing Metal Clay. The first step is to print the clay into tensile bars.

The second step requires sintering to make it into a solid bronze object. With these

creations, several material properties can be determined. The 3D printed materi-

als mechanical properties, including tensile and micro-hardness can be characterized.

Lastly, the properties of the 3D printed with conventional wrought and molded coun-

terparts are compared. Precious Metal Clay or PMC was developed in the early 1990s

in Japan by metallurgist Dr. A. Morikawa [22]. His material consisted of microscopic

particles of pure silver or fine gold powder and a water-soluble, non-toxic, organic

binder which burns off during firing. Success was first achieved with gold and later

duplicated with silver. The original formula of PMC, now called ”Standard”, must

9

Fig. 1.5. Layout and flow paths for a LENS R© system [21].

be fired in a kiln at 900◦C (1,650◦F) and has a shrinkage rate of 30%. PMC+ is

available in sheet form which used in origami [23]. Today, metal clay is commercially

available in silver, gold, bronze, copper, and steel. It allows artists to make intricate

jewelry, beads, and small sculptures. The clay can be used just like any soft clay.

After drying, the clay can be fired in a variety of ways such as in a kiln or furnace.

When the binder burns during heating the pure sintered metal remains. Shrinkage is

10

an issue with between 8% and 30% occurring depending on the binder concentration.

Alloys such as bronze, sterling silver, and steel also are available. However, no tensile

strength data exists. Quantifying the tensile strength and hardness properties and

comparing it to wrought and cast metal are needed.

1.4 Problem Statement

Nowadays, Engineers are seeking out new and clever ways to design intricate parts.

The old ways and proven ways of creating parts are being looked at more critically.

Competition amongst manufacturing companies is making them find more cost

effective ways of doing business. Parts have the potential to be manufactured with

lower unit cost. This is dependent on the time it takes a part to be manufactured,

the materials used, the machines that make the parts, and labor costs [24]. Most

3D printed metallic components are fabricated using laser or electron beam sources,

which are expensive and not easily accessible.

In this work, what is explored is new manufacturing technique to fabricate 3D

printed metallic materials using a two-step process: room-temperature 3D printing

followed by sintering. The new 3D printing approach is inexpensive and flexible. How-

ever, the mechanical properties of the 3D printed metal are unknown yet. Material

properties of Bronze Metal Clay (BMC) are not understood. Currently, using BMC

for part making will have unknown reliability. The properties need to be computed

and the differences between different bronzes need to be explored to better serve the

engineering community.

1.5 Structure of Thesis

This thesis is organized into five chapters, providing clear and reasonable flow of

content. The first chapter introduces thesis work, gives the background of research,

and presents a statement of the current problem and objective of this thesis. Chapter

2, Chapter 3, Chapter 4, and Chapter 5 focus on materials used, printing process,

11

test method, and research data and correlated graphs, tensile test, and hardness test.

Last but not least, Chapter 6 gives conclusions and directions of future study.

12

2. MATERIAL PROPERTIES AND PREPARATION

2.1 Copper

Copper was the first metal discovered and used, and the third widely used metal

after iron and aluminum. Over the centuries it has been used for art and engineer-

ing. It has great electrical conductivity, corrosion resistance, easy machinability and

beautiful color. Interestingly, copper has a high thermal conductivity and it is non-

magnetic. A face-centered cubic structure helps copper to have good ductility and

strength. Alloyed copper has increased hardness and strength properties. There are

hundreds of wrought-copper alloy and cast-copper-alloy compositions [25]. The plain

copper-tin bronzes usually contain trace amounts of phosphorus for deoxidizing [26].

Tin-Bronze is an ancient alloy used for thousands of years. Because the ancient peo-

Table 2.1.Popular Tin-Bronze Alloys

Specifications Cu Sn P

C51000 95 5 trace

C51100 95.6 4.2 .2

C52100 92 8 trace

C52400 90 10 trace

C90700 89 11 .3

C90800 87 12

C90900 87 13

C91100 84 16

C91300 81 19

13

ple used this formula, it is natural to think that when new methods are pioneered to

make metals, it is natural to start with Tin-Bronze [27]. Bronze alloys are available in

wrought, cast or powders made from those materials. Copper-tin alloys are liquefied

and poured into a mold to make casted materials.

Either the processes of die, sand or permanent–mold casting is used. Once casted,

metal can be further processed by extrusion, rolling, or forging. Major benefits of

castings are their flexible design process and inexpensive processes. Casted metal has

some general properties. This metal usually has a larger grain size, extraneous inclu-

sions, and porosity. The porosity is caused by gases in the metal or shrinkage during

solidification. Of course, the art in making good castings relies on reducing the defects

while getting the most out of the process economies [28]. Phosphor bronzes (Cu-Sn)

are one of five families of copper alloys that are used for bearing and wear-resistant

alloys in cast form. The others families are Phosphor bronzes with lead (Cu-Sn-Pb)

alloys, aluminum bronze, manganese bronze, and silicon bronze. Phosphor bronzes

have trace phosphorus fluctuating from 0.1 to 1 percent. Hardness rises with addi-

tional phosphorus content. Meanwhile, Cu-Sn-Pb alloys have, reasonable strength,

high-value hardness, and great wear resistance [29].vDeficient lubricant applications

require these higher lead compositions. Aluminum, Mn and Si bronzes have great

tensile strength, high hardness, and good shock resistance. Despite the advantages of

other family members, the tin bronzes (commonly referred to as phosphor bronzes),

are the dominant alloys in this family. Most popular wrought phosphor bronze al-

loys contain 5, 8, or 10 percent tin. Respectively these allows are: C51000, C52100,

and C52400. Typically these three alloys contain less than 0.4 percent phosphorus

(see Table 2.1). Again this elemental addition improves hardness. Also these al-

loys have outstanding elastic properties. The numbering system is from the Unified

Numbering Systems (UNS). Copper alloys are designated by a ‘C’ followed by 5 num-

bers. The Copper Development Association created a three digit numbering system

which has been expanded for more compositions. Wrought allows start at C1xxxx,

and cast alloys are either C8xxxx or C9xxxx. There are material property differ-

14

ences between wrought and cast copper alloys that contain the same compositions.

Casting allows better latitude because less hot-working and cold-working takes place.

Still, the impurities that occur during the casting process can create lower quality

castings [27, 30–33].

2.2 Material Selection, Metal Clay

Lump metal clay in bronze was introduced in 2008 by Metal Adventures Inc. (Fig.

2.1) and in 2009 by Prometheus. Because of the lower cost, the BMCs are used by

artists more often than the gold and silver metal clays. The actual creation time of a

bronze piece is also far greater than that of its silver counterpart. Base metal clays,

such as bronze, copper, and steel metal clays are best fired in the absence of oxygen to

eliminate the oxidation of the metal by atmospheric oxygen. A means to accomplish

this to place the pieces in activated carbon inside a container was developed by Dr.

William Struve [34].

Metal clays are also available as dry powders to which water is added to hydrate

and kneaded to attain a clay consistency. One advantage to the powders are their

unlimited shelf life. Silver is a noble metal and it resists oxidation. Silver can be

fused by heat in an oxygen environment in a kiln. When particles are heated, close to

melting temperature, but not melting, they move close together and become sticky,

adhering to each other. This compaction and partial fusing is called ’sintering’. Sin-

tering produces metals that are more porous and lighter than cast metal, also not as

strong. Precious metals are costly, and a ’base metal’ clays solution was sought [36].

Base metals like copper and bronze can corrode when heated in an oxygen atmo-

sphere. Using activated charcoal in a closed, stainless steel container produces a low

oxygen environment for sintering base metal clay. When heated to high temperatures,

the charcoal tries to burn and uses any available oxygen in the area, thus preventing

oxidation of metal particles. The BMC used has 89% copper and 11% tin. Using the

phase diagram (Fig. 2.2), the alpha phase plus liquid starts at 843◦C.

15

Fig. 2.1. A 100g pouch of BRONZclayTM [35].

16

Fig. 2.2. Phase diagram of CuSn [37].

However, in the first stage of firing base metal clay, the organic binders need to

be burned away first. Then it is followed up with a sintering temperature. The exact

composition of BMC is unknown to the general public, however Cu89Sn11 is the

promised alloy. Pre-alloy bronze powder are commercially available and Table 2.1

shows the possible alloy names. C90700 appears to be an exact match. Meanwhile,

the microscopic metal particles makeup 80% to 90% by weight of the clay. Water

is from 10% to 20%. Finally the binder which is usually methyl cellulose takes up

17

Table 2.2.XRF Delta Element Results

Readout Alloy MN Cu Sn P

Unfired BMC C524 1.1 87.20 12.61 0.2

Fired BMC C524 1.4 87.42 12.39 0.2

1% by weight. The binder allows for: (1) slow drying; (2) improve stability; (3)

reduce brittleness of dry clay, and (4) make carving of dry clay easier. The particles

come in various mesh sizes and can come pre-alloyed or an elemental mixture of tin

and copper. BMC is analyzed while it was clay and after firing. Utilizing the Delta

Element hand held X-ray fluorescence (XRF) reader (Fig. 2.4) we found a match [38].

XRF is non-destructive method to determine the elemental composition of mate-

rials. XRF devices measure the fluorescent X-ray emitted from a specimen while it

is excited by a X-ray. The XRF device has a built in library shown in Fig. 2.5. The

library had additional alloys added and the software matched the alloy to C52400

shown in Fig. 2.6. Table 2.2 shows the results from the two tests. The unfired BMC

had a close match value of MN:1.1 vs. fired BMC of MN:1.4. Also, the appearance

of phosphorus was not a surprise because it is a popular added element and assists

in deoxidation the alloy [39,40].

Several samples were found in the literature [41–43] that are shown in Fig. 2.7

and attributes in Table 2.3. These alloys are chosen because they closely matched

the BMC.The SLM specimen had the best result in ultimate stress, but the C90700

cast had the highest modulus stress value. These values are what we will compare

our results to in this thesis.

2.3 Molding

Utilizing commercial available product: BRONZclayTM, the clay formed into

molded tensile bars. The first method was to 3D print a plastic mold [44](Fig. 2.7).

18

Table 2.3.Stress values of several copper alloys

AlloyModulus

(GPa)

Yield

(MPa)

Ultimate

(MPa)

CuSn10 powder Typical Cast [Scudino] 38.89 82.25 166.03

CuSn10 powder SLM [Scudino] 77.89 180.24 417.68

CuSn10 powder Cast [Tavakoli] 86.43 132.24 207.1

CuSn10 Pre-alloy powder Cast [Tavakoli] 88.84 167.9 297.16

C907 Cast [MetalTek] 265.7 178.02 225.42

19

(a)

(b)

Fig. 2.3. Delta Element [38].

20

The design of the tensile bar shape was created by Laboratory Devices [45] and

used by both Mechanical Engineering and Mechanical Engineering Technology teach-

ing labs at IUPUI as well as many other universities here in the USA. These specimens

do not meet either the ASTM 370 or ASTM E8/E8M standards because of the 4 in

length requirement. This allows causes the grip length to be smaller. The specifica-

tion calls out a total length of 4 in, and grip sections of 1.25 in. Laboratory Devices

reports that these are the tensile flat specimens they have been selling for many years.

As long as the machine will hold the sample, it is believed that adequate data can

be obtained. Our grip length averaged around 38 mm which was within ASTM spec-

ifications. The clay was pushed into the mold. Uniform results were not obtained.

Another molding procedure used was flattening the clay with a rolling pin with rubber

band spaces to ensure uniform thickness. This was problematic. It tended to cause

cracks in the clay. Lastly, using a tortilla press a uniform thickness was established

and a tensile bar was cut out with a razor blade (Fig. 2.8, Fig. 2.9, Fig. 2.10).

2.4 3D Printing

The tensile bar specimen was converted in an stl file format and was sliced in

G-code. Then the G-code was run on the Createbot clay printer [3, 46, 47]. A 3D

printed BMC tensile bars were made (Fig. 2.14). Fig. 2.15 shows the shrinkage from

80 mm to 60 mm that occurs after firing. That is a 75 percent decrease in length.

Createbot suggested to use a layer height of 0.74 mm with a first layer height of 0.84

mm shown in Fig. 2.13. The slip was refrigerated to 4◦C prior to use, and no heating

was used in the printer. The printer used a 14 gauge Luer lock nozzle. The printer

was set at a print speed of 20 mm/s.

2.5 Sintering

Sintering is the step of the 2 step process to make BMC into bronze. It is well

established that different ways of sintering will cause effect on the porosity and the

21

material characteristics of the final metal [37, 48–53]. To fire BMC a kiln or furnace

is used. This research project used a vacuum tube furnace, model QSH-VTF-1700T,

which is capable of reaching 1700◦C. The vacuum apparatus for the furnace was

not used, because Dr. Struve protocols of using the activated coconut carbon were

adhered to. A stainless steel container with a lid was created out of a stainless steel

butter dish. Activated carbon is added to the pan about 6 mm deep. Then the dried

clay is placed on the charcoal and is covered by at least another 6 mm of charcoal.

The vessel is loaded into the tube furnace (Fig. 2.11) and the best temperature

combination used was 60 minute ramp to 343◦C, holding for 180 minutes and then

240 ramp to 900◦C to 960◦C, and holding for 240 minutes. Fig. 2.12 shows the face

panel of the furnace. Two major readouts use Celsius degree units. The Present Value

(PV) and Seek Value(SV) are illuminated display in red and green colors, respectively.

Table 2.4 shows the temperature profile that was used.

The binder was confirmed that it burnt at 300◦C. The ’correct’ sintering tem-

perature depends on the specific kiln. For safety, the container is removed from the

furnace at below 260◦C.

After the furnace is cool enough the metal tray is removed. The charcoal is

removed and the BMC is has become a bronze tensile bar (Fig. 2.13).

22

Table 2.4.Temperature Profile

Segment Panel Symbol

User Input

[Celsius]

[minutes]

Explanation

1 C01 0◦C Initial Temperature

2 t01 60 minutesRamping time from 0◦C to 343◦C

Average heating rate is 5.7 C/min

3 C02 343◦CTarget temperature value to

first heating stage (343◦C)

4 t02 180 minutes Searing time at 343◦C stage

5 C03 343◦CTemperature value at the heating

flat to burn off the binder

6 t03 240 minutes

Second heating time from

343◦C to 900◦C

Average heating rate is

2.32 C/min

7 C04 900◦CTarget temperature value

at peak heating flat

8 t04 240 minutes Searing time at 900◦C stage

9 C05 900◦C Temperature value at the heating flat

10 t05 -121Program End, Output power off.

Furnace cooling down naturally

23

Fig. 2.4. Delta Element Built-in library.

24

(a)

(b)

Fig. 2.5. XRF results using Ready-Allow software

25

Fig. 2.6. Stress Strain Curve of several copper alloys.

Fig. 2.7. 3D Printed Mold and Clay tensile bar.

26

Fig. 2.8. Ball of clay on tortilla press.

Fig. 2.9. Flatten clay on tortilla press.

27

Fig. 2.10. Tensile strip partially cut out from the clay.

28

Fig. 2.11. 3D printed sample.

29

Fig. 2.12. 3D printed specimens after firing.

30

Fig. 2.13. Settings for the Createbot.

Fig. 2.14. Stainless steel tray sits in the center of the tube furnace.

31

Fig. 2.15. Control panel of tube furnace.

Fig. 2.16. Stainless steel dish with charcoal and bronze tensile bar.

32

3. TENSILE TEST

3.1 Experimental Details

Engineering materials can utilize several mechanical tests to measure strength.

Specimens are destroyed in the test process. Perhaps the most common experiment

is the tensile force. Hardness is usually defined in terms of resistance of the material

to penetration by a hard ball or point. Specimens are affectionately called dog bones.

This is because of the shape is a bar with larger sized ends. We used the ASTM

standards [54,55] for metal testing (Fig. 3.1) using our specimen design [45].

Fig. 3.1. Dog bone Tensile bar shape.

33

Utilizing the plan for the specimens the goal was to make them uniform and

smooth (un-notched). When performing tensile force testing various experimental

devices exist. Both simple hand-operated and computer control devices exist. The

large computer control devices are called universal testing machines.

Fig. 3.2. ASTM standard E8 flowchart [55].

3.2 Test

The specimen width and length of the specimen are recorded with a 0.001 in

caliper. The MTS computer requires the width and thickness as well as the grip

separation. After loading the specimen into the grips on the MTS QTest the grip

separation measurement can be recorded. The extensometer is installed on the spec-

imen and then zeroed out on the computer. Some specimens required the grip sep-

34

aration to be different depending on the specimen thickness. A tensile strain rate

applied of 0.0847 mm/s was utilized. The machine stops immediately when a break

is detected, or if the extensometer has gone beyond its maximum height. The MTS

Testworks software will record a raw data which was analyzed in Microsoft Excel and

Matlab. Fig. 3.2 shows the E8 testing procedures that were followed when testing

the specimens.

3.3 Tensile Test Equations

To begin the tensile testing, it is essential to understand the fundamental theory

behind the tensile test. Some very basic principles need to be defined. First, engi-

neering stress is defined as

S =F

A0

(3.1)

where F is the axial tensile force and A0 is the initial undeformed cross-sectional area

of the specimen. Second, the engineering strain is defined as

e =∆L

L0

(3.2)

where the L0 is the initial unchanged length and ∆L is the change in length with

respect to the initial length, L0. The ratio of the stress to the strain is called the

elastic modulus and can be defined as

E =σ

ε(3.3)

The relationship between the stress and the strain is given by a stress-strain curve as

shown below. To determine the modulus of elasticity for each material, an algorithm

involving the linear regression was created. The algorithm begins by storing all the

35

data points between the initial start point and the maximum peak point (ultimate

strength). It is then that the stored data set is split into approximately six equal sets

with zero overlap. Within each region, a linear regression is performed in order to

determine the slope of the line.

Linear Regression Line Equation:

Y = β0X + β1 (3.4)

Linear Regression Coefficient:

β0 =

n∑i=1

(xi − x)(yi − y)

n∑i=1

(xi − x)2(3.5)

Once the slopes are all determine, the maximum slope is taken as the experimen-

tally determined modulus of elasticity for the elastic region of the curve. It should be

noted that depending on the frequency of data collection (number of points taken)

six regions may not be enough to get a good approximation of the modulus. In this

case, six was chosen since it has been well established as the number in algorithms

used by Universal Tensile Test Machines, such as Instron.

Once the modulus is known, the 0.2% offset is generated in order to calculate the

yield stress [56, 57]. The algorithm employed was a simple minimization method in

order to determine the intersection of the closest points on the curve and offset line.

Since the tensile test frequency of data collection varied greatly, the algorithm incor-

porated a linear interpolation method between every two points on the stress strain

curve to ensure sufficient number of points for a good approximation. The algorithm

would start by calculating the distance between every point on the offset line with

36

Fig. 3.3. Stress Strain example curve.

respect to every point on the interpolated line between two points. This is done for

every set of two points consecutively. As it is calculating, the program compares

the distance for each one. The smallest distance between two points has its interpo-

lated values stored. When complete, the stored interpolated points is considered the

approximated yield stress.

37

Table 3.1.Stress Tests Results

AlloyModulus

(MPa)

Yield

(MPa)

Ultimate

(MPa)

CuSn10 powder

Typical Cast [Scudino]38.89 82.25 166.03

CuSn10 powder SLM [Scudino] 77.89 180.24 417.68

CuSn10 powder Cast [Tavakoli] 86.43 132.24 207.10

CuSn10 Pre-alloy powder Cast [Tavakoli] 88.84 167.90 297.16

C907 Cast [Metaltek] 265.70 178.02 225.42

C90700

Cast Prepared Specimen (G)76.81 115.21 209.29

BMC printed and sintered in 4

hours ramp to 843C (K)22.12 46.44 104.32

BMC printed and sintered in 4

hours ramp to 960C (L)37.05 77.81 157.00

BMC molded and sintered in 10

hours ramp to 960C (Z)36.41 72.82 161.94

38

3.4 Results and Discussion

The stress-strain curves of tested tensile bars of four specimens are plotted with

previous known data in Fig. 3.4. The C90700 sample aligned well with the MetalTek

data. Two printed specimens were ramped up in four hours to either 843◦C or 960◦C,

while the molded one were ramped up in 10 hours. The long time involved before

break for the molded specimens caused the extensometer to go past its maximum

height. The 10 hour sintering creates a stronger material.

3.5 Comparison of Selected Tensile Data

Additionally, looking at the output data stronger material. Also, molded samples

recorded a higher modulus of 37.05 GPa vs. 22.12 GPa for the printed specimens

(See Table 3.1). Both samples were much weaker than the wrought Cu88.8 Sn11 P0.2

which had a 72.81 GPa. Molded specimens are in Fig. 3.4. Printed specimens are

shown in Fig. 3.5.

39

Fig. 3.4. Stress Strain test curve.

40

Fig. 3.5. Molded specimen after break.

Fig. 3.6. Printed specimen after break.

41

Fig. 3.7. Printed specimen K. Top photo shows the specimen afterbeing printed and before firing. The middle photo shows the firedspecimen at 80% smaller. Bottom photo shows the same specimenafter tensile test fracture.

42

4. HARDNESS TEST

Fig. 4.1. Rockwell Dial Indicator.

4.1 Experimental Details

Hardness testing was completed use both HRB and HRC using a Rockwell Hard-

ness tester (Fig. 4.1) using ASTM standard E18 [58].

Fig. 4.5 explains the three-step method when completing a Rockwell Harness test.

During step 1 an initial force, F0, is put onto the point and a hole is indented. Step

43

2 completes the indentation with force, F1. Step 3 the F1 force is removed and a

reading is recorded from the indicator.

Rockwell tests scales go from A to Z and have specifications for the indenter and

required test force. The equations used in this research are based on two cases. Here

e is the total increase of penetration depth under initial force after additional force

removal. Units are in 0.002 mm.

Rockwell test with Brale Indenter (Fig 4.3):

hardness = 100 − e (4.1)

Rockwell test with Ball Indenter (Fig. 4.4)

hardness = 130 − e (4.2)

4.2 Test

Sample of Cu92Sn8 plate was hardness tested (Fig. 4.4). Another sample of

Cu92Sn8 plate was heated (Fig. 4.4). the grain pattern was disrupted in the ‘O’

specimen which caused a higher HRB value.

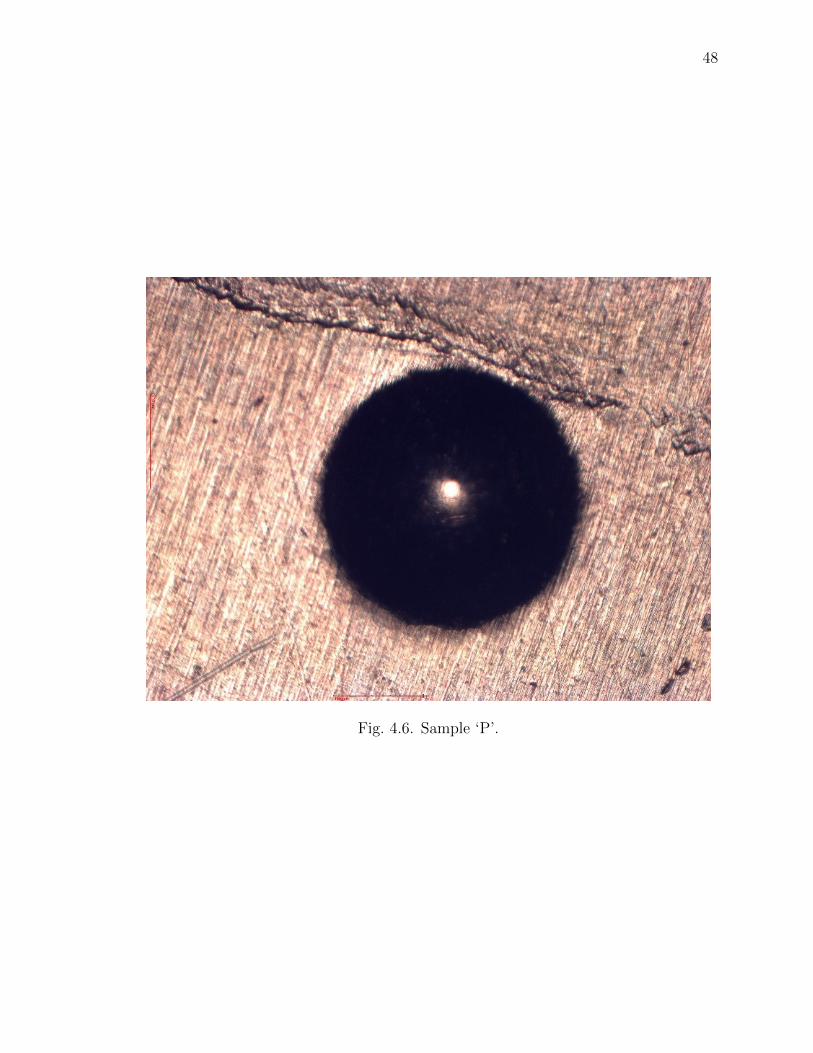
Using alloy C52100 shown in Fig. 4.6 and Fig. 4.7 the detection of grain pattern

is difficult to decipher [59–61].

Alloy C90700 is shown in Fig. 4.8, Fig. 4.9, and Fig 4.10.

4.3 Results and Discussion

Hand molded specimens had a Rockwell hardness HRB85, while printed samples

had a mean of HRB69 (Fig. 4.11). Copper alloy Cu88.8Sn11P0.2 was a hard material

with a HRC45 (Fig. 4.12).

44

Fig. 4.2. A diamond tip and other tips that use different size balls forhardness testing.

45

Fig. 4.3. HRC [58].

46

Fig. 4.4. HRB [58].

47

Fig. 4.5. Rockwell Hardness test method [58].

48

Fig. 4.6. Sample ‘P’.

49

Fig. 4.7. Sample ‘O’.

50

Fig. 4.8. Sample ‘G’.

51

Fig. 4.9. Sample ‘M’.

52

Fig. 4.10. Sample ‘N’.

Fig. 4.11. Rockwell hardness testing

53

Fig. 4.12. Wrought metal comparison

54

5. MICROSTRUCTURE ANALYSIS

5.1 Results

Five specimens were cut-up and etched with Nitric Acid [62, 63] (Fig. 5.1, Fig.

5.2, Fig. 5.3, Fig. 5.4 and Fig 5.5).

5.2 Bronze Metal Clay

Voids are trapped spaces caused by the unburnt binder or trapped binder gases

(Fig. 5.1). Tin can be seen in Fig. 5.2.

5.3 Alloys C52100 and C90700

Although C52100 had a clear grain structure (Fig. 5.3) C90700 did not produce

a clear grain structure (Fig. 5.4, Fig 5.5)

55

Fig. 5.1. 200x magnification of Molded BMC.

56

Fig. 5.2. 200x magnification of Printed BMC. Specimen ‘K’.

57

Fig. 5.3. 200x magnification of C52100.

58

Fig. 5.4. 200x magnification of C90700. Specimen ‘G’.

59

Fig. 5.5. 200x magnification of C90700. Specimen ‘M’. Heat treated300◦C for 20 minutes.

60

6. CONCLUSIONS AND RECOMMENDATIONS

6.1 Summary

This research project was an innovative approach to current technologies. Utiliz-

ing two recent developments of BMC and 3D printers had much to synergize. The

motivation was to determine if the bronze that was created would have adequate

properties. Molded and printed specimens were created using an ASTM 638 speci-

men size. Tensile tests and hardness tests where completed and the results show that

the molded samples were stronger.

6.2 Conclusions

6.2.1 Ultimate Tensile Strength

The Ultimate tensile strength for BMC ‘Z’ specimen was 161.94 MPa. This molded

specimen was better than BMC ‘K’ printed specimen which was fired at lower tem-

perature of 843◦C and had a ultimate stress of 104.32 MPa. Meanwhile, BMC ‘L’

printed specimen had a ultimate stress of 157 MPa. This value closely resembles ‘Z’

because they were both fired to a higher temperature of 960◦C. The C90700 speci-

men had an ultimate stress of 209.29 MPa which was greater than any of the BMC

specimens.

6.2.2 Young’s Modulus

The Young’s modulus was 37.05 GPa and 36.41 GPa for ‘L’ and ‘Z’, respectively.

These samples were both fired at the same temperature. Meanwhile ‘K’ had a modulus

61

of 22.12 GPa because of the lower sintering temperature reduced the strength. C90700

had the highest modulus of 76.81 GPa.

6.2.3 Yield Stress

Both ‘L’ and ‘Z’ had similar Yield stress values. They were 77.81 MPa and 72.82

MPa. These values are not as close as the modulus. The 3D printed specimen L’

had the highest value of the three BMC samples regarding yield stress. Finally the

C90700 specimen had 115.21 MPa for yield stress.

6.2.4 Best Specimen

Of the three BMC specimens the printed BMC specimen ‘L’ had led in 2 areas,

and was less than specimen ‘Z’ in one value by only 2%. The conclusion is that 3D

printed materials have slightly better mechanical properties than molded parts. A

higher temperature of 960◦C increased the strength becuase there was less /alpha

The C90700 was adequate in establishing an upper-bound, and ensured that our data

was consistent.

From this work we see that BMC is a worthwhile material to make metal parts.

Both the 3D printing process and molded materials have very similar mechanical

properties, but do not approach the high values of the C90700 alloy bar stock. Bronze

is a worthy metal in the engineering toolbox. The possibility of inexpensively creating

intricate objects now exists.

6.3 Recommendations

Progress can be continued to be made on this current effort. The material used is

low cost, and many more specimens can be produced. Several areas of possible testing

include compression, and 3 bar bending. Also BMC can be combined with pure

copper clay which would allow samples from the range of Cu89Sn11 to Cu99.9Sn0.1 to

62

be created and then tested. With a temperature chamber the material can be tested

under different conditions. A lot of effort was to devise a procedure that did not

require a vacuum furnace, however allowing for vacuum could decrease firing times,

and increase the amount of binder that is removed from the work piece. Changes to

the 3D printer settings may be helpful in getting better specimens. Three-D printing

the slip was not consistent. Humidity may play a roll. It appears using air pressure

may be a better option than an acme lead screw threaded rod.

REFERENCES

63

REFERENCES

[1] A. Leopold, A Sand County almanac, and Sketches here and there. OxfordUniversity Press, pp. 1, 1949.

[2] J. T. Black, R. A. Kohser, and E. P. DeGarmo, DeGarmo’s materials and pro-cesses in manufacturing, 10th ed. Wiley, pp. 344-364, 2008.

[3] Createbot, Instruction manual, 2016 (accessed July 21, 2017). [Online].Available: http://createbot.net/

[4] Copper.org, The copper advantage guide to working with copper andcopper alloys, 2010 (accessed July 21, 2017). [Online]. Available: https://www.copper.org/publications/pub list/pdf/a1360.pdf

[5] S. Andrieu, B. Bayle, M. Pernot, and J.-M. Welter, “Effects of various inclusionson the behaviour of a cusn 9 bronze, under different mechanical tests.” Revuede Metallurgie, Cahiers d’Informations Techniques, vol. 97, no. 5, pp. 599–612,2000.

[6] M. Pernot and F. Montheillet, “Archaeometallurgy of metal working: Hammer-ing of copper base alloys during the protohistoric period. first results.” Rev MetallCIT, vol. 91, no. 5, pp. 849–861, 1994.

[7] F. Awaja, D. Stifter, and N. Laidani, “Anti-adhesion of thin polymer films ascells/biofilm repellent for biomedical devices,” Surfaces and Interfaces, vol. 4,pp. 18–26, 2016.

[8] L. Medeghini, S. Mignardi, C. De Vito, N. Macro, M. DAndrea, and S. Richard,“New insights on early bronze age iv pottery production and consumption in thesouthern levant: The case of khirbat iskandar, jordan,” Ceramics International,vol. 42, no. 16, pp. 18 991–19 005, 2016.

[9] M. Kupkova, S. Strobl, M. Kupka, H. Danninger, and E. Dudrov, “Static com-pression and resonance vibration tests on cellular materials g,” Metalurgija,vol. 41, no. 4, pp. 309–312, 2002.

[10] Mygeologypage, Chapter 4: the bronze age, 1999 (accessed July 21, 2017).[Online]. Available: http://mygeologypage.ucdavis.edu/cowen/∼gel115/115ch4.html

[11] W. E. King, H. D. Barth, V. M. Castillo, G. F. Gallegos, J. W. Gibbs, D. E.Hahn, C. Kamath, and A. M. Rubenchik, “Observation of keyhole-mode lasermelting in laser powder-bed fusion additive manufacturing,” Journal of MaterialsProcessing Technology, vol. 214, no. 12, pp. 2915–2925, 2014.

64

[12] W. King, A. Anderson, R. Ferencz, N. Hodge, C. Kamath, S. Khairallah,and A. Rubenchik, “Laser powder bed fusion additive manufacturing of met-als; physics, computational, and materials challenges,” Applied Physics Reviews,vol. 2, no. 4, p. 041304, 2015.

[13] A. Gusarov and I. Smurov, “Modeling the interaction of laser radiation withpowder bed at selective laser melting,” Physics Procedia, vol. 5, pp. 381–394,2010.

[14] S. K. Everton, M. Hirsch, P. Stravroulakis, R. K. Leach, and A. T. Clare, “Reviewof in-situ process monitoring and in-situ metrology for metal additive manufac-turing,” Materials & Design, vol. 95, pp. 431–445, 2016.

[15] Femeval.com, Knowledge based process planning and design for additivelayer manufacturing, 2013 (accessed July 21, 2017). [Online]. Available:http://www.femeval.com/proyectos/karma/

[16] P. K. Gokuldoss, S. Kolla, and J. Eckert, “Additive manufacturing processes:Selective laser melting, electron beam melting and binder jettingselection guide-lines,” Materials, vol. 10, no. 6, p. 672, 2017.

[17] Arcam.com, EBM-built materials – way beyond average, 2015 (accessedJuly 21, 2017). [Online]. Available: http://www.arcam.com/technology/electron-beam-melting/materials

[18] M. S. Hossain, J. A. Gonzalez, R. M. Hernandez, M. A. I. Shuvo, J. Mireles,A. Choudhuri, Y. Lin, and R. B. Wicker, “Fabrication of smart parts usingpowder bed fusion additive manufacturing technology,” Additive Manufacturing,vol. 10, pp. 58–66, 2016.

[19] W. J. Sames, F. List, S. Pannala, R. R. Dehoff, and S. S. Babu, “The metallurgyand processing science of metal additive manufacturing,” International MaterialsReviews, vol. 61, no. 5, pp. 315–360, 2016.

[20] Z. Doubrovski, J. C. Verlinden, and J. M. Geraedts, “Optimal design for ad-ditive manufacturing: opportunities and challenges,” in ASME InternationalDesign Engineering Technical Conferences and Computers and Information inEngineering Conference. American Society of Mechanical Engineers, ConferenceProceedings, pp. 635–646, 2011.

[21] R. P. Mudge and N. R. Wald, “Laser engineered net shaping advances additivemanufacturing and repair,” Welding Journal, New York, vol. 86, no. 1, p. 44,2007.

[22] K. Hoshino, Morikawa, T. Kohno, K. Ueda, and M. Miyakawa, ”Moldablemixture for use in the manufacturing of precious metal articles,” 1994(accessed July 21, 2017). [Online]. Available: https://www.google.com/patents/US5328775

[23] Metalclayguru.com, What is metal clay, 2010 (accessed July 21, 2017). [Online].Available: http://metalclayguru.com/what-is-metal-clay/

[24] F. C. Walsh and C. T. J. Low, “A review of developments in the electrodepositionof tin-copper alloys,” Surface and Coatings Technology, vol. 304, pp. 246–262,2016.

65

[25] Copperalliance, Copper and copper alloys, 2004 (accessed July 21, 2017).[Online]. Available: http://copperalliance.org.uk/docs/librariesprovider5/resources/pub-120-copper-and-copper-alloys.pdf

[26] C. Mathewson, Modern Uses of Nonferrous Metals. The Maple Press Company,pp. 88-94, 1935.

[27] J. R. Davis, Copper and copper alloys. ASM International, pp. 130-167, 2001.

[28] E. Avallone, I. Baumeister, and A. Sadegh, Marks’ Standard Handbook for Me-chanical Engineers. 10. New York: McGraw-Hill, pp. 64-88, 2006.

[29] R. B. Ross, Metallic materials specification handbook. Springer Science & Busi-ness Media, pp. 153-164, 2013.

[30] J. R. Davis, Alloying: understanding the basics. ASM international, pp. 480-490,2001.

[31] Y. Prasad, K. Rao, and S. Sasidhar, Hot working guide: a compendium of pro-cessing maps. ASM international, pp. 2-32, 2015.

[32] H. R. Clauser, Industrial and engineering materials. McGraw-Hill School Pub-lishing Company, pp. 180-185, 1975.

[33] B. Bayle, P. Bocher, J. Jonas, and F. Montheillet, “Flow stress and recrystallisa-tion during hot deformation of cusn9 alloys,” Materials science and technology,vol. 15, no. 7, pp. 803–811, 1999.

[34] Y. M. Padilla, Bronze Metal Clay. Lark Books, pp. 2-32, 2010.

[35] Riogrande.com, Welcome to BRONZclay TM & COPPRclay TM, 2014 (accessedJuly 21, 2017). [Online]. Available: https://media1.riogrande.com/content/welcome-to-bronzclay-copprclay-is.pdf

[36] E. Afshari and M. Ghambari, “Characterization of pre-alloyed tin bronze powderprepared by recycling machining chips using jet milling,” Materials & Design,vol. 103, pp. 201–208, 2016.

[37] R. M. German and L. G. Campbell, “Atmospheric oxidation corrosion of sinteredartistic bronze,” Powder Metallurgy, vol. 49, no. 2, pp. 189–191, 2006.

[38] Olympus-ims.com, Delta family: hand held XRF analyzers, 2010 (accessed July21, 2017). [Online]. Available: http://www.olympus-ims.com/en/

[39] O. D. Neikov, I. Murashova, N. A. Yefimov, and S. Naboychenko, Handbook ofnon-ferrous metal powders: technologies and applications. Elsevier, pp. 1-12,2009.

[40] M. Naboka and J. Giordano, Copper alloys. Nova Science Publishers, pp. 1-2,2011.

[41] S. Scudino, C. Unterdrfer, K. Prashanth, H. Attar, N. Ellendt, V. Uhlenwinkel,and J. Eckert, “Additive manufacturing of cu10sn bronze,” Materials Letters,vol. 156, pp. 202–204, 2015.

66

[42] A. Tavakoli, “Development of tin-bronze and copper based journal bearing ma-terials with tribaloy alloy additives,” Thesis, pp. 1-45, 2007.

[43] MetalTek, Alloy guide, 2016 (accessed July 21, 2017). [Online]. Available:https://www.metaltek.com/alloy-guide

[44] X. Ren, H. Shao, T. Lin, and H. Zheng, “3d gel-printingan additive manufactur-ing method for producing complex shape parts,” Materials & Design, vol. 101,pp. 80–87, 2016.

[45] F. LaMay, Tensiles labatory device, 2016 (accessed July 21, 2017). [Online].Available: http://www.laboratorydevicesco.com/tensiles.html

[46] S. Hong, C. Sanchez, H. Du, and N. Kim, “Fabrication of 3d printed metalstructures by use of high-viscosity cu paste and a screw extruder,” Journal ofElectronic Materials, vol. 44, no. 3, pp. 836–841, 2015.

[47] Z. C. Cordero, D. H. Siddel, W. H. Peter, and A. M. Elliott, “Strengthening offerrous binder jet 3d printed components through bronze infiltration,” AdditiveManufacturing, vol. 15, pp. 87–92, 2017.

[48] M. A. Almomani, A. M. Shatnawi, and M. K. Alrashdan, “Effect of sinteringtime on the density, porosity content and microstructure of copper-1 wt.carbidecomposites,” Advanced Materials Research, vol. 1064, pp. 32–33, 2014.

[49] R. Ivanus, “Copper-based sintered autolubricant bearings from industrialwastes,” Metalurgia, vol. 52.6, pp. 18–32, 2000, June.

[50] F. Keraghel, k. Loucif, and M. P. Delplancke, “Study of bronze porous alloycu-sn worked out by metallugy of the powders,” Physics Procedia, vol. 21, pp.152–158, 2011.

[51] E. Peissker, “Pressing and sintering characteristics of powder mixtures for sin-tered bronze 90/10 containing different amounts of free tin.” Modern develop-ments in powder metallurgy., pp. 597–615, 1974.

[52] T. N. Vorobyova, O. N. Vrublevskaya, M. G. Galuza, and V. P. Glibin, “Chemicalsynthesis of cusn powder by tin cementation with copper in aqueous solution,”Surfaces and Interfaces, vol. 4, pp. 9–17, 2016.

[53] O. Yeheskel, M. Pinkas, and M. P. Dariel, “Evolution of the elastic moduli atthe early stage of copper sintering,” Materials Letters, vol. 57, no. 28, p. 4418,2003.

[54] K. Morgan, “B598-09: Standard practice for determining offset yield strength intension for copper alloys,” ASTM International, pp. 3–5, 2016.

[55] K. Morgan, “E8-16a: Standard test methods for tension testing of metallic ma-terials,” ASTM International, pp. 1–8, 2016.

[56] K. Morgan, “B598-09: Standard practice for determining offset yield strength intension for copper alloys,” ASTM International, pp. 1–3, 2014.

[57] A. Nohara, N. Yonezawa, and T. Imura, “Stress-extension behavior of copper-tin alloy whiskers,” Japanese Journal of Applied Physics, vol. 21, no. 1R, p. 194,1982.

67

[58] K. Morgan, “E18-12: Standard test methods for rockwell hardness of metallicmaterials,” ASTM International, pp. 1–4, 2012.

[59] R. Lensing, P. Mayr, and E. Macherauch, “Influence of frequency on cyclic work-hardening behavior of copper and alpha-copper-tin polycrystals,” Zeitschrift FurMetallkunde, vol. 69, no. 6, pp. 394–400, 1978.

[60] R. Lensing, P. Mayr, and E. Macherauch, “Effect of experimental frequencyon the cyclic work hardening behavior of pure copper and alpha copper tinpolycrystals,” ChemInform, vol. 9, no. 40, pp. 1–2, 1978.

[61] H. E. Boyer, “Heat treating of nonferrous alloys,” Metallography, Microstructure,and Analysis, vol. 2, no. 3, pp. 190–195, 2013.

[62] K. Cetinkaya, “A study of the microscopic deformation behavior of an phosphorbronze plate during arbitrary holes piercing process,” Materials & design, vol. 28,no. 1, pp. 294–300, 2007.

[63] A. Tuthill, “Guidelines for the use of copper alloys in seawater,” NiDI Publica-tion, vol. 12003, pp. 1–2, 1988.

PUBLICATIONS

PUBLICATIONS

1. M. Golub, “Eegrc poster: experimental design and measurement of internal and

external flow convection coefficient using 3D printed geometries,” in ASEE Annual

Conference & Exposition, pp. 27696, 2017.

2. M. Golub, and J. Zhang, “Current challenges and outlook of electric snowmobile

technology –lessons from clean snowmobile challenge,” in EVS 29: 29th International

Electric Vehicle Symposium, pp. 2427–2431, 2016.

3. M. Golub and J. Zhang, “Designing a low-cost, light-weight electric snowmo-

bile,” IUPUI Research Day, Indianapolis, IN, April 8, 2016.

4. M. Golub, and J. Zhang, “The effects of using 3D printed samples for Tensile

Lab experiments,” IUPUI Research Day, Indianapolis, IN, April 10, 2017.

5. M. Golub, and J. M. Derrick, “Using 3D printed experimental design and

measurement of internal and external flow convection coefficient using 3d printed

geometries,” in ASEE Annual Conference & Exposition, pp. 27716, 2017.

6. D. Michalaka, and M. Golub, “Effective building and development of student

teamwork using personality types in engineering courses,” in ASEE Annual Confer-

ence & Exposition, pp. 26902, 2016.

7. J. Zhang, Y. Zhang, H. Zhang, and M. Golub, “Comparative study of mechan-

ical properties of 3D printed plastic components,” Materials Science and Technology

2016 (MS&T16), Salt Lake City, UT, USA, October 23–27, 2016.

8. L. Cai, H. Zhang, P. Byrd, K. Schlarman, Y. Zhang, M. Golub, and J. Zhang,

“Effect of printing orientation on strength of 3d printed abs plastics,” in TMS: 145

Annual Meeting and Exhibition: Supplemental Proceedings,” pp. 199–204, John

Wiley and Sons, Inc., 2016.

68

9. J. Derrick, A. Mattingly, A. Alhareth, Z. Bingcheng, H. Nawaz, E. Steven-

son, M. Faruqui, L. Meng, D. Balaji, B. Gandhi, M. Golub, J. Ortiz, T. Meyer, J.

Frankum, J. Saini, and B. McGuire, “A Quality Function Deployment (QFD) for

Electric Snowmobile–Phase 1,” CSC Tech Paper (Indianapolis), 2016.

10. D. Torres, N. Hunter, M. Alsigoor, A. Alqahtani, A. Almakhlafi, M. Abusaq,

A. Alnemer, M. Golub, J. Dusza, N. Mathias, and J. Reasoner, “Zero emission electric

snowmobile design summary,” Clean Snowmobile Challenge Tech Paper (Indianapo-

lis), 2017.

11. J. Manis, S. Horan, A. Rajbhandari, H. Tecle, M. Golub, T. Thorat, Y. Ding,

J. Zhou, and F. Alkoize, “Design of diesel snowmobile with pressure wave supercharger

phase 1,” Clean Snowmobile Challenge Tech Paper (Indianapolis), 2017.

12. F. S. Baharuddin, G. Chen, Y.-R. Chen, B. V. Gandhi, G. O. Wible, Z. W.

Yong, A. S. Mohammed, J. Zhang, Y. Zhang, and M. Golub, “Designing a low-cost,

light-weight electric snowmobile,” IUPUI Research Day, Indianapolis, IN, April 17,

2015.

69


Recommended