Page 1
Characterization of the interactions of the Streptococcus
pneumoniae toxin,
Pneumolysin, with soluble molecules of the immune system
Thesis submitted for the degree of
Doctor of Philosophy
At the University of Leicester
By
Bayan Hama Amin Faraj
Department of Infection, Immunity and Inflammation
University of Leicester
November 2017
Page 2
I
Statement of originality
This accompanying thesis submitted for the degree of PhD entitled “Characterization of
the interactions of the Streptococcus pneumoniae toxin, Pneumolysin, with soluble
molecules of the immune system” is based on work conducted by the author in the
Department of Infection, Immunity and Inflammation of the University of Leicester
during the period between September 2013 and September 2017.
All the work recorded in this thesis is original unless otherwise acknowledged in the text
or by references.
None of this work has been submitted for another degree in this or any other University.
Signed………………… Date……………………
Page 3
II
Characterization of the interactions of the Streptococcus pneumoniae toxin,
Pneumolysin, with soluble molecules of the immune system
Bayan Hama Amin Faraj
Abstract
Pneumolysin (Ply) is a key virulence factor of the bacterium Streptococcus pneumoniae
(Pneumococcus). Major functions include forming pores in mammalian cell membranes
and activating the complement cascade to divert the host’s immune system. The aim of
this thesis was to investigate these processes at the molecular level to understand how Ply
facilitates disease by the pneumococcus.
Previous studies have suggested that Ply interacts with various soluble molecules of
the immune system, including L-ficolin and IgG. These interactions activate complement
via the lectin and classical pathways, respectively. In this thesis I have demonstrated that
Ply does not interact with either native serum L-ficolin or recombinant human L-ficolin
produced in Chinese hamster ovary cells. The previous erroneous report probably arose
as a result of contamination of Ply preparations with L-ficolin ligands. Investigation of
binding between Ply and IgG showed that Ply binds to IgG2, IgG3 and IgG4 but not to
IgG1. Binding is mediated through interactions between domains 1-3 of Ply and the Fab
region of the IgGs.
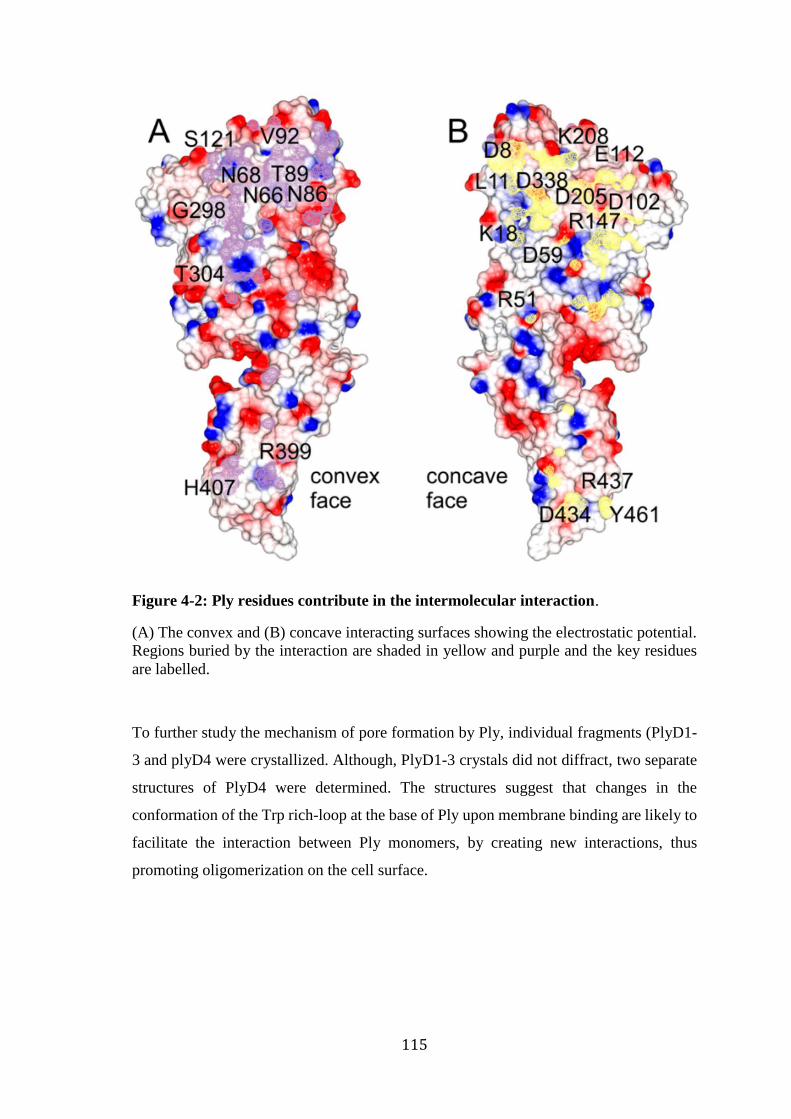
An additional aim of this thesis was to investigate pore formation by Ply. The crystal
structure of Ply, determined in our group, showed that Ply monomers in the crystal pack
together similar to the way in which they are likely to assemble on the cell surface prior
to pore formation. Based on the structure, a series of mutations were created to disrupt
packing between Ply monomers during pre-pore and pore formation. The activities
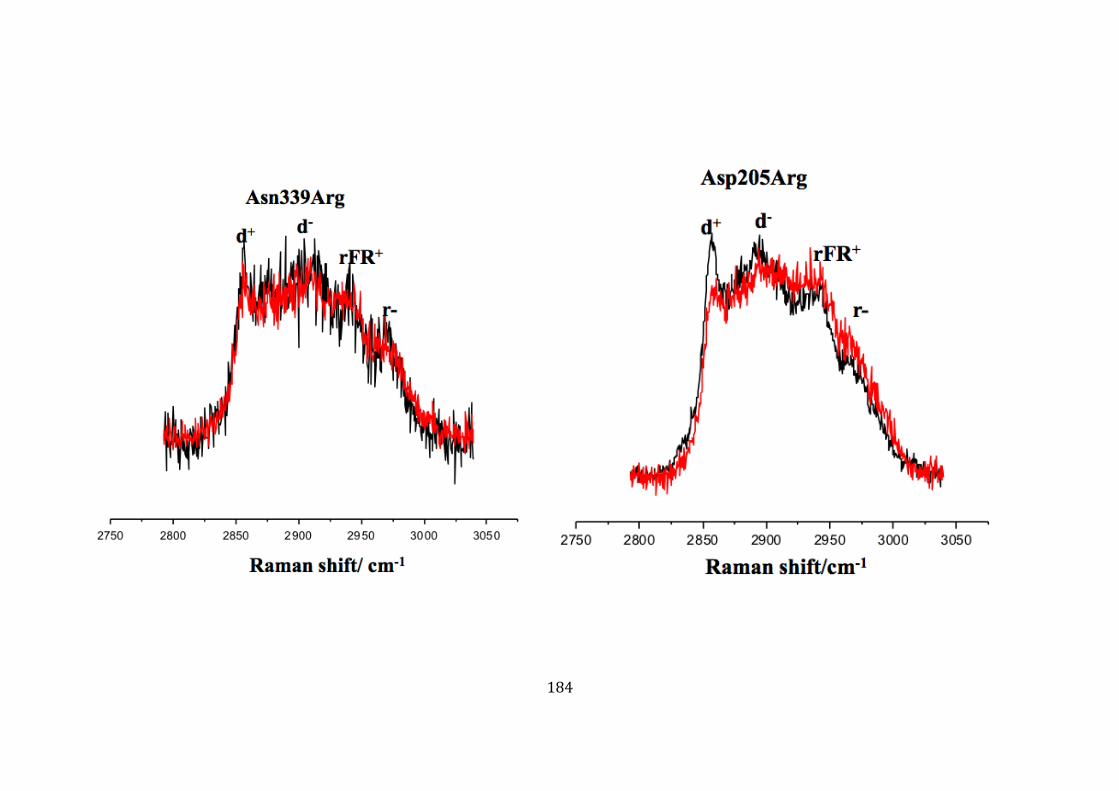
of two of the mutants, Asp205Arg and Asn339Arg were completely abolished and most
of the mutants had greatly reduced activities compared to wild-type Ply indicating that
these residues play important roles during pore formation. Interestingly, electron
microscopy showed that Ply Asp205Arg forms chain like structures on membranes but
cannot form circular pores or arcs. Thus although monomers still self-associated they
could not kill cells. By contrast, Ply Asn339Arg, binds to the membrane but does not
oligomerize.
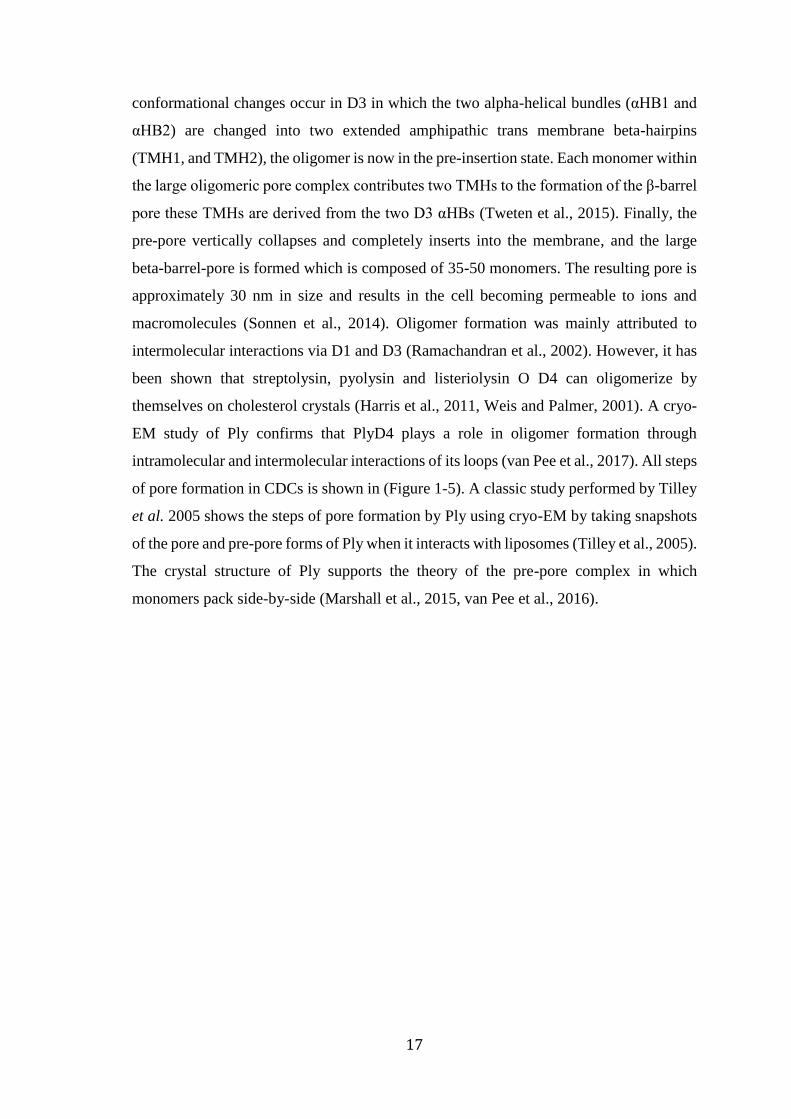
In further work, crystal structures of the membrane-binding domain of Ply revealed
conformational changes in a Trp rich-loop at the base of the toxin involved in
membrane binding. These changes promote new packing interactions between Ply
monomer thereby promoting oligomerization on the membrane.
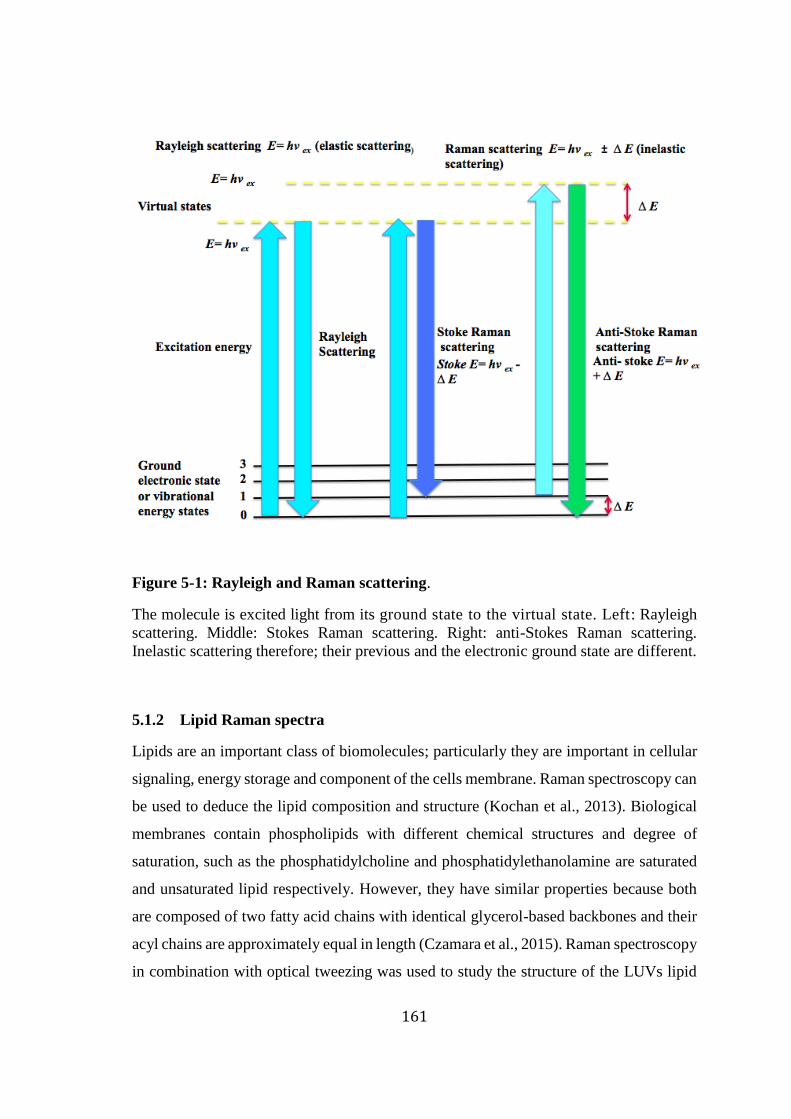
Finally, I investigated the structural changes of the membrane by spectroscopic
monitoring of optically trapped vesicles. The inelastic back-scattered light was monitored
from a single liposome, held by optical tweezers and exposed to Ply. Ply binding
increased the membrane fluidity due to a decrease in the short-range order of the lipid
molecules in the bilayer. Analysis of a series of point mutants suggests that these changes
are caused by association of Ply monomers during formation of the pre-pore, prior to
insertion across the membrane.
Page 4
III
Acknowledgements
First and foremost, I would like to thank God for giving me the opportunity to write this
thesis without him, I can do nothing.
I would like to express my sincere gratitude to my both supervisors Prof. Russell Wallis
and Prof. Peter Andrew for their continuous support of my PhD study, for their patience,
motivation, and immense knowledge. Their guidance helped me in all the time.
My special thanks to
Dr. Umakhanth Venkatraman Girija, Dr. Christopher Michael Furze, Dr. Jamie Elton
Marshall and Dr. Farah Badakshi for their help and support in the 218 laboratory. Dr.
Andrew Hudson for providing the Raman Spectroscopy facilities in his lab in Chemistry
Department at Leicester University.
Many thanks go to my cousin Dr. Chro Kamil Abdurrahman for her always support, with
all my appreciation, I am grateful to Miss Natalie Susan Allcock, core of biotechnology
services of Electron Microscopy Facility at Leicester University.
I would like to acknowledge and thank KRG-HCDP scholarship program human
capacity development in Kurdistan for funding my scholarship.
A special word of thanks also goes to my family and specifically to my mum for her
continuous support and encouragement.
Last but not least, I would like to thank all my siblings; I have been extremely fortunate
in my life to have all of you who they showed me unconditional love and support.
Page 5
IV
Publication arising from this thesis
1- MARSHALL, J. E., FARAJ, B. H., GINGRAS, A. R., LONNEN, R., SHEIKH,
M. A., EL-MEZGUELDI, M., MOODY, P. C., ANDREW, P. W. & WALLIS, R.
2015. The Crystal Structure of Pneumolysin at 2.0 A Resolution Reveals the
Molecular Packing of the Pre-pore Complex. Sci Rep, 5, 13293.
2- COLLARD, L., PEREZ-GUAITA, D., FARAJ, B. H. A., WOOD, B. R.,
WALLIS, R., ANDREW, P. W. & HUDSON, A. J. 2017. Light Scattering By
Optically-Trapped Vesicles Affords Unprecedented Temporal Resolution Of
Lipid-Raft Dynamics. Sci Rep, 7, 8589.
Page 6
V
Table of contents
Abstract .................................................................................................................................................. II
Acknowledgements ............................................................................................................................ III
Table of contents .............................................................................................................................. V
List of figures ..................................................................................................................................... IX
List of tables ....................................................................................................................................... XII
List of abbreviations ...................................................................................................................... XIII
Chapter 1 General introduction ....................................................................................... 1 1.1 Pneumococcus .............................................................................................................................. 1 1.2 Pneumococcal epidemiology .................................................................................................. 1 1.3 Pneumococcal diseases ............................................................................................................. 3
1.3.1 Otitis media (OM) .......................................................................................................... 4 1.3.2 Sinusitis and bronchitis ............................................................................................... 4 1.3.3 Pneumonia and septicaemia ..................................................................................... 4 1.3.4 Pneumococcal meningitis ........................................................................................... 5
1.4 Pneumococcus virulence factors ........................................................................................... 5 1.4.1 The Capsule ...................................................................................................................... 6 1.4.2 The cell wall ..................................................................................................................... 7 1.4.3 Autolysin A (LytA) ......................................................................................................... 7 1.4.4 Neuraminidases or sialidases ................................................................................... 7 1.4.5 Hyaluronidase (Hyl) ..................................................................................................... 8 1.4.6 Immunoglobulin A1 protease (IgA1) ..................................................................... 8 1.4.7 Pneumococcal iron acquisition and uptake transporters ............................. 8 1.4.8 Pneumococcal surface protein A (PspA) .............................................................. 9 1.4.9 Pneumococcal surface protein C (PspC) .............................................................. 9 1.4.10 Pneumococcal adhesion and virulence A (PavA) and enolase (Eno) ....... 9 1.4.11 Sortases ........................................................................................................................... 10
1.5 Vaccines against the pneumococcus .................................................................................. 10 1.6 Treatment of the pneumococcus infections ................................................................... 12 1.7 Ply ..................................................................................................................................................... 13 1.8 Overview mechanism of pore formation ......................................................................... 15 1.9 Role of Ply in pathogenesis .................................................................................................... 18 1.10 The mammalian immune system ........................................................................................ 19
1.10.1 Complement system .................................................................................................. 20 1.10.1.1 Classical pathway (CP) .............................................................................................................. 22 1.10.1.2 Lectin pathway (LP) ................................................................................................................... 23 1.10.1.3 Alternative pathway (AP) ........................................................................................................ 25 1.10.1.4 Terminal pathway (TP) ............................................................................................................ 25
1.11 Ficolins ........................................................................................................................................... 25 1.11.1 Human M-ficolin .......................................................................................................... 26 1.11.2 Human H-ficolin .......................................................................................................... 26 1.11.3 Human L-ficolin ........................................................................................................... 26
1.12 Mouse ficolins .............................................................................................................................. 28 1.12.1 Ficolin-A .......................................................................................................................... 28 1.12.2 Ficolin-B .......................................................................................................................... 28
1.13 Genetics of ficolins ..................................................................................................................... 29 1.13.1 Structure of ficolins .................................................................................................... 31
1.14 Ficolins and disease .................................................................................................................. 31 1.15 Humoral immunity .................................................................................................................... 32
1.15.1 Antibody structure ..................................................................................................... 33
Page 7
VI
1.15.2 Ig isotypes ...................................................................................................................... 34 1.15.2.1 Immunoglobulin G (IgG)........................................................................................................... 34 1.15.2.1.1 IgG1 ............................................................................................................................................... 35 1.15.2.1.2 IgG2 ............................................................................................................................................... 35 1.15.2.1.3 IgG3 ............................................................................................................................................... 36 1.15.2.1.4 IgG4 ............................................................................................................................................... 36 1.15.2.2 Immunoglobulin A (IgA) .......................................................................................................... 37 1.15.2.3 Immunoglobulin E (IgE) ........................................................................................................... 38 1.15.2.4 Immunoglobulin D (IgD) .......................................................................................................... 38 1.15.2.5 Immunoglobulin M (IgM)......................................................................................................... 38
1.16 Biological membrane ............................................................................................................... 39 1.16.1 Structure and biophysical properties of lipid bilayers ................................ 41 1.16.1.1 Lipid molecules ............................................................................................................................ 41 1.16.1.1.1 Phospholipids ........................................................................................................................... 41 1.16.1.1.2 Cholesterol ................................................................................................................................. 41 1.16.1.2 Liposomes as the membrane model ................................................................................... 42 1.16.2 Bilayer melting temperatures (Tm) .................................................................... 44
1.17 Physical states of lipid bilayer .............................................................................................. 45 1.18 General aims of the thesis ...................................................................................................... 46
Chapter 2 Production and purification of Ply and Ply domains ....................... 47 2.1 Objectives ...................................................................................................................................... 47 2.2 Materials and methods ............................................................................................................ 47
2.2.1 Materials ......................................................................................................................... 47 2.2.2 Electrophoresis ............................................................................................................ 47 2.2.3 Competent cells and transformation .................................................................. 48 2.2.4 Competent cell preparation by the rubidium chloride method .............. 48 2.2.5 Sodium dodecyl-polyacrylamide gel electrophoresis (SDS-PAGE) ........ 48 2.2.6 Expression and purification of full-length Ply ................................................ 49 2.2.7 Cloning and amplification of PlyD1-3 by PCR ................................................. 52 2.2.8 Small scale expression of PlyD1-3 ....................................................................... 53 2.2.9 Large scale protein expression ............................................................................. 54 2.2.10 Inclusion body preparation .................................................................................... 54 2.2.11 Inclusion body solubilisation ................................................................................. 54 2.2.12 Small scale refolding test ......................................................................................... 54 2.2.13 Large scale refolding of PlyD1-3 ........................................................................... 55 2.2.14 Cloning, expression and purification of PlyD4 ............................................... 55 2.2.15 Expression and purification of PlyD4 ................................................................. 57
2.3 Results ............................................................................................................................................ 57 2.3.1 Expression and purification of full-length Ply ................................................ 57 2.3.2 Cloning, expression and purification of PlyD1-3 ........................................... 60 2.3.3 Cloning, expression and purification of PlyD4 ............................................... 66
2.4 Discussion ..................................................................................................................................... 69
Chapter 3 Interaction of Ply with human L-ficolin and IgG isotypes ............. 71 3.1 Introduction ................................................................................................................................. 71 3.2 Objectives ...................................................................................................................................... 72 3.3 Materials and methods ............................................................................................................ 72
3.3.1 Materials ......................................................................................................................... 72 3.3.2 PCR amplification of the L- ficolin cDNA ........................................................... 73 3.3.3 Cloning of full-length L-ficolin into pGEM-T easy vector ........................... 73 3.3.4 Cloning of full-length L-ficolin into pED4 ......................................................... 74 3.3.5 Expression vector pED4 ........................................................................................... 74 3.3.6 Cell culture ..................................................................................................................... 75 3.3.7 DNA precipitation ....................................................................................................... 76 3.3.8 Transfection of mammalian cells by the calcium phosphate method ... 76
Page 8
VII
3.3.9 Expression and purification of full-length L-ficolin ...................................... 76 3.3.10 Cell storage .................................................................................................................... 77 3.3.11 Cloning, expression and purification of the fibrinogen-like domain of L-
ficolin ............................................................................................................................... 78 3.3.11.1 Amplification of the cDNA encoding the fibrinogen-like domain of L-ficolin... 78 3.3.11.2 Expression and purification of the fibrinogen-like domain of L-ficolin .............. 80 3.3.12 ELISA binding between Ply and L-ficolin .......................................................... 80 3.3.13 ELISA binding between Ply and IgG isotypes .................................................. 81 3.3.14 Inhibition assay ........................................................................................................... 81 3.3.15 IgG4 digestion with IdeS enzyme ......................................................................... 81
3.4 Results ............................................................................................................................................ 82 3.5 Cloning, expression and purification of L-ficolin .......................................................... 82
3.5.1 PCR amplification of full-length L-ficolin .......................................................... 82 3.5.2 Production and purification of full-length L-ficolin...................................... 84
3.6 Cloning expression and purification of fibrinogen-like domain of L-ficolin ..... 85 3.6.1 PCR amplification and cloning of fibrinogen-like domain of L-ficolin .. 85 3.6.2 Expression and purification of fibrinogen-like domain of L-ficolin ....... 87 3.6.3 Analysis binding between recombinant Ply and L-ficolin ......................... 90
3.7 ELISA binding between Ply and IgG isotypes ................................................................. 96 3.8 ELISA binding between PlyD1-3 and PlyD4 with IgG isotypes ............................... 98 3.9 ELISA binding between Ply and Ply domains with IgG fragments ..................... 100 3.10 Digestion of IgG4 with IdeS enzyme ............................................................................... 103 3.11 ELISA binding between monoclonal Fab and Fc with the Ply, PlyD1-3 and
PlyD4 106 3.12 ELISA binding between Ply D385N and IgG isotypes .............................................. 108 3.13 Inhibition assay ....................................................................................................................... 109 3.14 Discussion .................................................................................................................................. 111
3.14.1 Binding between Ply and L-ficolin .................................................................... 111 3.14.2 Binding between Ply and IgG isotypes ............................................................ 111
Chapter 4 Inhibition of Ply by disruption of intermolecular packing ......... 113 4.1 Objectives ................................................................................................................................... 113 4.2 Materials and methods ......................................................................................................... 116
4.2.1 Materials ...................................................................................................................... 116 4.2.2 Construction of Ply mutants by SOE-PCR ...................................................... 116 4.2.3 Mutations in the TMH1 and TMH2 region of Ply ........................................ 119 4.2.4 Fluorescence spectroscopy .................................................................................. 119 4.2.5 Stability of mutants ................................................................................................. 120 4.2.6 Preparation of liposomes ..................................................................................... 120 4.2.7 Fluorescence data collection with liposomes .............................................. 120 4.2.8 Haemolytic assay ..................................................................................................... 121 4.2.9 Transmission electron microscopy (TEM) .................................................... 121 4.2.10 Preparation of liposomes with calcein ............................................................ 121 4.2.11 Calcein-leakage assay ............................................................................................. 122 4.2.12 PlyD1-3 crystallization and optimization ...................................................... 122 4.2.13 PlyD4 crystallization with sLeX ......................................................................... 122 4.2.14 X-ray diffraction of PlyD1-3 and PlyD4 crystals ......................................... 123 4.2.15 Crystallization theory ............................................................................................. 124 4.2.16 X-ray diffraction ....................................................................................................... 125
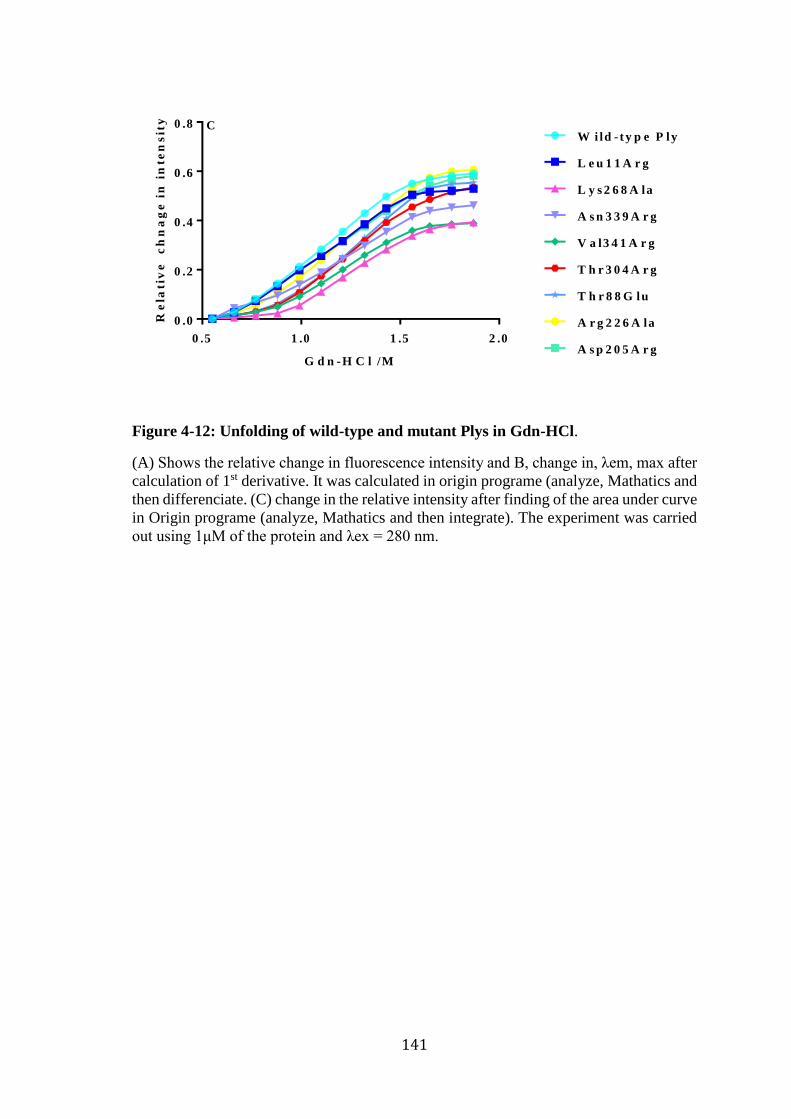
4.3 Results ......................................................................................................................................... 127 4.3.1 SOE-PCR construction of single mutant Ply .................................................. 127 4.3.2 Mutations inTMH1 and TMH2 region of Ply ................................................. 129 4.3.3 Cytolytic activities of Ply mutants ..................................................................... 130 4.3.4 Stability measurement of mutants by Gdn-HCl denaturation ............... 133
Page 9
VIII
4.3.5 Liposome binding .................................................................................................... 142 4.3.6 Calcein leakage from liposomes in the presence of Ply ........................... 148 4.3.7 Pore formation of Ply on Chol-containing liposomes by EM ................. 151 4.3.8 Crystallization of PlyD1-3 and D4 ..................................................................... 154 4.3.9 Discussion ................................................................................................................... 158
Chapter 5 The conversion of monomers of Ply to pre-pore complexes promotes microdomain formation in lipid bilayers ......................................................... 160
5.1 Raman spectroscopic analysis of lipid bilayers .......................................................... 160 5.1.1 Raman spectroscopy .............................................................................................. 160 5.1.2 Lipid Raman spectra ............................................................................................... 161 5.1.3 Optical tweezers (OT) ............................................................................................ 163 5.1.4 Microfluidic device .................................................................................................. 165
5.2 Objectives ................................................................................................................................... 166 5.3 Materials and methods ......................................................................................................... 166
5.3.1 Materials ...................................................................................................................... 166 5.4 Preparation of lipid vesicles (Liposomes) .................................................................... 166 5.5 Microfluidic laminar flow cell ............................................................................................ 167 5.6 Raman tweezers of a single liposome with the wild-type Ply and Ply mutants
........................................................................................................................................................ 169 5.7 Raman measurement and data collection .................................................................... 170 5.8 The OT setup ............................................................................................................................. 171 5.9 Raman data normalization .................................................................................................. 172 5.10 Results ......................................................................................................................................... 173
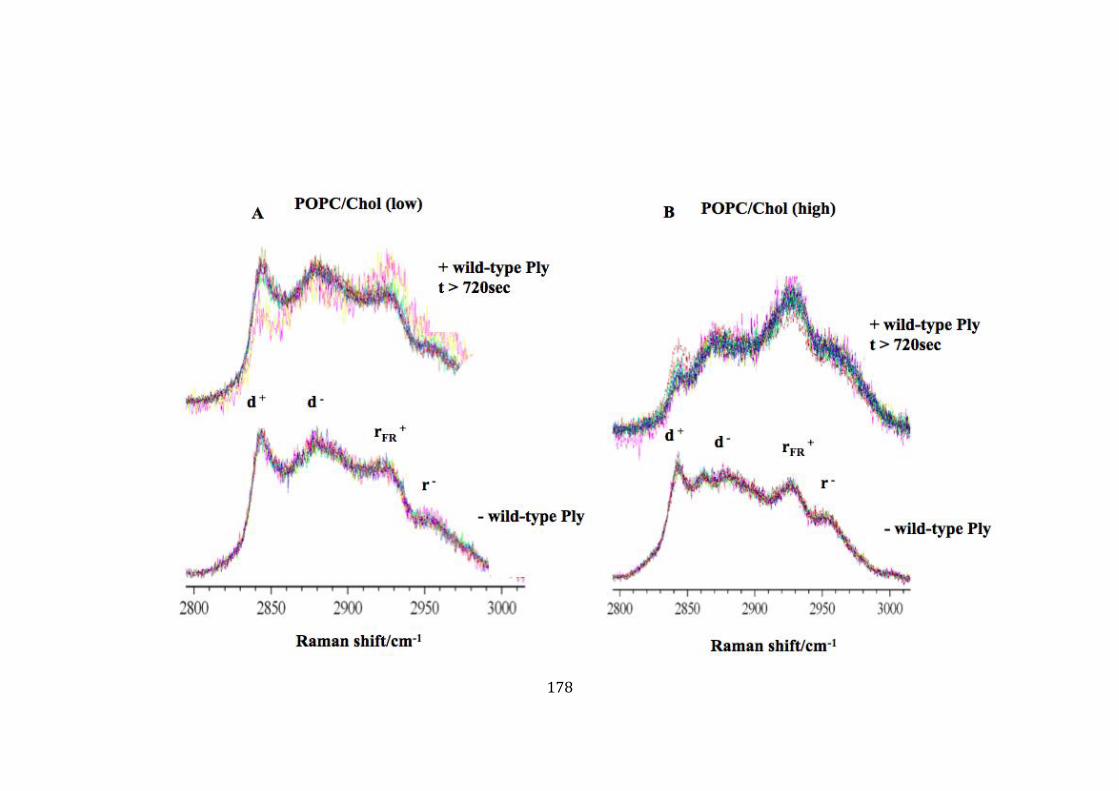
5.10.1 Lipid vibrational spectroscopy........................................................................... 173 5.10.2 Observing structural changes in a single liposome by wild-type Ply . 174 5.10.3 The influence of lipid composition on the changes observed in the
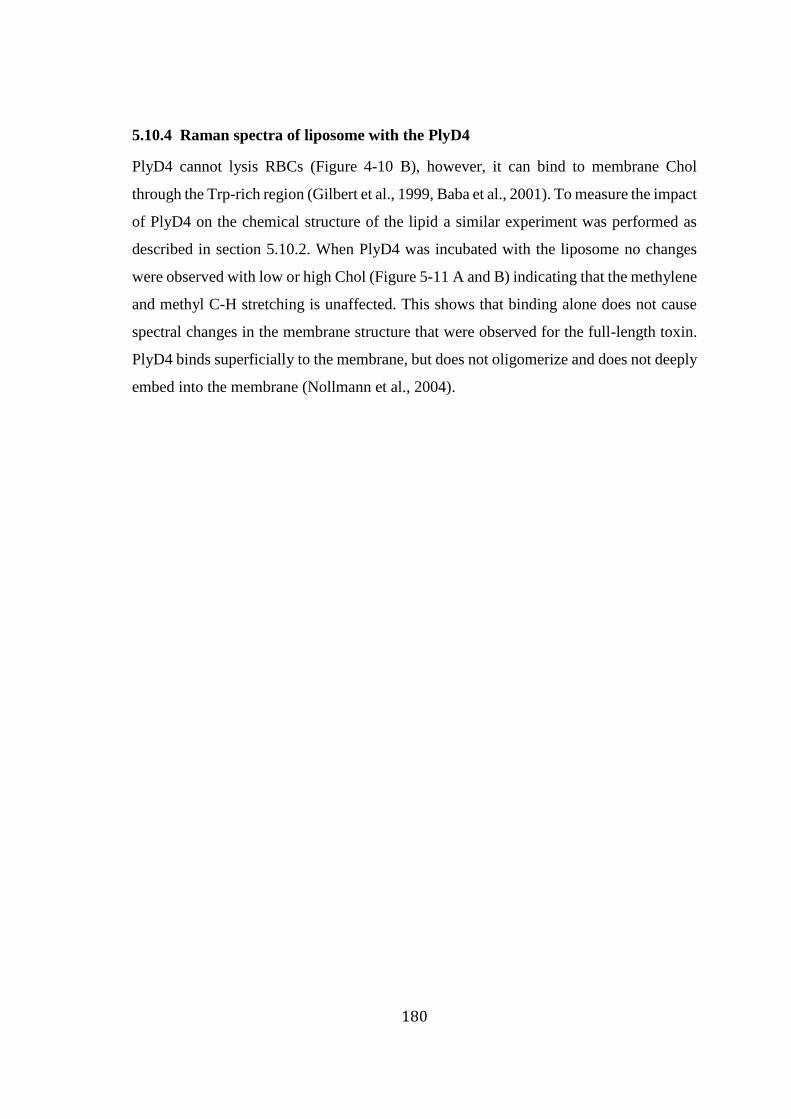
bilayers following the addition of wild-type Ply ......................................... 176 5.10.4 Raman spectra of liposome with the PlyD4 .................................................. 180 5.10.5 Monitoring membrane, structural change of the liposome with Ply
Asp205Arg (D205R) and Asn339Arg (N339R) ........................................... 183 5.10.6 Monitoring membrane, structural change of the liposome with mutant
Ply Thr304Arg, Arg226Ala, Thr88Glu, and Lys268Ala, Val341Arg and Leu11Arg ..................................................................................................................... 185
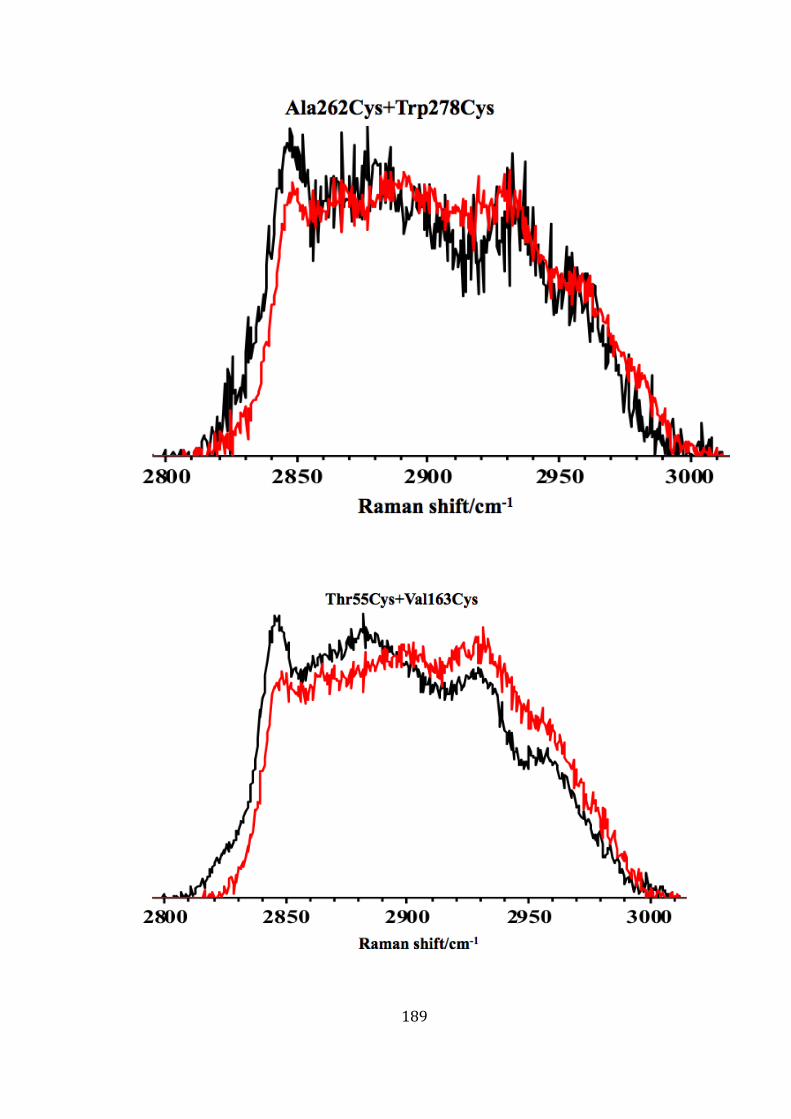
5.10.7 Influence of locked mutant on the chemical structure of the membrane ................................................................................................................... 188
5.10.8 Monitoring change of the lipid layer of a liposome membrane composed of ternary mixture of POPC/Chol /SM (1:1:1) ....................... 190
5.11 Discussion .................................................................................................................................. 191 5.12 General discussion ................................................................................................................. 193
5.12.1 ELISA binding between Ply and human L-ficolin ....................................... 193 5.12.2 ELISA binding between Ply and IgG isotypes ............................................... 193 5.12.3 Ply binds to the Fab region of IgG via domains 1-3 ................................... 193 5.12.4 Structural based mutation in Ply to block pore formation ..................... 194 5.12.5 Raman spectral analysis of Ply on the lipid bilayer membrane ........... 194
5.13 Future work .............................................................................................................................. 195 5.13.1 Mutation in PlyD1-3 residues ............................................................................. 195 5.13.2 Disruption of Ply monomers ............................................................................... 195 5.13.3 Raman spectroscopy and Ply .............................................................................. 195
Appendixes ....................................................................................................................................... 196
References ......................................................................................................................................... 207
Page 10
IX
List of figures
Figure 1-1: Pneumococcal pathogenic routes of infection. .............................................. 3 Figure 1-2: Schematic diagram of the pneumococcus virulence factors. ......................... 6
Figure 1-3: Ply crystal structure. ..................................................................................... 15 Figure 1-4: Two hypothesis models of pore formation by CDCs. .................................. 16 Figure 1-5: Mechanism of pore formation of CDCs family on the lipid bilayer. ........... 18 Figure 1-6: Three pathways of the complement system: Classical, Lectin and
Alternative pathways (CP, LP and AP). ................................................................. 21
Figure 1-7: Schematic representation of human C1q and human IgG showing how C1q
binds to IgG on the pathogen surface. .................................................................... 23
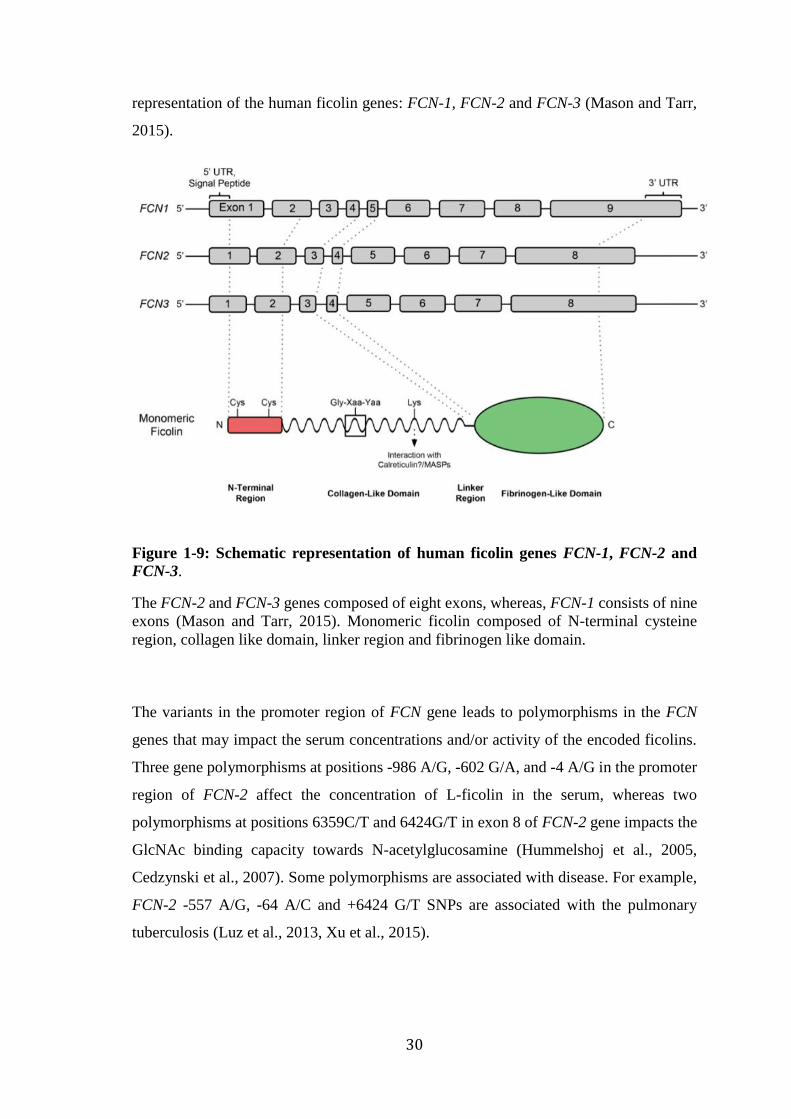
Figure 1-8: Schematic representation of MBL-MASPs binding to a pathogen surface. 24 Figure 1-9: Schematic representation of human ficolin genes FCN-1, FCN-2 and FCN-
3. ............................................................................................................................. 30 Figure 1-10: Schematic diagram of ficolin structure and domain organisation. ............ 31 Figure 1-11: Schematic diagram of Ig structure. ............................................................ 34
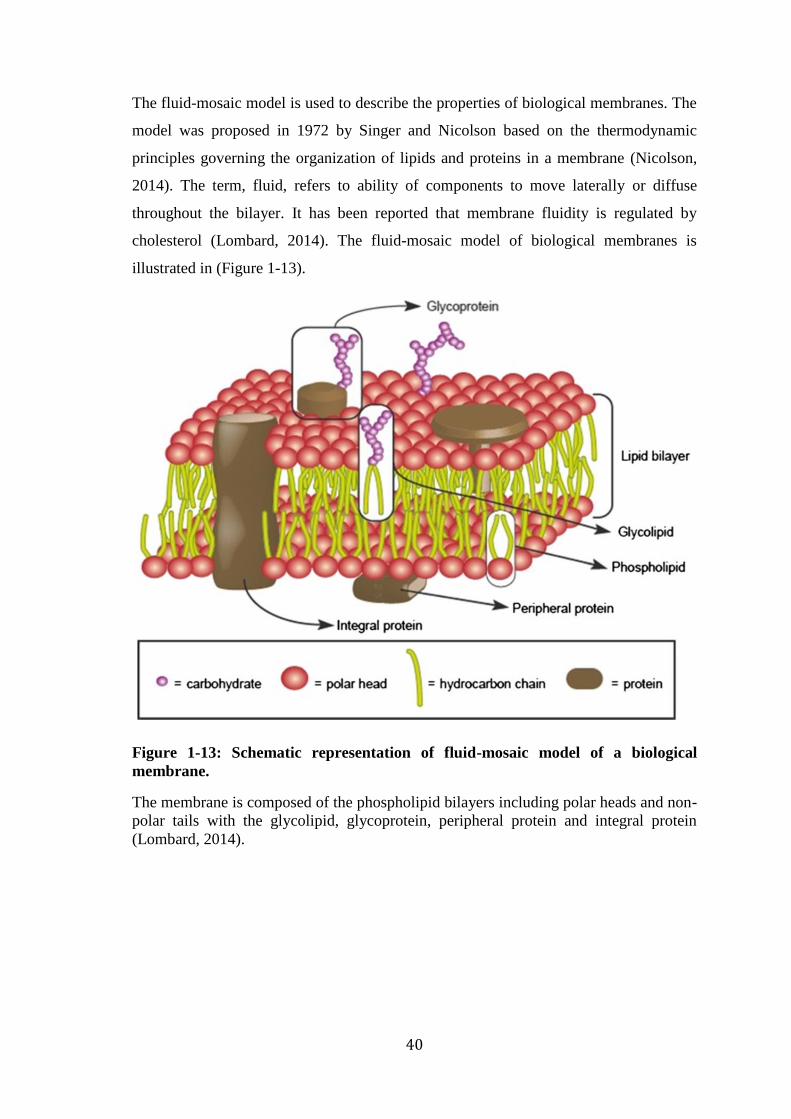
Figure 1-12: Schematic representation of membrane lipid types. .................................. 39 Figure 1-13: Schematic representation of fluid-mosaic model of a biological membrane.
................................................................................................................................ 40 Figure 1-14: Cholestrol chemical structure. ................................................................... 42
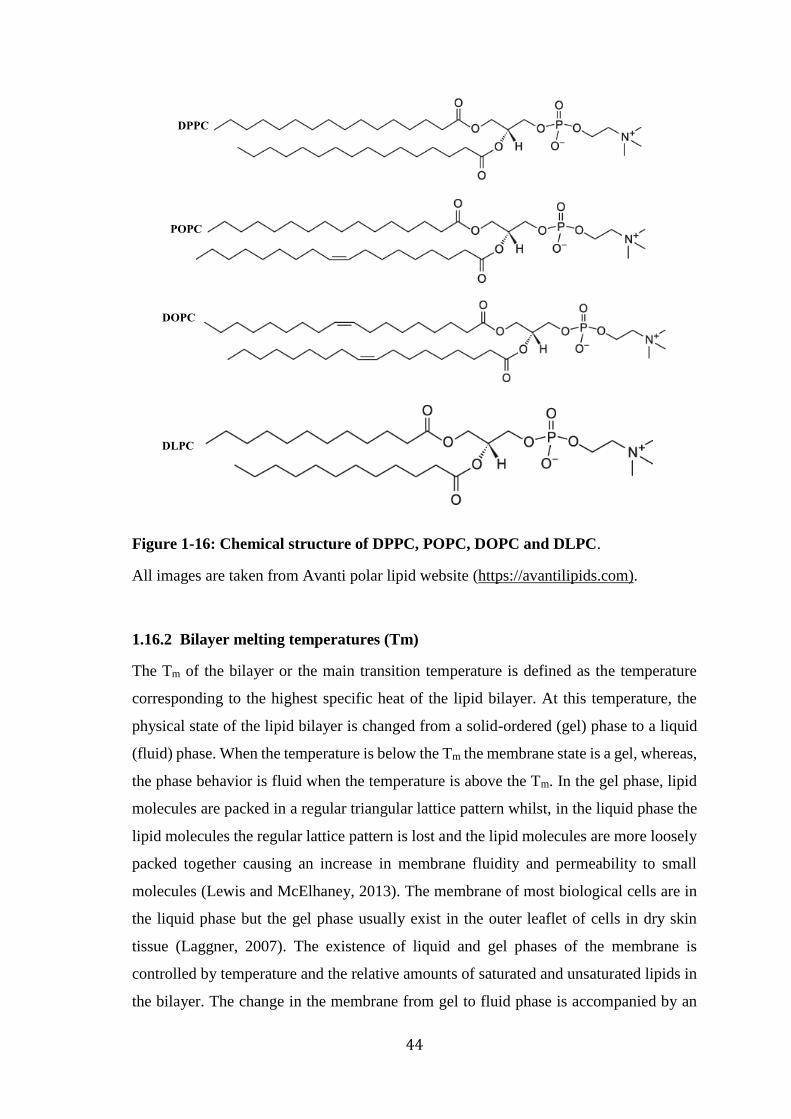
Figure 1-15: Schematic view of a liposome vesicle and a lipid bilayer. ........................ 43 Figure 1-16: Chemical structure of DPPC, POPC, DOPC and DLPC. .......................... 44
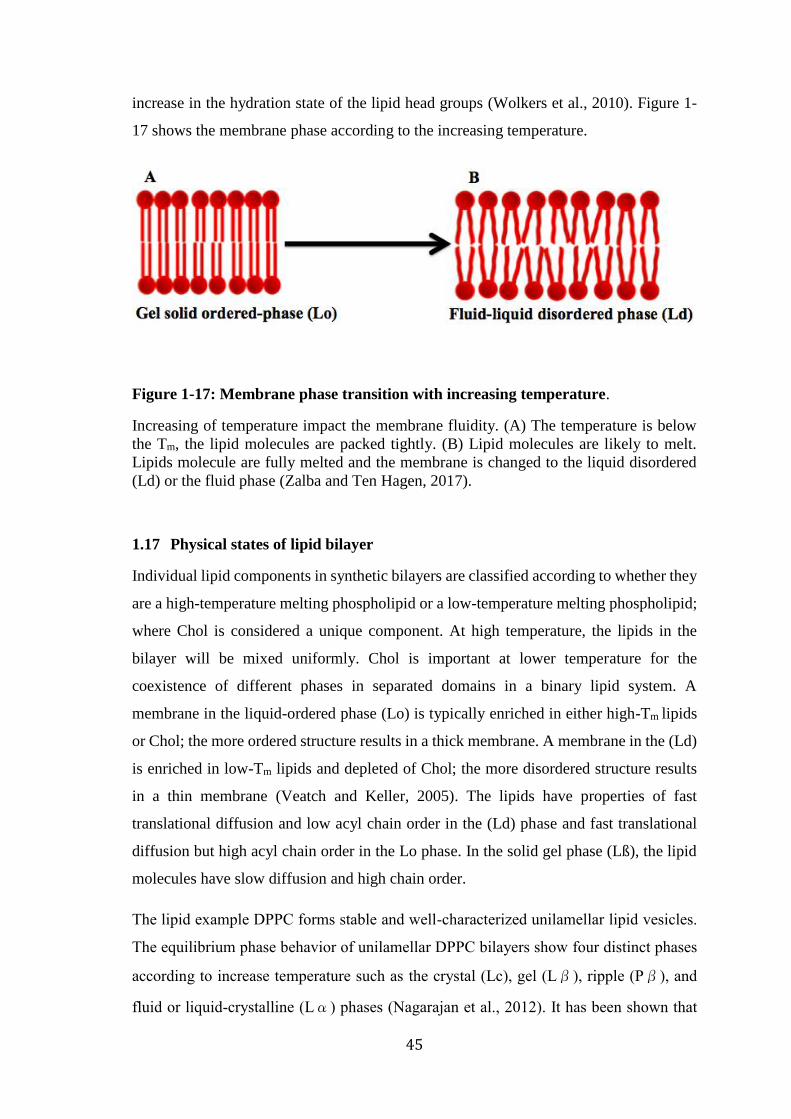
Figure 1-17: Membrane phase transition with increasing temperature. ......................... 45 Figure 2-1: Vector map of pLEICS-07. .......................................................................... 50
Figure 2-2: Ply amino acid residues. .............................................................................. 51 Figure 2-3: Vector map of pLEICS-01. .......................................................................... 53 Figure 2-4: Vector map of pLEICS-10. .......................................................................... 56
Figure 2-5: SDS-PAGE showing Ply purification by affinity chromatography on Ni-
Sepharose column. .................................................................................................. 58
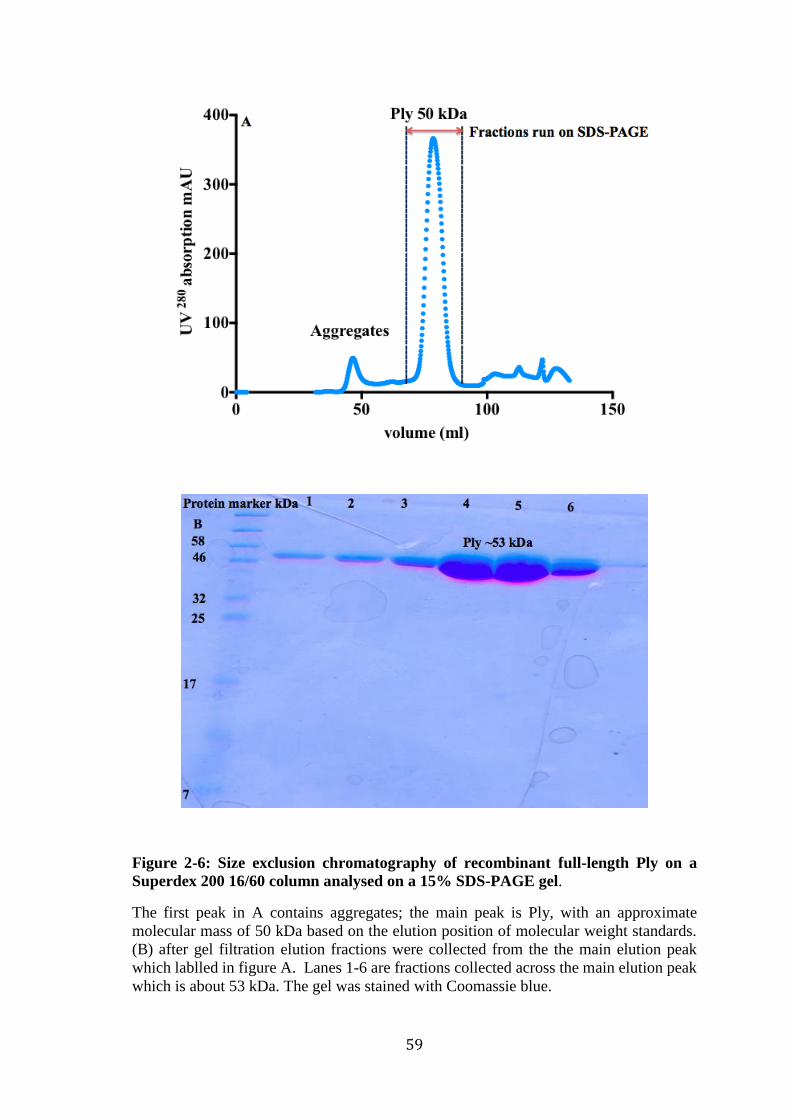
Figure 2-6: Size exclusion chromatography of recombinant full-length Ply on a
Superdex 200 16/60 column analysed on a 15% SDS-PAGE gel. ......................... 59 Figure 2-7: Agarose gel showing PCR of PlyD1-3 DNA fragments. ............................. 60 Figure 2-8: 15% SDS-PAGE of small-scale expression of PlyD1-3 in inclusion body. 61
Figure 2-9: Elution profile of the purified PlyD1-3 on Superdex 200 10/300 after
refolding screens. .................................................................................................... 63
Figure 2-10: Purified refolded recombinant PlyD1-3 after analytical size exclusion
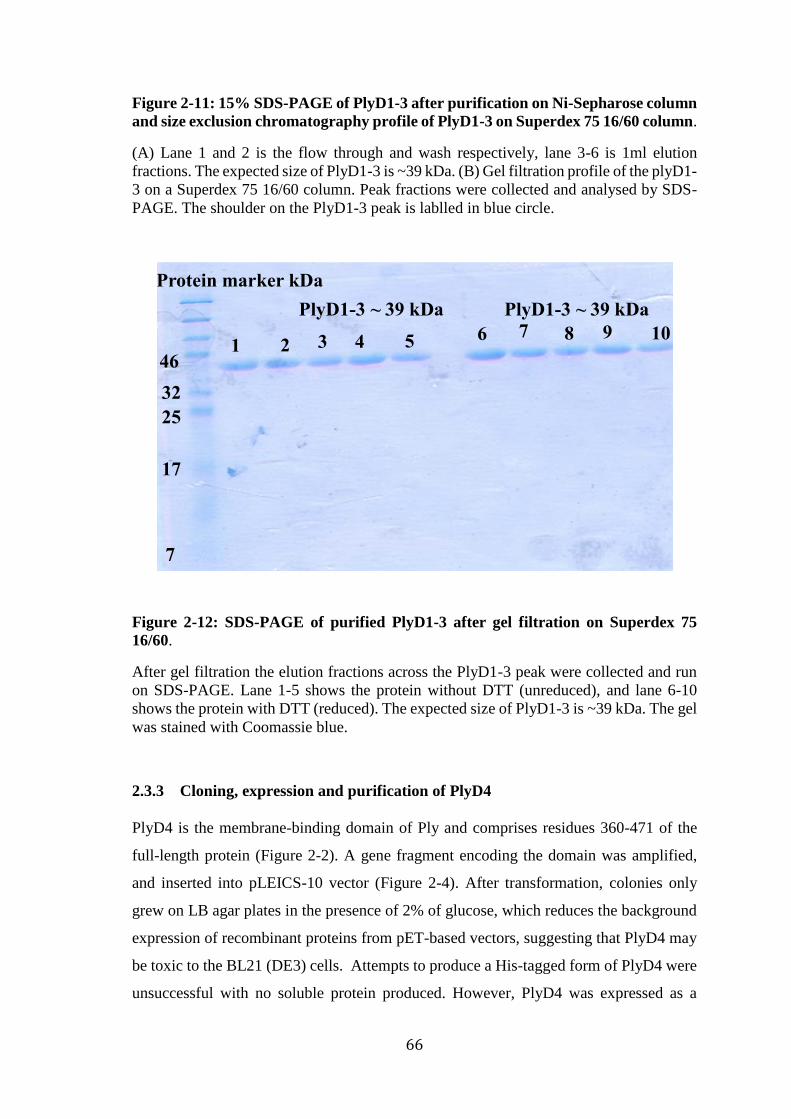
chromatography assessed by SDS-PAGE. .............................................................. 64 Figure 2-11: 15% SDS-PAGE of PlyD1-3 after purification on Ni-Sepharose column
and size exclusion chromatography profile of PlyD1-3 on Superdex 75 16/60
column. ................................................................................................................... 66
Figure 2-12: SDS-PAGE of purified PlyD1-3 after gel filtration on Superdex 75 16/60.
................................................................................................................................ 66 Figure 2-13: 15% SDS-PAGE of purified PlyD4 tagged with MBP after affinity
chromatography on amylose resin column. ............................................................ 67 Figure 2-14: Elution profile of PlyD4 after digestion with TEV protease on a Superdex
75 16/60 gel filtration column. ............................................................................... 68 Figure 2-15: 15% SDS-PAGE of purified PlyD4 after digestion with TEV protease on
Superdex 75 16/60 gel filtration. ............................................................................ 69 Figure 3-1: Map of a pED4 expression vector. ............................................................... 75 Figure 3-2: Amino acids sequence of human L-ficolin. ................................................. 77
Page 11
X
Figure 3-3: Map of the bacterial expression vector pET28 a. ........................................ 79 Figure 3-4: 1% w/v agarose gel electrophoresis showing PCR steps to amplify cDNA
of the L-ficolin. ....................................................................................................... 83 Figure 3-5: A restriction digestion of L-ficolin cDNA in pGEM-T easy (A) and pED4
(B) with Pst1/EcoR1 enzymes. ............................................................................... 84 Figure 3-6: 15% SDS-PAGE gel analysis of recombinant L-ficolin after
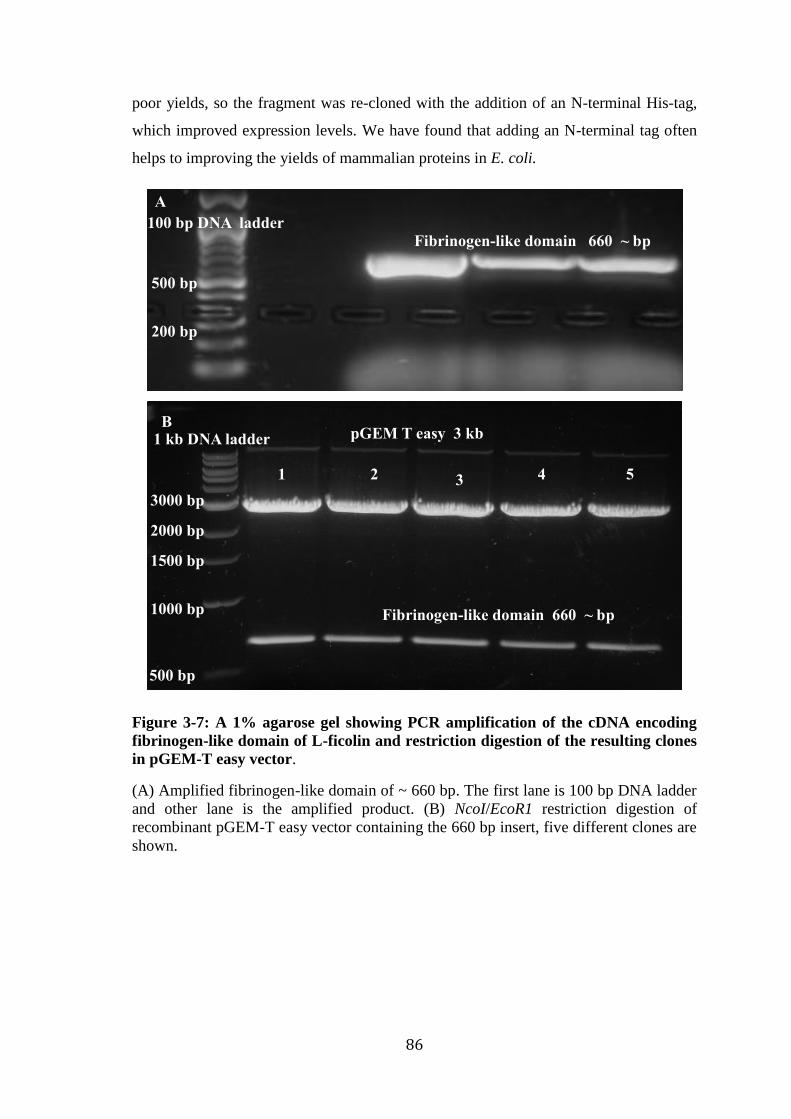
chromatography on a GlcNac-Sepharose column. ................................................. 85 Figure 3-7: A 1% agarose gel showing PCR amplification of the cDNA encoding
fibrinogen-like domain of L-ficolin and restriction digestion of the resulting clones
in pGEM-T easy vector. .......................................................................................... 86 Figure 3-8: A 1% agarose gel of NcoI/EcoR1 restriction digestion of seven
different fibrinogen-like domain clones in pET28a. .......................................... 87 Figure 3-9: SDS-PAGE of the fibrinogen-like domain of L-ficolin. .............................. 88 Figure 3-10: Size exclusion chromatography of recombinant fibrinogen-like domain on
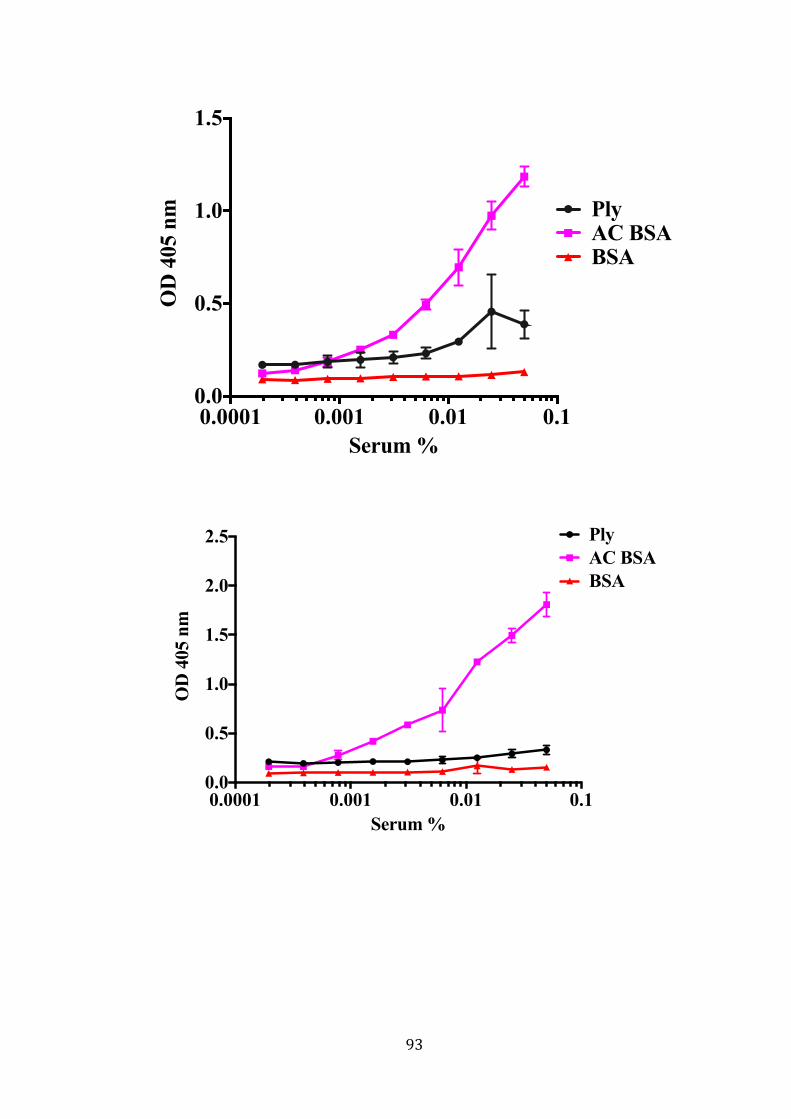
a Superdex 75 16/60 column analysed on a 15% SDS-PAGE gel. ........................ 89 Figure 3-11: No binding between recombinant Ply and purified recombinant L-ficolinby
ELISA. .................................................................................................................... 91 Figure 3-12: L-ficolin binding to recombinant Ply using monoclonal anti L-ficolin
antibody by ELISA. .............................................................................................. 92 Figure 3-13: ELISA binding of Ply with serum L-ficolin. ............................................ 95
Figure 3-14: ELISA binding assay between Ply and IgG isotypes. ................................ 97 Figure 3-15: ELISA binding of Ply domains with IgG isotypes. ................................... 99 Figure 3-16: ELISA binding of Ply and Ply domains with IgG fragments. ................ 102
Figure 3-17: Elution profile of an IgG4 digestion with IdeS enzyme on Superdex 200
16/60. .................................................................................................................... 104 Figure 3-18: Analysis of digested IgG4 on SDS-PAGE............................................... 105 Figure 3-19: ELISA binding of Ply and Ply domains with the monoclonal Fab and Fc
of digested IgG4. ................................................................................................... 107 Figure 3-20: ELISA binding comparison of wild-type Ply and mutant PlyD385N with
IgG isotypes. ......................................................................................................... 108 Figure 3-21: Inhibition of binding of IgG, Fab and Fc to Ply. ..................................... 110 Figure 3-22: Alignment of the IgG CH1 amino acid sequences. .................................. 112
Figure 4-1: Packing of monomers in the Ply crystal reveals the packing of the pre-pore
complex. ................................................................................................................ 113
Figure 4-2: Ply residues contribute in the intermolecular interaction. ......................... 115 Figure 4-3: Vector map of pLEICS-9. .......................................................................... 118
Figure 4-4: Schematic diagram of protein crystallization phase. ................................. 125 Figure 4-5: X-ray diffraction. ....................................................................................... 126 Figure 4-6: The two-dimensional representation of the reflected X-ray from two crystal
planes. ................................................................................................................... 127 Figure 4-7: SOE-PCR to introduce the mutations D205R and K268A into Ply. .......... 128
Figure 4-8: Ply amino acid residues forming TMH1 and TMH2. ................................ 129 Figure 4-9: Result of SOE-PCR showing the construction of the Ply
Thr55Cys+Val163Cys (TMH1) and Ala262Cys+Trp278Cys (TMH2) mutants. 130 Figure 4-10: Haemolytic activities of wild-type Ply, mutants Ply and ply truncated
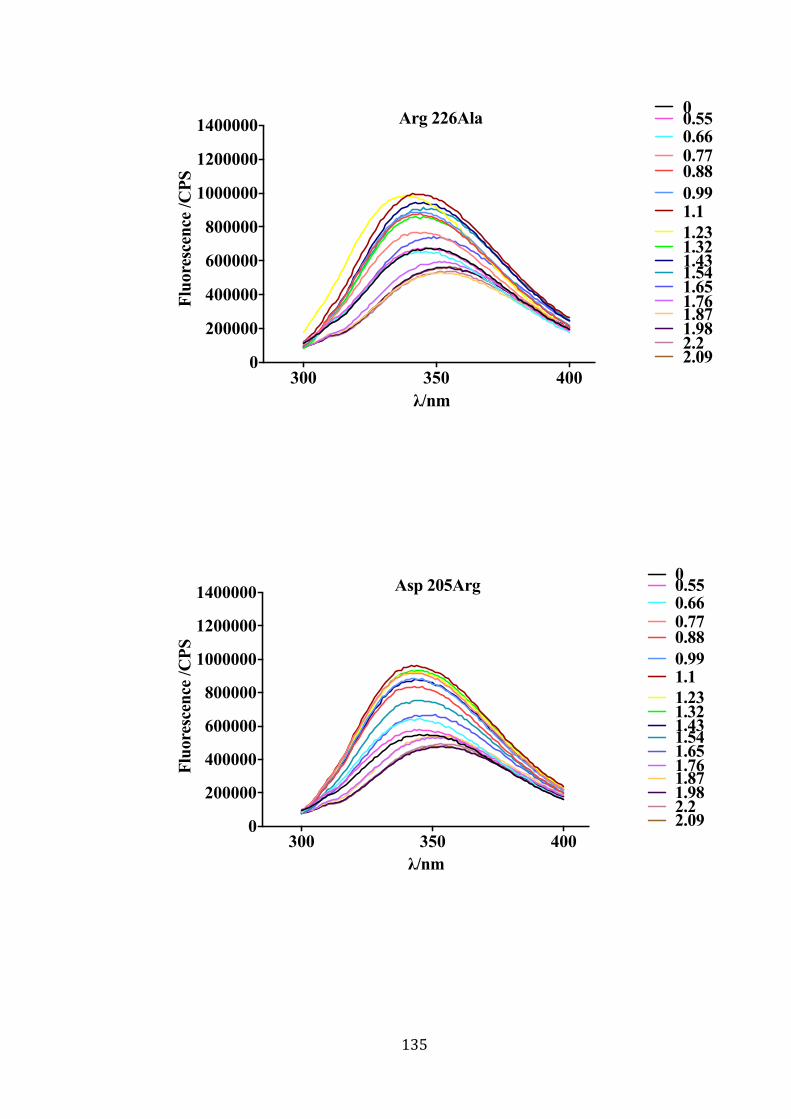
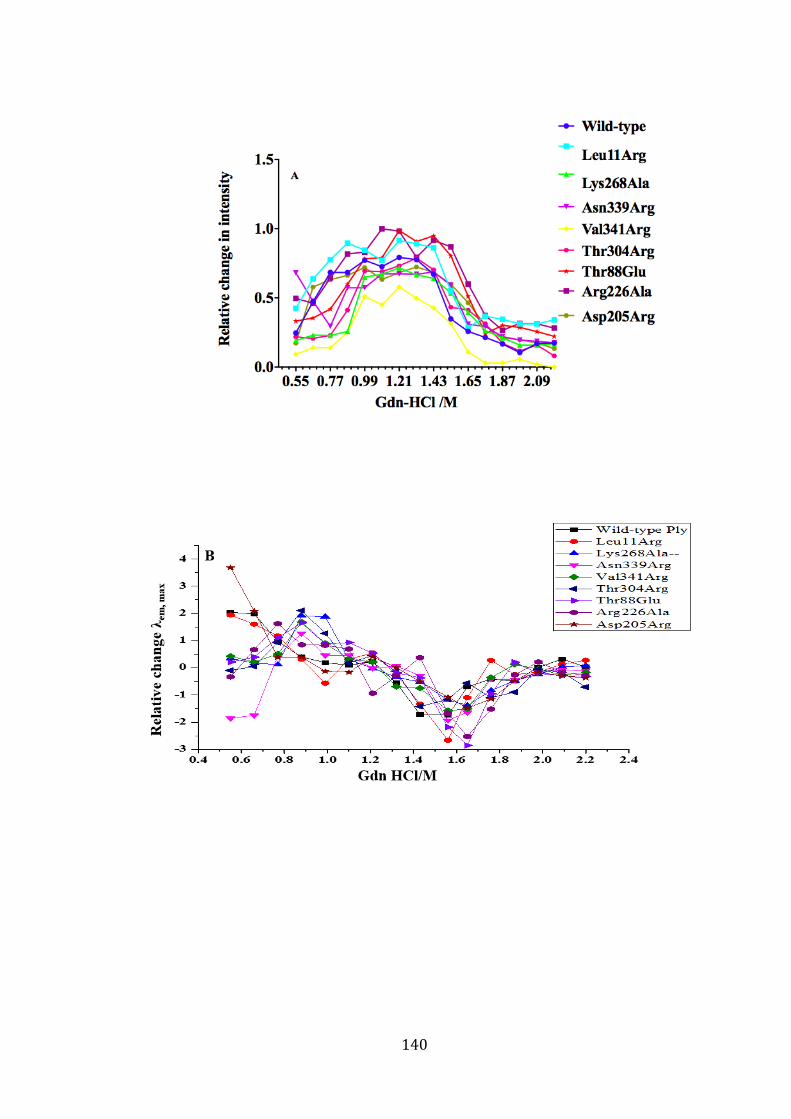
fragments. ............................................................................................................. 132 Figure 4-11: Fluorescence emission spectra of wild-type Ply and mutants in Gdn-HCl.
.............................................................................................................................. 139
Figure 4-12: Unfolding of wild-type and mutant Plys in Gdn-HCl. ............................. 141
Page 12
XI
Figure 4-13: Fluorescence emission spectra of wild-type Ply and mutants in the
presence and absence of cholesterol containing liposomes. ................................. 146 Figure 4-14: Change in the λem max of wild-type Ply and mutants in the presence and
absence of liposomes. ........................................................................................... 147
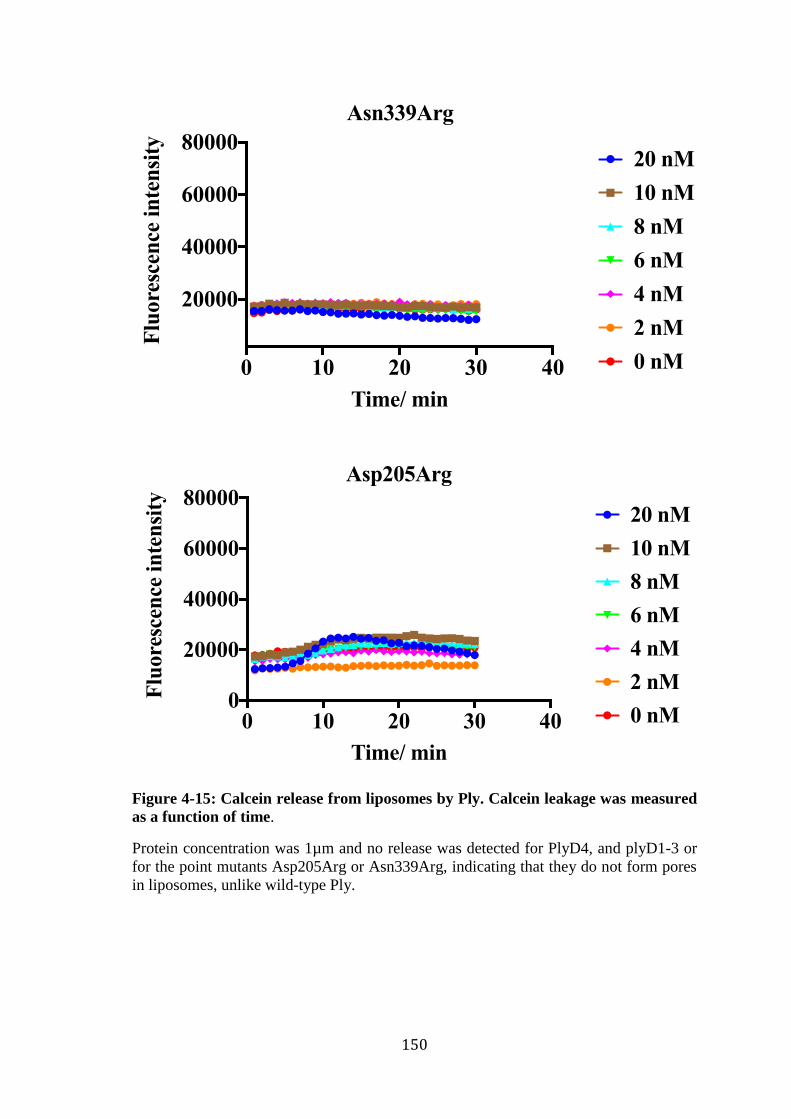
Figure 4-15: Calcein release from liposomes by Ply. Calcein leakage was measured as a
function of time. .................................................................................................... 150 Figure 4-16: Negative-stain EM of wild-type Ply, mutants Ply Thr304Arg, and PlyD4
with unilamellar liposome containing-Chol. ........................................................ 152 Figure 4-17: Negative-stain EM of Ply Asp205Arg, with the unilamellar liposome
containing-Chol. ................................................................................................... 153 Figure 4-18: Negative-stain EM of Ply Asn339Arg, with the unilamellar liposome
containing Chol. .................................................................................................... 154 Figure 4-19: PlyD4 crystal structure the Trp loop in the green structure is flip down. 155 Figure 4-20: Ply domain structure and the likely changes upon membrane binding. . 156 Figure 5-1: Rayleigh and Raman scattering. ................................................................ 161 Figure 5-2: The gradient force mechanism in OT. ....................................................... 165
Figure 5-3: Microfluidic device pattern. ....................................................................... 169 Figure 5-4: Microfluidic device preparation. ................................................................ 169 Figure 5-5: Liposome manipulation between two different solutions including PBS and
Ply by OT. ............................................................................................................. 170
Figure 5-6: Schematic of Optical tweezers. .................................................................. 171 Figure 5-7: Representative Raman spectra of an-optically trapped POPC/Chol liposome
and POPC/Chol separately. ................................................................................... 174
Figure 5-8: The Raman spectra profile of an-optically trapped liposome (1:1 mole ratio
POPC/Chol) with and without wild-type Ply. ...................................................... 175 Figure 5-9: Raman spectra profile of an-optically trapped pure POPC liposome with and
without wild-type Ply. ........................................................................................... 176
Figure 5-10: Comparison Raman spectra of an-optically trapped single liposome with
and without wild-type Ply in low/high concentration of cholesterol. ................... 179
Figure 5-11: Comparison of Raman spectra of an-optically trapped liposome with and
without PlyD4. ...................................................................................................... 182 Figure 5-12: Raman spectra profile of an-optically trapped liposome (1:1 POPC/Chol)
with mutant D205R and N339R. .......................................................................... 185 Figure 5-13: Raman spectra profile of-an optically trapped 1:1 POPC/Chol vesicle with
mutant Lys268Ala, Arg226Ala, Val341Arg, Thr88Glu and Leu11Arg. .............. 187 Figure 5-14: Comparison of Raman spectra for an-optically trapped liposome
POPC/Chol 1:1 ratio and POPC/Chol low ratio with mutant Thr304Arg. .......... 187 Figure 5-15: Comparison of Raman spectra for an-optically trapped liposome
POPC/Chol high with and without Thr304Arg. ................................................... 188 Figure 5-16: Raman spectra analysis of an-optically trapped liposome with Ply locked
mutants (Thr55Cys+Val163Cys and Ala262Cys+Trp278Cys). ........................... 190
Figure 5-17: Raman spectra profile of 1:1:1 POPC/Chol/SM liposome with wild- type
Ply, PlyD4 and Ply mutant T304R........................................................................ 191 Figure 5-18: Schematic represntaion of impacting Ply on the the membrane phase. ... 192
Page 13
XII
List of tables
Table 1-1: The pneumococcus vaccine types, which are currently licensed. ................. 12 Table 1-2: A schematic outline of three human ficolins (M-ficolin, L-ficolin and H-
ficolin). .................................................................................................................... 29 Table 1-3: Human IgG isotypes characteristic. .............................................................. 37 Table 2-1: Oligonucleotide primers to amplify PlyD1-3. ............................................... 52 Table 2-2: Oligonucleotide primer sets for amplify PlyD4. ........................................... 56 Table 3-1: Sequence of oligonucleotides using in the cloning of the human L-ficolin. . 73
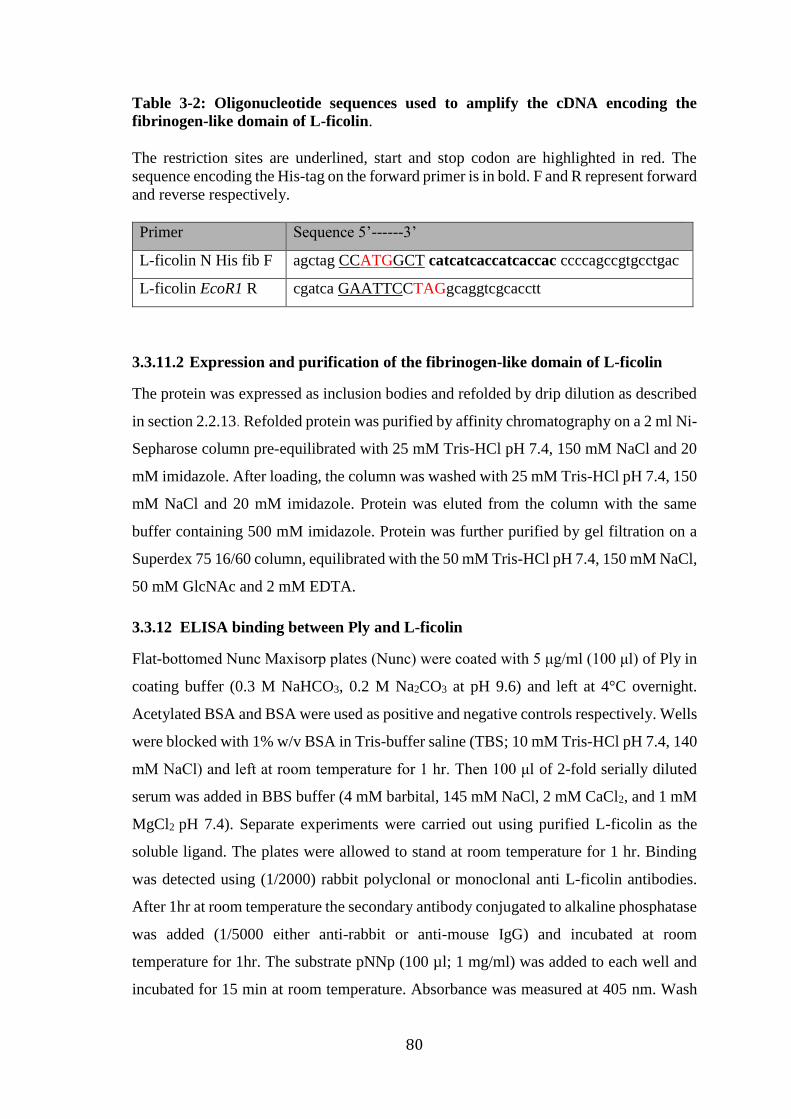
Table 3-2: Oligonucleotide sequences used to amplify the cDNA encoding the
fibrinogen-like domain of L-ficolin. ....................................................................... 80
Table 4-1: Mutagenic Primer sequences to make the single point mutants. ................. 117 Table 4-2: Primer sequences of the TMH1 and TMH2 mutants. ................................. 119 Table 4-3: Optimisation crystallisation condition for PlyD1-3. ................................... 123 Table 4-4: Cytolytic activity of wild-type Ply and Ply mutants. The haemolytic activity
of single mutants and double mutants were carried out at different time. Therefore,
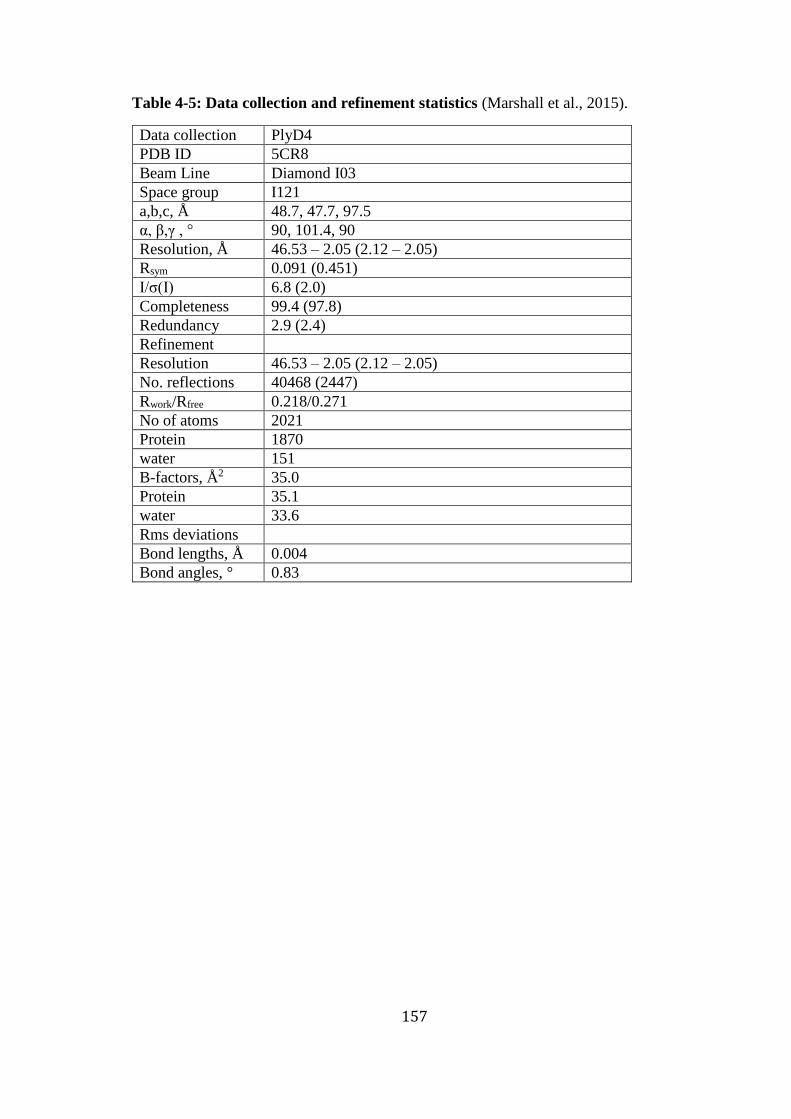
the relative activity of wild-type Ply is different. ................................................. 133 Table 4-6: Data collection and refinement statistics (Marshall et al., 2015). ............... 157
Page 14
XIII
List of abbreviations
Ap Alternative pathway
Arg Arginine
Asn Asparagine
Asp Aspartic acid
BSA Bovine serum albumin
CAP Community acquired pneumonia
cDNA Complementary DNA
CHO Chines Hamster Ovary
CP Classical pathway
CRM197 Cross reactive material 197
DHFBS Dialysed heat fetal bovine serum
DLPC 1, 2-dilauroyl-sn-glycero-3-phosphate
DLS Dynamic light scattering
DMS Dimethyl sulfoxide
dNTP Deoxynucleotide triphosphate
DOPC 1, 2-dioleoyl-sn-glycero-3-phosphocholine
DPPC Dipalmitoylphosphatidylcholine
DTT Dithiothreiotol
E coli Escherichia coli
EDTA Ethylene diamine tetra acetic acid
ELISA Enzyme linked immunosorbent assay
Eno Enolase
Gdn-HCl Guanidine-HCl
GlcNAc N-acetyl glucosamine
Glu Glutamic acid
GSSH Glutathione disulphide
His-tag Histidine-tag
Hyl Hyaluronidase
Ig Immunoglobulin
IPD Invasive pneumococcal diseases
IPTG Isopropyl β-D-1-thiogalactopyranoside
LB Luria-Bertani broth
Ld Liquid disorder
Leu Leucine
Lo Liquid order
Lp Lectin pathway
LUVs Large unilamellar vesicles
Lys Lysine
LytA Autolysin A
MAC Membrane attack complex
MASP MBL associated serine proteases
MBL Mannose binding lectin
MBP Maltose binding protein
Met Methionine
mIgD Membrane IgD
mRNA Messenger RNA
MSB Maurice Shock Building
MTX Methotrexate
Page 15
XIV
OM Otitis media
OME Otitis media with effusion
OT Optical tweezers
P/S Penicillin/Streptomycin
PAGE Polyacrylamide gel
PavA Pneumococcal adhesion and virulence A
PBS Phosphate buffer saline
PCR Polymerase chain reaction
PCV Pneumococcal conjugates vaccine
PDMS Polydimethylsiloxane
Phe Phenylalanine
Ply Pneumolysin
PlyD1-3 Pneumolysin domain 1-3
PlyD4 Pneumolysin domain4
PNACL Protein nucleic acid chemistry laboratory
pNNp p-Nitrophenyl phosphate disodium salt
POPC Palmitoyl-2-oleoylsen-glycero-3-phosphocholine
PPV Pneumococcal polysaccharide vaccine
PS Phosphatidylserine
PspC Pneumococcal surface protein C
RBCs Red blood cells
Re Reynolds
rFR+ Fermi resonance
rpm Round per minute
SDS Sodium dodecyl sulphate
SEM Standard error of the mean
sIgD Secreted IgD
sLeX Sialyl Lewis X
SOE-PCR Splicing overlap extension PCR
TBE Tris borate EDTA
TE Trypsin EDTA
TEM Transmission electron microscope
Thr Threonine
Tm Melting temperature
TMH 1, 2 Transmembrane hairpin 1 and 2
Trp Tryptophan
Tyr Tyrosin
Page 16
1
Chapter 1 General introduction
1.1 Pneumococcus
The Pneumococcus was discovered and isolated by the George Sternberg in 1880 and
Louis Pasteur in 1881 (Flaumenhaft and Flaumenhaft, 1993). It is a Gram-positive
bacterium and previously known as a Diplococcus pneumoniae (Stevens and Kaplan,
2000). The ecological niche of this bacterium is a part of the human nasopharyngeal
flora where it exists asymptomatically as a commensal (Kadioglu et al., 2008).
Approximately 25% of the population carries the pneumococcus in their nasopharynx but
it becomes a pathogen when it spreads from the nasopharynx to the lungs, blood and brain
(Paterson and Orihuela, 2010). In addition, when the immune system is compromised it
causes many serious diseases such as pneumonia, meningitis, bacteremia and otitis media
(Kadioglu et al., 2008).
Pneumococci are arranged in a pair or in a chain of varying lengths in blood cultures and
liquid media (AlonsoDeVelasco et al., 1995). Pneumococci are facultative anaerobes and
catalase-negative bacteria. They produce a green zone of hemolysis around colonies on
blood agar hence are classified as alpha-hemolytic (Obaro and Adegbola, 2002).
Pneumococcal infections are associated with a high rate of mortality and morbidity
globally (Song et al., 2013). This might be a result of its increasing antibiotic resistance.
In developing countries, pneumococcal septicemia is a major cause of child mortality
(Kadioglu et al., 2008). The pneumococcus represents the most common bacterial cause
of community-acquired pneumonia (CAP) in both developed and developing countries
(Feldman and Anderson, 2016). Moreover, it is the most important respiratory tract
bacterial pathogen in the UK and is responsible for most episodes of CAP.
1.2 Pneumococcal epidemiology
Normal carriage of the pneumococcus is first evident at 2-3 years old. Carriage in children
is higher than in adults with a ˂10 % decrease in the adult population (Henriques-
Normark and Tuomanen, 2013). The first step of pneumococcal infection is the
colonization of the nasopharynx. Infection can spread from person to person via
droplets/aerosols. Transmission is immediate on contact with respiratory droplets from
persons with existing pneumococcal illness or commonly, from persons who
Page 17
2
asymptomatically carry pneumococci in their nasopharynx (Hartzell et al., 2003). The
pneumococcus lives in the upper respiratory tract as a normal flora and it is found in 30-
70% of preschool children (Nilsson and Laurell, 2001).
Tracking the global or local spread of pneumococci is commonly done by serotyping of
the capsular polysaccharide (Henriques-Normark and Tuomanen, 2013). So far, at least
93-serotypes based on capsular polysaccharide structures are known in the pneumococcus
(Henriques-Normark and Tuomanen, 2013, Drijkoningen and Rohde, 2014). Studies in
the USA in the late 1990s showed that serotypes 4, 6B, 9V, 14, 18C, 19F and 23F account
for 59% of invasive pneumococcal diseases (IPD) in adults and 87% in children,
respectively (Feikin and Klugman, 2002). The same serotypes caused 61-81% of IPD in
Europe (Rudan et al., 2008). Most cases of childhood pneumonia occur in developing
countries, mostly in India, China, and Pakistan (Rudan et al., 2008). Some serotypes, such
as serotype 1 and 7F, have a high invasive disease potential, whereas other types are
mainly involved in carriage. Serotypes 3, 6B, and 19F have a lower invasive disease
potential but were associated with the highest mortality rates in patients (Sandgren et al.,
2004). The common serotypes in Germany associated with IPD are serotype 6A and 6B.
After introduction of the conjugate vaccine section 1.5, infections by both serotypes were
reduced among children and adults. However, serotype 6C and possibly 6D increased in
adults (van der Linden et al., 2013). A recent study carried out from April 2013 to March
2015 revealed that the most widespread serotypes in Japan were serotypes 3, 19A, and
22F and these were the most common isolates among adult patients with IPD (Fukusumi
et al., 2017). However, another study suggested that serotype1 is one of the most common
cause of pneumococcal disease worldwide (Cornick et al., 2017). Figure 1-1 displays the
pneumococcal infection progression route from nasopharyngeal carriage to respiratory
diseases including pneumonia and systemic diseases such as septicemia, meningitis, otitis
media and sinusitis.
Page 18
3
Figure 1-1: Pneumococcal pathogenic routes of infection.
Infection of organs is started through the airborne droplets displayed in blue and passed
through to other organs include blood, brain and ears to cause septicaemia, meningitis,
otitis media and sinusitis or by haematogenic route depicted in red. Image taken from
(Bogaert et al., 2004).
1.3 Pneumococcal diseases
In young and elderly people the pneumococcal diseases represent a global health problem.
Asymptomatic nasopharyngeal bacterial colonization can spread to the sterile parts of the
body to cause pneumonia, sepsis, and middle ear infection (Li et al., 2016). Pneumococcal
infection is divided into two types: invasive and noninvasive infections. Non-invasive
disease occurs at mucosal surfaces of the respiratory tract, lung and middle ear in which
the organism spreads directly from the nasopharynx. However, invasive diseases proceed
by spreading of the bacteria to the sterile tissue. The pneumococcus is the major cause of
pneumonia, septicemia and meningitis in children and annually more than a half million
of them die from pneumococcal diseases (Ingels, 2015). According to epidemiological
studies, approximately 1.6 million people die from IPD each year, 1 million of them are
children aged <5 years, mainly from developing countries (O'Brien et al., 2009).
Mortality is up to 10 times higher in some developing countries compared to developed
countries (Lagos et al., 2002). In any population, the incidence of IPD is impacted by
Page 19
4
different factors including the geographical location, season, prevalent serotype, age, and
vaccination status of the population (Cilloniz and Torres, 2014).
1.3.1 Otitis media (OM)
Inflammation of the middle ear is a common disease of childhood (Ngo et al., 2016). OM
is divided into two types: acute otitis media (AOM) which usually affects children under
two years of age and may be caused by bacteria or viral infections (Qureishi et al., 2014)
and OM with effusion (OME) which is a chronic inflammatory condition more common
in children between 3 and 7 years old (Daniel, 2013). The pneumococcus causes AOM
to give symptoms of earache and fever while the non-encapsulated Haemophilus
influenzae causes AOM with conjunctivitis (Palmu et al., 2004). The pneumococcal
conjugate vaccines PCV7 and PCV13 have decreased the incidence of IPD, but in the
respect of the OM only modest success have been achieved (Shenoy and Orihuela, 2016).
1.3.2 Sinusitis and bronchitis
Sinusitis is an infection of the sinuses, which are cavities connecting the middle ear with
the nasal cavity. Bronchitis is an infection of the airways leading from the trachea to the
lungs (Noterman and Nurmio, 2016). Most cases of bronchitis are viral, but the
pneumococcus and Haemophilus influenzae can cause chronic forms of bronchitis
(O’Grady et al., 2013). It specifically occurs in children and adults. Patients with
bronchitis may recover without antimicrobial treatment (Kristo et al., 2003).
1.3.3 Pneumonia and septicaemia
Pneumonia is an acute infection of lungs, where the alveoli fill with fluid and oxygen
absorption is reduced. This disease affects approximately 450 million people each year
(Rudan et al., 2008). Pneumonia is mostly caused by the pneumococcus and Haemophilus
influenzae type b in unvaccinated children (O'Brien et al., 2009, Watt et al., 2009). In the
UK, pneumococcal pneumonia is the most common cause of CAP in children under two
years (Randle et al., 2011). Fortunately, CAP caused by the pneumococcus is now
controlled because of the availability of effective vaccines. For example, paediatric
heptavalent vaccines (PCVs) are effective in immunizing children (Principi and Esposito,
2016). A variety of microorganisms cause pneumonia including Mycoplasma
pneumoniae, Chlamydophila pneumoniae and Staphylococcus aureus (Mandell, 2015).
Pneumococcal septicaemia occurs when the pneumococcus infects the blood stream
(Randle et al., 2011). Immunocompromised patients are particularly vulnerable (Iinuma
Page 20
5
et al., 2007). The consequence of pneumococcal septicemia is that RBCs cannot properly
transport oxygen efficiently to vital organs, and this can rapidly become life-threatening
(File, 2003).
1.3.4 Pneumococcal meningitis
Meningitis is the inflammation of the meninges, the membrane surrounding the brain,
which is a serious IPD (Randle et al., 2011). If bacterial meningitis is left untreated, it is
almost always fatal and pneumococcal meningitis accounts for a significant proportion
of meningitis deaths annually (Pollard et al., 2007). In the UK this disease is the second
most common form of bacterial meningitis after meningococci in children over the age
of one month (Randle et al., 2011). According to Levy et al. (Levy et al., 2014) bacterial
meningitis by the pneumococcus is the most common cause of meningitis in children
younger than two years. In Germany it has been reported that the mortality rate is ~7.5%
among children (Imohl et al., 2015). Acute bacterial meningitis in Iran is being considered
as a dangerous public health problem due to lack of the vaccination program against the
meningeal etiology agent specifically pneumococci (Houri et al., 2017). In 2000,
following the use of PCV7, IPD decreased among both children and adults. However, the
effect on pneumococcal meningitis was not clear (Hsu et al., 2009). Nevertheless, in Utah
use of PCV7 was associated with a decrease in the incidence of pneumococcal meningitis
of 72%, (Stockmann et al., 2013). Similarly, Bingen et al. observed a 68% decrease in
PCV7 serotype pneumococcal meningitis and a 16% to 31% increase in non-PCV7
serotype disease (Bingen et al., 2008).
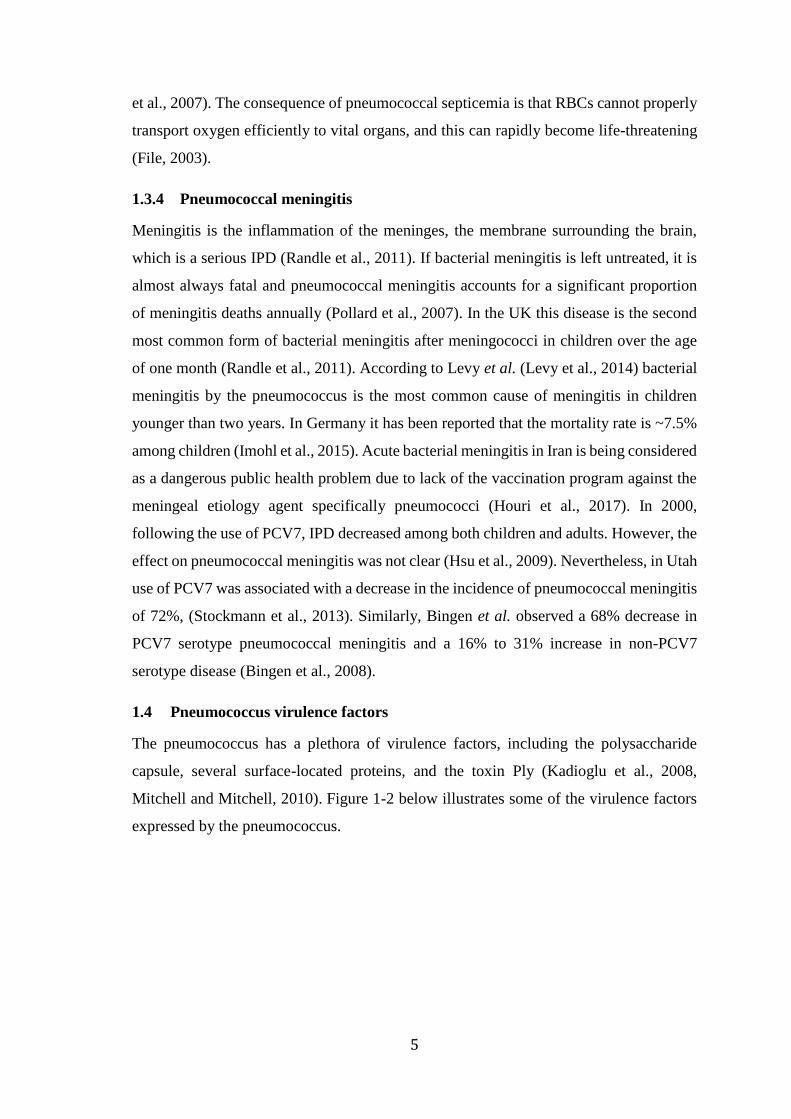
1.4 Pneumococcus virulence factors
The pneumococcus has a plethora of virulence factors, including the polysaccharide
capsule, several surface-located proteins, and the toxin Ply (Kadioglu et al., 2008,
Mitchell and Mitchell, 2010). Figure 1-2 below illustrates some of the virulence factors
expressed by the pneumococcus.
Page 21
6
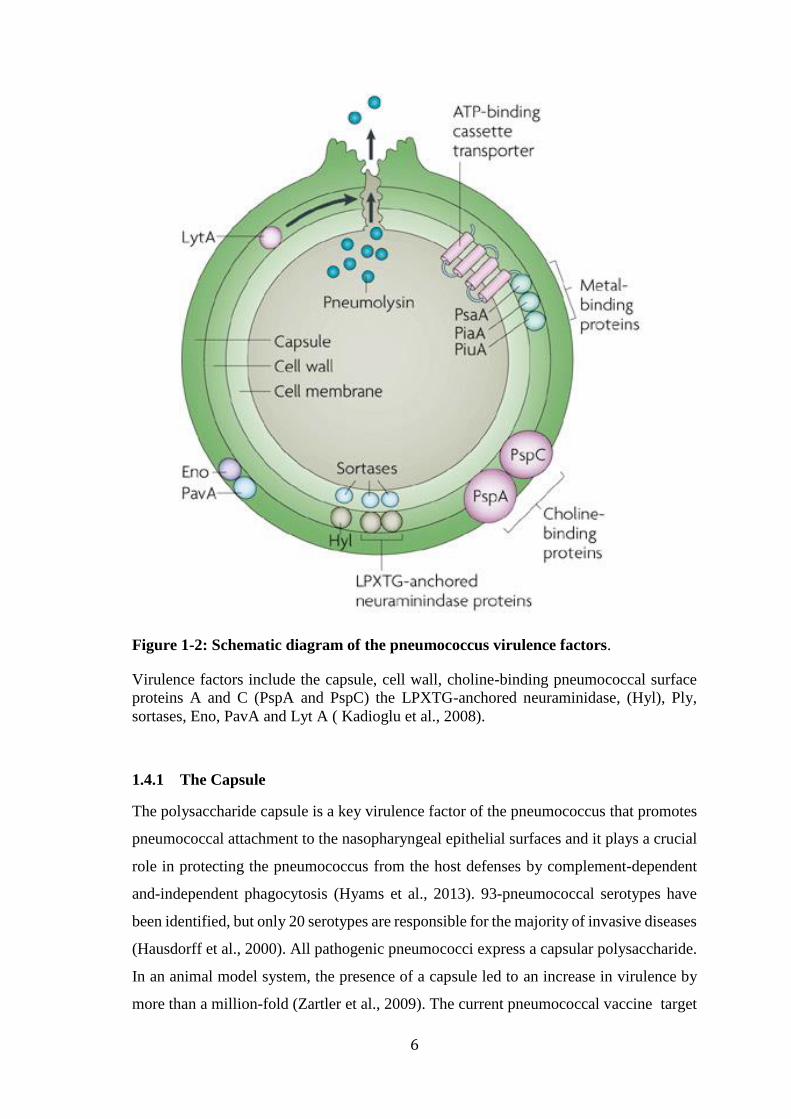
Figure 1-2: Schematic diagram of the pneumococcus virulence factors.
Virulence factors include the capsule, cell wall, choline-binding pneumococcal surface
proteins A and C (PspA and PspC) the LPXTG-anchored neuraminidase, (Hyl), Ply,
sortases, Eno, PavA and Lyt A ( Kadioglu et al., 2008).
1.4.1 The Capsule
The polysaccharide capsule is a key virulence factor of the pneumococcus that promotes
pneumococcal attachment to the nasopharyngeal epithelial surfaces and it plays a crucial
role in protecting the pneumococcus from the host defenses by complement-dependent
and-independent phagocytosis (Hyams et al., 2013). 93-pneumococcal serotypes have
been identified, but only 20 serotypes are responsible for the majority of invasive diseases
(Hausdorff et al., 2000). All pathogenic pneumococci express a capsular polysaccharide.
In an animal model system, the presence of a capsule led to an increase in virulence by
more than a million-fold (Zartler et al., 2009). The current pneumococcal vaccine target
Page 22
7
is the capsule because the capsule is the principal virulence factor of the pneumococcus
(Skov Sorensen et al., 2016).
1.4.2 The cell wall
Pneumococcal cell wall is a multi-molecular coat consisting of peptidoglycan, composed
of N-acetyl glucosamine (GlcNAc) and N-acetyl muramic acid (MurNAc), which is
covalently attached to teichoic acids (Bai et al., 2014). The cell wall provides two main
functions include bacterial protection from phagocytosis and maintenance of cell shape
(Bui et al., 2012). The pneumococcal cell wall strongly provokes inflammation due to the
activation of a wide arrange of cytokines and enzymes (Tomasz and Saukkonen, 1989).
The classical and alternative pathways of the complement system are activated by the
pneumococcal cell wall via lipoteichoic acid components (Hummell et al., 1985).
1.4.3 Autolysin A (LytA)
The LytA is another virulence factor of the pneumococcus, which is involved in autolysis
and in fratricidal penicillin induced lysis. LytA is mainly located intracellularly, but a
small amount is attached to the extracellular cell wall (Mellroth et al., 2012).
Structurally, LytA is a two-domain protein with an N-terminal acetylmuramoyl l-
alanine amidase domain and a C-terminal choline-binding domain (Fernandez-
Tornero et al., 2001). Mutation of LytA gene leads to a decrease in virulence compared
to the wild-type pneumococcus (Hirst et al., 2008). LytA mediates lysis and release of
Ply (Martner et al., 2008). In addition, release of LytA may lyse neighbouring non-
competent pneumococcal cells in a fratricidal manner (Eldholm et al., 2009). The likely
function of LytA is to release proteins involved in immune evasion or interference of the
host immune response by the cell wall components (Martner et al., 2009).
1.4.4 Neuraminidases or sialidases
Neuraminidase or sialidases remove N-acetyl-neuraminic acid (sialic acid) from
carbohydrates on host cells, which is a key carbohydrate source for the pneumococcus.
In addition, it is a receptor for adhesion and invasion and promotes biofilm formation
(McCombs and Kohler, 2016). Three types of neuraminidases are produced by the
pneumococcus called Nan A, Nan B, and Nan C, which are ordered according to their
contribution towards virulence (Xu et al., 2011, Walther et al., 2015). Nan A is the most
highly expressed neuraminidase in all the pneumococcus strains and can hydrolyse α2-3,
α2-6, and α2-8 sialyllactose to release N-acetyl-neuraminic acid (Walther et al., 2015, Xu
Page 23
8
et al., 2011, King et al., 2004). Nan B exists in most but not all the pneumococcus strains.
Nan B deficient strains cannot colonize the nasopharynx or cause sepsis (Walther et al.,
2015). Nan C only exists in 51% of strains (Gualdi et al., 2012, Smith et al., 2013). Nan
A (~115 kDa), Nan B (~75 kDa), and Nan C (~82 kDa) each have an N-terminal signal
sequence, followed by a lectin domain, and a catalytic domain. Nan A also has a C-
terminal domain LXPTG motif that is used to attach to the cell wall (King et al., 2004).
1.4.5 Hyaluronidase (Hyl)
Hyl degrades hexosaminidic linkages of hyaluronan or hyaluronic acid and also cleaves
other polysaccharide components such as chondroitin or chondroitin sulfates
(Zwijnenburg et al., 2001, Hynes and Walton, 2000). The three dimensional structure of
Hyl has been determined by X-ray crystallography. It is composed of an N-terminal
catalytic domain and a C-terminal supportive ß-domain connected by a short peptide
linker (Akhtar and Bhakuni, 2003). It has been suggested that Hyl plays a major role in
both colonization and invasion thus it is an important virulence factor, which exists in
most clinical isolates of the pneumococcus (Feldman et al., 2007). However, another
study showed that hyaluronidase did not contribute to virulence in a meningitis model of
infection (Wellmer et al., 2002).
1.4.6 Immunoglobulin A1 protease (IgA1)
The iga gene encodes the IgA1 protease, a 200 kDa metalloprotease that cleaves the hinge
region of human IgA1 at the bond between Pro-227 and Thr-228 (Wani et al., 1996).
Cleavage impacts the protective function of IgA1 and inhibits the phagocytic killing of
the pneumococcus (Janoff et al., 2014). IgA is the most common immunoglobulin on
mucosal surfaces and IgA1 represents over 90% of total IgA. IgA2 comprises only 10%
of IgA. Thus the IgA1 protease is a major virulence factor for colonization in the
nasopharynx (Weiser et al., 2003, Janoff et al., 2014).
1.4.7 Pneumococcal iron acquisition and uptake transporters
The pneumococcus encounters iron scarcity in the human host. To provide an appropriate
iron supply, the ATP binding cassette transporter Pia works to take up iron chelated by
hydroxamate siderophore, via the membrane-anchored substrate-binding protein PiaA
(Cheng et al., 2013). Piu A (~34 kDa), Pia A (~42 kDa) and Pit A (~37 kDa) are
lipoprotein components of two pneumococcal iron ABC transporters (Whalan et al.,
2005, Brown et al., 2002a). The three proteins are encoded by unlinked genes, piu A, pia
Page 24
9
A and pit A (Brown et al., 2002a). Mutation in any one of the three loci results in a modest
reduction in virulence, while mutation in two or three loci causes a more substantial
reduction of growth in an iron-restricted environments (Janulczyk et al., 2003).
1.4.8 Pneumococcal surface protein A (PspA)
PspA is a surface exposed protein of the pneumococcus (Tu et al., 1999). The virulence
role of PspA has been demonstrated in the pneumococcus strains in which the PspA genes
deleted or inactivated. PspA mutant strains are cleared more quickly from the blood of
nonimmunized mice than the wild-type strain (Haughney et al., 2013). PspA reduces the
deposition of complement component C3b on the pneumococcus thereby preventing
elimination of the pneumococcus by the complement system (Tu et al., 1999). A mutant
strain that lacks PspA shows greater deposition of complement than the wild-type strain
(Mukerji et al., 2012). PspA also inhibits the bactericidal activity of apolactoferrin, which
is present on the mucosal surface during inflammation (Haughney et al., 2013).
1.4.9 Pneumococcal surface protein C (PspC)
PspC is found in all pneumococcal strains. It consists of a coiled-coil helix, a proline-
rich region and a choline-binding domain (Yother and Briles, 1992). PspC leads to
adhesion and colonization on the nasopharynx of the pneumococcus. Mutations in PspC
reduce the ability of the pneumococcus to colonize in the mouse model (Balachandran et
al., 2002). The role of PspC in pneumococcal sepsis was investigated in a murine
infection model by deleting the pspC gene of strain D39. When mutant strains were
injected intravenously into mice, their survival rates increased significantly compared to
the wild-type strain (Iannelli et al., 2004). PspC provides protection of the pneumococcus
from the host immune system by binding of complement components including C4b
binding protein (C4BP) and factor H. In this way, it inhibits the CP and the AP pathways
of the complement system (Agarwal et al., 2012).
1.4.10 Pneumococcal adhesion and virulence A (PavA) and enolase (Eno)
PavA and Eno are present on the surface of the pneumococcus and bind to the
extracellular matrix components fibronectin and plasminogen (Holmes et al., 2001,
Bergmann et al., 2001). Fibronectin is a mammalian glycoprotein, which exist as both
soluble and less soluble forms. The soluble form is localised in body fluids, including
plasma, CSF and amniotic fluid, whereas the less soluble form is localised in the
extracellular matrix and basement membrane (van der Flier et al., 1995). PavA present
Page 25
10
on the pneumococcal outer cell surface binds fibronectin, either in the fluid phase or
immobilized onto a surface. This interaction has also been postulated to assist adhesion
of group A streptococci to epithelial cells (Holmes et al., 2001). Another study also
reported that PavA is not only important for adhesion but also for invasion because PavA
mutant strains were attenuated both in murine pulmonary models and in septicaemia
models of pneumococcal infection (Pracht et al., 2005). Eno is an anchorless surface
protein of the pneumococcus and has previously been identified as a plasminogen binding
protein (Kolberg et al., 2006). Pneumococci deficient in Eno are attenuated in a model of
respiratory infection, which indicates that plasminogen binding plays a role in respiratory
disease (Bergmann et al., 2001).
1.4.11 Sortases
Sortases are a family of enzymes present in Gram-positive bacteria (Ton-That et al.,
1999). They are cysteine transpeptidases enzymes that provide the covalent attachment
of substrate proteins to the cell walls of Gram-positive bacteria (Kang et al., 2011). They
are classified into three types: Srt C-1, Srt C-2, and Srt C-3 previously known as Srt B,
Srt C, and Srt D and are encoded by the rlrA islet genes. Sortases are important for the
assembly of a pilus and mediate cell wall localization (LeMieux et al., 2008). The pilus
is a long filamentous protein fiber that projects from the cell surface. It plays a key role
in pathogenesis through attachment to host cells, immune evasion and biofilm formation
(Jacobitz et al., 2016).
1.5 Vaccines against the pneumococcus
Despite antibiotic treatment and vaccines, the burden of disease due to the pneumococcus
remains high (Reynolds et al., 2014). Furthermore, the rapid emergence of antibiotic
resistance in pneumococci highlights the need for effective vaccines. Two types of
pneumococcal vaccine are currently available: pneumococcal polysaccharide vaccine
(PPV) and pneumococcal conjugate vaccine (PCV) (Principi and Esposito, 2016).
Pneumovax® 23 provides protection agaist 23 pneumococcal polysaccharides. It is
composed of 23 purified polysaccharide antigens of pneumococcal serotypes 1, 2, 3, 4,
5, 6B, 7F, 8, 9N, 9V, 10A, 11A, 12F, 14, 15B, 17F, 18C, 19A, 19F, 20, 22F, 23F, 33F.
Pneumovax® 23 was licensed in 1983 in the United States and replaced an earlier 14-
valent formulation that was licensed in 1977 (Pilishvili and Bennett, 2015).
Page 26
11
In the United States PPV23 is recommended for vaccination of children >2 years old with
severe chronic underlying diseases associated with an increased risk of complications due
to pneumococcal infection (Nuorti and Whitney, 2010). Nasopharyngeal carriage of the
pneumococcus in children is reduced by PPV (Pilishvili and Bennett, 2015). A study
performed in Taiwan suggested that the PPV23 is effective against pneumococcal
infection in elderly adults over 75 years old. Vaccination in the previous year led a
reduction of 60%, 76% and 90% of pneumonia hospitalization, of IPD, and of death from
pneumonia respectively (Tsai et al., 2015). PPV23 induces antibodies primarily through
T-cell independent mechanisms, and therefore induces a relatively weak immune
response. Therefore, in children <2 years whose immune systems are immature, antibody
responses to PPV is poor. T-cell independent antigens do not induce immunological
memory. Furthermore, anti-PS antibodies have relatively low affinity for their
carbohydrate antigens because switching from IgM to IgG does not occur even after
repeat vaccinations. Taken together, the lack of memory has some vital consequences for
vaccination and the antibodies rapidly decline in serum so revaccination is often required
(Kayhty and Eskola, 1996). The second type of pneumococcal vaccine is the PCV which
is composed of capsular polysaccharide covalently attached to a nontoxic version of
Corynebacterium diphtheriae toxin (CRM197) carrier protein (Principi and Esposito,
2017). The first licensed PCV vaccine was PCV7, which was recommended for use in
infants and young children with a 4 dose schedule in 2000 in the United States (Pilishvili
and Bennett, 2015). Serotypes covered by PCV7, are serotype 4, 6B, 9V, 14, 18C, 19F,
and 23F (Principi and Esposito, 2017). A study by Simonsen et al. has shown that PCV7
positively impacts on CAP in children and adults (Simonsen et al., 2011). PCV7 was also
shown to be effective in Europe and was added to the national immunisation program in
September 2006 in the United Kingdom (Elemraid et al., 2013). PCV7 vaccination was
abandoned in 2010 worldwide and replaced by new vaccines including PCV10 and
PCV13. Therefore, it became clear that there was a necessity for vaccines with further
pneumococcal serotypes (Principi and Esposito, 2017). The covered serotypes for all
pneumococcal vaccines are shown in (Table 1-1), PCV10 serotypes comprise 1, 4, 5, 6B,
7F, 9V, 14, 18C, 19F and 23F (Principi and Esposito, 2017). While PCV13 covers
serotypes 1, 3, 4, 5, 6A, 6B, 7F, 9V, 14, 18C, 19A, 19F, 23F (Principi and Esposito,
2017). In PCV10, eight capsular polysaccharides are conjugated to a non-lipidated cell
surface lipoprotein (protein D) of non-typeable Haemophilus influenzae, and two capsular
polysaccharides are conjugated to tetanus or diphtheria toxoid. However, In PCV13, a
Page 27
12
nontoxic mutant of diphtheria toxin is used with all serotypes conjugated to CRM197,
(Principi and Esposito, 2017).
PCV10 and PCV13 are licensed to prevent IPD, CAP and OM in children from 6 weeks
to 5 years of age. However, PCV13 has also been licensed for use in older subjects
(Principi and Esposito, 2017). Conjugate vaccines provide improvement of the immune
and memory response, permanent protection and protect newborns and children, reduce
the bacterial carriage and provide immunity to a large group of animals (WHO). In
addition, to polysaccharide and conjugate vaccines, a recent study suggested that a mutant
Ply C428G and W433F denoted as PlyM2 provides effective protection against
pneumococcal infection (Sun et al., 2015). The advantages of the latter approach is that
Ply is universally expressed in virulent forms of the pneumococcus so it is not strain
specific in contrast to the polysaccharide vaccines.
Table 1-1: The pneumococcus vaccine types, which are currently licensed.
Pneumococcus
vaccines
Serotypes covered License
year
PPV23 (Pneumovax) 1,2,3,4,5,6B, 7F, 8,9N, 9V, 10A, 11A, 12F,
14,15B, 1F, 18C, 19F, 19A, 20, 22F, 23F,
33F
1983
PCV7 (Prevnar®) 4, 6B, 9V, 14, 18C, 19F, 23F 2000
PCV10 (SynflorixTM) PCV7 serotypes + 1, 5, 7F 2009
PCV13 (Prevenar TM) PCV10 serotypes +3, 6A, 19A 2010
1.6 Treatment of the pneumococcus infections
The drug of choice to treat pneumococcal diseases is penicillin, which was introduced in
1943, and used continuously between the 1960s and 1990s (Chiou, 2006), However, in
the mid-1970s, resistant strains of the pneumococcus were observed. Penicillin resistance
is related to structurally modify penicillin-binding proteins of the pneumococcus (Van
der Poll and Opal, 2009). Pneumococcal infections are widely treated with
aminopenicillins and these are used as the first line antimicrobial drugs in the treatment
of OM and CAP in many countries (File et al., 2004). CAP can be treated with ß-lactams
Page 28
13
or macrolides or fluoroquinolones alone or in combination (Caballero and Rello, 2011).
Combination antibiotic therapy generally has a better outcome compared with
monotherapy (Caballero and Rello, 2011). Additionally, resistance of the pneumococcus
to penicillin is likely to be associated to the increase in use of β-lactams in the early 1990s
and the expansion of resistant clones (Granizo et al., 2000, McGee et al., 2001). Several
studies suggested that antibiotic resistance of the pneumococcus has been reduced by
reducing antibiotic consumption (Low, 2005, Guillemot et al., 2005). However, other
studies do not support this conclusion (Barkai et al., 2005, Belongia et al., 2001). In a
recent study, the pneumococcus was recorded as the most frequently isolated pathogen
from the middle ear in children with AOM and showed a high rate of resistance to
penicillin, erythromycin, and clindamycin (Zielnik-Jurkiewicz and Bielicka, 2015).
Widespread macrolide use, however, is associated with increased macrolide resistance
pneumococcus (Malhotra-Kumar et al., 2007, Schroeder and Stephens, 2016).
Corticosteroids are also used in the treatment of pneumococcal pneumonia (van de Beek
et al., 2007). However, evidence is somewhat contradictory. For example, corticosteroids
did not reduce the mortality rate in one study of hospitalized CAP patients. In contrast,
the mortality rate was reduced by ~3% in another study (Siemieniuk et al., 2015).
1.7 Ply
Ply is a cholesterol-dependent cytolysin (CDC), which exists as water-soluble monomers
or dimers, and oligomerizes on target membranes (Sonnen et al., 2014). It is a key
virulence factor of the pneumococcus and forms pores in the membrane of mammalian
cells (van Pee et al., 2016). All clinical isolates of the pneumococcus express Ply and it
plays a key role during pneumococcal infection (Berry et al., 1989, Mitchell et al., 1997).
CDCs are secreted as soluble monomers by pathogenic bacteria. They bind to cholesterol-
containing cell membranes, where they oligomerize to form circular pores with a diameter
of approximately 30 nm. CDCs are produced by a variety of Gram-positive bacteria
including Streptococcus, Bacillus, Listeria, and Clostridium (Dowd et al., 2012, Cassidy
and O'Riordan, 2013). They have similar tertiary structures with 40-70% sequence
identity and conserved pore-forming mechanisms (Tweten, 2005, Bhakdi et al., 1993, van
Pee et al., 2016). Ply does not have a signal sequence present in many CDCs. Instead, it
is released from the pneumococcus by autolysis mediated by LytA or via a non-autolytic
mechanism that remains undefined (Price et al., 2012, AlonsoDeVelasco et al., 1995).
Balachandran et al. found that Ply to be released in the absence of LytA, indicating an
Page 29
14
autolysis-independent release of Ply (Balachandran et al., 2001). Price and Camilli
suggested that Ply exists in the cell wall of the pneumococcus in agreement with the
previous study of Balachandran that Ply can be released without depending on autolysis
(Price and Camilli, 2009).
Ply consists of 471 amino acids residues with a molecular mass of ~53 KDa. It is
composed of four domains; three contiguous domains (D1-3) and a fourth separate
membrane binding domain (D4) (Figure 1-3) (Walker et al., 1987). Ply has an elongated
shape. Circular dichroism revealed that Ply is structurally rich in ß-sheet 36% and α-
helices 11% (Morgan et al., 1993, van Pee et al., 2016, Lawrence et al., 2015). In three
recent studies, the Ply was crystallized successfully and its structure determined by X-ray
diffraction (Marshall et al., 2015, Lawrence et al., 2015, van Pee et al., 2016). PlyD2
provides the connection between the head D1 and the tail of the monomer D4. PlyD1
plays an important role in orienting the toxin in the membrane because of the high content
of negatively charged residues on one face packing against positively charged residues
on the other (Rossjohn et al., 1998). PlyD4 binds to the membrane of the host cell. A
sequence of 11 amino acids (427ECTGLAWEWWR437) known as the Trp-rich loop is
responsible for binding to cholesterol, its receptor in the membrane (Gilbert et al., 1999).
A recent study suggested that Ply has another receptor: sialyl Lewis X (sLeX) present on
many cells including the surface of the RBCs (Shewell et al., 2014). Nevertheless, Ply
binds liposomes that lack sLeX, so unlike cholesterol this receptor is not essential.
PlyD1 has six ß-strands and two α-helices. PlyD2 has three long ß-strands that connect
D1 to D4, while PlyD3 comprises a five-stranded antiparallel ß-sheet surrounded by two
three-helix bundles (transmembrane hairpins TMH1 and TMH2 or HB1 or HB2 helical
bundles). PlyD4 is composed of a compact ß-sandwich with two ß-sheets, each with four
ß-strands. In contrast, to PlyD1-3, which is intertwined, PlyD4 is linked an independently
folding unit linked via a glycine (Gly361) to PlyD2 (Van Pee et al., 2016).
Page 30
15
Figure 1-3: Ply crystal structure.
A different colour depicts the four domains, (D1) is blue, (D2) is yellow, (D3) is light
brown and (D4) is in green. The Trp-rich loop is coloured in red. Transmembrane hairpins
1, 2 (TMH1 and TMH2) are depicted in purple and cyan respectively.
1.8 Overview mechanism of pore formation
The mechanism of pore formation of the CDCs have been investigated in many studies,
via different techniques including, electron microscopy (EM) through negative staining,
cryo-EM, atomic force microscopy (AFM), fluorescence imaging, kinetic assays and
other biophysical and functional methods (Tweten, 2005, Hotze and Tweten, 2012,
Czajkowsky et al., 2004, Lawrence et al., 2015, Palmer et al., 1998, van Pee et al., 2016).
Two hypothesis of CDCs pore formation are discussed in the literature. The first based
on streptolysin O produced by the Streptococcus pyogenes, suggested that monomers
oligomerize into arc-shape pores on the cell membrane (Palmer et al., 1998). According
Domain 1
Domain 2
Domain 4
Domain 3 TMH1
TMH2
Trp-rich loop
Page 31
16
to this study streptolysin O binds and oligomerizes on the membrane surface, and the
oligomeric structure is able to insert and open a pore into the lipid bilayer before the ring
is completely formed. The second hypothesis, based on work on perfringolysin O
suggested that monomers bind to the membrane, oligomerize to form a pre-pore structure,
which then inserts into the membrane to form the transmembrane pore (Shepard et al.,
2000, Heuck et al., 2003). Figure 1-4 below illustrates the two hypothesis mechanisms of
pore formation taken from (Gilbert, 2002). There are two recent contradictory studies
about the CDCs assembly on the membrane and pore formation. Leung et al. suggested
that the assembly of suilysin on the membrane is terminated in the pre-pore state and is
not impacted by the pre-pore to pore transition (Leung et al., 2014). However, Gilbert et
al. suggested that at low toxin concentration the rate of lysis is controlled by the transition
of pre-pore to pore to form an incomplete ring. In addition, at high toxin concentration
the affinity of the protein for the membrane receptor controlled the rate of lysis (Gilbert
and Sonnen, 2016).
Figure 1-4: Two hypothesis models of pore formation by CDCs.
(A) Shows that the insertion of the toxin followed by oligomerization leading to gradual
pore formation. (B) Shows that the toxin monomer binding, oligomerization to form a
pre-pore followed by membrane insertion to create the pore.
According to Tweten (Tweten, 2005), during pore formation monomers bind to
cholesterol in the membrane via the Trp-rich loop at the base of the D4 (Rossjohn et al.,
1998). This orientates the CDCs on the membrane enabling them to diffuse laterally.
Secondly, D3 of the toxin rearranges following insertion of the Trp-loop of D4 insertions
causing the CDCs monomers to oligomerize to form the pre-pore structure. Thirdly, the
N-terminal of the D3 forms the internal part of the transmembrane pore and further
Page 32
17
conformational changes occur in D3 in which the two alpha-helical bundles (αHB1 and
αHB2) are changed into two extended amphipathic trans membrane beta-hairpins
(TMH1, and TMH2), the oligomer is now in the pre-insertion state. Each monomer within
the large oligomeric pore complex contributes two TMHs to the formation of the β-barrel
pore these TMHs are derived from the two D3 αHBs (Tweten et al., 2015). Finally, the
pre-pore vertically collapses and completely inserts into the membrane, and the large
beta-barrel-pore is formed which is composed of 35-50 monomers. The resulting pore is
approximately 30 nm in size and results in the cell becoming permeable to ions and
macromolecules (Sonnen et al., 2014). Oligomer formation was mainly attributed to
intermolecular interactions via D1 and D3 (Ramachandran et al., 2002). However, it has
been shown that streptolysin, pyolysin and listeriolysin O D4 can oligomerize by
themselves on cholesterol crystals (Harris et al., 2011, Weis and Palmer, 2001). A cryo-
EM study of Ply confirms that PlyD4 plays a role in oligomer formation through
intramolecular and intermolecular interactions of its loops (van Pee et al., 2017). All steps
of pore formation in CDCs is shown in (Figure 1-5). A classic study performed by Tilley
et al. 2005 shows the steps of pore formation by Ply using cryo-EM by taking snapshots
of the pore and pre-pore forms of Ply when it interacts with liposomes (Tilley et al., 2005).
The crystal structure of Ply supports the theory of the pre-pore complex in which
monomers pack side-by-side (Marshall et al., 2015, van Pee et al., 2016).
Page 33
18
Figure 1-5: Mechanism of pore formation of CDCs family on the lipid bilayer.
As clear from left to right the soluble monomer is anchored to the cholesterol membrane
through the Trp-rich loop at the base of D4 which causes a change in D3. The monomers
later oligomerized and collapsed downwards through the membrane to form the open pore
(Tweten, 2005).
1.9 Role of Ply in pathogenesis
Paton et al. demonstrated the key role of Ply towards virulence of the pneumococcus in
vivo in 1983 (Paton et al., 1983). They showed that mice immunized with a partially
inactivated form of Ply, caused moderate protection against a virulent strain of the
pneumococcus. In addition, in 1987 the Ply gene was sequenced from a serotype 2 strain
of the pneumococcus, D39 (Walker et al., 1987). An isogenic Ply-negative mutant of the
pneumococcus was then produced which was called (Ply-N) (Berry et al., 1989).
Intranasal challenge of mice with Ply-N showed reduced virulence compare to the wild-
type (Berry et al, 1989). Another study confirmed the results from Berry et al. 1989,
intranasal challenge of mice with Ply-N showed reduced severity of the inflammatory
response, a decrease in bacterial growth rate in the lungs and a delayed movement of the
bacteria into the blood stream, compared to the wild-type bacteria (Canvin et al., 1995).
Ply has a cytotoxic impact on eukaryotic cells. For example, at sub-cytolytic
concentrations, the proinflammatory activity of neutrophils and monocytes is increased
as a result of an influx of the extracellular calcium during pore formation (Cockeran et
al., 2002). Ply induces an increase in circulating cardiac troponins in the blood stream.
Page 34
19
Troponins are indicators of cardiac injury and cause inflammatory cell infiltration into
the myocardium (Alhamdi et al., 2015). Moreover, due to activation of proinflammatory
immune cells by Ply, reactive oxygen and nitrogen are released and damage host tissues
(Cockeran et al., 2001, Houldsworth et al., 1994). Ply is toxic to most eukaryotic cells
including epithelial and endothelial cells present in the respiratory tract and brain.
Apoptosis of neutrophils, brain cells, macrophages and dendritic cells are induced by pore
formation by Ply (Braun et al., 2007, Srivastava et al., 2005, Littmann et al., 2009). The
impact of Ply on cells and tissues is well studied but the impact of Ply on the molecular
process is less understood. A recent study revealed that Ply is genotoxic, therefore, Ply
can damage DNA in the alveolar epithelial cells in the absence of live bacterial cells (Rai
et al., 2016).
Ply induces the cytokine production by the white blood cells, which are proteins that
regulate the host’s immune response to infection (Hirst et al., 2004). Wild-type Ply plays
a role in an inducing the production of interleukins include IL-1 and IL-18, while these
cytokines were not induced by Ply-deficient pneumococcus strains (Shoma et al., 2008).
Furthermore, in vitro work using human pharyngeal and bronchial epithelial cells showed
that Ply encourages the release of pro-inflammatory cytokines IL-6 and 8 (Kung et al.,
2014).
Another role of Ply is the activation of the complement system. As a result of complement
activation and complement C3 deposition on Ply, activation on the pneumococcus itself
is reduced thereby reducing opsonophagocytosis. The mechanism of activation is less
well understood. It was reported that Ply activates the CP of the complement system via
direct interaction with C1q, due to similarity with C-reactive protein (CRP) (Mitchell et
al., 1991). However, another study suggested that C1q does not bind to Ply directly and
its binding requires the presence of immunoglobulin. The same study suggested that Ply
can also activate the LP via L-ficolin (Ali et al., 2013).
1.10 The mammalian immune system
The immune system is the network of tissues, cells and molecules within an organism
that work together to defend the body against diseases mediated by infectious agents
including bacteria, viruses, parasites, fungi and other diseases including cancer. It
provides protection through innate and adaptive immunity. Innate immunity mediates an
initial, immediate and nonspecific immune response against invading microorganisms.
Page 35
20
Innate immune components include the phagocyte, complement system, epithelial cells,
mucosal membranes and the skin (Mogensen, 2009). Adaptive immunity consists of the
specialised lymphocytes and their products involved in the mediation of the antigen-
specific immunity. The key cells of adaptive immunity are T and B-lymphocytes (Greter
et al., 2012). Adaptive immunity is divided into two branches: cell-mediated immunity,
which eliminates intracellular microbes, and is carried out by the T-lymphocytes; and
humoral immunity, which protects the body against extracellular microbes by the action
of antibodies that are produced by the B-lymphocytes (Jiravanichpaisal et al., 2006). B-
cells remain in the bone marrow during maturation, whereas T-cells egress into the
thymus.
1.10.1 Complement system
Bordet discovered the complement system in 1896 as a heat-labile component of serum
(Jason, 2010). Complement is part of innate and adaptive immunity that provides the first
line of defence against invasion by foreign or altered host cells (Ricklin et al., 2010,
Kerepesi et al., 2006). The complement system is composed of over 30 soluble plasma
proteins and membrane-associated proteins produced mainly by the liver (Kolev et al.,
2014). Microorganism can be lysed via assembly of the membrane attack complex
(MAC), opsonised by complement proteins or eliminated as a result of immune and
inflammatory responses that aid immune cells to fight infection and maintain
homoeostasis. Three distinct pathways can activate the complement system: the Classical
(CP), Lectin (LP), and Alternative (AP) pathways. Each pathway terminates with the
MAC (Jason, 2010). Figure 1-6 below illustrates the three complement pathways, all of
which generate a C3 convertase that is the central component of the system and cleaves
the inactive C3 into C3a, which is an anaphylatoxin, and C3b an opsonin.
Page 36
21
Figure 1-6: Three pathways of the complement system: Classical, Lectin and
Alternative pathways (CP, LP and AP).
The CP is activated by C1 consisting of C1q and C1r2 C1s2. During activation the
recognition molecule C1q binds to IgG and IgM on the surface of pathogens, triggering
activation of C1r and C1s. C4 and C4b bound C2 are cleaved by C1s and together form
the C3 convertase formation (C4b2a). The LP is activated through the binding of
mannose-binding lectin (MBL), serum ficolins, collectin-10 (CL1-10 or CL-L1) and
collectin-11 (CL-11 or CL-K1) in complex with MBL-associated serine proteases 1 and
2 (MASP-1 and MASP-2), to acetylated groups and carbohydrates on the surface of
pathogens. MASP-2 cleaves C4 and C2 to form the C3 convertase (C4b2a). Spontaneous
low-level hydrolysis of C3 in plasma leads to formation of C3b and subsequent activation
of the AP. The C3b binds factor B (homologous to C2) to form a C3bB complex.
Subsequent cleavage of factor B by factor D forms the alternative pathway C3 convertase
(C3bBb). C5 convertases (C3bBbC3b) for the AP and C4bC2aC3b for the CP and LP
cleave C5 and initiate the terminal pathway resulting in assembly of the membrane-attack
complex (Beltrame et al., 2015).
Page 37
22
1.10.1.1 Classical pathway (CP)
The CP is also known as the antigen-antibody dependent pathway because C1q binds to
the Fc region of IgG and IgM. However, the CP also activates when the C1q binds to the
surface of a wide variety of microbes and apoptotic cells, even in the absence of
antibodies (Gaboriaud et al., 2004). C1q is composed of six N-terminal collagen-like arms
with C-terminal immunoglobulin-binding globular head domains (Figure 1-7) (Melis et
al., 2015). C1q binds to pathogens or altered-self surfaces, and immune molecules and
lead to the autocatalysis of associated serine protease C1r followed by cleavage of
proenzyme C1s to form activated C1s (Wallis et al., 2010, Forneris et al., 2012). C4 is a
substrate of C1s and it is cleaved to generate C4a and C4b, C4a is an anaphylatoxin,
whereas, C4b binds covalently to the surface of the pathogens. C2 then binds to the C4b
fragment and is cleaved by C1s to form C2a and C2b. C2a binds to C4b to make the C3
convertase complex, C4b2a (Wallis et al., 2010). The C3 convertase cleaves C3 to
generate C3b and C3a, the latter is another anaphylatoxin. C3b deposits on the cell
surface, where it serves as an opsonin and also forms the C5 convertase, C4b2aC3b. C5
is cleaved by the C5 convertase into C5b and C5a, C5b binds to C6 , C7 , C8 and multiple
copies of C9 to form the MAC (Celik et al., 2001).
Page 38
23
Figure 1-7: Schematic representation of human C1q and human IgG showing how
C1q binds to IgG on the pathogen surface.
The highlighted light green region in IgG represents the C1q binding residues D270,
K322, P329 and P331 in the CH2 domain of IgG. C1 is composed of the multimeric
pattern recognition molecule C1q and a heterotetramer of proteases C1r and C1s. C1q has
six globular heads each with an Fc binding region (Melis et al., 2015).
1.10.1.2 Lectin pathway (LP)
Matsushita and Fujita discovered the LP in 1992 (Beltrame et al., 2015). It plays a key
role in the innate immune response (Rosbjerg et al., 2014). MBL, CL-L1 and CL-K1,
together with H-ficolin, M-ficolin and L-ficolin are the pattern-recognition molecules of
the LP (Kjaer et al., 2013, Matsushita et al., 2013). Similar to C1q, the N-terminal region
of all LP recognition molecules contains a collagen-like domain, however, the C-terminal
recognition domains are different from C1q. Collectins including MBL contain C-type
carbohydrate recognition domain (CRD), which recognises patterns of carbohydrates
including glucose, mannose, and N-acetyl-glucosamine via Ca+2-dependent interactions
(Thielens et al., 2001). Ficolins possess a C-terminal fibrinogen-like domain, which binds
to N-acetyl groups, on sugars such as N-acetyl-glucosamine, on the pathogens surface.
Ficolins and collectins bind MASPs to activate the LP. During complement activation by
the LP, MASP-1 cleaves MASP-2 and MASP-2 subsequently cleaves C4 and C2
(Frederiksen et al., 2005, Krarup et al., 2004). When MBL/MASP-2 or ficolin/MASP-2
complexes bind to the surface of a pathogen, MASP-2 activates through autolysis or via
MASP-1 (Heja et al., 2012). The C4 is cleaved by the activated MASP-2 into C4a and
C4b and the C4b binds to the pathogen surface. MASP-2 also cleaves C2, and the C2a
Page 39
24
fragment binds to C4b producing the C3 convertase (C4bC2a). The cascade continues as
previously described for the CP through C5 convertase to the terminal pathway (Heja et
al., 2012). Structurally MASPs comprise two N-terminal CUB domains, separated by an
EGF-like domain, two CCP modules and a serine protease domain at the C-terminus
(Figure 1-8) (Gingras et al., 2011).
Figure 1-8: Schematic representation of MBL-MASPs binding to a pathogen
surface.
MBL is shown associated with the MASPs protease. It is shown in the activated state
resulting from pathogen binding. The MASPs needs Ca+2 ion to be activated as shown in
magenta circles. The carbohydrate recognition domain (CRDs) bind to sugars on the
pathogens surface (Hohenester, 2011).
Page 40
25
1.10.1.3 Alternative pathway (AP)
In contrast to the CP and the LP, the AP is constitutively active and interacts with cell
surfaces without depending on pathogen-recognition molecules (Sahu et al., 1994). AP
activation begins in the fluid phase where C3 (H2O) is formed by hydrolysis of C3. C3
(H2O) binds to factor B (CFB), which is cleaved, by the factor D (CFD) to form the fluid
phase C3 convertase (C3 (H2O) Bb) (Borza, 2016). This enzyme cuts C3 into C3a and
C3b, the later interacts with amine and carbohydrate groups on cell surfaces and engages
CFB (Borza, 2016). This complex then binds with another C3b to form the C5 convertase
component (Pangburn and Müller-Eberhard, 1986). All these steps are shown in (Figure
1-6).
1.10.1.4 Terminal pathway (TP)
Activation of the TP is induced by the formation of C5 convertase (C4b2aC3b and
C3bBbC3b) that cleaves C5 to C5a and C5b. C5b initiates the formation of MAC by
binding to C6 and C7 to make the hydrophobic complex C5b67, which inserts into the
lipid bilayers. After that C5b67 interacts with C8 and allows binding and polymerisation
of C9 to make the MAC pore-forming complex (Figure 1-6). This has a hydrophilic inner
surface and an outer hydrophobic surface that allows water and solutes to freely pass
across the cell membrane resulting in loss of membrane permeability and eventually lysis
of the cells (Lambris et al., 2008).
1.11 Ficolins
Ichijo et al. first discovered ficolins as the transforming growth factor β-binding protein
from porcine uterus in 1991 (Ichijo et al., 1991). Activation of the LP by ficolins results
in cell lysis, opsonisation, phagocytosis, and cytokine production (Endo et al., 2015).
Ficolins are structurally similar to Mannose-binding lectin (MBL) and collectins (Zhang
and Ali, 2008) but contain fibrinogen-like domains in place of CRDs of collectins
(Matsushita and Fujita, 2001). Three different ficolins have been identified in the human
plasma: ficolin-1 (FCN-1), ficolin-2 (FCN-2) and ficolin-3 (FCN-3) also known as M-
ficolin, L-ficolin and H-ficolin respectively (Bidula et al., 2013). M-ficolin and L-ficolin
share 80% sequence identity, whereas H-ficolin has ~50% amino acid identity with both
(Kilpatrick and Chalmers, 2012). Only two types of ficolins have been discovered in the
mouse and other rodents, ficolin-A (Fcn A) and ficolin-B (Fcn B). These are homologues
of L-ficolin and M-ficolin in humans, respectively (Endo et al., 2012). Two ficolins have
Page 41
26
also been identified in pigs, called ficolin-α and ficolin-β (Ichijo et al., 1993). Ficolins
interact with the MASP-1 and MASP-2 in the presence of Ca2+ (Cseh et al., 2002). M-
ficolin, L-ficolin and H-ficolin serum concentrations are ~1.4 μg/ml, 3.4 μg/ml and 25
μg/ml respectively (Verma et al., 2012).
1.11.1 Human M-ficolin
M-ficolin is also known as FCN-1 or L-ficolin/p35-related protein. This ficolin was
identified in 1996 as a by-product during human FCN-2 characterization (Endo et al.,
1996, Lu et al., 1996). The M-ficolin gene is FCN-1, which is located on chromosome 9
(9q34) (Endo et al., 1996). It is expressed in leukocytes and lung, therefore, has been
described as a non-serum ficolin (Liu et al., 2005) but it is not expressed by macrophages
or monocytic dendritic cells (Lu et al., 1996, Hashimoto et al., 1999). Human M-ficolin
activates the LP through the formation of complexes with MASP-1 and MASP-2 (Liu et
al., 2005). It is also found associated with Map-19, which is also known as sMAP. It is
formed by alternative splicing of the primary transcript of the MASP-2 gene (Endo et al.,
2005). M-ficolin can bind to several carbohydrate ligands on microbes, surface including
GlcNAc, N-acetylgalactosamine, and sialyl-N-acetyllactosamine (Liu et al., 2005).
1.11.2 Human H-ficolin
H-ficolin is a serum ficolin discovered in 1978 (Matsushita et al., 2002). Also known as
FCN-3, Hakata-antigen or β2-thermolabile macro glycoprotein, it was found in the sera
of patients with systemic lupus erythematosus. H-ficolin activates the LP in association
with MASP-1, MASP-2, and MASP-3 (Matsushita, 2013). The H-ficolin gene was cloned
and characterized in 1998 (Sugimoto et al., 1998). The mRNA of H-ficolin is expressed
in liver and lungs (Sugimoto et al., 1998). H-ficolin exists as a mixture of different sizes
of oligomers (Yae et al., 1991). Like other ficolins, H-ficolin recognizes the N-acetyl
groups and has been shown to bind to Aerococcus viridians and Hafnia alvei
polysaccharide and lipopolysaccharides (Zacho et al., 2012). It has been suggested that
IgM interacts with H-ficolin in tumor cell immunosurveillance and this mediates
complement activation to defend against tumors (Lei et al., 2015).
1.11.3 Human L-ficolin
Independent studies first described L-ficolin as an elastin-binding protein (EPB-37) and
as a corticosteroid-binding protein (hucolin) (Edgar, 1995, Harumiya et al., 1995).
Matsushita et al. first purified L-ficolin from serum in 1996 (Matsushita et al., 1996). L-
Page 42
27
ficolin is also known as ficolin-2, P35, EBP-37 or hucolin. L-ficolin is encoded by the
FCN-2 gene on chromosome 9 (9q34), which contains eight exons and is composed of
314 amino acid residues (Edgar, 1995, Endo et al., 2011, Zhao et al., 2013, Endo et al.,
1996, Matsushita et al., 1996). Liver hepatocytes synthesise L-ficolin and it is present in
the blood stream at a concentration 1.4 μg/ml (Verma et al., 2012).
The L-ficolin polypeptide has a molecular mass of 35 kDa (Matsushita et al., 1996) and
it assembles into tetramers of trimers, with a total of 12-subunits (Hummelshoj et al.,
2007). The N-terminal region contains two cysteine residues (Cys7 and Cys27) followed
by a collagen-like domain, which is composed of 69 amino acid residues: 15 Gly-X-Y (X
and Y representing any amino acid) repeats. The C-terminal fibrinogen-like domain
contains 209 amino acids (Hummelshoj et al., 2007).
L-ficolin binds to acetylated compounds, such as GlcNAc, β-1-3-D-glucan and DNA
(Kuraya et al., 2005). It also binds to non-saccharide N-acetylated compounds such as,
N-acetyl-glycine and N-acetyl-cysteine. Moreover, L-ficolin binds to the lipoteichoic
acid cell wall components of Gram-positive bacteria (Lynch et al., 2004). Recent studies
reported that L-ficolin binds to the teichoic acid of the Streptococcus pneumoniae
(Vassal-Stermann et al., 2014). Besides its lectin properties, L-ficolin has been reported
to bind to elastin, corticosteroids and DNA (Harumiya et al., 1995, Edgar, 1995).
Furthermore, recent studies showed that L-ficolin binds to DNA and heparin via the
sulphate and phosphate groups at the S3 ion binding site of the L-ficolin (Laffly et al.,
2014).
L-ficolin binds to a variety of bacteria including Streptococcus pneumoniae serotype
11F, 11A and 11D (Krarup et al., 2005), Staphylococcus aureus serotype 1, 8, 9, 11, and
12 and Salmonella typhimurium (Aoyagi et al., 2005). L-ficolin also binds to the
unencapsulated pneumococcal strain R6 (Vassal-Stermann et al., 2014) and the
encapsulated strain serotype 2 D39 (Ali et al., 2012). In addition, studies have
documented that L-ficolin recognises Mycobacterium tuberculosis and Mycobacterium
bovis (Luo et al., 2013). L-ficolin also binds the 1, 3-β-D-glucan structures exist on yeast
and fungal cell wall (Ma et al., 2004). A recent study has highlighted the key role of L-
ficolin in innate defence against Aspergillus, causing opsonophagocytosis by
macrophages and neutrophils. It also leads to killing of fungi, by inducing the production
of cytokine during infection (Bidula et al., 2015). L-ficolin can also recognise HCV
Page 43
28
envelope glycoproteins E1 and E2 to activate complement and mediate cytolytic activity
in HCV-infected hepatocytes (Liu et al., 2009).
1.12 Mouse ficolins
Two types of ficolin are produced in mice and other rodents: ficolin-A and ficolin-B.
1.12.1 Ficolin-A
Ficolin-A is highly expressed in the liver and spleen. It is a polypeptide of molecular mass
37 kDa. Like other mammalian ficolins, it binds to acetylated compound such as GlcNAc
(Fujimori et al., 1998) and activates complement system via binding to MASP-2. By
contrast, mouse ficolin-B does not bind MASPs or activate complement (Endo et al.,
2005). As a result of alternative splicing of the ficolin-A gene, two types of ficolin-A
exist in the serum called ficolin-A and ficolin-A variant. The latter is composed of a
shorter collagen-like domain and has an eight amino acids (Endo et al., 2005). Infection
studies, revealed that both ficolins played a crucial role against pneumococcal infection
(Endo et al., 2012), with mice deficient in ficolin-A and ficolin-B having reduced survival
when infected transnasally with Streptococcus pneumoniae D39. Ficolin-A is often
referred as the mouse orthologue of human L-ficolin. It binds to GlcNAc, GalNAc and
elastin (Fujimori et al., 1998, Girija et al., 2011). It also binds various microorganisms
including Gram-positive and Gram-negative bacteria and fungal cells. Gram-positive
bacteria include Enterococcus faecalis, Listeria monocytogenes and some
Staphylococcus aureus strains, but not Streptococcus agalactiae. Gram-negative targets
include E. coli and Pseudomonas aeruginosa strains, but not Salmonella strains. Ficolin-
A also binds to clinical isolates of Aspergillus fumigatus (Hummelshoj et al., 2012).
1.12.2 Ficolin-B
Ficolin-B was first characterised in 1998. Ficolin-B mRNA is highly expressed in bone
marrow and weakly expressed in spleen (Ohashi and Erickson, 1998). It is a homologue
of human M-ficolin and like M-ficolin is found within the lysosomes of activated
macrophages (Endo et al., 2005, Runza et al., 2006, Endo et al., 2004). Ficolin-B binds
to acetylated sugars, including GlcNAc and GalNAc and it binds specifically to silalic
acid residues (Endo et al., 2005, Girija et al., 2011). Mouse ficolin-B cannot associate
with MASPs or activate the LP (Endo et al., 2005). However, rat ficolin-B is able to bind
to MASP-2 to activate the LP of rat (Girija et al., 2011). Another study has reported that
N-linked glycosylation is required for oligomerization of ficolin-B and its association
Page 44
29
with MASPs/sMAP to deposit C4b on immobilized N-acetylglucosamine (Endo et al.,
2012).
1.13 Genetics of ficolins
M-ficolin and L-ficolin genes are both located on the chromosome 9q34. M-ficolin is
mainly expressed by monocytes and neutrophils, whereas, L-ficolin is expressed by the
liver hepatocyte cells and secreted to the blood stream (Teh et al., 2000, Garred et al.,
2010). H-ficolin is encoded by the FCN-3 gene is located on chromosome 1p36.11 and
expressed by the liver and lungs (Kilpatrick and Chalmers, 2012, Ruskamp et al., 2009).
An overview of the three human ficolins is shown in (Table 1-2). M-ficolin contains 326
amino acid residues whereas; L-ficolin and H-ficolin comprise 313 and 299 amino acids
respectively, including the signal peptide (Boldt et al., 2013, Mason and Tarr, 2015).
Table 1-2: A schematic outline of three human ficolins (M-ficolin, L-ficolin and H-
ficolin).
Information was taken from the (Mason and Tarr, 2015).
FCN-1 FCN-2 FCN-3
Proteins name
Ficolin -1 or M ficolin Ficolin-2 or
L-ficolin
Ficolin-3 or H-
ficolin
Chromosome
9p34 9p34 1p36.11
Exon
9 8 8
Tissue
expression
Monocyte and
Neutrophil
Liver Liver and Lung
Serum
concentration
µg/ml
1.07 μg/ml 3.7–5.4 μg/ml ~26 μg/ml
Amino acid
residues
326 313 299
The M- and L-ficolin genes consist of eight exons, whereas H-ficolin comprises nine
exons. The signal sequence and the first nine N-terminal residues are encode by the first
exon, the collagen-like domain is encoded by the second and third exon, the fourth exon
encodes a short linker and exon five to eight (or nine) encode the fibrinogen-like domain
(Kilpatrick and Chalmers, 2012, Mason and Tarr, 2015). Figure 1-9 shows a schematic
Page 45
30
representation of the human ficolin genes: FCN-1, FCN-2 and FCN-3 (Mason and Tarr,
2015).
Figure 1-9: Schematic representation of human ficolin genes FCN-1, FCN-2 and
FCN-3.
The FCN-2 and FCN-3 genes composed of eight exons, whereas, FCN-1 consists of nine
exons (Mason and Tarr, 2015). Monomeric ficolin composed of N-terminal cysteine
region, collagen like domain, linker region and fibrinogen like domain.
The variants in the promoter region of FCN gene leads to polymorphisms in the FCN
genes that may impact the serum concentrations and/or activity of the encoded ficolins.
Three gene polymorphisms at positions -986 A/G, -602 G/A, and -4 A/G in the promoter
region of FCN-2 affect the concentration of L-ficolin in the serum, whereas two
polymorphisms at positions 6359C/T and 6424G/T in exon 8 of FCN-2 gene impacts the
GlcNAc binding capacity towards N-acetylglucosamine (Hummelshoj et al., 2005,
Cedzynski et al., 2007). Some polymorphisms are associated with disease. For example,
FCN-2 -557 A/G, -64 A/C and +6424 G/T SNPs are associated with the pulmonary
tuberculosis (Luz et al., 2013, Xu et al., 2015).
Page 46
31
1.13.1 Structure of ficolins
Ficolins are multimeric proteins, consisting of polypeptides of 34-40 kDa. Human L-
ficolin is composed of tetramers of a trimeric subunit, with 12-polypeptide chains, each
of 35 kDa (Figure 1-10). H-ficolin contains more than 18 polypeptide chains (Yae et al.,
1991). Each ficolin polypeptide is composed of a short N-terminal region containing
cysteine residues; a central collagen-like domain with Gly-X-Y repeats, a short linker
region and a C-terminal fibrinogen-like domain (Figure 1-10 A) (Matsushita et al., 1996,
Tanio et al., 2007).
Figure 1-10: Schematic diagram of ficolin structure and domain organisation.
(A) Shows a ficolin monomer, which comprises an N-terminal cysteine region, a
collagen-like domain and fibrinogen-like domain. (B) A ficolin polypeptide chain. (C) A
ficolin trimeric subunit that contains three fibrinogen-like domains within a C-terminal
head. (D) Four trimeric subunits in a tetramer. Disulphide bonds via the N-terminal
cysteine-rich domains hold subunits together (Garred et al., 2016).
1.14 Ficolins and disease
High levels of L-ficolin are found in patients with chronic hepatitis C virus (Hu et al.,
2013). It has been suggested that L-ficolin neutralises hepatitis C virus by binding to
envelope glycoproteins E1 and E2 (Hamed et al., 2014, Zhao et al., 2014). Hoang et al.
Cysteine-rich region
Collagen like-domain
Linker
Fibrinogen like-domain
Polypeptide chain
Structure trimeric subunit
Oligomer
A
B
C
D
Page 47
32
reported that patients with hepatitis B virus had higher levels of L-ficolin in their serum
compared with those with hepatocellular carcinoma (Hoang et al., 2011). Serum L-ficolin
levels may be a useful indicator for chronic hepatitis B infection, hepatocellular
carcinoma and cirrhosis (Chen et al., 2015). A recent study has suggested that L-ficolin
prevents the entry of HIV-1 into cells by binding to the envelope glycoprotein gp120 and
serum levels of L-ficolin are higher in HIV patients than the normal population (Luo et
al., 2016). It has been documented that both L-ficolin and H-ficolin prevent Influenza A
virus infection in vitro and in vivo by binding to hemagglutinin and neuraminidase
(Verma et al., 2012, Pan et al., 2012). M-ficolin has been shown to interact with surface
glycoproteins of Zaire Ebola virus (Favier et al., 2016).
Beside the relation between ficolins and viral infections, many studies have shown that
neutralisation of ficolins play a key role in parasite diseases. For example, Trypanosoma
cruzi calreticulin inhibits activation of the CP, as a result of interacting with C1 and the
LP by binding to L-ficolin (Valck et al., 2010). In this way Trypanosoma cruzi blocks
two major arms of the innate immune response (Sosoniuk et al., 2014). Another study has
shown that L-ficolin polymorphisms lead to increasing the susceptibility to leishmaniasis
(Assaf et al., 2012).
A variety of other studies have highlighted disease associations involving ficolins. For
example, it has been reported that L-ficolin serum concentrations are decreased in patients
infected with pulmonary Mycobacterium tuberculosis (Luo et al., 2013). Deficiency of
H-ficolin leads to lack of complement deposition on acetylated structures and is
associated with chronic disabling infections and lung damage (Munthe-Fog et al., 2012).
H-ficolin concentrations are also decreased in patients with Crohn's disease or ulcerative
colitis (Schaffer et al., 2013). M-ficolin concentration in patients with rheumatoid arthritis
was 30-fold higher than those with osteoarthritis (Ammitzboll et al., 2012).
1.15 Humoral immunity
Antibodies are produced by B-cells and mediate humoral immunity through
neutralisation and opsonisation of extracellular pathogens (Kalia et al., 2006). B-cells
mature and develop in the bone marrow (Kierney and Dorshkind, 1987, Kurosaka et al.,
1999). Antibody production is the only effector function of B-cells and different
antibodies are produced according to their specificity towards antigen.
Page 48
33
1.15.1 Antibody structure
Immunoglobulins (Ig) are heterodimeric glycoproteins produced by specialized B-
lymphocytes known as plasma cells (Schroeder Jr, 2010, Lipman et al., 2005). IgGs are
composed of four polypeptide chains with two identical heavy chains (~55 kDa) and two
identical light chains (~25 kDa) assembled to form a Y-shaped structure held together by
disulfide and non-covalent bonds (Figure 1-11). The resulting molecule is ~150 kDa
(Schroeder Jr, 2010, Lipman et al., 2005). In 1890, von Behring and Kitasato reported
that diphtheria toxin can neutralize the existence of an agent in the blood followed by
known as ‘Antikorper’ or antibodies, it was described as the agent that able to
discriminate between two immune substances (Schroeder Jr, 2010). Structurally each
antibody heavy chain comprises one N-terminal variable domain (V) which serves as the
antigen-binding site and three C-terminal constant domains (C). Each light chain
comprises a variable domain and a constant domain. Together the variable domains serve
as the antigen-binding sites. Each arm of the antibody is known as Fab fragment, while
the central stem is called the Fc portion and it interacts with effector cells and receptors.
Each Ig domain consists of approximately 110-130 amino acids, (Schroeder Jr, 2010,
Wang et al., 2007).
Page 49
34
Figure 1-11: Schematic diagram of Ig structure.
The heavy and light chains consist of N-terminal variable (V) domain coloured blue and
cyan. The remaining domains form the constant region, with domains coloured as red and
green. The hinge region is located between CH1 and CH2. Proteolytic enzymes (including
IdeS, Papain and Pepsin) are able to split the Ig into Fab domains containing the antigen-
binding site and Fc domains that mediate activation of the CP and phagocytosis.
1.15.2 Ig isotypes
There are five Ig or isotypes of Igs: IgG, IgM, IgA, IgD, and IgE. All isotypes are
assembled from Ig domains but they differ in the sequences of the constant regions of
their heavy chains (Woof and Burton, 2004). Key features of each group are described
below. Table 1-3 below shows the general features of each IgG isotype (Vidarsson et al.,
2014).
1.15.2.1 Immunoglobulin G (IgG)
IgG is the predominant Ig isotype in human serum (Vidarsson et al., 2014). It comprises
10-20% of the protein in the plasma. IgG a glycoprotein with 82-96% protein and 4-18%
carbohydrate. IgG has the longest serum half-life of all isotypes (Schroeder Jr, 2010,
Vidarsson et al., 2014). It is classified into four subclasses: IgG1, IgG2, IgG3, and IgG4,
S-S
S-S
CH2 CH2
CH3 CH3
Fc domain Fc domain
Fab domain Fab domain
Hinge region
COO - COO -
H3N + +NH3
CO
O - C
OO
- S-S
S-S
VH
VH
VL
VL
CL
CL
CH 1 CH1
Antigen binding site Antigen binding site
+H3N +NH3
Page 50
35
ranked according to their average serum concentration (IgG1> IgG2> IgG3> IgG4) in the
blood of normal, healthy individuals (Schroeder Jr, 2010, Liu and May, 2012). IgG
isotypes IgG1, IgG2, IgG3, and IgG4 account for approximately 60%, 25%, 10%, and
5% of IgG in blood, respectively (Stoop et al., 1969). An N-linked glycosylation site in
all IgG molecules is located in the CH2 domain at Asn-297. It plays a key role in
maintaining the quaternary structure and in the stability of the Fc domain (Mimura et al.,
2000, Mimura et al., 2001, Krapp et al., 2003). Some studies have reported differences in
the glycosylation pattern of each isotype (Selman and Hansen, 2012, Vestrheim et al.,
2014). The number of disulphide bonds differs in each isotype. The disulphide bond in
the hinge region of each IgG isotypes is different. In IgG1 and IgG4 is two, IgG2 has
four disulphide bonds and IgG3 has eleven disulphide bonds (Liu and May, 2012). The
hinge region of each isotype is different with 15, 12, 62 amino acid residues for IgG1,
IgG2, IgG4 and IgG3 (Vidarsson et al., 2014). The hinge region determines the stability,
flexibility and distances spanned by the two Fabs (Tian et al., 2014).
1.15.2.1.1 IgG1
IgG1 is the predominant IgG subclass and constitutes (10-15 mg/ml) in human serum
(Mimura et al., 2000, Mimura et al., 2001). The IgG1 half-life is 3 weeks, whilst, the
IgG3 has the shortest half-life of about only 1 week (Dullaers et al., 2012). A deficiency
of IgG1 is associated with recurrent infections (Jefferis and Kumararatne, 1990). Serum
IgG1 concentrations are increased in Sjogren syndrome, systemic sclerosis, systemic
lupus erythematosus and primary biliary cirrhosis diseases (Zhang et al., 2015). IgG1
contains fucosylated N-linked sugar whilst IgG3 showed a non-fucosylated glycoforms.
Activation of the complement cascade by IgG1 play a crucial role in protection of the
human body against infectious agents (Redpath et al., 1998). It has been reported that the
IgG1 and IgG3 are the most efficient IgG isotypes for activating the complement system
via the CP by binding to C1q (Bruggemann et al., 1987). Mutations in residues Asp 270,
Leu 334, Leu 335 leads to a reduction in complement activation (Michaelsen et al., 2009).
1.15.2.1.2 IgG2
IgG2 accounts for 25% of the total IgG in human blood. It plays a crucial role in
protection against Streptococcus pneumoniae, Haemophilus influenzae, and Neisseria
meningitidis. IgG2 deficiency may result in the virtual absence of IgG anti-carbohydrate
antibodies (Vidarsson et al., 2014). The concentration of IgG2 is decreased in association
Page 51
36
with a decreasing levels of IgG4, IgA1 and IgA2 (Latiff and Kerr, 2007). IgG2 can
activate the complement system but is considerably less efficient than IgG1 and IgG3
(Burton et al., 1986, Michaelsen et al., 1991).
1.15.2.1.3 IgG3
IgG3 comprises approximately 10% of the total serum IgG. It has a unique elongated
hinge region containing ~62 amino acid residues (Stoop et al., 1969, Michaelsen et al.,
1977) and is efficient at activating complement. The hinge region is encoded by four
exons in IgG3 while only one exon encodes the hinge regions of IgG1, IgG2, and IgG4.
IgG3 has a higher molecular weight compared to other subclasses because of its hinge
region (Vidarsson et al., 2014). IgG3 is encoded by 13 allotypes, which are the alleles
encoding the antibody chain, while IgG1, IgG2, are encoded by 4 allotypes respectively
(Lefranc and Lefranc, 2012). IgG3 has a short half-life of ~7 days. This reduction is
associated with an arginine at position 435, which is histidine in all other IgG subclasses
(Irani et al., 2015). IgG3 deficiency is associated with recurrent respiratory infections
including sinusitis (Meyts et al., 2006, Visitsunthorn et al., 2011). The concentration of
IgG3 is increased in patients with Mycobacterium Leprosy (Hussain et al., 1995).
1.15.2.1.4 IgG4
IgG4 comprises only ~5% of IgG in serum (0.35 to 0.51 mg/ml) (Aalberse et al., 2009,
Aalberse and Schuurman, 2002, Aucouturier et al., 1984, Kleger et al., 2015). The hinge
region consists of 12 amino acid residues. Unlike all other IgGs, IgG4 can undergo Fab-
arm exchange (FAE) in which a bi specific antibody formed (Davies and Sutton, 2015).
In this process, the IgG4 heavy chains separate to form half-molecules containing only
one heavy and light chain. The half-molecules from separate antibodies associate to
produce a bi-specific antibody (Aalberse and Schuurman, 2002). This contributes to the
anti-inflammatory properties of IgG4 and limits the ability of IgG4 to form immune
complexes and activate complement (Aalberse and Schuurman, 2002). A recent study
reported that up to 33% of IgG4 molecules were κ/λ light-chain hybrids (Young et al.,
2014). The constant region of IgG4 regions shows 95% amino acid sequence homology
to the other IgG subclasses. However, IgG4 binds only weakly to Fcγ receptors, and can
not activate complement. IgG4 is associated with autoimmune diseases such as
pancreatitis (Kleger et al., 2015). The level of IgG4 is elevated in some cases of infectious
bacterial paortitis (Zakir et al., 2015).
Page 52
37
Table 1-3: Human IgG isotypes characteristic.
General property IgG1 IgG2 IgG3 IgG4
Molecular weight (kDa) 146 146 170 146
Amino acids in hinge region 15 12 62 12
Heavy chain disulphide bonds 2 4 11 2
Serum level g/l 6.98 3.8 0.51 0.58
Relative abandance % 60 25 10 5
Half-life weeks 3 3 1 3
Complement activation (C1q binding) ++ + +++ -
Ab response to proteins ++ +/- ++ ++
Ab response to polysacharides + +++ +/- +/-
Ab response to allergens + - - ++
1.15.2.2 Immunoglobulin A (IgA)
IgA is the second most abundant serum antibody after IgG. It is present in plasma at a
concentration of ~2 mg/ml, (Roos et al., 2001, Schroeder Jr, 2010). IgA is predominantly
secreted and produced by the mucosal surfaces. It is found in secretions such as saliva
and breast milk. It protects the body against inhaled and ingested antigens (Leusen, 2015,
Carlier et al., 2016). IgA exists as two forms according to location and production.
Mucosal secreted IgA (IgA2) is predominantly dimeric while serum IgA (IgA1) is
monomeric. Therefore, the function of IgA is likely to be different according to its
location. For example, intestinal IgA (a mucosal IgA) is able to neutralize toxins and
some pathogens, it also provides a different and spatially diversified population of
commensal bacteria (Gutzeit et al., 2014). In addition, the secreted IgA which is present
in human colostrum and milk play a key role in both passive and active immune
protection of the newborn (Woof and Kerr, 2006). IgA1 has an extra 13 amino acid
residues in the hinge region (Carlier et al., 2016, Leusen, 2015, Cerutti and Rescigno,
2008). This elongated hinge prevents recognition by bacterial proteases. IgA2 is more
sensitive to these proteolytic enzymes (Schroeder Jr, 2010 Carlier et al., 2016).
Page 53
38
1.15.2.3 Immunoglobulin E (IgE)
Ishizaka and Ishizaka identified IgE in 1967 (Poole and Rosenwasser, 2005). IgE is
normally present in the plasma at a concentration of less than 1 µg/ml with half-life of
about 2 days in serum. It consists of only 0.004% of total Ig in serum (Amarasekera, 2011,
Stone et al., 2010, Hamilton, 2010). IgE provides immunity against parasites such as
helminths. In addition, it mediates type I hypersensitivity reactions associated with
allergic diseases including asthma, allergic rhinitis and atopic dermatitis (Fitzsimmons et
al., 2014, Wu and Zarrin, 2014).
1.15.2.4 Immunoglobulin D (IgD)
IgD was discovered in 1965. Serum concentrations of IgD are below IgG, IgA, and IgM
but higher than IgE. It represents approximately 0.25% of total Ig in serum (40 µg/ml in
adults) and has a short half-life of about 2 days (Vladutiu, 2000, Rogers et al., 2006). IgD
is expressed as two forms: membrane IgD (mIgD) and secreted IgD (sIgD), mIgD is co-
expressed with IgM in ~90% of mature B-cells (Wu et al., 2016b). In B cells, IgD serves
as the B cell receptor and signals the B cells to become activated. Once activated it
stimulates the cell to produce antibodies (Ubelhart et al., 2015). The hinge region of IgD
is long and susceptible to proteolysis (Gleich et al., 1969, Sire et al., 1982). The serum
concentration of sIgD is elevated in some autoimmune diseases including rheumatoid
arthritis, systemic lupus erythematosus, Sjogren's disorder and autoimmune thyroiditis
(Rostenberg and Penaloza, 1978, Schmidt and Mueller-Eckhardt, 1973).
1.15.2.5 Immunoglobulin M (IgM)
IgM is considered to be an ancient antibody class, which exists in all vertebrates, except
coelacanths, and is important in innate and adaptive immunity in fish (Pleass et al., 2016).
Two types of IgM are present in the immune system: membrane-bound receptors on B-
cells (mIgM) and secreted IgM (sIgM). The plasma concentration of IgM is 1-2 mg/ml,
with a half-life of 5 days. The sIgM molecules are predominantly pentamers and
hexamers, while the mIgM is monomeric (Czajkowsky and Shao, 2009, Czajkowsky et
al., 2010, Ehrenstein and Notley, 2010). It serves as an opsonin for the clearance of small
apoptotic particles, senescent erythrocytes, and even microbes (Racine and Winslow,
2009). IgM activates complement via the CP. It has a 1000-fold greater binding affinity
for C1q than IgG (Ehrenstein and Notley, 2010). CP activation on apoptotic cells occurs
predominantly via IgM (Zwart et al., 2004). A recent study reported that ethanol-induced
Page 54
39
apoptosis in the liver recruits sIgM, facilitating the activation of C1q via the CP (Smathers
et al., 2016).
1.16 Biological membrane
Biological membranes are the semi-permeable barrier surrounding all living cells that
mediates the exchange of intracellular and extracellular components (Bovigny et al.,
2015). They are composed of a bilayer of different phospholipids, proteins and sugars.
Lipid molecules can be divided into three main types: phospholipid, glycolipids and sterol
(Figure 1-12) (Watson, 2015). Membrane phospholipids are amphiphilic due to the polar
head group that has a high affinity for water molecules (hydrophilic) and the non-polar
tail group that has a low affinity for water molecules (hydrophobic). The hydrophilic head
group is oriented outwards on the outer leaflet and inwards on the inner leaflet of the lipid
bilayer, whereas the hydrophobic tails points to the interface between the bilayer leaflets.
Figure 1-12: Schematic representation of membrane lipid types.
Membrane has three types lipid including a phosphatidylcholine (a), glycolipid (b) and a
sterol (c) (Watson, 2015). Phosphatidylcholine composed of hydrophilic head (choline,
phosphate and glycerol) and hydrophobic tails which might be saturated or unsaturated.
Glycolipid comprises of hydrophilic head (sugar and glycerol) and hydrophobic tails.
Steroid as well composed of hydrophilic head and hydrophobic tail.
Page 55
40
The fluid-mosaic model is used to describe the properties of biological membranes. The
model was proposed in 1972 by Singer and Nicolson based on the thermodynamic
principles governing the organization of lipids and proteins in a membrane (Nicolson,
2014). The term, fluid, refers to ability of components to move laterally or diffuse
throughout the bilayer. It has been reported that membrane fluidity is regulated by
cholesterol (Lombard, 2014). The fluid-mosaic model of biological membranes is
illustrated in (Figure 1-13).
Figure 1-13: Schematic representation of fluid-mosaic model of a biological
membrane.
The membrane is composed of the phospholipid bilayers including polar heads and non-
polar tails with the glycolipid, glycoprotein, peripheral protein and integral protein
(Lombard, 2014).
Page 56
41
1.16.1 Structure and biophysical properties of lipid bilayers
1.16.1.1 Lipid molecules
1.16.1.1.1 Phospholipids
Phospholipids comprise the phosphate containing polar head group and fatty acid non-
polar tail group. They can be divided into two types of structures: glycerophospholipids
and sphingomyelins (SM) (Li et al., 2015). Most of the phospholipids in the eukaryotic
cells membrane are the glycerophospholipids which contain a glycerol-2 backbone; this
a long acyl chain that typically contains many gauche orientations of the un saturated
carbon-carbon bonds leads low density packing (Brown and London, 2000). The
backbone is sphingosine in sphingolipids; this contains C16 saturated acyl chain, which
can pack tightly together to produce ordered domains in the fluid membrane (referred to
as lipid rafts). The presence of sphingolipids in a lipid membrane needs higher
temperatures for the main transition compared with membrane comprising pure
glycerophospholipids.
1.16.1.1.2 Cholesterol
Cholesterol is an important constituent of animal cell membranes. More than 90% of
cellular Chol is incorporated into the membrane. It was discovered in 1815 by the French
chemist Michel Eugène Chevreul. Chol is a major determinant of biophysical properties
of a membrane because, when incorporated in the membrane, Chol increases mechanical
strength, affecting membrane elasticity, it makes the membrane less elastic and hence
increases stiffness and the packing density of lipids (Magarkar et al., 2014, Goluszko and
Nowicki, 2005). Chol is an amphiphilic molecule with a polar hydroxyl head group that
is embedded into the acyl chains of the lipid membrane; it also has a rigid core with four
hydrophobic hydrocarbon rings and a flexible acyl tail (Figure 1-14). In addition, Chol
plays a key role in lipid metabolism because it is a precursor for some biological
compounds such vitamin D, steroid hormones and bile acids. Chol facilitates the proper
development and functioning of the nervous system because it is the component of the
myelin sheath (Czamara et al., 2015).
Page 57
42
Figure 1-14: Cholestrol chemical structure.
It is composed of weak hydrophilic hydroxyl head, four hydrophobic hydrocarbon rings
and flexible acyl tail. Image was taken from Avanti polar lipid website
(https://avantilipids.com/product).
1.16.1.2 Liposomes as the membrane model
Liposomes are synthetic vesicles with a bilayer structure surrounding an aqueous core.
They are useful as a membrane model to study how the shape and morphology of the lipid
bilayer is influenced by external factors, including physical, chemical and biological
(Kato et al., 2015). They were first characterized in the 1960s by Alec D Bangham at the
Babraham Institute, University of Cambridge (Bozzuto and Molinari, 2015). The name,
liposome, is derived from the Greek words 'lipos', which means fat, and 'soma', which
means body. Phospholipids are the most common component used in the preparation of
liposomes, followed by Chol and sphingolipids. Phospholipids have a strong tendency to
form membranes because of its amphipathic nature (Bozzuto and Molinari, 2015).
Besides the use of liposomes as a model membrane for biophysical and bioanalytical
research, they are also used in medicine as a drug carrier (Sercombe et al., 2015). Figure
1-15 shows the structure of a liposome, where a liposomal bilayer provides an interface
between the interior content and the surroundings.
Page 58
43
Figure 1-15: Schematic view of a liposome vesicle and a lipid bilayer.
(A) Represents liposome vesicle in which the polar head turns outward whereas, the
nonpolar tail turns inward. B, is the lipid bilayer of liposome (Bozzuto and Molinari,
2015).
Liposomes can be classified based on different parameters: firstly, their method of
preparation which includes reverse-phase evaporation and extrusion; secondly, their size
which encompasses small (<100 nm), intermediate (100 nm to 1 m) and large (>1 m)
unilamellar vesicles; and, finally, lamellarity which includes unilamellar, multilamellar
vesicles. Either unilamellar or multilamellar could be formed depending on the method
of formation (Bozzuto and Molinari, 2015). Common phospholipids used in the
preparation of liposome is 1,2-dipalmitoyl-sn-glycero-3-phosphocholine (DPPC), 1-
palmitoyl-2-oleoyl-sn-glycero-phosphocholine (POPC), 1,2-dioleoyl-sn-glycero-3-
phosphocholine (DOPC), and 1,2-dilauroyl-sn-glycero-3-phosphocholine (DLPC) and
(Figure 1-16) (Yang et al., 2016). The ratio of phospholipid to Chol that is typically used
in the preparation of liposomal bilayers is approximately 1:1 to 2:1 (e.g. 2 parts of lipids
and 1 part of cholesterol mole ratio or 1:1 mole ratio (Briuglia et al., 2015).
A B Polar head
Non polar tail
Page 59
44
Figure 1-16: Chemical structure of DPPC, POPC, DOPC and DLPC.
All images are taken from Avanti polar lipid website (https://avantilipids.com).
1.16.2 Bilayer melting temperatures (Tm)
The Tm of the bilayer or the main transition temperature is defined as the temperature
corresponding to the highest specific heat of the lipid bilayer. At this temperature, the
physical state of the lipid bilayer is changed from a solid-ordered (gel) phase to a liquid
(fluid) phase. When the temperature is below the Tm the membrane state is a gel, whereas,
the phase behavior is fluid when the temperature is above the Tm. In the gel phase, lipid
molecules are packed in a regular triangular lattice pattern whilst, in the liquid phase the
lipid molecules the regular lattice pattern is lost and the lipid molecules are more loosely
packed together causing an increase in membrane fluidity and permeability to small
molecules (Lewis and McElhaney, 2013). The membrane of most biological cells are in
the liquid phase but the gel phase usually exist in the outer leaflet of cells in dry skin
tissue (Laggner, 2007). The existence of liquid and gel phases of the membrane is
controlled by temperature and the relative amounts of saturated and unsaturated lipids in
the bilayer. The change in the membrane from gel to fluid phase is accompanied by an
DPPC
POPC
DOPC
DLPC
Page 60
45
increase in the hydration state of the lipid head groups (Wolkers et al., 2010). Figure 1-
17 shows the membrane phase according to the increasing temperature.
Figure 1-17: Membrane phase transition with increasing temperature.
Increasing of temperature impact the membrane fluidity. (A) The temperature is below
the Tm, the lipid molecules are packed tightly. (B) Lipid molecules are likely to melt.
Lipids molecule are fully melted and the membrane is changed to the liquid disordered
(Ld) or the fluid phase (Zalba and Ten Hagen, 2017).
1.17 Physical states of lipid bilayer
Individual lipid components in synthetic bilayers are classified according to whether they
are a high-temperature melting phospholipid or a low-temperature melting phospholipid;
where Chol is considered a unique component. At high temperature, the lipids in the
bilayer will be mixed uniformly. Chol is important at lower temperature for the
coexistence of different phases in separated domains in a binary lipid system. A
membrane in the liquid-ordered phase (Lo) is typically enriched in either high-Tm lipids
or Chol; the more ordered structure results in a thick membrane. A membrane in the (Ld)
is enriched in low-Tm lipids and depleted of Chol; the more disordered structure results
in a thin membrane (Veatch and Keller, 2005). The lipids have properties of fast
translational diffusion and low acyl chain order in the (Ld) phase and fast translational
diffusion but high acyl chain order in the Lo phase. In the solid gel phase (Lß), the lipid
molecules have slow diffusion and high chain order.
The lipid example DPPC forms stable and well-characterized unilamellar lipid vesicles.
The equilibrium phase behavior of unilamellar DPPC bilayers show four distinct phases
according to increase temperature such as the crystal (Lc), gel (Lβ), ripple (Pβ), and
fluid or liquid-crystalline (Lα) phases (Nagarajan et al., 2012). It has been shown that
Page 61
46
the interaction between a saturated lipid and Chol or interaction between mono-
unsaturated lipids and Chol results in the presence of Ld and Lo phases of the membrane.
The interaction between DPPC and Chol produces a Lo phase, whereas the interaction
between POPC and Chol produces Ld phase; and a binary mixture of DPPC and POPC
produces a Ld phase (Turkyilmaz et al., 2011). The ternary mixture of DPPC/POPC/Chol
has also been examined to show how the interaction between lipid-lipid and Chol-lipid
changes the membrane phase from Lo to Ld, and the tighter packing of Chol-lipid
combinations to the looser packing of lipid-lipid combinations (Yang et al., 2016).
1.18 General aims of the thesis
This thesis covers three main aims. The first aim was to investigate the interaction
between recombinant Ply and the soluble molecules of the immune system that have been
identified as potential binding partners, including L-ficolin of the LP and IgGs, which
initiate the CP. This work is covered in Chapter 3. The second aim, described in Chapter
4, was to examine the mechanism of pore formation by Ply by characterizing the
interaction between Ply monomers during pore assembly. Following on from this work,
the third aim covered in Chapter 5 was to observe changes in single cell-sized liposomes
by Ply using Raman spectroscopy.
Page 62
47
Chapter 2 Production and purification of Ply and Ply domains
2.1 Objectives
In order to study the interactions between Ply and the soluble molecules of the immune
system, it was necessary to produce recombinant full-length Ply and Ply fragments
comprising PlyD1-3 and PlyD4. The Ply gene was first cloned and sequenced by Walker
and colleagues (Walker et al., 1987). In the current study, His6-tagged full-length Ply and
PlyD1-3 were expressed in Escherichia coli (E. coli) and purified by affinity
chromatography on Ni-Sepharose columns followed by gel filtration. PlyD4 was
expressed as a maltose-binding protein (MBP) fusion and separated from MBP by
cleavage with TEV protease followed by gel filtration.
2.2 Materials and methods
2.2.1 Materials
A plasmid containing the full-length Ply gene in pLEICS-07 (Figure 2-1), a pET-based
expression vector, was provided by Dr. Rana Lonnen (Leicester University UK, MSB
G43). Promega supplied XL10 and BL21 (DE3) E. coli strains competent cells. Platinum
Pfx polymerase for (PCR) was from Life Technologies. Protein and DNA markers and
amylose-Sepharose affinity resin was supplied by New England Biolabs. Filters (0.2 µm),
Ni-affinity resin, Superdex 200 and 75 16/60 columns used for protein purification were
purchased from GE healthcare. Qiagen supplied mini and midi prep plasmid extraction
kits to purify and extract plasmid DNA. The Quickfold protein refolding kit was from
Athena Enzyme Systems. SYBR® Safe DNA gel stain and loading dye were from
Invitrogen. Bugbuster protein extraction reagent was from Merck Millipore. Agilent
Technologies supplied strata clean resin beads. Isopropyl β-D-1-thiogalactopyranoside
(IPTG) and chemicals were purchased from Thermo Fisher Scientific and Sigma.
Protease inhibitor tablets were from Roche.
2.2.2 Electrophoresis
PCR products and digested plasmids were separated by electrophoresis on agarose gels
(0.5-1.5%) prepared as described in (Sambrook and Russell, 2001). 0.5 g/ml of SYBR®
Safe DNA gel stain was added to the gels before pouring. Gels were run in 1x TBE buffer
(45 mM Tris-base, 45 mM boric acid and 1 mM EDTA). DNA samples were diluted 5:1
with 6x loading dye. DNA ladders (100 bp, 1 kb) were used as molecular weight markers.
Page 63
48
Gels were run at 80 V and 400 mA for 60 minutes (min), visualised under UV
illumination and photographed using UV gel documentation system.
2.2.3 Competent cells and transformation
E. coli XL10 Gold cells were used for plasmid amplification and cloning and E. coli BL21
(DE3) were used for protein expression. Competent cells were prepared chemically by
the rubidium chloride method described in section 2.2.4. For cloning, 100-1000 ng of
ligated recombinant plasmid was used while for normal transformation, supercoiled
plasmid (10-50 ng) was used. These were mixed with 100 μl of competent cells, and
incubated on ice for 20 min. Cells were heat-shocked at 42°C for 2 min and then put on
ice for 2 min. 300 μl of Luria-Bertani (LB) was added to the cells. After 60 min incubation
with shaking at 37°C and 220 rpm, the entire content was spread onto LB agar (LBA)
containing the appropriate antibiotic e.g. 100 μg/ml ampicillin or 50 μg/ml kanamycin.
The plates were incubated at 37°C overnight (Li et al., 2011).
2.2.4 Competent cell preparation by the rubidium chloride method
100 ml LB containing 20 mM MgSO4 was inoculated with overnight culture and
incubated for 2-3 hr in a baffled flask until the OD600 reached 0.4-0.6. After that, cells
were spun down at 4500 g at 4°C for 5 min. The pellet was resuspended in 40 ml TBF1
buffer (30 mM potassium acetate, 10 mM CaCl2, 50 mM MnCl2, 100 mM RbCl
containing 15% glycerol at pH 5.8). The suspension was left on ice for 5 min and
centrifuged again at 4500 g at 4°C for 5 min. Next, the pellet was resuspended in 4 ml
TBF2 buffer (10 mM MOPS or PIPES, 75 mM CaCl2, 10 mM RbCl, 15% glycerol at pH
6.5) and left on ice for 30 min. Cells were aliquoted into 100 µl fractions and then frozen
immediately in liquid nitrogen and stored in -80°C. All buffers were sterilized by filter-
sterilize 0.2 µm prior to use (Green and Rogers, 2013).
2.2.5 Sodium dodecyl-polyacrylamide gel electrophoresis (SDS-PAGE)
Proteins were separated by SDS-PAGE using a BioRad mini protein II gel system. In this
procedure proteins are unfolded and coated with SDS and separated based on their sizes.
The resolving gel was prepared by mixing 375 mM Tris-HCl pH 8.8, 15% v/v acrylamide,
0.1% SDS w/v, 0.1% v/v ammonium persulfate and 0.0004% TEMED. The stacking gel
was composed of 125 mM Tris-HCl pH 6.8, 4% v/v acrylamide, 0.1% w/v SDS, 0.002%
ammonium persulfate and 0.0004% TEMED. The resolving gel was set under
Page 64
49
isopropanol to remove air bubbles until the gel solidified. Then the stacking gel was cast
on top and the comb added.
The gel was run in 1x SDS running buffer (25 mM Tris-HCl, 192 mM glycine, 0.1% w/v
SDS). Samples were loaded on the gel by mixing 5 l of 5x loading buffer (250 mM
Tris-HCl pH 6.8, 50% v/v glycerol, 10% w/v SDS, 500 mM DTT, 0.25% w/v
bromophenol blue) with 20 l of each protein sample. Samples were denatured at 95°C
for 5 min before running. Electrophoresis was carried out at room temperature using a
constant voltage (200 V) and variable current for approximately 50 min until the dye front
reached the end of the gel. Gels were stained with Coomassie blue stain (0.4% w/v in
50% v/v methanol and 10% v/v acetic acid) for 15 min, rinsed with water and destained
in (30% v/v methanol containing 7% v/v acetic acid). Gels were scanned with an HP
Scanjet G4010.
2.2.6 Expression and purification of full-length Ply
A recombinant pET-based expression plasmid (pLEICS-07), (Figure 2-1) containing the
full-length gene was transformed into BL21 (DE3) cells. The encoded protein Ply
contains 471 amino acid residues (Figure 2-2). An N-terminal His6-tagged was added for
purification followed by a cleavage site for the Tobacco Etch virus protease (TEV). Cells
were grown in (LB) medium with 50μg/ml kanamycin to an OD600 of 0.5-0.8 at 37C.
Expression was induced with 1mM IPTG, and cells were incubated overnight at 18C.
Page 65
50
Figure 2-1: Vector map of pLEICS-07.
Page 66
51
Figure 2-2: Ply amino acid residues.
Domains 1, 2, 3, and 4 are coloured blue, green, red and black, respectively.
Cells were harvested by centrifugation at 5000 g for 15 min and resuspended in 40 ml
lysis buffer (50 mM Tris-HCl pH 7.5, 150 mM NaCl, 20 mM imidazole, 1% v/v Tween
20 and 1 tablet of protease inhibitor). The mixture was sonicated on ice 5x for 15 sec
using the large probe, with a break after each sonication pulse for 45 sec to avoid
overheating. The mixture was then centrifuged at 25,000 g for 20 min at 4°C to remove
cell debris. Then, the supernatant was loaded onto 1 ml Ni-Sepharose column that was
equilibrated with buffer (50 mM Tris-HCl pH 7.5, 150 mM NaCl, 20 mM imidazole).
The column was washed thoroughly with the same buffer, and then the Ply eluted with
50 mM Tris-HCl pH 7.5, 150 mM NaCl, 500 mM imidazole. Fractions (0.5 ml) were
collected and loaded on 15% w/v SDS-PAGE. Fractions containing Ply were loaded onto
a Superdex 200 16/60 gel filtration column, equilibrated with 20 mM Tris-HCl pH 7.5.
Fractions (1.5 ml) were collected across the elution peak and Ply was identified by 15%
w/v SDS-PAGE. Finally, Ply was concentrated and its concentration was determined by
absorbance at 280 nm, using an extinction coefficient (e) of 1.36 cm2mg-1 (Morgan et al.,
1994). Aliquots were snap frozen in liquid nitrogen and stored at -80oC.
Page 67
52
2.2.7 Cloning and amplification of PlyD1-3 by PCR
DNA encoding PlyD1-3 was amplified by PCR from the full-length Ply gene. Primers
were designed according to the PROTEX guidelines, which use ligase-independent
cloning by recombination (Table 2-1). PCR amplifications were carried out in 50 μl
volumes containing 50 ng of DNA template, 0.1 μM forward and reverse primers, 2.5 U
of pfx DNA polymerase, 0.1 mM dNTPs, 0.75 mM MgSO4, and 1x PCR buffer and
enhancer. The PCR reaction was performed using an initial denaturation at 94°C for 5
min followed by 32 cycles with denaturation at 94°C for 50 sec, annealing at 61°C for 50
sec, followed by extension at 72°C for 1 min, with a final extension at 72°C for 5 min in
a Labnet Multi Gene II thermo cycler. The PCR product was analysed on a 1% w/v
agarose gel in TBE buffer. DNA fragments were isolated from the agarose gel and
purified using a QIAEX II gel extraction kit. The targeted PCR fragment was cloned into
pLEICE-01 vector (Figure 2-3) by PROTEX, which introduces an N-terminal His6 tag.
Sequence verification was carried out by the Protein Nucleic Acid Chemistry Laboratory
(PNACL) at Leicester University using pLEICS-01 sequencing primers.
Table 2-1: Oligonucleotide primers to amplify PlyD1-3.
The start and stop codons are shown in red.
Primer Sequence 5’--------3’
FP plyD1-3 TACTTCCAATCCATGGCAAATAAAGCAGTAAATGACTTTATA
RP plyD1-3 TATCCACCTTTACTGTCAGTTTCTGTAAGCTGTAACCTTAGTC
Page 68
53
Figure 2-3: Vector map of pLEICS-01.
2.2.8 Small scale expression of PlyD1-3
Briefly, recombinant DNA was transformed into BL21 (DE3) competent cells. 10 ml of
LB with 100 mg/ml of ampicillin was inoculated with a single colony of the transformed
cells and incubated at 37°C until an OD600 of 0.5-0.8 was reached. The culture was
induced with IPTG at 1 mM final concentration. After incubation for 3 hr, the cells were
centrifuged and washed with PBS. The pellet was resuspended in 100 μl of Bugbuster
and incubated at room temperature for 15 min. The sample was then centrifuged and the
supernatant collected for analysis. Next, the pellet was mixed with 100 μl PBS. Finally,
the supernatant and the pellet samples were analyzed on a 15% w/v SDS-PAGE gel to
check for expression and the purity of the protein.
Page 69
54
2.2.9 Large scale protein expression
After transformation to BL21 (DE3) cells were grown at 37°C in 500 ml LB media with
100 mg/ml ampicillin. Expression was induced with 1mM IPTG at an OD600 of 0.6-0.8
and cells were grown overnight. PlyD1-3 was expressed in inclusion bodies and purified
as described below in section 2.2.10.
2.2.10 Inclusion body preparation
Cells were pelleted at 4500 rpm and at 4°C for 20 min. The pellet was washed with 40
ml of PBS. Next the pellet was resuspended in 40 ml lysis buffer (25 mM Tris-HCl pH
8.0, 150 mM NaCl, 0.5 mg/ml lysozyme, 0.5% v/v Triton-X-100 and 1m M EDTA) with
1 protease inhibitor tablet and incubated at room temperature for 30 min with shaking.
MgCl2 (5 mM) and DNAse (5 μg/ml) were added to digest the DNA. The suspension was
incubated at room temperature with shaking for 15 min and cells were lysed by sonication
on ice with the large probe at an amplitude 8 for 10 x 30 sec and with a break of 60 sec.
The lysate was centrifuged at 20,000 g at 4°C for 20 min (this speed was used for all
subsequent centrifugation steps), then the pellet was washed in 40 ml of 25 mM Tris-HCl
pH 8.0 containing 0.5 M NaCl, 1 mM EDTA and 0.5% v/v Triton-X-100 v/v. Additional
washes were carried out in 40 ml of 1M urea, containing 0.5 M NaCl, and 1 mg/ml sodium
deoxycholate in 25 mM Tris-HCl pH 8.0 and finally 40 ml of 1:10 dilution of Bugbuster
protein extraction reagent. Finally, the pellet was mixed with 10 ml 25 mM Tris-HCl pH
8.0 and snap frozen in liquid nitrogen and stored at -80°C (Qoronfleh et al., 2007). After
purification samples were checked by SDS-PAGE.
2.2.11 Inclusion body solubilisation
Inclusion bodies were solubilised in 25 mM Tris-HCl pH 8.0 containing 8 M urea and 5
mM DTT. The mixture was incubated at 37°C for 10 min and centrifuged at 14000 rpm
for 10 min to remove insoluble cell debris. Finally, the protein concentration of the
supernatant was measured at 280 nm with a Nanodrop 1000 Spectrophotometer
(Labtech).
2.2.12 Small scale refolding test
The solubilized inclusion bodies were adjusted to a final concentration of 1 mg/ml with
25 mM Tris-HCl pH8, 8 M urea and 5 mM DTT and different refolding conditions were
tested using the QuickFold™ Protein Refolding Kit. Solubilized protein (25 μl) was
mixed with 475 μl of the 15 different refolding buffers in the screen and incubated
Page 70
55
overnight at 4°C. Next each sample was centrifuged at 14000 rpm for 10 min. Soluble
protein was checked on a 15% v/v SDS-PAGE gel. Unfolded protein tends to aggregate,
so will be removed in the spin step. Samples that gave a clear band on the gel were loaded
on to an analytical Superdex 200 10/300 gel filtration column, equilibrated with 20 mM
Tris-HCl pH 7.5 and 100 mM NaCl to check for a peak of the expected molecular mass.
Fractions were collected across the peaks, concentrated with Strataclean beads and
analyzed by 15% w/v SDS-PAGE. Three buffers gave promising refolding results:
buffers 2, 4 and 8.
2.2.13 Large scale refolding of PlyD1-3
PlyD1-3 (2 mg/ml) was refolded by drip dilution at 4 ºC into buffer 8 (50 mM Tris-HCl
pH 8.5, containing 9.5 mM NaCl, O.4 mM KCl, 2 mM MgCl2, 2 mM CaCl2, 0.4 M
sucrose, 0.5 Triton X-100, 0.05% polyethylene glycol 3, 550, 1 mM GSH, and 0.1 mM
GSSH) to give a final concentration of 0.02 mg/ml. After refolding, the sample was
filtered through a 0.22 μm Millipore filter to remove any aggregate and then passed
through a 2 ml Ni-Sepharose column, equilibrated with 25 mM Tris-HCl pH 7.4, 150 mM
NaCl and 20 mM imidazole using a peristaltic pump. Bound PlyD1-3 was eluted with
500 mM imidazole from the column. Fractions containing protein were collected and the
purity was estimated by SDS-PAGE. PlyD1-3 was further purified by gel filtration on
Superdex 75 16 / 60 column in 50 mM Tris-HCl pH7.5, 150 mM NaCl. Fractions contain
protein were collected across the peak. Typically ~10 mg of pure protein was obtained
per litre of culture media.
2.2.14 Cloning, expression and purification of PlyD4
PlyD4 was amplified by PCR as described in section 2.2.7 from the Ply gene using
primers described in Table 2-2. The resulting fragment was cloned into pLEICS-10
(Figure 2-4). This vector encodes an N-terminal MBP-tag with a TEV cleavage site that
is located between the N-terminus of inserted protein and the tag. After cloning the
sequence was confirmed by PNACL.
Page 71
56
Table 2-2: Oligonucleotide primer sets for amplify PlyD4.
Start and stop codons are shown in red.
Primer Sequence 5’--------3’
FP PlyD4 5’GTATTTTCAGGGCGCCATGCAGAAACGGAGATTTACTGCTG3’
RP PlyD4 5’GACGAGCTCGAATTTCAGTCATTTCTACCTTATCCTC3’
Figure 2-4: Vector map of pLEICS-10.
Page 72
57
2.2.15 Expression and purification of PlyD4
The recombinant plasmid was transformed into BL21 (DE3). A small-scale expression
was performed by inoculating 10 ml LB media containing 100 μg/ml ampicillin with a
single transformed colony and incubated overnight at 37°C. This culture was used to
inoculate 500 ml LB containing 100 μg/ml ampicillin and cells were incubated at 37°C
in the shacking incubator. At an OD600 of 0.5-0.8, expression was induced with 1mM
IPTG and the culture was incubated overnight at 30°C. Cells were harvested by
centrifugation at 4000 g for 20 min at 4°C. The cell pellet was mixed with 40 ml lysis
buffer (50 mM Tris-HCl pH 7.5, 150 mM NaCl and 1% v/v Tween 20) and a protease
inhibitor tablet. Sonication was performed 6 x for 15 sec on ice, with 45 sec rest intervals
to lysis the cells and the mixture was centrifuged at 20,000g for 20 min at 4°C. The
supernatant was passed through a 2 ml amylose-Sepharose column that was equilibrated
with 50 mM Tris-HCl pH 7.5, 150 mM NaCl to bind the soluble MBP-tagged PlyD4
fragment. After that the column was washed with 10 ml of 50 mM Tris-HCl pH 7.5, 150
mM NaCl and eluted with 1ml fractions of 50 mM Tris-HCl pH 7.5, 150 mM NaCl and
10 mM maltose. Fractions were collected, analyzed by SDS-PAGE followed by staining
with Coomassie blue for 15 min. The fractions contained the fusion protein were pooled
and digested with (TEV) protease at 4°C overnight and loaded on a Superdex 75 16/60
gel filtration column that was equilibrated with 50 mM Tris-HCl 7.5, 150 mM NaCl to
separate the MBP-tag from the PlyD4. Finally, fractions containing PlyD4 were analysed
by SDS-PAGE. Samples were concentrated and snap frozen in liquid nitrogen and stored
at -80°C.
2.3 Results
2.3.1 Expression and purification of full-length Ply
The expression plasmid encoding full-length Ply (MSB G43) was transformed into BL21
(DE3) strain and production was induced with IPTG. Ply was initially purified by affinity
chromatography on a Ni-Sepharose column, which removes most of the impurities.
Fractions containing Ply were analyzed by SDS-PAGE (Figure 2-5).
Page 73
58
Figure 2-5: SDS-PAGE showing Ply purification by affinity chromatography on Ni-
Sepharose column.
Lane 1 is the flow through, lane 2 wash fraction, and lanes 3-7 is the elution fractions of
Ply after chromatography. The gel was stained with Coomassie blue. Ply runs at ~53 kDa
as expected. The protein bands in lane 4-6 is very thick due to presence of high protein
concentration.
The fractions containing Ply were pooled and loaded onto a Superdex 200 16/60 gel
filtration column. Ply was eluted as a single peak with a mass of ~50 kDa (Figure 2-6 A)
based on the elution of known standards indicating that Ply is monomeric in solution as
reported previously (Solovyova et al., 2004, Gilbert et al., 1998, Morgan et al., 1993).
Figure 2-6 B shows the SDS-PAGE of Ply after gel filtration. A single protein band was
observed with no detectable impurities. The overall yield was typically 20 mg of pure
protein per 500 ml of culture.
protein marker kDa
1 2 3 4 5 6 7
7
17
25
32
46
58 Ply ~53 kDa
Page 74
59
Figure 2-6: Size exclusion chromatography of recombinant full-length Ply on a
Superdex 200 16/60 column analysed on a 15% SDS-PAGE gel.
The first peak in A contains aggregates; the main peak is Ply, with an approximate
molecular mass of 50 kDa based on the elution position of molecular weight standards.
(B) after gel filtration elution fractions were collected from the the main elution peak
which lablled in figure A. Lanes 1-6 are fractions collected across the main elution peak
which is about 53 kDa. The gel was stained with Coomassie blue.
Page 75
60
2.3.2 Cloning, expression and purification of PlyD1-3
PlyD1-3 was produced to help characterize binding between Ply and the IgG isotypes.
The gene fragment encoding PlyD1-3 was first amplified from the Ply gene by PCR
(Figure 2-7). The mass of the fragment separated on an agarose gel corresponded closely
with the expected size of ~1074 bp.
Figure 2-7: Agarose gel showing PCR of PlyD1-3 DNA fragments.
Lane 1 is 1kb DNA ladder lanes 2 is PlyD1-3. The fragment was purified from the gel
and cloned into pLEICS-01 expression vector.
The fragment was cloned into pLEICS-01 and sequenced. The resulting expression
plasmid was transformed into BL21 (DE3) and test expressions were carried out as
described in materials and methods. These preliminary tests showed that PlyD1-3 was
expressed in insoluble inclusion bodies (Figure 2-8). These were purified to remove
protein, lipid and nucleic acid contaminants and solubilized in 8 M urea. A refolding
1kb DNA ladder
PlyD1-3 ~ 1074 bp
500 bp
1000 bp
1500 bp
1 2
Page 76
61
screen was then performed to determine the best conditions for refolding, in which PlyD1-
3 was diluted into fifteen different buffers as mentioned in materials and methods.
Refolding was tested by SDS-PAGE and promising conditions were tested further by gel
filtration. Figure 2-9 shows the elution profile of the selected samples from the refolding
screens. Although the concentration of protein was very low, peaks of the expected size
were observed in three refolding buffers (eluting at ~15 ml from the analytical column).
Figure 2-8: 15% SDS-PAGE of small-scale expression of PlyD1-3 in inclusion body.
PlyD1-3 expresed in inclusion body at two different temperatures including 30°C and
37°C. Expresed PlyD1-3 purified and isolated from the E. coli cells by Bugbuster. Lane
1 and 2 show purified PlyD1-3 at 30°C and 37°C subsequently.
Page 78
63
Figure 2-9: Elution profile of the purified PlyD1-3 on Superdex 200 10/300 after
refolding screens.
PlyD1-3 refolded in four different buffer samples include 2, 4, 8 and 10 according to the
QuickFold™ Protein Refolding Kit. Refolded samples subjected to gel filtration on a
Superdex 200 10/300. Small peaks at ~15 ml correspond to PlyD1-3.
Page 79
64
After gel filtration on Superdex 200 10/300, each refolded samples were concentrated
with Strataclean beads and analysed by SDS-PAGE under reducing conditions (Figure 2-
10). PlyD1-3 was refolded successfully in three refolding screen conditions: buffers 2, 4
and 8. This means any of these can be used to refold PlyD1-3.
Figure 2-10: Purified refolded recombinant PlyD1-3 after analytical size exclusion
chromatography assessed by SDS-PAGE.
After gel filtration samples were concentrated with Strataclean beads. Concentrated
samples were resuspended in 5x loadying dye and incubated 5 min at 95°C before loading
onto the gel. Protein marker was loaded on the left side of the gel and the number of the
right side corresponds to the number of the refolding buffer.
For large-scale purification, solubilized inclusion bodies were refolded by drip dilution
into buffer 8 (50 mM Tris-HCl pH 8.5, containing 9.5 mM NaCl, O.4 mM KCl, 2 mM
MgCl2, 2 mM CaCl2, 0.4 M sucrose, 0.5 Triton X-100, 0.05% polyethylene glycol 3,550,
1 mM GSH, and 0.1 mM GSSH). PlyD1-3 contains 359 amino acid residues (Figure 2-
2) and was expressed with an N-terminal His6 tag, enabling purification by Ni-affinity
chromatography (Figure 2-11 A). The sample was eluted from the Ni-Sepharose column
with imidazole and further purified by gel filtration on a Superdex 75 16/60 column to
remove minor impurities. It eluted as a large peak with a smaller shoulder as labled with
the red circle (Figure 2-11 B). No differences was detected by SDS-PAGE (Figure 2-12)
suggesting that the shoulder may represent a dimer. When fractions corresponding to the
Ply D1-3-1 refolding buffer 2, 4, 6, 8. 10, 14 after gel filtration
superdex 300 10/20 analytical column
7
17
25
32
46 2 4 8 10
Protein marker kDa
PlyD1-3 ~ 39 kDa
Page 80
65
main peak or the shoulder were reapplied to the gel filtration column, protein eluted as a
single peak at the same position as the main peak, consistent with dimerization at high
protein concentrations. Given that full-length Ply is a monomer, removal of domain 4
probably exposes a hydrophobic surface that facilitates self-association. The purity of the
protein was checked on 15% SDS-PAGE (Figure 2-12). The expected size of PlyD1-3 is
~39 kDa. Yields of PlyD1-3 were typically 10 mg per litre of culture.
Page 81
66
Figure 2-11: 15% SDS-PAGE of PlyD1-3 after purification on Ni-Sepharose column
and size exclusion chromatography profile of PlyD1-3 on Superdex 75 16/60 column.
(A) Lane 1 and 2 is the flow through and wash respectively, lane 3-6 is 1ml elution
fractions. The expected size of PlyD1-3 is ~39 kDa. (B) Gel filtration profile of the plyD1-
3 on a Superdex 75 16/60 column. Peak fractions were collected and analysed by SDS-
PAGE. The shoulder on the PlyD1-3 peak is lablled in blue circle.
Figure 2-12: SDS-PAGE of purified PlyD1-3 after gel filtration on Superdex 75
16/60.
After gel filtration the elution fractions across the PlyD1-3 peak were collected and run
on SDS-PAGE. Lane 1-5 shows the protein without DTT (unreduced), and lane 6-10
shows the protein with DTT (reduced). The expected size of PlyD1-3 is ~39 kDa. The gel
was stained with Coomassie blue.
2.3.3 Cloning, expression and purification of PlyD4
PlyD4 is the membrane-binding domain of Ply and comprises residues 360-471 of the
full-length protein (Figure 2-2). A gene fragment encoding the domain was amplified,
and inserted into pLEICS-10 vector (Figure 2-4). After transformation, colonies only
grew on LB agar plates in the presence of 2% of glucose, which reduces the background
expression of recombinant proteins from pET-based vectors, suggesting that PlyD4 may
be toxic to the BL21 (DE3) cells. Attempts to produce a His-tagged form of PlyD4 were
unsuccessful with no soluble protein produced. However, PlyD4 was expressed as a
19-12-14 15% SDS-PAGE ply D1-3-1 after gelfiltration on Superdex 75
16/60
7
17
25
32
46 1 2 3 4 5 6 7 8 9 10
PlyD1-3 ~ 39 kDa PlyD1-3 ~ 39 kDa
Protein marker kDa
Page 82
67
soluble fusion with an N-terminal MBP tag, which enhances the solubility of the
expressed proteins (Nallamsetty et al., 2005). The fusion protein was purified by affinity
chromatography on an amylose-Sepharose column (Costa et al., 2014, Fox and Waugh,
2003) and was eluted from the column with 10 mM maltose. The resulting protein was
~53 kDa, with MBP ~42 kDa and PlyD4 ~13 kDa (Figure 2-13). The tag was removed
from PlyD4 by overnight digestion with TEV protease and the proteins were separated
by gel filtration chromatography on a Superdex 75 16/60 column. PlyD4 eluted from the
column as a single peak after 140 ml, much later than expected for its size, probably as a
result of weak interaction with the column (Figure 2-14). PlyD4 migrated with a
molecular weight of ~13 kDa on SDS-PAGE gels as expected (Figure 2-15).
Figure 2-13: 15% SDS-PAGE of purified PlyD4 tagged with MBP after affinity
chromatography on amylose resin column.
After chromatography elution fractions were run on the SDS-PAGE. Lane 1-5 of the left
side shows elution fraction of the protein that was run under non-reducing condition
(without DTT). Lane 1-5 of right side shows same elution fractions of the protein but run
under reducing conditions (with DTT). The expected size of PlyD4 with MBP tag is ~53
kDa. The gel was stained with Coomassie blue.
Protein marker kDa
11
17
22
25
32
46
58 1 2 3 1 2 3 4 5 4 5
PlyD4 with MBP ~ 53 kDa
Page 83
68
Figure 2-14: Elution profile of PlyD4 after digestion with TEV protease on a
Superdex 75 16/60 gel filtration column.
MBP tagged PlyD4 after chromatography digested with TEV protease and run on the
gelfiltration column. After digestion the MBP peak is shown high absorbance because it
was expressed more than the PlyD4. PlyD4 eluted after 140 ml from the gel-filtration
column.
Ply D4
volume (ml)
UV
28
0 a
bsor
ptio
n m
AU
50 100 150 200
-500
0
500
1000
1500
PlyD4 ~ 13kDa
MBP ~ 42 kDa
Volume (ml)
UV
28
0 a
bso
rpti
on
m
UA
Page 84
69
Figure 2-15: 15% SDS-PAGE of purified PlyD4 after digestion with TEV protease
on Superdex 75 16/60 gel filtration.
After gel filtration eluted protein across the MBP and PlyD4 peaks were collected and
run on the 15% SDS-PAGE. After disgestion with TEV the protein splited into MBP and
PlyD4. Lanes 1-4 is MBP (~ 42 kDa), and lanes 5, 6, 7 and 8 correspond to PlyD4 (~13
kDa).
2.4 Discussion
In the work described in this chapter full-length Ply and Ply fragments comprising
domains 1-3 (PlyD1-3) and domain 4 (PlyD4) were cloned, expressed and purified.
Previous studies have shown that an N-terminal His6-tagged protein does not compromise
the haemolytic activity of Ply (Wu et al., 2012). Ply migrated with the expected molecular
mass on gel filtration indicating that it is monomeric. Based on SDS-PAGE, the purity
was >99%, with yields of 20 mg. Unlike the full-length protein, PlyD1-3 was insoluble
when expressed in E. coli at 37ºC. Nevertheless, it was refolded successfully by drop
dilution. PlyD1-3 dimerized at high concentrations, probably through the interactions
between the exposed interfaces exposed by removal of D4. PlyD4 only expressed well
with an N-terminal MBP-tag, which is known to increase the solubility of expressed
proteins (Nallamsetty et al., 2005). It eluted from the gel filtration column much later than
expected, indicating that it binds to the column matrix. Superdex is made from dextran
Protein marker kDa
11
17
22
25
32
46
58 1 2 3 4 5 6 7 8
PlyD4 ~ 13 kDa
MBP ~ 42 kDa
Page 85
70
covalently attached to highly cross-linked agarose. It has been suggested that D4 may
function as a lectin by binding to sLeX (Shewell et al., 2014) and this could explain why
it is retained on the column. However, full-length Ply elutes at the expected position on
the same column, so the interaction between D4 and Superdex is probably non-specific.
Page 86
71
Chapter 3 Interaction of Ply with human L-ficolin and IgG
isotypes
3.1 Introduction
Many studies have reported that the CP and the AP of the complement play a crucial role
against pneumococcal infections (Hazlewood et al., 1992, Homann et al., 1997, Janoff
and Rubins, 1997). The antigenic structure of the pneumococcus activates the CP and the
AP of the complement pathways (Paton et al., 1984). For example, the AP is activated by
teichoic acid whereas the CP is activated by capsular polysaccharide and Ply (Paton et
al., 1984). Brown et al. reported that the CP of the complement is the key pathway against
the pneumococcus infection in mice (Brown et al., 2002b). Another study has confirmed
that the CP is vital for complement-mediated phagocytosis of the pneumococcus. In this
work, C2 deficiency increases susceptibility to the pneumococcus (Yuste et al., 2008).
CP and AP play a critical role in host defense against the pneumococcus during the early
stage of OM (Li et al., 2012). C1q interacts with pneumococcal surface-exposed proteins
directly, even in the absence of specific antibodies and mediates binding to host cells
(Agarwal et al., 2013). A recent study reported that mouse strain deficient in MASP-2
was highly susceptible to pneumococcal infection and it was not able to opsonize
pneumococcus. However, that mouse strain was able to activate both CP and AP of the
complement. This suggests that the LP is also important against pneumococcus infection
as well as the CP and the AP (Ali et al., 2012).
Studies have reported that Ply activates complement directly. By directing complement
activation away from the bacterium itself, this activity may reduce deposition of C3b on
its surface (Yuste et al., 2005, Paton et al., 1984). It has been suggested that complement
activation on Ply occurs via the CP and the LP. A direct interaction between C1q and Ply
has been proposed due to similarity between PlyD4 and C-reactive protein (CRP), which
itself activates the CP (Mitchell et al., 1991). However, Ali et al (2013) reported that
complement activation depends on the presence of the IgG, suggesting that C1q may not
bind to Ply directly. The most recent data suggested that Ply activates the CP via IgG3
and IgM (Ali et al., 2013). L-ficolin was also identified as binding to Ply (Ali et al., 2013).
Furthermore, in C1q-deficient human serum Ply activated complement via the LP
suggesting that L-ficolin is likely to be the recognition molecule responsible for
Page 87
72
activation. No activation was detected in C1q-deficient mouse serum and ficolin-A did
not bind to Ply (Ali et al., 2013). The pneumococcus evades complement via several
different mechanisms. For example, the pneumococcus prevents binding of C4b and
Factor H to its surface, thus reducing the function of both classical and alternative
pathways (Li et al., 2012). The capsular polysaccharide prevents binding of IgG and CRP,
thereby reducing CP activity, and reducing the AP activity through decreasing the
degradation of C3b (Hyams et al., 2010). In addition, direct binding of C1q with
pneumococcal endopeptidase O attenuates the CP to facilitate pneumococcal escape
(Agarwal et al., 2014). Ply itself can activate the CP (Paton et al., 1984). This activation
may prevent host defense against the pneumococcus by depleting components from
serum (Boulnois et al., 1991).
3.2 Objectives
Ali et al (2013) reported that Ply interacts with the human L-ficolin in the serum. This
chapter will focus on the interaction between Ply and L-ficolin. Recombinant proteins
(Ply and L-ficolin) were used to measure the interaction between them. Because Ply has
been implicated in binding to IgG to initiate the activation of CP, this chapter also focuses
on determining the molecular interaction between Ply and IgG isotypes.
3.3 Materials and methods
3.3.1 Materials
DNA restriction enzymes and T4 DNA ligase were obtained from New England Biolabs.
Promega supplied pGEM-T easy cloning vectors and acetylated BSA. DXB11 CHO cells
line, pED4, and pET28a, were kindly provided by Prof. Russell Wallis (Lab 218 MSB
Leicester University). Tissue culture media including Minimal Essential Media α with
and without nucleosides (MEM α+, MEMα-), CHO-S-SFMII and phosphate buffered
saline (PBS) were purchased from Life Technologies. Bovine serum albumin (BSA),
carbonate/bicarbonate buffer, anti-human IgG conjugated with alkaline phosphatase,
anti-human L-ficolin and p-nitrophenyl phosphate disodium salt (pNNp), dialyzed heat
fetal bovine serum (DHFBS), methotrexate (MTX),Penicillin/Streptomycin (P/S),
Trypsin EDTA (10X TE), N-acetyl glucoseamine (GlcNAc), calf-thymus DNA, dimethyl
sulfoxide (DMSO), and 5-bromo-4-chloro-3-indolyl-ß-D-galactoside (X-Gal ) were
purchased from Sigma. Tissue culture flasks were purchased from Thermo Fisher
Scientific and Nunc. Oligonucleotide primers were from Eurofins Genomics. IgG
Page 88
73
isotypes were supplied by Athens Research & Technology. Qiagen supplied DNeasy
blood and tissue kits.
3.3.2 PCR amplification of the L- ficolin cDNA
DNA was extracted from DXB11 cells previously transfected with L-ficolin cDNA
provided by Prof. Wilhelm Schwaeble at Leicester University using the DNeasy blood
and tissue kit. Full-length L-ficolin was amplified and assembled using different sets of
primers (Table 3-1).
Table 3-1: Sequence of oligonucleotides using in the cloning of the human L-ficolin.
Restriction sites (Pst1 and EcoR1) are underlined, start and stop codon are in bold and an
optimised Kozak sequence, to facilitate better levels of gene expression, was put before
the start codon and is highlighted in red. F represents forward and R is reverse.
Primer Sequence 5’------3’
L-ficolin pst1 F GACATC CTGCAG GCCACC ATGgagctggacagagct
L-ficolin EcoR1
R
GTCATC GAATTC CTAGgcaggtcgcacctt
L-fic mat F ctccaggcggcagacacctgtccagaggtga
L-fic colfib F aacggagcacctggggagccccagccg
L-fic colfib R cggctggggctccccaggtgctccgtt
L-fic Sig F1 tgggcgctgccaccctgctgctctctttcctgggcatggcctgggctctccaggcggcagaca
cct
L-fic Sig F2 CTGCAGGCCACCATGgagctggacagagctgtgggggtcctg
ggcgctgccaccct
3.3.3 Cloning of full-length L-ficolin into pGEM-T easy vector
The amplified L-ficolin cDNA was initially cloned into pGEM-T easy cloning vector. An
A-tail was added to the blunt-ended PCR product by incubating 10 μl of the PCR product
with 5U Taq DNA polymerase, 0.1 mM dNTP and 2 μl 10 x Taq polymerase buffer and
1 μl of MgCl2 (0.75 mM) at 70°C for 30 min. 3 μl of the mixture was then added to 1 μl
Page 89
74
of pGEM-T easy vector (0.05 μg), 5 μl 2 x rapid ligation buffer, and 1 μl T4 DNA ligase
(3 Weiss units) and incubated at 4°C overnight. The ligated product was introduced into
competent XL10 cells by transformation, as described in section 2.2.3. Cells were plated
onto LB agar (LBA) plates containing 100 mM IPTG, 50 mg/ml X-Gal plates and
100μg/ml ampicillin. White colonies, containing the inserts were used to inoculate 1.5 ml
of LB broth containing 100 μg/ml ampicillin and incubated overnight at 37°C. Plasmids
were isolated using Qiagen plasmid mini kit. Constructs containing the insert were
sequenced by the PNACL facility at Leicester University.
3.3.4 Cloning of full-length L-ficolin into pED4
The mammalian expression vector pED4 (10 μg) was digested by mixing 44 μl of pED4
with 4 μl EcoR1 and 4 μl Pst1, 3 μl BSA, 30 μl NEB buffer 3 and 215 μl H2O and
incubating for 3 hr at 37°C. The product was separated on a 1% w/v agarose gel in TBE
buffer and extracted and purified from the gel using a Qiaex II gel extraction kit. A
fragment encompassing the entire L-ficolin cDNA was digested with the same enzymes.
For ligation, 0.5 μg of digested pED4 was mixed with the cDNA at different molar ratios
together with 1 μl of 10 x ligase buffer, 1 μl of T4 DNA ligase and water in a 10 μl
reaction and incubated at 4°C overnight. Each ligation reaction was transformed into
XL10 cells and plated onto LBA containing 100μg/ml ampicillin. Individual colonies
were grown up in 1.5 ml LB broth containing 100 μg/ml ampicillin, plasmid DNA was
extracted and the presence of the insert was confirmed by restriction digestion with
enzymes EcoR1/Pst1 followed by DNA sequencing performed by PNACL.
3.3.5 Expression vector pED4
The mammalian expression vector pED4 (Figure 3-1) expresses the gene of interest as a
dicistronic mRNA along with the dihydrofolate reductase (DHFR) gene. DHFR is
required for the synthesis of purines, thymidine, and certain amino acids and is used as a
selectable marker in the DHFR-deficient CHO cell line, DXB11. Following transfection
into DXB11 cells, only those cells containing the pED4 vector are able to grow in the
absence of external nucleotides. Expression of the gene of interest can be further
increased by selection of transfected cells in increasing concentrations of MTX, an
inhibitor of dihydrofolate reductase, up to 0.5 µM (Kaufman et al., 1991).
Page 90
75
Figure 3-1: Map of a pED4 expression vector.
This vector is a discistronic mRNA expression vector of 5360 bp, containing the DHFR
gene as a selectable marker and the B-lactamase gene conferring ampicillin resistance for
selection in bacteria. The L-ficolin gene was cloned into the Pst1/EcoR1 sites within the
polylinker region (Kaufman et al., 1991).
3.3.6 Cell culture
DXB11 cells, which are deficient in the DHFR gene, were used to express L-ficolin
(Urlaub and Chasin, 1980). Two days before the transfection the DXB11 cell line was
grown in minimal essential medium containing nucleosides (MEM α+) with 10% v/v
DHFBS and P/S at final concentrations of 500 units/ml and 500 μg/ml respectively. Cells
were grown in Nunc tissue culture flasks (25 cm2) at 37°C with 5% CO2.
Page 91
76
3.3.7 DNA precipitation
DNA was precipitated by adding 1/10 volume of 3 M sodium acetate pH 5.2 and two
volumes of 100% cold ethanol. The mixture was incubated on dry ice for 15 min and the
DNA pelleted by centrifugation for 15 min at 13000 rpm in a microcentrifuge. The pellet
was washed in 1 ml of 70% cold ethanol and dried in the tissue culture laminar flow
cabinet for 15-30 min under sterile conditions.
3.3.8 Transfection of mammalian cells by the calcium phosphate method
The recombinant plasmid was introduced into DXB11 CHO cells by transfection using
the calcium phosphate method (Graham and van der Eb, 1973). In this method the DNA
binds to the calcium phosphate and can enter to the eukaryotic cells by endocytosis.
Briefly, the DNA together with 100 μl of 10 mg/ml calf thymus DNA was diluted in 1 ml
of sterile ddH2O containing 120 μl of 2 M CaCl2 in a 15 ml falcon tube. This was mixed
with 1 ml of 2 x HEPES buffered saline pH 7.1 (HBS; 0.5g HEPES, 0.8 g NaCl/50 ml)
and 40 μl 100 x phosphate buffer (70 mM Na2HPO4 and 70 mM NaH2PO4). The mixture
was left for 30 min at room temperature to allow a precipitate to form. 1 ml was added to
50% confluent DXB11 cells in MEMα+ medium containing 10% v/v DHFBS and P/S in
a (25 cm2) flask, and incubated overnight. The next day, cells were washed with PBS at
pH 7.2 and the MEMα+ medium was replaced. Cells were incubated overnight until they
reached confluence. The cells were trypsinized and resuspended in MEMα− containing
10% v/v DHFBS, with P/S. Media (200 μl) was added to each well of a 96 well tissue
culture plate and incubated for 2 weeks at 37°C with 5% CO2. When the clones had
reached confluence, they were transferred to 24 well plates (Nunc). Cells were passaged
into MEMα− containing 10% v/v DHFBS, with P/S and increasing concentrations of
MTX up to 0.5 μM.
3.3.9 Expression and purification of full-length L-ficolin
L-ficolin was purified from the cell line as described previously for MBL (Wallis and
Drickamer, 1999). The cells were grown in 3 layered tissue culture flasks in MEMα-
containing 0.5 μM MTX, 10% v/v DHFBS with P/S. Once the cells were fully confluent,
the media was replaced with CHO-S-SFM II without nucleosides containing 50 mM
HEPES, pH 7.55 as an additional buffer during the cell growth, 0.5 μM MTX and P/S.
Media was harvested every other day, spun at 1500 rpm for 2 min to remove any cell
debris and stored at -20°C. L-ficolin was purified by affinity chromatography on a
Page 92
77
GlcNac-Sepharose column. Culture media (500 ml) was diluted with an equal volume of
high salt loading buffer (25 mM Tris-HCl pH 7.5, 1 M NaCl and 10 mM CaCl2). This
was loaded onto a 2 ml GlcNac-Sepharose column that was equilibrated with the same
buffer. The column was then washed with high and low-salt loading buffer (25 mM Tris-
HCl pH 7.5, 150 mM NaCl and 5 mM CaCl2). Protein was eluted with 25 mM Tris-HCl
pH 7.5, 150 mM NaCl containing 300 mM GlcNac. Purified protein was dialyzed to
remove GlcNac in 20 mM Tris-HCl pH 7.5 and 150 mM NaCl. Yields were ~0.35 mg
from 1 litter of culture medium. The amino acids sequence of L-ficolin is shown in
(Figure 3-2).
Figure 3-2: Amino acids sequence of human L-ficolin.
The signal sequence is shown in blue, the N-terminal domain in black, the collagen-like
domain in green and the fibrinogen-like domain in red.
3.3.10 Cell storage
Transfected cells were stored by mixing 1ml of trypsinized cells from a 25 cm2 flask with
2 ml DHFBS containing 10% v/v DMSO. The cells were split into two 1ml cryovials and
frozen in dry ice. Cells were stored at -196°C.
Page 93
78
3.3.11 Cloning, expression and purification of the fibrinogen-like domain of L-
ficolin
3.3.11.1 Amplification of the cDNA encoding the fibrinogen-like domain of L-
ficolin
The cDNA encoding the fibrinogen-like domain of L-ficolin was amplified using primers
shown in (Table 3-2). The DNA was separated on a 1% agarose gel and the DNA
fragment excised and purified. The PCR product was cloned into the pGEM-T easy vector
as described in section 3.3.3 and the sequence was verified by PNACL. The cDNA
fragment was then digested with Nco1/EcoR1 and cloned into the polylinker region of
the expression vector pET28a (Figure 3-3) and digested with the same restriction
enzymes. The resulting plasmid was sequenced by PNACL.
Page 94
79
Figure 3-3: Map of the bacterial expression vector pET28 a.
This vector is 5368 bp and contains the kanamycin antibiotic resistance gene as a
selectable marker. The cDNA encoding the fibrinogen-like domain was cloned into
NcoI/EcoRI restriction sites.
Page 95
80
Table 3-2: Oligonucleotide sequences used to amplify the cDNA encoding the
fibrinogen-like domain of L-ficolin.
The restriction sites are underlined, start and stop codon are highlighted in red. The
sequence encoding the His-tag on the forward primer is in bold. F and R represent forward
and reverse respectively.
Primer Sequence 5’------3’
L-ficolin N His fib F agctag CCATGGCT catcatcaccatcaccac ccccagccgtgcctgac
L-ficolin EcoR1 R cgatca GAATTCCTAGgcaggtcgcacctt
3.3.11.2 Expression and purification of the fibrinogen-like domain of L-ficolin
The protein was expressed as inclusion bodies and refolded by drip dilution as described
in section 2.2.13. Refolded protein was purified by affinity chromatography on a 2 ml Ni-
Sepharose column pre-equilibrated with 25 mM Tris-HCl pH 7.4, 150 mM NaCl and 20
mM imidazole. After loading, the column was washed with 25 mM Tris-HCl pH 7.4, 150
mM NaCl and 20 mM imidazole. Protein was eluted from the column with the same
buffer containing 500 mM imidazole. Protein was further purified by gel filtration on a
Superdex 75 16/60 column, equilibrated with the 50 mM Tris-HCl pH 7.4, 150 mM NaCl,
50 mM GlcNAc and 2 mM EDTA.
3.3.12 ELISA binding between Ply and L-ficolin
Flat-bottomed Nunc Maxisorp plates (Nunc) were coated with 5 μg/ml (100 μl) of Ply in
coating buffer (0.3 M NaHCO3, 0.2 M Na2CO3 at pH 9.6) and left at 4°C overnight.
Acetylated BSA and BSA were used as positive and negative controls respectively. Wells
were blocked with 1% w/v BSA in Tris-buffer saline (TBS; 10 mM Tris-HCl pH 7.4, 140
mM NaCl) and left at room temperature for 1 hr. Then 100 μl of 2-fold serially diluted
serum was added in BBS buffer (4 mM barbital, 145 mM NaCl, 2 mM CaCl2, and 1 mM
MgCl2 pH 7.4). Separate experiments were carried out using purified L-ficolin as the
soluble ligand. The plates were allowed to stand at room temperature for 1 hr. Binding
was detected using (1/2000) rabbit polyclonal or monoclonal anti L-ficolin antibodies.
After 1hr at room temperature the secondary antibody conjugated to alkaline phosphatase
was added (1/5000 either anti-rabbit or anti-mouse IgG) and incubated at room
temperature for 1hr. The substrate pNNp (100 µl; 1 mg/ml) was added to each well and
incubated for 15 min at room temperature. Absorbance was measured at 405 nm. Wash
Page 96
81
steps were carried out three times using 200 µl of wash buffer (10 mM Tris-HCl pH 7.4,
140 mM NaCl, 5 mM CaCl2, 0.05% v/v Tween 20) and plates were dried upside down
on paper towels.
3.3.13 ELISA binding between Ply and IgG isotypes
Nunc Maxisorp microtiter plates were coated with 100 μl ligand at 5 μg/ml (either Ply,
PlyD1-3, PlyD4 or BSA) in coating buffer (0.3 M NaHCO3, 0.2 M Na2CO3 at pH 9.6)
and incubated at 4°C overnight. The plate was blocked with 200 μl/well of 1% w/v BSA
in PBS and allowed to stand at room temperature for 1 hr. Next, two-fold serial dilutions
of the IgG isotypes, the Fab or Fc fragments were added in PBS. Plates were allowed to
stand at room temperature for 1hr. Binding was detected with anti-human IgG conjugated
with alkaline phosphatase and incubated for 1hr at room temperature. Finally, (100 µl;
1mg/ml) substrate pNNp was added and the absorbance was read at 405 nm. The plate
was washed three times with washing buffer after each binding step as described above.
3.3.14 Inhibition assay
Plates were coated with Ply and blocked with 1% BSA as described above. Serial
dilutions of Ply (starting at 1mg/ml; 50 l) were mixed with IgG Fab and Fc (50 l; 200
g) and incubated for 10 min before transfer to the coated wells. The resulting samples
were incubated at room temperature for 1hr. After washing, wells were incubated with
anti-human IgG followed by substrate pNNp. Absorbance was read at 405 nm. Graph pad
prism 7 programme was used to make the figures. The data was analyzed in prism
programe by choosing Nonlinar regression, Dose response curves - Inhibition and then
the equation [Inhibitor] vs. response -- Variable slop]. To find the IC50 of inhibition. The
equation is Y=Bottom + (Top-Bottom)/ (1 + ((X^HillSlope)/ (IC50^HillSlope).
3.3.15 IgG4 digestion with IdeS enzyme
IgG4 (4 mg Human Myeloma Plasma, Kappa) was prepared in 20 mM phosphate buffer
pH 7.4, 150 mM NaCl and 0.05% sodium azide. For each 1 mg of IgG4, 1000 units of
IdeS (IgG-degrading enzyme from Streptococcus pyogenes) was added and the mixture
was incubated for 5 hr at 37°C and overnight at 4°C. IdeS was prepared in ddH2O
according to GENOVIS instruction (A0-FRI-050) at 67 units/µl. After digestion, the Fab
and Fc regions were separated by gel filtration on a Superdex 200 16/60 column.
Fractions were analyzed by SDS-PAGE. Fab and Fc fragments were concentrated to 3
mg/ml and 1.8 mg/ml stored at -80°C.
Page 97
82
3.4 Results
A previous study has reported that Ply binds to L-ficolin to activate the LP pathway of
complement (Ali et al., 2013). To characterize this process in more detail, I produced
recombinant full-length L-ficolin and smaller fragment encompassing the fibrinogen-like
domain. The advantage of using recombinant proteins rather than purifying the ficolin
from serum is that preparations are free from contamination by serum components
including complement components.
3.5 Cloning, expression and purification of L-ficolin
3.5.1 PCR amplification of full-length L-ficolin
PCR was used to amplify the cDNA encoding the full-length L-ficolin. Initial attempts to
clone the full-length cDNA were unsuccessful because the template lacked a functional
signal peptide. PCR1 was carried out with (L-ficolin pst1 F and L-fic colfib R) primers
to check the presence of signal peptide in the cDNA, no band appeared (Table 3-1 and
Figure 3-4). PCR2 (~249 bp) was carried out to check the existence of mature sequence
in the cDNA with (L-fic mat F and L-fic colfib R) (Table 3-1 and Figure 3-4). In order to
generate the full-length cDNA, multiple steps were used. PCR3 was performed to amplify
the DNA encoding the N-terminal, collagen and fibrinogen-like domains of L-ficolin; the
product was approximately 1kb as expected (Figure 3-4). This was then used as a template
for adding the signal peptide (incorporated within the primer Lfic Sig F1) in PCR4. The
product was used as a template to generate PCR5 (~1 kb), which encodes the full-length
L-ficolin with signal peptide (Figure 3-4).
Page 98
83
Figure 3-4: 1% w/v agarose gel electrophoresis showing PCR steps to amplify cDNA
of the L-ficolin.
PCR1 and 2 were used to analyse the L-ficolin cDNA in the template cell line with (L-
ficolin pst1 F and L-fic colfib R) primers. No product was deteceted in PCR1 indicating
that the ficolin lacked a signal sequence. PCR2 (~249 bp) was carried out with (L-fic mat
F and L-fic colfib R) confirmed that the L-ficolin cDNA was present in the cell line. In
PCR3 the N-terminal, collagen and fibrinogen-like domains were amplified but minus
the signal peptide. In PCR 4 and 5 a functional signal sequence was added and the full
length L-ficolin cDNA was amplified with both Lfic Sig F1 and Lfic SigF2.
The final L-ficolin PCR product was A-tailed and cloned into the cloning vector pGEM-
T easy vector (Figure 3-5 A). A Pst1/EcoR1 fragment encompassing the entire gene was
then inserted into pED4. Clones were confirmed by restriction digestion (Figure 3-5 B)
and sequenced to ensure that no mutations were introduced by the PCR.
100 bp
200 bp
300 bp
400 bp
PCR1 PCR2
500 bp
1000 bp
PCR3 1kb DNA ladder
PCR4 1000 bp
1kb DNA ladder 1kb DNA ladder
500 bp
1000 pb PCR5
~249 bp
100 bp DNA ladder
~917 bp
~1 kb
500 bp
~1 kb
Page 99
84
Figure 3-5: A restriction digestion of L-ficolin cDNA in pGEM-T easy (A) and pED4
(B) with Pst1/EcoR1 enzymes.
The plasmids pGEM T-easy and pED4 in A, and B figures were digested with
Pst1/EcoR1at 37oC for 3 hr. After digestion of recombinant pGEM T-easy the right size
bands of L-ficolin was cut from the gel and purified. Then the purified product cloned
into pED4. This also digested wih the Pst1/EcoR1 enzymes to check the existence of the
L-ficolin. In each case the upper bands correspond to the pGEM-Teasy and pED4 vectors
(3 and 5.4) kb in size repectively. The lower bands represent the L-ficolin cDNA and the
expected size is 1kb.
3.5.2 Production and purification of full-length L-ficolin
Full-length L-ficolin was produced by expression in CHO DBX11 cells. This cell line
carries out the post-translation modifications that are essential for function, including
hydroxylation of proline residues and hydroxylation and glycosylation of Lys residue in
the collagen-like domain, together with disulphide bond formation, (Wallis and
Drickamer, 1999). L-ficolin was harvested in serum-free medium and was purified by
affinity chromatography on a GlcNac-Sepharose column. About 0.35 mg of purified
recombinant L-ficolin was obtained per liter of culture media. The ficolin migrated as a
single band of 35 kDa under reducing condition (Figure 3-6) as expected from the amino
acid sequence (Matsushita, 2010, Endo et al., 2011).
Full length L-ficolin
500 bp
1000 bp
3000 bp
Full-length L-ficolin 1 kb
pED 4 5.4 kb
1 kb DNA ladder
Full-length L-ficolin 1 kb
pGEM T- easy vector 3 kb 1 kb DNA ladder
A
B
Page 100
85
Figure 3-6: 15% SDS-PAGE gel analysis of recombinant L-ficolin after
chromatography on a GlcNac-Sepharose column.
L-ficolin was expressed in CHO DBX11 cells line and purified by affinity
chromatography on a GlcNac-Sepharose column. Lane 1-6 show the L-ficolin elution
fractions after chromatography. A 15% gel was run under reducing condition (with DTT)
and stained with Coomassie blue.
3.6 Cloning expression and purification of fibrinogen-like domain of L-ficolin
3.6.1 PCR amplification and cloning of fibrinogen-like domain of L-ficolin
To localise the interaction between Ply and L-ficolin an additional fragment was made
encompassing the fibrinogen-like domain of L-ficolin. This was amplified by PCR as
described in the methods section, separated on a 1% agarose gel (~660 bp), purified and
cloned into pGEM-T easy vector (Figure 3-7 A and B). The fragment was then excised
by restriction digestion with Nco1 and EcoR1 and cloned into pET28a digested with the
same enzymes (Figure 3-8). Initial attempts to express the protein in E. coli resulted in
Page 101
86
poor yields, so the fragment was re-cloned with the addition of an N-terminal His-tag,
which improved expression levels. We have found that adding an N-terminal tag often
helps to improving the yields of mammalian proteins in E. coli.
Figure 3-7: A 1% agarose gel showing PCR amplification of the cDNA encoding
fibrinogen-like domain of L-ficolin and restriction digestion of the resulting clones
in pGEM-T easy vector.
(A) Amplified fibrinogen-like domain of ~ 660 bp. The first lane is 100 bp DNA ladder
and other lane is the amplified product. (B) NcoI/EcoR1 restriction digestion of
recombinant pGEM-T easy vector containing the 660 bp insert, five different clones are
shown.
200 bp
500 bp
Fibrinogen-like domain 660 ~ bp
100 bp DNA ladder
A
pGEM T easy 3 kb 1 kb DNA ladder
500 bp
1000 bp
1500 bp
2000 bp
1 2 3 4 5
Fibrinogen-like domain 660 ~ bp
3000 bp
B
Page 102
87
Figure 3-8: A 1% agarose gel of NcoI/EcoR1 restriction digestion of seven
different fibrinogen-like domain clones in pET28a.
All seven clones contained the insert giving two fragments on digestion: the vector
(5.4 kb) and the smaller insert (~660 bp). The difference in the intensity of the
samller product in lane 2-6 is probably due to incomplete digestion.
3.6.2 Expression and purification of fibrinogen-like domain of L-ficolin
The fibrinogen-like domain was expressed in E. coli BL21 (DE3) and purified from
inclusion bodies (Figure 3-9 A) by drop dilution as described in the section 2.2.13. It was
purified by affinity chromatography on a Ni-Sepharose column (Figure 3-9 B). The
fibrinogen-like domain migrated at the expected size of ~27 kDa by SDS-PAGE.
pET 28 a 5400 pb
Fibrinogen-like domain ~ 660 bp
500 bp
1000 bp
1500 bp
2000 bp
1 kb DNA ladder
1 2 3 4 5 6
7
Page 103
88
Figure 3-9: SDS-PAGE of the fibrinogen-like domain of L-ficolin.
(A) Purified inclusion bodies (increasing amounts loaded from left to right). The
fibrinogen-like domain migrates at the expected molecular mass of ~27 kDa. (B)
Purification of the fibrinogen-like domain on a Ni-Sepharose column. Protein was eluted
in 6 fractions using 500 mM imidazole. Proteins were separated on 15% gels and stained
with Coomassie blue.
Further purification was carried out by gel filtration on a Superdex 75 16/60 column
(Figure 3-10 A). Protein eluted with an apparent molecular mass of ~80 kDa consistent
with trimerization of the fibrinogen-like domain as described previously (Tanio et al.,
2007). Proteins migrated at ~27 kDa by SDS-PAGE indicating that trimerisation is
mediated by non-covalent interactions (Figure 3-10 B). Yields were relatively low (0.25
mg from 500 ml of culture).
Page 104
89
Figure 3-10: Size exclusion chromatography of recombinant fibrinogen-like domain
on a Superdex 75 16/60 column analysed on a 15% SDS-PAGE gel.
(A) The elution profile of the fibrinogen-like domain on a Superdex 75 16/60 gel filtration
column. The main peak lablled by red arrow is fibrinogen like domain is about ~ 80 kDa.
The first peak is aggregate. (B) Fractions were collected across the main peak of
fibrinogen-like domain and run on the SDS-PAGE under reducing with DTT (lanes 1-6)
and non-reducing without DTT (lanes 7-12) conditions.
Page 105
90
3.6.3 Analysis binding between recombinant Ply and L-ficolin
Binding of purified Ply to recombinant human purified L-ficolin was investigated
using a solid-phase binding assay in which Ply was immobilized in the wells of an ELISA
plate and incubated with increasing concentrations of recombinant L-ficolin. Bound
ficolin was detected using a polyclonal anti-L-ficolin antibody (Figure 3-11 A and 3-11
B). Surprisingly, no binding was detected between recombinant Ply and recombinant L-
ficolin. Two recombinant ply preps were used as labbled Ply and Ply1 in (Figure 3-11) to
confirm the result. L-ficolin did bind to acetylated BSA, a known ligand, indicating that
L-ficolin was functional. To exclude the unlikely possibility that bound L-ficolin was not
recognized by the antibody, the experiment was repeated using the same monoclonal anti
L-ficolin antibody used in the original published study (Figure 3-12). Again no binding
was detected. These studies suggest that the conclusions of the original study were
incorrect, possibly due to contamination of Ply preparations by an L-ficolin ligand.
Page 106
91
Figure 3-11: No binding between recombinant Ply and purified recombinant L-
ficolinby ELISA.
Nunc Maxisorp plate wells were coated with Ply and Ply1, acetylated BSA (Ac BSA) or
BSA and blocked with 1% w/v BSA. Purified recombinant L-ficolin was incubated
with the coated wells at room temperature and binding was detected using a rabbit
polyclonal anti L-ficolin antibody. The primary antibody was detected with an anti-
rabbit IgG antibody conjugated with alkaline phosphatase and the colour changed to
yellow. Absorbance was determined at 405 nm. The data was recorded in triplicate and
the error is the SEM. Graph pad Prism 7 programme was used to make the figures.
Page 107
92
Figure 3-12: L-ficolin binding to recombinant Ply using monoclonal anti L-
ficolin antibody by ELISA.
The experiment was carried out in the same way as in (Figure 3.17) above except that
binding was detected using a monoclonal anti L-ficolin antibody as the primary antibody,
and an anti-mouse IgG antibody conjugated with alkaline phosphatase for pNNP
substrate. The data was recorded in triplicate and the error is the SEM.
Given the unexpected findings described above, it was important to investigate what
might have gone wrong in the initial study. One possibility is that antibody might have
reacted against a contaminant in whole serum rather than L-ficolin. I therefore reproduced
the binding experiments described in the previous report using L-ficolin from human
serum. Binding was investigated using the same assay except that serial dilutions of serum
were used instead of purified L-ficolin. Binding was detected using the polyclonal anti-
L-ficolin antibody. As can be seen in (Figure 3-13) no binding was detected between Ply
and serum L-ficolin. As before L-ficolin bound to acetylated BSA but not the BSA
control. Experiments were repeated using different Ply preparations and using serum
from different donors. Thus L-ficolin does not bind to Ply. Moreover the previous
erroneous conclusion cannot be explained by the detection method. The most likely
explanation is that preparations of Ply were contaminated by the L-ficolin ligand.
0.01 0.1 1 10 1000.00
0.05
0.10
0.15
0.20
0.25
[L-ficolin] µg/ml
OD
405n
m
binding between ply and l-ficolin monoclonal antibody
Ply
Ac BSA
BSA
Page 108
93
3rd serum
0.0001 0.001 0.01 0.10.0
0.5
1.0
1.5
Serum %
OD
405 n
m
Ply AC BSA BSA
2nd serum
0.0001 0.001 0.01 0.10.0
0.5
1.0
1.5
2.0
2.5
OD
405 n
m
Serum %
Ply
AC BSA
BSA
Page 109
94
1st serum
0.0001 0.001 0.01 0.10.0
0.5
1.0
1.5
2.0
2.5
3.0
Serum %
OD
405 n
m
Ply
AC BSA
BSA
0.0001 0.001 0.01 0.10.0
0.5
1.0
1.5
2.0
2.5
3.0
3.5
Serum %
OD
405 n
m
Ply
AC BSA BSA
hany
serum
Page 110
95
Figure 3-13: ELISA binding of Ply with serum L-ficolin.
Nunc Maxisorp plate wells were coated with two Ply prep as designate as Ply, Ply1,
acetylated BSA (AC BSA) or BSA. 1% BSA was used for blocking the plate after that
the plate was incubated with serial dilutions of different serum from different donars.
After washing the binding was detected using a rabbit polyclonal anti L-ficolin antibody
as the primary antibody, and anti-rabbit IgG conjugated with alkaline phosphatase. After
incubation with pNNP substrate, absorbance was measured at 405 nm. The data was
recorded in triplicate and the error is the SEM. Graph pad Prism 7 programme was used
to make the figures.
sadam serum o/n readinfg
0.0001 0.001 0.01 0.10.0
0.5
1.0
1.5
Serum %
OD
405 n
m
Ply
AC BSA
BSA
0.0001 0.001 0.01 0.10.0
0.5
1.0
1.5
2.0
2.5
3.0
3.5
Serum %
OD
405 n
m
Data 1
Ply1
AC BSA
Ply2
BSA
Page 111
96
3.7 ELISA binding between Ply and IgG isotypes
An ELISA was performed to test binding between Ply and different IgG isotypes.
Following previous studies that described CP was activated on Ply pre-incubated with
polyclonal non-immune serum IgG preparations. I aimed to show which IgG isotypes
mediate this binding with Ply with using monoclonal IgG from human myeloma plasma
(Mitchell et al., 1991). Immobilized Ply was incubated with the serial dilutions of human
IgG isotypes including monoclonal IgG1, IgG2, IgG3 and IgG4. Monoclonal preparations
were obtained from the serum of myeloma patients, where one isotype of IgG is
overproduced. Unlike whole IgG, these IgGs are clonal so any binding is unlikely to be
caused by "classical" antibody-antigen interactions via the variable regions of the
antibody. Ply bound to the whole IgG, IgG2, IgG3 and IgG4 but not to IgG1 (Figure 3-
14 A and B).
Page 112
97
Figure 3-14: ELISA binding assay between Ply and IgG isotypes.
Nunc Maxisorp plate wells were coated with Ply and BSA. After coating plate was blocked with 1% BSA. After blocking plate was incubated with
serial dilutions of IgG isotypes. Binding was detected using anti-human IgG antibody, conjugated with alkaline phosphatase. After incubation with
pNNP substrate, absorbance was measured at 405 nm. The data was recorded in triplicate and the error is the SEM. Graph pad Prism 7 programme
was used to make the figures.
Page 113
98
3.8 ELISA binding between PlyD1-3 and PlyD4 with IgG isotypes
To localise the binding between Ply and IgG, binding was tested towards Ply fragments:
PlyD1-3 and PlyD4, produced as described in Chapter 2. As before, binding was
investigated by immobilizing the Ply fragments and adding each IgG isotype in turn.
Detection was using an anti-human IgG antibody. As shown in Figure 3-15 A, no binding
was detected between PlyD4 and IgG2, IgG3, IgG4 or IgG1. However, PlyD1-3 bound
to all IgG isotypes except IgG1 (Figure 3-15 B). Thus a similar binding pattern was
observed as with full-length Ply suggesting that Ply interacts through domains 1-3.
Page 114
99
Figure 3-15: ELISA binding of Ply domains with IgG isotypes.
Nunc Maxisorp plate wells were coated with Ply domains (PlyD4 and PlyD1-3) or BSA. Plate was blocked with 1% BSA. Then it was incubated
with serial dilutions of IgG isotypes. Binding was detected using anti-human IgG antibody, conjugated with alkaline phosphatase. After incubation
with pNNP substrate, absorbance was measured at 405 nm. The data was recorded in triplicate and the error is the SEM. Graph pad Prism 7
programme was used to make the figures.
Page 115
100
3.9 ELISA binding between Ply and Ply domains with IgG fragments
In order to localise the binding site on IgG, Ply was immobilized and incubated with the
serial dilutions of Fc and Fab. These fragments were generated by digestion of whole
antibodies (supplied by Athens Research), so comprise mixtures of IgG isotypes. Binding
was detected using the anti-human IgG antibody. It was found that, Ply bound to the Fab
fragment of IgG not to the Fc fragment (Figure 3-16 A). Similarly, PlyD1-3 also bound
to the Fab fragment, not to Fc (Figure 3-16 B). As expected, PlyD4 did not bind to the
Fab and Fc fragments (Figure 3-16 C). In summary, Ply binds to IgG3, 2 and 4 via the
Fab fragment of the antibody and D1-3 of Ply. These findings contradict previous work
that suggested Ply binds to the Fc portion of IgG (Mitchell et al., 1991).
Page 117
102
Figure 3-16: ELISA binding of Ply and Ply domains with IgG fragments.
Nunc Maxisorp plate wells were coated with Ply and Ply domains and BSA. Plate was
blocked with 1% of BSA. After that it was incubated with serial dilutions of Fab and Fc
fragments. Binding was detected using anti-human IgG antibody, conjugated with
alkaline phosphatase. After incubation with pNNP substrate absorbance was measured at
405nm. The data was recorded in triplicate and the error is the SEM. Graph pad Prism 7
programme was used to make the figures.
Page 118
103
3.10 Digestion of IgG4 with IdeS enzyme
To generate monoclonal Fc and Fab fragments, IgG4 was digested using IdeS enzyme,
which cleaves the IgG below the hinge region and produces two fragments: Fab2 and Fc
(An et al., 2014). IgG4 was chosen because it bound strongly to Ply in our assays. Because
cleavage is below the hinge the Fab fragment generated is a dimer (~100 kDa) linked by
disulphide bonds. Fragments were separated by gel filtration (Figure 3-17). Two peaks
were observed, a larger peak corresponding to the Fab2 fragment (~100 kDa) and a
smaller peak corresponding to Fc (~50 kDa). Fractions were collected across the Fab and
Fc peaks and analyzed by SDS-PAGE under reducing and non-reducing condition (Figure
3-18 A and B) respectively. Under non-reducing condition the Fab and Fc region migrated
at ~100 kDa and ~ 24 kDa respectively. Under reducing condition the Fab was separated
into two fragments of ~31 kDa and ~24 kDa corresponding to the heavy and light chains
respectively (Figure 3-18 B).
Page 119
104
Figure 3-17: Elution profile of an IgG4 digestion with IdeS enzyme on Superdex 200
16/60.
4 mg of IgG4 digested with IdeS enzyme 67 Unit/µl and incubated 5hr at 37°C and left
at 4°C overnight and subjected to gel filtration column. After digestion the IgG4 splited
into two parts include Fab2 and Fc fragment as labled in the figure. The small peak before
the Fab2 peak is the aggregates. Fab2 and Fc peaks were run on the SDS-PAGE.
Page 120
105
Figure 3-18: Analysis of digested IgG4 on SDS-PAGE.
(A) Under non-reducing condition. The Fab and Fc fragments migrate at the expected
molecular masses of ~>100 kDa and ~25 kDa respectively. (B) Digested IgG4 under
reducing condition the Fab2 is separated into two bands ~24 kDa and ~31 kDa, the light
and heavy chains.
Page 121
106
3.11 ELISA binding between monoclonal Fab and Fc with the Ply, PlyD1-3 and
PlyD4
In the previous experiment, Fc and Fab fragments were isolated from whole IgG, so
contain mixtures of the four IgG isotypes. Moreover, Fab fragments will be polyclonal.
Thus it is possible that binding of Ply to Fab could occur via antibody-antigen interaction.
The experiment was therefore repeated using monoclonal Fab2 and Fc fragments. The
result of this experiment was similar to the previous finding. Figure 3-19 A shows that
Ply and PlyD1-3 bound to the monoclonal Fab2. No binding was observed between Fc
and Ply, PlyD1-3 or to PlyD4 (Figure 3-19 B). Thus, this experiment confirms our
previous finding that the interaction between Ply and IgG was occurrs via PlyD1-3 and
the Fab of IgG.
Page 122
107
Figure 3-19: ELISA binding of Ply and Ply domains with the monoclonal Fab and Fc of digested IgG4.
(A) represents the binding between Fab with the Ply, PlyD1-3, PlyD4 and BSA. (B) represents the binding between Fc with the Ply, PlyD1-3,
PlyD4 and BSA. Nunc Maxisorp plate wells were coated with with Ply and Ply domains and BSA and incubated with serial dilutions of monoclonal
Fab and Fc fragments. Binding was detected using anti-human IgG antibody, conjugated with alkaline phosphatase. After incubation with pNNP
substrate, absorbance was measured at 405 nm. The data was recorded in triplicate and the error is the SEM. Graph pad prism 7 programme was
used to make the figures.
Page 123
108
3.12 ELISA binding between Ply D385N and IgG isotypes
Previous studies have suggested that the mutation D385N knocks out complement
activation (Mitchel and Andrew, 1997). Therefore, PlyD385N (produced in Lab 218) was
tested using the ELISA binding assay to see if loss of complement activity is caused by
loss of binding to IgG. As shown in (Figure 3-20) the point mutation D385N still bound
to IgG. Wild-type Ply and mutant D385N Ply showed similar binding to IgG2, IgG3 and
IgG4. No binding was detected with the IgG1. This suggests that failure to activate
complement by PlyD385N is not caused by loss of binding to IgG.
Figure 3-20: ELISA binding comparison of wild-type Ply and mutant PlyD385N
with IgG isotypes.
Nunc Maxisorp plate wells were coated with Ply, Ply D385N or BSA and incubated with
serial dilutions of IgG isotypes. Binding was detected using anti-human IgG antibody,
conjugated with alkaline phosphatase. After incubation with pNNP substrate, absorbance
measured at 405 nm. The data was recorded in triplicate and the error is the SEM. Graph
pad prism 7 programme was used to make the figures.
2/09/15 Binding between wt Ply and mutant D385N
0.01 0.1 1 10 100 10000.0
0.2
0.4
0.6
0.8
OD
405nm
Ab concentration µg/ml
IgG1& Wt Ply
IgG1& Ply D385N
IgG2&Wt Ply
IgG2& Ply D385N
IgG3& Wt Ply
IgG3& Ply D385N
IgG4& Wt Ply
IgG4& Ply D385N
Page 124
109
3.13 Inhibition assay
Inhibition assays were used to measure binding between components in solution. Plates
were immobilized with Ply and serial dilutions of Ply were incubated with a fixed amount
of IgG, Fab or Fc. The amount of IgG bound to the plate was detected using anti-human
IgG antibody. Figure 3-21 A shows that the whole IgG binds to Ply in solution leading
to a concentration dependent decrease in the amount of IgG binding to the plate. The IC50
(the concentration of an inhibitor where the response (or binding) is reduced by half) for
Ply with IgG was (3.8 mg/ml), figure B, shows that Fab fragment also binds to Ply in
solution. The IC50 was (4.5 mg/ml) after analyzing the data in Prism program, whereas
Fc fragment does not bind. The detecting antibody (anti-human IgG) recognizes both Fc
and Fab fragments. Thus, IgG binds tightly to Ply via the Fab fragment.
Page 125
110
Figure 3-21: Inhibition of binding of IgG, Fab and Fc to Ply.
In figure A , B 10 x serial dilution of Ply was incubated with IgG and IgG fragments (Fab or Fc) at concentration of 100 g/ml. 100 l from the
pre-incubated mixture was transferred to the Ply immobilized plate and absorbance measured at 405 nm. The data was recorded in triplicate and
the error is the SEM. Graph pad prism 7 programme was used to make the figures.
Page 126
111
3.14 Discussion
3.14.1 Binding between Ply and L-ficolin
Human L-ficolin is a soluble protein of the innate immune system that recognizes
pathogens through its fibrinogen-like domains and activates the LP through MASPs
(Vassal-Stermann et al, 2014). Previous published work (Ali et al., 2013) suggested that
L-ficolin also binds Ply. In this chapter, the interaction between Ply and human L-ficolin
was reassessed to characterize the interaction in more detail. Surprisingly, no binding
between Ply and L-ficolin was detected using native serum L-ficolin as well as
recombinant protein. Ply lysed RBCs (Chapter 4) and L-ficolin bound to acetylated BSA
(a known ligand) confirming that both components were functional. The most likely
explanation for the erroneous conclusions of the previous study was that the preparations
of Ply were contaminated by L-ficolin ligand. This finding highlights the importance of
using pure proteins in binding analysis, particularly in this case where a pathogen-
recognition receptor (L-ficolin) is used because even minor contamination from e.g. a
bacterial cell wall component can lead to false positives.
3.14.2 Binding between Ply and IgG isotypes
Ply activates the complement system through the CP by binding to IgG (Yuste et al.,
2005, Paton et al., 1984, Mitchell et al., 1991). The likely function of this interaction is
to deplete the host of complement components and diverting the immune response away
from the bacteria. This study was undertaken to better understand how Ply interacts with
IgG and identify which IgG isotypes interacts with Ply. My results showed that Ply bound
to IgG4, IgG3 and IgG2 but not IgG1 (Figure 3-14). The four IgG isotypes share greater
than 90% sequence identity, and the variation is mostly found in the hinge region and the
constant domain CH2 within the Fc fragment, which can be excluded (Vidarsson et al.,
2014). In this study all monoclonal IgGs had kappa light chains, so differences in binding
between IgG1 and IgGs 2, 3 and 4 must be due to differences in the heavy chain within
the Fab region. The sequence alignment of the CH1 region of each IgG isotype reveals
that three amino acids (CSR) are conserved in IgG2, IgG3 and IgG4. While they are
(SSK) in the IgG1 (Figure 3-22).
Page 127
112
Figure 3-22: Alignment of the IgG CH1 amino acid sequences.
The amino acid sequences are highly conserved in all IgG isotypes, but three amino acids
are conserved in IgG2, IgG3, and IgG4 (CSR) under line in black. In IgG1 is (SSK) under
line in red.
Ply bound to IgG4 but it is worth noting that the IgG4 does not activate complement.
Activation of CP complement pathway is initiated by human IgG subclasses in the rank
order IgG3 > IgG1 > IgG2 while IgG4 shows no significant activation (Burton and Woof,
1992, Isenman et al., 1975, Tao et al., 1993). The findings presented in this chapter
revealed that, the IgG Fab fragment bound to the PlyD1-3 of Ply, which is in contrast to
the previous study published in 1991 by Mitchell et al, where the Fc fragment was
identified. Binding to Fab would leave the Fc fragment free to interact with C1q.
Furthermore, this study showed that IgG2, IgG3 and IgG4 all bound to Ply D385N, which
was previously described as a mutant form of the toxin that was deficient in complement
activation (Mitchell and Andrew, 1997). Thus it can be concluded that failure to activate
complement by PlyD385N is not caused by a failure to bind to IgG as previously reported.
It was sugsted that the residue Asp 385 of Ply is provided in antibody binding via Fc
region. This binding cause activate of the CP.
Page 128
113
Chapter 4 Inhibition of Ply by disruption of intermolecular
packing
4.1 Objectives
Ply monomers pack side-by-side in crystals like the molecular packing of molecules in
the pre-pore complex (Marshall et al., 2015). The concave face of one monomer packs
against the convex face of its neighbour (Figure 4-1). There is some charge
complementarity between the convex (negatively charged) and concave faces (positive
charged). The concave interface comprises 44 binding residues whereas convex face has
41. The major contribution towards oligomerization on the membrane surface is likely to
be surface complementarity between the concave and convex interfaces, as there are
relatively few hydrogen bonds.
Figure 4-1: Packing of monomers in the Ply crystal reveals the packing of the pre-
pore complex.
Each molecule of Ply molecule packs against each other in both cancave and convex face. Such that the large concave side interacts with its partner’s convex side.
Page 129
114
To test whether the interactions observed in the crystal structure are important for pore
formation (Figure 4-2), residues at the interface were mutated and the cytolytic activities
of the resulting mutants were tested. Selected mutants include D205R, N339R and T304R
were also analysed by EM and calcein leakage from liposomes. As well as single mutants,
two disulphide-locked forms of Ply were created. Mutations were introduced into
residues in TMH1 and TMH2 with the aim of generating a locked form of Ply that can
still bind to membranes but cannot undergo the conformational changes to form pores.
Locked mutant contained pairs of Cys residues at specific sites in Ply. This was done in
order to lock different parts of the Ply molecule with the intention of preventing them
moving apart during pore formation. The amino acids that were replaced by Cys in Ply
were Thr 55, Val 163, Ala 262 and Trp 278. In this case Ply carries two mutations and
they created by SOE-PCR. The mutants included; Thr55Cys + Val163Cys (intended to
lock D2 to TMH1 of D 3 of Ply and A262 + W278C (intended to lock TMH2). The lock
mutants were designed by Adnan Muhammad at Leicester University. These mutants can
not form pores so they can be activated if DTT added to reduce the disulphide bond.
Page 130
115
Figure 4-2: Ply residues contribute in the intermolecular interaction.
(A) The convex and (B) concave interacting surfaces showing the electrostatic potential.
Regions buried by the interaction are shaded in yellow and purple and the key residues
are labelled.
To further study the mechanism of pore formation by Ply, individual fragments (PlyD1-
3 and plyD4 were crystallized. Although, PlyD1-3 crystals did not diffract, two separate
structures of PlyD4 were determined. The structures suggest that changes in the
conformation of the Trp rich-loop at the base of Ply upon membrane binding are likely to
facilitate the interaction between Ply monomers, by creating new interactions, thus
promoting oligomerization on the cell surface.
Page 131
116
4.2 Materials and methods
4.2.1 Materials
All PCR components that were used to make the single and double mutants are described
in section 2.2.1. The vector pLEICS-93 was provided by PROTEX at Leicester
University, PBS was purchased from Life Technologies. Guanidine-HCl (Gdn-HCl), L-
α-phosphatidylcholine, cholesterol, dihexadecyl phosphate, glycerol and calcein were
supplied by Sigma. Sheep red blood cells (RBCs) were provided by Thermo Scientific.
Nunc supplied the round and flat bottom 96 well plates. Crystallization screens:
Morpheus, PACT, JCSG, and Proplex were purchased from Molecular Dimensions. sLeX
was supplied by Calbiochem. Hidex sense plate reader, 96 well black plates was from
Perkin Elmer. MRC Maxi 48 well crystallization plates were purchased from the
Hampton Research, and TTP Labtech provided triple sitting drop 96 well plate.
4.2.2 Construction of Ply mutants by SOE-PCR
Point mutations were introduced into Ply by SOE-PCR (Hussain and Chong, 2016) using
a two-step procedure. Mutations were introduced by producing two half fragments, which
then combined to generate the full-length Ply gene sequence with the mutants by two
rounds of PCR. In the first round PCR the 5’ fragments of all mutants were generated
using 10 pmol of forward wild-type Ply pLEICS-93 primer with mutant reverse primers
as illustrates in (Table 4-1) (Thr88Glu, Arg226Ala, Thr304Arg, Leu11Arg, Asp205Arg,
Lys268Ala, Asn339Arg and Val341Arg). Similarly, by first round, PCR the 3’ fragments
were generated with 10 pmol reverse wild type Ply pLEICS-93 with forward mutant
primers (Thr88Glu, Arg226Ala, Thr304Arg, Leu11Arg, Asp205Arg, Lys268Ala,
Asn339Arg and Val341Arg). The PCR reaction was explained in section 2.2.7 with the
following settings: 5 min at 94°C, 50 sec at 94°C, 50 sec at 62°C, and 1 min at 72°C) for
32 cycles with a final cycle of 5 min at 72°C. Subsequently, the amplified PCR products
were run on 1% agarose gel in TBE buffer followed by purification from the gel with
Qiagen purification kit. Next, the second round PCR were performed to make the full
length Ply. Equal amount of both halves fragments of DNA (20 ng), was used to obtain
the full length Ply gene. In each case 2 µl of short fragment was mixed with the 4 µl of
long fragment with both external forward wt Ply and reverse wt Ply pLEICS-93 (Table
4-1) and the PCR was performed as normally done. PCR was carried out as described
previously using a denaturation step of 5 min at 94°C followed by 32 cycles of: 50 sec at
94°C, 50 sec at 62°C, and 1 min at 72°C. PCR products were run on 1% agarose gel and
Page 132
117
purified from the gel using a Qiagen purification kit. The resulting mutant Ply genes were
introduced into pLEICS-93 (Figure 4-3) by recombination. All clones were sequenced by
PNACL. Recombinant plasmids were transformed into E. coli BL21 (DE3) and proteins
were expressed and purified by Ni-Sepharose affinity chromatography and gel filtration
as described for wild-type Ply in section 2.2.6.
Table 4-1: Mutagenic Primer sequences to make the single point mutants.
Mutant amino acid nucleotides are shown in red, start and stop codons are shown in green
and aqua respectively. Wild-type is abbreviated to wt.
First round PCR Sequence 5’---------3’ Forward wt Ply pLEICS-93 GTATTTTCAGGGCGCCATGGCAAATAAAGCAGTAAATGACTT
Reverse Thr88Glu primer ATCGACCGCAAGAAGTTCGGGATTATTCTCTAA
Reverse Arg226Ala primer CTCTGCAGAAATTCCAGCCTGTTTTAAATCCTC
Reverse Thr304Arg primer CATATCCACCTTGCCACGTACAACTCGGGCACC
Reverse Leu11Arg primer ATCGTAATTCATAGCGCGTATAAAGTCATTTAC
Reverse Asp205Arg primer TGGATTTTTAACAGCACGTACGCTGACTGTATA
Reverse Lys268Ala primer AGCTACCTTGACTCCGGCTATCAAAGCTTCAAA
Reverse Asn339 Arg primer AAAGGTCGCAACTACGCGGTCACGTAAAAAAGA
Reverse Val341Arg primer ATTTTGAAAGGTCGCACGTACATTGTCACGTAA
Reverse wt Ply pLEICS-93 GACGGAGCTCGAATTTCACTAGTCATTTTCTACCTTATCTTCTA
Forward Thr88Glu primer TTAGAGAATAATCCCGAACTTCTTGCGGTCGAT
Forward Arg226Ala primer GAGGATTTAAAACAGGCTGGAATTTCTGCAGAG
Forward Thr304Arg primer GGTGCCCGAGTTGTACGTGGCAAGGTGGATATG
Forward Leu11Arg primer GTAAATGACTTTATACGCGCTATGAATTACGAT
Forward Asp205Arg primer TATACAGTCAGCGTACGTGCTGTTAAAAATCCA3
Forward Lys268Ala primer TTTGAAGCTTTGATAGCCGGAGTCAAGGTAGCT
Forward Asn339 Arg primer TCTTTTTTACGTGACCGCGTAGTTGCGACCTTT
Forward Val341Arg primer TTACGTGACAATGTACGTGCGACCTTTCAAAAT3
Second round PCR Sequence 5’---------3’
Forward wt Ply pLEICS-93 GTATTTTCAGGGCGCCATGGCAAATAAAGCAGTAAATGACTT
Reverse wt Ply pLEICS-93 GACGGAGCTCGAATTTCACTAGTCATTTTCTACCTTATCTTCTA
PCR was carried out as described previously using a denaturation step of 5 min at 94°C
followed by 32 cycles of: 50 sec at 94°C, 50 sec at 62°C, and 1 min at 72°C. PCR products
were run on 1% agarose gel and purified from the gel using a Qiagen purification kit. The
resulting mutant Ply genes were introduced into pLEICS-93 (Figure 4-3) by
recombination. All clones were sequenced by PNACL. Recombinant plasmids were
transformed into E. coli BL21 (DE3) and proteins were expressed and purified by Ni-
Page 133
118
Sepharose affinity chromatography and gel filtration as described for wild-type Ply in
section 2.2.6.
Figure 4-3: Vector map of pLEICS-9.
Page 134
119
4.2.3 Mutations in the TMH1 and TMH2 region of Ply
Mutations were also introduced into the TMH1 and TMH2 regions of Ply and two
disulphide-locked mutants were created. Oligonucleotide primers are shown in (Tables
4-1and 4-2).
Table 4-2: Primer sequences of the TMH1 and TMH2 mutants.
The cysteine codons in all primers are shown in a bold red.
Primers TMH1 Sequence 5’---------3’
Tyr55Cys forward AAGCGGAGCTTGTCGTGTAATACAAGTGATATT
Tyr55Cys reverse AATATCACTTGTATTACACGACAAGCTCCGCTT5
Val163Cys forward ATGGAACAACTCAAGTGTAAGTTTGGTTCTGAC
Val163Cys reverse GTCAGAACCAAACTTACACTTGAGTTGTTCCAT
Primer TMH2 Sequence 5’---------3’
Ala262Cys forward GATGAAGTAGAGGCTTGTTTTGAATCTTTGATA
Ala262Cys reverse TATCAAAGATTCAAAACAAGCCTCTACTTCATC
Trp278Cys forward GCTCCTCAGACAGAGTGTAAGCAGATTTTGACA
Ala278Cys reverse TGTCAAAATCTGCTTACACTCTGTCTGAGGAGC
4.2.4 Fluorescence spectroscopy
Fluorescence spectroscopy has long been used to study protein folding and dynamics.
The protein conformation changes are mostly dependent on the tryptophan (Trp) and
tyrosine (Tyr) residues because these are the natural fluorophores in proteins (Munishkina
and Fink, 2007, Zhang et al., 2013). The dominant source of the intrinsic protein
fluorescence is Trp, because it has the highest quantum yield. The Trp emission maximum
λem, max is sensitive to the polarity of its environment. The λem, max of buried of Trp is
around 335 nm, whereas for fully solvent accessible Trp this value increases to 355 nm
(Ghisaidoobe and Chung, 2014, Munishkina and Fink, 2007). The intrinsic fluorescence
of Phe in proteins is usually relatively unimportant (in proteins containing Tyr and Trp)
due to that phe has low absorptivity and quantum yield. The quantum yield of Tyr is
similar to Trp, but the Trp indole group is considered as the dominant source of UV
Page 135
120
absorbance at ~280 nm and emission at ~350 nm in proteins (Ghisaidoobe and Chung,
2014).
In this study, fluorescence spectroscopy was performed to investigate stabilities of all
mutants. Ply has 41 aromatic residues including 19 Tyr, 8 Trp and 14 Phe residues. Gdn-
HCl was used as the protein denaturant (Rashid et al., 2005).
4.2.5 Stability of mutants
Fluorescence spectra were taken for all mutants using a linear titration of Gdn-HCl over
the concentration range of 0.55-2.0 M. The protein concentration of all mutants was 1
µM in 20 mM Tris-HCl pH 7.5 in a totral volume of 300 µl in the low volume quartz
fluorescence cuvette (Sigma). Fluorescence measurements were performed using a
Fluoromax-4 (Horbia Jobin Yvon). Proteins were excited at 280 nm with a 2.5 nm slit
width and fluorescence was detected between 300 and 400 nm at 1 nm intervals with a
2.5 nm slit width. All spectra were collected at 20 °C. The cuvette was placed in the
heat block inside the fluorimeter for 150 sec to allow equilibration before collecting
spectra.
4.2.6 Preparation of liposomes
Liposomes were prepared according to (Nollmann et al., 2004) by mixing Chol/α-
phosphatidylcholine/dihexadecyl phosphate at a molar ratio of 130:130:13 µmoles (50,
100, and 7.1 mg) respectively. This mixture was dissolved in 5ml 1:1 (v/v)
methanol/chloroform in a volumetric flask and solubilized by shaking. Then it was dried
under a dry stream of nitrogen on ice. After all the liquid had evaporated, the translucent
lipid film was rehydrated in 5 ml PBS and dissolved by vortexing and sonicating at room
temperature for 90 sec and stored at 4oC for one week.
4.2.7 Fluorescence data collection with liposomes
Fluorescence spectra were collected with liposome for wild-type Ply and all mutantas
(Thr88Glu, Arg226Ala, Thr304Arg, Leu11Arg, Asp205Arg, Lys268Ala, Asn339Arg
and Val341Arg, Thr55Cys+V163Cys and A262Cys+Trp278Cys) against fixed
concentration of liposome. The final concentration of each mutant and cholesterol were
adjusted at 1μM, and 10μM in PBS respectively. First 270 µl of PBS mixed with 30 µl of
proteins and the spectra were collected. Then 270 µl of liposome mixed with 30 µl of
proteins and spectra were collected again in a totral volume of 300 µl in the low volume
Page 136
121
quartz fluorescence cuvette (Sigma). Fluorescence measurements were performed using
a Fluoromax-4 (Horbia Jobin Yvon). Proteins were excited at 280 nm with a 2.5 nm slit
width and fluorescence was detected between 300 and 400 nm at 1 nm intervals with a
2.5 nm slit width. All spectra were collected at 20 °C. The cuvette was placed in the
heat block inside the fluorimeter for 150 sec to allow equilibration before collecting
spectra.
4.2.8 Haemolytic assay
To prepare 1% v/v of sheep red blood cells (RBCs), cells were washed 3 times in chilled
PBS. Cells were pelleted by centrifugation at 1734 g, at 4°C for 15 min. Two-fold serial
dilutions of Ply were aliquoted into round-bottomed 96-well microtitre plates with a final
volume of 50 µl. These dilutions were mixed with an equal volume of 1% v/v sheep
RBCs. Plates were incubated at room temperature for 30 min, and then centrifuged at
1734 g, at 4°C to remove unlysed RBCs and cellular debris. Then 80 µl of the supernatant
was transferred into flat-bottomed 96-well microtiter plate, and the absorbance was
measured at 410 nm to measure haemoglobin.
4.2.9 Transmission electron microscopy (TEM)
Electron microscopy was used to check oligomerization of Ply on unilamellar liposome
vesicles. Each mutant (1µM) was mixed with a 1/50 dilution of liposomes in PBS and
left at room temperature for 10 min. Then 5 µl of each sample was applied to a freshly
glow-discharged 400 mesh carbon-coated grid (Agar Scientific Ltd). Grids were
discharged for 60 sec in a Q150T ES machine. The excess sample was removed by
touching a piece of filter paper to the side of the grid. Grids were negatively stained with
5 µl of 1% (w/v) uranyl acetate for 5 sec and immediately blotted dry. Then a further 5
µl of stain was added to the grid and left for 10 sec and blotted dry. Negatively stained
specimens were viewed on a JEOL 1400 TEM with an accelerating voltage of 100 kV.
The digital images were collected with a Megaview III digital camera with iTEM
software at Leicester University.
4.2.10 Preparation of liposomes with calcein
Unilamellar liposomes were prepared as described in section 5.4 and rehydrated in 1ml
of 70 mM calcein, it was dissolved in 1M KOH until dissolution occurred then the pH
was brought back to 7.4 by adding 2M HCl (Chongsiriwatana and Barron, 2010).
Unilamellar liposome vesicles were extruded 20 times through 1 μm polycarbonate
Page 137
122
membrane to entrap the calcein. The mixture was centrifuged at 500 rpm for 20 min and
the liposome pellet was washed in 1ml PBS four times to eliminate free calcein. The
liposome pellet was resuspended in 1ml PBS and stored at 4oC for one week.
4.2.11 Calcein-leakage assay
Leakage of the self-quenching calcein from liposomes upon exposure to Ply was
measured in a spectrofluorometer (HIDEX Sense) using Optiplate-96 F black bottom
(Perkin Elmer) at an λex of 485 nm and λem of 560 nm at 37oC. Complete release of calcein
was obtained by exposing liposomes to Triton X-100 at a final concentration of 0.25 mM.
Self-quenching calcein from the liposome vesicles were measured for the wild-type Ply,
mutant Asp205Arg, Asn339Arg, Ply D1-3 and PlyD4. In this experiment 2.5 µl of
liposomes with calcein was added to each well with a final volume of 100 µl with different
concentration of each protein (20 mM, 10 mM, 8 mM, 6 mM, 4 mM, 2 mM and 0 mM).
The kinetics mode of the spectrophotometer was measured every minute for about 30 min
at 37°C.
4.2.12 PlyD1-3 crystallization and optimization
Sitting drop were set up with commercial crystallization screens: Morpheus, PACT,
JCSGs, and Proplex by mixing 0.1 μl reservoir buffer with 0.1 μl of purified PlyD1-3 (10
mg/ml) on MRC crystallization plates using a Mosquito NanoDrop crystallisation robot.
Screens were tested at room temperature and at 4°C. After one-week crystals were
observed in most screens. The best quality crystals were observed in the Proplex screen:
0.2 M sodium acetate, 0.1 M sodium citrate pH 5.5 and 5% PEG 4000 at 4°C. Variants
of this condition were set up manually to try to improve the quality of the crystals by
changing the precipitant concentration. Table 4-3 shows the optimization buffers. For
larger drops, 1.5 μl of PlyD1-3 (10 mg/ml) was mixed with 1.2 μl reservoir buffer.
4.2.13 PlyD4 crystallization with sLeX
PlyD4 (5 mg/ml) crystallization trials were set up with sLeX trisaccharide (20 mM) using
JCSG and PACT screens as described in section 4.2.12. Plates were kept at room
temperature and checked daily. Promising crystals were observed in JCSG screen: 0.1 M
potassium thiocyanate, and 30% PEG MME 2000. Based on the initial screen, larger
drops were set up changing the concentration of the PEG precipitant to 15, 20, 25, 30, 35,
40%. 1.5 l of protein with sLeX was mixed with 1.2 l of the reservoir solution and
Page 138
123
incubated at room temperature. After one-month small crystals grew in 0.1 M potassium
thiocyanate, and 35% PEG MME 2000.
Table 4-3: Optimisation crystallisation condition for PlyD1-3.
1 100 mM HEPES pH 7.5, 8% ethylene glycol EG and 20%, 18%, 16%, 14%, 12%, 10% PEG
8000
2 200 mM Potassium thiocynate, 100mM BTP pH8.5 and 20%, 18%, 16%, 14%, 12%, 10%
PEG 8000
3 100 mM HEPES pH 7.5, 12% PEG 8000 and 14%, 12%, 10%, 8%, 4%, 2% EG
4 100 mM Trizma-Ac pH 8, 200mM potassium thiocynate and 20%, 18%, 16%, 14%, 12%,
10% PEG 8000
5 100 mM Trizma -Ac pH 8.5, 200mM potassium thiocynate and 20%, 18%, 16%, 14%, 12%,
10% PEG 8000
6 100 mM HEPES pH 7.5, 12% PEG 8000, 10% EG and different volume drops of the protein
and the buffers
7 100 mM HEPES pH 7, 10% EG and 20%, 18%, 16%, 14%, 12%, 10% PEG 8000
8 100 mM Trizma -Ac pH 8, 10% EG and 20%, 18%, 16%, 14%, 12%, 10% PEG 8000
9 100 mM Trizma -Ac pH 8.5, 10% EG and 20%, 18%, 16%, 14%, 12%, 10% PEG 8000
10 0.1 M Sodium acetate pH4.5 and 1.8, 1.6, 1.4,1.2 1 and 0.8M ammonium phosphate dibasic
11 0.2 M Sodium acetate, 0.1M sodium citrate pH 5.5 and 7% PEG4000 incubated at 4°C
12 0.1 M MgCl2, 0.1 M HEPES pH 7.5, 10% PEG 4000 at room temperature
13 0.2 M Sodium acetate, 0.1 M sodium citrate pH5.5 10% PEG4000 at room temperature
4.2.14 X-ray diffraction of PlyD1-3 and PlyD4 crystals
PlyD1-3 crystals were picked with litho loops in buffer containing 30% v/v glycerol as a
cryoprotectant. Crystals were frozen in a stream of nitrogen gas. Prof. Russell Wallis
carried out this work. Diffraction data were collected at 100K at beam line Diamond LS
and were analysed using CCP4 by Prof. Russell Wallis. Phases for the D4 structures were
determined using D4 of the Ply structure as a search model. Manual refinement in Coot
was used to optimize the models (Emsley and Cowtan, 2004) in combination with
refinement in Refmac5, part of the CCP4 software suite (Krissinel, 2015) and in Phenix
Page 139
124
(Adams et al., 2010).
4.2.15 Crystallization theory
150 years ago protein crystallization was discovered by chance and in the late 19th
century it was developed as a powerful purification tool and as a demonstration of
chemical purity (McPherson and Gavira, 2014). Two steps are generally used to obtain
crystals. The first is the identification of crystallization conditions, which depends on the
chemical, biochemical and physical conditions. Then, the crystal conditions are optimized
by changing the initial conditions by incremental amounts to obtain the better quality
crystal for diffraction analysis (McPherson and Gavira, 2014). Crystallization proceeds
in two inseparable steps: nucleation and growth. To obtain crystals, the protein is brought
to supersaturation. This is a non-equilibrium condition in which the concentration of
the macromolecule is increased above the solubility limit (McPherson and Gavira, 2014).
Weak protein-protein interactions that may be specific or nonspecific lead to crystal
formation, leading to nucleation, which is the critical step in the crystallization.
Nucleation is followed by crystal growth (McPherson and Gavira, 2014, Durbin and
Feher, 1996). The crystallization process encompasses four zones: undersaturation,
nucleation, metastable and precipitation zones (Figure 4-4) (Chayen, 2004). In the
precipitation zone, the protein concentration reaches a high supersaturation, so
precipitates. At lower concentrations the system moves to the nucleation zone where
nucleation can occur. Crystal growth occurs in the metastable zone. As the crystal grows
so the solubility of protein decreases. Eventually, crystal growth stops in the
undersaturation zone.
Page 140
125
Figure 4-4: Schematic diagram of protein crystallization phase.
The changeable factor can be additive concentration or precipitant, pH, temperature. The
solubility curve is defined as the concentration of protein in the solute that is in
equilibrium with crystals. Whereas, the supersolubility curve is defined as the line that
splits conditions where spontaneous nucleation or precipitation occurs from conditions
where the crystallization solution remains clear if it is left undisturbed. Four zones
including precipitation, nucleation metastable and undersaturation condition these zones
are produced as a result of the different degree of supersaturating conditions (Chayen,
2004).
4.2.16 X-ray diffraction
X-rays are specifically a powerful approach to achieving insight into the inner structure
of material because the wavelength of X-rays corresponds to the interatomic distances in
macromolecules. For this reason, constructive and destructive interference occurs
between X-rays that are scattered from atoms and the scattered waves are said to diffract
(Pouget et al., 1975). In 1912 Max von Laue and Co discovered that crystalline substances
act as three-dimensional diffraction gratings for X-ray wavelengths identical to the
spacing of planes in a crystal lattice (Bunaciu et al., 2015). X-ray diffraction is the most
contributive experimental method in structural biology.
Page 141
126
Figure 4-5: X-ray diffraction.
When X-ray beams hit the crystal, the beam is diffracted, depending on the arrangement
of atoms within the structure. At specific angles, constructive interference produces spots
on the film or detector.
Scattering can be detected when a large number of the molecules are arranged in a well-
defined configuration in the crystal. Typical X-ray wavelengths are about 0.1-100 Å,
which is on the order of the atomic spacing in a solid (Scheck, 2013). The diffraction of
the X-ray can be calculated by Bragg’s law: nλ = d2sinθ (n is an integer, the wavelength
of the X-rays is λ, the spacing between the planes in the atomic lattice is d, the angle
between the incident ray and the scattering planes as θ (Jenkins, 2000).
Page 142
127
Figure 4-6: The two-dimensional representation of the reflected X-ray from two
crystal planes.
Suppose that the X-ray beam is incident at the angle θ in one of the crystal plane then the
beam is reflected from an atom of both planes (upper and lower planes). The reflected
beam from the lower surface travels further from the upper surface reflected beam by a
distance of 2dsinθ. The reflected beam from both planes is combined to make the
constructive interface when this path difference is equal to some integral multiple of the
wavelength λ.
4.3 Results
4.3.1 SOE-PCR construction of single mutant Ply
In the crystal structure of Ply, individual Ply monomers are packed side-by-side, which
resembles the molecular packing of the pre-pore complex. To test whether the
intermolecular interactions observed in the crystal are also essential for the cytolytic
activity of the toxin, mutations were introduced into those residues at the interface. In
total eight point mutations were introduced. These mutations were designed to change
surface exposed residues and thereby to disrupt the intermolecular packing. Most residues
were changed to large charged groups (Glu or Arg) because these are likely to be most
disrupting of the surface complementarity: Leu11Arg, Thr88Glu, Asp205Arg,
Val341Arg, Thr304Arg and Asn339Arg (L11R, T88E, D205R, V341R, T304R and
N399R). Other mutations Lys268Ala, Arg226Ala (K268A and R226A) were made to
d
Incident X-ray Reflected X-ray
Crystal planes dsin
Upper plane
Lower plane
Page 143
128
disrupt polar intermolecular interactions.
SOE-PCR was used to generate all mutants of Ply using two rounds of PCR. In the first
round, the mutation was introduced into the Ply gene to create two overlapping fragments.
In the second round the fragments were amplified to generate the full-length mutant gene.
First round and second round PCR is shown for two of the mutants including Asp205Arg
(fragments of 615bp and 804bp) and Lys268Ala (fragments of 615bp and 804bp) both
mutants are designated as D205R and K268A in (Figure 4-7). A similar strategy was used
to create all mutants. Once the full-length mutant clones were produced, they were cloned
into pLEICS-93 by PROTEX. DNA sequencing by PNACL was used to verify the
mutations and to confirm that no additional changes were introduced by the PCR. Proteins
were expressed in BL21 (DE3) and purified by Ni-chromatography followed by size
exclusion chromatography on a Superdex 200 16/60 as described for the wild-type
protein. Yields of all proteins were high with ~35 mg of protein from 1L of culture.
Figure 4-7: SOE-PCR to introduce the mutations D205R and K268A into Ply.
In the first round, PCR products of 615 bp and 804 bp (D205R) and 804 bp and 615 bp
(k268A) were produced which matched the expected size of the fragments. These
products were combined to generate the 1416 bp gene of full length Ply.
Page 144
129
4.3.2 Mutations inTMH1 and TMH2 region of Ply
Two double mutants were introduced into Ply gene to create disulphide-locked mutants:
Thr55Cys+Val163Cys and Ala262Cys+Trp278Cys. These mutations were introduced
into the regions of Ply that form the transmembrane structures of the pore. D3 of Ply
consists of a 5-stranded antiparallel β-sheet that is surrounded by the two α-helical
bundles that become (TMH1 and TMH2) (Shepard et al., 1998, Shatursky et al., 1999,
Lawrence et al., 2015). When Ply binds to the membrane, TMH1 and TMH2 unfurl to
make two ß-hairpins, which insert into the membrane. TMH1 was initially identified in
PFO as residues S190-N217 (Shepard et al., 1998) and TMH2 as K288-D311 (Shatursky
et al., 1999). Residues M158-E187 (TMH1) and D257-Q280 (TMH2) represent the
corresponding stretches in Ply (Figure 4-8).
10 20 30 40 50 60
MANKAVNDFI LAMNYDKKKL LTHQGESIEN RFIKEGNQLP DEFVVIERKK RSLSTNTSDI
70 80 90 100 110 120
SVTATNDSRL YPGALLVVDE TLLENNPTLL AVDRAPMTYS IDLPGLASSD SFLQVEDPSN
130 140 150 160 170 180
SSVRGAVNDL LAKWHQDYGQ VNNVPARMQY EKITAHSMEQ LKVKFGSDFE KTGNSLDIDF
190 200 210 220 230 240
NSVHSGEKQI QIVNFKQIYY TVSVDAVKNP GDVFQDTVTV EDLKQRGISA ERPLVYISSV
250 260 270 280 290 300
AYGRQVYLKL ETTSKSDEVE AAFEALIKGV KVAPQTEWKQ ILDNTEVKAV ILGGDPSSGA
310 320 330 340 350 360
RVVTGKVDMV EDLIQEGSRF TADHPGLPIS YTTSFLRDNV VATFQNSTDY VETKVTAYRN
370 380 390 400 410 420
GDLLLDHSGA YVAQYYITWN ELSYDHQGKE VLTPKAWDRN GQDLTAHFTT SIPLKGNVRN
430 440 450 460 470
LSVKIRECTG LAWEWWRTVY EKTDLPLVRK RTISIWGTTL YPQVEDKVEN D
Figure 4-8: Ply amino acid residues forming TMH1 and TMH2.
Residues M158-E187 and D257-Q280 highlighted as black and navy blue bold
respectively form the TMH1 and TMH2 regions of Ply. Blue, green, red and black
residues indicate domains 1, 2, 3 and 4, respectively.
Page 145
130
Figure 4-9 summaries the construction of the double mutants (Thr55Cys+Val163Cys and
Ala262Cys+ Trp278Cys Ply genes encoding the locked mutants. Single mutations were
introduced first and these were used as templates to generate the final double mutant.
Mutant Plys gene were introduced into pLEICS-93 vector by recombination and were
produced in BL21 (DE3) as described for the single mutants.
Figure 4-9: Result of SOE-PCR showing the construction of the Ply
Thr55Cys+Val163Cys (TMH1) and Ala262Cys+Trp278Cys (TMH2) mutants.
PCR was used to produce the full-length double mutants Ply in a multi-step process.
Products from the initial reactions, after producing two half fragments were combined
and used as a template to generate the full-length single mutants Thr55Cys. This was used
as template to make Val163Cys and finally Thr55Cys+Val 163Cys was produced.
Ala262Cys was created and used as template to make Trp278Cys and finally
Ala262Cys+Trp278Cys was produced.
4.3.3 Cytolytic activities of Ply mutants
The haemolytic activities of mutant Plys was compared with wild-type protein using
sheep RBCs. Haemolysis was measured by absorbance at 410 nm to detect the released
haemoglobin following lysis. The ability of Ply to lyse sheep RBCs was reduced in all
mutations, but by different degrees, as shown in (Figure 4-10 A and Table 4-4). The
greatest effects were observed for Asn339Arg and Asp205Arg, which failed to lyse sheep
RBCs at the highest concentrations tested (10 μM) reflecting >3000-fold decreases in
haemolytic activity. Both mutations are located towards in the middle of the binding
Page 146
131
interface within D1. Other mutations including Thr88Glu and Arg226Ala in D1 also
caused substantial decreases of about 25.6 and 15.6 folds in their haemolytic activity
respectively. The mutation Thr304Arg within D3 resulted in a 300-fold decrease in the
hemolytic activity. The Thr side chain forms part of a β strand, which packs against the
hydrocarbon portion of side chain of Lys268. The activities of Leu11Arg and V341Arg
were also lower but only by ≤2-fold. Interestingly, these residues are situated in the
posterior region of D1 that forms the outer part of the pre-pore ring, Residues in this
region of the toxin may be less important for oligomerization, perhaps reflect some
flexibility when monomers assemble. In summary, disruption of the surface
complementarity and polar intermolecular interactions of Ply in the crystal structure also
reduce the ability of the toxin to produce pores. These finding support our hypothesis that
the packing observed in the crystal lattice mimics the packing of Ply during pore
formation.
Analysis of the two disulphide locked mutants showed that both had reduced haemolytic
(5%, 1.5% of Ala262Cys+Trp278Cys and Tys55Cys+Val163Cys of wild type Ply)
(Figure 4-10 B) activities, as expected, but neither completely abolished haemolysis. The
simplest explanation for the residual activity is that a small proportion of each mutant
contained reduced cysteine residues so could still form pores. As expected, neither D4
nor D1-3 had haemolytic activity (Figure 4-10 B), indicating that the full-length Ply is
required for pore formation. The hemolytic activity test of locked mutants were carried
out separately and highlited as grey in (table 4.4).
Page 147
132
Figure 4-10: Haemolytic activities of wild-type Ply, mutants Ply and ply truncated
fragments.
Figure A, and B is shown the haemolytic activity of single mutants, double mutants and
Ply fragments. The absorbance of haemoglobin was measured at 410nm absorbance after
30 min incubation at room temperature PBS was used as a negative control. The data
was recorded in triplicate and the error is the SEM. Graph pad prism 7 programme was
used to make the figures.
Page 148
133
Table 4-4: Cytolytic activity of wild-type Ply and Ply mutants. The haemolytic activity
of single mutants and double mutants were carried out at different time. Therefore, the
relative activity of wild-type Ply is different.
Protein EC50 (nM) Relative haemolytic activity
Wild-type Ply 2.6 1.0
L11R 4.6 0.565
T88E 76 0.034
D205R >10000 <0.0003
N339R >10000 <0.0003
R226A 48 0.054
T304R 900 0.0031
K268A 6.3 0.412
V341R 2.5 1.04
Wild-type 6.4 1
T55C+V163C 4.07 1.5
A262C+W278C 1.8 3.5
4.3.4 Stability measurement of mutants by Gdn-HCl denaturation
To check that change in haemolytic activities was not caused by destabilisation of the
mutants, proteins were denatured with Gdn-HCl and unfolding was measured by
fluorescence. Figure 4-11 shows the emission spectra of all mutants in increasing
concentrations of Gdn-HCl.
Page 149
134
300 350 4000
200000
400000
600000
800000
1000000
1200000
1400000
λ/nm
Flu
ore
scen
ce /
CP
S
Wild-type Ply 00.550.660.770.88
0.991.1
1.211.321.431.541.651.761.871.98
2.092.2
300 350 4000
200000
400000
600000
800000
1000000
1200000
1400000
λ/nm
Flu
ore
scen
ce /
CP
S
00.550.660.770.88
0.991.1
1.231.321.431.541.651.761.871.98
2.092.2
Lys 268Ala
Page 150
135
300 350 4000
200000
400000
600000
800000
1000000
1200000
1400000
λ/nm
Flu
ore
scen
ce /
CP
S
00.550.660.770.88
0.991.1
1.231.321.431.541.651.761.871.98
2.092.2
Arg 226Ala
300 350 4000
200000
400000
600000
800000
1000000
1200000
1400000
λ/nm
Flu
ore
scen
ce /
CP
S
00.550.660.770.88
0.991.1
1.231.321.431.541.651.761.871.98
2.092.2
Asp 205Arg
Page 151
136
300 350 4000
200000
400000
600000
800000
1000000
1200000
1400000
λ/nm
Flu
ore
scen
ce /
CP
S
00.550.660.770.88
0.991.1
1.231.321.431.541.651.761.871.98
2.092.2
Asn339Arg
300 350 4000
200000
400000
600000
800000
1000000
λ/nm
Flu
ore
scen
ce /
CP
S
00.550.660.770.88
0.991.1
1.231.321.431.541.651.761.871.98
2.092.2
Val 341Arg
Page 152
137
300 350 4000
200000
400000
600000
800000
1000000
1200000
1400000
λ/nm
Flu
ore
scen
ce /
CP
S
00.550.660.770.88
0.991.1
1.231.321.431.541.651.761.871.98
2.092.2
Leu 11Arg
300 350 4000
200000
400000
600000
800000
1000000
1200000
1400000
λ/nm
Flu
ore
scen
ce /
CP
S
00.550.660.770.88
0.991.1
1.231.321.431.541.651.761.871.98
2.092.2
Thr 88 Glu
Page 153
138
300 350 4000
200000
400000
600000
800000
1000000
1200000
1400000
λ/nm
Flu
ore
scen
ce /
CP
S
00.550.660.770.88
0.991.1
1.231.321.431.541.651.761.871.98
2.092.2
Thr 304 Arg
300 350 4000
200000
400000
600000
800000
1000000
1200000
1400000
1600000
λ/nm
Flu
ore
scen
ce /
CP
S
T55C+V163C 00.550.660.770.88
0.991.1
1.231.321.431.541.651.761.871.98
2.092.2
Page 154
139
Figure 4-11: Fluorescence emission spectra of wild-type Ply and mutants in Gdn-
HCl.
All mutant Proteins were excited at 280 nm with different concentration of Gdn-HCl from
(0.5-2.2) M with a 2.5 nm slit width and fluorescence was detected between 300-400 nm
at 1nm intervals with 2.5 slit width. All spectra were collected at 20°C. Each graph
represents the denaturation profile of each Ply toxin, where the protein was exposed to
0.55 M to 2.2 M Gdn-HCl M.
The fluorescence of the wild-type and all mutants were measured in increasing
concentrations of Gdn-HCl. In every case, the fluorescence intensity increased over the
range of 0.99-1.54 M of Gdn-HCl and then decreased from 1.54-2.2M of Gdn-HCl
(Figure 4-12 A). The changes probably reflect unfolding of the different Ply domains (e.g.
D4 and D1-3). Above 2.2 M Gdn-HCl, the fluorescence intensity did not change
suggesting that all toxins were fully unfolded. All mutants had the same denaturation
profile as the wild-type Ply, indicating that they are not destabilised appreciably by the
mutations. The shift in the fluorescence maximum is shown in (Figure 4-12 B). For each
protein the λem, max was between 347-349 nm at 1.65 M Gdn-HCl and increased to 352-
354 nm with increasing concentrations of Gdn-HCl. The graph represent tha data after
calculation of 1st derivative IN Origin programe. This is consistents with the buried Trp
residues becoming exposed to the polar solvent as the protein unfolds.
300 350 4000
200000
400000
600000
800000
λ/nm
Flu
ore
scen
ce /
CP
S
A262C+W278C 00.55
0.66
0.770.88
0.99
1.1
1.231.321.431.541.651.761.871.98
2.092.2
Page 156
141
Figure 4-12: Unfolding of wild-type and mutant Plys in Gdn-HCl.
(A) Shows the relative change in fluorescence intensity and B, change in, λem, max after
calculation of 1st derivative. It was calculated in origin programe (analyze, Mathatics and
then differenciate. (C) change in the relative intensity after finding of the area under curve
in Origin programe (analyze, Mathatics and then integrate). The experiment was carried
out using 1μM of the protein and λex = 280 nm.
0 .5 1 .0 1 .5 2 .0
0 .0
0 .2
0 .4
0 .6
0 .8
G d n -H C l /M
Re
lativ
e
ch
na
ge
in
in
te
ns
ity
W i ld - t y p e P ly
L e u 1 1 A r g
L y s 2 6 8 A la
A s n 3 3 9 A r g
V a l3 4 1 A r g
T h r 3 0 4 A r g
T h r 8 8 G lu
A r g 2 2 6 A la
A s p 2 0 5 A r g
C
Page 157
142
4.3.5 Liposome binding
The Gdn-HCl denaturation measurements confirmed that the mutations did not
compromise protein stability. To investigate membrane binding, Ply was added to
cholesterol-containing liposomes, and fluorescence was used to detect any changes in the
environment of the Trp residues. Data are shown in (Figure 4-13).
Page 158
143
250 300 350 400 4500
200000
400000
600000
800000
Wild-type Ply
l/nm
Flu
ore
scen
ce /C
PS
No liposome
Liposome
250 300 350 400 4500
200000
400000
600000
l/nm
Flu
ore
scen
ce /C
PS
Lys268Ala
No liposome
Liposome
250 300 350 400 4500
200000
400000
600000
800000
Thr88Glu
l/nm
Flu
ore
scen
ce /C
PS
No liposome
Liposome
250 300 350 400 4500
200000
400000
600000
Arg226Ala
l/nm
Flu
ore
scen
ce /C
PS
No liposome
Liposome
Page 159
144
250 300 350 400 4500
200000
400000
600000
800000
Asp205Arg
l/nm
Flu
ore
scen
ce /
CP
S No liposome
Liposome
250 300 350 400 4500
200000
400000
600000
800000
Asn339Arg
l/nm
Flu
ore
scen
ce /C
PS
No liposome
Liposome
250 300 350 400 4500
500000
1000000
1500000
Thr304Arg
l/nm
Flu
ore
scen
ce /
CP
S No liposome
Liposome
250 300 350 400 4500
200000
400000
600000
800000
Val341Arg
l/nm
Flu
ore
scen
ce /
CP
S No liposome
Liposome
Page 160
145
250 300 350 400 4500
200000
400000
600000
800000
Leu11Arg
l/nm
Flu
ore
scen
ce /
CP
S No liposome
Liposome
300 350 4000
500000
1000000
1500000
λ/nm
Flu
ore
scen
ce /C
PS
Thr55Cys+Val163Cys
No liposome
Liposome
250 300 350 400 4500
500000
1000000
1500000
Ala262Cys+Trp278Cys
l/nm
Flu
ore
scen
ce /C
PS
No liposome
Liposome
Page 161
146
Figure 4-13: Fluorescence emission spectra of wild-type Ply and mutants in the
presence and absence of cholesterol containing liposomes.
Final protein concentration and liposome were 1µm, 10 µm respectively. Proteins were
excited at 280 nm with a 2.5 nm slit width and fluorescence was detected between 300
and 400 nm at 1 nm intervals with a 2.5 nm slit width. All spectra were collected at 20°C.
Pink and green lines show the fluorescence spectra of protein with and without liposome
respectively.
Page 162
147
There are eight Trp residues in Ply with six in D4 and three of in the Trp-rich loop.
Incubating the toxins with liposomes, lead to a reduction in the λ em max indicating a change
to a more hydrophobic environment. This probably reflects Trp residues in the binding
loop becoming buried in the hydrophobic membrane. This is in agreement with a previous
study by (Ohno-Iwashita et al., 1988) on PFO toxin. Importantly, all the mutants behaved
similarly to the wild-type toxin indicating that the mutations do not prevent lipid binding.
Figure 4-14: Change in the λem max of wild-type Ply and mutants in the presence and
absence of liposomes.
The green dots represent the λem max of Ply in solution with liposomes, the red dots
show that same without liposomes. Ply has an initial fluorescence maxima wavelength
Between 343 and 347 nm that, on average, decreases by 5 nm with the addition of
liposomes. The λem max of all mutants decreases in the presence of liposomes, reflecting
a change in the location of one or more Trp residues into a more hydrophobic
environment. The λem max of each mutant is taken from the data and ploted against the
mutant’s name.
Page 163
148
4.3.6 Calcein leakage from liposomes in the presence of Ply
Ply point mutations Asp205Arg, and Asn339Arg completely abolished lysis of sheep
RBCs. To test the effect of the mutants on membrane integrity, calcein leakage from
liposomes was quantified by steady-state fluorescence spectroscopy. Calcein is a
fluorescent molecule that is self-quenching on membranes. Dissociation from the
membrane leads to an increase in the fluorescence (Menestrina, 1988) enabling the time
course of pore formation to be measured. Figure 4-15 shows the calcein fluorescence
changes from liposomes with wild-type Ply, Asp205Arg, Asn339Arg PlyD4 and PlyD1-
3. Leakage appears as an increase in the fluorescence, which reaches a steady state. To
calibrate the system, complete release of calcein was obtained by exposing liposomes to
Triton X-100, which dissolves liposomes by destabilizing their membranes (Lin and
Thomas, 2003). Wild-type Ply showed increasing calcein release over time. More release
was observed with increasing concentrations of Ply. By contrast no release was observed
with PlyD4 and PlyD1-3. No change of fluorescence was seen for either Asn339Arg or
Asp205Arg, confirming that neither mutant forms pores in synthetic liposomes.
0 10 20 30 400
20000
40000
60000
80000
Time/ min
Flu
ore
scen
ce i
nte
nsi
ty
Wild-type Ply
20 nM
10 nM
8 nM
6 nM
4 nM
2 nM
0 nM
Page 164
149
0 10 20 30 400
200000
400000
600000
800000
Time/ min
Flu
ore
scen
ce i
nte
nsi
ty
plyD1-3
20 nM
10 nm
8 nm
6 nm
4 nm
2 nm
0 nm
0 10 20 30 40
20000
40000
60000
80000
Time/ min
Flu
ore
scen
ce i
nte
nsi
ty
PlyD4
20 nM
10 nm
8 nM
6 nM
4 nM
2 nM
0 nM
Page 165
150
Figure 4-15: Calcein release from liposomes by Ply. Calcein leakage was measured
as a function of time.
Protein concentration was 1µm and no release was detected for PlyD4, and plyD1-3 or
for the point mutants Asp205Arg or Asn339Arg, indicating that they do not form pores
in liposomes, unlike wild-type Ply.
0 10 20 30 40
20000
40000
60000
80000
Time/ min
Flu
ore
scen
ce i
nte
nsi
ty
Asn339Arg
20 nM
10 nM
8 nM
6 nM
4 nM
2 nM
0 nM
0 10 20 30 400
20000
40000
60000
80000
Time/ min
Flu
ore
scen
ce i
nte
nsi
ty
Asp205Arg
20 nM
10 nM
8 nM
6 nM
4 nM
2 nM
0 nM
Page 166
151
4.3.7 Pore formation of Ply on Chol-containing liposomes by EM
Wild-type Ply, and selected mutants were incubated with Chol-containing unilamellar
liposomes to visualize their oligomeric structures by negative-stain electron microscopy.
Mixtures were stained with 1% uranyl acetate on a copper grid, and oligomers were
visualized by transmission EM. As shown in (Figure 4-16) wild-type Ply formed
complete rings that covered most of the liposomes indicated in the figure by cyan arrows
(Koster et al., 2014, Sonnen et al., 2014). The interior of lysed liposomes stained more
darkly indicating that transmembrane pores were formed and the lipid was removed
(Dang et al., 2005). In contrast, the non haemolytic mutant Asp205Arg bound to and
oligomerized on unilamellar liposomes mainly in the form of long chains (Figure 4-17
orange arrow). The Ply monomers still self-associated, but these structures did not form
pores. Ply Asp339Arg, which is also non haemolytic, did not form pores or arcs. Instead
the mutant appeared to completely cover the liposomes which remained undamaged (with
no darker internal staining) (Figure 4-18, blue arrow). PlyD4 also bound the membrane
to form arrays (Figure 4-16 by the green arrow). The mutant Thr304Arg reduced the
haemolytic activity of Ply by ~300-fold. It is located in the domain 3. Addition of
Arg prevent the threonine side chain forms part of a β strand that packs against
the hydrocarbon portion of the side chain of Lys268. This strand may displaced
upon oligomerisation on the membrane to allow the monomers to pack together
to form the ring. To visualize the oligomeric structures of T304R negative-stain electron
microscopy was performed. The mutant was incubated with unilamellar liposome
membrane and after that checked by the transmission EM. As shown in (Figyre 4-16)
mutant Thr304Arg can form complete ring and incomplete ring on the liposome
membrane.
Page 167
152
Figure 4-16: Negative-stain EM of wild-type Ply, mutants Ply Thr304Arg, and
PlyD4 with unilamellar liposome containing-Chol.
Liposomes were incubated with wild-type Ply, mutant Ply and PlyD4 for 10 min at room
temperature and imaged by EM. The complete ring is produced by the wild-type Ply; In
the case of PlyD4, it is also oligomerized on the membrane as an array.
Wild-type Ply
Wild-type Ply Wild-type Ply
Unilamellar liposome Unilamellar liposome Wild-type Ply Complete ring
Complete ring
Ring chain D205R
Linear array PlyD4 PlyD4
T304R
Page 168
153
Figure 4-17: Negative-stain EM of Ply Asp205Arg, with the unilamellar liposome
containing-Chol.
Liposomes were incubated with Asp205Arg mutant for 10 min at room temperature and
imaged by EM. This mutant makes chain like structures. The scale bar is written in the
bottom right of each image, which is 100 nm.
Asp205Arg Asp205Arg
Asp205Arg Asp205Arg
Chain like structure
Chain like structure
Page 169
154
Figure 4-18: Negative-stain EM of Ply Asn339Arg, with the unilamellar liposome
containing Chol.
Liposomes were incubated with Asp339Arg mutant for 10 min at room temperature and
imaged by EM. This mutant only coats the liposomes. The scale bar is written in the
bottom right of each image, which is 100 nm.
4.3.8 Crystallization of PlyD1-3 and D4
Crystals of PlyD1-3 were grown in 0.1M sodium citrate pH 5.5, containing 0.2M sodium
acetate and 7% PEG 4000 at 4°C by the sitting drop method. Cryoprotected crystals were
picked, and tested for diffraction at 100K; but unfortunately no crystals diffracted.
Crystals of PlyD4 were grown in 0.1M potassium thiocynate containing 35% PEG MME
2000 at room temperature. Crystal took ~4 weeks to grown and diffracted to 2.1Å
resolution at Diamond Light Source. Two different structures were determined only one
structure is shown in (Figure 4-19). Refined models had good stereochemistry (Table 4-
7). Although crystals were grown in the presence of sialyl Lewis-X (which is proposed
to serve as a co-receptor on host cells (Shewell et al., 2014), no sugar was detected in the
Asn339Arg
Asn339Arg Asn339Arg
Monomer oligomerization
Monomer oligomerization
Page 170
155
density map (Figure 4-19). Structures were solved by molecular replacement using the
structure of the full-length Ply as a search model.
Figure 4-19: PlyD4 crystal structure the Trp loop in the green structure is flip down.
PlyD4 is the binding domain of Ply. This domain was crystalized after one-month and
small crystals grew in 0.1 M potassium thiocyanate, and 35% PEG MME 2000. The Trp
loop is responsible for binding to cholesterol, its receptor in the membrane. The protein
data bank ID of PlyD4 is 5CR8.
In the structure of full-length Ply, the Trp-rich loop is extended as would be expected
when bound to a membrane. In the structures of PlyD4 alone, the loop is partially folded
back (Figure 4-20). In the PFO structure the loop is fully bent back against the body of
D4 (Rossjohn et al., 1997). Taken together the structures are consistent with the previous
suggestion that when the toxin binds to the membrane of mammalian cells the loop
springs outwards and downwards to project into the membrane (Rossjohn et al., 1997).
Page 171
156
Figure 4-20: Ply domain structure and the likely changes upon membrane binding.
(A) Domains 1, 2 and 3 are contiguous and connected to the C-terminal membrane-
binding domain (D4) via D2. The protein data bank ID of Ply is 5CR6. (B) Overlay of
D4 of full-length Ply, PlyD4 and perfringolysin O (PFO; PDB: 1PFO) structures. The
structures show the likely changes that occur upon membrane binding. Remarkably, the
Trp-rich loop flips outwards and downwards (cyan arrow) showing Trp433, to enable
binding to the membrane (Marshall et al., 2015). The protein data bank ID of PlyD4 is
5CR8.
Page 172
157
Table 4-5: Data collection and refinement statistics (Marshall et al., 2015).
Data collection PlyD4
PDB ID 5CR8
Beam Line Diamond I03
Space group I121
a,b,c, Å 48.7, 47.7, 97.5
α, β,γ , ° 90, 101.4, 90
Resolution, Å 46.53 – 2.05 (2.12 – 2.05)
Rsym 0.091 (0.451)
I/σ(I) 6.8 (2.0)
Completeness 99.4 (97.8)
Redundancy 2.9 (2.4)
Refinement
Resolution 46.53 – 2.05 (2.12 – 2.05)
No. reflections 40468 (2447)
Rwork/Rfree 0.218/0.271
No of atoms 2021
Protein 1870
water 151
B-factors, Å2 35.0
Protein 35.1
water 33.6
Rms deviations
Bond lengths, Å 0.004
Bond angles, ° 0.83
Page 173
158
4.3.9 Discussion
Pore formation by Ply kills host cells and plays a major role in the damage caused during
pneumococcal infections. In this chapter, mutations were introduced into Ply with the aim
of disrupting packing between adjacent molecules during pre-pore and pore-formation.
Residues were selected based on the recent crystal structure of Ply in which monomers
pack side-by-side in linear arrays. Eight mutations were made: Leu11Arg, Asn339Arg,
Asp205Arg, Thr88Glu, Arg226Ala, and Val341Arg in D1, Lys268Ala and Thr304Arg in
D3. When tested all 8 mutations reduced the ability of Ply to lyse RBCs, confirming that
these residues are important and supporting the hypothesis that the packing of molecules
in the crystals mimics the interactions that occur during pore formation. Several other
CDCs have been crystallized. Although most pack differently, two recent structures of
intermediolysin and listeriolysin O, show similar side-by-side packing to Ply (Johnson et
al., 2013). Interesting contacts in the three structures involve equivalent regions of the
CDC polypeptides, and many of the interacting residues are conserved, suggesting that
CDCs pack together in the same way during pore formation (Marshal et al., 2015). In
line with our findings Lawrence et al. and Van et al. also showed that the mutations in
Ply interface residues significantly influence the Ply pore formation activity (Lawrence
et al., 2015, van Pee et al., 2016). This confirms the idea that the monomer-monomer
interactions observed in the structure are necessary for pore-formation by the CDCs
(Hotze et al., 2012).
Mutations in this study were mostly located in PlyD1 and PlyD3, because these regions
form the majority of the interface between monomers. During pore formation, PlyD4
anchors Ply to the membrane. PlyD1 participates in oligomerization and acts as a bridge
between D2 and D3. PlyD3 undergoes a large conformational change in which the helical
regions form β-hairpins that penetrate into the membrane (Tween et al 2005, Tilley et al.,
2005). PlyD2 is relatively mobile and collapsed down and rotates as the pre-pore is
converted to the functional pore.
As indicated above, all mutants reduced the haemolytic activity of Ply but to different
degrees. Remarkably, two mutants Asp205Arg and Asn339Arg completely lost their
haemolytic activities. Stability and membrane binding tests showed that the loss of
haemolytic activity was not caused by destabilization of Ply or a failure to bind to
cholesterol-containing membranes. Interestingly, EM indicated that loss of activity was
Page 174
159
caused by distinct changes in the Asp205Arg and Asn339Arg mutants (Figure 4-17 and
4-18). Ply Asp205Arg monomers oligomersized on the membrane to form linear chains,
but these structures were not curved and failed to make pores in the membrane.
Alternatively, mutant Asn339Arg was still able to bind to the membrane, but monomers
could not oligomerize. Overall both residues are important for oligomerization and
assembly of functional pores. This interesting finding provides further understanding of
Ply oligomerization on the cell surface and could facilitate the production of inhibitors
for Ply toxin.
Finally, PlyD4 was successfully crystallized to give two new structures. The Trp-loop is
partially folded back against the body of Ply. In solution it is likely that the Trp loop is
fully bent back as seen in the structure of PFO structure (Rossjohn et al., 1997). Upon
membrane binding the loop moves away and swings outward and downwards enabling
interaction with the cell membrane. This conformation change at the base of the toxin
promotes monomer-monomer interactions upon membrane by binding the loop that
springs outwards and downwards, allowing additional contacts between D4 of adjacent
monomers.
Page 175
160
Chapter 5 The conversion of monomers of Ply to pre-pore
complexes promotes microdomain formation in lipid bilayers
5.1 Raman spectroscopic analysis of lipid bilayers
5.1.1 Raman spectroscopy
Raman spectroscopy is the optical analysis technique discovered by Professor Sir
Chandrasekhara Venkata in 1928. He was awarded a Nobel Prize in 1930 for his work on
this phenomenon (Lawton et al., 2014). Raman spectroscopy is the useful technique to
determine the chemical composition and molecular structures in cells and tissues. It is
defined as a vibrational spectroscopy technique, which occurs as a result of interaction of
light with molecules leading to inelastic scattering. The shift in the wavelength gives
information about the frequencies of vibrational modes of molecules present in the
sample (De Luca et al., 2015). This technique is mostly used in biology, analytical
chemistry, and medicine specifically to identify molecular fingerprints of disease and
evaluation of living cells and tissues (Redding et al., 2015). When the light is passed
through the transparent substance, it can be elastically scattered by the molecules with
the same frequency. This is known as Rayleigh scattering (Lambert et al., 2006). In the
Raman effect the incoming wavelength is different from the scattered wavelength i.e. this
is an inelastic light scattering process (Lambert et al., 2006). Raman scattering is
classified into two different kinds: Stokes and anti-Stokes scattering. In Stokes
scattering, the photons have lost energy to the molecules, whereas, in anti -Stokes
scattering, the photons have gained energy from the molecule (Richard, 2001). Both
scattering include the Raman scattering types and the Rayleigh scattering (Figure 5-1).
Page 176
161
Figure 5-1: Rayleigh and Raman scattering.
The molecule is excited light from its ground state to the virtual state. Left: Rayleigh
scattering. Middle: Stokes Raman scattering. Right: anti-Stokes Raman scattering.
Inelastic scattering therefore; their previous and the electronic ground state are different.
5.1.2 Lipid Raman spectra
Lipids are an important class of biomolecules; particularly they are important in cellular
signaling, energy storage and component of the cells membrane. Raman spectroscopy can
be used to deduce the lipid composition and structure (Kochan et al., 2013). Biological
membranes contain phospholipids with different chemical structures and degree of
saturation, such as the phosphatidylcholine and phosphatidylethanolamine are saturated
and unsaturated lipid respectively. However, they have similar properties because both
are composed of two fatty acid chains with identical glycerol-based backbones and their
acyl chains are approximately equal in length (Czamara et al., 2015). Raman spectroscopy
in combination with optical tweezing was used to study the structure of the LUVs lipid
Page 177
162
bilayer. The hydrophobic lipid tail groups at 1050-1150 cm-1 and 2800-3200 cm-1
respectively represent the Raman spectra of the skeletal C-C and C-H starching mode of
the lipid bilayer. This was the first example of the Raman spectrum recorded from the
individual vesicles (Cherney and Harris, 2010). In addition, Raman spectroscopy in
combination with optical tweezers was also used to analyse the composition of the
liposome membrane by Sanderson and Ward (Sanderson and Ward, 2004). The Raman
assignment peaks of some lipids are well established. For example, 2851 and 2882 cm-1
represent the symmetric (d+) and antisymmetric (d-) methylene stretching vibrations of
DMPC respectively (Lhert et al., 2002, Snyder et al., 1982). However, in the bilayer of
POPC, the methylene stretching is at 2855 cm-1 and 2893 cm-1 ; the latter value is shifted
to higher frequency because the lipid chains are more fluid (Snyder et al., 1982, Aslanian
et al., 1986). The shoulder at 2928 cm-1 and the peak around 2972 cm-1 is assigned to a
Fermi resonance of the symmetric methyl stretch (rFR+) and antisymmetric methyl stretch
(r-) respectively of the fatty acid chains (Lhert et al., 2002). The lipid Raman spectrum is
characterized by the presence of the hydrocarbon chain, which is observed in three
regions for all lipids including 1500-1400, 1300-1250 and 1200-1050 cm-1 in the
fingerprint. The bands in the 1500-1400 cm-1 range is the CH2 assignment fingerprint and
~1300 cm-1 is assigned to the CH3 vibrations groups in the lipids. Bands in the 1200-
1050cm-1 regions are attributed to the C-C stretching vibrations, which represent the
skeletal modes. It needs to be taken account that the Raman spectra of individual lipids
are considerably different according to their saturation, phase, geometrical isomerism and
polymorphic/polytypic and presence of a hydrophilic group (Czamara et al., 2015).
It is very well understood that the transition temperature are different for different lipid
molecules such as POPC, DPPC, DOPC, DLPC and PC24. They are different in their
temperature of the gel phase to the fluid phase (Dmitriev and Surovtsev, 2015). The
disordering process in the lipid bilayer from gel to fluid is determined by different
structural and spectroscopic techniques including infrared absorption, electronic spin
resonance, NMR and Raman (Binder et al., 1998, Naumann et al., 1992, Heimburg et al.,
1992, Sassi et al., 2015). It has been reported that the frequency of the CH2 peak positions
increase with the increasing of the temperature; for example they are increased by about
2 cm-1 at 50 K and 263 K, larger increase of temperature is caused transition from gel-
fluid phase (between 263 K and 275 K) (Surovtsev and Dzuba, 2014, Kodati et al., 1994,
Casal and Mantsch, 1984). The conversion from gel to liquid-crystalline phases is
Page 178
163
accompanied by an increase in the symmetric CH2 stretching band in both FTIR and
Raman spectra; the wavenumber shifts from 2851-2853 cm-1 in the FTIR spectra of
hydrated lipids; similarly in Raman spectra, the wavenumber is shifted from 2851.5-
2853.5 cm-1 (Sassi et al., 2015). In addition, when cholesterol is added to DPPC and
POPC lipids near the gel-fluid phase transition, the Raman frequencies for both CH2 and
C-C stretching are altered (Surovtsev and Dzuba, 2014). Raman spectroscopy can be
combined with optical tweezing (known as Raman tweezing) to enable a confocal
spectroscopic measurement on cell-sized structures. This was used first time in 1986 and
has recently been extended to trap and record the Raman spectra from particles in
microfluidic flow channels (Redding et al., 2015). Raman Tweezers are typically
composed of two lasers: one for trapping a cell-sized particle and another for Raman
excitation. The lasers can be configured on a microscope apparatus (Ajito and Torimitsu,
2002).
5.1.3 Optical tweezers (OT)
Different types of synthetic bilayers can be studied. Two common variants are solid-
supported planar lipid bilayers and unilamellar lipid vesicles. The former is unsatisfactory
for the study of transmembrane protein complexes because the solid support would
interfere with penetration of the protein in the lipid bilayer. Thus, we have utilised
unilamellar lipid vesicles in this research. There is a very useful approach that can be used
in experiments employing unilamellar lipid vesicles in which a single vesicle is
suspended at a fixed point in a liquid sample by OT. Physical changes to the single vesicle
can then be monitored by optical microscopy or microspectroscopy. Arthur Ashkin
discovered the physical principles of optical tweezing (OT) in 1970 (Heller et al., 2014).
He showed that the radiation pressure from the laser beam causes the acceleration of
microparticle (Ashkin, 1970), and two counter propagating beams could create an optical
trap for the particle by the radiation pressure. Later, he showed that a single laser beam
could lead to levitation of the microparticle by the balance of the radiation pressure and
the gravitational force on the particle (Ashkin and Dziedzic, 1971). OT is attractive
because of its capability as a non-contact and non-invasion method that can be widely
used in different applications in physics, biology, chemistry, medical science and
nanoscience (Guo and Li, 2013). Another configuration of OT uses a highly focused laser
beam to trap particles. The laser beam is focused by a high-quality microscope objective
Page 179
164
to a diffraction-limited spot in the specimen plane, which makes an optical trap to hold a
small particle at the beam waist (Guo and Li, 2013). OT is a useful tool for the trapping
and manipulation of biological cells, and has been utilised in different areas in biomedical
research, such as fertilization, cell-cell interaction, cell adhesion, embryology,
microbiology… etc (Zhang and Liu, 2008).
The mechanism of trapping by a highly focussed laser beam relies on two kinds of forces
namely scattering force which tends to push the particle along an axis parallel to the
direction of light propagation and the gradient force which tends to pull the particle
towards the high intensity region. The gradient force is produced by the field gradient
density (Figure 5-2) (Zhang and Liu, 2008, Basu et al., 2010, Redding et al., 2015). Both
forces exerted on the particle depend on the particle size (r) and the wavelength of the
laser beam (λ) (Zhang and Liu, 2008). Optical trapping is usually performed with deep
red and near-infrared lasers. The short wavelengths of the laser minimise photon damage
to the trapped particle (Celliers and Conia, 2000). A particle trapping by the OT is
classified into three different regimes including Mie regime (r≫λ); Rayleigh regime
(r≪λ); and regime in between them (r∼λ). If a particle is within the Mie scattering region,
which is when the particle is of the identical scale as the incident light. The optical force
can be divided into two components. The first component is the pressure force resulting
from the back scattering of incident photons from the laser; this force acts along the
direction of the propagating laser beam. The second, and more important form of energy
transfer occurs through the refraction of photons through the particle (Ashkin, 1992).
Page 180
165
Figure 5-2: The gradient force mechanism in OT.
The objective lens of the microscope focuses the light to a diffraction-limited beam waist,
to create a three-dimensional light gradient.
5.1.4 Microfluidic device
This device makes it possible to deliver unilamellar vesicles into an optical tweezer, and
then after a single vesicle is held by the tweezers, the surrounding fluid can be exchanged.
How this is done is explained in the next section. Microfluidic devices enable small liquid
volumes of liquids to be controlled precisely (Tehranirokh et al., 2013). According to the
microfluidic technology liquid flow can be manipulated in channels with dimensions of
(10-100) micrometers (Yu et al., 2009). The microfluidic system allows two various
solutions to flow without mixing in a channel. The micro channels lead to interesting flow
characteristics that are integral to the function of microfluidic devices (Eriksson et al.,
2007).
The fluid flow in the microfluidic device is controlled by the Reynolds number which is
defined as the ratio of momentum forces to viscous forces (Squires and Quake, 2005).
The Reynolds number equation is shown as Re = v d /, (d represents the pipe
diameter, v is the average velocity, and ρ is the fluid density and μ is the dynamic viscosity
(Saint-Michel et al., 2014).Three types of fluid flow in the channel pipe have been
described: turbulent, laminar and transient. For instance, if the Re value is lower than
2300, the flow is laminar and the two fluids will flow in parallel streams to each other
without mixing; whereas, if Re 4000, the flow is turbulent and both fluids are mixed
Page 181
166
completely. In addition, if Re 2300 < Re < 4000, the flow is transient and the fluids will
be partially mixed (Squires and Quake, 2005). Microfluidic devices are produced by Soft-
lithography with an elastomer rubber, polydimethylsiloxane (PDMS) (Velve-Casquillas
et al., 2010).
5.2 Objectives
In this chapter, the structural changes of the lipid bilayer in a liposome is described once
exposed to Ply and a number of Ply mutants. Using a combination of OT, microfluidic
device and Raman spectroscopy. A microfluidic device was created to allow
manipulation of the liposome into a solution of Ply using OT. It is consisting of laser
beam tightly focused through an objective lens, which is used to isolate single particles
in suspension. A change in the structure of the lipid membrane in a liposome (~1 µm in
diameter unilamellar vesicles) was detected by measuring inelastic back-scattered light
via Raman spectroscopy.
5.3 Materials and methods
5.3.1 Materials
Chol, POPC, Micro-Extruder and polycarbonate membrane were supplied by Avanti
polar lipid. Boron-doped silicon (100) wafer purchased from (MicroChemical GmbH),
negative photoresist (SU-8-2002) supplied by (MicroChem Crop). The base hardener
silicon adhesive with Trimethylisocyate and 85% oil immersion were purchased from
the Sigma 1.0 mm biopsy puncher was purchased from World Precision Instruments.
5.4 Preparation of lipid vesicles (Liposomes)
Different batches of liposomes were prepared: pure POPC, binary mixtures of
POPC/Chol (1:1, 1:2 and 4:1 mole ratio) and a ternary mixture of POPC/Chol/SM (1:1:1).
Liposomes were prepared according to the Avanti Polar Lipids protocol 10 mg POPC
was mixed with 5 mg Chol (for a 1:1 mole ratio) they were dissolved in 1ml chloroform
this was dried under a gentle stream of N2 at room temperature to evaporate the solvent
completely. After that the white film rehydrated in 1 ml PBS. Then it was extruded 20
times through the 1μm pore size polycarbonate membrane at 50oC in order to control the
phase transition temperature. In addition, to produce LUVs that are homogeneous with
Page 182
167
the respect of size but might be different in the composition. Liposomes were stored at
4oC and used within a week.
5.5 Microfluidic laminar flow cell
A microfluidic device was prepared to enable controlled mixing of a single liposome in
PBS with a solution-containing Ply that is flowing in parallel by laminar flow.
Microfluidic devices were made by soft lithography. A photomask containing negative
images of the pattern of microfluidic channels was reproduced and printed by (JD Photo-
Tools, Oldham, Lancashire) made from Boron-doped silicon with a diameter of 50 mm
and a thickness of 280 m. A single copy of the pattern is composed of two inlets and
one out let (Figure 5-3 A). The perimeter of the inlet for the protein solution is bordered
by two rows of isosceles trapezia (Figure 5-3 B) these are separated by 8 μm in the inner
circle, and 5 μm in the outer circle. Two rows of isosceles trapezia provide removing of
any particles present in the protein solution, which would be drained into the focus of the
optical-tweezing laser. The width of the fluidic channels into which the liposome
dispersion and the protein solution are injected is 100 μm, and these converge at a Y-
shaped junction into a fluidic channel of 200 μm-width.
The master template of the device was produced by dispensing approximately 1 ml of a
permanent negative photoresist (SU-8-2002) onto the wafer and distributed on the wafer
surface on the chuck of the spin. Then, it was spun onto the wafer at 500 rpm for 30 sec
followed by 1500 rpm for 30 sec to create a uniform 100 m. Next the wafer was baked
on a hot plate at 95oC for 45 min. An in-house vacuum chuck photography apparatus was
used to clamp the coated silicon wafer and then a predesigned mask was placed on the
wafer, which was exposure to UV radiation at 365 nm to the wafer with the 15% power
at the illumination of 550-650 mJ cm-2 using a LED curing lamp (DELOLUX80/365,
Delo industrial adhesive). The UV initiates cross-linking of the epoxy resin; the parts of
the resin not exposed to UV are removed following developing. After UV exposure the
wafer was put on the hot plate to bake at 95oC for 10 min, and rinsed in Microposit EC
solvent developer for 2 min and then cleaned with isopropyl alcohol and dried.
Replicas of the pattern shown in (Figure 5-4 A) were produced by PDMS. PDMS consists
of two components, the base and hardener silicon adhesive; they were mixed in a ratio
10:1 and cast over the pattern with ~5 mm thickness (Figure 5-4 B). Then the cast was
Page 183
168
placed into the vacuum desiccator to remove air bubbles, before casting the wafer was
salinized in 85% Trimethylisocyate in a vacuum left overnight to reduce the sticking of
PDMS on the wafer and to prolong the lifetime of the wafer. The wafer was then
incubated in an oven at 65oC for 2 hr to harden the PDMS. Then the PDMS slab was
carefully excised from the wafer with a sharp scalpel. The template was then reused to
make another microfluidic device.
The 1 mm-internal diameter biopsy puncher was used to punch holes to create the outlet
and inlet in the fluidic patterns transferred onto the PDMS. The PDMS blocks were
cleaned with adhesive tape to remove debris from both sides and they were taped to
eliminate any dust from collecting. Glasses cover slip cleaned it in 14 ml of the 95%
H2SO4 and 6 ml of 30% H2O2 at room temperature for 15 min then it washed in 40 ml
(18.2 MU, Milli-Q, Millipore) for 5 min finally they put into the methanol for a few sec
and dried in oven at 60oC for 10 min. Next the PDMS was sealed with a glass cover slip.
Next the PDMS and the glass cover slip for PDMS sealing were treated with oxygen
plasma to activate the PDMS and the cover glass (Menzel-Glaser, 24 mm by 50 mm) for
1min at 0.1 mbar and 28 W (ManiFesto-PC-MFC, Gala Instrument GmbH) (Friend and
Yeo, 2010). Then the PDMS was bonded to the cover glasses; a weight was placed on
top of the PDMS to secure to the glass surface and the device was placed in the oven at
80oC overnight. This procedure promotes complete bonding and allows the cover glasses
to bind to the PDMS and seal the flow channels of microfluidic device. Figure 5-3 C
shows the Y-shape device with two inlets and outlet and the laminar co-flowing streams
of two fluids: pure water and a solution containing a blue dye
Page 184
169
Figure 5-3: Microfluidic device pattern.
(A) Display microfluidic pattern replica. (B) Shows the inlet of the microfluidic device,
which was used to inject Ply. (C) illustrates the laminar flow of co-flowing streams of
pure water and a dye solution in the microfluidic device at 10 nl/min.
Figure 5-4: Microfluidic device preparation.
(A) Represent the silicon wafer with printed Y-shaped patterns. (B) is the sealed
microfluidic component; inlets were made with a 1 mm biopsy punch after casting.
5.6 Raman tweezers of a single liposome with the wild-type Ply and Ply mutants
For the flow cell experiment 9.5 nM (0.5 µg/ml) of Ply and a 1:100 dilution of liposome
were prepared separately in PBS. Delivery of the two fluids was done using a dual syringe
pump (Harvard Scientific). Both were delivered to the separate inlets of the microfluidic
component using PTFE tubing. The flow rate was set initially at 100 nl/min, and then
after the microfluidic channels were fully filled the flow rate was lowered to 5 nl/min to
enable the optical trapping of the liposomes. OT of a single liposome was carried with a
1070 nm IR laser at a power of 10 mW that was controlled by the LabView software
(National Instruments). First the liposome was trapped in the original solution PBS and
C
100 mm
A B
1
mm
Liposome inlet
Ply inlet
Outlet
9.5 nM
PLY
(PBS) 1 mm
LUV
(PBS)
OT
(d ) (e )
OT = Optical
Trap
A B
Page 185
170
its Raman spectra was collected at 37oC. Then the liposome was transferred into the Ply
solution site in the microfluidic device (Figure 5-5) again the Raman spectra were
recorded with 100 Raman spectra recorded over 30 sec using WinSpec3 software.
Figure 5-5: Liposome manipulation between two different solutions including PBS
and Ply by OT.
Two solutions comprising liposomes (LUVs) in PBS and Ply flow together but do not
mix because of a laminar boundary inside the microfluidic device.
5.7 Raman measurement and data collection
The combination of dichroic mirrors, DM1 and DM2 (z700dcxr; Chroma) (Figure 5-6)
allowed the Raman-scattered light, from the 488 nm laser, to be collected by the objective
lens. The signals were gathered from the samples utilizing at 13.5 mW for all Raman
experiments depicted in this work. Focusing of the 160 mm achromatic lens system
(Comar), onto a 150 μm pinhole (Comar) in the confocal image plane allows spatial
filtering of the Raman wavelength. The second achromatic lens 160 mm was used to re-
collimate the spatial filtered light. Then the 50 mm achromatic lens was focused onto the
100 μm-width entrance slits of a spectrograph with a 0.500 m imaging triple grating
monochromator (Acton Research Potbelly, Spectra Pro 2500i; 1800 seam /mm grating;
500 nanometre blaze wavelength). The detector was a -80 °C cooled, back-
illuminated, charge-coupled device (Princeton Instruments, Pixis I 00B). Increments
of 0.018 nanometer (~ 0.5 centimetre -1) was used to measure the spectral data points.
Page 186
171
The optical resolution of the spectrograph was 2cm-1, and the precision of the
wavenumber was 0.5 cm-1. Acquisition time for an individual spectrum was 30 sec and
was controlled by the WinSpec3software. The background signal of the lipid-Raman
spectrum (which includes the stretching set of water molecules) was subtracted using
Excel, and all Raman spectra were normalized in order to have the same integrated
intensity for the overlapping C-H stretching bands (between 2800 and 3040 cm-1), which
is the region of interest of the lipid. Figure 5-6 represents the schematic diagram of the
OT and measuring the inelastic scattering of light.
Figure 5-6: Schematic of Optical tweezers.
The blue path is the Raman excitation laser at 488 nm lasers. The mirror DM1 reflects
the beam onto the objective. The inelastic back-scattered light of the Raman is collected
back through the objective by the short wave pass dichroic mirror DM2. The DM1, DM2
are the dichroic mirrors, with the long-wave pass. L1-achromatic lens, L2-achromatic
lens, are included 160 mm, 50 mm respectively. M is the silver mirror and λ-graph is a
Raman spectrometer.
5.8 The OT setup
The experiments were performed using a custom built inverted microscope. The sample
stage was composed of the aluminum plate and the insulted flexible heater ring shape. A
K-type thermocouple was used to monitor the temperature of the aluminum plate. A 1cm
Page 187
172
delrin plate was used to isolate the sample stage from the microscope body. The
aluminum plate and delrin plate have a circular opening matched to the inner diameter of
the heating element. The oil-immersion infinity corrected, objective lens (Nikon Inc.,
1.25 NA, 100) make contact between the microscope and the lower surface of the 1.5
cover glass through the circular opening. The white light LED 400-800 nm and the
condenser illuminated the sample. The trapping laser at 1070 nm had a 7 mm diameter
beam. This was expanded to 21 mm by two achromatic lenses (L1 and L2). In order to
create an optical trap in the sample plane, the back aperture of the objective lens was over
filled by a continuous-wave infra-red (IR) laser (1070 nm-wavelength). The liquid-
crystal-on-slicon and the spatial light modulator controlled the focal point of the optical
trap in the lateral and axial position, which is located near the IR source beam. This
instrument capability enables a trapped particle is correctly positioned at the focal point
of a second laser beam of 488 nm wavelength which is combined with the IR laser by the
DM1 dichroic mirror. More than 95% of the 488 nm was reflected by the DM1 dichroic
mirror with the transmission of IR 1070 nm and approximately 50% of the laser 488 nm
was used to measure the light scattering because it is not sufficient to trap the particle.
The Notch filter was placed in front of the CCD for both laser sources. The advantage of
using two different laser sources for the optical trapping and the Raman excitation is that
the trapped particle can be manipulated freely with sensitivity and the set up allows
alignment of the particle into the focal spot of the excitation laser to optimize the Raman
intensity. Another advantage of using two lasers with the different wavelengths is
minimising damage of the sampl by selecting a suitable wavelength for the optical
trapping laser.
5.9 Raman data normalization
Raman data was normalized using a multistep process. Firstly, the cosmic background
anomalies of all Raman data were removed by estimating the values that would have been
recorded without interference and replacing them with the average of the two neighboring
data. After this correction any changes in the data can be identified. Secondly, the base
line was adjusted to zero to normalize the intensity of the Raman data because in the raw
data the Raman spectra lies on a slope due to overlapping signals in the Raman. This was
solved by taking three sections using a linear equation due to the change in gradient in
stages. For example, the data was separated into three sections including 1st section
Page 188
173
between 562.200-564.989 nm, the 2nd section between 565.001-572.989 nm and the 3rd
section lies between 573.006-574.200 nm. The large broad signal of PBS was excluded
because lipid intest peaks are contained in those three sections. The equation to normalize
the intensity of each section was performed by Dr. Andrew Hudson in the Chemistry
department at Leicester University. All equations are displayed in the appendix. The final
step was the calculation of the Raman shift, in which the wavelength of the region of
interest was converted into wavenumbers of the Raman shift.
5.10 Results
5.10.1 Lipid vibrational spectroscopy
LUVs (1µm) were prepared by the extrusion method in order to produce the consistent
liposome vesicles. A single liposome was optically trapped with the 1070 nm laser and
the Raman spectra was recorded at 488 nm laser. The region of interest for the study of
the liposome structural changes is the C-H stretching region. The C-H stretching region
is composed of symmetric and asymmetric methylene stretching (d+, d-) and methyl
stretching (rFR+, r-). Previous studies have assigned peaks to different vibrations. The
symmetric (d+) and asymmetric (d-) methylene stretching vibrations of POPC appear at
2851 cm-1 and 2900 cm-1, respectively (Figure 5-7 A). The shoulder at 2925 cm-1 is
assigned to the symmetric methyl stretch (rFR+), and the peak around 2970 cm-1 to the
asymmetric methyl stretch (r-) of the fatty acid chain (Figure 5-7 A) (Snyder et al., 1978,
Snyder et al., 1982, Aslanian et al., 1986). The Raman fingerprint of pure POPC and Chol
were recorded separately to understand how they impact the Raman assignment peaks of
liposome. Though the same C-H stretches shifted frequencies they are still identifiable as
the d+, d-, rFR+ and r- stretches respectively (Figure 5-7 B). This clearly shows that POPC
is responsible for a significant fraction of the d+ contribution and a broader d- stretch vice
versa d+ is shifted and d- is thinner in Chol. The rFR+ and r- are much stronger in Chol
than the POPC peak.
Page 189
174
Figure 5-7: Representative Raman spectra of an-optically trapped POPC/Chol
liposome and POPC/Chol separately.
Symbols on each peak represent different regions of the C-H stretching spectrum. Figure
A (d+) and (d-) represent symmetric and asymmetric methylene (CH2) stretching
respectively and (rFR+) (r-) represents symmetric and asymmetric methyl (CH3)
stretching. Figure B shows the Raman peak of the POPC/Chol separately shown by the
red and black lines.
5.10.2 Observing structural changes in a single liposome by wild-type Ply
The Y-shaped microfluidic device (Figure 5-3A) was used in order to study the
interaction between a single POPC/Chol liposome and Ply. Movement of an optically
trapped liposome across the laminar-flow boundary results an immediate change in the
environment enabling study of the structural changes in the lipid bilayer. The liposome
was optically trapped with the red laser (=1070 nm) and moved into the flow of the toxin
stream. The change in the Raman spectra of the liposome was recorded at 488 nm, every
30 sec. A control experiment was carried out in which the liposome was optically trapped
in the same way but without the addition of Ply. The first spectrum, in black (Figure 5-8)
was recorded whilst the liposome was stationary in PBS. The final spectrum in red (Figure
5-8) was recorded after 720 sec in the solution of Ply. A change in the Raman spectra is
observed when Ply is present with a decrease in the CH2 symmetric stretching mode (d+)
(Figure 5-8). Differences in the C-H stretching region of the liposome might be a sign of
an increase in the diameter of the vesicle when Ply binds, with a decrease in short-range
order of lipid molecules in the bilayer and an increase in membrane fluidity. The overall
change in the Raman spectra of the liposome with Ply is similar to the change observed
Page 190
175
by a temperature-induced transition from Lo into Lo + Ld. This change is characterized
by a decrease in CH2 symmetric stretching mode (d+).
To confirm that Chol is necessary for the changes observed, Ply was mixed with pure
POPC vesicles without Chol. Raman spectra were recorded for a series of liposomes
(Figure 5-9 B). No changes were observed in the Raman spectra when exposed to the
wild-type toxin indicating that Chol is essential for binding of Ply.
Figure 5-8: The Raman spectra profile of an-optically trapped liposome (1:1 mole
ratio POPC/Chol) with and without wild-type Ply.
Raman spectra of liposome was recorded in Y-shape microfluidic device. Then liposome
transferred to the Ply site in Y-shaped device by OT. A sequence of experimental Raman
spectra recorded at 30 sec intervals following exposure to Ply. Raman Spectra of liposome
without (black) and with wild-type Ply (red after 720 sec).
Page 191
176
Figure 5-9: Raman spectra profile of an-optically trapped pure POPC liposome with
and without wild-type Ply.
(A) Shows the pure POPC spectra. (B) Shows the Raman spectra of POPC with wild-
type Ply, both spectra are identical indicating that Chol is essential for Ply binding. The
d+ and d- bands are not changed in both figures A and B.
5.10.3 The influence of lipid composition on the changes observed in the bilayers
following the addition of wild-type Ply
In this experiment liposomes were prepared with POPC/Chol ratios of 4:1 and 1:2. The
latter ratio is the saturation limit of Chol in the POPC bilayers. This experiment was
performed to observe how the Chol impacts the chemical and structural changes of the
lipid in the liposome once incubated with Ply. Figure 5-10 A shows the Raman spectra
of a single liposome with low Chol concentration. No change can be seen in the Raman
spectra when the liposome is transferred to the wild-type Ply solution. However, a big
change is observed with the high Chol concentration once exposure to Ply (Figure 5-10
B). The major change was in the d+ symmetric CH2 and rFR+ CH3 symmetric region,
which decreased and increased respectively. Differences in the C-H stretching region was
caused by sequestering of Chol by Ply. It has been suggested, that change in C-H
stretching region on addition of Chol is caused by the Chol associating tightly with the ac
yl chain of the lipid in the membrane (Rojko and Anderluh, 2015). Taken together, the
2650 2700 2750 2800 2850 2900 2950 3000 3050 3100
Raman Shift (cm-1)Raman shift /cm-1
A Only POPC
Raman shift /cm-1
B POPC with wild-type Ply d+
d- d+
d-
Page 192
177
results suggest that addition of Chol to the membrane causes the lipid acyl chains to
become more packed and ordered. Addition of Ply changes the arrangement of the lipid
acyl chains from packed ordered to disorder. Ply impact the membrane phase similar to
the changes induced by temperature.
Page 194
179
Figure 5-10: Comparison Raman spectra of an-optically trapped single liposome
with and without wild-type Ply in low/high concentration of cholesterol.
A sequence of experimental Raman spectra recorded at 30 sec intervals following
exposure to Ply. Top (A, B) images show Raman spectra of single liposome (containing
low and high amounts of Chol) with Ply. Bottom images show the liposomes without Ply.
Page 195
180
5.10.4 Raman spectra of liposome with the PlyD4
PlyD4 cannot lysis RBCs (Figure 4-10 B), however, it can bind to membrane Chol
through the Trp-rich region (Gilbert et al., 1999, Baba et al., 2001). To measure the impact
of PlyD4 on the chemical structure of the lipid a similar experiment was performed as
described in section 5.10.2. When PlyD4 was incubated with the liposome no changes
were observed with low or high Chol (Figure 5-11 A and B) indicating that the methylene
and methyl C-H stretching is unaffected. This shows that binding alone does not cause
spectral changes in the membrane structure that were observed for the full-length toxin.
PlyD4 binds superficially to the membrane, but does not oligomerize and does not deeply
embed into the membrane (Nollmann et al., 2004).
Page 197
182
Figure 5-11: Comparison of Raman spectra of an-optically trapped liposome with
and without PlyD4.
Top (A, B) images show Raman spectra of single liposome (containing low and high
amounts of Chol) with PlyD4. Bottom images show the liposomes without PlyD4. A
sequence of experimental Raman spectra recorded at 30 sec intervals following exposure
to PlyD4. In both A and B images the four bands of CH2 and CH3 as lablled d+ d-, Rfr+,
r- respectively are not changed.
Page 198
183
5.10.5 Monitoring membrane, structural change of the liposome with Ply
Asp205Arg (D205R) and Asn339Arg (N339R)
The point mutations N339R and D205R abolished the haemolytic activity of Ply without
affecting its overall structure or ability to interact with the membrane (Chapter 4). N339R
does not oligomerise on liposomes whereas D205R can oligomerise but cannot form
pores. Addition of the N339R mutant resulted in no change in the Raman spectra (Figure
5-12), indicating that the mutation prevents the structural changes in the membrane that
were observed for wild-type toxin. Surprisingly, the D205R mutant (Figure 5-12) induced
similar affects as wild-type toxin despite having no haemolytic activity. Thus the spectral
changes observed are not caused by pore formation itself. Instead, it can be concluded
that oligomerization of Ply monomers on the membrane surface causes the changes to the
membrane.
Page 200
185
Figure 5-12: Raman spectra profile of an-optically trapped liposome (1:1
POPC/Chol) with mutant D205R and N339R.
A sequence of experimental Raman spectra recorded at 30 sec intervals following
exposure to Ply D205R and N339R. Raman Spectra of liposome without (black) and with
Ply D205R and N339R (red) recorded after 0 sec and 720 sec.
5.10.6 Monitoring membrane, structural change of the liposome with mutant Ply
Thr304Arg, Arg226Ala, Thr88Glu, and Lys268Ala, Val341Arg and
Leu11Arg
Spectral changes in a single liposome were also measured for a number of Ply point
mutants including Thr304Arg, Arg226Ala, Thr88Glu, and Lys268Ala, Val341Arg and
L11R. All showed similar changes to the wild-type toxin to varying degrees revealing
similar structural changes to the membrane (Figure 5-13). Mutant Thr304Arg (Figure 5-
14) caused large shifts in the C-H stretching spectrum and the d+ band disappeared.
This mutant reduced the haemolytic activity of Ply by ~300-fold (Chapter 4). At 1:1
ratio and low POPC/Chol ratio the d+ band reduced significantly, (Figure 5-14A, B red
line), however, no change was observed at a high Chol ratio (Figure 5-15). The reason
for these differences is not clear.
Page 202
187
Figure 5-13: Raman spectra profile of-an optically trapped 1:1 POPC/Chol vesicle
with mutant Lys268Ala, Arg226Ala, Val341Arg, Thr88Glu and Leu11Arg.
A sequence of experimental Raman spectra recorded at 30 sec intervals following
exposure to all above mutants. Raman Spectra of liposome without (black) and with Ply
mutants (red) recorded after 0 sec and 720 sec.
Figure 5-14: Comparison of Raman spectra for an-optically trapped liposome
POPC/Chol 1:1 ratio and POPC/Chol low ratio with mutant Thr304Arg.
Top (A, B) images show Raman spectra of single liposome (containing 1:1 and low
amounts of Chol) without PlyT304R. Bottom images show the liposomes with PlyT304R.
Raman Spectra of liposome without (black) and with Ply T304R (red) recorded after 0
sec and 720 sec.
Page 203
188
Figure 5-15: Comparison of Raman spectra for an-optically trapped liposome
POPC/Chol high with and without Thr304Arg.
The A, spectra represent the liposome spectra without the Thr304Arg whereas; B, spectra
represent the liposome spectra without (blak) and with Thr304Arg (red) that result in no
change.
5.10.7 Influence of locked mutant on the chemical structure of the membrane
The two locked mutants were also tested. Both mutants caused similar spectral changes
as wild-type Ply (Figure 5-16), in which the d+ peak disappeared. The locked mutants
were designed to prevent pore insertion, but not Ply oligomerisation, so these results are
consistent with the conclusion the changes to the membrane structure are not caused by
pore formation itself. However, caution is needed because the locked mutants did retain
some haemolytic as described in Chapter 4 (Figure 4-10 B) suggesting that a small
proportion of the mutants were not disulphide trapped.
Page 205
190
Figure 5-16: Raman spectra analysis of an-optically trapped liposome with Ply
locked mutants (Thr55Cys+Val163Cys and Ala262Cys+Trp278Cys).
Raman spectra of POPC/Chol (1:1 mole ratio) was recorded for both mutants in the Y-
shaped microfluidic device. A sequence of experimental Raman spectra recorded at 30
sec intervals following exposure to (Thr55Cys+Val163Cys and Ala262Cys+Trp278Cys).
Ply. Raman Spectra of liposome without (black) and with mutants (red after 720 sec).
5.10.8 Monitoring change of the lipid layer of a liposome membrane composed of
ternary mixture of POPC/Chol /SM (1:1:1)
To understand the interaction between lipid rafts and Ply toxins, spectra were recorded
for liposomes containing 1:1:1 mixture of POPC/Chol/SM. SM is used to form lipid rafts
in liposome preparations (Kai and Elina, 1997). No changes were detected on addition of
wild-type Ply, PlyD4 or mutant T304R to POPC/Chol/SM liposomes (Figure 5-17). This
result suggests that the presence of SM in a lipid membrane, causes the surrounding lipid
to become more ordered, so that no Chol sequestering is required prior to pore insertion
by Ply.
Page 206
191
Figure 5-17: Raman spectra profile of 1:1:1 POPC/Chol/SM liposome with wild-
type Ply, PlyD4 and Ply mutant T304R.
(A) Shows the pure Raman spectra of the POPC/Chol/SM alone; B, C, and D display
Raman spectra profile of the liposome once exposed to the wild-type Ply, PlyD4 and the
mutant Ply T304R consequently ina Y-shape microfluidic devic.
5.11 Discussion
The present study observes changes in the membrane of single cell-sized liposome using
Raman spectroscopy and optical tweezers. The process of pore formation by Ply is well
established (Tilley et al., 2005, Gilbert et al., 1999) but how it impacts on the structure of
the cell membrane is still poorly understood. The purpose of the work in this Chapter was
to provide a greater understanding of the structural changes in the lipid membrane upon
interaction with the Ply toxin. Raman spectroscopy is widely used to study membranes
and gives a spectral fingerprint of a sample as a result of inelastic scattering of light (Rajan
et al., 2017). Many studies have reported the characteristic changes in the chemical
structure of the lipid in response to changes in temperature (Wu et al., 2016a, Lewis and
McElhaney, 2013, Schaefer et al., 2012). According to the literature the Raman peaks of
the lipid is divided into four overlapping bands due to symmetric and asymmetric
stretching of the CH2 and CH3 bonds (Snyder et al., 1978). The Raman spectra of the
liposome changes when Ply is added reflecting in an increase in the disorder of the
membrane. The changes resemble those caused by heating in which the diameter of the
vesicle is gradually increased and this leads to a decrease in a short-range order of lipid
molecules in the lipid bilayer, and increase in membrane fluidity. The membrane phase
changes from an ordered gel phase to a liquid-disordered phase. Comparison of the effects
of wild-type Ply with the point mutants and truncated forms suggests that the observed
changes to the membrane fluidity are caused by self-association of Ply monomers not by
pore formation itself. Thus disulphide-locked mutants, which cannot form pores but can
form pre-pore structures, showed similar changes to wild-type Ply confirming that the
changes observed in the membrane are not caused by pore formation. By contrast, the
Asn339Arg mutant binds to the membrane but cannot self-associate or form pores and
caused no spectral changes (as did D4 alone). Asp205Arg self-associates on the
membrane but cannot form pores, yet resembles wild-type Ply with respect to the changes
in the Raman spectrum. This approach therefore provides a very useful way of
Page 207
192
distinguishing pores from pre-pores, something that has not been possible previously
using spectral methods. This in-turn can be used for characterising the molecular
mechanism of Ply inhibitors.
The structural changes of the membrane were recorded for different Ply mutants include
(Leu11Arg, Lys268Ala, Val341Arg, Arg226Ala, and Thr88Glu, Thr304Arg) through the
Raman spectroscopy with highlighting on the C-H stretching region and specifically the
d+ band which represents the symmetric stretching of CH2 region of lipid. All the mutants
impact the structural changes with different degree, in all of them the d+ band was
reduced. Reducing of the d+ band means that the membrane phase is changed from the
Lo to Ld phase. Because the impact of Ply on the membrane structure some how similar
to the impact of tempreture on the membrane. Ply and Ply mutants once bind to the
cholesterol in the membrane they sequester cholesterol from the membrane for the
purpose of securing the most stable surface for pore formation. Sequestering of the
cholesterol from the membrane by Ply and Ply mutants cause reduction of the d+ band is
then an indication of altering the phase of the membrane from the Lo to Ld (Figure 5-18).
Figure 5-18: Schematic represntaion of impacting Ply on the the membrane phase.
When the membrane contains the equi-molar amountas of phosphocholine (POPC) and
cholesterol (1:1), a liquid-ordered phase, Lo, exists (shown in blue in the figure). The Lo
shares characteristics of the gel (L) and fluid (liquid-disordered, Ld) phases of a lipid
membrane. While the intercalation of cholesterol with phosphocholine molecules disrupts
the planar triangular lattice in the gel phase, a trans conformation of the hydrocarbon
chains is more favoured in the fluid phase resulting in a higher degree of short-range
order. After addition of the Ply and Ply mutants, we believe that the membrane transitions
from a pure Lo phase into a state in which the Lo and Ld phases coexist (as shown in the
figure in dark blue - Lo region with high cholesterol - and red Ld region with low
cholesterol. The Ply sequesters cholesterol from the membrane.
Page 208
193
5.12 General discussion
5.12.1 ELISA binding between Ply and human L-ficolin
Ply is a virulence factor of the pneumococcus, which is a pathogen of significant clinical
importance; therefore, understanding the interaction of Ply with the immune system is
critical. The work presented in (Chapter 3) revealed that Ply does not bind to human L-
ficolin, contrary to a previous report (Ali et al., 2013). The inconsistency between the two
studies is most likely to have been caused by contamination of Ply preparations. Because,
Ply is produced in E. coli, a potential target of L-ficolin, any impurities (e.g. acetylated
cell wall components) could lead to false positive results. I used highly pure preparations
of Ply with an additional gel-filtration purification step. The resulting protein was
successfully crystallized (Marshall et al., 2015).
5.12.2 ELISA binding between Ply and IgG isotypes
My data confirmed that Ply binds to IgG. However, the results were somewhat surprising
regarding binding to IgG isotypes. Ply bound to IgG2, IgG3, and IgG4, but not to IgG1.
The reason for these differences in binding is unclear. However, it is interesting to note
that the length of the hinge regions in each IgG isotypes is different. Ali et al (2013)
suggested that the long hinge region of IgG3 (62 amino acids) might facilitate its
interaction with Ply. However, the hinge regions of IgG4 and IgG2 are shorter than IgG3
(12 amino acids), so this explanation is unlikely. More likely is that there is a binding site
that is conserved in IgG2, IgG3 and IgG4 but not in IgG1 which is located in the CH1
region (Figure 3.22). Interestingly, IgG3 and IgG1 both activate the classical pathway,
whereas IgG2 has lower activity and IgG4 fails to activate complement. Thus, most
Ply-driven complement activation probably occurs through IgG3. The function of the
interactions of Ply with IgG2 and IgG4 is less clear, although they would likely reduce
the amount of functional IgG in serum, thereby impairing the immune response of the
host.
5.12.3 Ply binds to the Fab region of IgG via domains 1-3
The results of this study indicate that the Ply-IgG interaction is mediated mainly through
the Fab fragment of the IgG and the PlyD1-3 fragment of Ply. In contrast, to the findings
of Mitchell et al (1991), Ply did not interact via IgG Fc. Binding of Ply to the Fab
fragment of IgG would mean that the Fc portion is free to bind to C1q and activate CP.
Page 209
194
5.12.4 Structural based mutation in Ply to block pore formation
Monomers of Ply pack side-by-side in the crystal structure of Ply (Marshall et al., 2015).
We hypothesized that these packing interactions mimic the packing interactions that
occur when Ply monomers come together on the cell-surface. To test this hypothesis,
mutations were made to residues at the interface and the activities of the resulting Ply
mutants were measured. The eight point mutations that were made all reduced the
haemolytic activity of Ply, supporting our hypothesis. Two of the mutants completely
abolished haemolysis by Ply. These affects were not caused by destabilization of Ply
or by failure to bind to the membrane. Analysis by EM showed that the loss of activity
was caused by distinct mechanisms. Asp205Arg mutants still formed oligomers but these
oligomers were linear not curved, implying that the mutation prevents pore-formation.
Pore formation would require flexibility in the packing to create the necessary curvature.
Presumably the Asp205Arg mutation prevents this flexibility resulting in the linear arrays
of molecules that were observed in electron micrographs rather than circular pores. The
other mutant Asn339Arg appeared to block oligomerization completely, so that the
mutant covered the membrane of liposomes but did not assemble to form pores, arcs or
even linear arrays.
5.12.5 Raman spectral analysis of Ply on the lipid bilayer membrane
Analysis by Raman spectroscopy of single liposomes revealed that Ply impacts
membrane chemical structure. Ply leads to a decrease in a short-range order of lipid
molecules in the lipid bilayer. The changes observed were the result of oligomerization
of Ply monomers on the membrane rather than pore formation itself leading to changes
in the lipid vibrational mode (CH2 and CH3). Thus, the non-haemolytic mutant
Asp205Arg caused changes in the lipid vibrational mode similar to the wild-type Ply.
Asp205Arg mutant still oligomerized to form long chains, but could not form pores.
Conversely, mutant Asn339Arg caused no changes to the lipid vibrational mode, despite
binding to the membrane. Oligomerization of Ply was completely abolished by this
mutation. Together, the data show that toxin oligomerization on the membrane is
necessary to change the vibration mode of the CH2 and CH3 groups in the lipid
molecule of the membrane.
Page 210
195
5.13 Future work
5.13.1 Mutation in PlyD1-3 residues
Studies in this thesis revealed that the interaction between Ply and IgG occurs via the
PlyD1-3 and Fab region of IgG. Thus it would be interesting to identify the residues that
are responsible for this interaction by introducing point mutation into PlyD1-3 residues
to identify the binding region on the toxin. The PlyD1-3/IgG Fab would also be a good
target for crystallization/structural studies.
5.13.2 Disruption of Ply monomers
The chapter four results showed that disruption of packing interactions prevents pore
formation by Ply. Therefore, a drug that blocks packing could potentially form the basis
of a new treatment for pneumococcal disease. Ply activity could be prevented either by
small molecules or antibodies. It would also be interesting to investigate the packing in
other CDCs by introducing mutations at interface surface residues. This would confirm
that interface is conserved in all CDCs and that they have a common mode of
polymerization.
5.13.3 Raman spectroscopy and Ply
The structural changes in lipid membrane observed by the Raman spectroscopy caused
by Ply provide a useful way of distinguishing pore from pre-pore formation. It would be
interesting to investigate more Ply mutants to show the impact of residues on the chemical
structure of the membrane. Additionally, it is important to investigate the impact of other
CDCs on the chemical structure of the membrane to see if the observed changes are a
common feature of CDCs.
Page 211
196
Appendixes Appendix 1- Blast DNA sequences of truncated Ply
Ply D1-3 forward primer blast
Page 212
197
Ply D1-3 Reverse primer blast
Page 213
198
Ply D4 blast sequences
Appendix 2- L-ficolin and fibrinogen like domain blast sequences
Full-length L-ficolin cloned into pGEM-T sequence analyse
Page 214
199
Full-length L-ficolin cloned into pED4 vector and the sequence analyse with the primer pED4 seq F
Fibrinogen-like domain cloned into pGEM-T vector and the sequence analysed with T7-promoter prime
Page 215
200
Fibrinogen-like domain cloned into pGEM-T vector and the sequence analysed with SP6 prime
Fibrinogen-like domain cloned into pET28 vector and the sequence analyse
Page 216
201
Appendix 3- mutants Ply blast sequences
Thr88Glu= T88E (Thr changed to Glu acid) ACT D GAA
Page 217
202
Asn339Arg= N339R (Asn changed to Arg) AAT D CGC
Thr304Arg=T304R (Thr changed to Arg) ACA D CGT
Page 218
203
Asp205Arg= D205R (Asp changed to Arg) GAC D CGT
Page 219
204
Val341Arg= V341R (Val changed to Arg) GTT D CGT
Page 220
205
Tyr55Cys+Val163Cys= T55C+V163C (ACA changed into TGT and GTC changed into TGT)
Ala262Cys+Trp278Cys =A262C+W278C (GCT changed into TGT and TGG changed into TGT)
Page 221
206
Appendix 4- Raman data normalization
Section 1 formula
Section 2 formula
Section 3 formula
Raman shift intensity correction formula
Raman data normalization equation and formula
Page 222
207
References
AALBERSE, R. C. & SCHUURMAN, J. 2002. IgG4 breaking the rules. Immunology,
105, 9-19.
AALBERSE, R. C., STAPEL, S. O., SCHUURMAN, J. & RISPENS, T. 2009.
Immunoglobulin G4: an odd antibody. Clin Exp Allergy, 39, 469-77.
ADAMS, P. D., AFONINE, P. V., BUNKOCZI, G., CHEN, V. B., DAVIS, I. W.,
ECHOLS, N., HEADD, J. J., HUNG, L. W., KAPRAL, G. J., GROSSE-
KUNSTLEVE, R. W., MCCOY, A. J., MORIARTY, N. W., OEFFNER, R.,
READ, R. J., RICHARDSON, D. C., RICHARDSON, J. S., TERWILLIGER, T.
C. & ZWART, P. H. 2010. PHENIX: a comprehensive Python-based system for
macromolecular structure solution. Acta Crystallogr D Biol Crystallogr, 66, 213-
21.
AGARWAL, V., AHL, J., RIESBECK, K. & BLOM, A. M. 2013. An alternative role of
C1q in bacterial infections: facilitating Streptococcus pneumoniae adherence and
invasion of host cells. J Immunol, 191, 4235-45.
AGARWAL, V., HAMMERSCHMIDT, S., MALM, S., BERGMANN, S., RIESBECK,
K., BLOM, A. M., FACULTY OF, M., MEDICINSK MIKROBIOLOGI, M.,
MEDICAL, M., INSTITUTIONEN FÖR LABORATORIEMEDICIN, M.,
LUNDS, U., PROTEIN, C., MEDICIN, DEPARTMENT OF LABORATORY
MEDICINE, M., LUND, U. & PROTEINKEMI 2012. Enolase of Streptococcus
pneumoniae binds human complement inhibitor C4b-binding protein and
contributes to complement evasion. J immuno (Baltimore, Md. : 1950), 189, 3575.
AGARWAL, V., SROKA, M., FULDE, M., BERGMANN, S., RIESBECK, K. &
BLOM, A. M. 2014. Binding of Streptococcus pneumoniae endopeptidase O
(PepO) to complement component C1q modulates the complement attack and
promotes host cell adherence. J Biol Chem, 289, 15833-44.
AJITO, K. & TORIMITSU, K. 2002. Laser trapping and Raman spectroscopy of single
cellular organelles in the nanometer range. Lab Chip, 2, 11-4.
AKHTAR, M. S. & BHAKUNI, V. 2003. Streptococcus pneumoniae hyaluronate lyase
contains two non-cooperative independent folding/unfolding structural domains:
characterization of functional domain and inhibitors of enzyme. J Biol Chem, 278,
25509-16.
ALHAMDI, Y., NEILL, D. R., ABRAMS, S. T., MALAK, H. A., YAHYA, R.,
BARRETT-JOLLEY, R., WANG, G., KADIOGLU, A. & TOH, C. H. 2015.
Circulating Pneumolysin Is a Potent Inducer of Cardiac Injury during
Pneumococcal Infection. PLoS Pathog, 11, e1004836.
ALI, Y. M., KENAWY, H. I., MUHAMMAD, A., SIM, R. B., ANDREW, P. W. &
SCHWAEBLE, W. J. 2013. Human L-ficolin, a recognition molecule of the lectin
Page 223
208
activation pathway of complement, activates complement by binding to
pneumolysin, the major toxin of Streptococcus pneumoniae. PLoS One, 8,
e82583.
ALI, Y. M., LYNCH, N. J., HALEEM, K. S., FUJITA, T., ENDO, Y., HANSEN, S.,
HOLMSKOV, U., TAKAHASHI, K., STAHL, G. L., DUDLER, T., GIRIJA, U.
V., WALLIS, R., KADIOGLU, A., STOVER, C. M., ANDREW, P. W. &
SCHWAEBLE, W. J. 2012. The lectin pathway of complement activation is a
critical component of the innate immune response to pneumococcal infection.
PLoS pathogens, 8, e1002793.
ALONSODEVELASCO, E., VERHEUL, A. F., VERHOEF, J. & SNIPPE, H. 1995.
Streptococcus pneumoniae: virulence factors, pathogenesis, and vaccines.
Microbiol Rev, 59, 591-603.
AMARASEKERA, M. 2011. Immunoglobulin E in health and disease. Asia Pac Allergy,
1, 12-5.
AMMITZBOLL, C. G., THIEL, S., ELLINGSEN, T., DELEURAN, B., JORGENSEN,
A., JENSENIUS, J. C. & STENGAARD-PEDERSEN, K. 2012. Levels of lectin
pathway proteins in plasma and synovial fluid of rheumatoid arthritis and
osteoarthritis. Rheumatol Int, 32, 1457-63.
AN, Y., ZHANG, Y., MUELLER, H. M., SHAMEEM, M. & CHEN, X. 2014. A new
tool for monoclonal antibody analysis: application of IdeS proteolysis in IgG
domain-specific characterization. MAbs, 6, 879-93.
AOYAGI, Y., ADDERSON, E. E., MIN, J. G., MATSUSHITA, M., FUJITA, T.,
TAKAHASHI, S., OKUWAKI, Y. & BOHNSACK, J. F. 2005. Role of L-
ficolin/mannose-binding lectin-associated serine protease complexes in the
opsonophagocytosis of type III group B streptococci. J Immunol, 174, 418-25.
ASHKIN, A. 1970. Acceleration and Trapping of Particles by Radiation Pressure. Phys.
Rev. Lett. 24, 156-159.
ASHKIN, A. 1992. Forces of a single-beam gradient laser trap on a dielectric sphere in
the ray optics regime. Biophys J, 61, 569-82.
ASHKIN, A. & DZIEDZIC, J. 1971. Optical levitation by radiation pressure. Appl. Phys.
Lett, 19, 283-285.
ASLANIAN, D., NEGRERIE, M. & CHAMBERT, R. 1986. A Raman spectroscopic
study on the interaction of an ion-channel protein with a phospholipid in a model
membrane system (gramicidin A/L-alpha-lysophosphatidylcholine). Eur J
Biochem, 160, 395-400.
ASSAF, A., HOANG, T. V., FAIK, I., AEBISCHER, T., KREMSNER, P. G., KUN, J.
F. & VELAVAN, T. P. 2012. Genetic evidence of functional ficolin-2 haplotype
as susceptibility factor in cutaneous leishmaniasis. PLoS One, 7, e34113.
Page 224
209
AUCOUTURIER, P., DANON, F., DAVEAU, M., GUILLOU, B., SABBAH, A.,
BESSON, J. & PREUD'HOMME, J. L. 1984. Measurement of serum IgG4 levels
by a competitive immunoenzymatic assay with monoclonal antibodies. J Immunol
Methods, 74, 151-62.
BABA, H., KAWAMURA, I., KOHDA, C., NOMURA, T., ITO, Y., KIMOTO, T.,
WATANABE, I., ICHIYAMA, S. & MITSUYAMA, M. 2001. Essential Role of
Domain 4 of Pneumolysin from Streptococcus pneumoniae in Cytolytic Activity
as Determined by Truncated Proteins. Biochemical and Biophysical Research
Communications, 281, 37-44.
BAI, X.-H., CHEN, H.-J., JIANG, Y.-L., WEN, Z., HUANG, Y., CHENG, W., LI, Q.,
QI, L., ZHANG, J.-R., CHEN, Y. & ZHOU, C.-Z. 2014. Structure of
pneumococcal peptidoglycan hydrolase LytB reveals insights into the bacterial
cell wall remodeling and pathogenesis. J. Biol. Chem., 289, 23403-23416.
BALACHANDRAN, P., BROOKS-WALTER, A., VIROLAINEN-JULKUNEN, A.,
HOLLINGSHEAD, S. K. & BRILES, D. E. 2002. Role of pneumococcal surface protein
C in nasopharyngeal carriage and pneumonia and its ability to elicit protection against
carriage of Streptococcus pneumoniae. Infect Immun, 70, 2526-34.
BALACHANDRAN, P., HOLLINGSHEAD, S. K., PATON, J. C. & BRILES, D. E.
2001. The autolytic enzyme LytA of Streptococcus pneumoniae is not responsible
for releasing pneumolysin. J Bacteriol, 183, 3108-16.
BARKAI, G., GREENBERG, D., GIVON-LAVI, N., DREIFUSS, E., VARDY, D. &
DAGAN, R. 2005. Community prescribing and resistant Streptococcus
pneumoniae. Emerg Infect Dis, 11, 829-37.
BASU, H., DHARMADHIKARI, A., DHARMADHIKARI, J., SHARMA, S. &
MATHUR, D. A biophotonic study of live, flowing red blood cells in an optical
trap. International Conference on Fiber Optics and Photonics, 2010. International
Society for Optics and Photonics, 817309-817309-8.
BELONGIA, E. A., SULLIVAN, B. J., CHYOU, P. H., MADAGAME, E., REED, K. D.
& SCHWARTZ, B. 2001. A community intervention trial to promote judicious antibiotic
use and reduce penicillin-resistant Streptococcus pneumoniae carriage in children.
Pediatrics, 108, 575-83.
BELTRAME, M. H., BOLDT, A. B., CATARINO, S. J., MENDES, H. C.,
BOSCHMANN, S. E., GOELDNER, I. & MESSIAS-REASON, I. 2015. MBL-
associated serine proteases (MASPs) and infectious diseases. Mol Immunol, 67,
85-100.
BERGMANN, S., ROHDE, M., CHHATWAL, G. S. & HAMMERSCHMIDT, S. 2001.
alpha-Enolase of Streptococcus pneumoniae is a plasmin(ogen)-binding protein
displayed on the bacterial cell surface. Mol Microbiol, 40, 1273-87.
Page 225
210
BERRY, A. M., YOTHER, J., BRILES, D. E., HANSMAN, D. & PATON, J. C. 1989.
Reduced virulence of a defined pneumolysin-negative mutant of Streptococcus
pneumoniae. Infect Immun, 57, 2037-42.
BHAKDI, S., WELLER, U., WALEV, I., MARTIN, E., JONAS, D. & PALMER, M.
1993. A guide to the use of pore-forming toxins for controlled permeabilization
of cell membranes. Med Microbiol Immunol, 182, 167-75.
BIDULA, S., KENAWY, H., ALI, Y. M., SEXTON, D., SCHWAEBLE, W. J. &
SCHELENZ, S. 2013. Role of ficolin-A and lectin complement pathway in the
innate defense against pathogenic Aspergillus species. Infect Immun, 81, 1730-
40.
BIDULA, S., SEXTON, D. W., ABDOLRASOULI, A., SHAH, A., REED, A.,
ARMSTRONG-JAMES, D. & SCHELENZ, S. 2015. The serum opsonin L-
ficolin is detected in lungs of human transplant recipients following fungal
infections and modulates inflammation and killing of aspergillus
fumigatus.(Report). 212, 234.
BINDER, H., GUTBERLET, T., ANIKIN, A. & KLOSE, G. 1998. Hydration of the
dienic lipid dioctadecadienoylphosphatidylcholine in the lamellar phase--an
infrared linear dichroism and x-ray study on headgroup orientation, water
ordering, and bilayer dimensions. Biophys J, 74, 1908-23.
BINGEN, E., LEVY, C., VARON, E., DE LA ROCQUE, F., BOUCHERAT, M.,
D'ATHIS, P., AUJARD, Y. & COHEN, R. 2008. Pneumococcal meningitis in the
era of pneumococcal conjugate vaccine implementation. Eur J Clin Microbiol
Infect Dis, 27, 191-9.
BOGAERT, D., SLUIJTER, M., DE GROOT, R. & HERMANS, P. W. M. 2004.
Multiplex opsonophagocytosis assay (MOPA): a useful tool for the monitoring of
the 7-valent pneumococcal conjugate vaccine. Vaccine, 22, 4014-4020.
BOLDT, A. B., SANCHEZ, M. I., STAHLKE, E. R., STEFFENSEN, R., THIEL, S.,
JENSENIUS, J. C., PREVEDELLO, F. C., MIRA, M. T., KUN, J. F. & MESSIAS-
REASON, I. J. 2013. Susceptibility to leprosy is associated with M-ficolin
polymorphisms. J Clin Immunol, 33, 210-9.
BORZA, D. B. 2016. Alternative Pathway Dysregulation and the Conundrum of
Complement Activation by IgG4 Immune Complexes in Membranous
Nephropathy. Front Immunol, 7, 157.
BOULNOIS, G. J., PATON, J. C., MITCHELL, T. J. & ANDREW, P. W. 1991. Structure
and function of pneumolysin, the multifunctional, thiol-activated toxin of
Streptococcus pneumoniae. Mol Microbiol, 5, 2611-6.
Page 226
211
BOVIGNY, C., TAMO, G., LEMMIN, T., MAINO, N. & DAL PERARO, M. 2015.
LipidBuilder: A Framework To Build Realistic Models for Biological
Membranes. J Chem Inf Model, 55, 2491-9.
BOZZUTO, G. & MOLINARI, A. 2015. Liposomes as nanomedical devices. Int J
Nanomedicine, 10, 975-99.
BRAUN, J. S., HOFFMANN, O., SCHICKHAUS, M., FREYER, D., DAGAND, E.,
BERMPOHL, D., MITCHELL, T. J., BECHMANN, I. & WEBER, J. R. 2007.
Pneumolysin causes neuronal cell death through mitochondrial damage. Infect
Immun, 75, 4245-54.
BRIUGLIA, M. L., ROTELLA, C., MCFARLANE, A. & LAMPROU, D. A. 2015.
Influence of cholesterol on liposome stability and on in vitro drug release. Drug
Deliv Transl Res, 5, 231-42.
BROWN, D. A. & LONDON, E. 2000. Structure and function of sphingolipid- and
cholesterol-rich membrane rafts. J Biol Chem, 275, 17221-4.
BROWN, J. S., GILLILAND, S. M., RUIZ-ALBERT, J. & HOLDEN, D. W. 2002a.
Characterization of pit, a Streptococcus pneumoniae iron uptake ABC transporter.
Infect Immun, 70, 4389-98.
BROWN, J. S., HUSSELL, T., GILLILAND, S. M., HOLDEN, D. W., PATON, J. C.,
EHRENSTEIN, M. R., WALPORT, M. J. & BOTTO, M. 2002b. The classical
pathway is the dominant complement pathway required for innate immunity to
Streptococcus pneumoniae infection in mice. Proc Natl Acad Sci U S A, 99,
16969-74.
BRUGGEMANN, M., WILLIAMS, G. T., BINDON, C. I., CLARK, M. R., WALKER,
M. R., JEFFERIS, R., WALDMANN, H. & NEUBERGER, M. S. 1987.
Comparison of the effector functions of human immunoglobulins using a matched
set of chimeric antibodies. J Exp Med, 166, 1351-61.
BUI, N. K., EBERHARDT, A., VOLLMER, D., KERN, T., BOUGAULT, C., TOMASZ,
A., SIMORRE, J. P. & VOLLMER, W. 2012. Isolation and analysis of cell wall
components from Streptococcus pneumoniae. Anal Biochem, 421, 657-66.
BUNACIU, A. A., UDRISTIOIU, E. G. & ABOUL-ENEIN, H. Y. 2015. X-ray
diffraction: instrumentation and applications. Crit Rev Anal Chem, 45, 289-99.
BURTON, D. R., GREGORY, L. & JEFFERIS, R. 1986. Aspects of the molecular
structure of IgG subclasses. Monogr Allergy, 19, 7-35.
BURTON, D. R. & WOOF, J. M. 1992. Human antibody effector function. Advances in
immunology, 51, 1-84.
CABALLERO, J. & RELLO, J. 2011. Combination antibiotic therapy for community-
acquired pneumonia. Ann Intensive Care, 1, 48.
Page 227
212
CANVIN, J. R., MARVIN, A. P., SIVAKUMARAN, M., PATON, J. C., BOULNOIS,
G. J., ANDREW, P. W. & MITCHELL, T. J. 1995. The role of pneumolysin and
autolysin in the pathology of pneumonia and septicemia in mice infected with a
type 2 pneumococcus. J Infect Dis, 172, 119-23.
CARLIER, F. M., SIBILLE, Y. & PILETTE, C. 2016. The epithelial barrier and
immunoglobulin A system in allergy. Clin Exp Allergy, 46, 1372-1388.
CASAL, H. L. & MANTSCH, H. H. 1984. Polymorphic phase behaviour of phospholipid
membranes studied by infrared spectroscopy. Biochim Biophys Acta, 779, 381-
401.
CASSIDY, S. K. & O'RIORDAN, M. X. 2013. More than a pore: the cellular response
to cholesterol-dependent cytolysins. Toxins (Basel), 5, 618-36.
CEDZYNSKI, M., NUYTINCK, L., ATKINSON, A. P., ST SWIERZKO, A., ZEMAN,
K., SZEMRAJ, J., SZALA, A., TURNER, M. L. & KILPATRICK, D. C. 2007.
Extremes of L-ficolin concentration in children with recurrent infections are
associated with single nucleotide polymorphisms in the FCN2 gene. Clin Exp
Immunol, 150, 99-104.
CELIK, I., STOVER, C. M., BOTTO, M., THIEL, S., TZIMA, S., KÜNKEL, D.,
WALPORT, M., LORENZ, W. & SCHWAEBLE, W. J. 2001. Role of the
classical pathway of complement activation in experimentally induced
polymicrobial peritonitis.
CELLIERS, P. M. & CONIA, J. 2000. Measurement of localized heating in the focus of
an optical trap. Appl Opt, 39, 3396-407.
CERUTTI, A. & RESCIGNO, M. 2008. The Biology of Intestinal Immunoglobulin A
Responses. Immunity, 28, 740-750.
CHAYEN, N. E. 2004. Turning protein crystallisation from an art into a science. Curr
Opin Struct Biol, 14, 577-83.
CHEN, T., HU, Y., DING, Q., YU, J., WANG, F., LUO, F. & ZHANG, X. L. 2015.
Serum ficolin-2 concentrations are significantly changed in patients with hepatitis
B virus infection and liver diseases. Virol Sin, 30, 249-60.
CHENG, W., LI, Q., JIANG, Y. L., ZHOU, C. Z. & CHEN, Y. 2013. Structures of
Streptococcus pneumoniae PiaA and its complex with ferrichrome reveal insights
into the substrate binding and release of high affinity iron transporters. PLoS One,
8, e71451.
CHERNEY, D. P. & HARRIS, J. M. 2010. Confocal Raman microscopy of optical-
trapped particles in liquids. Annu Rev Anal Chem (Palo Alto Calif), 3, 277-97.
Page 228
213
CHIOU, C. C. 2006. Does Penicillin Remain the Drug of Choice for Pneumococcal
Pneumonia in View of Emerging in Vitro Resistance? Clinical Infectious
Diseases, 42, 234-237.
CHONGSIRIWATANA, N. P. & BARRON, A. E. 2010. Comparing bacterial membrane
interactions of antimicrobial peptides and their mimics. Methods Mol Biol, 618,
171-82.
CILLONIZ, C. & TORRES, A. 2014. Pneumococcal disease: Epidemiology and new
vaccines.(Editorial). 1, 35.
COCKERAN, R., ANDERSON, R. & FELDMAN, C. 2002. The role of pneumolysin in
the pathogenesis of Streptococcus pneumoniae infection. Curr Opin Infect Dis,
15, 235-9.
COCKERAN, R., THERON, A. J., STEEL, H. C., MATLOLA, N. M., MITCHELL, T.
J., FELDMAN, C. & ANDERSON, R. 2001. Proinflammatory interactions of
pneumolysin with human neutrophils. J Infect Dis, 183, 604-11.
CORNICK, J. E., TASTAN BISHOP, O., YALCIN, F., KIRAN, A. M., KUMWENDA,
B., CHAGUZA, C., GOVINDPERSHAD, S., OUSMANE, S., SENGHORE, M.,
DU PLESSIS, M., PLUSCHKE, G., EBRUKE, C., MCGEE, L., SIGAUQUE, B.,
COLLARD, J. M., BENTLEY, S. D., KADIOGLU, A., ANTONIO, M., VON
GOTTBERG, A., FRENCH, N., KLUGMAN, K. P., HEYDERMAN, R. S.,
ALDERSON, M. & EVERETT, D. B. 2017. The global distribution and diversity
of protein vaccine candidate antigens in the highly virulent Streptococcus
pnuemoniae serotype 1. Vaccine.
COSTA, S., ALMEIDA, A., CASTRO, A. & DOMINGUES, L. 2014. Fusion tags for
protein solubility, purification and immunogenicity in Escherichia coli: the novel
Fh8 system. Front Microbiol, 5, 63.
CSEH, S., VERA, L., MATSUSHITA, M., FUJITA, T., ARLAUD, G. J. & THIELENS,
N. M. 2002. Characterization of the interaction between L-ficolin/p35 and
mannan-binding lectin-associated serine proteases-1 and -2. J Immunol, 169,
5735-43.
CZAJKOWSKY, D. M., HOTZE, E. M., SHAO, Z. & TWETEN, R. K. 2004. Vertical
collapse of a cytolysin prepore moves its transmembrane beta-hairpins to the
membrane. Embo j, 23, 3206-15.
CZAJKOWSKY, D. M., SALANTI, A., DITLEV, S. B., SHAO, Z., GHUMRA, A.,
ROWE, J. A. & PLEASS, R. J. 2010. IgM, Fc mu Rs, and malarial immune
evasion. J Immunol, 184, 4597-603.
CZAJKOWSKY, D. M. & SHAO, Z. 2009. The human IgM pentamer is a mushroom-
shaped molecule with a flexural bias. Proc Natl Acad Sci U S A, 106, 14960-5.
Page 229
214
CZAMARA, K., MAJZNER, K., PACIA, M. Z., KOCHAN, K., KACZOR, A. &
BARANSKA, M. 2015. Raman spectroscopy of lipids: a review.(Report). J.
Raman Spectrosc 46, 4.
DANG, T. X., HOTZE, E. M., ROUILLER, I., TWETEN, R. K. & WILSON-
KUBALEK, E. M. 2005. Prepore to pore transition of a cholesterol-dependent
cytolysin visualized by electron microscopy. J Struct Biol, 150, 100-8.
DANIEL, M. 2013. Antibiotics for otitis media with effusion in children. Clin
Otolaryngol, 38, 56-7.
DAVIES, A. M. & SUTTON, B. J. 2015. Human IgG4: a structural perspective. Immunol
Rev, 268, 139-59.
DE LUCA, A. C., DHOLAKIA, K. & MAZILU, M. 2015. Modulated Raman
Spectroscopy for Enhanced Cancer Diagnosis at the Cellular Level. Sensors
(Basel, Switzerland), 15, 13680-13704.
DMITRIEV, A. A. & SUROVTSEV, N. V. 2015. Temperature-Dependent Hydrocarbon
Chain Disorder in Phosphatidylcholine Bilayers Studied by Raman Spectroscopy.
J Phys Chem B, 119, 15613-22.
DOWD, K. J., FARRAND, A. J. & TWETEN, R. K. 2012. The cholesterol-dependent
cytolysin signature motif: a critical element in the allosteric pathway that couples
membrane binding to pore assembly. PLoS pathogens, 8, e1002787.
DRIJKONINGEN, J. J. & ROHDE, G. G. 2014. Pneumococcal infection in adults:
burden of disease. Clin Microbiol Infect, 20 Suppl 5, 45-51.
DULLAERS, M., DE BRUYNE, R., RAMADANI, F., GOULD, H. J., GEVAERT, P. &
LAMBRECHT, B. N. 2012. The who, where, and when of IgE in allergic airway
disease. J Allergy Clin Immunol, 129, 635-45.
DURBIN, S. D. & FEHER, G. 1996. Protein crystallization. Annual review of physical
chemistry, 47, 171-204.
EDGAR, P. F. 1995. Hucolin, a new corticosteroid-binding protein from human plasma
with structural similarities to ficolins, transforming growth factor-beta 1-binding
proteins. FEBS Lett, 375, 159-61.
EHRENSTEIN, M. R. & NOTLEY, C. A. 2010. The importance of natural IgM:
scavenger, protector and regulator. Nat Rev Immunol, 10, 778-86.
ELDHOLM, V., JOHNSBORG, O., HAUGEN, K., OHNSTAD, H. S. &
HAVARSTEIN, L. S. 2009. Fratricide in Streptococcus pneumoniae:
contributions and role of the cell wall hydrolases CbpD, LytA and LytC.
Microbiology, 155, 2223-34.
Page 230
215
ELEMRAID, M. A., RUSHTON, S. P., SHIRLEY, M. D., THOMAS, M. F., SPENCER,
D. A., EASTHAM, K. M., HAMPTON, F., GORTON, R., POLLARD, K.,
GENNERY, A. R. & CLARK, J. E. 2013. Impact of the 7-valent pneumococcal
conjugate vaccine on the incidence of childhood pneumonia. Epidemiol Infect,
141, 1697-704.
EMSLEY, P. & COWTAN, K. 2004. Coot: model-building tools for molecular graphics.
Acta Crystallogr D Biol Crystallogr, 60, 2126-32.
ENDO, Y., LIU, Y., KANNO, K., TAKAHASHI, M., MATSUSHITA, M. & FUJITA,
T. 2004. Identification of the mouse H-ficolin gene as a pseudogene and orthology
between mouse ficolins A/B and human L-/M-ficolins. Genomics, 84, 737-44.
ENDO, Y., MATSUSHITA, M. & FUJITA, T. 2011. The role of ficolins in the lectin
pathway of innate immunity. Int J Biochem Cell Biol, 43, 705-12.
ENDO, Y., MATSUSHITA, M. & FUJITA, T. 2015. New insights into the role of ficolins
in the lectin pathway of innate immunity. Int Rev Cell Mol Biol, 316, 49-110.
ENDO, Y., NAKAZAWA, N., LIU, Y., IWAKI, D., TAKAHASHI, M., FUJITA, T.,
NAKATA, M. & MATSUSHITA, M. 2005. Carbohydrate-binding specificities
of mouse ficolin A, a splicing variant of ficolin A and ficolin B and their complex
formation with MASP-2 and sMAP. Immunogenetics, 57, 837-44.
ENDO, Y., SATO, Y., MATSUSHITA, M. & FUJITA, T. 1996. Cloning and
Characterization of the Human Lectin P35 Gene and Its Related Gene. Genomics,
36, 515-521.
ENDO, Y., TAKAHASHI, M., IWAKI, D., ISHIDA, Y., NAKAZAWA, N., KODAMA,
T., MATSUZAKA, T., KANNO, K., LIU, Y., TSUCHIYA, K., KAWAMURA,
I., IKAWA, M., WAGURI, S., WADA, I., MATSUSHITA, M., SCHWAEBLE,
W. J. & FUJITA, T. 2012. Mice deficient in ficolin, a lectin complement pathway
recognition molecule, are susceptible to Streptococcus pneumoniae infection. J
Immunol, 189, 5860-6.
ERIKSSON, E., ENGER, J., NORDLANDER, B., ERJAVEC, N., RAMSER, K.,
GOKSOR, M., HOHMANN, S., NYSTROM, T. & HANSTORP, D. 2007. A
microfluidic system in combination with optical tweezers for analyzing rapid and
reversible cytological alterations in single cells upon environmental changes. Lab
Chip, 7, 71-6.
FAVIER, A. L., GOUT, E., REYNARD, O., FERRARIS, O., KLEMAN, J. P.,
VOLCHKOV, V., PEYREFITTE, C. & THIELENS, N. M. 2016. Enhancement
of Ebola Virus Infection via Ficolin-1 Interaction with the Mucin Domain of GP
Glycoprotein. J Virol, 90, 5256-69.
FEIKIN, D. R. & KLUGMAN, K. P. 2002. Historical changes in pneumococcal
serogroup distribution: implications for the era of pneumococcal conjugate
vaccines. Clin Infect Dis, 35, 547-55.
Page 231
216
FELDMAN, C. & ANDERSON, R. 2016. Epidemiology, virulence factors and
management of the pneumococcus. F1000Res, 5, 2320.
FELDMAN, C., COCKERAN, R., JEDRZEJAS, M. J., MITCHELL, T. J. &
ANDERSON, R. 2007. Hyaluronidase augments pneumolysin-mediated injury to
human ciliated epithelium. Int J Infect Dis, 11, 11-5.
FERNANDEZ-TORNERO, C., LOPEZ, R., GARCIA, E., GIMENEZ-GALLEGO, G. &
ROMERO, A. 2001. A novel solenoid fold in the cell wall anchoring domain of
the pneumococcal virulence factor LytA. Nat Struct Biol, 8, 1020-4.
FILE, T. M. 2003. Community-acquired pneumonia. Lancet, 362, 1991-2001.
FILE, T. M., GARAU, J., BLASI, F., CHIDIAC, C., KLUGMAN, K., LODE, H.,
LONKS, J. R., MANDELL, L., RAMIREZ, J. & YU, V. 2004. Guidelines for
empiric antimicrobial prescribing in community-acquired pneumonia. CHEST
Journal, 125, 1888-1901.
FITZSIMMONS, C. M., FALCONE, F. H. & DUNNE, D. W. 2014. Helminth Allergens,
Parasite-Specific IgE, and Its Protective Role in Human Immunity. Front
Immunol, 5, 61.
FLAUMENHAFT, E. & FLAUMENHAFT, C. 1993. Evolution of America's pioneer
bacteriologist: George M. Sternberg's formative years. Mil Med, 158, 448-57.
FORNERIS, F., WU, J. & GROS, P. 2012. The modular serine proteases of the
complement cascade. Curr Opin Struct Biol, 22, 333-41.
FOX, J. D. & WAUGH, D. S. 2003. Maltose-binding protein as a solubility enhancer.
Methods Mol Biol, 205, 99-117.
FREDERIKSEN, P. D., THIEL, S., LARSEN, C. B. & JENSENIUS, J. C. 2005. M-
ficolin, an innate immune defence molecule, binds patterns of acetyl groups and
activates complement. Scand J Immunol, 62, 462-73.
FRIEND, J. & YEO, L. 2010. Fabrication of microfluidic devices using
polydimethylsiloxane. Biomicrofluidics, 4.
FUJIMORI, Y., HARUMIYA, S., FUKUMOTO, Y., MIURA, Y., YAGASAKI, K.,
TACHIKAWA, H. & FUJIMOTO, D. 1998. Molecular cloning and
characterization of mouse ficolin-A. Biochem Biophys Res Commun, 244, 796-
800.
FUKUSUMI, M., CHANG, B., TANABE, Y., OSHIMA, K., MARUYAMA, T.,
WATANABE, H., KURONUMA, K., KASAHARA, K., TAKEDA, H., NISHI,
J., FUJITA, J., KUBOTA, T., SUNAGAWA, T., MATSUI, T. & OISHI, K. 2017.
Page 232
217
Invasive pneumococcal disease among adults in Japan, April 2013 to March 2015:
disease characteristics and serotype distribution. BMC Infect Dis, 17, 2.
GABORIAUD, C., THIELENS, N. M., GREGORY, L. A., ROSSI, V., FONTECILLA-
CAMPS, J. C. & ARLAUD, G. J. 2004. Structure and activation of the C1
complex of complement: unraveling the puzzle. Trends Immunol, 25, 368-73.
GARRED, P., GENSTER, N., PILELY, K., BAYARRI-OLMOS, R., ROSBJERG, A.,
MA, Y. J. & SKJOEDT, M. O. 2016. A journey through the lectin pathway of
complement-MBL and beyond. Immunol Rev, 274, 74-97.
GARRED, P., HONORE, C., MA, Y. J., RORVIG, S., COWLAND, J., BORREGAARD,
N. & HUMMELSHOJ, T. 2010. The genetics of ficolins. J Innate Immun, 2, 3-
16.
GHISAIDOOBE, A. B. & CHUNG, S. J. 2014. Intrinsic tryptophan fluorescence in the
detection and analysis of proteins: a focus on Forster resonance energy transfer
techniques. Int J Mol Sci, 15, 22518-38.
GILBERT, R. J. 2002. Pore-forming toxins. Cell Mol Life Sci, 59, 832-44.
GILBERT, R. J., JIMENEZ, J. L., CHEN, S., TICKLE, I. J., ROSSJOHN, J., PARKER,
M., ANDREW, P. W. & SAIBIL, H. R. 1999. Two structural transitions in
membrane pore formation by pneumolysin, the pore-forming toxin of
Streptococcus pneumoniae. Cell, 97, 647-55.
GILBERT, R. J., ROSSJOHN, J., PARKER, M. W., TWETEN, R. K., MORGAN, P. J.,
MITCHELL, T. J., ERRINGTON, N., ROWE, A. J., ANDREW, P. W. &
BYRON, O. 1998. Self-interaction of pneumolysin, the pore-forming protein
toxin of Streptococcus pneumoniae. J Mol Biol, 284, 1223-37.
GILBERT, R. J. & SONNEN, A. F. 2016. Measuring kinetic drivers of pneumolysin pore
structure. Eur Biophys J, 45, 365-76.
GINGRAS, A. R., GIRIJA, U. V., KEEBLE, A. H., PANCHAL, R., MITCHELL, D. A.,
MOODY, P. C. & WALLIS, R. 2011. Structural basis of mannan-binding lectin
recognition by its associated serine protease MASP-1: implications for
complement activation. Structure, 19, 1635-43.
GIRIJA, U. V., MITCHELL, D. A., ROSCHER, S. & WALLIS, R. 2011. Carbohydrate
recognition and complement activation by rat ficolin-B. Eur J Immunol, 41, 214-
23.
GLEICH, G. J., BIEGER, R. C. & STANKIEVIC, R. 1969. Antigen combining activity
associated with immunoglobulin D. Science, 165, 606.
Page 233
218
GOLUSZKO, P. & NOWICKI, B. 2005. Membrane cholesterol: a crucial molecule
affecting interactions of microbial pathogens with mammalian cells. Infect
Immun, 73, 7791-6.
GRAHAM, F. L. & VAN DER EB, A. J. 1973. A new technique for the assay of
infectivity of human adenovirus 5 DNA. Virology, 52, 456-467.
GRANIZO, J. J., AGUILAR, L., CASAL, J., GARCIA-REY, C., DAL-RE, R. &
BAQUERO, F. 2000. Streptococcus pneumoniae resistance to erythromycin and
penicillin in relation to macrolide and beta-lactam consumption in Spain (1979-
1997). J Antimicrob Chemother, 46, 767-73.
GREEN, R. & ROGERS, E. J. 2013. Transformation of chemically competent E. coli.
Methods Enzymol, 529, 329-36.
GRETER, M., HELFT, J., CHOW, A., HASHIMOTO, D., MORTHA, A., AGUDO-
CANTERO, J., BOGUNOVIC, M., GAUTIER, E. L., MILLER, J., LEBOEUF,
M., LU, G., ALOMAN, C., BROWN, B. D., POLLARD, J. W., XIONG, H.,
RANDOLPH, G. J., CHIPUK, J. E., FRENETTE, P. S. & MERAD, M. 2012.
GM-CSF controls nonlymphoid tissue dendritic cell homeostasis but is
dispensable for the differentiation of inflammatory dendritic cells. Immunity, 36,
1031-46.
GUALDI, L., HAYRE, J. K., GERLINI, A., BIDOSSI, A., COLOMBA, L.,
TRAPPETTI, C., POZZI, G., DOCQUIER, J.-D., ANDREW, P., RICCI, S. &
OGGIONI, M. R. 2012. Regulation of neuraminidase expression in Streptococcus
pneumoniae.
GUILLEMOT, D., VARON, E., BERNEDE, C., WEBER, P., HENRIET, L., SIMON,
S., LAURENT, C., LECOEUR, H. & CARBON, C. 2005. Reduction of antibiotic
use in the community reduces the rate of colonization with penicillin G-
nonsusceptible Streptococcus pneumoniae. Clin Infect Dis, 41, 930-8.
GUO, H. & LI, Z. 2013. Optical tweezers technique and its applications. Science China
Physics, Mechanics and Astronomy, 56, 2351-2360.
GUTZEIT, C., MAGRI, G. & CERUTTI, A. 2014. Intestinal IgA production and its role
in host-microbe interaction. Immunol Rev, 260, 76-85.
HAMED, M. R., BROWN, R. J., ZOTHNER, C., URBANOWICZ, R. A., MASON, C.
P., KRARUP, A., MCCLURE, C. P., IRVING, W. L., BALL, J. K., HARRIS, M.,
HICKLING, T. P. & TARR, A. W. 2014. Recombinant human L-ficolin directly
neutralizes hepatitis C virus entry. J Innate Immun, 6, 676-84.
HAMILTON, R. G. 2010. Clinical laboratory assessment of immediate-type
hypersensitivity. J Allergy Clin Immunol, 125, S284-96.
Page 234
219
HARRIS, J. R., LEWIS, R. J., BAIK, C., POKRAJAC, L., BILLINGTON, S. J. &
PALMER, M. 2011. Cholesterol microcrystals and cochleate cylinders:
attachment of pyolysin oligomers and domain 4. J Struct Biol, 173, 38-45.
HARTZELL, J. D., OSTER, C. N. & GAYDOS, J. C. 2003. How contagious are common
respiratory tract infections? N Engl J Med, 349, 95.
HARUMIYA, S., OMORI, A., SUGIURA, T., FUKUMOTO, Y., TACHIKAWA, H. &
FUJIMOTO, D. 1995. EBP-37, a new elastin-binding protein in human plasma:
structural similarity to ficolins, transforming growth factor-beta 1-binding
proteins. J Biochem, 117, 1029-35.
HASHIMOTO, S., SUZUKI, T., DONG, H. Y., NAGAI, S., YAMAZAKI, N. &
MATSUSHIMA, K. 1999. Serial analysis of gene expression in human monocyte-
derived dendritic cells. Blood, 94, 845-52.
HAUGHNEY, S. L., PETERSEN, L. K., SCHOOFS, A. D., RAMER-TAIT, A. E.,
KING, J. D., BRILES, D. E., WANNEMUEHLER, M. J. & NARASIMHAN, B.
2013. Retention of structure, antigenicity, and biological function of
pneumococcal surface protein A (PspA) released from polyanhydride
nanoparticles. Acta biomaterialia, 9, 8262-8271.
HAUSDORFF, W. P., BRYANT, J., PARADISO, P. R. & SIBER, G. R. 2000. Which
pneumococcal serogroups cause the most invasive disease: implications for
conjugate vaccine formulation and use, part I. Clin Infect Dis, 30, 100-21.
HAZLEWOOD, M. A., KUMARARATNE, D. S., WEBSTER, A. D., GOODALL, M.,
BIRD, P. & DAHA, M. 1992. An association between homozygous C3 deficiency
and low levels of anti-pneumococcal capsular polysaccharide antibodies. Clin Exp
Immunol, 87, 404-9.
HEIMBURG, T., WURZ, U. & MARSH, D. 1992. Binary phase diagram of hydrated
dimyristoylglycerol-dimyristoylphosphatidylcholine mixtures. Biophys J, 63,
1369-78.
HEJA, D., HARMAT, V., FODOR, K., WILMANNS, M., DOBO, J., KEKESI, K. A.,
ZAVODSZKY, P., GAL, P. & PAL, G. 2012. Monospecific inhibitors show that
both mannan-binding lectin-associated serine protease-1 (MASP-1) and -2 Are
essential for lectin pathway activation and reveal structural plasticity of MASP-2.
J Biol Chem, 287, 20290-300.
HELLER, I., HOEKSTRA, T. P., KING, G. A., PETERMAN, E. J. & WUITE, G. J.
2014. Optical tweezers analysis of DNA-protein complexes. Chem Rev, 114,
3087-119.
HENRIQUES-NORMARK, B. & TUOMANEN, E. I. 2013. The pneumococcus:
epidemiology, microbiology, and pathogenesis. Cold Spring Harbor perspectives
in medicine, 3.
Page 235
220
HEUCK, A. P., TWETEN, R. K. & JOHNSON, A. E. 2003. Assembly and topography
of the prepore complex in cholesterol-dependent cytolysins. J Biol Chem, 278,
31218-25.
HIRST, R. A., GOSAI, B., RUTMAN, A., GUERIN, C. J., NICOTERA, P., ANDREW,
P. W. & O'CALLAGHAN, C. 2008. Streptococcus pneumoniae deficient in
pneumolysin or autolysin has reduced virulence in meningitis. J Infect Dis, 197,
744-51.
HIRST, R. A., KADIOGLU, A., O'CALLAGHAN, C. & ANDREW, P. W. 2004. The
role of pneumolysin in pneumococcal pneumonia and meningitis. Clin Exp
Immunol, 138, 195-201.
HOANG, T. V., TOAN, N. L., SONG LE, H., OUF, E. A., BOCK, C. T., KREMSNER,
P. G., KUN, J. F. & VELAVAN, T. P. 2011. Ficolin-2 levels and FCN2
haplotypes influence hepatitis B infection outcome in Vietnamese patients. PLoS
One, 6, e28113.
HOHENESTER, E. 2011. Tackling the legs of mannan-binding lectin. Structure, 19,
1538-40.
HOLMES, A. R., MCNAB, R., MILLSAP, K. W., ROHDE, M., HAMMERSCHMIDT,
S., MAWDSLEY, J. L. & JENKINSON, H. F. 2001. The pavA gene of
Streptococcus pneumoniae encodes a fibronectin-binding protein that is essential
for virulence. Mol Microbiol, 41, 1395-408.
HOMANN, C., VARMING, K., HOGASEN, K., MOLLNES, T. E., GRAUDAL, N.,
THOMSEN, A. C. & GARRED, P. 1997. Acquired C3 deficiency in patients with
alcoholic cirrhosis predisposes to infection and increased mortality. Gut, 40, 544-
9.
HOTZE, E. M. & TWETEN, R. K. 2012. Membrane assembly of the cholesterol-
dependent cytolysin pore complex. Biochim Biophys Acta, 1818, 1028-38.
HOTZE, E. M., WILSON-KUBALEK, E., FARRAND, A. J., BENTSEN, L., PARKER,
M. W., JOHNSON, A. E. & TWETEN, R. K. 2012. Monomer-monomer
interactions propagate structural transitions necessary for pore formation by the
cholesterol-dependent cytolysins. J Biol Chem, 287, 24534-43.
HOULDSWORTH, S., ANDREW, P. W. & MITCHELL, T. J. 1994. Pneumolysin
stimulates production of tumor necrosis factor alpha and interleukin-1 beta by
human mononuclear phagocytes. Infect Immun, 62, 1501-3.
HOURI, H., PORMOHAMMAD, A., RIAHI, S. M., NASIRI, M. J., FALLAH, F.,
DABIRI, H. & POURIRAN, R. 2017. Acute bacterial meningitis in Iran:
Systematic review and meta-analysis. PLoS One, 12, e0169617.
Page 236
221
HSU, H. E., SHUTT, K. A., MOORE, M. R., BEALL, B. W., BENNETT, N. M., CRAIG,
A. S., FARLEY, M. M., JORGENSEN, J. H., LEXAU, C. A., PETIT, S.,
REINGOLD, A., SCHAFFNER, W., THOMAS, A., WHITNEY, C. G. &
HARRISON, L. H. 2009. Effect of pneumococcal conjugate vaccine on
pneumococcal meningitis. N Engl J Med, 360, 244-56.
HU, Y. L., LUO, F. L., FU, J. L., CHEN, T. L., WU, S. M., ZHOU, Y. D. & ZHANG, X.
L. 2013. Early increased ficolin-2 concentrations are associated with severity of
liver inflammation and efficacy of anti-viral therapy in chronic hepatitis C
patients. Scand J Immunol, 77, 144-50.
HUMMELL, D. S., SWIFT, A. J., TOMASZ, A. & WINKELSTEIN, J. A. 1985.
Activation of the alternative complement pathway by pneumococcal lipoteichoic
acid. Infect Immun, 47, 384-7.
HUMMELSHOJ, T., MA, Y. J., MUNTHE-FOG, L., BJARNSHOLT, T., MOSER, C.,
SKJOEDT, M. O., ROMANI, L., FUJITA, T., ENDO, Y. & GARRED, P. 2012.
The interaction pattern of murine serum ficolin-A with microorganisms. PLoS
One, 7, e38196.
HUMMELSHOJ, T., MUNTHE-FOG, L., MADSEN, H. O., FUJITA, T.,
MATSUSHITA, M. & GARRED, P. 2005. Polymorphisms in the FCN2 gene
determine serum variation and function of Ficolin-2. Hum Mol Genet, 14, 1651-
8.
HUMMELSHOJ, T., THIELENS, N. M., MADSEN, H. O., ARLAUD, G. J., SIM, R. B.
& GARRED, P. 2007. Molecular organization of human Ficolin-2. Mol Immunol,
44, 401-11.
HUSSAIN, H. & CHONG, N. F. 2016. Combined Overlap Extension PCR Method for
Improved Site Directed Mutagenesis. Biomed Res Int, 2016, 8041532.
HUSSAIN, R., KIFAYET, A. & CHIANG, T. J. 1995. Immunoglobulin G1 (IgG1) and
IgG3 antibodies are markers of progressive disease in leprosy. Infect Immun, 63,
410-5.
HYAMS, C., CAMBERLEIN, E., COHEN, J. M., BAX, K. & BROWN, J. S. 2010. The
Streptococcus pneumoniae capsule inhibits complement activity and neutrophil
phagocytosis by multiple mechanisms. Infect Immun, 78, 704-15.
HYAMS, C., TRZCINSKI, K., CAMBERLEIN, E., WEINBERGER, D. M.,
CHIMALAPATI, S., NOURSADEGHI, M., LIPSITCH, M. & BROWN, J. S.
2013. Streptococcus pneumoniae capsular serotype invasiveness correlates with
the degree of factor H binding and opsonization with C3b/iC3b. Infect Immun, 81,
354-63.
HYNES, W. L. & WALTON, S. L. 2000. Hyaluronidases of Gram-positive bacteria.
FEMS Microbiol Lett, 183, 201-7.
Page 237
222
IANNELLI, F., CHIAVOLINI, D., RICCI, S., OGGIONI, M. R. & POZZI, G. 2004.
Pneumococcal surface protein C contributes to sepsis caused by Streptococcus
pneumoniae in mice. Infect Immun, 72, 3077-80.
ICHIJO, H., HELLMAN, U., WERNSTEDT, C., GONEZ, L. J., CLAESSON-WELSH,
L., HELDIN, C. H. & MIYAZONO, K. 1993. Molecular cloning and
characterization of ficolin, a multimeric protein with fibrinogen- and collagen-
like domains. J Biol Chem, 268, 14505-13.
ICHIJO, H., RONNSTRAND, L., MIYAGAWA, K., OHASHI, H., HELDIN, C. H. &
MIYAZONO, K. 1991. Purification of transforming growth factor-beta 1 binding
proteins from porcine uterus membranes. J Biol Chem, 266, 22459-64.
IINUMA, Y., HIROSE, Y., TANAKA, T., KUMAGAI, K., MIYAJIMA, M.,
SEKIGUCHI, H., NOMOTO, Y., YABE, M., IMAI, Y. & YAMAZAKI, Y. 2007.
Rapidly progressive fatal pneumococcal sepsis in adults: a report of two cases. J
Infect Chemother, 13, 346-9.
IMOHL, M., MOLLER, J., REINERT, R. R., PERNICIARO, S., VAN DER LINDEN,
M. & AKTAS, O. 2015. Pneumococcal meningitis and vaccine effects in the era
of conjugate vaccination: results of 20 years of nationwide surveillance in
Germany. BMC Infect Dis, 15, 61.
INGELS, H. A. 2015. Reccurrent invasive pneumococcal disease in children host factors
and vaccination response. Dan Med J, 62.
IRANI, V., GUY, A. J., ANDREW, D., BEESON, J. G., RAMSLAND, P. A. &
RICHARDS, J. S. 2015. Molecular properties of human IgG subclasses and their
implications for designing therapeutic monoclonal antibodies against infectious
diseases. Mol Immunol, 67, 171-82.
ISENMAN, D., DORRINGTON, K. & PAINTER, R. 1975. The structure and function
of immunoglobulin domains. J Immunol, 114, 1726-29.
JACOBITZ, A. W., NAZIGA, E. B., YI, S. W., MCCONNELL, S. A., PETERSON, R.,
JUNG, M. E., CLUBB, R. T. & WERESZCZYNSKI, J. 2016. The "Lid" in the
Streptococcus pneumoniae SrtC1 Sortase Adopts a Rigid Structure that Regulates
Substrate Access to the Active Site. J Phys Chem B, 120, 8302-12.
JANOFF, E. N. & RUBINS, J. B. 1997. Invasive pneumococcal disease in the
immunocompromised host. Microb Drug Resist, 3, 215-32.
JANOFF, E. N., RUBINS, J. B., FASCHING, C., CHARBONEAU, D., RAHKOLA, J.
T., PLAUT, A. G. & WEISER, J. N. 2014. Pneumococcal IgA1 protease subverts
specific protection by human IgA1. Mucosal Immunol, 7, 249-56.
Page 238
223
JANULCZYK, R., RICCI, S. & BJORCK, L. 2003. MtsABC is important for manganese
and iron transport, oxidative stress resistance, and virulence of Streptococcus
pyogenes. Infect Immun, 71, 2656-64.
JASON, R. D. W.-C. S. 2010. Complement and its role in innate and adaptive immune
responses. 细胞研究:英文版, 20, 34-50.
JEFFERIS, R. & KUMARARATNE, D. S. 1990. Selective IgG subclass deficiency:
quantification and clinical relevance. Clin Exp Immunol, 81, 357-67.
JENKINS, R. 2000. X‐Ray Techniques: Overview. Encyclopedia of analytical chemistry.
JIRAVANICHPAISAL, P., LEE, B. L. & SODERHALL, K. 2006. Cell-mediated
immunity in arthropods: hematopoiesis, coagulation, melanization and
opsonization. Immunobiology, 211, 213-36.
JOHNSON, S., BROOKS, N. J., SMITH, R. A., LEA, S. M. & BUBECK, D. 2013.
Structural basis for recognition of the pore-forming toxin intermedilysin by
human complement receptor CD59. Cell Rep, 3, 1369-77.
KADIOGLU, A., WEISER, J. N., PATON, J. C. & ANDREW, P. W. 2008. The role of
Streptococcus pneumoniae virulence factors in host respiratory colonization and
disease. Nat Rev Microbiol, 6, 288-301.
KAI, S. & ELINA, I. 1997. Functional rafts in cell membranes. Nature, 387, 569.
KALIA, V., SARKAR, S., GOURLEY, T. S., ROUSE, B. T. & AHMED, R. 2006.
Differentiation of memory B and T cells. Curr Opin Immunol, 18, 255-64.
KANG, H. J., COULIBALY, F., PROFT, T. & BAKER, E. N. 2011. Crystal Structure of
Spy0129, a Streptococcus pyogenes Class B Sortase Involved in Pilus Assembly
(Crystal Structure of a Pilin Polymerase). PLoS ONE, 6, e15969.
KATO, N., ISHIJIMA, A., INABA, T., NOMURA, F., TAKEDA, S. & TAKIGUCHI,
K. 2015. Effects of lipid composition and solution conditions on the mechanical
properties of membrane vesicles. Membranes (Basel), 5, 22-47.
KAUFMAN, R. J., DAVIES, M. V., WASLEY, L. C. & MICHNICK, D. 1991. Improved
vectors for stable expression of foreign genes in mammalian cells by use of the
untranslated leader sequence from EMC virus. Nucleic Acids Res, 19, 4485-90.
KAYHTY, H. & ESKOLA, J. 1996. New vaccines for the prevention of pneumococcal
infections. Emerg Infect Dis, 2, 289-98.
KEREPESI, L. A., HESS, J. A., NOLAN, T. J., SCHAD, G. A. & ABRAHAM, D. 2006.
Complement component C3 is required for protective innate and adaptive
immunity to larval strongyloides stercoralis in mice. J Immunol, 176, 4315-22.
Page 239
224
KIERNEY, P. C. & DORSHKIND, K. 1987. B lymphocyte precursors and myeloid
progenitors survive in diffusion chamber cultures but B cell differentiation
requires close association with stromal cells. Blood, 70, 1418-24.
KILPATRICK, D. C. & CHALMERS, J. D. 2012. Human L-ficolin (ficolin-2) and its
clinical significance. J Biomed Biotechnol, 2012, 138797.
KING, S. J., HIPPE, K. R., GOULD, J. M., BAE, D., PETERSON, S., CLINE, R. T.,
FASCHING, C., JANOFF, E. N. & WEISER, J. N. 2004. Phase variable
desialylation of host proteins that bind to Streptococcus pneumoniae in vivo and
protect the airway. Mol Microbiol, 54, 159-71.
KJAER, T. R., THIEL, S. & ANDERSEN, G. R. 2013. Toward a structure-based
comprehension of the lectin pathway of complement. Mol Immunol, 56, 413-22.
KLEGER, A., SEUFFERLEIN, T., WAGNER, M., TANNAPFEL, A., HOFFMANN, T.
K. & MAYERLE, J. 2015. IgG4-related autoimmune diseases: Polymorphous
presentation complicates diagnosis and treatment. Dtsch Arztebl Int, 112, 128-35.
KOCHAN, K., MARZEC, K. M., CHRUSZCZ-LIPSKA, K., JASZTAL, A., MASLAK,
E., MUSIOLIK, H., CHLOPICKI, S. & BARANSKA, M. 2013. Pathological
changes in the biochemical profile of the liver in atherosclerosis and diabetes
assessed by Raman spectroscopy. Analyst, 138, 3885-90.
KODATI, V. R., EL-JASTIMI, R. & LAFLEUR, M. 1994. Contribution of the
Intermolecular Coupling and Librotorsional Mobility in the Methylene Stretching
Modes in the Infrared Spectra of Acyl Chains. J. Phys. Chem. 98, 12191-12197.
KOLBERG, J., AASE, A., BERGMANN, S., HERSTAD, T. K., RODAL, G., FRANK,
R., ROHDE, M. & HAMMERSCHMIDT, S. 2006. Streptococcus pneumoniae
enolase is important for plasminogen binding despite low abundance of enolase
protein on the bacterial cell surface. Microbiology, 152, 1307-17.
KOLEV, M., LE FRIEC, G. & KEMPER, C. 2014. Complement--tapping into new sites
and effector systems. Nat Rev Immunol, 14, 811-20.
KOSTER, S., VAN PEE, K., HUDEL, M., LEUSTIK, M., RHINOW, D.,
KUHLBRANDT, W., CHAKRABORTY, T. & YILDIZ, O. 2014. Crystal
structure of listeriolysin O reveals molecular details of oligomerization and pore
formation. Nat Commun, 5, 3690.
KRAPP, S., MIMURA, Y., JEFFERIS, R., HUBER, R. & SONDERMANN, P. 2003.
Structural analysis of human IgG-Fc glycoforms reveals a correlation between
glycosylation and structural integrity. J Mol Biol, 325, 979-89.
KRARUP, A., THIEL, S., HANSEN, A., FUJITA, T. & JENSENIUS, J. C. 2004. L-
ficolin is a pattern recognition molecule specific for acetyl groups. J Biol Chem,
279, 47513-9.
Page 240
225
KRARUP, A., SORENSEN, U. B., MATSUSHITA, M., JENSENIUS, J. C. & THIEL,
S. 2005. Effect of capsulation of opportunistic pathogenic bacteria on binding of
the pattern recognition molecules mannan-binding lectin, L-ficolin, and H-ficolin.
Infect Immun, 73, 1052-60.
KRISSINEL, E. 2015. CCP4 Software Suite: history, evolution, content, challenges and
future developments. Arbor: Ciencia, 191, a220.
KRISTO, A., UHARI, M., LUOTONEN, J., KOIVUNEN, P., ILKKO, E., TAPIAINEN,
T. & ALHO, O.-P. 2003. Paranasal Sinus Findings in Children During
Respiratory Infection Evaluated With Magnetic Resonance Imaging. Pediatrics,
111, e586-e589.
KUNG, E., COWARD, W. R., NEILL, D. R., MALAK, H. A., MUHLEMANN, K.,
KADIOGLU, A., HILTY, M. & HATHAWAY, L. J. 2014. The pneumococcal
polysaccharide capsule and pneumolysin differentially affect CXCL8 and IL-6
release from cells of the upper and lower respiratory tract. PLoS One, 9, e92355.
KURAYA, M., MING, Z., LIU, X., MATSUSHITA, M. & FUJITA, T. 2005. Specific
binding of L-ficolin and H-ficolin to apoptotic cells leads to complement
activation. Immunobiology, 209, 689-97.
KUROSAKA, D., LEBIEN, T. W. & PRIBYL, J. A. 1999. Comparative studies of
different stromal cell microenvironments in support of human B-cell
development. Exp Hematol, 27, 1271-81.
LAFFLY, E., LACROIX, M., MARTIN, L., VASSAL-STERMANN, E., THIELENS,
N. M. & GABORIAUD, C. 2014. Human ficolin-2 recognition versatility
extended: an update on the binding of ficolin-2 to sulfated/phosphated
carbohydrates. FEBS Lett, 588, 4694-700.
LAGGNER, P. 2007. Life – As a Matter of Fat – The Emerging Science of Lipidomics
edited by Ole G. Mouritsen. Weinheim.
LAGOS, R., MUNOZ, A., VALENZUELA, M. T., HEITMANN, I. & LEVINE, M. M.
2002. Population-based surveillance for hospitalized and ambulatory pediatric
invasive pneumococcal disease in Santiago, Chile. Pediatr Infect Dis J, 21, 1115-
23.
LAMBERT, P. J., WHITMAN, A. G., DYSON, O. F. & AKULA, S. M. 2006. Raman
spectroscopy: the gateway into tomorrow's virology. Virol J, 3, 51.
LAMBRIS, J. D., RICKLIN, D. & GEISBRECHT, B. V. 2008. Complement evasion by
human pathogens. Nat Rev Microbiol, 6, 132-42.
LATIFF, A. H. & KERR, M. A. 2007. The clinical significance of immunoglobulin A
deficiency. Ann Clin Biochem, 44, 131-9.
Page 241
226
LAWRENCE, S. L., FEIL, S. C., MORTON, C. J., FARRAND, A. J., MULHERN, T.
D., GORMAN, M. A., WADE, K. R., TWETEN, R. K. & PARKER, M. W. 2015.
Crystal structure of Streptococcus pneumoniae pneumolysin provides key insights
into early steps of pore formation. Sci Rep, 5, 14352.
LAWTON, P. F., SAUNTER, C. D. & GIRKIN, J. M. Combining optical trapping in a
microfluidic channel with simultaneous micro-Raman spectroscopy and motion
detection. SPIE MOEMS-MEMS, 2014. International Society for Optics and
Photonics, 89760V-89760V-9.
LEFRANC, M. P. & LEFRANC, G. 2012. Human Gm, Km, and Am allotypes and their
molecular characterization: a remarkable demonstration of polymorphism.
Methods Mol Biol, 882, 635-80.
LEI, X., LIU, C., AZADZOI, K., LI, C., LU, F., XIANG, A., SUN, J., GUO, Y., ZHAO,
Q., YAN, Z. & YANG, J. 2015. A novel IgM-H-ficolin complement pathway to
attack allogenic cancer cells in vitro. Sci Rep, 5, 7824.
LEMIEUX, J., WOODY, S. & CAMILLI, A. 2008. Roles of the sortases of Streptococcus
pneumoniae in assembly of the RlrA pilus. J Bacteriol, 190, 6002-13.
LEUNG, C., DUDKINA, N. V., LUKOYANOVA, N., HODEL, A. W., FARABELLA,
I., PANDURANGAN, A. P., JAHAN, N., PIRES DAMASO, M., OSMANOVIC,
D., REBOUL, C. F., DUNSTONE, M. A., ANDREW, P. W., LONNEN, R.,
TOPF, M., SAIBIL, H. R. & HOOGENBOOM, B. W. 2014. Stepwise
visualization of membrane pore formation by suilysin, a bacterial cholesterol-
dependent cytolysin. Elife, 3, e04247.
LEUSEN, J. H. 2015a. IgA as therapeutic antibody. Mol Immunol, 68, 35-9.
LEVY, C., VARON, E., PICARD, C., BECHET, S., MARTINOT, A., BONACORSI, S.
& COHEN, R. 2014. Trends of pneumococcal meningitis in children after
introduction of the 13-valent pneumococcal conjugate vaccine in France. Pediatr
Infect Dis J, 33, 1216-21.
LEWIS, R. N. & MCELHANEY, R. N. 2013. Membrane lipid phase transitions and
phase organization studied by Fourier transform infrared spectroscopy. Biochim
Biophys Acta, 1828, 2347-58.
LHERT, F., BLAUDEZ, D., HEYWANG, C. & TURLET, J. M. 2002. Free-Standing
Black Films: An Alternative to Langmuir Monolayers for the Study by Raman
Spectroscopy of Peptide−Phospholipid Interaction in Ultrathin Films. Langmuir,
18, 512-518.
LI, C., WEN, A., SHEN, B., LU, J., HUANG, Y. & CHANG, Y. 2011. FastCloning: a
highly simplified, purification-free, sequence- and ligation-independent PCR
cloning method. BMC Biotechnology, 11, 92-92.
Page 242
227
LI, J., WANG, X., ZHANG, T., WANG, C., HUANG, Z., LUO, X. & DENG, Y. 2015.
A review on phospholipids and their main applications in drug delivery systems.
Asian J. Pharm 10, 81-98.
LI, Q., LI, Y. X., DOUTHITT, K., STAHL, G. L., THURMAN, J. M. & TONG, H. H.
2012. Role of the alternative and classical complement activation pathway in
complement mediated killing against Streptococcus pneumoniae colony opacity
variants during acute pneumococcal otitis media in mice. Microbes Infect, 14,
1308-18.
LI, Y., HILL, A., BEITELSHEES, M., SHAO, S. & LOVELL, J. F. 2016. Directed
vaccination against pneumococcal disease. 113, 6898-903.
LIN, H.-Y. & THOMAS, J. L. 2003. PEG-lipids and oligo (ethylene glycol) surfactants
enhance the ultrasonic permeabilizability of liposomes. Langmuir, 19, 1098-1105.
LIPMAN, N. S., JACKSON, L. R., TRUDEL, L. J. & WEIS-GARCIA, F. 2005.
Monoclonal Versus Polyclonal Antibodies: Distinguishing Characteristics,
Applications, and Information Resources. ILAR Journal, 46, 258-268.
LITTMANN, M., ALBIGER, B., FRENTZEN, A., NORMARK, S., HENRIQUES-
NORMARK, B. & PLANT, L. 2009. Streptococcus pneumoniae evades human
dendritic cell surveillance by pneumolysin expression. EMBO Mol Med, 1, 211-
22.
LIU, H. & MAY, K. 2012. Disulfide bond structures of IgG molecules: structural
variations, chemical modifications and possible impacts to stability and biological
function. MAbs, 4, 17-23.
LIU, J., ALI, M. A., SHI, Y., ZHAO, Y., LUO, F., YU, J., XIANG, T., TANG, J., LI, D.,
HU, Q., HO, W. & ZHANG, X. 2009. Specifically binding of L-ficolin to N-
glycans of HCV envelope glycoproteins E1 and E2 leads to complement
activation. Cell Mol Immunol, 6, 235-44.
LIU, Y., ENDO, Y., IWAKI, D., NAKATA, M., MATSUSHITA, M., WADA, I.,
INOUE, K., MUNAKATA, M. & FUJITA, T. 2005. Human M-ficolin is a
secretory protein that activates the lectin complement pathway. J Immunol, 175,
3150-6.
LOMBARD, J. 2014. Once upon a time the cell membranes: 175 years of cell boundary
research. Biol Direct, 9, 32.
LOW, D. E. 2005. Changing trends in antimicrobial-resistant pneumococci: it's not all
bad news. Clin Infect Dis, 41 Suppl 4, S228-33.
LU, J., TAY, P. N., KON, O. L. & REID, K. B. 1996. Human ficolin: cDNA cloning,
demonstration of peripheral blood leucocytes as the major site of synthesis and
assignment of the gene to chromosome 9. Biochem J, 313 ( Pt 2), 473-8.
Page 243
228
LUO, F., CHEN, T., LIU, J., SHEN, X., ZHAO, Y., YANG, R. & ZHANG, X. 2016.
Ficolin-2 binds to HIV-1 gp120 and blocks viral infection. Virol Sin, 31, 406-414.
LUO, F., SUN, X., WANG, Y., WANG, Q., WU, Y., PAN, Q., FANG, C. & ZHANG,
X. L. 2013. Ficolin-2 defends against virulent Mycobacteria tuberculosis infection
in vivo, and its insufficiency is associated with infection in humans. PLoS One, 8,
e73859.
LUZ, P. R., BOLDT, A. B., GRISBACH, C., KUN, J. F., VELAVAN, T. P. & MESSIAS-
REASON, I. J. 2013. Association of L-ficolin levels and FCN2 genotypes with
chronic Chagas disease. PLoS One, 8, e60237.
LYNCH, N. J., ROSCHER, S., HARTUNG, T., MORATH, S., MATSUSHITA, M.,
MAENNEL, D. N., KURAYA, M., FUJITA, T. & SCHWAEBLE, W. J. 2004.
L-ficolin specifically binds to lipoteichoic acid, a cell wall constituent of Gram-
positive bacteria, and activates the lectin pathway of complement. J Immunol,
172, 1198-202.
MA, Y. G., CHO, M. Y., ZHAO, M., PARK, J. W., MATSUSHITA, M., FUJITA, T. &
LEE, B. L. 2004. Human mannose-binding lectin and L-ficolin function as
specific pattern recognition proteins in the lectin activation pathway of
complement. J Biol Chem, 279, 25307-12.
MAGARKAR, A., DHAWAN, V., KALLINTERI, P., VIITALA, T., ELMOWAFY, M.,
ROG, T. & BUNKER, A. 2014. Cholesterol level affects surface charge of lipid
membranes in saline solution. Sci Rep, 4, 5005.
MALHOTRA-KUMAR, S., LAMMENS, C., COENEN, S., VAN HERCK, K. &
GOOSSENS, H. 2007. Effect of azithromycin and clarithromycin therapy on
pharyngeal carriage of macrolide-resistant streptococci in healthy volunteers: a
randomised, double-blind, placebo-controlled study. Lancet, 369, 482-90.
MANDELL, L. A. 2015. Community-acquired pneumonia: An overview. Postgrad Med,
127, 607-15.
MARSHALL, J. E., FARAJ, B. H., GINGRAS, A. R., LONNEN, R., SHEIKH, M. A.,
EL-MEZGUELDI, M., MOODY, P. C., ANDREW, P. W. & WALLIS, R. 2015.
The Crystal Structure of Pneumolysin at 2.0 A Resolution Reveals the Molecular
Packing of the Pre-pore Complex. Sci Rep, 5, 13293.
MARTNER, A., DAHLGREN, C., PATON, J. C. & WOLD, A. E. 2008. Pneumolysin
released during Streptococcus pneumoniae autolysis is a potent activator of
intracellular oxygen radical production in neutrophils. Infect Immun, 76, 4079-87.
MARTNER, A., SKOVBJERG, S., PATON, J. C. & WOLD, A. E. 2009. Streptococcus
pneumoniae autolysis prevents phagocytosis and production of phagocyte-
activating cytokines. Infect Immun, 77, 3826-37.
Page 244
229
MASON, C. P. & TARR, A. W. 2015. Human lectins and their roles in viral infections.
Molecules, 20, 2229-71.
MATSUSHITA, M. 2010. Ficolins: complement-activating lectins involved in innate
immunity. J Innate Immun, 2, 24-32.
MATSUSHITA, M., ENDO, Y. & FUJITA, T. 2013. Structural and functional overview
of the lectin complement pathway: its molecular basis and physiological
implication. Arch Immunol Ther Exp (Warsz), 61, 273-83.
MATSUSHITA, M., ENDO, Y., TAIRA, S., SATO, Y., FUJITA, T., ICHIKAWA, N.,
NAKATA, M. & MIZUOCHI, T. 1996. A novel human serum lectin with
collagen- and fibrinogen-like domains that functions as an opsonin. J Biol Chem,
271, 2448-54.
MATSUSHITA, M. & FUJITA, T. 2001. Ficolins and the lectin complement pathway.
Immunol Rev, 180, 78-85.
MATSUSHITA, M., KURAYA, M., HAMASAKI, N., TSUJIMURA, M., SHIRAKI, H.
& FUJITA, T. 2002. Activation of the lectin complement pathway by H-ficolin
(Hakata antigen). J Immunol, 168, 3502-6.
MCCOMBS, J. E. & KOHLER, J. J. 2016. Pneumococcal Neuraminidase Substrates
Identified through Comparative Proteomics Enabled by Chemoselective
Labeling. Bioconjug Chem, 27, 1013-22.
MCGEE, L., MCDOUGAL, L., ZHOU, J., SPRATT, B. G., TENOVER, F. C.,
GEORGE, R., HAKENBECK, R., HRYNIEWICZ, W., LEFEVRE, J. C.,
TOMASZ, A. & KLUGMAN, K. P. 2001. Nomenclature of major antimicrobial-
resistant clones of Streptococcus pneumoniae defined by the pneumococcal
molecular epidemiology network. J Clin Microbiol, 39, 2565-71.
MCPHERSON, A. & GAVIRA, J. A. 2014. Introduction to protein crystallization. Acta
Crystallogr F Struct Biol Commun, 70, 2-20.
MELIS, J. P., STRUMANE, K., RUULS, S. R., BEURSKENS, F. J., SCHUURMAN, J.
& PARREN, P. W. 2015. Complement in therapy and disease: Regulating the
complement system with antibody-based therapeutics. Mol Immunol, 67, 117-30.
MELLROTH, P., DANIELS, R., EBERHARDT, A., RONNLUND, D., BLOM, H.,
WIDENGREN, J., NORMARK, S. & HENRIQUES-NORMARK, B. 2012.
LytA, major autolysin of Streptococcus pneumoniae, requires access to nascent
peptidoglycan. J Biol Chem, 287, 11018-29.
MENESTRINA, G. 1988. Escherichia coli hemolysin permeabilizes small unilamellar
vesicles loaded with calcein by a single‐hit mechanism. FEBS letters, 232, 217-
220.
Page 245
230
MEYTS, I., BOSSUYT, X., PROESMANS, M. & DE, B. 2006. Isolated IgG3 deficiency
in children: to treat or not to treat? Case presentation and review of the literature.
Pediatr Allergy Immunol, 17, 544-50.
MICHAELSEN, T. E., FRANGIONE, B. & FRANKLIN, E. C. 1977. Primary structure
of the "hinge" region of human IgG3. Probable quadruplication of a 15-amino
acid residue basic unit. J Biol Chem, 252, 883-9.
MICHAELSEN, T. E., GARRED, P. & AASE, A. 1991. Human IgG subclass pattern of
inducing complement-mediated cytolysis depends on antigen concentration and
to a lesser extent on epitope patchiness, antibody affinity and complement
concentration. Eur J Immunol, 21, 11-6.
MICHAELSEN, T. E., SANDLIE, I., BRATLIE, D. B., SANDIN, R. H. & IHLE, O.
2009. Structural difference in the complement activation site of human IgG1 and
IgG3. Scand J Immunol, 70, 553-64.
MIMURA, Y., CHURCH, S., GHIRLANDO, R., ASHTON, P. R., DONG, S.,
GOODALL, M., LUND, J. & JEFFERIS, R. 2000. The influence of glycosylation
on the thermal stability and effector function expression of human IgG1-Fc:
properties of a series of truncated glycoforms. Mol Immunol, 37, 697-706.
MIMURA, Y., SONDERMANN, P., GHIRLANDO, R., LUND, J., YOUNG, S. P.,
GOODALL, M. & JEFFERIS, R. 2001. Role of oligosaccharide residues of IgG1-
Fc in Fc gamma RIIb binding. J Biol Chem, 276, 45539-47.
MITCHELL, A. M. & MITCHELL, T. J. 2010. Streptococcus pneumoniae: virulence
factors and variation. Clin Microbiol Infect, 16, 411-8.
MITCHELL, T. J., ALEXANDER, J. E., MORGAN, P. J. & ANDREW, P. W. 1997.
Molecular analysis of virulence factors of Streptococcus pneumoniae. Soc Appl
Bacteriol Symp Ser, 26, 62s-71s.
MITCHELL, T. J., ANDREW, P. W., SAUNDERS, F. K., SMITH, A. N. & BOULNOIS,
G. J. 1991. Complement activation and antibody binding by pneumolysin via a
region of the toxin homologous to a human acute-phase protein. Mol Microbiol,
5, 1883-8.
MOGENSEN, T. H. 2009. Pathogen recognition and inflammatory signaling in innate
immune defenses. Clin Microbiol Rev, 22, 240-73.
MORGAN, P. J., HYMAN, S. C., BYRON, O., ANDREW, P. W., MITCHELL, T. J. &
ROWE, A. J. 1994. Modeling the bacterial protein toxin, pneumolysin, in its
monomeric and oligomeric form. J Biol Chem, 269, 25315-20.
MORGAN, P. J., VARLEY, P. G., ROWE, A. J., ANDREW, P. W. & MITCHELL, T.
J. 1993. Characterization of the solution properties and conformation of
pneumolysin, the membrane-damaging toxin of Streptococcus pneumoniae.
Biochem J, 296 ( Pt 3), 671-4.
Page 246
231
MUKERJI, R., MIRZA, S., ROCHE, A. M., WIDENER, R. W., CRONEY, C. M.,
RHEE, D. K., WEISER, J. N., SZALAI, A. J. & BRILES, D. E. 2012.
Pneumococcal surface protein A inhibits complement deposition on the
pneumococcal surface by competing with the binding of C-reactive protein to cell-
surface phosphocholine. J Immunol, 189, 5327-35.
MUNISHKINA, L. A. & FINK, A. L. 2007. Fluorescence as a method to reveal structures
and membrane-interactions of amyloidogenic proteins. Biochim Biophys Acta,
1768, 1862-85.
MUNTHE-FOG, L., HUMMELSHOJ, T., HONORE, C., MOLLER, M. E., SKJOEDT,
M. O., PALSGAARD, I., BORREGAARD, N., MADSEN, H. O. & GARRED,
P. 2012. Variation in FCN1 affects biosynthesis of ficolin-1 and is associated with
outcome of systemic inflammation. Genes Immun, 13, 515-22.
NAGARAJAN, S., SCHULER, E. E., MA, K., KINDT, J. T. & DYER, R. B. 2012.
Dynamics of the gel to fluid phase transformation in unilamellar DPPC vesicles.
J Phys Chem B, 116, 13749-56.
NALLAMSETTY, S., AUSTIN, B. P., PENROSE, K. J. & WAUGH, D. S. 2005.
Gateway vectors for the production of combinatorially-tagged His6-MBP fusion
proteins in the cytoplasm and periplasm of Escherichia coli. Protein Sci, 14, 2964-
71.
NAUMANN, C., BRUMM, T. & BAYERL, T. M. 1992. Phase transition behavior of
single phosphatidylcholine bilayers on a solid spherical support studied by DSC,
NMR and FT-IR. Biophys J, 63, 1314-9.
NGO, C. C., MASSA, H. M., THORNTON, R. B. & CRIPPS, A. W. 2016. Predominant
Bacteria Detected from the Middle Ear Fluid of Children Experiencing Otitis
Media: A Systematic Review. PLoS One, 11, 0150949.
NICOLSON, G. L. 2014. The Fluid-Mosaic Model of Membrane Structure: still relevant
to understanding the structure, function and dynamics of biological membranes
after more than 40 years. Biochim Biophys Acta, 1838, 1451-66.
NILSSON, P. & LAURELL, M. H. 2001. Carriage of penicillin-resistant Streptococcus
pneumoniae by children in day-care centers during an intervention program in
Malmo, Sweden. Pediatr Infect Dis J, 20, 1144-9.
NOLLMANN, M., GILBERT, R., MITCHELL, T., SFERRAZZA, M. & BYRON, O.
2004. The role of cholesterol in the activity of pneumolysin, a bacterial protein
toxin. Biophys J, 86, 3141-51.
NOTERMAN, H. & NURMIO, A. 2016. Infectious diseases in children and treatment at
home: Guidebook for parents.
Page 247
232
NUORTI, J. P. & WHITNEY, C. G. 2010. Prevention of pneumococcal disease among
infants and children - use of 13-valent pneumococcal conjugate vaccine and 23-
valent pneumococcal polysaccharide vaccine - recommendations of the Advisory
Committee on Immunization Practices (ACIP). MMWR Recomm Rep, 59, 1-18.
O'BRIEN, K. L., WOLFSON, L. J., WATT, J. P., HENKLE, E., DELORIA-KNOLL,
M., MCCALL, N., LEE, E., MULHOLLAND, K., LEVINE, O. S. & CHERIAN,
T. 2009. Burden of disease caused by Streptococcus pneumoniae in children
younger than 5 years: global estimates. Lancet, 374, 893-902.
O’GRADY, K.-A. F., GRIMWOOD, K., CRIPPS, A., MULHOLLAND, E. K.,
MORRIS, P., TORZILLO, P. J., WOOD, N., SMITH-VAUGHAN, H., REVELL,
A. & WILSON, A. 2013. Does a 10-valent pneumococcal-Haemophilus
influenzae protein D conjugate vaccine prevent respiratory exacerbations in
children with recurrent protracted bacterial bronchitis, chronic suppurative lung
disease and bronchiectasis: protocol for a randomised controlled trial. Trials, 14,
1.
OBARO, S. & ADEGBOLA, R. 2002. The pneumococcus: carriage, disease and
conjugate vaccines. J Med Microbiol, 51, 98-104.
OHASHI, T. & ERICKSON, H. P. 1998. Oligomeric structure and tissue distribution of
ficolins from mouse, pig and human. Arch Biochem Biophys, 360, 223-32.
OHNO-IWASHITA, Y., IWAMOTO, M., MITSUI, K., ANDO, S. & NAGAI, Y. 1988.
Protease-nicked theta-toxin of Clostridium perfringens, a new membrane probe
with no cytolytic effect, reveals two classes of cholesterol as toxin-binding sites
on sheep erythrocytes. Eur J Biochem, 176, 95-101.
PALMER, M., HARRIS, R., FREYTAG, C., KEHOE, M., TRANUM-JENSEN, J. &
BHAKDI, S. 1998. Assembly mechanism of the oligomeric streptolysin O pore:
the early membrane lesion is lined by a free edge of the lipid membrane and is
extended gradually during oligomerization. Embo j, 17, 1598-605.
PALMU, A. A., VERHO, J., JOKINEN, J., KARMA, P. & KILPI, T. M. 2004. The
seven-valent pneumococcal conjugate vaccine reduces tympanostomy tube
placement in children. Pediatr Infect Dis J, 23, 732-8.
PAN, Q., CHEN, H., WANG, F., JEZA, V. T., HOU, W., ZHAO, Y., XIANG, T., ZHU,
Y., ENDO, Y., FUJITA, T. & ZHANG, X. L. 2012. L-ficolin binds to the
glycoproteins hemagglutinin and neuraminidase and inhibits influenza A virus
infection both in vitro and in vivo. J Innate Immun, 4, 312-24.
PANGBURN, M. K. & MULLER-EBERHARD, H. J. 1986. The C3 convertase of the
alternative pathway of human complement. Enzymic properties of the
bimolecular proteinase. Biochem J, 235, 723-30.
Page 248
233
PATERSON, G. K. & ORIHUELA, C. J. 2010. Pneumococci: immunology of the innate
host response. Respirology, 15, 1057-63.
PATON, J. C., LOCK, R. A. & HANSMAN, D. J. 1983. Effect of immunization with
pneumolysin on survival time of mice challenged with Streptococcus
pneumoniae. Infect Immun, 40, 548-52.
PATON, J. C., ROWAN-KELLY, B. & FERRANTE, A. 1984. Activation of human
complement by the pneumococcal toxin pneumolysin. Infect Immun, 43, 1085-7.
PILISHVILI, T. & BENNETT, N. M. 2015. Pneumococcal disease prevention among
adults: Strategies for the use of pneumococcal vaccines. Vaccine, 33, D60-D65.
PLEASS, R. J., MOORE, S. C., STEVENSON, L. & HVIID, L. 2016. Immunoglobulin
M: Restrainer of Inflammation and Mediator of Immune Evasion by Plasmodium
falciparum Malaria. Trends Parasitol, 32, 108-19.
POLLARD, A. J., NADEL, S., NINIS, N., FAUST, S. N. & LEVIN, M. 2007. Emergency
management of meningococcal disease: eight years on. Arch Dis Child, 92, 283-
6.
POOLE, J. A. & ROSENWASSER, L. J. 2005. The role of immunoglobulin E and
immune inflammation: implications in allergic rhinitis. Curr Allergy Asthma Rep,
5, 252-8.
POUGET, J. P., LAUNOIS, H., D'HAENENS, J. P., MERENDA, P. & RICE, T. M.
1975. Electron Localization Induced by Uniaxial Stress in Pure V O 2. Physical
Review Letters, 35, 873-875.
PRACHT, D., ELM, C., GERBER, J., BERGMANN, S., ROHDE, M., SEILER, M.,
KIM, K. S., JENKINSON, H. F., NAU, R. & HAMMERSCHMIDT, S. 2005.
PavA of Streptococcus pneumoniae modulates adherence, invasion, and
meningeal inflammation. Infect Immun, 73, 2680-9.
PRICE, K. E. & CAMILLI, A. 2009. Pneumolysin localizes to the cell wall of
Streptococcus pneumoniae. J Bacteriol, 191, 2163-8.
PRICE, K. E., GREENE, N. G. & CAMILLI, A. 2012. Export requirements of
pneumolysin in Streptococcus pneumoniae. J Bacteriol, 194, 3651-60.
PRINCIPI, N. & ESPOSITO, S. 2016. Prevention of Community-Acquired Pneumonia
with Available Pneumococcal Vaccines. Int J Mol Sci, 18.
PRINCIPI, N. & ESPOSITO, S. 2016. Prevention of Community-Acquired Pneumonia
with Available Pneumococcal Vaccines. Int J Mol Sci, 18.30.
QORONFLEH, M. W., HESTERBERG, L. K. & SEEFELDT, M. B. 2007. Confronting
high-throughput protein refolding using high pressure and solution screens.
Protein Expr Purif, 55, 209-24.
Page 249
234
QUREISHI, A., LEE, Y., BELFIELD, K., BIRCHALL, J. P. & DANIEL, M. 2014.
Update on otitis media - prevention and treatment. Infect Drug Resist, 7, 15-24.
RACINE, R. & WINSLOW, G. M. 2009. IgM in microbial infections: taken for granted?
Immunol Lett, 125, 79-85.
RAI, P., HE, F., KWANG, J., ENGELWARD, B. P. & CHOW, V. T. 2016.
Pneumococcal Pneumolysin Induces DNA Damage and Cell Cycle Arrest. Sci
Rep, 6, 22972.
RAJAN, S., GAZZALI, P. M. & CHANDRASEKARAN, G. 2017. Impact of Fe on
structural modification and room temperature magnetic ordering in BaTiO3.
Spectrochim Acta A Mol Biomol Spectrosc, 171, 80-89.
RAMACHANDRAN, R., HEUCK, A. P., TWETEN, R. K. & JOHNSON, A. E. 2002.
Structural insights into the membrane-anchoring mechanism of a cholesterol-
dependent cytolysin. Nat Struct Biol, 9, 823-7.
RANDLE, E., NINIS, N. & INWALD, D. 2011. Invasive pneumococcal disease.
Archives of disease in childhood - Education & practice edition, 96, 183.
RASHID, F., SHARMA, S. & BANO, B. 2005. Comparison of guanidine hydrochloride
(GdnHCl) and urea denaturation on inactivation and unfolding of human placental
cystatin (HPC). Protein J, 24, 283-292.
REDDING, B., SCHWAB, M. & PAN, Y.-L. 2015. Raman Spectroscopy of Optically
Trapped Single Biological Micro-Particles. Sensors (Basel, Switzerland), 15,
19021-19046.
REDPATH, S., MICHAELSEN, T., SANDLIE, I. & CLARK, M. R. 1998. Activation of
complement by human IgG1 and human IgG3 antibodies against the human
leucocyte antigen CD52. Immunol, 93, 595-600.
REYNOLDS, C. A., FINKELSTEIN, J. A., RAY, G. T., MOORE, M. R. & HUANG, S.
S. 2014. Attributable healthcare utilization and cost of pneumonia due to drug-
resistant streptococcus pneumonia: a cost analysis. Antimicrob Resist Infect
Control, 3, 16.
RICHARD, L. M. 2001. Raman spectroscopy for chemical analysis. Meas. Sci. Technol.
12, 653-654.
RICKLIN, D., HAJISHENGALLIS, G., YANG, K. & LAMBRIS, J. D. 2010.
Complement: a key system for immune surveillance and homeostasis. Nat
Immunol, 11, 785-97.
ROGERS, K. A., RICHARDSON, J. P., SCINICARIELLO, F. & ATTANASIO, R.
2006. Molecular characterization of immunoglobulin D in mammals:
Page 250
235
immunoglobulin heavy constant delta genes in dogs, chimpanzees and four old
world monkey species. Immunol, 118, 88-100.
ROJKO, N. & ANDERLUH, G. 2015. How Lipid Membranes Affect Pore Forming
Toxin Activity. Acc Chem Res, 48, 3073-9.
ROOS, A., BOUWMAN, L. H., VAN GIJLSWIJK-JANSSEN, D. J., FABER-KROL,
M. C., STAHL, G. L. & DAHA, M. R. 2001. Human IgA activates the
complement system via the mannan-binding lectin pathway. Journal of
immunology (Baltimore, Md. : 1950), 167, 2861.
ROSBJERG, A., MUNTHE-FOG, L., GARRED, P. & SKJOEDT, M. O. 2014.
Heterocomplex formation between MBL/ficolin/CL-11-associated serine
protease-1 and -3 and MBL/ficolin/CL-11-associated protein-1. J Immunol, 192,
4352-60.
ROSSJOHN, J., FEIL, S. C., MCKINSTRY, W. J., TWETEN, R. K. & PARKER, M. W.
1997. Structure of a cholesterol-binding, thiol-activated cytolysin and a model of
its membrane form. Cell, 89, 685-92.
ROSSJOHN, J., GILBERT, R. J., CRANE, D., MORGAN, P. J., MITCHELL, T. J.,
ROWE, A. J., ANDREW, P. W., PATON, J. C., TWETEN, R. K. & PARKER,
M. W. 1998. The molecular mechanism of pneumolysin, a virulence factor from
Streptococcus pneumoniae. J Mol Biol, 284, 449-61.
ROSTENBERG, I. & PENALOZA, R. 1978. Serum IgG and IgD and levels in some
infectious and noninfectious diseases. Clin Chim Acta, 85, 319-21.
RUDAN, I., BOSCHI-PINTO, C., BILOGLAV, Z., MULHOLLAND, K. &
CAMPBELL, H. 2008. Epidemiology and etiology of childhood pneumonia. Bull
World Health Organ, 86, 408-16.
RUNZA, V. L., HEHLGANS, T., ECHTENACHER, B., ZAHRINGER, U.,
SCHWAEBLE, W. J. & MANNEL, D. N. 2006. Localization of the mouse
defense lectin ficolin B in lysosomes of activated macrophages. J Endotoxin Res,
12, 120-6.
RUSKAMP, J. M., HOEKSTRA, M. O., POSTMA, D. S., KERKHOF, M., BOTTEMA,
R. W., KOPPELMAN, G. H., ROVERS, M. M., WIJGA, A. H., DE JONGSTE,
J. C., BRUNEKREEF, B. & SANDERS, E. A. 2009. Exploring the role of
polymorphisms in ficolin genes in respiratory tract infections in children. Clin
Exp Immunol, 155, 433-40.
SAHU, A., KOZEL, T. R. & PANGBURN, M. K. 1994. Specificity of the thioester-
containing reactive site of human C3 and its significance to complement
activation. Biochem J, 302 ( Pt 2), 429-336.
Page 251
236
SAINT-MICHEL, B., DUBRULLE, B., MARIÉ, L., RAVELET, F. & DAVIAUD, F.
2014. Influence of reynolds number and forcing type in a turbulent von kármán
flow. New J. Phys, 16, 063037.
SAMBROOK, J. & RUSSELL, D. W. 2001. Molecular cloning: a laboratory manual,
Cold Spring Harbor, N.Y, Cold Spring Harbor Laboratory Press.
SANDERSON, J. M. & WARD, A. D. 2004. Analysis of liposomal membrane
composition using Raman tweezers. Chem Commun (Camb), 1120-1.
SANDGREN, A., SJOSTROM, K., OLSSON-LILJEQUIST, B., CHRISTENSSON, B.,
SAMUELSSON, A., KRONVALL, G. & HENRIQUES NORMARK, B. 2004.
Effect of clonal and serotype-specific properties on the invasive capacity of
Streptococcus pneumoniae. J Infect Dis, 189, 785-96.
SASSI, P., CAPONI, S., RICCI, M., MORRESI, A., OLDENHOF, H., WOLKERS, W.
F. & FIORETTO, D. 2015. Infrared versus light scattering techniques to monitor
the gel to liquid crystal phase transition in lipid membranes. J. Raman Spectrosc,
46, 644-51.
SCHAEFER, J. J., MA, C. & HARRIS, J. M. 2012. Confocal Raman microscopy probing
of temperature-controlled release from individual, optically-trapped phospholipid
vesicles. Anal Chem, 84, 9505-12.
SCHAFFER, T., FLOGERZI, B., SCHOEPFER, A. M., SEIBOLD, F. & MULLER, S.
2013. Increased titers of anti-Saccharomyces cerevisiae antibodies in Crohn's
disease patients with reduced H-ficolin levels but normal MASP-2 activity. J
Crohns Colitis, 7, e1-10.
SCHECK, F. 2013. Quantum physics, Berlin, Springer.
SCHMIDT, K. & MUELLER-ECKHARDT, C. 1973. Antinuclear autoantibodies of IgD
class. An analysis of 82 patients. Z Immunitatsforsch Exp Klin Immunol, 145, 385-
91.
SCHROEDER JR, H. W. 2010. Structure and function of immunoglobulins. J Allergy
Clin Immunol, 125, S41-S52.
SCHROEDER, M. R. & STEPHENS, D. S. 2016. Macrolide Resistance in Streptococcus
pneumoniae. Front Cell Infect Microbiol, 6.
SELMAN, L. & HANSEN, S. 2012. Structure and function of collectin liver 1 (CL-L1)
and collectin 11 (CL-11, CL-K1). Immunobiology, 217, 851-863.
SERCOMBE, L., VEERATI, T., MOHEIMANI, F., WU, S. Y., SOOD, A. K. & HUA,
S. 2015. Advances and Challenges of Liposome Assisted Drug Delivery. Front
Pharmacol, 6, 286.
Page 252
237
SHATURSKY, O., HEUCK, A. P., SHEPARD, L. A., ROSSJOHN, J., PARKER, M.
W., JOHNSON, A. E. & TWETEN, R. K. 1999. The mechanism of membrane
insertion for a cholesterol-dependent cytolysin: a novel paradigm for pore-
forming toxins. Cell, 99, 293-9.
SHENOY, A. T. & ORIHUELA, C. J. 2016. Anatomical site-specific contributions of
pneumococcal virulence determinants. Pneumonia (Nathan), 8.
SHEPARD, L. A., HEUCK, A. P., HAMMAN, B. D., ROSSJOHN, J., PARKER, M. W.,
RYAN, K. R., JOHNSON, A. E. & TWETEN, R. K. 1998. Identification of a
membrane-spanning domain of the thiol-activated pore-forming toxin
Clostridium perfringens perfringolysin O: an alpha-helical to beta-sheet transition
identified by fluorescence spectroscopy. Biochemistry, 37, 14563.
SHEPARD, L. A., SHATURSKY, O., JOHNSON, A. E. & TWETEN, R. K. 2000. The
mechanism of pore assembly for a cholesterol-dependent cytolysin: formation of
a large prepore complex precedes the insertion of the transmembrane beta-
hairpins. Biochemistry, 39, 10284-93.
SHEWELL, L. K., HARVEY, R. M., HIGGINS, M. A., DAY, C. J., HARTLEY-
TASSELL, L. E., CHEN, A. Y., GILLEN, C. M., JAMES, D. B., ALONZO, F., 3RD,
TORRES, V. J., WALKER, M. J., PATON, A. W., PATON, J. C. & JENNINGS, M. P.
2014. The cholesterol-dependent cytolysins pneumolysin and streptolysin O require
binding to red blood cell glycans for hemolytic activity. Proc Natl Acad Sci U S A, 111,
E5312-20.
SHOMA, S., TSUCHIYA, K., KAWAMURA, I., NOMURA, T., HARA, H.,
UCHIYAMA, R., DAIM, S. & MITSUYAMA, M. 2008. Critical involvement of
pneumolysin in production of interleukin-1alpha and caspase-1-dependent
cytokines in infection with Streptococcus pneumoniae in vitro: a novel function
of pneumolysin in caspase-1 activation. Infect Immun, 76, 1547-57.
SIEMIENIUK, R. A., MEADE, M. O., ALONSO-COELLO, P., BRIEL, M., EVANIEW,
N., PRASAD, M., ALEXANDER, P. E., FEI, Y., VANDVIK, P. O., LOEB, M.
& GUYATT, G. H. 2015. Corticosteroid Therapy for Patients Hospitalized With
Community-Acquired Pneumonia: A Systematic Review and Meta-analysis. Ann
Intern Med, 163, 519-28.
SIMONSEN, L., TAYLOR, R. J., YOUNG-XU, Y., HABER, M., MAY, L. &
KLUGMAN, K. P. 2011. Impact of pneumococcal conjugate vaccination of
infants on pneumonia and influenza hospitalization and mortality in all age groups
in the United States. MBio, 2, e00309-10.
SIRE, J., AUFFRAY, C. & JORDAN, B. R. 1982. Rat immunoglobulin delta heavy chain
gene: nucleotide sequence derived from cloned cDNA. Gene, 20, 377-86.
SKOV SORENSEN, U. B., YAO, K., YANG, Y., TETTELIN, H. & KILIAN, M. 2016.
Capsular Polysaccharide Expression in Commensal Streptococcus Species:
Genetic and Antigenic Similarities to Streptococcus pneumoniae. 7.
Page 253
238
SMATHERS, R. L., CHIANG, D. J., MCMULLEN, M. R., FELDSTEIN, A. E.,
ROYCHOWDHURY, S. & NAGY, L. E. 2016. Soluble IgM links apoptosis to
complement activation in early alcoholic liver disease in mice. Mol Immunol, 72,
9-18.
SMITH, A., JOHNSTON, C., INVERARITY, D., SLACK, M., PATERSON, G. K.,
DIGGLE, M. & MITCHELL, T. 2013. Investigating the role of pneumococcal
neuraminidase A activity in isolates from pneumococcal haemolytic uraemic
syndrome. J Med Microbiol, 62, 1735-42.
SNYDER, R., STRAUSS, H. & ELLIGER, C. 1982. Carbon-hydrogen stretching modes
and the structure of n-alkyl chains. 1. Long, disordered chains. J. Phys. Chem, 86,
5145-5150.
SNYDER, R. G., HSU, S. L. & KRIMM, S. 1978. Vibrational spectra in the CH
stretching region and the structure of the polymethylene chain. Spectrochimica
Acta Part A: Molecular Spectroscopy, 34, 395-406.
SOLOVYOVA, A. S., NOLLMANN, M., MITCHELL, T. J. & BYRON, O. 2004. The
solution structure and oligomerization behavior of two bacterial toxins:
pneumolysin and perfringolysin O. Biophys J, 87, 540-52.
SONG, J. Y., EUN, B. W. & NAHM, M. H. 2013. Diagnosis of Pneumococcal
Pneumonia: Current Pitfalls and the Way Forward. Infect Chemother, 45, 351-
366.
SONNEN, A. F., PLITZKO, J. M. & GILBERT, R. J. 2014. Incomplete pneumolysin
oligomers form membrane pores. Open Biol, 4, 140044.
SOSONIUK, E., VALLEJOS, G., KENAWY, H., GABORIAUD, C., THIELENS, N.,
FUJITA, T., SCHWAEBLE, W., FERREIRA, A. & VALCK, C. 2014.
Trypanosoma cruzi calreticulin inhibits the complement lectin pathway activation
by direct interaction with L-Ficolin. Mol Immunol, 60, 80-5.
SQUIRES, T. & QUAKE, S. 2005. Microfluidics: Fluid physics at the nanoliter scale.
Reviews of Modern Physics, 77, 977-1026.
SRIVASTAVA, A., HENNEKE, P., VISINTIN, A., MORSE, S. C., MARTIN, V.,
WATKINS, C., PATON, J. C., WESSELS, M. R., GOLENBOCK, D. T. &
MALLEY, R. 2005. The apoptotic response to pneumolysin is Toll-like receptor
4 dependent and protects against pneumococcal disease. Infect Immun, 73, 6479-
87.
STEVENS, D. L. & KAPLAN, E. L. 2000. Streptococcal infections: clinical aspects,
microbiology, and molecular pathogenesis, Oxford University Press, USA.
Page 254
239
STOCKMANN, C., AMPOFO, K., BYINGTON, C. L., FILLOUX, F., HERSH, A. L.,
BLASCHKE, A. J., COWAN, P., KORGENSKI, K., MASON, E. O. & PAVIA,
A. T. 2013. Pneumococcal meningitis in children: epidemiology, serotypes, and
outcomes from 1997-2010 in Utah. Pediatrics, 132, 421-8.
STONE, K. D., PRUSSIN, C. & METCALFE, D. D. 2010. IgE, mast cells, basophils,
and eosinophils. J Allergy Clin Immunol, 125, S73-80.
STOOP, J. W., ZEGERS, B. J., SANDER, P. C. & BALLIEUX, R. E. 1969. Serum
immunoglobulin levels in healthy children and adults. Clin Exp Immunol, 4, 101-
12.
SUN, T., HOU, H., LU, J., XU, M., GU, T., WANG, D., DONG, Y., JIANG, C., KONG,
W. & WU, Y. 2015. Detection and comparison of structure and function of wild-
type pneumolysin and its novel mutant PlyM2. Chem Res Chin Univ, 31, 553-
557.
SUROVTSEV, N. V. & DZUBA, S. A. 2014. Flexibility of phospholipids with saturated
and unsaturated chains studied by Raman scattering: The effect of cholesterol on
dynamical and phase transitions. J. Chem. Phys. 140.
TANIO, M., KONDO, S., SUGIO, S. & KOHNO, T. 2007. Trivalent recognition unit of
innate immunity system: crystal structure of trimeric human M-ficolin fibrinogen-
like domain. J Biol Chem, 282, 3889-95.
TAO, M. H., SMITH, R. I. & MORRISON, S. L. 1993. Structural features of human
immunoglobulin G that determine isotype-specific differences in complement
activation. J Exp Med, 178, 661-7.
TEH, C., LE, Y., LEE, S. H. & LU, J. 2000. M-ficolin is expressed on monocytes and is
a lectin binding to N-acetyl-D-glucosamine and mediates monocyte adhesion and
phagocytosis of Escherichia coli. Immunology, 101, 225-32.
TEHRANIROKH, M., KOUZANI, A. Z., FRANCIS, P. S. & KANWAR, J. R. 2013.
Microfluidic devices for cell cultivation and proliferation. Biomicrofluidics, 7,
51502.
THIELENS, N. M., CSEH, S., THIEL, S., VORUP-JENSEN, T., ROSSI, V.,
JENSENIUS, J. C. & ARLAUD, G. J. 2001. Interaction properties of human
mannan-binding lectin (MBL)-associated serine proteases-1 and -2, MBL-
associated protein 19, and MBL. J. Immunol, 166, 5068-77.
TIAN, X., LANGKILDE, A. E., THOROLFSSON, M., RASMUSSEN, H. B. &
VESTERGAARD, B. 2014. Small-angle x-ray scattering screening complements
conventional biophysical analysis: comparative structural and biophysical analysis of
monoclonal antibodies IgG1, IgG2, and IgG4. J Pharm Sci, 103, 1701-10.
Page 255
240
TILLEY, S. J., ORLOVA, E. V., GILBERT, R. J. C., ANDREW, P. W. & SAIBIL, H.
R. 2005. Structural Basis of Pore Formation by the Bacterial Toxin Pneumolysin.
Cell, 121, 247-256.
TOMASZ, A. & SAUKKONEN, K. 1989. The nature of cell wall-derived inflammatory
components of pneumococci. Pediatr Infect Dis J, 8, 902-3.
TON-THAT, H., LIU, G., MAZMANIAN, S. K., FAULL, K. F. & SCHNEEWIND, O.
1999. Purification and characterization of sortase, the transpeptidase that cleaves
surface proteins of Staphylococcus aureus at the LPXTG motif. Proc Natl Acad
Sci U S A, 96, 12424-9.
TSAI, Y. H., HSIEH, M. J., CHANG, C. J., WEN, Y. W., HU, H. C., CHAO, Y. N.,
HUANG, Y. C., YANG, C. T. & HUANG, C. C. 2015. The 23-valent
pneumococcal polysaccharide vaccine is effective in elderly adults over 75 years
old--Taiwan's PPV vaccination program. Vaccine, 33, 2897-902.
TU, A.-H. T., FULGHAM, R. L., MCCRORY, M. A., BRILES, D. E. & SZALAI, A. J.
1999. Pneumococcal Surface Protein A Inhibits Complement Activation by
Streptococcus pneumoniae. Infect Immun, 67, 4720-24.
TURKYILMAZ, S., ALMEIDA, P. F. & REGEN, S. L. 2011. Effects of isoflurane,
halothane, and chloroform on the interactions and lateral organization of lipids in
the liquid-ordered phase. Langmuir, 27, 14380-5.
TWETEN, R. K. 2005. Cholesterol-dependent cytolysins, a family of versatile pore-
forming toxins. Infect Immun, 73, 6199-209.
TWETEN, R. K., HOTZE, E. M. & WADE, K. R. 2015. The Unique Molecular
Choreography of Giant Pore Formation by the Cholesterol-Dependent Cytolysins
of Gram-Positive Bacteria. Annu Rev Microbiol, 69, 323-40.
UBELHART, R., HUG, E., BACH, M. P., WOSSNING, T., DUHREN-VON MINDEN,
M., HORN, A. H., TSIANTOULAS, D., KOMETANI, K., KUROSAKI, T.,
BINDER, C. J., STICHT, H., NITSCHKE, L., RETH, M. & JUMAA, H. 2015.
Responsiveness of B cells is regulated by the hinge region of IgD. Nat Immunol,
16, 534-43.
URLAUB, G. & CHASIN, L. A. 1980. Isolation of Chinese hamster cell mutants
deficient in dihydrofolate reductase activity. Proc Natl Acad Sci U S A, 77, 4216-
20.
VALCK, C., RAMIREZ, G., LOPEZ, N., RIBEIRO, C. H., MALDONADO, I.,
SANCHEZ, G., FERREIRA, V. P., SCHWAEBLE, W. & FERREIRA, A. 2010.
Molecular mechanisms involved in the inactivation of the first component of
human complement by Trypanosoma cruzi calreticulin. Mol Immunol, 47, 1516-
21.
Page 256
241
VAN DE BEEK, D., DE GANS, J., MCINTYRE, P. & PRASAD, K. 2007.
Corticosteroids for acute bacterial meningitis. Cochrane Database Syst Rev,
Cd004405.
VAN DER FLIER, M., CHHUN, N., WIZEMANN, T. M., MIN, J., MCCARTHY, J. B.
& TUOMANEN, E. I. 1995. Adherence of Streptococcus pneumoniae to
immobilized fibronectin. Infect Immun, 63, 4317-22.
VAN DER LINDEN, M., WINKEL, N., KUNTZEL, S., FARKAS, A., PERNICIARO,
S. R., REINERT, R. R. & IMOHL, M. 2013. Epidemiology of Streptococcus
pneumoniae serogroup 6 isolates from IPD in children and adults in Germany.
PLoS One, 8, e60848.
VAN DER POLL, T. & OPAL, S. M. 2009. Pathogenesis, treatment, and prevention of
pneumococcal pneumonia. The Lancet, 374, 1543-1556.
VAN PEE, K., MULVIHILL, E., MULLER, D. J. & YILDIZ, O. 2016. Unraveling the
Pore-Forming Steps of Pneumolysin from Streptococcus pneumoniae. Nano Lett,
16, 7915-7924.
VAN PEE, K., NEUHAUS, A., D'IMPRIMA, E., MILLS, D. J. & KUHLBRANDT, W.
2017. CryoEM structures of membrane pore and prepore complex reveal cytolytic
mechanism of Pneumolysin. 6.
VEATCH, S. L. & KELLER, S. L. 2005. Seeing spots: complex phase behavior in simple
membranes. Biochim Biophys Acta, 1746, 172-85.
VELVE-CASQUILLAS, G., LE BERRE, M., PIEL, M. & TRAN, P. T. 2010.
Microfluidic tools for cell biological research. Nano Today, 5, 28-47.
VERMA, A., WHITE, M., VATHIPADIEKAL, V., TRIPATHI, S., MBIANDA, J.,
IEONG, M., QI, L., TAUBENBERGER, J. K., TAKAHASHI, K., JENSENIUS,
J. C., THIEL, S. & HARTSHORN, K. L. 2012. Human H-ficolin inhibits
replication of seasonal and pandemic influenza A viruses. J Immunol, 189, 2478-
87.
VESTRHEIM, A. C., MOEN, A., EGGE-JACOBSEN, W., REUBSAET, L.,
HALVORSEN, T. G., BRATLIE, D. B., PAULSEN, B. S. & MICHAELSEN, T.
E. 2014. A pilot study showing differences in glycosylation patterns of IgG
subclasses induced by pneumococcal, meningococcal, and two types of influenza
vaccines. Immun Inflamm Dis, 2, 76-91.
VIDARSSON, G., DEKKERS, G. & RISPENS, T. 2014. IgG subclasses and allotypes:
from structure to effector functions. Front Immunol, 5, 520.
VISITSUNTHORN, N., HENGCRAWIT, W., JIRAPONGSANANURUK, O. &
LUANGWEDCHAKAM, V. 2011. Immunoglobulin G (IgG) subclass deficiency
in Thai children. Asian Pac J Allergy Immunol, 29, 332-7.
Page 257
242
VLADUTIU, A. O. 2000. Immunoglobulin D: properties, measurement, and clinical
relevance. Clin Diagn Lab Immunol, 7, 131-40.
WALKER, J. A., ALLEN, R. L., FALMAGNE, P., JOHNSON, M. K. & BOULNOIS,
G. J. 1987. Molecular cloning, characterization, and complete nucleotide
sequence of the gene for pneumolysin, the sulfhydryl-activated toxin of
Streptococcus pneumoniae. Infect and Immun, 55, 1184-1189.
WALLIS, R. & DRICKAMER, K. 1999. Molecular determinants of oligomer formation
and complement fixation in mannose-binding proteins. J Biol Chem, 274, 3580-
9.
WALLIS, R., MITCHELL, D. A., SCHMID, R., SCHWAEBLE, W. J. & KEEBLE, A.
H. 2010. Paths reunited: Initiation of the classical and lectin pathways of
complement activation. Immunobiology, 215, 1-11.
WALTHER, E., RICHTER, M., XU, Z., KRAMER, C., VON GRAFENSTEIN, S.,
KIRCHMAIR, J., GRIENKE, U., ROLLINGER, J. M., LIEDL, K. R.,
SLEVOGT, H., SAUERBREI, A., SALUZ, H. P., PFISTER, W. &
SCHMIDTKE, M. 2015. Antipneumococcal activity of neuraminidase inhibiting
artocarpin. Int J Med Microbiol, 305, 289-97.
WANG, W., SINGH, S., ZENG, D. L., KING, K. & NEMA, S. 2007. Antibody structure,
instability, and formulation. Hoboken.
WANI, J. H., GILBERT, J. V., PLAUT, A. G. & WEISER, J. N. 1996. Identification,
cloning, and sequencing of the immunoglobulin A1 protease gene of
Streptococcus pneumoniae. Infect Immun, 64, 3967-74.
WATSON, H. 2015. Biological membranes. Essays Biochem, 59, 43-69.
WATT, J. P., WOLFSON, L. J., O'BRIEN, K. L., HENKLE, E., DELORIA-KNOLL,
M., MCCALL, N., LEE, E., LEVINE, O. S., HAJJEH, R., MULHOLLAND, K.
& CHERIAN, T. 2009. Burden of disease caused by Haemophilus influenzae type
b in children younger than 5 years: global estimates. Lancet, 374, 903-11.
WEIS, S. & PALMER, M. 2001. Streptolysin O: the C-terminal, tryptophan-rich domain
carries functional sites for both membrane binding and self-interaction but not for
stable oligomerization. Biochim Biophys Acta, 1510, 292-9.
WEISER, J. N., BAE, D., FASCHING, C., SCAMURRA, R. W., RATNER, A. J. &
JANOFF, E. N. 2003. Antibody-enhanced pneumococcal adherence requires
IgA1 protease. Proc Natl Acad Sci U S A, 100, 4215-20.
WELLMER, A., ZYSK, G., GERBER, J., KUNST, T., VON MERING, M.,
BUNKOWSKI, S., EIFFERT, H. & NAU, R. 2002. Decreased virulence of a
pneumolysin-deficient strain of Streptococcus pneumoniae in murine meningitis.
Infect Immun, 70, 6504-8.
Page 258
243
WHALAN, R. H., FUNNELL, S. G., BOWLER, L. D., HUDSON, M. J., ROBINSON,
A. & DOWSON, C. G. 2005. PiuA and PiaA, iron uptake lipoproteins of
Streptococcus pneumoniae, elicit serotype independent antibody responses
following human pneumococcal septicaemia. FEMS Immunol Med Microbiol, 43,
73-80.
WOLKERS, W. F., OLDENHOF, H. & GLASMACHER, B. 2010. Dehydrating
phospholipid vesicles measured in real-time using ATR Fourier transform
infrared spectroscopy. Cryobiology, 61, 108-14.
WOOF, J. M. & BURTON, D. R. 2004. Human antibody-Fc receptor interactions
illuminated by crystal structures. Nat Rev Immunol, 4, 89-99.
WOOF, J. M. & KERR, M. A. 2006. The function of immunoglobulin A in immunity. J.
Pathol, 208, 270-82.
WU, H. L., TONG, Y., PENG, Q., LI, N. & YE, S. 2016a. Phase transition behaviors of
the supported DPPC bilayer investigated by sum frequency generation (SFG)
vibrational spectroscopy and atomic force microscopy (AFM). Phys Chem Chem
Phys, 18, 1411-21.
WU, L., SU, S., LIU, F., XU, T., WANG, X., HUANG, Y., SUN, X., GE, X., CHEN, T.,
LIU, H., WANG, C., CHOREV, M., XU, T. & QIN, X. 2012. Removal of the tag
from His-tagged ILYd4, a human CD59 inhibitor, significantly improves its
physical properties and its activity. Curr Pharm Des, 18, 4187-96.
WU, L. C. & ZARRIN, A. A. 2014. The production and regulation of IgE by the immune
system. Nat Rev Immunol, 14, 247-259.
WU, Y., CHEN, W., CHEN, H., ZHANG, L., CHANG, Y., YAN, S., DAI, X., MA, Y.,
HUANG, Q. & WEI, W. 2016b. The Elevated Secreted Immunoglobulin D
Enhanced the Activation of Peripheral Blood Mononuclear Cells in Rheumatoid
Arthritis. PLoS One, 11, e0147788.
XU, D. D., WANG, C., JIANG, F., WEI, L. L., SHI, L. Y., YU, X. M., LIU, C. M., LIU,
X. H., FENG, X. M., PING, Z. P., JIANG, T. T., CHEN, Z. L., LI, Z. J. & LI, J.
C. 2015. Association of the FCN2 Gene Single Nucleotide Polymorphisms with
Susceptibility to Pulmonary Tuberculosis. PLoS One, 10, e0138356.
XU, G., KIEFEL, M. J., WILSON, J. C., ANDREW, P. W., OGGIONI, M. R. &
TAYLOR, G. L. 2011. Three Streptococcus pneumoniae sialidases: three
different products. J Am Chem Soc, 133, 1718-21.
YAE, Y., INABA, S., SATO, H., OKOCHI, K., TOKUNAGA, F. & IWANAGA, S.
1991. Isolation and characterization of a thermolabile beta-2 macroglycoprotein
('thermolabile substance' or 'Hakata antigen') detected by precipitating (auto)
antibody in sera of patients with systemic lupus erythematosus. Biochim Biophys
Acta, 1078, 369-76.
Page 259
244
YANG, J., MARTI, J. & CALERO, C. 2016. Pair interactions among ternary
DPPC/POPC/cholesterol mixtures in liquid-ordered and liquid-disordered phases.
Soft Matter, 12, 4557-61.
YOTHER, J. & BRILES, D. E. 1992. Structural properties and evolutionary relationships
of PspA, a surface protein of Streptococcus pneumoniae, as revealed by sequence
analysis. J. Bacterio, 174, 601-609.
YOUNG, E., LOCK, E., WARD, D. G., COOK, A., HARDING, S. & WALLIS, G. L.
2014. Estimation of polyclonal IgG4 hybrids in normal human serum.
Immunology, 142, 406-13.
YU, B., LEE, R. J. & LEE, L. J. 2009. Microfluidic Methods for Production of
Liposomes. United States: Elsevier Science & Technology.
YUSTE, J., SEN, A., TRUEDSSON, L., JONSSON, G., TAY, L. S., HYAMS, C.,
BAXENDALE, H. E., GOLDBLATT, F., BOTTO, M. & BROWN, J. S. 2008.
Impaired opsonization with C3b and phagocytosis of Streptococcus pneumoniae
in sera from subjects with defects in the classical complement pathway. Infect
Immun, 76, 3761-70.
ZACHO, R. M., JENSEN, L., TERP, R., JENSENIUS, J. C. & THIEL, S. 2012. Studies
of the pattern recognition molecule H-ficolin: specificity and purification. J Biol
Chem, 287, 8071-81.
ZAKIR, S., SMITH, R. N. & JAMES, R. S. 2015. An elevated IgG4 response in chronic
infectious aortitis is associated with aortic atherosclerosis. Mod Pathol, 28, 1428-
34.
ZARTLER, E. R., PORAMBO, R. J., ANDERSON, C. L., CHEN, L. H., YU, J. &
NAHM, M. H. 2009. Structure of the capsular polysaccharide of pneumococcal
serotype 11A reveals a novel acetylglycerol that is the structural basis for 11A
subtypes. J Biol Chem, 284, 7318-29.
ZHANG, C., GAO, C., MU, J., QIU, Z. & LI, L. 2013. Spectroscopic studies on unfolding
processes of apo-neuroglobin induced by guanidine hydrochloride and urea.
Biomed Res Int, 2013, 349542.
ZHANG, H., LI, P., WU, D., XU, D., HOU, Y., WANG, Q., LI, M., LI, Y., ZENG, X.,
ZHANG, F. & SHI, Q. 2015. Serum IgG subclasses in autoimmune diseases.
Medicine (Baltimore), 94, e387.
ZHANG, H. & LIU, K.-K. 2008. Optical tweezers for single cells. J R Soc Interface, 5,
671-90.
ZHANG, X. L. & ALI, M. A. 2008. Ficolins: structure, function and associated diseases.
Adv Exp Med Biol, 632, 105-15.
Page 260
245
ZHAO, H., JUNG, J. A., BRILES, D. E., KITA, H., TSIGRELIS, C. & JUHN, Y. J. 2013.
Asthma and antibodies to pneumococcal virulence proteins. Infection, 41, 927-
934.
ZHAO, Y., REN, Y., ZHANG, X., ZHAO, P., TAO, W., ZHONG, J., LI, Q. & ZHANG,
X. L. 2014. Ficolin-2 inhibits hepatitis C virus infection, whereas apolipoprotein
E3 mediates viral immune escape. J Immunol, 193, 783-96.
ZIELNIK-JURKIEWICZ, B. & BIELICKA, A. 2015. Antibiotic resistance of
Streptococcus pneumoniae in children with acute otitis media treatment failure.
Int J Pediatr Otorhinolaryngol, 79, 2129-33.
ZWART, B., CIURANA, C., RENSINK, I., MANOE, R., HACK, C. E. & AARDEN, L.
A. 2004. Complement activation by apoptotic cells occurs predominantly via IgM
and is limited to late apoptotic (secondary necrotic) cells. Autoimmunity, 37, 95-
102.
ZWIJNENBURG, P. J., VAN DER POLL, T., FLORQUIN, S., VAN DEVENTER, S.
J., ROORD, J. J. & VAN FURTH, A. M. 2001. Experimental pneumococcal
meningitis in mice: a model of intranasal infection. J Infect Dis, 183, 1143-6.