14th Int Symp on Applications of Laser Techniques to Fluid Mechanics Lisbon, Portugal, 07-10 July, 2008 Paper n°1352 - 1 - Characterization of the ionic wind produced by a DBD actuator designed to control the laminar-to-turbulent transition Vincent Boucinha 1 , Romain Joussot 2 , Pierre Magnier 3 , Régine Weber 4 , Annie Leroy-Chesneau 5 1: Institut PRISME / LME, University of Orléans, Orléans, France, [email protected]2: GREMI, CNRS / University of Orléans, Orléans, France, [email protected]3: Institut PRISME / LME, University of Orléans, Orléans, France, [email protected]4: Institut PRISME / LME, University of Orléans, Orléans, France, [email protected]5: Institut PRISME / LME, University of Orléans, Orléans, France, [email protected]Abstract Non thermal plasma actuators have provided a novel means of studying active flow control in aerodynamic research. The ionic wind induced by such devices has the ability to couple momentum into boundary layers resulting in control of flow separation or delay of laminar-to-turbulent transition. Significant results would probably be obtained at higher Reynolds numbers if the plasma actuators were systematically operated in unsteady mode. The aim of this experimental work was to provide an understanding of how an asymmetric DBD actuator operated in steady and unsteady mode behaved in quiescent air. Recent studies have shown that the plasma morphology is not the same during the positive and the negative cycles of the AC power supply of the DBD actuator. The mechanisms of momentum addition through the ionic wind are expected to be dependent on each cycle of the high voltage. In this work, the influence of the voltage cycles on the ionic wind velocity was studied by performing time-resolved measurements of the velocity synchronized with records of the AC voltage. Velocity measurements were carried out by means of a 2C- LDV system above the actuator for heights from 0,1 to 5 mm from the dielectric panel. The actuator was working with voltages of 14 to 32 kV pp and frequencies ranging from 0,5 to 1 kHz. For the unsteady mode, the pulsed frequency was fixed to 10 Hz and duty cycles of 50% and 75% were studied. First, the ionic wind was observed to be similar to a pulsed wall jet. Although operated in steady mode, it was forced by a frequency equal to the frequency of the AC power supply (0,5 to 1 kHz). When unsteadily working, the ambient air was also pulsed at 10 Hz above the actuator. Secondly, the velocity of the ionic wind was not the same according to the high voltage cycles. Both first half of the negative and positive cycles induced ionic wind however the negative one provided a velocity approximately twice higher than the positive one. According to the measurements in unsteady mode, a counter flow seemed to appear during the second half of the negative cycle. Thus, an optimal voltage wave form was suggested to prevent this inefficiency. These results must be considered carefully since up to now it was not possible to ensure if the velocities measured in quiescent air were only representative of the induced flow or also of the velocities of charged particles moving through the electric field inherent to the plasma discharge. 1. Introduction Over the last ten years, surface non-thermal plasmas have provided a novel means of studying active flow control in aerodynamic research. The so-called electrohydrodynamic (EHD) actuators are generally composed of metallic electrodes connected to a high voltage power supply that provide the ionisation of the air at atmospheric pressure. Plasma actuators can be operated in real- time control at high frequencies and do not require any mechanical parts. A part of the electrical power supplying the EHD actuators is directly converted into mechanical power providing zero net mass flux control devices. In fact, such actuators can generate EHD forces that induce a flow above the actuator known as the ‘ionic wind’ that has the ability to change the characteristics of boundary layers by momentum addition. Typically, the velocity of the ionic wind is about 5 m/s at 0,5 mm from the wall.
Transcript
14th Int Symp on Applications of Laser Techniques to Fluid Mechanics Lisbon, Portugal, 07-10 July, 2008
Paper n°1352
- 1 -
Characterization of the ionic wind produced by a DBD actuator designed to
control the laminar-to-turbulent transition
Vincent Boucinha1, Romain Joussot
2, Pierre Magnier
3, Régine Weber
4, Annie
Leroy-Chesneau5
1: Institut PRISME / LME, University of Orléans, Orléans, France, [email protected]
2: GREMI, CNRS / University of Orléans, Orléans, France, [email protected]
3: Institut PRISME / LME, University of Orléans, Orléans, France, [email protected]
4: Institut PRISME / LME, University of Orléans, Orléans, France, [email protected]
5: Institut PRISME / LME, University of Orléans, Orléans, France, [email protected]
Abstract Non thermal plasma actuators have provided a novel means of studying active flow control in aerodynamic research. The ionic wind induced by such devices has the ability to couple momentum into boundary layers resulting in control of flow separation or delay of laminar-to-turbulent transition. Significant results would probably be obtained at higher Reynolds numbers if the plasma actuators were systematically operated in unsteady mode. The aim of this experimental work was to provide an understanding of how an asymmetric DBD actuator operated in steady and unsteady mode behaved in quiescent air. Recent studies have shown that the plasma morphology is not the same during the positive and the negative cycles of the AC power supply of the DBD actuator. The mechanisms of momentum addition through the ionic wind are expected to be dependent on each cycle of the high voltage. In this work, the influence of the voltage cycles on the ionic wind velocity was studied by performing time-resolved measurements of the velocity synchronized with records of the AC voltage. Velocity measurements were carried out by means of a 2C-LDV system above the actuator for heights from 0,1 to 5 mm from the dielectric panel. The actuator was working with voltages of 14 to 32 kVpp and frequencies ranging from 0,5 to 1 kHz. For the unsteady mode, the pulsed frequency was fixed to 10 Hz and duty cycles of 50% and 75% were studied. First, the ionic wind was observed to be similar to a pulsed wall jet. Although operated in steady mode, it was forced by a frequency equal to the frequency of the AC power supply (0,5 to 1 kHz). When unsteadily working, the ambient air was also pulsed at 10 Hz above the actuator. Secondly, the velocity of the ionic wind was not the same according to the high voltage cycles. Both first half of the negative and positive cycles induced ionic wind however the negative one provided a velocity approximately twice higher than the positive one. According to the measurements in unsteady mode, a counter flow seemed to appear during the second half of the negative cycle. Thus, an optimal voltage wave form was suggested to prevent this inefficiency. These results must be considered carefully since up to now it was not possible to ensure if the velocities measured in quiescent air were only representative of the induced flow or also of the velocities of charged particles moving through the electric field inherent to the plasma discharge.
1. Introduction
Over the last ten years, surface non-thermal plasmas have provided a novel means of studying
active flow control in aerodynamic research. The so-called electrohydrodynamic (EHD) actuators
are generally composed of metallic electrodes connected to a high voltage power supply that
provide the ionisation of the air at atmospheric pressure. Plasma actuators can be operated in real-
time control at high frequencies and do not require any mechanical parts. A part of the electrical
power supplying the EHD actuators is directly converted into mechanical power providing zero net
mass flux control devices. In fact, such actuators can generate EHD forces that induce a flow above
the actuator known as the ‘ionic wind’ that has the ability to change the characteristics of boundary
layers by momentum addition. Typically, the velocity of the ionic wind is about 5 m/s at 0,5 mm
from the wall.
14th Int Symp on Applications of Laser Techniques to Fluid Mechanics Lisbon, Portugal, 07-10 July, 2008
Paper n°1352
- 2 -
Plasma actuators have demonstrated a substantial effectiveness in modifying attached or
separated boundary layers in laminar and turbulent flows at moderate velocities. A review of the
main reported works has recently been published by Moreau (2007). Many studies have focused on
detachment control along airfoils more specifically along NACA0015 airfoils. Corke et al. (2004)
has shown that the actuation of plasma discharge is similar to slats or flaps and thus results in a drag
reduction and a lift enhancement for post-stall regime. Two kinds of non thermal plasma discharges
operated in steady or unsteady mode have mainly been used to add momentum into naturally
detached boundary layers. Corona discharges (Sosa et al. 2004; Magnier et al. 2007) or Dielectric
Barrier Discharges (DBD) (Göksel et al. 2006) have been demonstrated to successfully reattach the
flow over NACA0015 airfoils. The work described herein focuses on the properties of the ionic
wind induced by an asymmetric DBD actuator that was used for the first time to manipulate a
boundary layer flow by Roth et al. (1998). In the literature, opposite actions have been
experimented with DBD actuators acting on the laminar-to-turbulent transition of a flat plate
boundary layer. Grundmann and Tropea (2007) have observed a transition delay since they have
damped artificially introduced Tollmien-Schlichting waves by means of a DBD actuator operated in
unsteady mode. The authors have reported that not only the pulsed frequency of the actuator but
also the height within the momentum is added are crucial parameters in regards respectively to the
instabilities and to the thickness of the boundary layer. On the contrary, Seraudie et al. (2006) and
Porter et al. (2007) have promoted the transition moving the transition point upstream of the natural
position using plasma actuators working in steady mode. Significant stages in control of flow
separation or delay of transition would be probably achieved at higher Reynolds numbers if the
DBD actuators were systematically operated in unsteady mode.
It is well accepted that the ionic wind is produced by the transfer momentum between plasma
ions and neutral molecules of the surrounding gas; however the precise mechanisms of momentum
addition into boundary layers are not well elucidated. Experimental and numerical studies carried
out without free airflow have shown that the morphology of the plasma is not the same during the
negative and the positive half cycle of the AC voltage (Allegraud et al. 2007; Enloe et al. 2004;
Lagmich et al. 2008). Even if being supplied by AC voltages with high amplitudes and frequencies,
Forte et al. (2007) has shown that the velocity of the ionic wind appears to be limited to a threshold
value. The author has also found that the velocity of the ionic wind is greater during the negative
cycle of the high voltage when the actuator working under an external flow.
In this work, the airflow induced by an asymmetric DBD actuator used in our lab to control the
laminar-to-turbulent transition on a 1m-long flat plate was experimentally characterized (Boucinha
2008a). The aim was to provide a better understanding of how the actuator operated in steady and
unsteady mode behaved in quiescent air. A two-component Laser Doppler Velocimetry (LDV)
system was used to observe the time-resolved characteristics of the induced flow (section 3).
Moreover, the influence of both positive and negative cycles of the high voltage on the ionic wind
velocity was also studied by performing time-resolved measurements of the velocity synchronized
with records of the AC voltage (sections 4-5). As interactions between the smoke particles and the
plasma discharge were expected, the intrusion of the velocity measurement technique had been
briefly discussed for this experimental set-up (section 6).
2. Experimental set-up
2.1 Actuator design and power supply
The design of the surface DBD actuator consisted of two copper electrodes flush mounted on
both sides of a dielectric panel with an asymmetric disposition (Fig.1a). The lower passive electrode
was buried in order to inhibit discharges at the grounded side; consequently the plasma extended
only on the upper side of the dielectric panel which was exposed to the ambient fluid. The dielectric
14th Int Symp on Applications of Laser Techniques to Fluid Mechanics Lisbon, Portugal, 07-10 July, 2008
Paper n°1352
- 3 -
plate was chosen to ensure a good resistance to high voltages with a thickness as thin as possible.
The aim was to ensure that the actuator would have induced its ionic wind in a region of small
height. It was constituted by multiple layers of Kapton® and Mylar® representing a total thickness
of 0,7 mm. The 6 mm-width electrodes were separated by a gap of 3 mm and the area of the plasma
was about 9 mm x 120 mm. The two electrodes were connected to an AC power supply. It consisted
in a power amplifier (TREK®, Series 30/20A) that magnified the sine waveform delivered by a
function generator providing high voltages with amplitudes up to 60 kVpp.
In the present work, the actuator was operated in steady mode for voltages of 14 up to 32 kVpp
and frequencies ranging from 0,5 to 1 kHz. This mode of actuation is commonly opposed to the
unsteady mode that consists in modulating the high voltage signal by a frequency ten to hundred
times lower than the frequency of the high voltage (Fig. 1b). The pulse frequency associated to the
unsteady mode of actuation was fixed at 10 Hz and duty cycles of 50% and 75% were studied.
When the actuator operated unsteadily, the amplitude of the high voltage was 20 kVpp and its
frequency was 0,5 Hz. The electrical consumption for such configurations was approximately
ranging from 10 to 35 W per unit electrode length (m) and the ignition voltage was around 8 kVpp.
2.2 Velocity measurements
The goal was to measure above the actuator hence above the plasma region as nearer as possible of
the dielectric panel since the height of the plasma region was thought to be less than 100 µm
(Borghi et al. 2005). Stationary measurements with a Pitot tube made in glass had typically been
carried out to characterize the ionic wind in still air (Pons et al. 2005). This technique of
measurement although convenient for basic description and parametric studies did not allow
measurements very close to the dielectric
panel. Due to risks of arcing and
electromagnetic interferences associated to
the plasma discharge, hot-wire anemometry
was not really convenient above the actuator
as well. Consequently, a two-component
LDV system (Dantec Dynamics®, BSA
Series 51N) was chosen to carry out the
velocity measurements (fig. 2). The LDV
system used a four-beam optical
arrangement of a 15-W ionized Argon laser
(Spectra-Physics® Series 2000) providing
two 532 nm-wavelength beams in addition with two 488 nm-wavelength ones. A fiber optic probe
Fig. 1 Description of the DBD actuator: (a) design and geometrical parameters (b) high voltage signal
for the unsteady mode of actuation at 10 Hz
Fig. 2 Experimental set-up for the velocity measurements
(a) (b)
14th Int Symp on Applications of Laser Techniques to Fluid Mechanics Lisbon, Portugal, 07-10 July, 2008
Paper n°1352
- 4 -
with a 500 mm focal length lens generated an ellipsoid-shaped measuring volume with dimensions
of 80 µm x 80 µm x 100 µm. An angle of 8° was settled between the lasers beams and the dielectric
surface, thus, measurements could be performed above the plasma region for heights from 0,1 to 5
mm from the dielectric panel. The whole system could be displaced precisely along two axis by
means of two linear units (Isel®) driving by a computer (resolution of 0,1 mm). The test section
was seeded with olive oil particles by means of an aerosol generator (Pivtec® Series PivPart30).
Droplets with mean diameter of approximately 1 µm could be generated as it was expected from the
particle size distribution mentioned by the constructor. Measurements were performed in a 1m long,
0,5 m high and 0,5 m wide closed box in order to ensure that no recirculation would be present
during the actuator working. Once the seeding of the test section was achieved, a time delay was
observed to ensure the quiescence of the air. The sample records were ranging from 1 to 6,5 kHz
and were dependent on the velocity of the induced flow and on the measuring volume height from
the dielectric panel. Most of the results presented in this paper were obtained above the actuator at x
= 10,5 mm for a height of 0,5 mm from the wall. At this location, the data rate was at least 4 kHz.
2.3 Electrical measurements
The power supply output voltage applied to the
upper active electrode was measured with a high
voltage probe (Tektronix® Series P60116A) and the
current with a current transformer (CT,
Stangenes®). The electrical signals were visualized
and recorded using a fast digital oscilloscope
(LeCroy® Series WaveSurfer 434). Figure 3
shows a typical current measurement performed for
an AC waveform signal of 20 kVpp and 0,5 kHz.
During one period, two distinctive discharges were
occurring respectively during the first positive and
the first negative half-cycles of the high voltage as
it could be expected from the literature. Peaks of
current were observed to be approximately five time
higher during the positive cycles, corresponding to
current intensities up to 200 mA. In order to
synchronize the records of the high voltage with the
velocity measurements, a TTL signal was generated with the same phase and frequency than the
sine waveform delivered by the function generator. The TTL signal was then used to trigger the
LDV system that systematically compared the arrival time of the seeding particles to the reset
pulses provided by the TTL signal.
3. Description of the induced flow
3.1 Actuator working in steady mode
A previous work was carried out with the same experimental set-up as described here to study the
two-dimensional flow field induced by the DBD actuator supplied by an AC voltage in steady mode
(Boucinha 2008b). Velocity measurements were carried out above the actuator near the plasma-gas
interface (for x = 6 - 15 mm) and behind it (for x > 15 mm). Due to the dimensions of the measuring
volume of the LDV system, it was not possible to measure closer than 0,1 mm from the dielectric
plate. The main results of this study are summarized in this section.
When the actuator is working, the ambient air is deflected towards the plasma region with a
Fig. 3 Discharge current and AC high voltage signal for
20 kVpp and 0,5 kHz
14th Int Symp on Applications of Laser Techniques to Fluid Mechanics Lisbon, Portugal, 07-10 July, 2008
Paper n°1352
- 5 -
strong acceleration in the vicinity of the wall suggesting a higher velocity at the plasma-gas
interface (Fig. 4). The averaged induced flow is directed tangentially to the dielectric panel from the
upper active electrode to the lower passive electrode. The mean velocity is found to reach its
maximum value above the actuator at a height of y = 0,1 mm. The mean velocity is approximately 3
m/s at x = 13,5 mm for a voltage of 20 kVpp and a frequency of 1 kHz. When increasing the high
voltage up to 32 kVpp a ionic wind of about 5 m/s is observed at this location. Downstream of the
actuation zone (for x > 13,5 mm), there is no more plasma to involve the neutral molecules of the
ambient air and the ionic wind behaves similarly to a classical wall jet in still air. As a consequence
the maximum velocity value of the induced flow decreases and moves away from the surface,
which results in a diffusion of the ionic wind on the height. Velocity measurements at x = 100 mm
revealed that there was no more induced flow at this location. This spatial description of the
induced flow is similar to the results reported by Pons although carried out with a Pitot tube made
in glass. Our actuator provides a ionic wind that can be fully contained within a boundary layer
since the momentum is mostly added within a height of 3 mm from the dielectric panel. This is
probably due to the thickness of the dielectric material that is smaller than the ones usually used in
the literature. The measurements performed near the plasma-gas interface (at y = 0,1 mm) have to
be considered carefully because the smoking particles may be charged and affected by stronger
Coulombian forces near the dielectric plate.
Time-resolved measurements performed above the actuator reveal that the velocity fluctuates by
far around the mean velocity at the precise locations where the mean velocity is the highest, i.e. near
the plasma-gas interface. It indicates that the ionic wind generation is a highly non stationary
phenomenon. In this zone (6 mm < x < 15 mm), the plasma discharge couples momentum to the
ambient air under a linear frequency forcing. Actually, the ionic wind is found to be pulsated at the
same frequency than the AC power supply although operated in steady mode. One can assume that
the so-called steady mode is rather a quasy-steady mode that enables the mean velocity produced by
the actuator to be derived from the average velocities provided by both negative and positive cycles.
In this paper, we present further investigations of the influence of the voltages cycles on the
mechanisms of the ionic wind generation in quiescent air. The study focuses more precisely on the
influence of voltage slopes at a constant frequency and investigates the role of both positive and
negative cycles.
3.2 Actuator working in unsteady mode
The ionic wind induced by the actuator working unsteadily at 10 Hz was studied for two duty cycles
(50% and 75%) by performing time-resolved measurements of the velocity synchronized with the
voltage records over duration of 180 s. The actuator was supplied by a high voltage of 20 kVpp and
a frequency of 0,5 Hz and velocity measurements were carried out above the plasma region (x =
Fig. 4 Mean velocity profiles of the ionic wind induced by the DBD actuator (20 kVpp, 1 kHz)
14th Int Symp on Applications of Laser Techniques to Fluid Mechanics Lisbon, Portugal, 07-10 July, 2008
Paper n°1352
- 6 -
10,5 mm and y = 0,5 mm).
Figure 5 shows the time-resolved velocity measurements averaged over one period of the unsteady
actuation (0 – 100 ms) for a duty cycle of 50%. Similarly to what occurs in the steady mode, the
velocity of the ionic wind is linearly forced by the AC high voltage. Moreover, it remains obvious
that the negative cycles induce a longitudinal velocity approximately twice higher than the one
measured during the positive ones. In the unsteady mode, three temporal processes are suggested to
describe the ionic wind generation:
- from t = 0ms to 20 ms: when the actuator is turned on, at the beginning of the unsteady
actuation, it seems that the momentum transfer at the plasma-gas interface is a transient
process. Actually, 6 periods of 2 ms are needed for the velocity to reach its maximum value.
It indicates that a duration of approximately 10 ms is needed for the EHD forces to fully
accelerate the ambient fluid at a voltage amplitude of 20 kVpp and a frequency of 0,5 Hz.
Benard et al. (2008) has observed that 10 ms is necessary to fully detach a naturally attached
jet with a DBD actuator for a velocity of 10 m/s in the configuration they have studied.
- from t = 20 ms to 50 ms: in this part of the unsteady actuation, the ionic wind is produced
similarly as during the steady mode, i.e. the negative cycles couple more momentum than
the positive ones as shown by Forte with a plasma actuator working under an external flow.
More precisely, the velocity increases during the first half of the negative cycle but seems to
decrease during the second half; on the contrary, the velocity remains the same during the
whole positive cycle. This observation suggests that even if no plasma is created during the
second half of both negative and positive cycles (see Fig. 3), the seeding particles do not
have the same behavior during this two parts of the AC period.
- from t = 50 ms to 100 ms: when the actuator is turned off, no more EHD forces can
accelerate the ambient air and the velocity of the ionic wind naturally decreases. In this case,
the high voltage signal ends with a positive cycle and consequently the velocity is about 1
m/s at the end of the actuation. When the actuator is off, the high voltage is equal to zero
and consequently no electric field is present in the region of the velocity measurements.
Thus, the smoking particles are only moved downstream of the actuator by their inertial
velocity. At t = 80 ms, their velocity is equaled to zero. Furthermore, one can notice that the
decrease rate of the velocity in this part is not the same as the one observed during the
second part of both positive and negative cycles.
Fig. 5 AC high voltage signal and longitudinal velocity
at x = 10,5 mm, y = 0,5 mm for the unsteady actuation
(10 Hz, DC = 50%)
Fig. 6 Non-dimensional power spectral density of the
streamwise fluctuating velocity at x = 10,5 mm, y =
0,5 mm for the steady and the unsteady actuation at 20
kVpp and 0,5 kHz
14th Int Symp on Applications of Laser Techniques to Fluid Mechanics Lisbon, Portugal, 07-10 July, 2008
Paper n°1352
- 7 -
From the time-resolved measurements, the non-dimensional spectra of the longitudinal
fluctuating velocity were calculated for the unsteady mode for duty cycles of 50% and 75% and
compared to the steady case. In the unsteady mode, the ionic wind is also generated under a linear
frequency forcing above the actuator directly linked to the frequency of the AC power supply as
indicated by the frequency peaks of 0,5 kHz (Fig. 6). The unsteady mode allows to couple
momentum at low frequency since the ambient air is also pulsed at 10 Hz. The energy of the
fluctuating velocity of the ionic wind is contained within a frequency bandwidth that is larger when
higher is the duty cycle of the unsteady actuation. For a duty cycle of 50%, the energy is especially
due to the pulsed frequency of 10 Hz on the contrary of what occurs for a duty cycle of 75%. It is
not clear whether the harmonic frequencies shown in this figure are representative of structures
going on a convective phenomenon along the actuator. These harmonic frequencies may probably
due to a non-perfect sine waveform delivered by the function generator.
4. Influence of positive and negative offsets
In regards to the previous results, it was thought that positive or negative offsets on the high voltage
applied to the upper active electrode could have respectively decreased or increased the mean value
of the ionic wind. Thus, we present here velocity measurements carried out supplying the actuator
with the three different high voltage signals shown in Figure 7a. The positive and negative offsets
were respectively fixed to +5 kV and -5 kV and the passive lower electrode remained grounded.
The slopes of the voltages were the same; the difference lied in the duration of the positive and
negative cycles that were higher or smaller than the referred case with no offset.
First, velocity profiles above the plasma region were carried out with the actuator operated in
steady mode. The results presented in the Figure 7b are the mean values and standard deviation
(error bars) determined over five single measurements at each position during 10 s. The profiles are
found to be similar: neither the positive offset nor the negative one has an effect on the mean
velocity of the ionic wind. Moreover, the maximum velocity (2,8 m/s) is observed at the same
height (0,3 mm). A slight difference is noticed at higher locations from the dielectric panel however
not being significant. Then, measurements synchronized with the three high voltages were
performed with the actuator unsteadily operated at 10 Hz above the plasma region (x = 10,5 mm
and y = 0,5 mm). When the actuator was off, the high voltage was +5 kVpp for the positive offset
and -5 kVpp for the negative one. The Figure 8 shows the time-resolved velocity measurements
(a) (b)
Fig. 7 (a) Positive and negative offsets of the AC high voltage applied to the upper electrode and their influence (b) on
the mean velocity profiles above the steadily operated actuator at x = 10,5 mm for a frequency of 1 kHz
14th Int Symp on Applications of Laser Techniques to Fluid Mechanics Lisbon, Portugal, 07-10 July, 2008
Paper n°1352
- 8 -
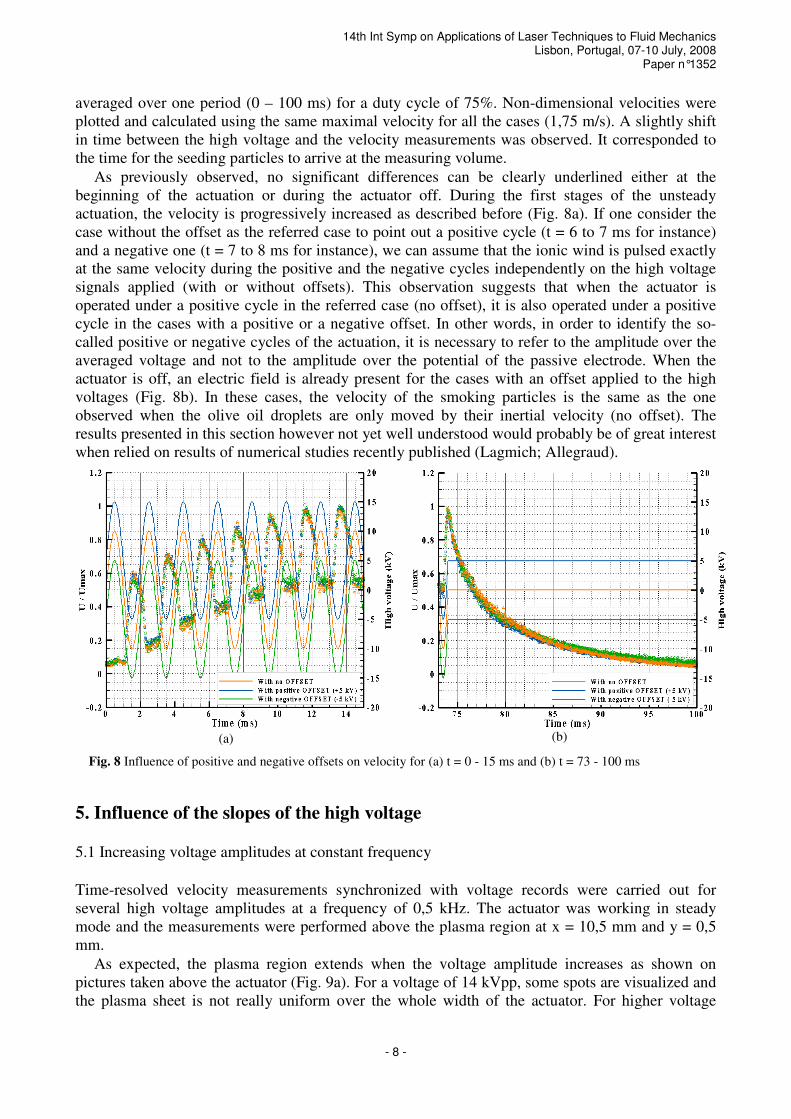
averaged over one period (0 – 100 ms) for a duty cycle of 75%. Non-dimensional velocities were
plotted and calculated using the same maximal velocity for all the cases (1,75 m/s). A slightly shift
in time between the high voltage and the velocity measurements was observed. It corresponded to
the time for the seeding particles to arrive at the measuring volume.
As previously observed, no significant differences can be clearly underlined either at the
beginning of the actuation or during the actuator off. During the first stages of the unsteady
actuation, the velocity is progressively increased as described before (Fig. 8a). If one consider the
case without the offset as the referred case to point out a positive cycle (t = 6 to 7 ms for instance)
and a negative one (t = 7 to 8 ms for instance), we can assume that the ionic wind is pulsed exactly
at the same velocity during the positive and the negative cycles independently on the high voltage
signals applied (with or without offsets). This observation suggests that when the actuator is
operated under a positive cycle in the referred case (no offset), it is also operated under a positive
cycle in the cases with a positive or a negative offset. In other words, in order to identify the so-
called positive or negative cycles of the actuation, it is necessary to refer to the amplitude over the
averaged voltage and not to the amplitude over the potential of the passive electrode. When the
actuator is off, an electric field is already present for the cases with an offset applied to the high
voltages (Fig. 8b). In these cases, the velocity of the smoking particles is the same as the one
observed when the olive oil droplets are only moved by their inertial velocity (no offset). The
results presented in this section however not yet well understood would probably be of great interest
when relied on results of numerical studies recently published (Lagmich; Allegraud).
5. Influence of the slopes of the high voltage
5.1 Increasing voltage amplitudes at constant frequency
Time-resolved velocity measurements synchronized with voltage records were carried out for
several high voltage amplitudes at a frequency of 0,5 kHz. The actuator was working in steady
mode and the measurements were performed above the plasma region at x = 10,5 mm and y = 0,5
mm.
As expected, the plasma region extends when the voltage amplitude increases as shown on
pictures taken above the actuator (Fig. 9a). For a voltage of 14 kVpp, some spots are visualized and
the plasma sheet is not really uniform over the whole width of the actuator. For higher voltage
Fig. 8 Influence of positive and negative offsets on velocity for (a) t = 0 - 15 ms and (b) t = 73 - 100 ms
(a) (b)
14th Int Symp on Applications of Laser Techniques to Fluid Mechanics Lisbon, Portugal, 07-10 July, 2008
Paper n°1352
- 9 -
amplitudes, the plasma seems to be more uniform and similar to a glow discharge. The extension of
the plasma with the voltage amplitude has usually been reported to explain the enhancement of the
ionic wind with the increase of the voltage amplitude. Thus, it provides an acceleration of the
external flow on a higher distance resulting in a higher velocity of the ionic wind downstream of the
actuator.
In addition, the Figure 9b shows that, locally, the EHD forces are also strongly dependent on the
slope of the high voltage supplying the actuator. Actually, the higher is the voltage amplitude, the
higher is the velocity of the ionic wind at x = 10,5 mm and y = 0,5mm. For a voltage of 32 kVpp, a
peak of velocity up to 3,8 m/s is observed. The synchronized measurements reveal that the
frequency forcing is only present from 16 kVpp. Moreover, the velocity of the ionic wind is found
to be always twice greater during the negative cycle than during the positive one over the whole
range of voltage amplitudes studied. It confirms that the EHD forces are strongly dependent on the
cycles of the voltage and that they are relied on the plasma morphology that is not the same during
an entire period. Finally, it seems that the increase of the velocity with the increase of the slope of
the voltage is limited to a threshold value. This point is currently under investigation and further
experiments at higher voltages have to be performed to confirm this last result.
5.2 AC wave form with different slopes for the positive and the negative cycles
From the previous results, it was thought that the mean velocity of the ionic wind could be
enhanced using an AC wave form that provided different slopes for the positive and the negative
cycles of the voltage. Consequently, the actuator working steadily was supplied by the high voltage
signals shown in Figure 10a. Two kinds of signal were investigated. The first one (15% - 85%)
provided a high slope for the first half of the positive cycle as well as for the second half of the
negative cycle. The other one (85% - 15%) was used to increase the slope of the voltage going on
the first / second half of the negative / positive cycles. The frequency and the amplitude of the AC
voltages were respectively fixed to 0,5 kHz and 20 kVpp in both cases. Current measurements and
velocity measurements synchronized with voltage records were performed at x = 10,5 mm and y =
0,5 mm.
In regards to the current measurements, a similar observation can be formulated for both positive
and negative cycles of the high voltage: peaks of current are more intense when the slope of the
voltage is higher (15%) whereas the discharge is maintained over a longer duration when the slope
is lower (85%) as shown in Figure 10a. Then, the results concerning the velocity measurements are
described distinguishing the four distinctively parts that composed an entire period starting with the
negative cycle:
Fig. 9 (a) Pictures of the plasma region above the DBD actuator and (b) longitudinal velocity as a function of the phase
angle of the voltage at x = 10,5 mm and y = 0,5 mm, for a frequency of 0,5 kHz and voltages of 14 to 32 kVpp
(a) (b)
14th Int Symp on Applications of Laser Techniques to Fluid Mechanics Lisbon, Portugal, 07-10 July, 2008
Paper n°1352
- 10 -
- 1st part of the negative cycle: higher is the slope, higher is the velocity (see section 5.1) and
thus faster is the time to reach the maximum value of the velocity. A difference of about
40% is found between the two cases for the maximum value of the velocity.
- 2nd
part of the negative cycle: no peaks of current are measured and a decrease of the
velocity is observed as the plasma discharge does no longer exist; however, the deceleration
observed is not the same according to the slope of the voltage. Actually, the deceleration is
quite more important when the slope is higher suggesting that a counter flow appears during
the second half of the negative cycle. Such a remark is reinforced considering that the
decelerations observed here mismatch from the one observed when the actuator is turned off
in the unsteady mode (see Fig. 8b and Fig. 13).
- 1st part of the positive cycle: a velocity is induced at a level twice lower than the one
induced during the 1st half of the negative cycle. At the beginning of this cycle, a strong
decrease of the velocity is noticed suggesting that the direction of the induced flow may
change from upstream to downstream.
- 2nd
part of the positive cycle: a slight decrease of the velocity is observed when the slope of
the voltage is lower (orange curves) however the deceleration is not comparable to the
deceleration occurring during the 2nd
half of the negative cycle. When the slope is higher
(blue curves), no significant decrease of the velocity is noticed. This observation suggests
that during the 2nd
half of the positive cycle, the velocity quite remains on a constant level.
The non-dimensional spectra of the longitudinal fluctuating velocity were compared in both
cases to the classical steady actuation (Fig. 11). The decrease of the velocity observed during the
entire period of the voltage is globally less important when the slope of the negative cycle is higher
(blue curves in Fig. 10). Consequently, for the “85% - 15%” case (also blue curve in Fig. 11), the
energy of the fluctuating velocity of the ionic wind is contained within a frequency bandwidth that
is centred on a lower frequency (20 Hz). However it does not provide the ionic wind to be pulsed at
the frequency of the AC power supply (0,5 kHz). When the actuator steadily working with a
classical AC wave form (50% - 50%), the energy is especially provided by the frequency forcing
associated to the voltage frequency as indicate the big peaks at 0,5 kHz. In this case, the energy is
contained within a larger frequency bandwidth centred on a higher frequency. This behaviour is
reinforced when considering the “15% - 85%” case: the energy is above all due to the 0,5 kHz-
peaks of frequency (orange curves in Fig. 11). As a conclusion, the “85% - 15%” signal will allow
(a) (b)
Fig. 10 (a) AC wave form with different slopes for the positive and the negative cycles and (b) induced velocity at x =
10,5 mm and y = 0,5mm for the actuator operating in steady mode (20 kVpp, 0,5 kHz)
14th Int Symp on Applications of Laser Techniques to Fluid Mechanics Lisbon, Portugal, 07-10 July, 2008
Paper n°1352
- 11 -
to transfer momentum more continuously with a
higher mean velocity. These observations combined
with the remarks made in section 3.2 will be of great
interest in order to optimize the unsteady actuation
at a low pulsed frequency (less than 100 Hz).
6. Influence of the smoking particles on the velocity measurements
Several industrial processes of air cleaning use for
instance electrostatic precipitators based on corona
discharges. Thus, an interaction between the
smoking particles and the plasma was expected.
Preliminary studies were carried out in order to try
to understand the limits we can expect from such an
experimental set-up, i.e. from measurements with
smoke over the discharge in quiescent air. It is
relevant to underline that in our case, we used a
DBD actuator with a thin dielectric panel that is supposed to induce a plasma discharge contained
within a smaller height than in others classical studies with higher thickness of the dielectric.
Velocity measurements were performed above the plasma region and downstream of the actuator
using several kinds of seeding particles. In addition to olive oil droplets, the aerosol generator (see
section 2.2) was used with DEHS substance. Measurements were also performed seeding the test
section by means of incense wires. In this last case, no information on the dimensions or on the
shape of the incense particles were available however one could assume that the incense particles
might probably be smaller than the seeding particles obtained using the aerosol generator. Due to
inherent changes in the experimental set-up, the measurements had to be carried out over several
series. Thus, the measuring volume of the LDV system was located at positions slightly shifted
considering the different series performed.
Non-dimensional velocity profiles are plotted in Figure 12. Above the actuator, no significant
differences is found according to the type of particles used when measuring near the dielectric panel
(y = 0,2 to 0,5 mm). At higher positions from the wall, the ionic wind appears more or less diffused.
Downstream of the actuation zone (at x = 20 mm), the velocity is found to be maximal at the same
height (y = 1 mm) for the three cases. Theses observations seem to indicate that independently of
0
0,5
1
1,5
2
2,5
3
3,5
0 0,2 0,4 0,6 0,8 1
U / Umax
Hei
ght (m
m)
g g
Olive oil
Incense
DEHS
Without smoke (pitot tube)
Fig. 12 Comparison of the mean velocity profiles obtained
above the actuator at x = 10,5 mm (square symbols) and
downstream of it at x = 20 mm (circle symbols)
Fig. 13 Comparison of the longitudinal velocity
measurements obtained with three different smoking
particles with the actuator operated unsteadily
Fig. 11 Non-dimensional power spectral density of the
longitudinal fluctuating velocity for AC wave forms
with different slopes for the positive and the negative
cycles of the high voltage
14th Int Symp on Applications of Laser Techniques to Fluid Mechanics Lisbon, Portugal, 07-10 July, 2008
Paper n°1352
- 12 -
the type of the smoke, the seeding particles would describe a similar velocity field. In Figure 12, a
measurement carried out using a Pitot tube made in glass without smoke over the discharge is
plotted in black line. The ionic wind seems to be slightly less diffused on the height when no smoke
is present. Due to the intrusion of the Pitot tube, it is not possible to ensure the LDV measurements
were exactly carried out at the same locations. Over the whole cases studied up to now, the major
difference remains on the values of the maximum velocity measured as shown below:
The values of the velocity provided by the LDV system are smaller than the one obtained when
measuring with the Pitot tube without smoke over the discharge. The velocity obtained using
incense particle is really low compared to the others cases. This remark could be reinforced when
observing the velocity measurements synchronized with the voltage records at x = 10,5 mm and y =
0,5 mm (Fig. 13). The measurements performed with olive oil and DEHS droplets are exactly the
same whereas some negative longitudinal velocities are observed during the 2nd
half of the negative
cycles reinforcing the idea of the existence of a counter flow during this period. Here, more data on
the geometry of the incense particles would have been needed to ensure that they were not charged
and moved under the electric field inherent to the discharge.
7. Conclusions
This paper discussed the dynamics of a zero-net mass flux actuator commonly used in active
plasma flow-control applications in our lab. The present work provided a physical understanding of
how a sine DBD actuator working in steady or in unsteady mode behaves in quiescent air according
to the positive and the negative cycles of the high voltage. This study focused on the velocity of the
ionic wind by providing velocity measurements with a 2C-LDV system synchronized with high
voltage records. The main results are summarized here:
- Even if operating in a steady mode, the flow induced by the plasma actuator is not
continuously produced. In fact, the plasma discharge couples momentum to the ambient air
with a linear frequency forcing that is the same than the frequency of the power supply of
the actuator. The pulses of velocity are generated twice per period of the AC high voltage
during the first part of the positive cycle as well as during the first half of the negative cycle.
The ionic wind generated during the negative cycle is observed to be approximately twice
higher than the one produced during the positive cycle. This observation is confirmed over
the whole range of high voltages studied (14 kVpp – 32 kVpp) however it seems that the
increase of the velocity with the increase of the slope of the voltage is limited to a threshold
value.
- From the measurements with the actuator operated in unsteady mode, the momentum
transfer at the plasma-gas interface is observed to be a transient process. Actually, a time of
approximately 10 ms is needed for the EHD forces to fully accelerate the ambient fluid at a
voltage amplitude of 20 kVpp and a frequency of 0,5 Hz. Moreover, it is thought that an
upstream ionic wind is also generated during the 2nd
half of the negative cycle.
- Using an AC wave form with a higher slope for the negative cycle compared to the slope of
the positive one may lead to reduce this non desirable and inefficient effect. Finally, some
considerations on the duty cycle may lead to conveniently centre the energy of the
fluctuating velocities on the pulsed frequency of the unsteady actuation.
These results are expected to ultimately aid in the analysis and optimization of the design of EHD
actuators as well as in the understanding of the mechanisms of the plasma discharge.
LDV system Pitot tube
Olive oil DEHS incense without smoke
Maximum of velocity (m/s) at x = 20 mm 2,1 2,0 1,45 2,7
14th Int Symp on Applications of Laser Techniques to Fluid Mechanics Lisbon, Portugal, 07-10 July, 2008
Paper n°1352
- 13 -
Acknowledgements This work benefited a financial support of the CNRT R2A and the Région Centre in France. The
pictures presented here have been realized with the help of Simon Deprez. The authors want to
thank Sandrine Aubrun and Stéphane Loyer for their technical support during the achievement of
the experimental set-up.
References Allegraud K, Guaitella O, Rousseau A (2007) Spatio-temporal breakdown in surface DBDs: evidence of collective
effect. J Phys D: Appl Phys 40(24):7698-7706
Benard N, braud P, Touchard G, Moreau E (2008) Detachment and attachment of an axisymmetric non-reactive jet with
turbulent shear layer: control by plasma actuator. Exp Therm Flu Sci 32(6):1193-1203
Borghi CA, Carraro M R, Cristofolini (2005) Plasma and flow characterization in a flat panel one atmosphere uniform
barrier discharge. In: AIAA Paper 2005-5307. 36th
AIAA Plasmadynamics and Lasers Conference. Toronto,
Canada
Boucinha V, Magnier P, Leroy-Chesneau A, Weber R, Dong B, Hong D (2008a) Characterization of the ionic wind
induced by a sine DBD actuator used for laminar-to-turbulent transition delay by LDV. In: 4th
AIAA Flow Control
Conference, 23-26 June, Seattle, Washington
Boucinha V, Joussot R, Dong B, Weber R, Leroy-Chesneau A, Magnier P (2008b) Flow control by plasma:
Characterization of the ionic wind in still air by LDV. In: 13th
Int. Symp. on Flow Visualization, 1-4 July, Nice,
France
Corke T C, He C, Patel M P (2004) Plasma flaps and slats: an application of weakly-ionized plasma actuators. In: AIAA
Paper 2004-2137. 2nd
AIAA Flow Control Conference. Portland, Oregon
Enloe C L , McLaughlin T E, VanDyken R V, Kachner K D, Jumper E J, Corke T C (2004) Mechanisms and responses
of a single dielectric barrier plasma actuator: plasma morphology. AIAA J 42(3):589-594
Forte M, Jolibois J, Pons J, Moreau E, Touchard G, Cazalens M (2007) Optimization of a dielectric barrier discharge
actuator by stationnary and non-stationnary measurements of the induced flow velocity: application to airflow
control. Exp Fluids 43:917-928
Göksel B, Greenblatt D, Rechenberg I, Nayeri C N, Paschereit C O (2006) Steady and unsteady plasma wall jets for
separation and circulation control. In: AIAA Paper 2006-3686. 3rd
AIAA Flow Control Conference. San Francisco,
California
Grundmann S, Tropea C (2007) Active cancellation of artificially introduced Tollmien-Schlichting waves using plasma
actuators. Exp Fluids 44(5):795-806
Lagmich Y, Callegari Th, Pitchford L C, Boeuf J P (2008) Model description of surface dielectric barrier discharges for
flow control. J Phys D: Appl Phys 41(9):5205-5214
Magnier P, Hong D, Leroy-Chesneau A, Bauchire J M, Hureau J (2007) Control of separated flows with the ionic wind
generated by a DC corona discharge. Exp Fluids 42(5):815-825
Moreau E (2007) Airflow control by non thermal plasma actuators. J Phys D: Appl Phys 40:605-636
Pons J, Moreau E, Touchard G (2005) Asymetric surface dielectric barrier discharge in air at atmospheric pressure:


![Generation and Characterization of Ionic - Springer · Generation and Characterization of Ionic ... (1b), P( O)SH 2 (1c), HP( S)OH ... 1353–1366. Moller-Plesset°theory°[40]°truncated°at°second-order](https://static.documents.pub/doc/80x56/5af572557f8b9a95468f6260/generation-and-characterization-of-ionic-springer-and-characterization-of-ionic.jpg)


