Page 1
University of the Pacific University of the Pacific
Scholarly Commons Scholarly Commons
University of the Pacific Theses and Dissertations Graduate School
1976
Characterization of the physical properties and the bioavailability Characterization of the physical properties and the bioavailability
of phenobarbital tablets, USP, 100 mg of phenobarbital tablets, USP, 100 mg
Mario F. Sylvestri University of the Pacific
Follow this and additional works at: https://scholarlycommons.pacific.edu/uop_etds
Part of the Pharmacy and Pharmaceutical Sciences Commons
Recommended Citation Recommended Citation Sylvestri, Mario F.. (1976). Characterization of the physical properties and the bioavailability of phenobarbital tablets, USP, 100 mg. University of the Pacific, Thesis. https://scholarlycommons.pacific.edu/uop_etds/434
This Thesis is brought to you for free and open access by the Graduate School at Scholarly Commons. It has been accepted for inclusion in University of the Pacific Theses and Dissertations by an authorized administrator of Scholarly Commons. For more information, please contact [email protected] .
Page 2
CHARACTERIZA'riON 0}' THE PHYSICAL PROPEH.TIES
AND TlfE BIOAVAILABILITY OF
PHENOBARBITAL TABLETS, USP, lOO.mg
!: ~, ,:
A Thesis
Presented to
The Jt'acul ty of the Graduate School
University of the Pacific
In Part"ia1 ~<'ul:fillment ·
of the Requirements for the De~ree • ' • !
Master of Science
, .. ,'. .....
by
Mario F. Sylvestrj
Page 3
This thesis~ written and submitted by
Matio F. Sylvestri
is approved for recommendation to the Committee
on Graduate Studies, University of the Pacific.
Department Chairman or Dean:
~W· Thesis Committee:
Chairman
Dated December 2, 1976 --------------~-----------------------
Page 4
I
Dedicate
This
Thesis
To My Parents
who planted the seed, watched it ~row . . .
.:\nd to you, dear GOD, for making this possible!
MFS !
Page 5
TJII JJIP7'RV~
iv
Finally, the author thanks his sister, Carolina
M. R. Sylvestri, for her invaluable assistance in the prep-
aration of this thesis.
Page 6
TABLE OF CONTEN'l'S
LIST OF TABLES.
LIS'r OP JnGURES •
INTRODUCTION •.. . . . . . Factors Affecting Bioavailability . Compendia! Standards. . . . . . . . . . . Bioavailability Protocol ........ . The Need. to Establish the Bioavailability of
Phen6barbital Tablets
MATERIALS AND METHODS . . . . . o e e 0 e I
Part I - Determination of Physical Properties
Weight • . . . Hardness ~ . . Di.sintegration Dissolution. . .
. . . . . . .
Part II - Bioavailability Study . . . . . . . . Experimental Design~ . . Experimental Protocol ..
·· The EMIT Assay .. System. .
RESUI.'rS . • • • • • • 0
DISCUSSIONS AND CONCLUSIONS .
SUMMARY· • • . . . . ~ . BIBLIOGRAPHY. . . . . . . . APPENDIX. . •
v
. . . . . . .
. . . . . . . . . . . . . . . . .
. . . . . . .
Page
vi
viii
1
5 11 13
15
19
20
20 20 21 21
25
25 25 26
32
98
104
106
110
Page 7
Table
I
II
III.
IV
V.
VI
VII
VIII
IX
X
.XI
XII
XIII
XIV
LIST OF TABLES
Experimental Code for Manufacture~s of · Phenobarbital Tablets,· USP, 100 mg,
Employed in This Study ..
Tablet Weight .in Milligrams for the 7 Products • . . ·· . . . . . .· . . .
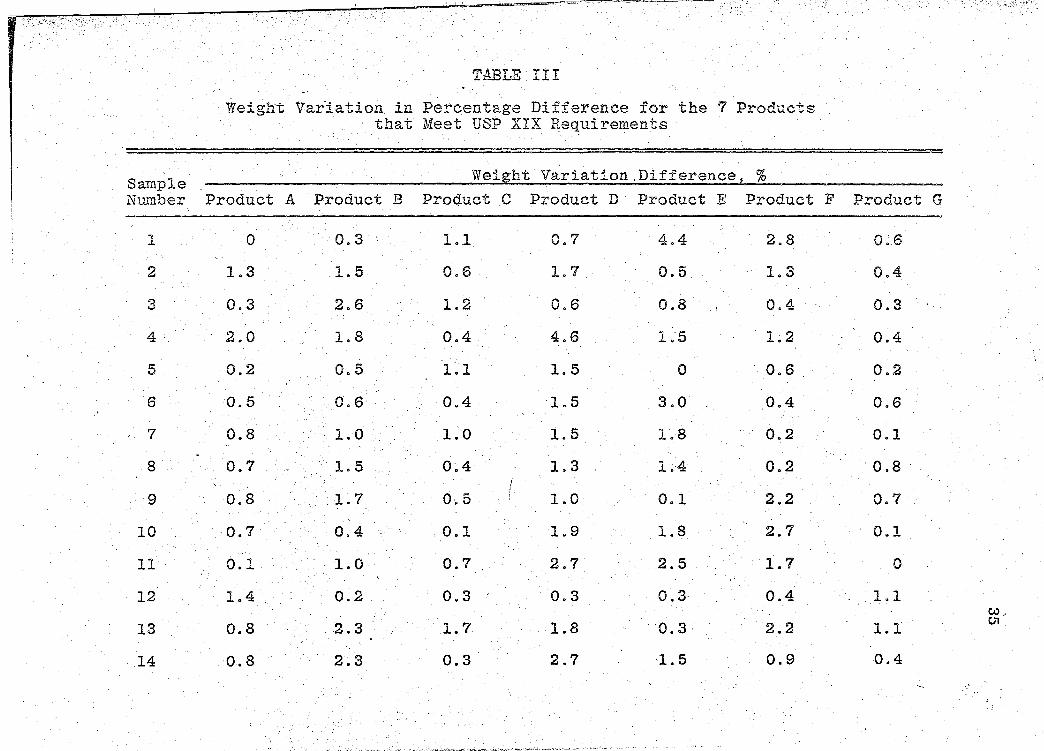
Weight Variation in Percentage Difference for the 7 Products that·Meet USP XIX Requirements . . . . ·. . . . . . . .
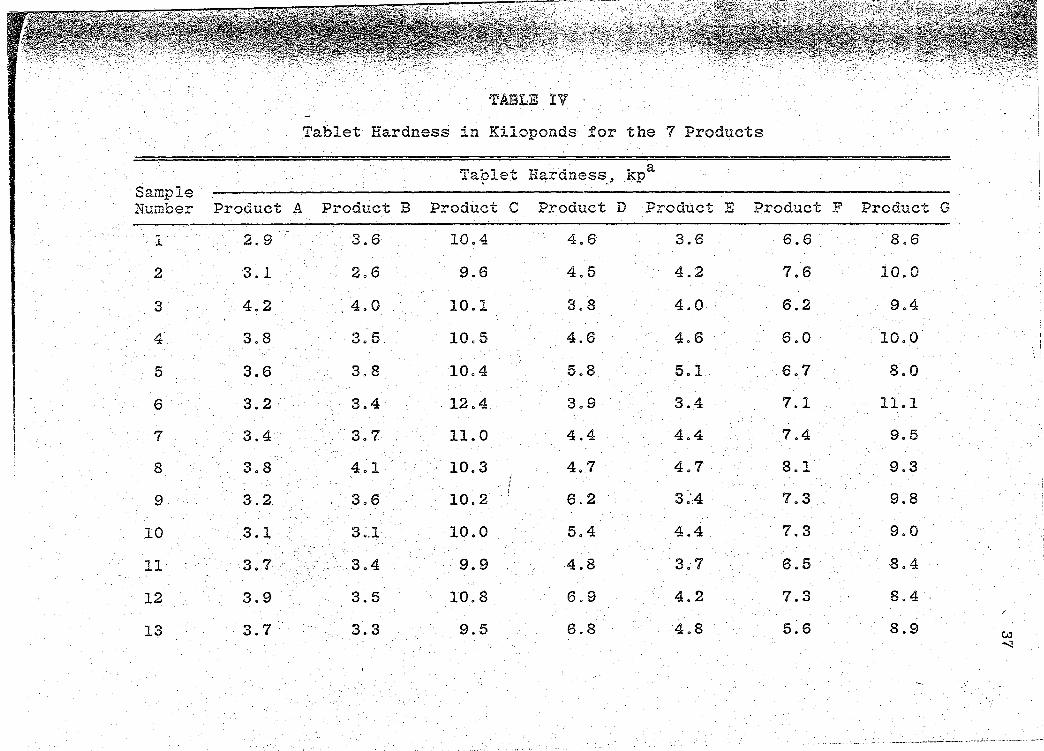
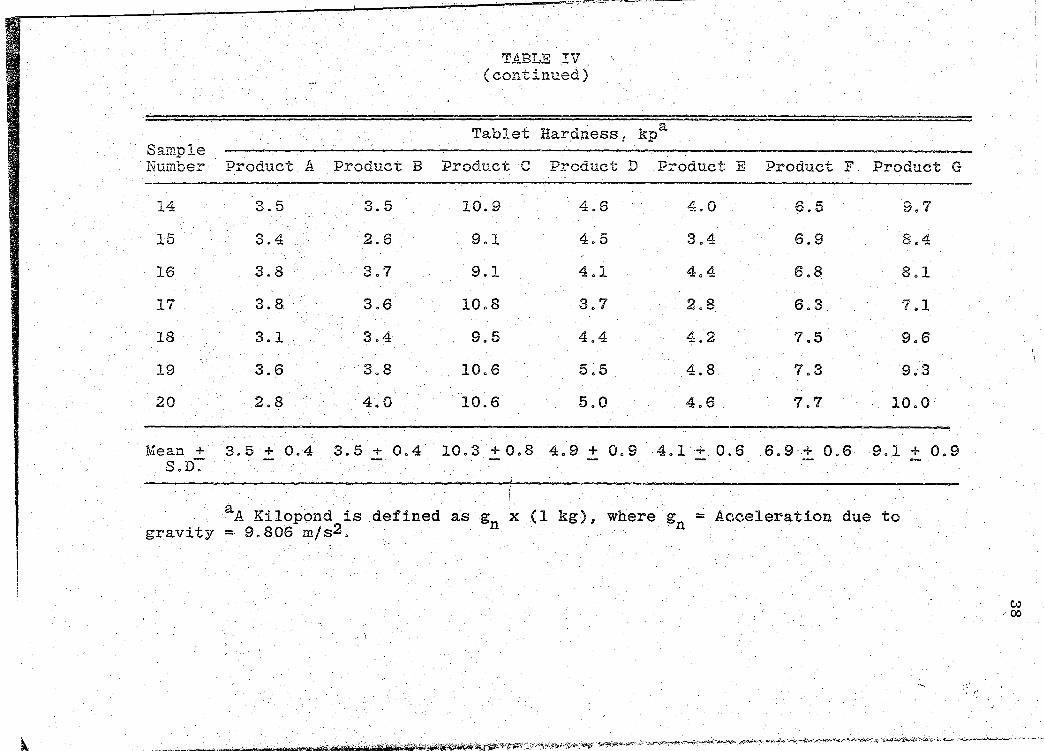
Tablet Hardness in Kiloponds for the 7 Products. . . . . . . . . . . . .
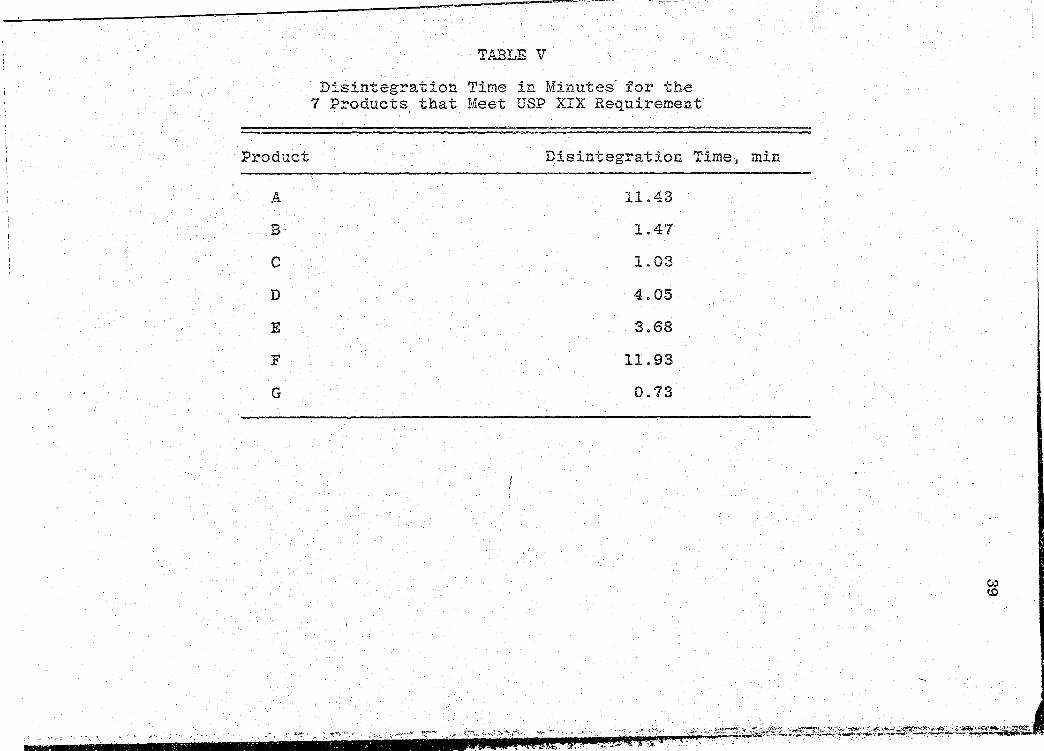
Disintegration Time in Minutes for the 7 Products that Meet USP XIX Requirements
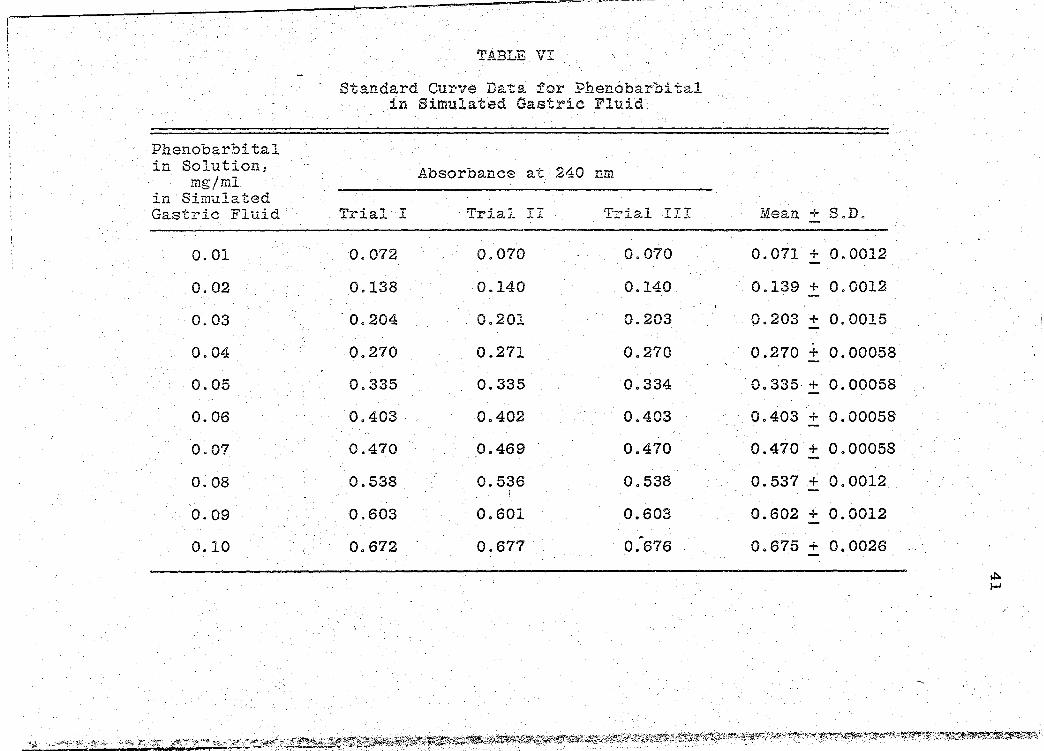
Standard Curve Data for Phenobarbital in Simulated Gastric Fluid . . .
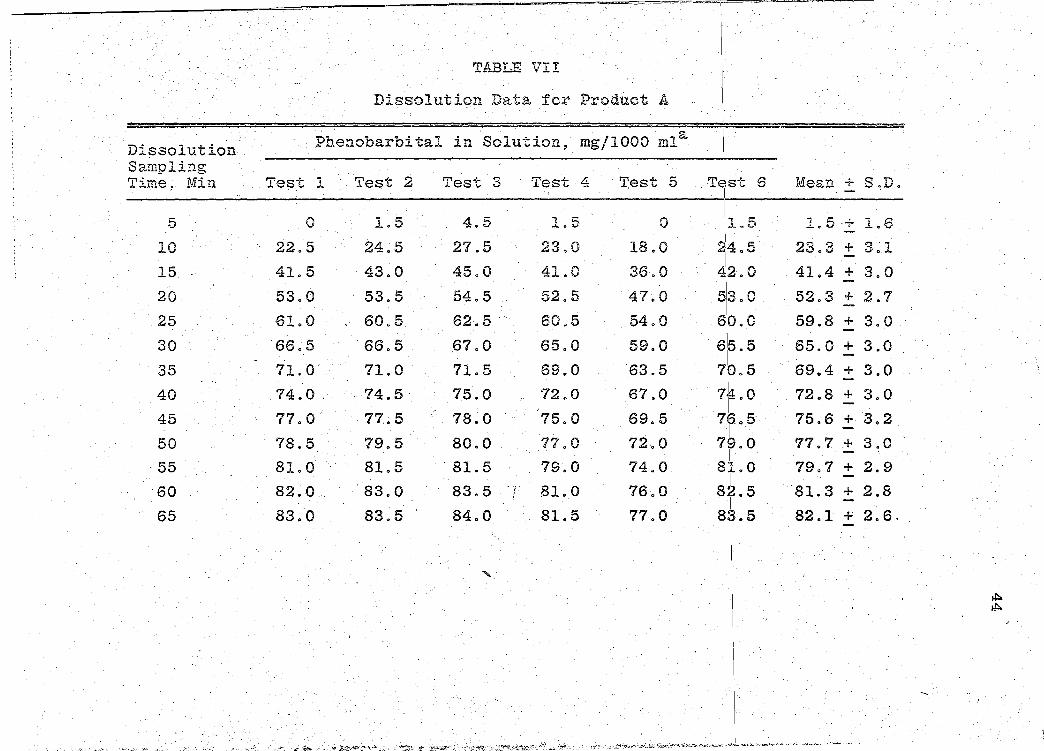
Dissolution Data for Product A.
Dissolution Data for Product B ..
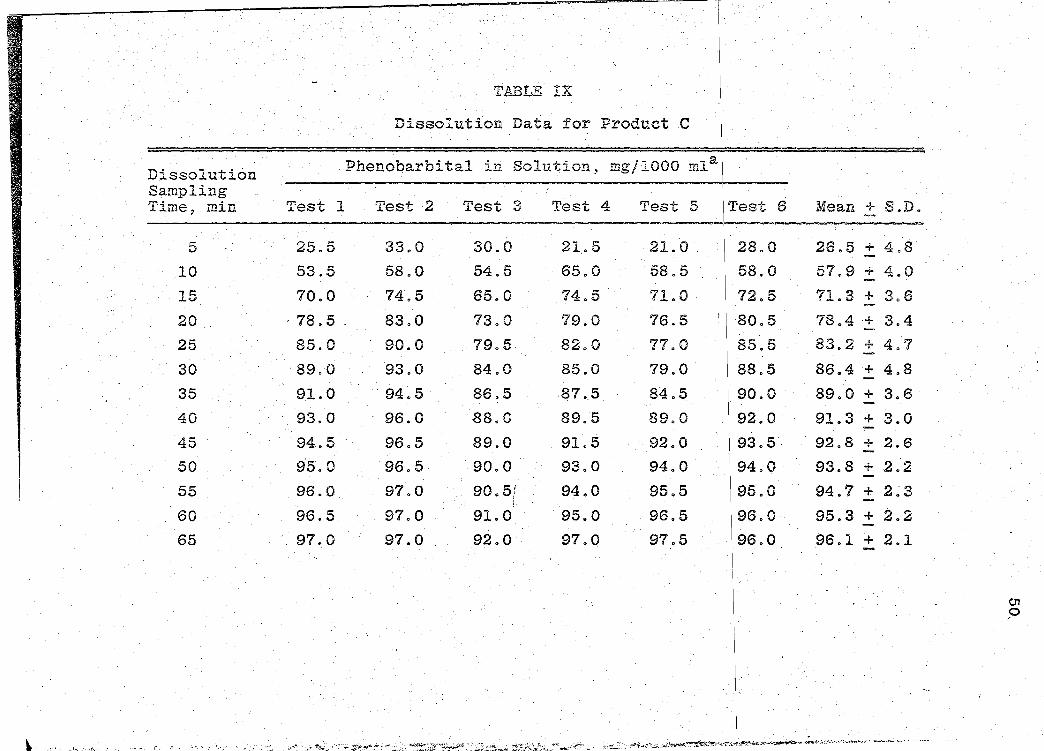
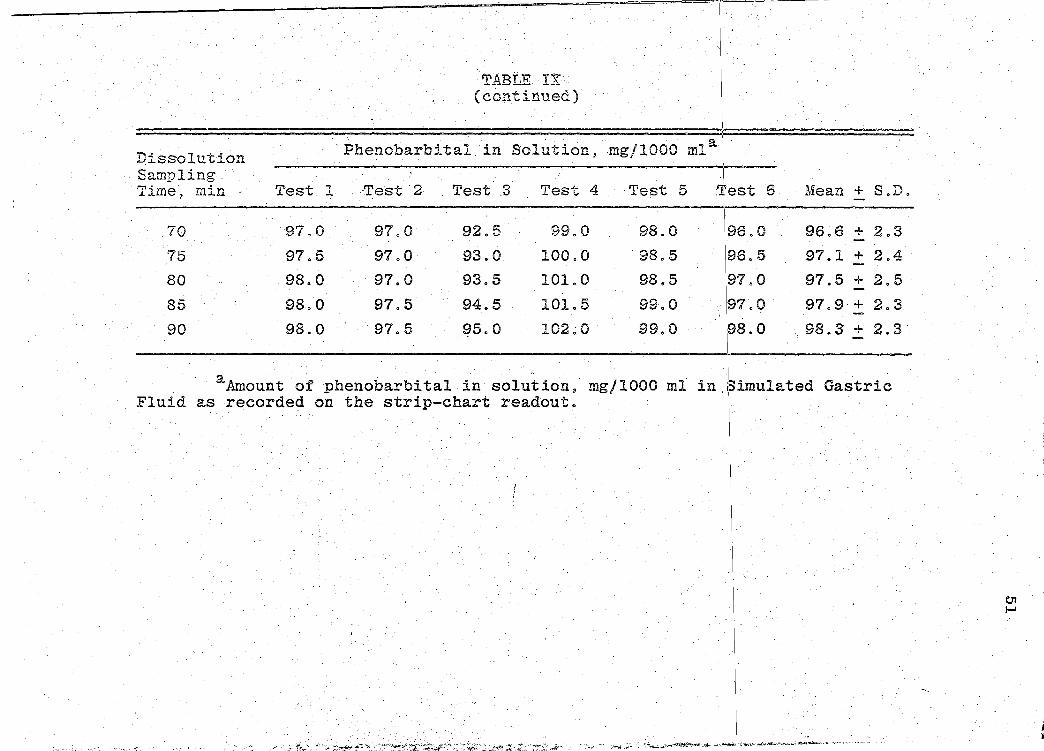
Dissolution Data for Product C.
Dissolution Data for P~oduct D.
Dissolution Data for Product E.
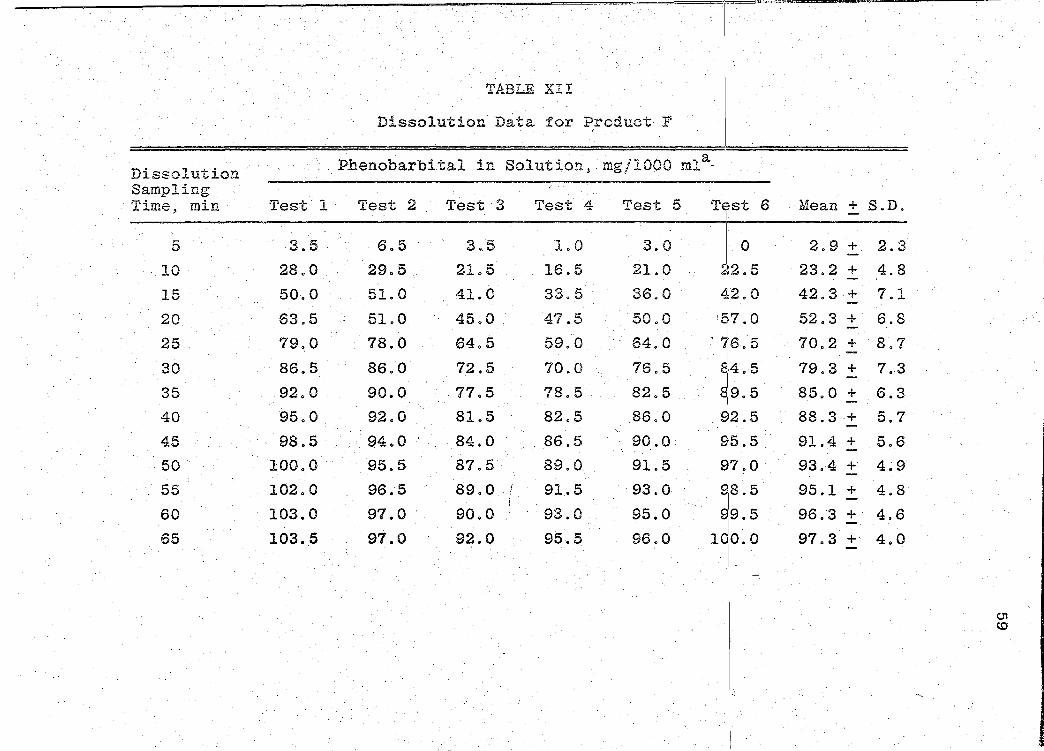
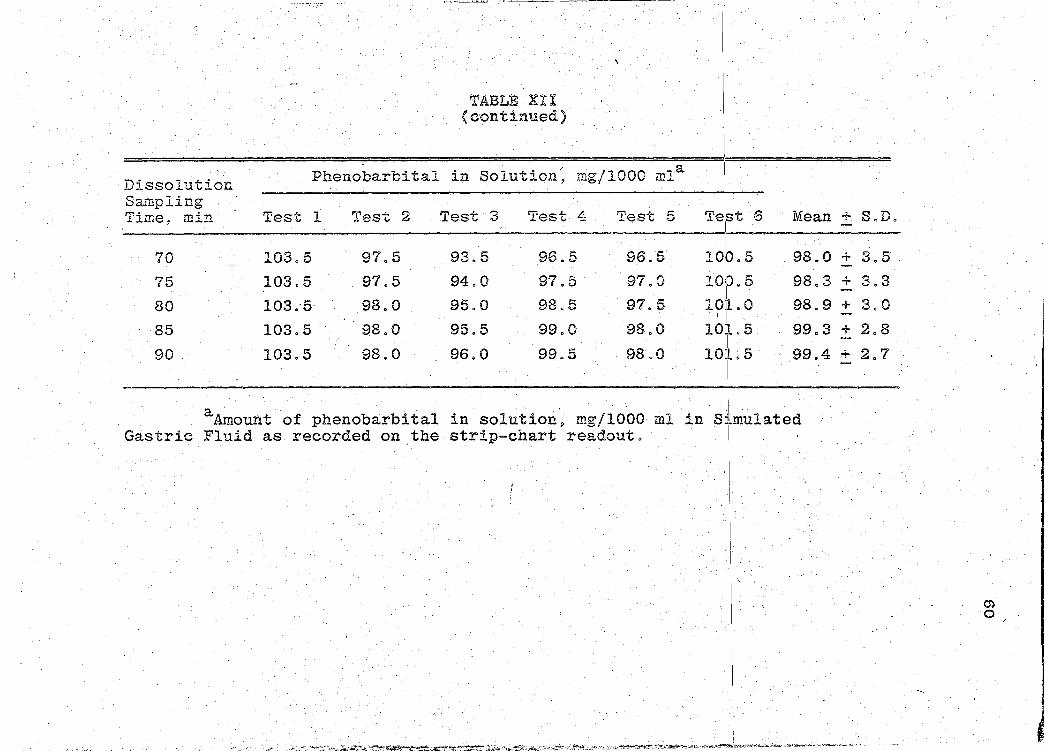
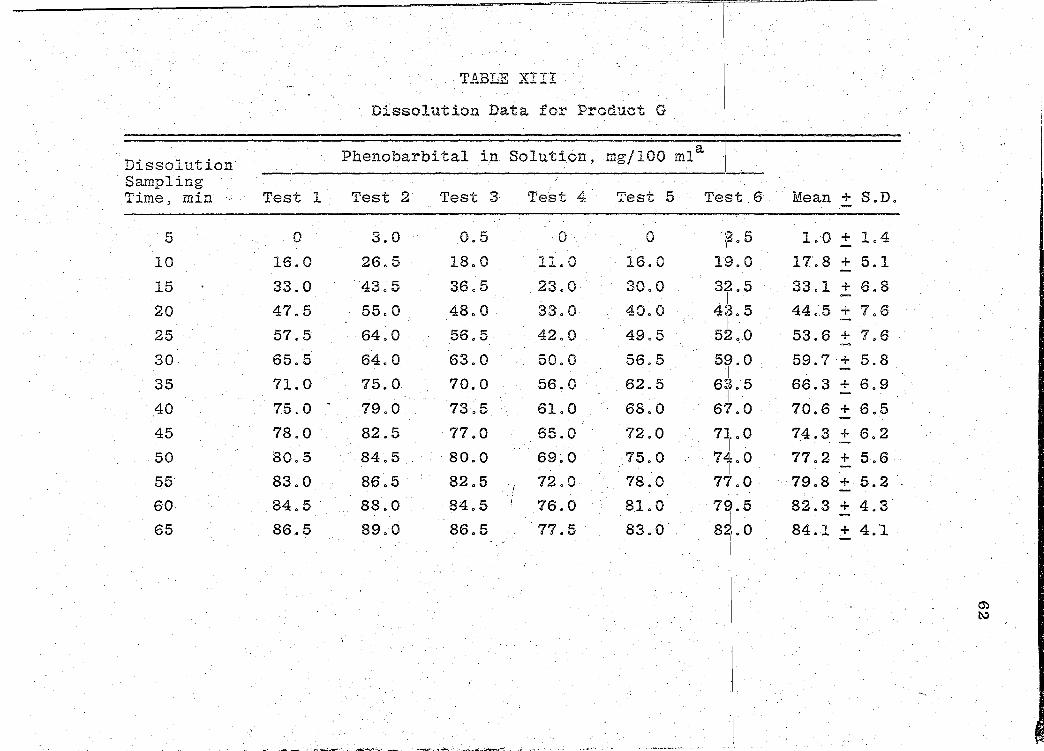
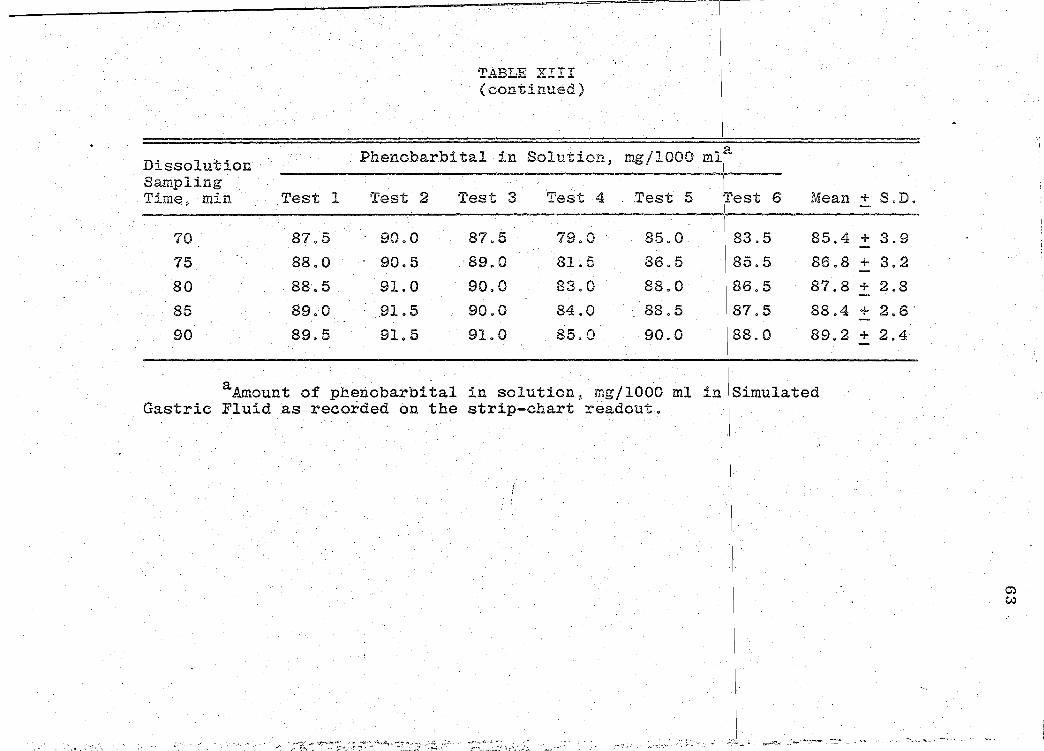
Dissolution Data for Product F. . . . . Dissolution Data for Product G.
.
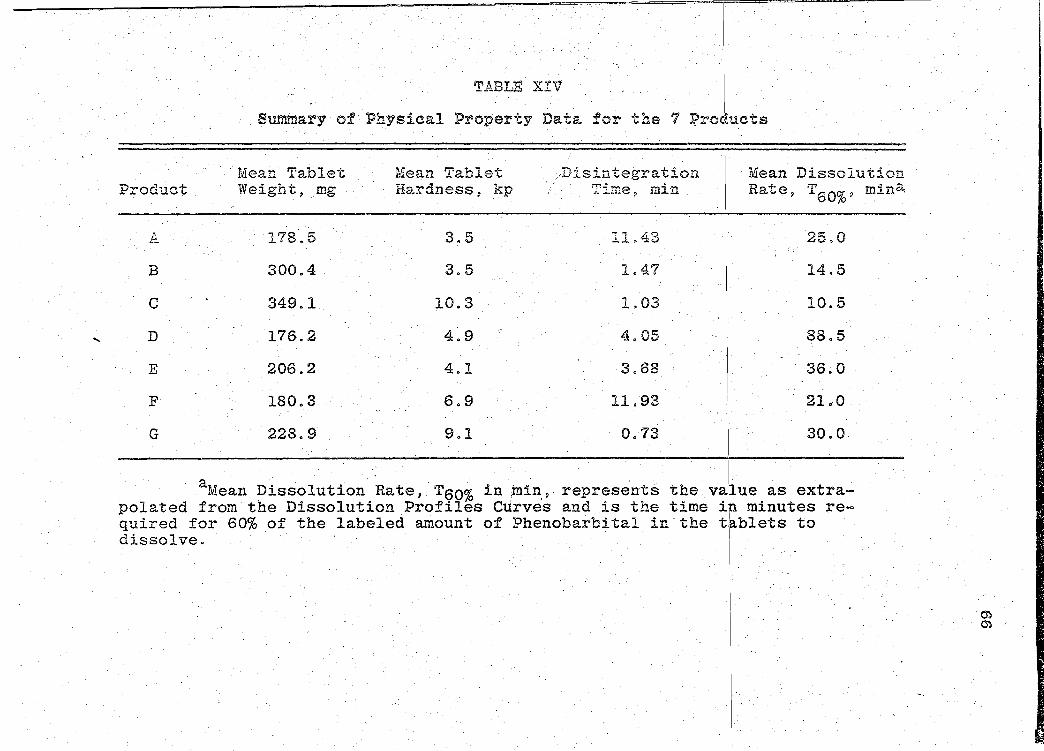
Summary of Physical Property Data for the '7 Products . . . . . . . . . . .
.
. XV Standard Curve Data for EMIT Phenobarbital
Assay.
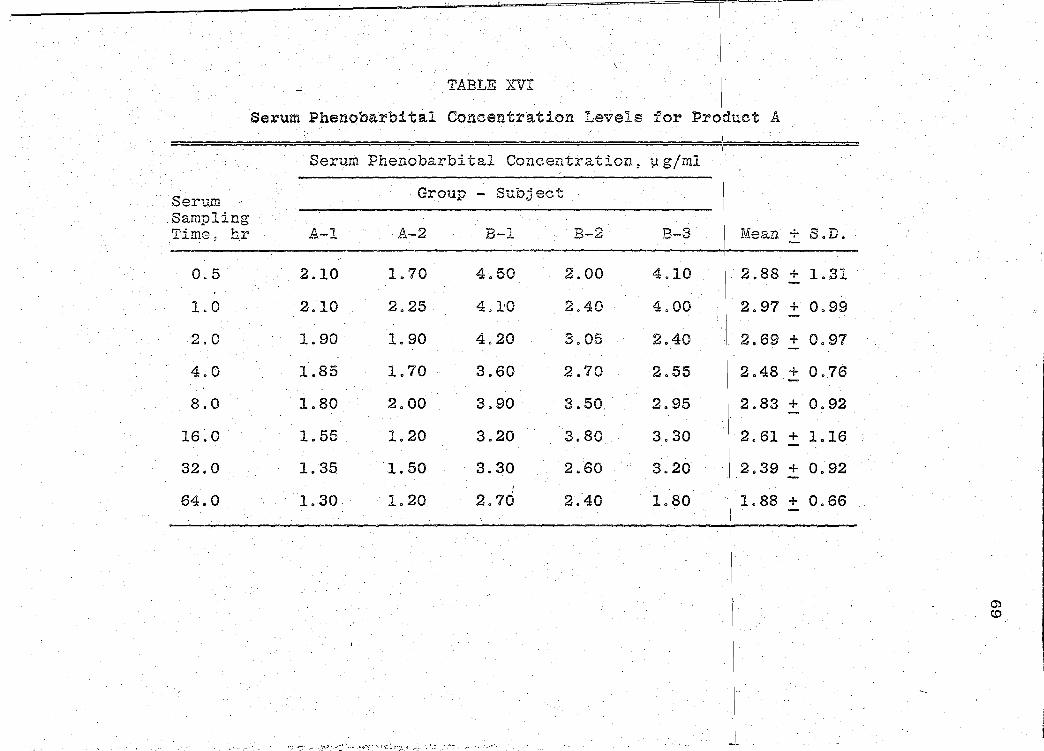
:XVI. Serum Phenobarbital Concentration Levels for Product A. • . . . . . . • . . . . .
XVII Serum Phenobarbital Concentration Levels for Ptoduct B. . . . . . . . .
vi
Page
19
33
35
37
39
41
44
47
50
53
56
59
62
66
67.
69
71
Page 8
Table
XVIII
XIX
LIST OF TABLES (continued)
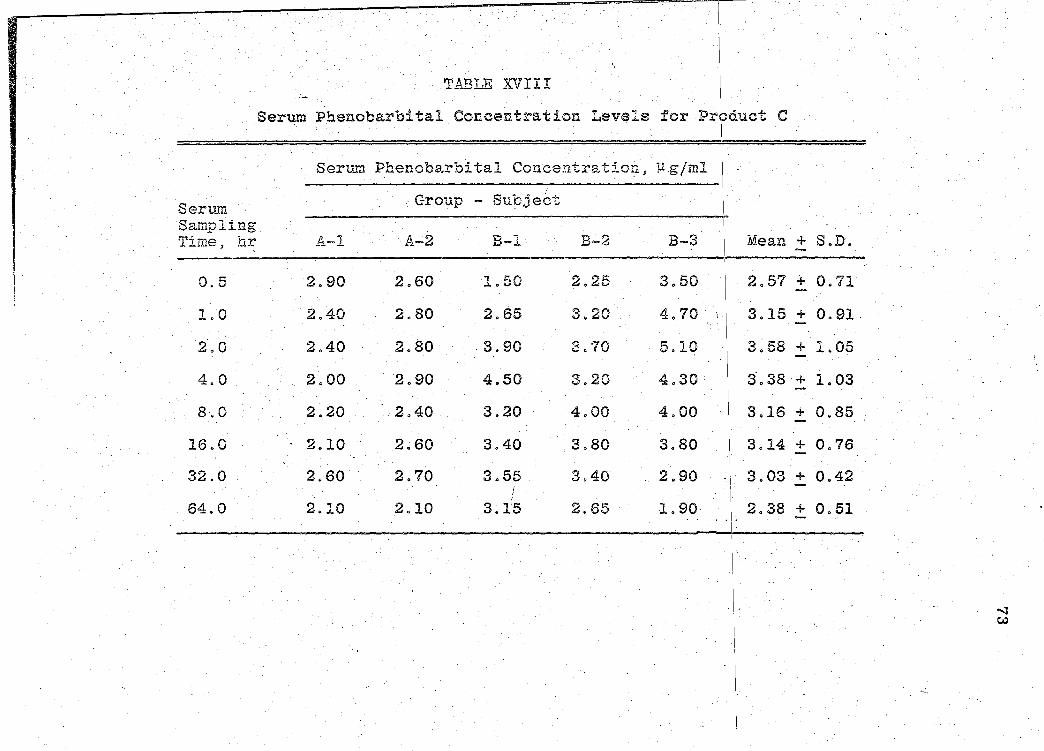
Serum Phenobarbital Concentration Levels for Product C. . . . . . . . . . . . . .
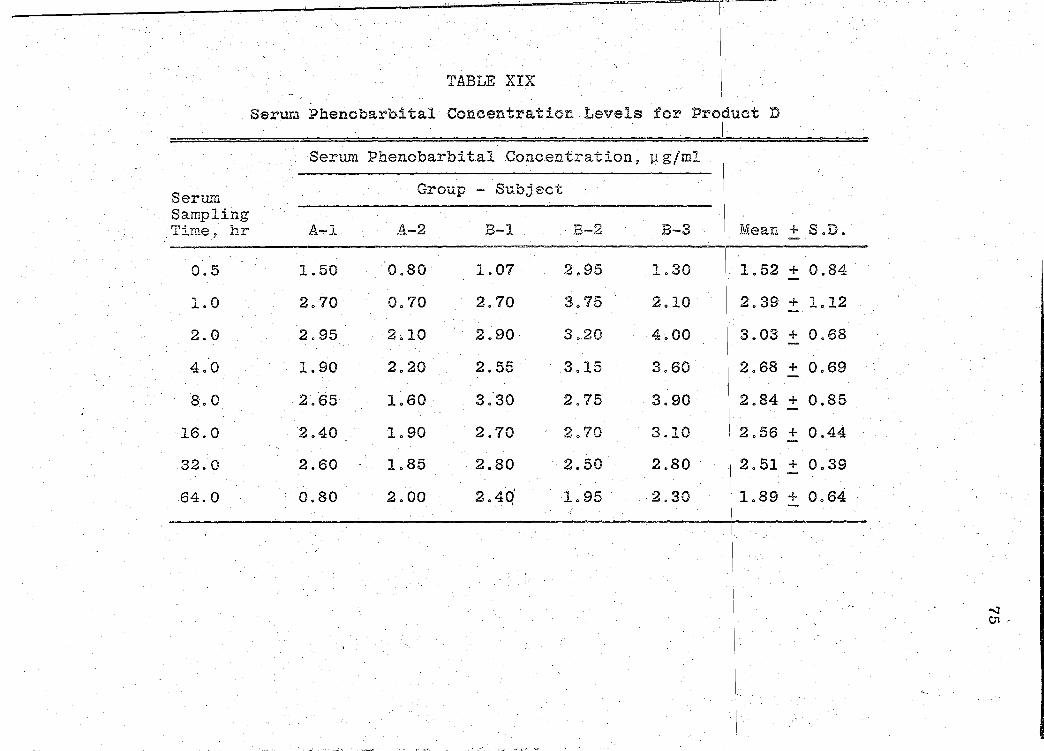
Serum Phenobarbital Concentration Levels for Product D. . . . . . . . . • . . .
XX Serum Phenobarbital Concentration Levels
vii
Page
73
75
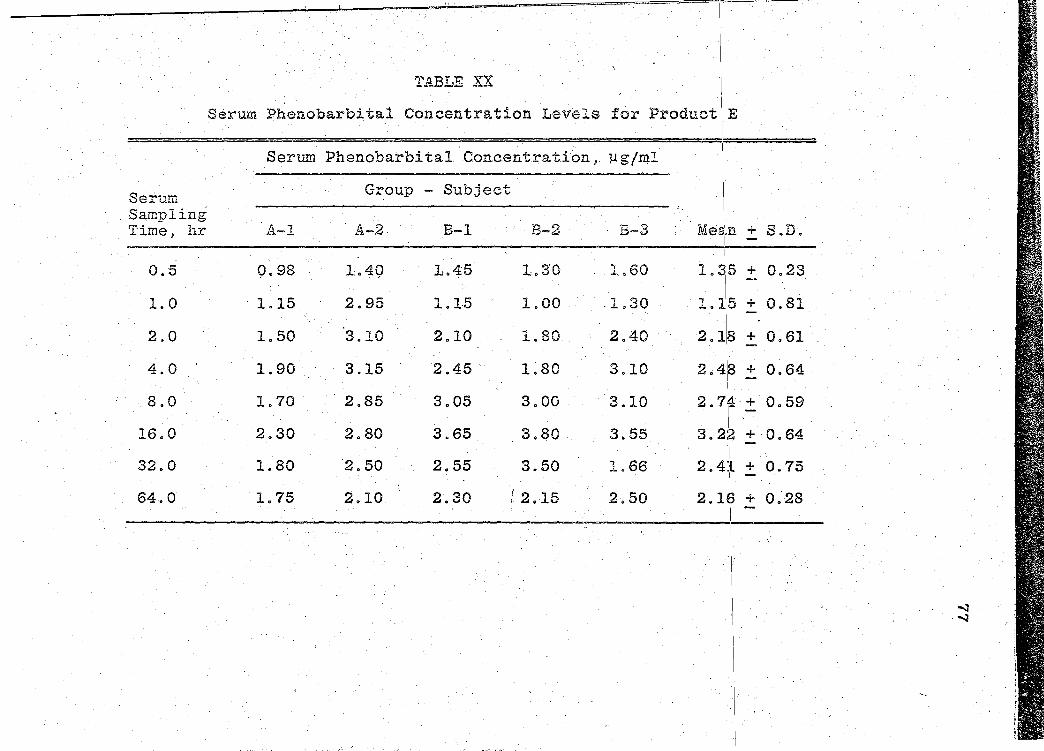
for Product E. . . . . . . . . . . . . . 77
XXI
XXII.
XXIII
·XXIV
XXV
XXVI
XXVII
XXVIII
XXIX
XXX
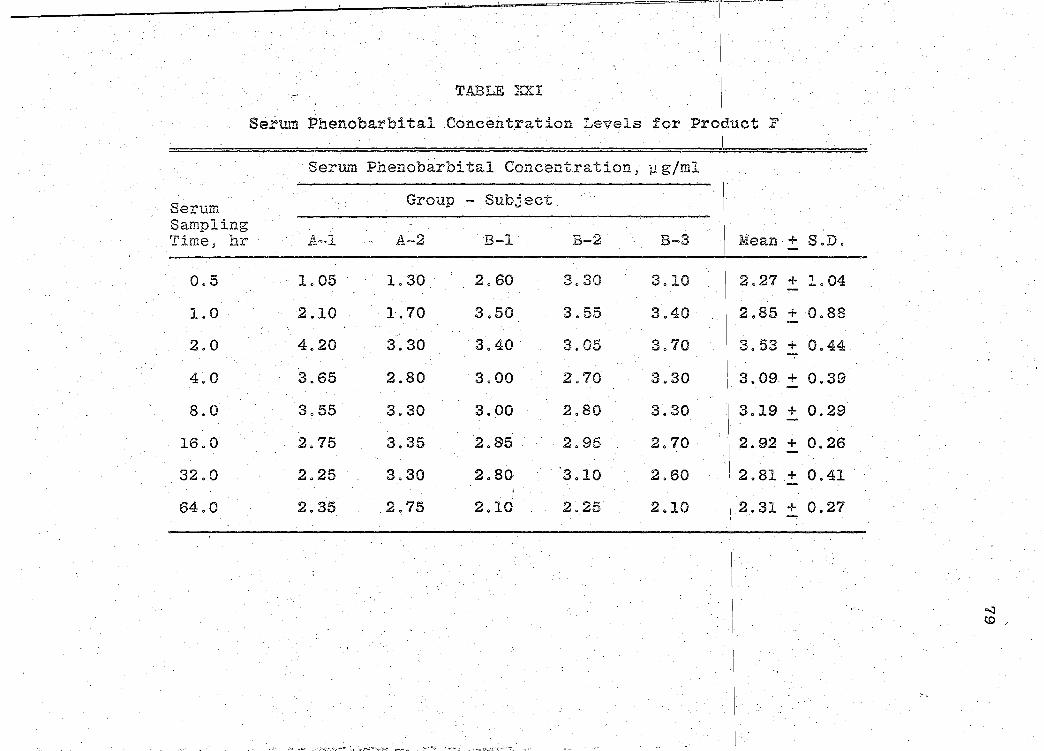
Serum Phenobarbital Concentration Levels for Product F ............. .
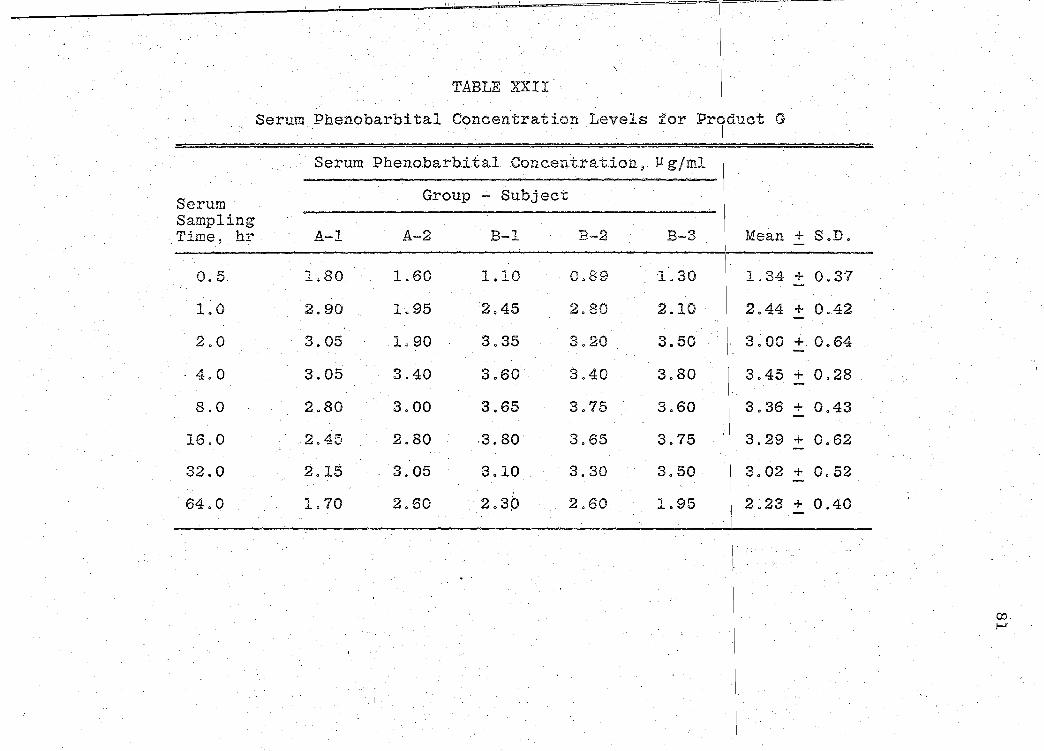
Sertim Phenobarbital Concentr~tion Levels for Product G. . . . . ~ . . . . . . . .
Summary of the Bioavailability Data for the 7 Products . . . . . . . . . . .
Statistical Analysis of Product A Bio~ ~vailability . . ~ . . . . . . . . .
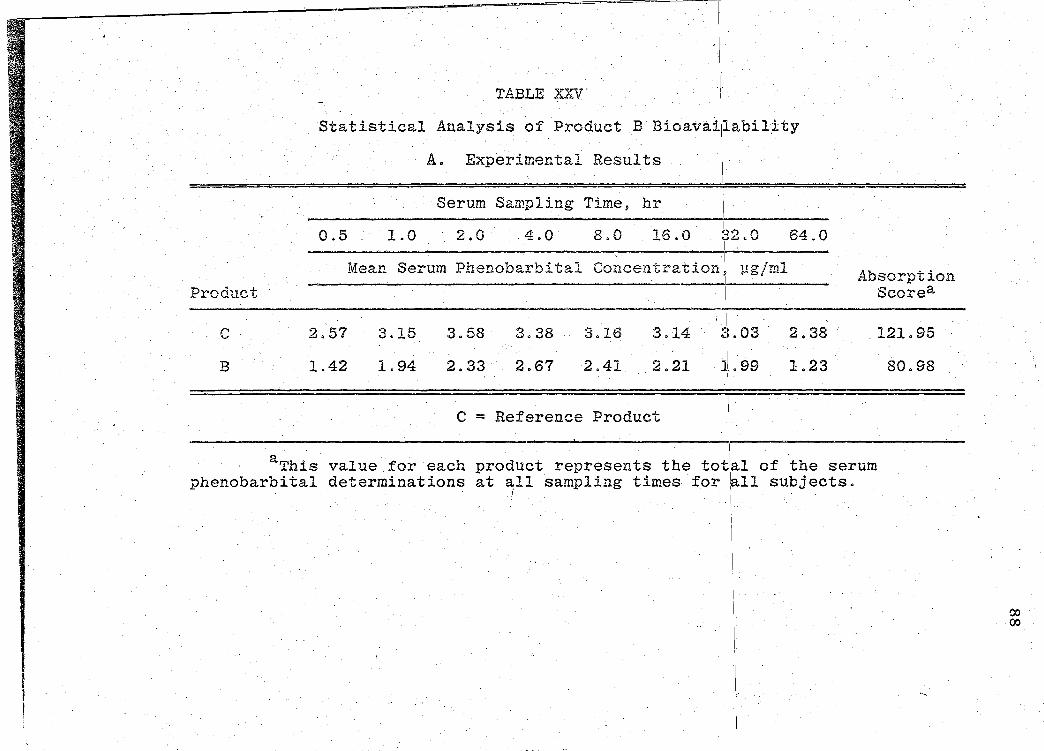
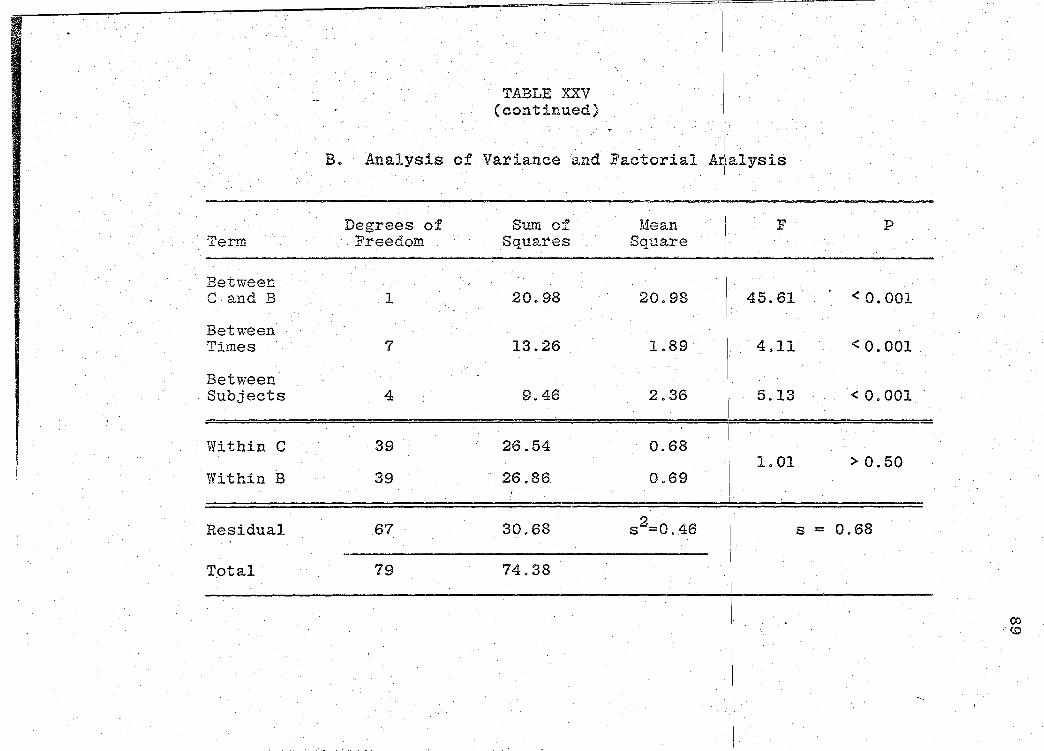
Statistical Analysis of Product B Bio~ availability ........... .
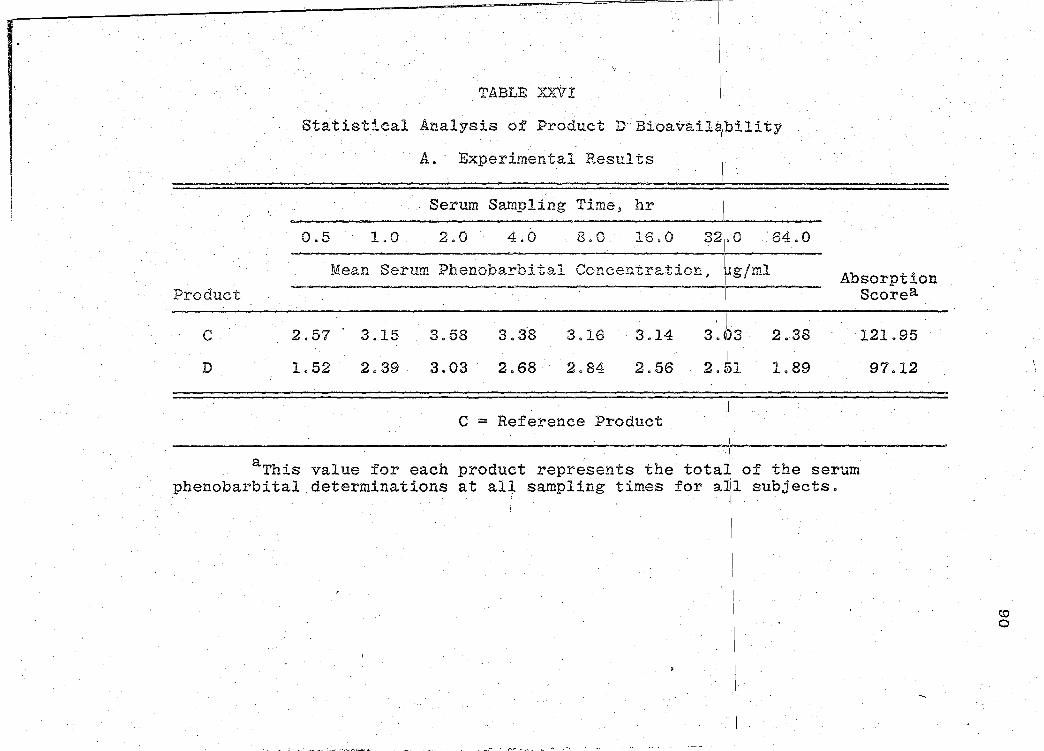
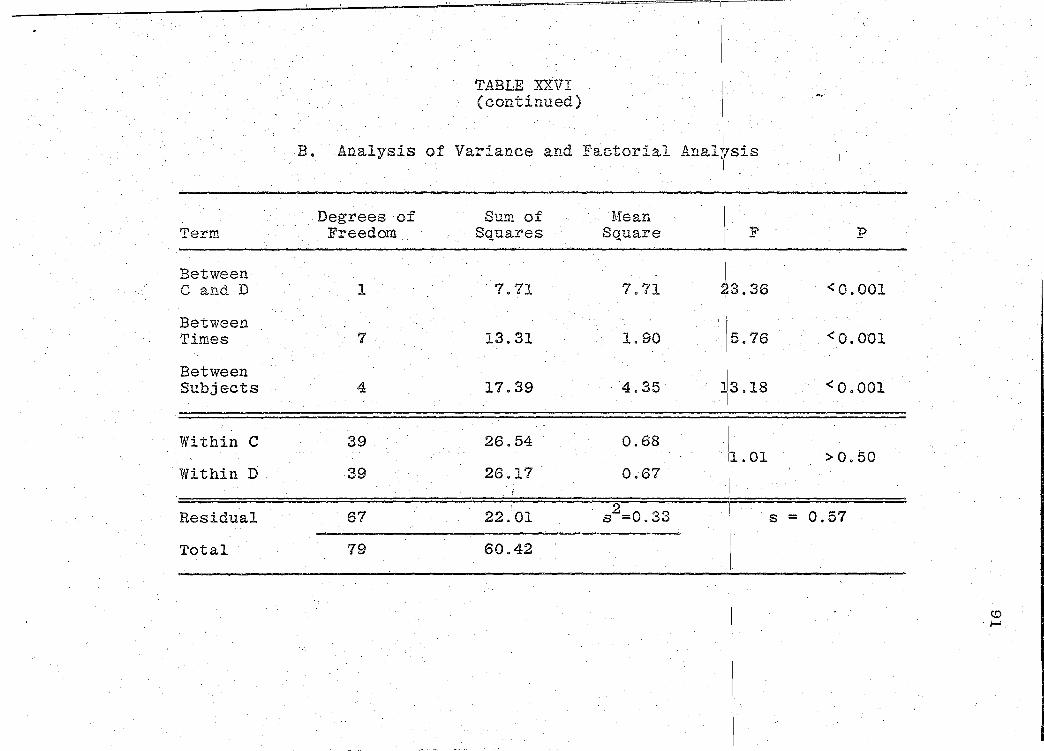
Statistical Analysis of Product D Bio~ availability . . . . . . . . . . . .
Statistical Analysis of Product E Bioavailability . . . . . . . . . . . .
Statistical Analysis of Product F Bio-availability ........... .
Statistical Analysis of Product G Bio-availability ........... .
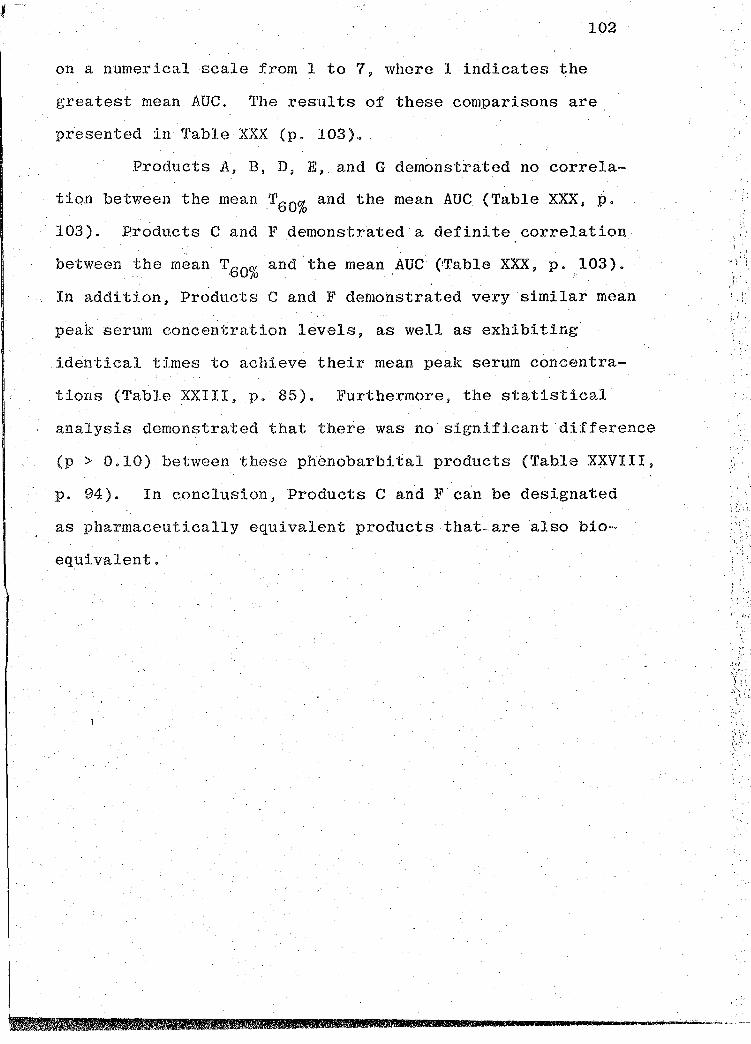
Correlation Data Profiles for the 7 .Products. . ......... .
.79
81
85
86
88
90
92
94
96
103
Page 9
LIST OF FIGURES
Figure P:ige
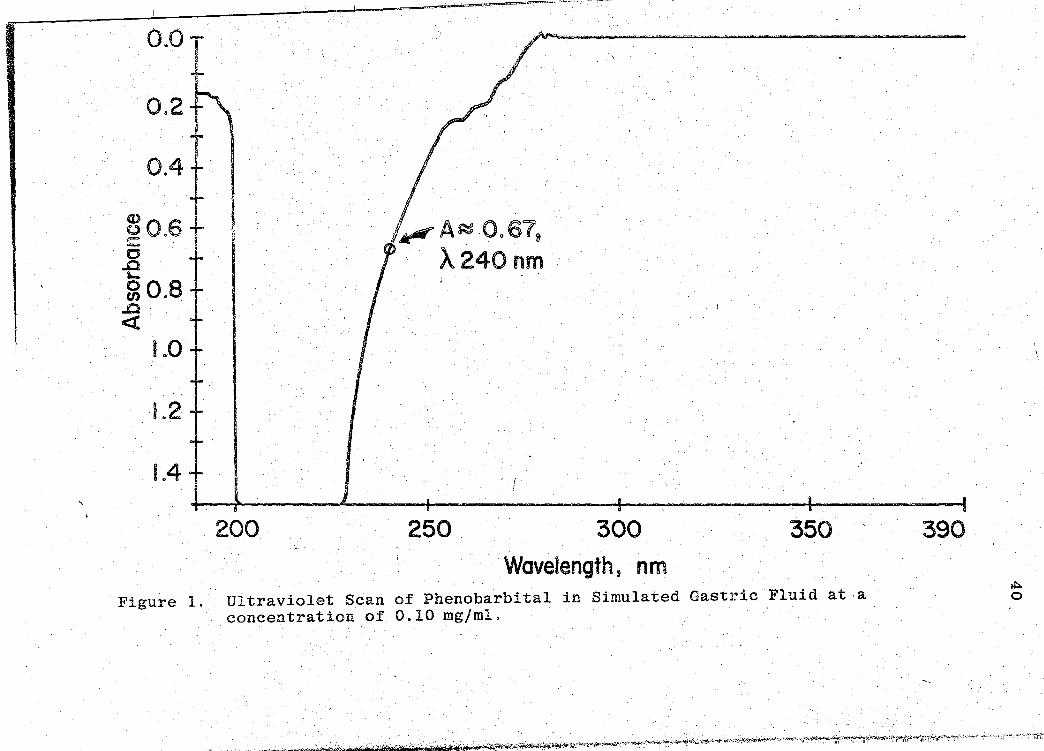
1. Ultraviolet Scan of Phenobarbital in Simu..:. lated Gastric Fluid at a conentration of 0.10 mgfml. . . . . . . . . . . . . . . 40
2. Standard Curve for Phenobarbital in Simu-lated Gastric Fluid . . . . . . . . . . 42
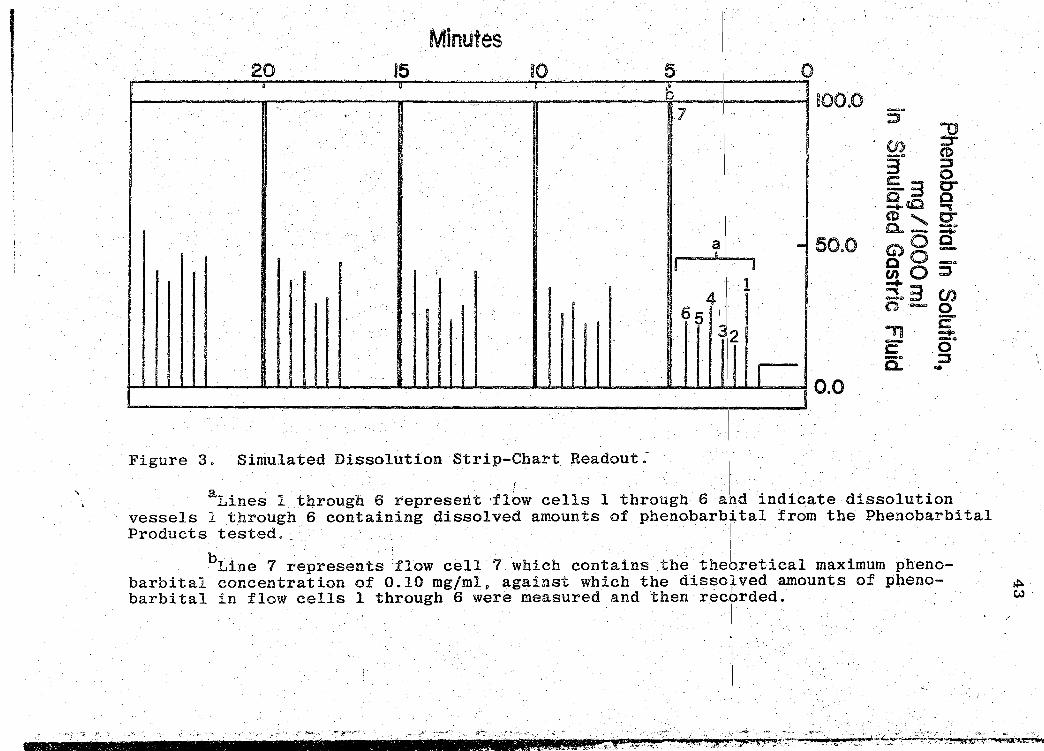
3. Simulated Dissolution Strip-Chart Readout 43
4. Mean Dissolution Profile Curve for Product A. 46
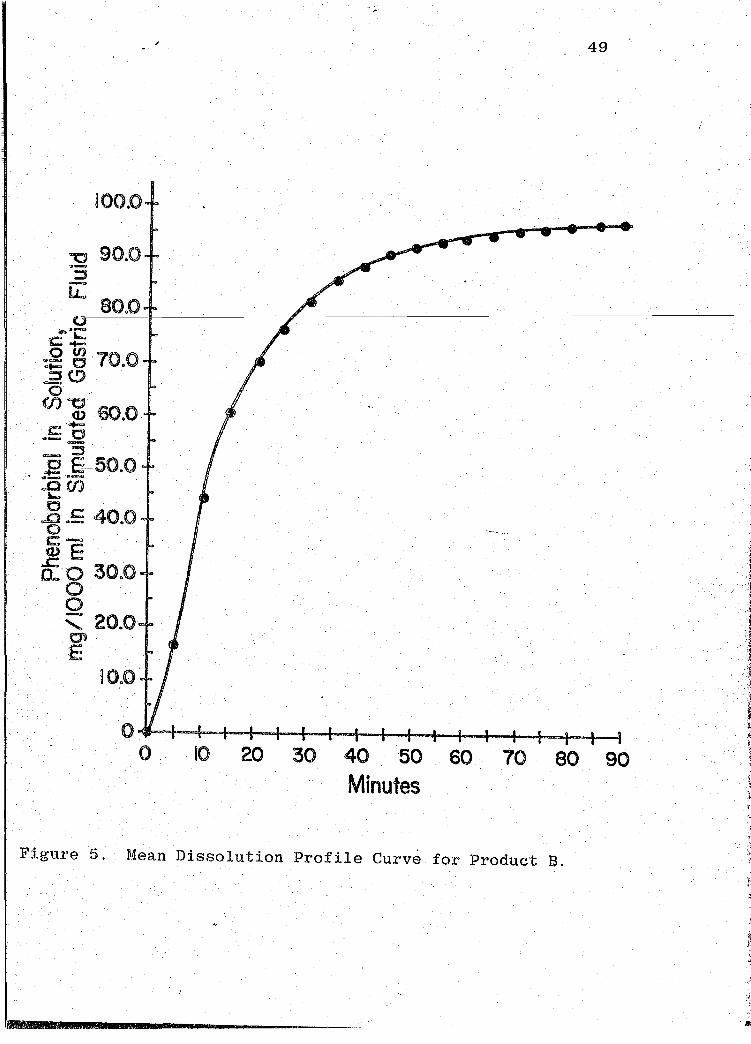
5. Mean Dissolution Profile Curve for Product B. 49
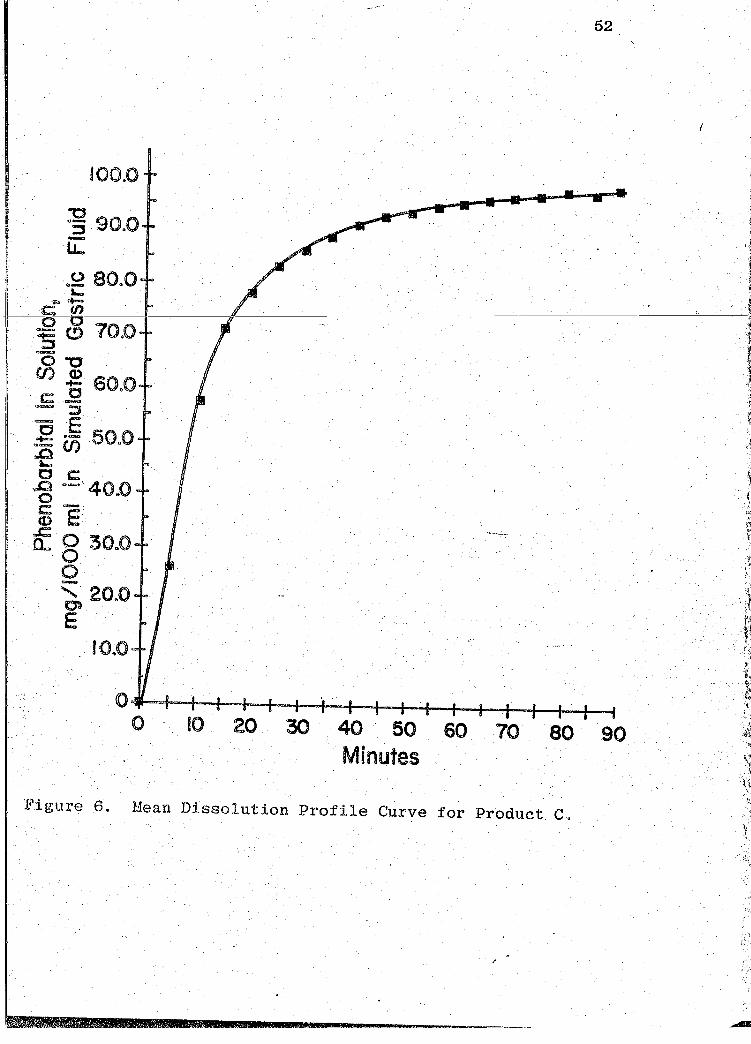
6. Mean Dissolution Profile Curve for Product c. 52
7. Mean Dissolution Profile Curve for Product D .. 55
. 8. Mean D1ssolution Profile Curve for Product E. 58
9. Mean Dissolution Profile Curve for Product F. 61
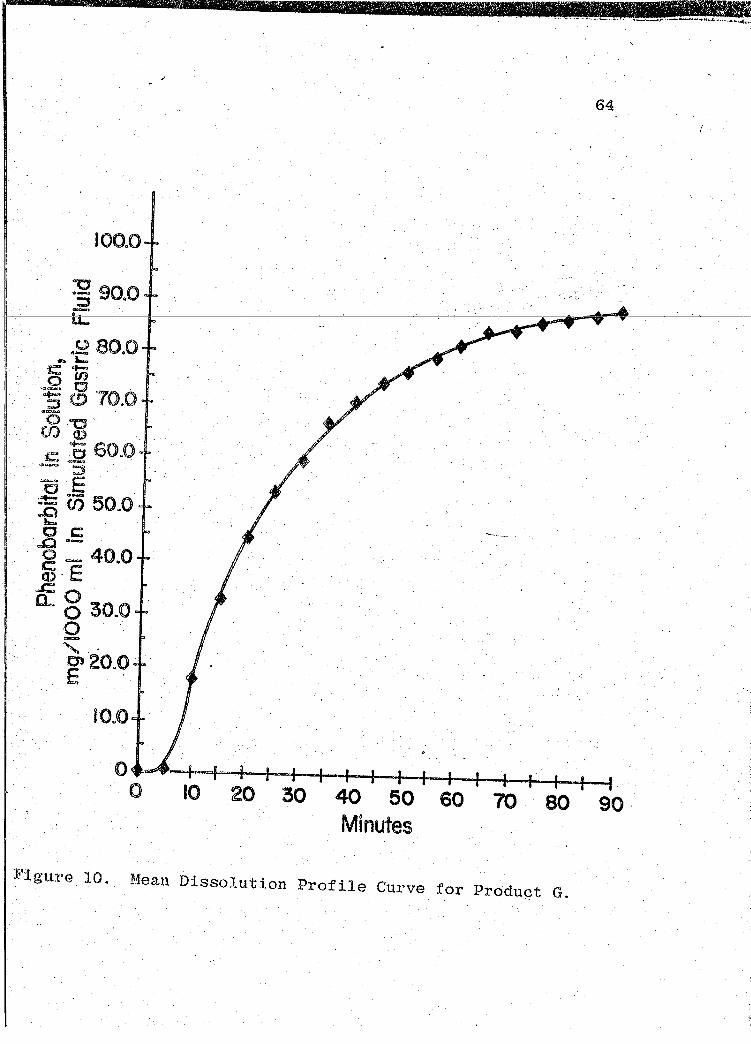
10. Mean Dissolution Profile Curve for Product G. 64
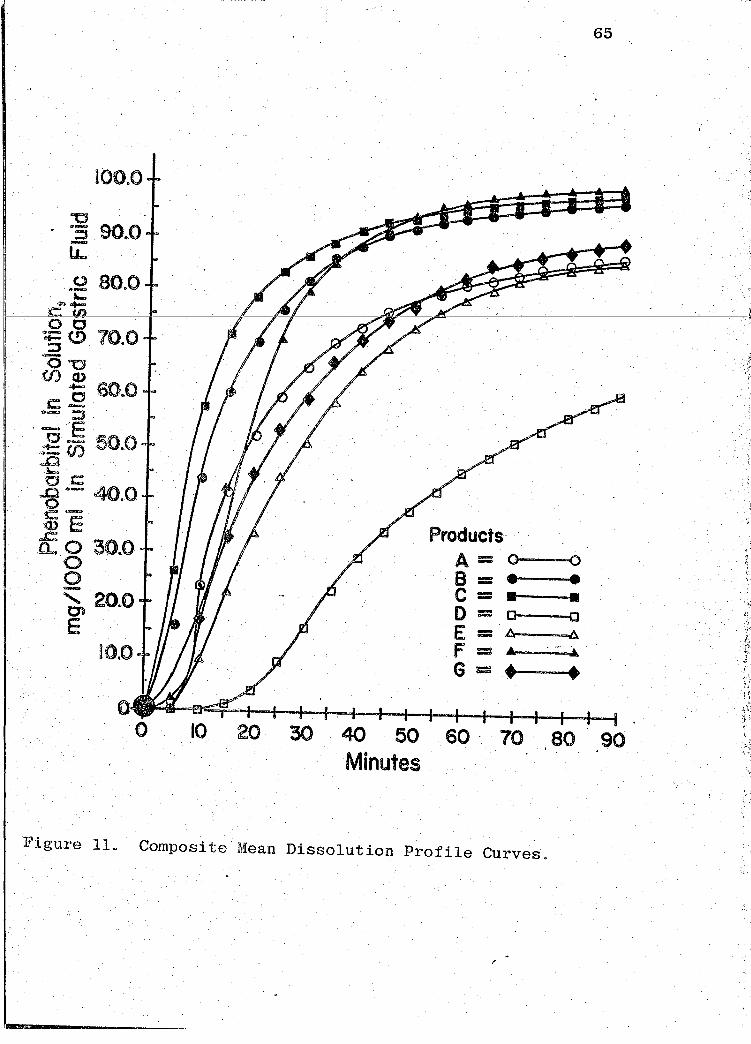
11. Composite Mean Dissolution Profile Curves 65
12. Standard Curve for the EMIT ·Phenobarbital· Assay . . . . . . . . . . . . . . . . . 68
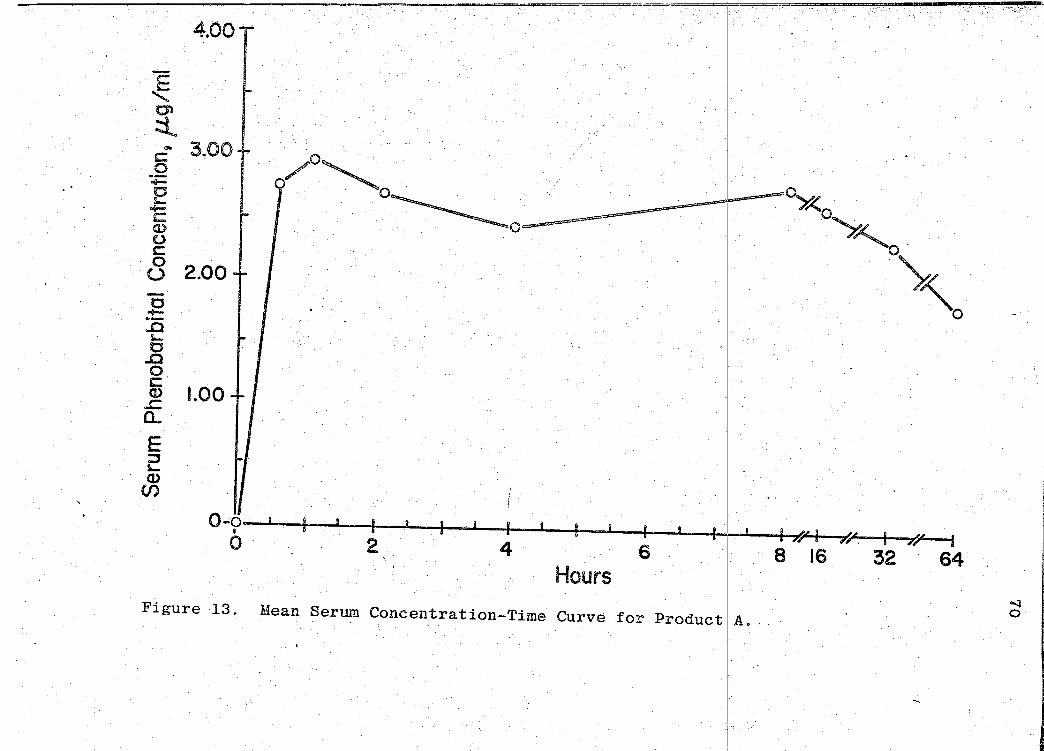
13. Mean Serum Concentration-Time Curve for Product A .. . . . . . .... . . . . . . . 70
I
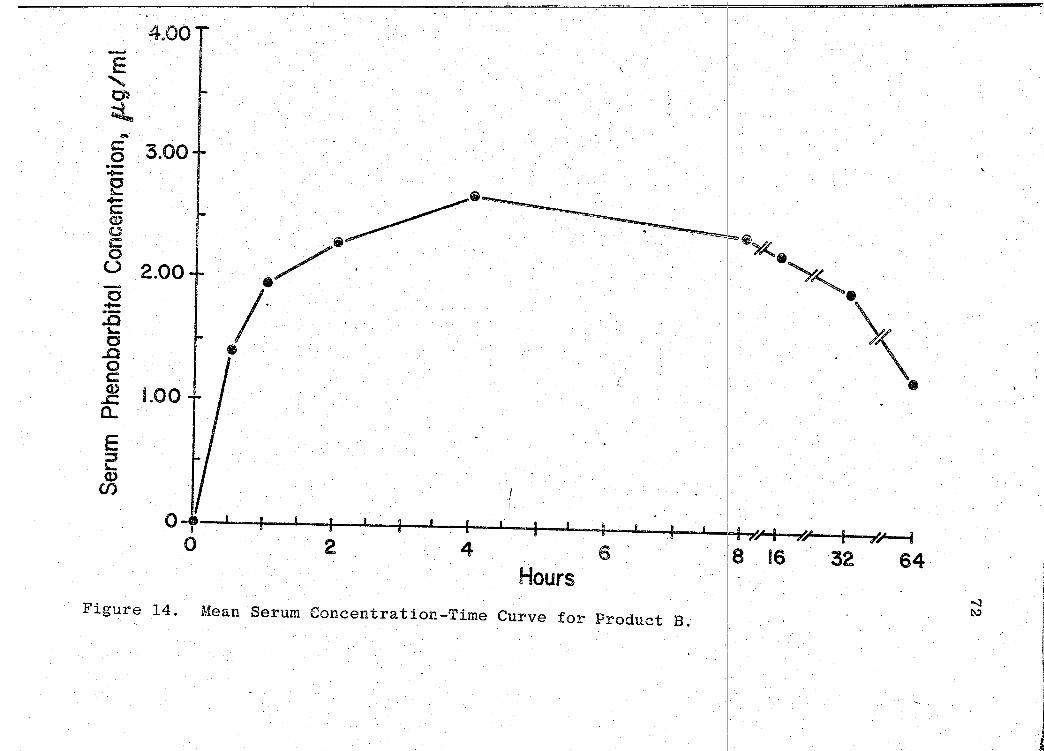
14. Mean Serum Concentration --Time Curve for Product B 72 t . . . . . . . . . . . . . . .
15. Mean Serum Concentration-Time Curve for Product c . . . . . . . . . . . . 74
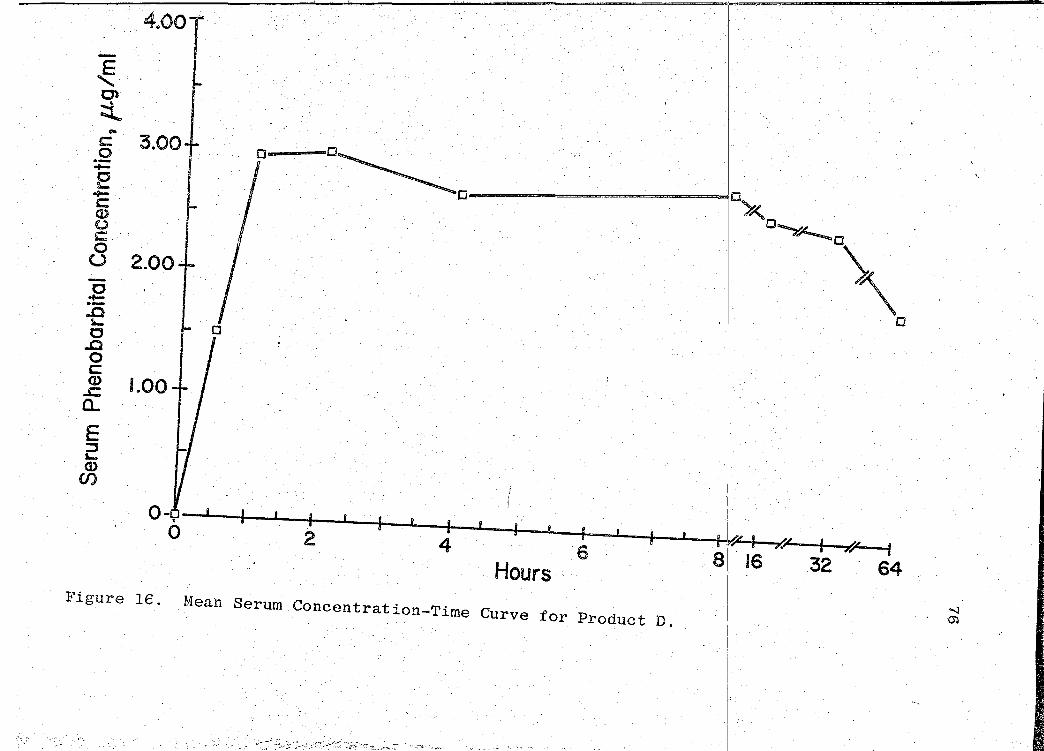
16. Mean Serum Concentration-Time Curve for Product D . . . . . . . . . . . . . . . 76
viii
Page 10
LIST 01<' FIGURES (continued)
ix
Figure Page
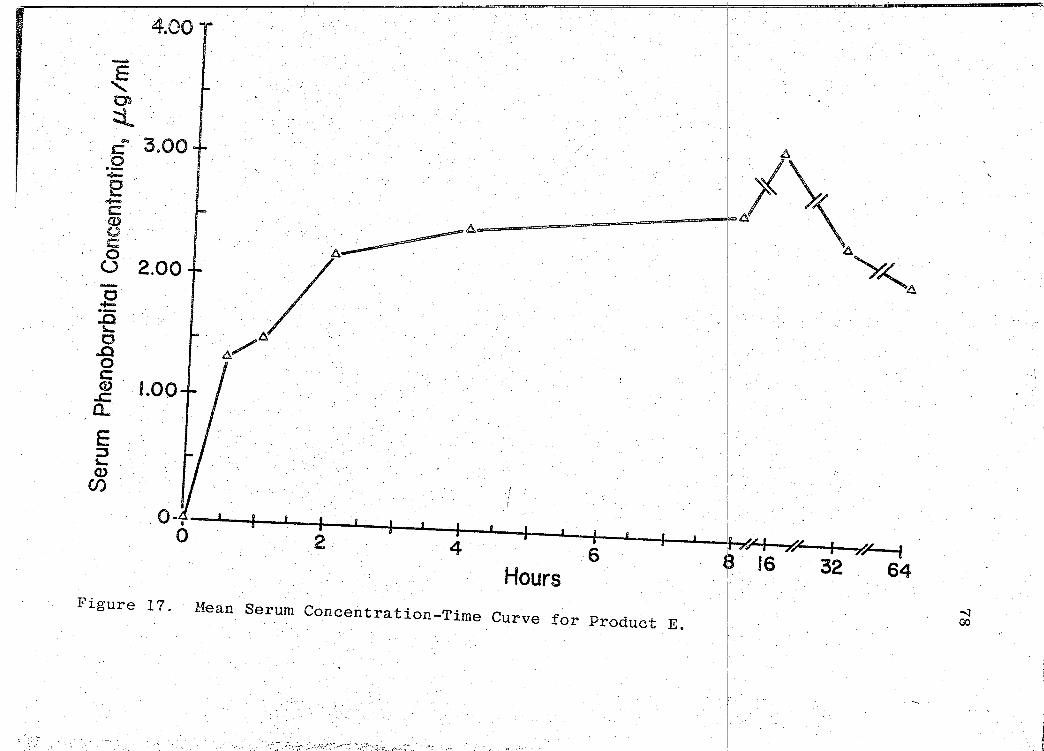
17. Mean Serum Concentration-Time Curve for Product E. • . . . . . . . . . . . . . . 78
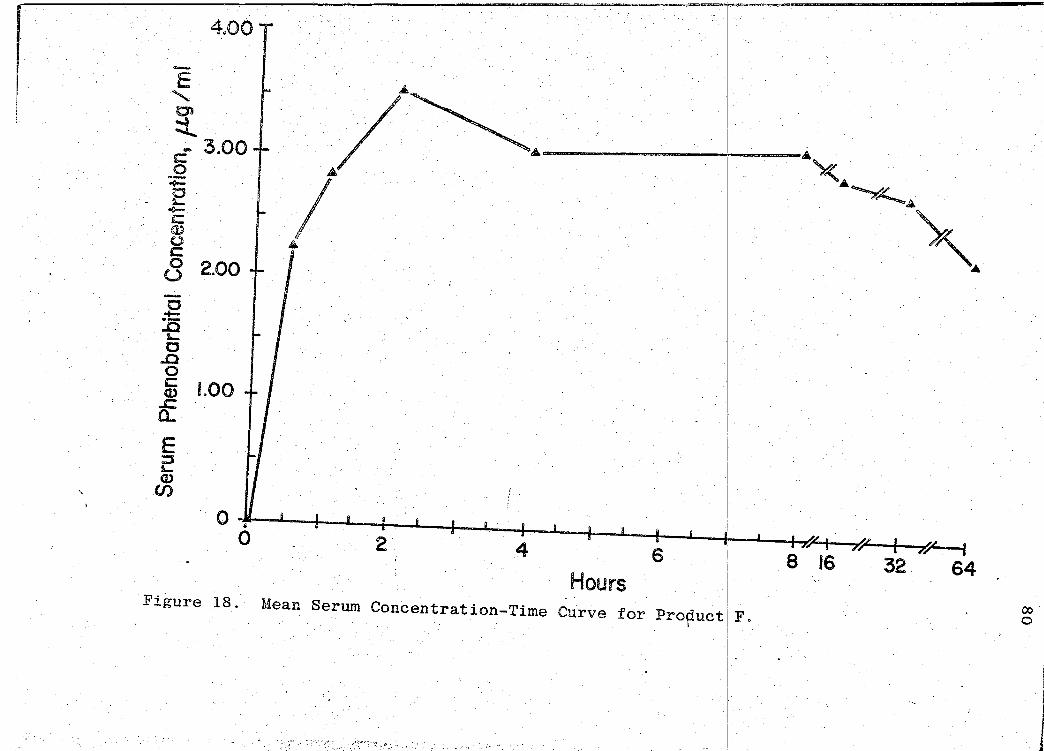
18. Mean Sertml Concentration-Time Curve for Product F. . . . ~ . . . . . . . . . . . 80
19.
20.
21.
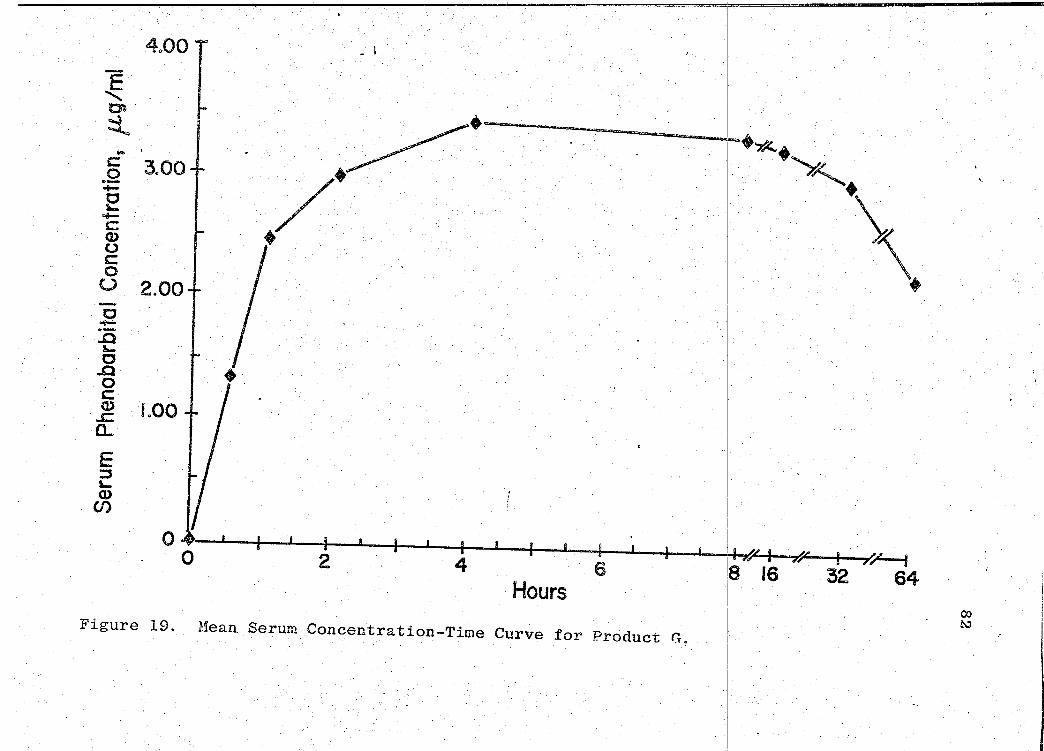
Mean Serum Concentration-Time Curve for Product G . .... ~ .......... .
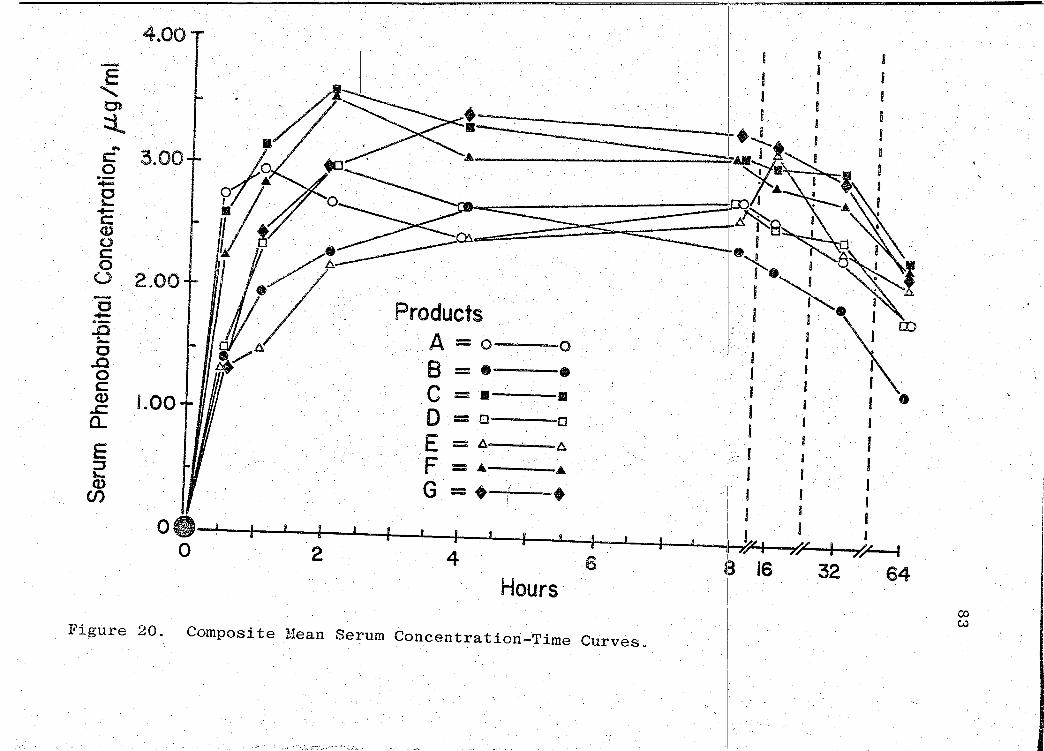
Composite Mean Serum Concentration-Time Curves . . · . . . . . . . . . . . . . . .
Composite Bar Graph of Mean Areas Under Serum Concentration-Time Curves. ~ . . .
82
83
84
Page 11
INTRODUCTION
The science of biopharmaceutics is concerned with
the relationship of the physical and chemical properties of
drugs and their dosage forms and the biological Bffects
observed following the administration of the drug product
(1). The science of pharmacokinetics deals with the study
of the time course of absorption, distribution, m.etabolism
and excretion of drugs in a biological system (2). There
fore, it is through biopharmaceutical and pharmacokinetic
research that the efficacy of all pharmaceutical dosage forms
should be determined. When the biopharmaceutical and
pharmacokinetic parameters of a drug have been fully charac
terized, then the·availability of the drug in the biological
system can be established.
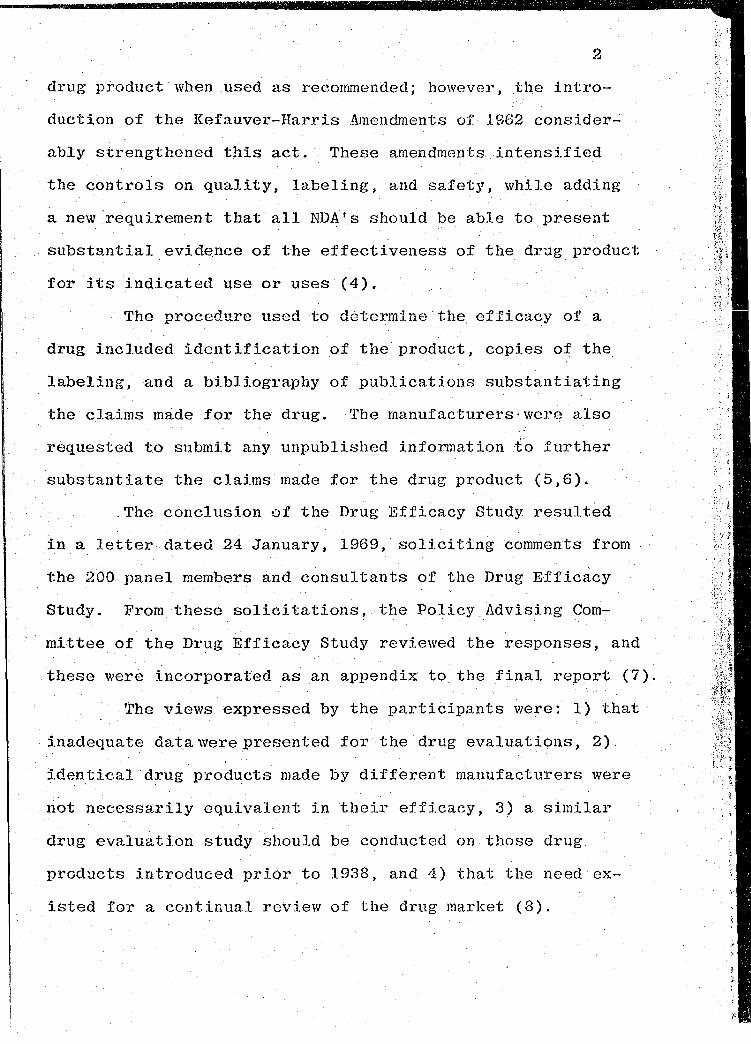
In the late 1960's, the Division of Medical Sciences,
·National Academy of Sciences, National Research Council~ con
ducted a Drug.Efficacy Study for the Food and Drug Adminis
tration (FDA). This study originated from the Kefauver
Harris Amendments of 1962 to the Food, Drug, and Cosmetic
Act of 1938. The amendments applied to all drugs that had
been introduced and marl(eted under the New Drug Applications
(NDA's) approved·within the time period of 1938 to 1962 (3).
The Food, Drug, and Cosmetic Act of 1938 required
a producer of a new drug to substantiate the safety of the
1
Page 12
2
drug product· when .used as recormnended; however, .th,e intro-
duction of the Kefauver-Harris Amendments of 1962 consider~
ably s~rengthened this act. These amendments intensified
the controls on quality, labeling, and safety, while adding
a new.requirement that all NDA's should be able to present
substantial evidence of the effectiveness of the drug product
for its indicated use or uses (4).
· The procedure used to determine the. efficacy of a
drug included identification of the product, copies of the
labeling, and a bibliography of publications substantiating
the claims made for the drug. The manufacturers·were also
requested to submit any unpublished in format ion ·fo further
substantiate the claims made for the drug product (5,6) .
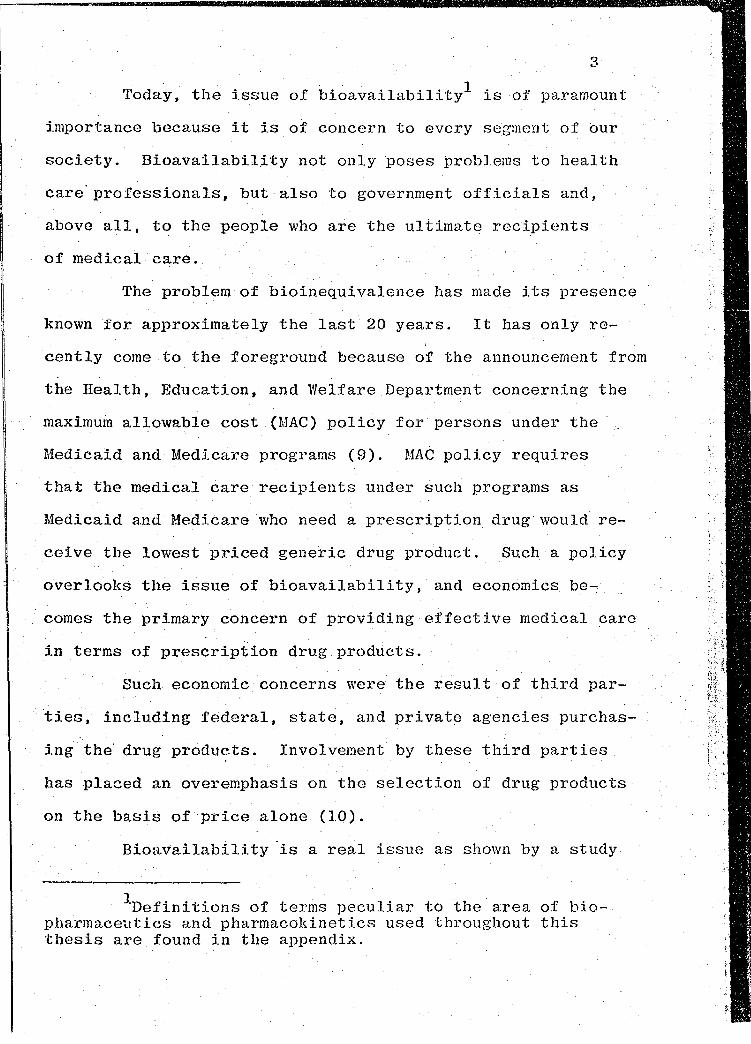
. The conclusion of the Drug Efficacy Study resulted
in a letter dated 24 January, 1969, soliciting comments from
the 200 panel members and consultants of the Drug Efficacy
Study. From these solicitations, the Policy Advising Com-
mittee of the Drug Efficacy Study reviewed the responses, and
these wer~ incorporated as an appendix to. the final report (7).
The views expressed by the partic.ipants were: 1) t.hat
inadequate data were presented for the drug evaluations, 2)
iden~ical drug products made by different manufacturers were
not necessarily equivalent in their efficacy, 3) a similar
drug evaluation study should be conducted on those drug.
products introduced prior to 1938, and 4) that the need ex-
isted for a continual reView of the drug market (8).
;'·.
!:
Page 13
3
Today, the issue of bibavailability1 is of paramount
importance because it is of concern to every segment of our
society. Bioavailability not only poses problems to health
care-professionals, but also to government officials and,
above all, to the people who are the ultimate recipients
of medical care.
The problem of bioinequivalence has made its presence
known for approximately the last 20 years. It has only re-
cently come to the foreground because of the announcement from
the Health, Education. and Welfare Department concerning the
maximu~ allowable cost (MAC) policy for persons under the
Medicaid and Medicare programs (9). MAC policy requires
that the medical care recipients under such programs as
Medicaid ahd Medicare who need a prescription drug·would re-
ceive the lowest priced generic drug product. Such·a policy
overlooks the issue of bioavailability, and economics be-
comes the primary concern of providing effective medical care
in terms of prescription drug products.
Such economic concerns were the result of third par-
ties, including f~deral, state, and private agencies purchas-
ing the· drug products. Involvement by these third parties
has placed an overemphasis on the selection of drug products
on the basis of price alone (10).
Bioavailability ·is a real issue as shown by a study
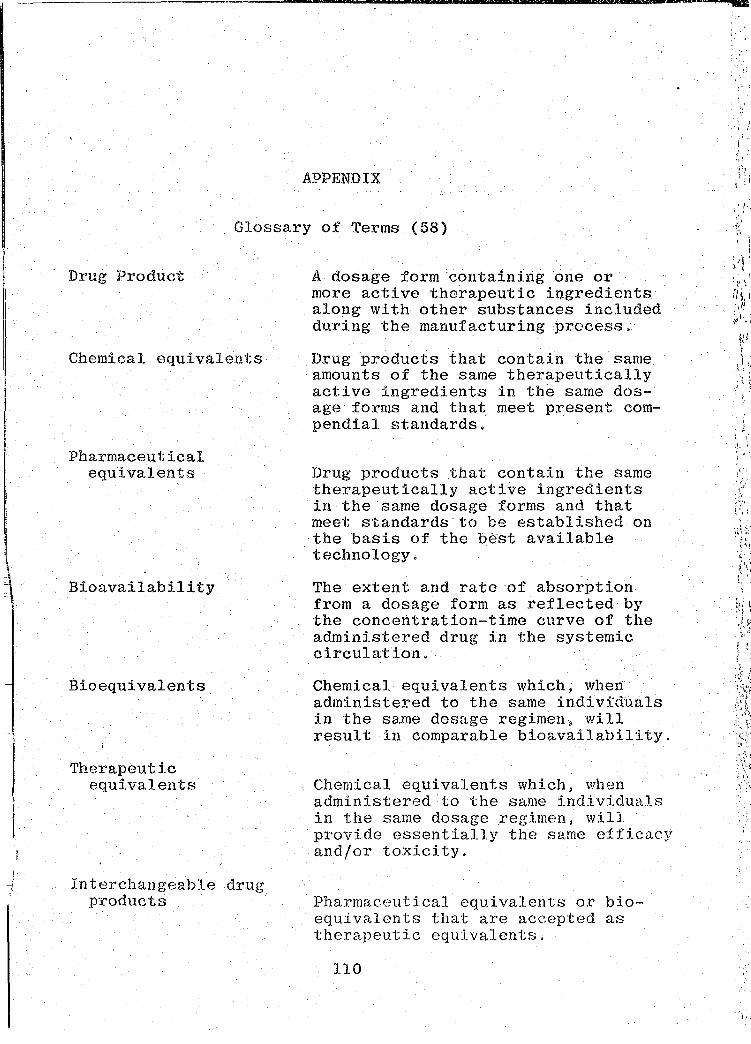
1Definitions of terms peculiar to the area of biopharmaceutics and pharmacokinetics used throughout this thesis are found in the appendix.
Page 14
4
(11) conducted on 16 different lots of oxytetracycline cap
sules, 250 mg, from 13 different suppliers, . ali of which had
been certified by the FDA. Results from this study indi
cated that all but one of the products tested had met the
standard regulatory requirements. Further analysis of these
produc.ts established that 7 out of the 16 lots produeed blood
·levels below the minimum therapeutic level of 0.6 J..lgjml. It
was observed that the lots which h~d the low serum levels
• also had a slower dissoltttion rate in vitro. An additional
study (12), involving all 11 manufacturers supplying the
United S~ates market with oxytetracycline capsules, 250 mg,
clearly revealed that chemical equivalents of oxytetracycline
were not bioequivalent.
In a crossover study (13), digoxin tablets, 0.5 mg,
from different manufacturers were orally administered to
normal human volunteer subjects. Marked differences in serum
digoxin lev~ls were observed after dosing with these various
products. In another ~tridy (14),· 2 diff~rent formulations
.of tolbutamide, both generically equivalent in t~rms of chem
.ical content and both meeting the specifications as set forth
in the United States Pharmacopeia (USP), were found to be
non-equivalent in terms of bioavailabilityor therapeutic
effica6y. Results from a study (15) involving· single lots
Of 14 different nitrofurantoin tablets which met the USP
standards showed that 2 of the lots were significantly less
bioavailable than the other products tested.
Page 15
5
Factors Affec_ting Bioavailabil~ t~
Bioavailability is a complex problem due to the many
variables associated with the development of drug dosage form
design. The bioavailability of a drug product can be in
fluenced by pharmaceutical formulation factors as well as
by the physi6logical factors of the patient taking that drug
product.
The activity of the drug at its site of action in
the body is related in a quantitative way to its concentra
tion in the blood and in other physiological fluids and to
the rate at which the body eliminates the drug. Factors
such as protein binding, storage sites~ biotransformation,
and the rate at which.the drug is made available to the
blood andf6r other physiological fluids will also affect the
activity of the drug. Therefore, for a drug to produce a
pharmacological response, it must be absorbed in sufficient
quantity and at an appropriate rate so that a minimum effec
tive concentration can be ~stabli~hed at the site of action
(16,, 17).
The gastrointestinal barrier is a highly complex struc
ture·co~posed of many chemical compounds, such as lipids,
proteins, lipoproteins, and polysaccharides. This barrier
is a semi-permeable membrane, permitting the passage of certain
substances while retarding or preventing the passage of other
substances. Since drugs are usually absorbed from the gastro
intestinal tract by passive diffusion, the rate of absorption
is then directly proportional to the concentration of the
drug in the gastrointestinal fluids (16).
Page 16
6
As an orally administered drug passes through the
various regions of the gastrointestinal· t~act, it is subjected
to many different environments with respect to pH, enzymes,
and fluidity, in addition to the various anatomical regions
that exhibit different surface properties (16,18). This is
illustrated by the fact that the large surface·area of the
small intestine is well suited to passively Rbsorbed drugs,
as compared to the stomach and colon which constitute re
gions of limited surface area (16). The varying pH range
of the gastrointestinal tract and its contents infl~ence the
am6unt, distribution, and absorption of a dissolved drug (19).
Generally, differences in therapeutic efficacy runong
drug products are most frequently due to differences in the
rate at which the active ingredient becomes available for
absorption. This variability can be attributed to differences
in pharmaceutical formulations. Formulation variables can
alter the onset, intensity, and duration of the desired
. physiological/pharmacological response; in add it ion, the
efficacy and the bioavailability may also be affected, and
the incidence arid intensity of side effect~ and toxic ·
reactioris may be altered (20). ' .
Formulation variables affect drug absorption by
either modifying the dissolution rate of the drug or by
~hangi~i the rate of absorption of the drug across a biolog
ical membrane (21). Drug availability can be controlled
by altering the various pharmaceutical formulation factors
affecting dissolution. Dissolution rate is described by
Page 17
7
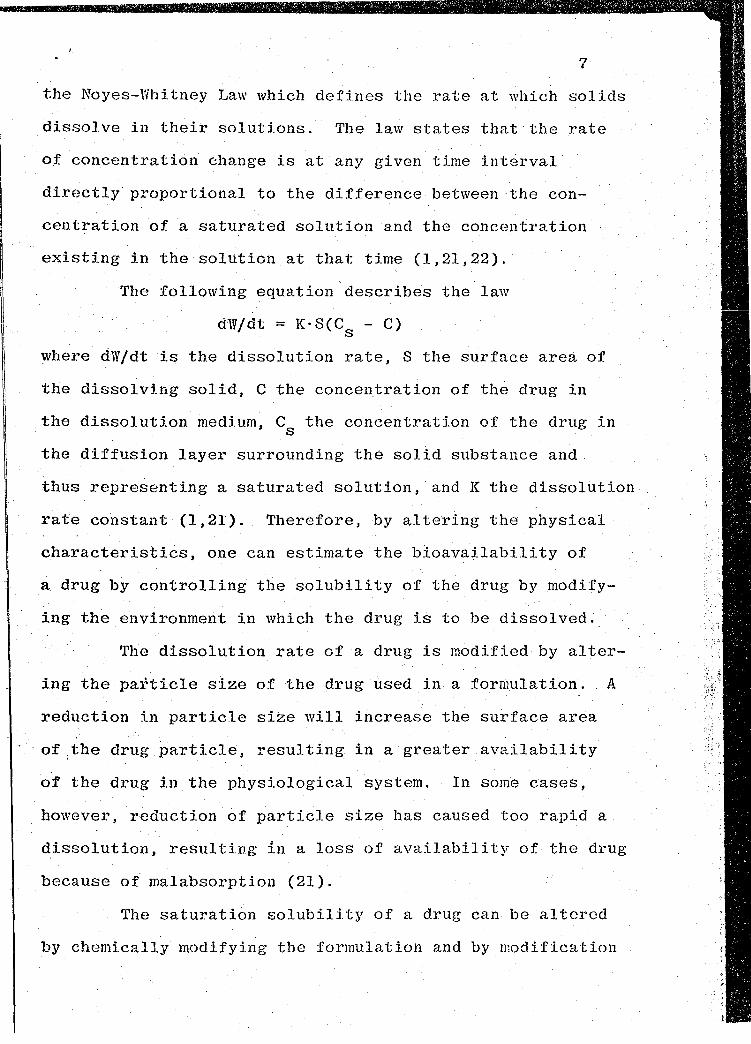
the Noyes-Whitney Law which defines the rate at which solids
dissolve in their solutions. The law states that the rate
of concentration change is at any given time interval
directly· proportional to the difference between the con-
centration of ~ saturated solution and the concentration
existing in the solution at that time (1,21,22).
The following equation describes the law
dW/dt = K·S(Cs - C)
where dW/dt is the dissolution rate, S the surface area of
the dissolving solid, C the c6ncentration of the drug in
the dissolution medium, C the concentration of the drug in s
the diffusion layer surrounding the solid substance and.
thus representing a saturated solution, and K the dissolution
rate constant (1,21). Therefore, by altering the physical
characteristics, one can estimate the bioavailability of
a drug by controlling the solubility of the drug by modify-
ing the environment in which the drug is to be dissolved.
The dissolution rate of a drug is modified by alter-
ing the particle size of the drug used in a formulation. A
reduction in particle size will increase the su~face area
of .the drug particle, resulting in a greater availability
of the drug in the physiological system. In some cases,
however, reduction of particle size has caused too rapid a
dissolution, resulting in a loss of availability of the drug
because o{ malabsorption (21).
The saturati6n solubility of a drug can be altered
by chemically modifying the formulation and by modification
Page 18
8
of the dissolution environment. The solubility of salts of
weak acids or bases is altered by adjusting the pH. In
creased availability has been demonstrated with an adjust
ment of the pH in the immediate environment surrounding
the drug by either increasing or decreasing the pH. These 2
methods can be used: 1) buffering the drug by adding a
solid basic substance to the formulation or 2) fashioning
the drug into its sodium salt (21).
Polymorphic structures of a subst~nce have different
melting points~ molecular arrangements, and solubility
characteristics exhibiting different stabilities and avail
abilities when in solution. The crystal form with the
lowest free energy is the most stable polymorph, while the
form w~th the highest free energy is the most unstable.
From a pharmaceutical viewpoint, the metastable polymorphs
of a subst:u1ce are preferred. They exhibit greater solu
bilities and dissolution rates compared to the stable forms
of the same compound (23).
Other physical properties of the active ingredient
must be considered in pharmaceutical formulation. It has
been sho~n that the amorphous forms of a dru~ are more
soluble than crystalline forms .of the same drug, resulting
in marked differences in the rate of a pharmacological
1·esponse ( 24).
Solvated and non-solvated forms of a drug must also
be considered. It has been shown that drugs form solvent
addition products called solvates. Solvated forms of a drug
Page 19
9
exhibit differences compared to their anhydrcn3.s equivalents
with respect to dissolutiQn rate and the drugs' availability
(21,24).
Adjuvants in pharmaceutical formul~tions can affect
the dissolution rate of the active ingredient in a dosage
form, even though an adjuvant has been defined as a sub
stance &dded to a formulation.that is not intended for medic
inal effect nor intended t6 alter or control drug availability.
Adjuvants may be disintegrating agents, fillers, lubricants,
binding agents, emulsifying agents, or suspending agents.
It has been shown that an adjuvant increases the total
solubility of the dosage form by influencing hydrogen ion
concentration at the face of the barrier.immediately adjacent
to the surface of the solid. This increase iri solubility·
results in an increase in the rate of solution and there~
fore makes the drug more available (24).
Anothe~ phenomenon associated with pharmaceutical
formulation is adsorption. Adsorptiori occurs when the active
ingredient in a dosage form adsorbs onto the surface of a
solid adjuvant resulting in a decreased bioavailability of
the drug. Complex· formation has also been observed between
the active ingredient and adjuvants resulting in enhance
ment or hindrance of the availability of the active ingredient
because this phenomenon can lead to changes in the solu
bility and absorbability of the active ingredient (24).
Lubricating agents used in pharmaceutical formula
tions are substances that a:re generally water insoluble and
Page 20
10
water repellant. Such lubricating agents_decrease the dis
solution rate of the active ingredients. This decrease in
dissolution r~te is a result of inadequate c6ntact between
the active ingredient and the physiological fluids~ How
ever, a water soluble lubricant like sodium lauryl sulfate
can significantly increase the bioavailability of drugs (24)~
The clinical efficacy.of a drug can be modified by
the rate and extent of absorption of an active ingredient
from a drug formulation as it enters into the systemic cir
culation. Evidence has shown that the absorption character
istics of a drug product, and the therapeutic performance of
the drug is markedly affected by the substances and methods
used in the manufacturing process (16). Consequently, phar
maceutical drug formulations cannot be considered therapeu
tically equivalent only because they contain the same amount
of active ingredient or ingredients and comply with accepted
official standards. Drug products exhibit differences in
bioavailability, resulting in different clinical responses
{21).
'fhe bioavailability issue is a perplexing problem.
In order to compare dosage forms of drug products, one must
consider the following points: 1) characteristics of the
pharmaceutical formulation, 2) manufacturing procedrires,
and 3) possible interaction of other components in the
formulation with the active constituent in the drug pro
duct (25).
Page 21
11
Compendia! Standa~ds
It is generally accepted that compliance with com-
pendial standards assures chemical equivalency; however,
such compliance does not assure therapeutic equivalency.
Consequently, it is essential that additional standards
and specifications be established to control the thera-
peutic equivalency of drug products (25).
The Content Uniformity requirement is a means of
demonstrating the uniformity of the content of the active
drug substance or· substances in solid dosage forms. This
requirement serves as a means of assurance that successive
units from a given container will contain equal amounts of
th~ drug. The Content Uniformity test is required for all
tablets of the 50 mg size or smaller. However, tablets
larger than the 50 mg size need not meet this requirement,
because there seems to be little need to add this require-
ment to the testing of tablets that contain relatively
little diluent or excipient and can therefore be controlled
satisfactorily through the Weight Variation test. On the
other ·hand, weight variation is not an indication of con-~-
tent u~iformity when the drug substance comprises a rela
tively minor portion of the tablet or when the tablet.is
coated (26,27).
Disintegration ~epresents an important character-
istic of tablet dosage forms and usually occurs before the
active constituent of the tablet can dissolve and ulti-
mately be ab~orbed. The Tablet Disintegration test was
~-
Page 22
·,
12
the first attempt to establish an :lndieator for·the avail-
ability of a drug for absorption into the systemic cit·-
culation (25). The term disintegration, however, does·
not imply complete solution of the tablet or its active
constituent (28).
This test has proven to be useful as a qualit~ con-
troi procedure for compressed tablets; however, it does
have limitations. Passing the test ohly assures that the
tablet has broken up into small particles ~ithin an estab
lished period of time~ The Disintegration test does not
-give assurance of a satisfactory rate of solution of the
active medicament from the tablet. It becomes an important
consideration if the drug has a low solubility: or is slowly
.soluble~ The Disintegration test does not take into ac-
count the possibility of an interaction occurring between
the tablet excipients and the active constituent, com-
plexing the .active drug, resulting in an inactive, insoluble
drug-complex. It has been reported that a drug must be in
solution before.it can be absorbed; consequently, a tablet
rna~ prove ineffective from a clinical consideration, though
it rnee~s the specifications of the Disintegration test. I
'rhus, compliance with the requirements of the Disintegration
test is not necessarily an indication of therapeutic effi~
cacy (25). Therefore, suitable dissolution char·acteristics
are an important property of a satisfactory drug product (29).
The Dissolution test is a quantitative method for
determining the dissolution characteristics of a solid dosage
i. ~:
Page 23
13
form. It is a method of deierminin~ the quantity of drug
that dissolves within a designated time period in a specified
volume of fluid in which the dosage form is immersed and
agitated under carefully contr6lled conditions. 'I'his test
permits the evaluation of the biological equivalency of chem-
ical equivalents, when correlation has been shown between
in vitro dissolution rates and data obtained from normal human
subjects through blood level or urinary excretion studies
{25,30).
Compressed tablets are the most widely used of all
the dosage forms, and they present the most problems in re-
gard to the bioavailability of the active component. This
is especially true for those compressed tablets that contain
drugs with a low solubility, a low rate of solution, drugs
which exhibit poor absorption characteristics, drugs which
are·uustable in the gastrointestinal environm~nt or drugs
that are used in large dosage (25).
BioavailabiJ.ity Protocol·
rrhese above considerations make it clear that experi-
mental data regarding bioavailability needs to be obtained
for tablet dosage forms. Useful data can be obtained when
" the e·xperimental design protocol follows certain criteria.
Protocol usuall~ requires a crossover study utilizing 10-20
normal healthy human adults ranging in age from 20-40 years
who are within 10% of their ideal body weight. Individ-
uals with a history of gastrointestinal, liver, or kidney
Page 24
14
disease or any other significant organ abnormality or
disease and individuals who requi~e anj medication bn a daily
regimen or who have a hypersensitivity to the drug being
studied must be excluded from the protocol. All of the
subjects must begiven physical examinations within 30
days before the initiation of the study, and appropriate
clinical pathological laboratory tests must be performed
{31,32,33).
Depending on the objective of the bioavailability
study~ diet arid fluid intake may be controlled. At specified
time intervals blood and/or urine samples are collected
and analyzed quantitatively to determine the amount of
active ingredient or ingredients present. The analytical
data obtained is then evaluated for therapeutic levels of
the active ing~edient or ingredients (31).
The significance of a bioavailability study ~s
established when a correlation is demonstrated between the
blood levels achieved using a drug already shown to b~
clinically ~ffective and the drug product being tested (34).
This type of relationship tendsto indicate that the drug
produc~ being tested would be therapeutically .equivalent
to the reference drug product (35).
Bioa~ailability data is necessary for the estab-
lishment of therapeutic equivalency among drug products.
Consequently, bioavailability data should be compiled for
all drug products; particularly for those drug products
most often prescribed.
Page 25
The Need to Establish the Bioavailability.of P~obarbital Tablets
15
Phenobarbital tablets have been listed among the
top 5 generic products, by new prescription volume, for the
last 4 years. In addition, phenobarbi~al tablets have also
been the leadin~ drug product among the top 20 generic pro-
ducts by refill prescription volume over the last 4 years.
Of the top 20 g~neric products by new and refill prescrip-
tion volume, phenobarbital products have ranked among the
top 3 for the past 4 years. Furthermore, phenobarbital tab-
·lets have been listed among the top 4 drug products in a
list of the average retail new prescription prices of the
top 20 generic products in the last 4 years (36).
From a physiochemical·basis,.the bioavail~bilit~
of phenobarbital tablets has been suspect. Phenobarbital
is soluble"~ta the extent of 1 g in 1000 ml of water, which
represents a value of 0.100% wfv. However, Sedam, Gennaro
and Osol (37) showed that at 28° phenobarbital was soluble
to the extent of 1 g in 783 ml of water, which repreients
a value of 0.128% wfv. Similar studies have shown that at
25°; phenobarbital exhibited solubilities of 0.109% wfv,
0.120% ~fv, 0.110%.w/v, and 0.130% wfv (38,39,40,41). These
differences in the solubility of phenobarbital at 25° may
affect the dissolution iate of phenobarbital, the rate of
absorption of phenobarbital into the systemic circulation,
and ultimately the bioavailability of phenobarbital tablets.
It has been reported that phenobarbital has exhibited
lilUCJJI!it@&WWJZ&i&WZ.Z us a a
Page 26
16
13 polymorphic forms (19,42,43). Clements and Stanski
(43) demonstrated differences in the dissolution rates of
4 polymorphic forms of phenobarbital. They showed that·
Forms III and IV had faster dissolution rates than Form
II and that Form XIII had a similar dissolution rate to
that of Form II. The metastable forms of phenobarbital
were found to dissolve at a faster rate than the stable
form. This observation is expected because the free energy
of the metastable polymorph exceeds that of the stable form.
·Since the di~solution rate is rel~ted to the solubility as
demonstrated by the Noyes-Whitney equation, the metastable
form would thus be expected to show a faster rate of dis
solution. Therefore, the dissolution rates of the poly
morphic forms of phenobarbital have been us~d to determine
the diffe~ences in the rate of absorption from the gastro-
intestinal tract and in the prediction of their bioavail
ability when incorporated into pharmaceutical formulations.
Jacob and Plein (44) demonstrated the need for de
termining the bioavailability of phenobarbital tablets. In
their study, the USP XVII Tablet Disintegration test was
performed on 42 lots of phenobarbital tablets. Of the 42
lots tested, 1 lot failed the test using the disks, whereas
12 lots of tablets failed the test without the disks. How
ever, the dissolution data in this study showed that 13 lots
of tablets failed to release 100% of the phenobarbital into
the simulated gastric fluid within 30 min. At the end of
60 min, 3 lots out of the 13 lots of tablets did not release
Page 27
1.7
50% of the drug. In fact, l manufacturer showed consider-
able tablet-to-tablet variation in dissolution rate. These
same 13 lots were then subjected to the Dissolution test in
an alkaline medium buffered at pH 9~5. In spite of the
fact that phenobarbital is soluble at pH 9.5, 11 out of the
13 lots of tablets did not release 100% of the phenobarbital
·in 30 min. The differences observed in the dissolution rates
of these various lots of commercial phenobarbital tablets
were attributed to pharmaceutical formulation factors.
Jacob and Plein (45) also demonstrated that phar-
maceutical formulation factors are of significant importance
in altering the bioavailability of phenobarbital tablets.
The data fromthis study showedthat an increase in binder
concentration and hardness of compression resulted in a
decrease in the dissolution rates of phenobarbital tablets.
It was reported in a study by Solvang and Finholt
(46) that the rate of release of phenobarbital from granules
and tablets prepared with gelatin as a granulating agent
was faster than the rate of dissolution of the pure drtig .
. In addition, phenobarbital showed a hi~her rate of release
from the tablets than from the granules. The slower rate of
release of the phenobarbital from the granules was postu-
lated to be caused by the compression process which leads to
deformatjon or crushing of the granules, increasing the
spe~ific surface area of the granules and concomitantly
increasing their rate of dissolution. This study demonstrated
. ~· '
Page 28
18
the fact that the rate of dissolution of phenobarbital from
tablets prepared with gelatin as.a granulating agent in-
creased with decreasing particle size of the drug. Further-
more, it also showed that phenobarbital tablets prepared with
gelatin as a granulating agent dissolved much faster in
human gastric juice th.an tablets prepared with other types
of binding agents examined. The author$ found that gelatin
makes the hydrophobic surface of the drug particles hydro-
philic, whereas other binders examined converted the drug
into the less hydrophilic form or produced a complex re-
ducing the solubility of phenobarbital. The results obtained
from this study reinforced the fact that pharmaceutical
formulation variables are of extreme importance, for these
variables not only alter the dissolution rate of phenobar
bital tablets, but also ultimately affect the bioavailability
of phenobarbital tablets.
The incomplete data available on phenobarbital tab-
lets indicated the necessity for determining the physical
properties and the bioavailability of these products. There-
fore, Phenobarbital Tablets, USP, 100 mg,.were obtained from
7 manufacturers to characterize the physical properties of
tablet weight, hardness, disintegration time, and dissolu-
tion rate; to determine the bioequivalency, bioavailability
studies were conducted employing 5 normal, healthy human
adult male subjects.
t L
Page 29
MATERIALS AND METHODS
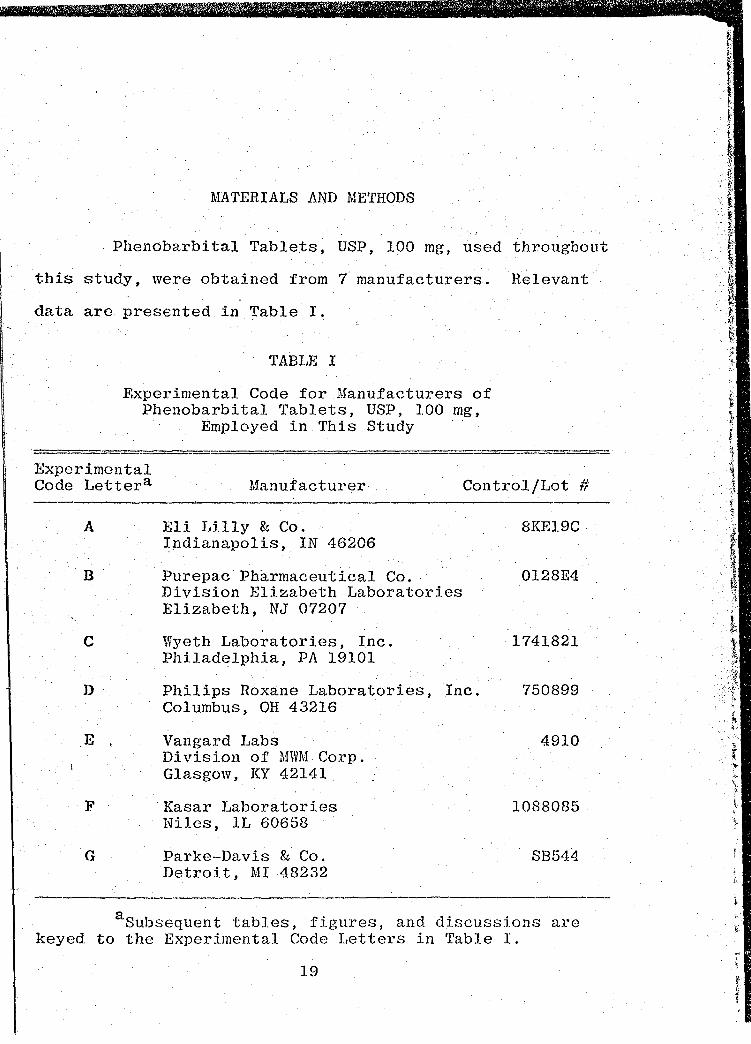
Phenobarbital Tablets, USP, 100 mg, used throughout
this study, were obtained from 7. manufacturers. Relevant
data are presented in Table I.
TABLE I
Experimental Code for Manufacturers of Phenobarbital Tablets, USP, 100 mg,
Employed in This Study
Experimental Code L~ttera Manufacturer Control/Lot #
A Eli Lilly & Co. 8KE19C ~ndianapolis, IN 46206
B Purepac Ph~rmaceutical Co. . 0128E4 Division Elizabeth Laboratories Elizabeth, NJ 07207
C Wyeth Laboratories, Inc. 1741821 Philad~lphia, PA 19101
D
E
F
G
Philips Roxane Laboratories, Inc. Columbus, OH 43216
Vangard Labs Division of MWM Corp. Glasgow, KY 42141
Kasar Laboratories Niles, IL 60658
Parke-Davis & Co. Detroit, MI 48232
750899
4910
1088085
SB544
aSubsequent tables, figures, and discussions are keyed to the Experimental Code Letters in Table I.
19
Page 30
20
Determination of Physical Properties
· We"i·ght
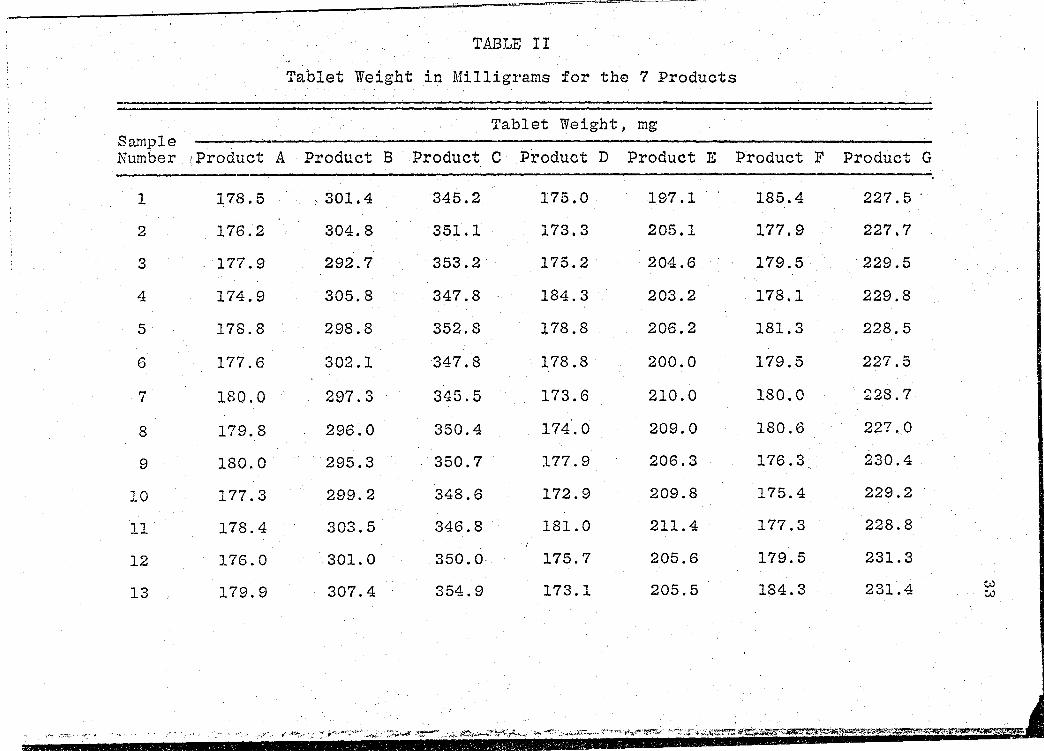
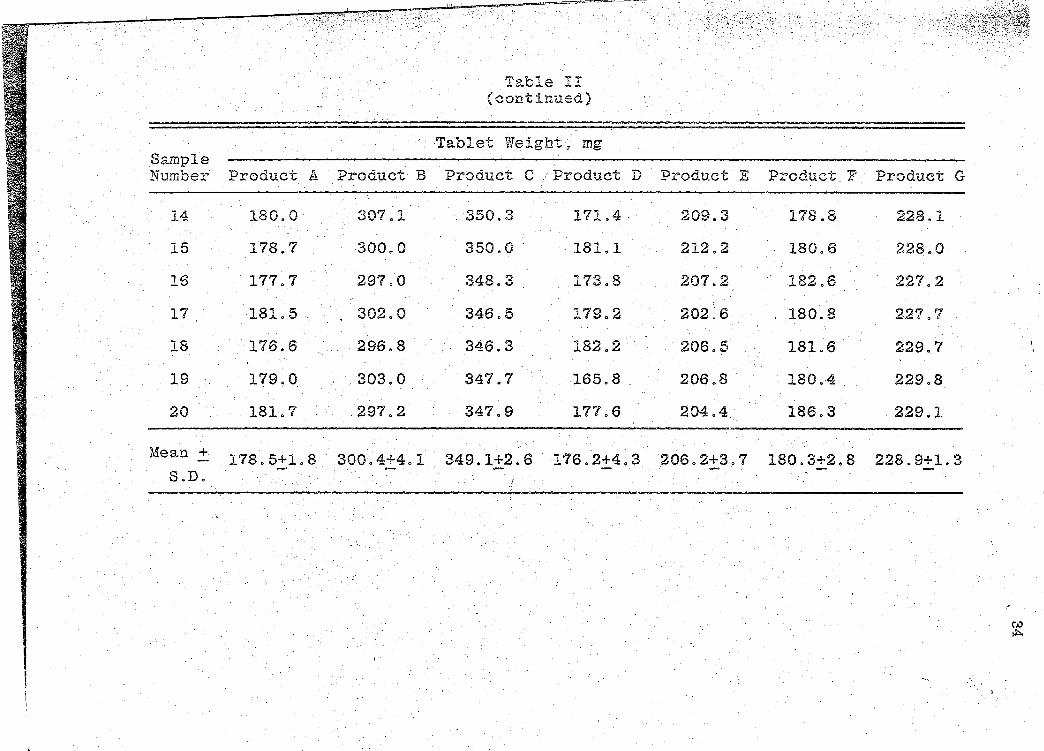
The weight o;f 20.individual whole tablets of the
same batch from each manufacturer were determined using an
analytical balance, their weights recorded in milligrams
and mean weight, and standard deviation calculated. ~he
tablet weight data are presented in Table II (~. 33).
These weight determinations were tested by the USP
XIX Weight Variation test for uncoated tablets (47). This
test provides limits for permissible variations in weights
of iridividual dosage units, e~pressed in terms of the per-
centa.ge difference from the mean weight of a sample. · The·
resUlts from the Weight Variation tests are presented ·in
Table III (p. 35).
Hardness
The hardness of 20 individual whole tablets of the
same batch from each manufacturer were determined by using
the.Schleuniger Tablet Hardness Tester, 1 an electrohically !
calibrated instrument operating on the counter-weight
principle. The hardness for each tablet was recorded in
kiloponds (kp) and the mean hardness and standard deviation
1Rr. K. Schleuniger & Co., Universit~tstrasse 87,
CH-8033 Zurich.
Page 31
21
calculated. These tablet hardness determinations are pre-
sented in Table IV (p. 37).
Disintegration
The Disintegration test as prescribed in the USP
XIX for uncoated tablets (48) was used on the tablets from
each manufacturer. The disintegration times were recorded
in minutes. The results from the Disintegration tests are
presented in Table V (p. 39).
Dissolution
Preliminary Experiments - If a 100 mg phenobarbital
tablet were to dissolve completely in a 1000 ml of simulated
gastric fluid, a maximum phenobarbital concentration of 0.10
mgjml would be obtained. Therefore, a solution of this
above concentration was accurately prepared and scanned in
2 an ultraviolet-visible scanning spectrophotometer. The
scan obtained is shown in Fig. 1 (p. 40). It was obvious
that the maximum absorbance was between a wavelength of
200-228 nm, and that the absorbance was g~eater than 1.5
{beyond the available scale of the chart range). Since an ,,
absorbance greater.than 1.0 can alter the sensitivity of
spectrophotometers operating in the ultraviolet region, it
was then decided to see if an ascending shoulde~ reading
could he employed to analyze the phenobarbital tablets in
later analyses. Upon further evaluation of the scan it was
2Model 202, Perkin-Elmer, Norwalk, CT 06856.
\ l ' ;
Page 32
22
noticed that an absorbance (A) of approximately 0.67 was.
obtained on the asce~ding shoulder of the scan at a wave-
length (A) of 240 .nm (see Fig. 1, p. 40). With this in-
formation, it was then decided to see if Beer's Law applied
at this wavelength. Solutions of known concentrations of
phenobarbital were prepared and their absorbances recorded
at 240 nm (Table VI, p. 41). It was observed that Beer's
Law was substantiated at this. wavelength as demonstrated
by the line~rity of the standard curve (Fig. 2, p. 42).
Therefore, ·in all later experiments, absorbances were re-
corded at 240 nm ..
Standard Curve - The standard curve was prepared
by making solutions of different known concentrations of
phenobarbital using simulated gastric fl~id as the solvent·.
A stock solution of 0.10 mgfml phenobarbital 3 was accurately·
prepared. The following concentrations were prepared using
the stock solution: 0 .. 01, 0.02, 0.03, 0.04, 0.05, 0~06,
0.07, 0.08, and 0.09 mgfml. The absorbances for these var-
ious solutions were determined at 240 nm with the slit pro-.
4 gram selector of the Beckman Spectrophotometric System in
the normal positiol:J..
Method of Analysis - The Dissolution tests were
performed by using the Beckman Spectrophotometric System,
3Lot # SVY, Mallinckrodt Chemical Works, St. Louis, MO 63147.
4 Model 25-7, Beckman Scientific Instruments, Fuller-ton, CA 92634.
Page 33
23
an analytical instrument specifically designed for tablet
dissolution testing. This system is outfitted with a water
bath for controlling the temperature within the vessels
containing the dissolution fluid. Within and upon the
water bath rests the multiple spindle and dissolution
vessel apparattis. The multiple spindle drive unit provides
for 6 tablet basket assemblies to be in operation simulta-
neously. thus allowing all 6 tests to be accomplished at
one time. This system contains a multichannel pump which
allows solution from each of the 6 vessel~ to be ,con-
tinously sampled to a· series of flow cells contained with-
in an automatic sample changer for spectrophotometric read-
ings. The automatic sample changer contains a temperature
control device that allows the samples in the flow cells to
be maintained at the same temperature as is the fluid in
the ·dissolution vessels. The sample changer accommodates
-7 cells, permitting continuous monitoring of the 6 tablet
dissolution vessels plus an additional cell for a blank or
for a theoretical concentration standard, thus allowing
the results to be recorded on a strip-chart representing
sample,absorbance or concentration (49).
The Dissolution tests were run at 37° + 0.5° in a
1000 ml of simulated gastric fluid (pH l. 2) which is pre
pared by mixing 7.0 ml of concentrated HC1 5 with sufficient
5Lot # WCLL, Mallinckrodt Chemical Works, St. Louis, MO 63147.
Page 34
24
distilled, deionized water to make 1000 H1.1.. The spindle
basket assembly was rota ted at 50 rpm. 'I'he pump, which
continuously circulated the samples from the dissolution
vessels through the flow cells and back again, was set for
a flow rate of 2.5 ml/min. The concentrations of the sam-
pies were determined at 240 nm and directly recorded on
the strip-chart (see Fig. 3, p. 43), moving at a speed of
0.5 in/min. The slit selector was programmed at normal
position with reference to a theoretical concentration
standard of 0.10 mgfml. The readings were taken at 5 miri
intervals during a period of 90 min with a dwell time of
10 sec for each sample.
In order to prevent tablet fragments from passing
into the flo~ cells, each dissolution vess~l was fitted
with a cellulose_ acetate filter with a pore size of 3 11
in diameter.
The dissolution data obtained from the strip-chart
readouts are ·presented in Tables VII-XIII (pp. 44, 47, 50,
53, 56, 59, 62). The mean dissolution profile curves are
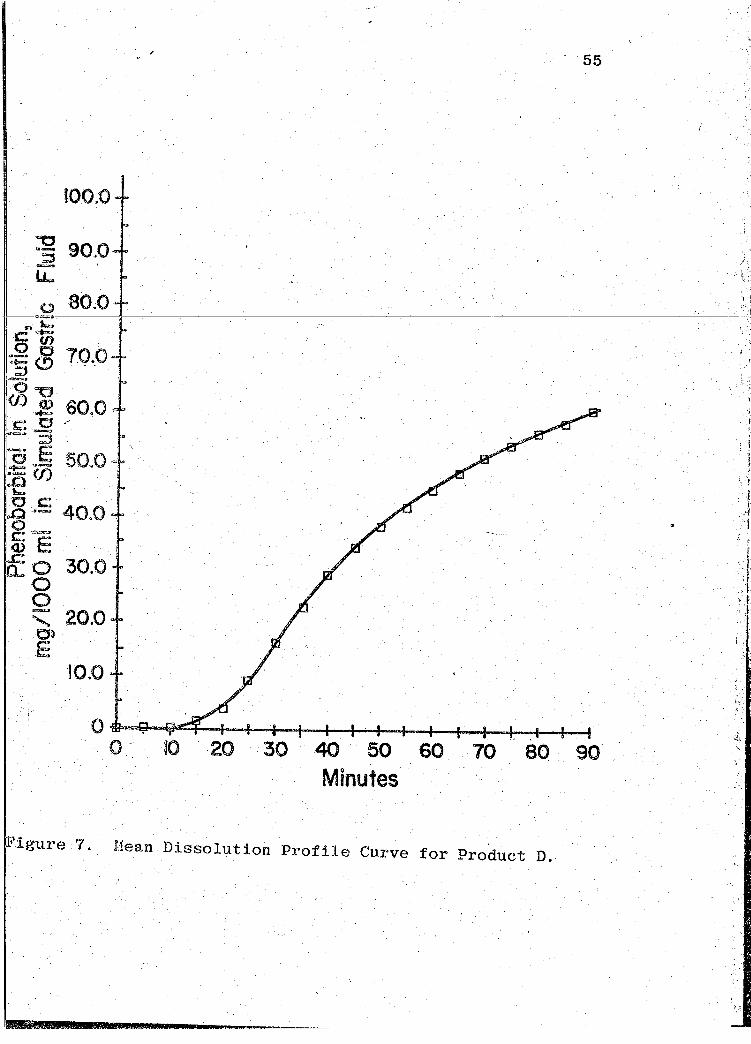
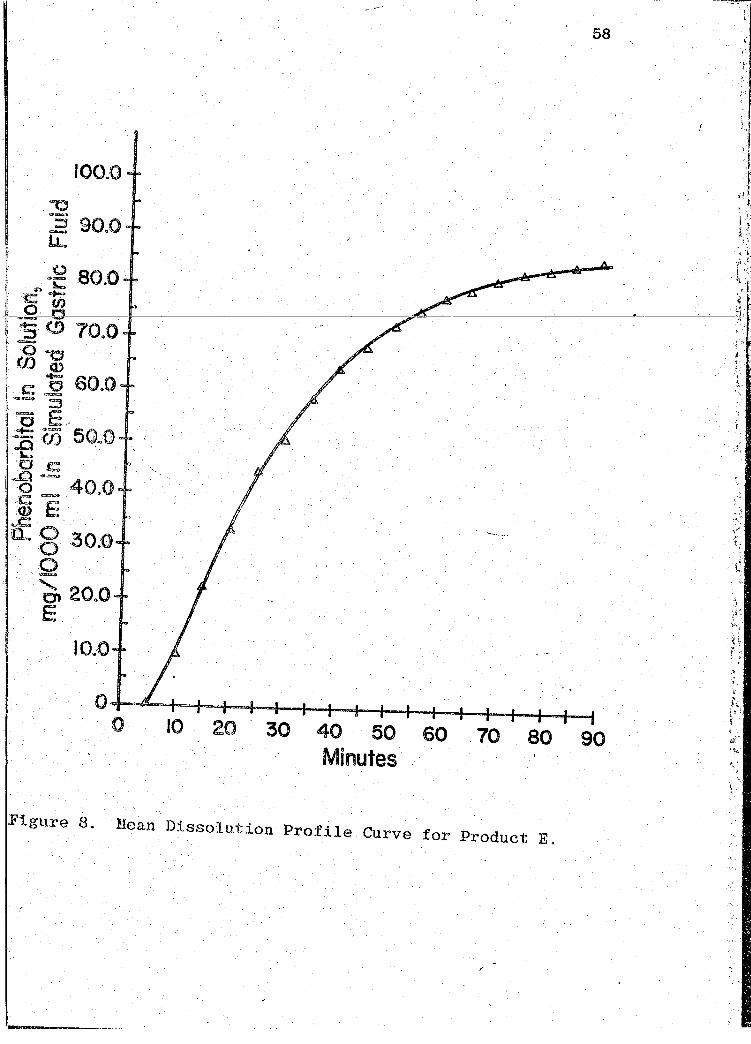
illustrated in Figs. 4-10 (pp. 46, 49, 52, 55, 58, 61, 64).
A composite graph of the mean dissol~tion profile curv~s
for the 7 products tested in _this study is shown in Fig. 11
(p. 65). A summary of the results of the physical property
data obtained is presented.in Table XIV (p. 66).
-~
,, 1
Page 35
25
Part II
Bioavailability Study
To determine the bioequivalency of the various
phenobarbital tablets, the following study was conducted.
Experimental Desig~
An incompletely randomized crossover study was em-
played to compare the bioavailability.
Experimental Protocol
In this study, 5 normal, healthy human adult male
subj ects6 v,rere employed: mean age 23.6 years (range 21-28
y.ears), mean weight 78.4 kg (range 61-94 kg), and a mean
height 183 em (range 173-193 em). Prior to the study,
each subject 0is given a gene~al ph~sical examination and
urine analysis7 and complete blood chemistry analysis
(~MA 12/60). 8 The subjects were instructed not to ingest
any drugs or alcohol for 48 hr prior to commencing the
study and also·to abstain from ingesting any other drugs
or alcohol throughout the duration of the study.
6 Recruited from the student body of the University of the Paci.fic School of Pharmacy, Stockton, CA. 95211.
7univ~rsity of the Pacific Cowell Health Center, Stockton, CA 95211.
8spencer Laboratories, 438 McCloud, P. 0. Box 4488, Stockton, CA 95204.
Page 36
26
The subjects were divided into 2 groups: Group A,
2 subjects and Group B, 3 subjects. A single 100 mg pheno
barbital tablet was orally administered with 240 m1 of water.
T.he subjects were instructed to fast from the prior evening
meal until 2 hr after ingesting the tablet. Different pro-
ducts were given to each group; the subjects in each group
received the same products with a 6 day lapse between the
administration of the various products. This procedure was
repeated every we.ek for 7 consecutive weeks until both groups
had received the phenobarbital t·ablets from each manufac-
turer.
Blood samples were drawn by the fingertip method
at intervals of 0.5, 1.0, 2.0, 4.0, 8.0, 16.0, 32.0 and
64.0 hr post-dosing. The samples were coll~cted in 6
heparinized microcapillary tubes, centrifuged and refrig-
erated until the serum samples could be assayed by the (
"Enzyme Multiple Immuno~ssay Technique"(EMIT)9 for pheno-
barbital content.
The EMIT As~ay System
Principle - The EMIT assay procedure is a homo
geneous 'enzy1ne immu~oassay technique used for the micro
analysis of specific compounds in biological fluids.
----------·-------9
"El\!IT" is a registered trademark of the Syva Corp., Palo Alto, CA 94304.
Page 37
27
To perform the EMIT Phenobarbital Assay th~ fol-
lowing are required:
1) the EMIT Phenobarbital Assa~ Kit which consist of:
a. Reagent A (lyophilized antibody/substrate) contains antibodies made igainst a phenobarbital derivative. The antibodies are formed by chemically coupling the drug to a macromolecular carrier and immunizing · · sheep or goats with the resulting antigeri. The antibody/substrate preparation when re~onstituted contains a standardized preparation of the immunized sheep or goat gamma globulin, the enzyme substrate g1ucose-6-phosphate (EC 1.1.1.49), and nicotinamide adenine diriucleotide, and preservatives in 0.055M Tris HC1 buffer at pH 5.0.
b. Reagent B (lyophilized enzyme) is prepared by chemically coupling phenobarbital to glucose-6-phosphate dehydrogenase. The reagent when Teconstituted contains the enzyme-labeled ph~nobarbital and preservatives in 0.055M Tris HCl buffer at pH 7.9 and has been standardized to match Reagent
. A~
c. Buffer concentrate containing a surfactant wh,ich upon reconstitution results in a 0.~55M Tris HCl pH 7.9 buffer solution.·
2) the EMIT Drug Calibrators consist of a set of 6 vials of lyophilized serum base preparations.
3) the EMIT Control is a vial of lyophilized base preparation.
· This assay- procedure requires a drug to be· labeled
to an enzyme. When the enzyme-labeled drug becomes bound
to an antibody against the drug, the activity of the enzyme
is reduc.:::d. Free drug in a sample competes with ·the en2~ym<::-
labeled drug for the antibody and thereby decreases the
antibody-induced inactivation of the enzyme. Enzyme activity
correlates with the concentration of free drug introduced.
Page 38
28
In the reaction of enzyme with the substrate, NAD+ is con~
verted to·NADH and the 6hanie in concentration of NAD+ is
spectrophotometrically measured (50).
In ~n actual assay procedure, controlled amountB oj
antibody are added to a specimen. If the specimen contains
phenobarbita1, it and the antibody bind to one another. Since
the antibody is present in excess, the concentration of un-
bound antibody is directly related to the original concentra-
tion of the phenobarbital. When the drugjenzyme complex is
then added, the degree of inactivation of the enzyme is direct-
ly related to the concentration of thri unbound antibody (50).
Instrumentation - The instrumentation recommended
and used to perform the assays consisted of: 1) a pipettorf
dilutor, 10 for accurate sampling and diluting; and 2) a micro
sample spectrophotometer11 equipped with a therm~lly regu-
1 t d fl 11 12 h · h · t d t t · 1 · t . 13 . a·e ow ce , w 1c 1s connec e o a 1mer pr1n er
with memory .function and the capability of automatically
timing 2 absorbance readings 80 sec apart and printing out
the change in absorbance between the 2 readings (51, 52 ,.53).
Assay Procedure - Using the pipettorfdilutor, 50 pl
of standard or unknown serum sa~ple is-diluted with 250 pl
10 . . · Model 1000; Syva Corp. , Palo Alto, CA 94304.
11Mpdel 300-N, Gilford Instrument Laboratories Inc., Oberlin, OH 44074.
12Model 3017, Gilford Instrument Laboratories Inc., Oberlin, OH 44074.
13 . Model 2400, Syva Corp., Palo Alto, CA 94304 .
. - ·-- - ---- --- - --- ---
Page 39
29
of buffer solution in a l ml disposable beaker. A 50 ~~
sample of this dilution is transferred into a second 1 ml
disposable beaker. To this second beaker is added 50 pl of
Reagent A plus 250 pl of buffer, ·followed by 50 pl of
Reagent B plus 250 ~1 of buffer (50,51).
The assay mixture contained .in the second beaker
is aspirated ·into the spectiophotometer flow cell. The 2
absorbance readings are made at a wavelength of 340 nm:
the initial reading after a 15 sec delay for thermal equi
libration at 30°,and the final reading at 95 sec. The in-
dividual readings and the differences between them over
the 80 sec time interval are automatically printed out
(50, 51).
Standard Curve - The standard curve is prepared by
using the EMIT Calibrators. The calibrators consist of a
set of 6 vials of lyophilized serum preparations containing
precise amounts of phenobarbital that serve as standards
to be used in the preparation of the standard curve.
The vials were prepared and reconstituted according
to instructions in the package insert. The reconstituted
solutions contained the following concentrations of phenobar-
bital: 0 Pg/ml (Negat~ve Calibrator), 5.0, 10.0, 20.0,
40.0 ind 80.0 Pg/ml. These concentrations as supplied by
the nianufacturer should be used directly for assay of usual
therapeutic levels of phenobarbital. How~ver, the levels
of phenobarbital obtained with tbe doses given to the subjects
Page 40
30
in this study were below those obtained in usual therapy.
Therefore, to prepare the standard_ curve, the contents of
the vials including the Negative Calibrator were further
diluted 10 fold with distilled water,.the final concentra-
tions being 0, 0.5, 1.0, 2.0, 4.0 and 8.0 pgjml.
The standard curve was.obtained by plotting the
difference,. AA-~A for each c~librator, against the respeco
tive concent~ation of the calibrator. The D.A represents the
calibrator absorbance at each concentration. The AA repreo
sents the Negative Calibrator absorbance. 'l'hese D.A-D.A 0
values are presented in Table XV (p. 67). EMIT graph paper,
a modified legit function paper, produces a linear curve
(50). 'l""'he standard curve is illustrated in Fig. 12 (p. 68). ·
Analysis of Subject Serum Samples - The EMIT Con-
trol serves as a check when measuring subject serum pheno-
barbital levels, since it contains precise amounts of pheno~
barbit~l and 4 other antiepileptic drugs in lyophilized
serum. The control was diluted 10 fold with distilled
water, resulting in a concentration 3.0 ~g/ml.
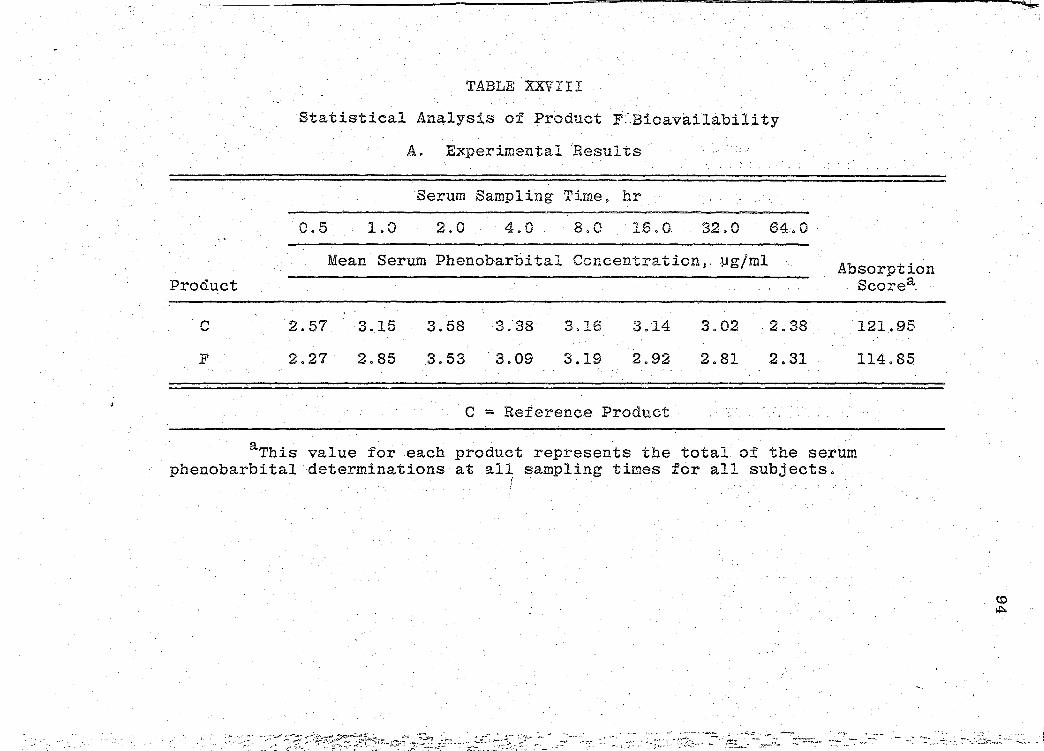
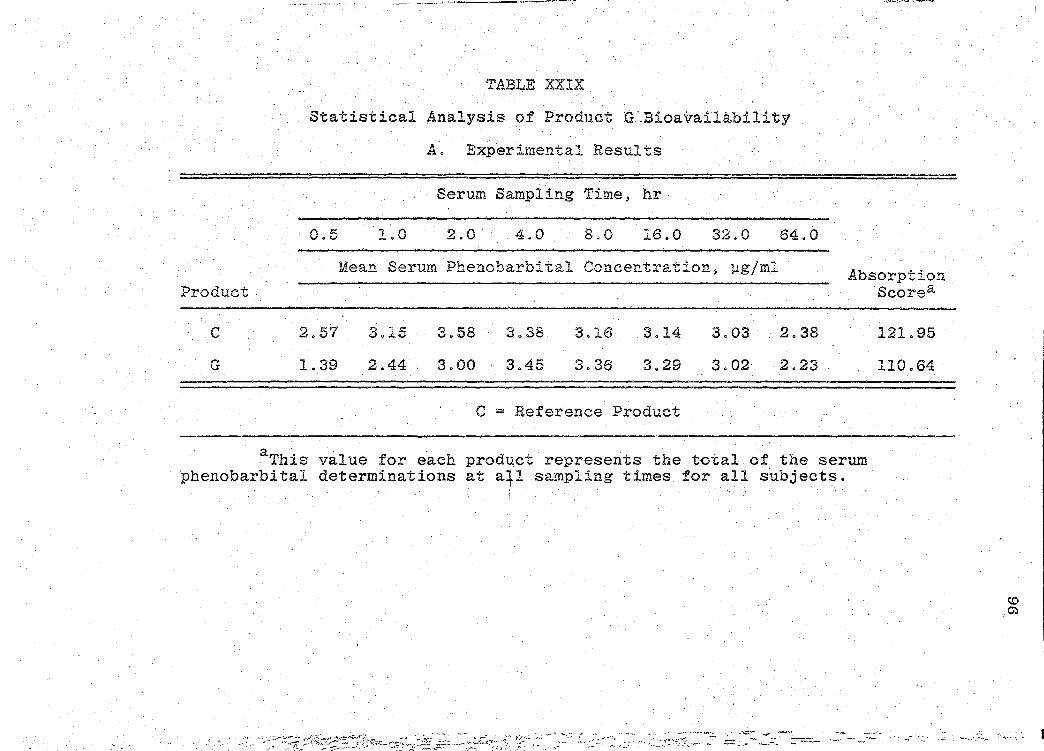
The serum phenobarbital concentration levels obtained
are presented in Tables XVI-XXII (pp. 69, 71, 73, 75, 77, 79, I
81). The mean serum concentration - time curves are illus-
trated in Figs. 13-19 (pp. 70, 72, 74, 76, 78, 80, 82). A
composite graph of the mean serum concentration - time curves
for the 7 products tested in this study is shown in Fig. 20
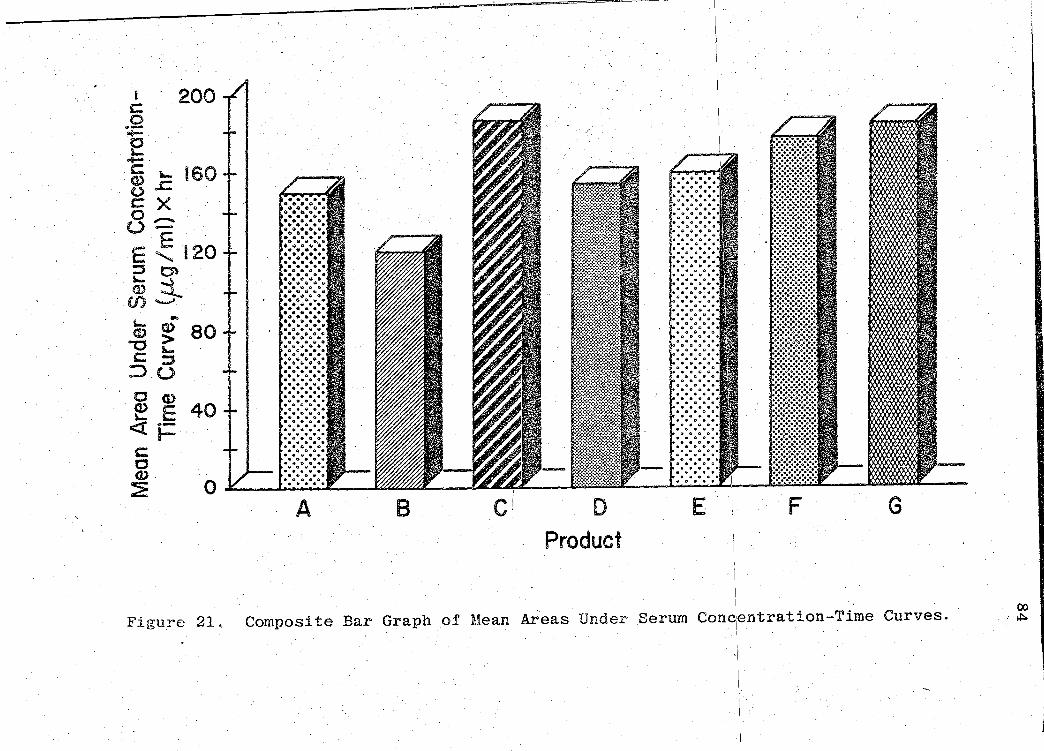
(p. 83). Fig. 21 (p. 84) represents a composite bar graph
of the mean areas under the serum concentration - time curves
-· - ---------------- --- ------- --- ---~- ----
,, '
Page 41
31
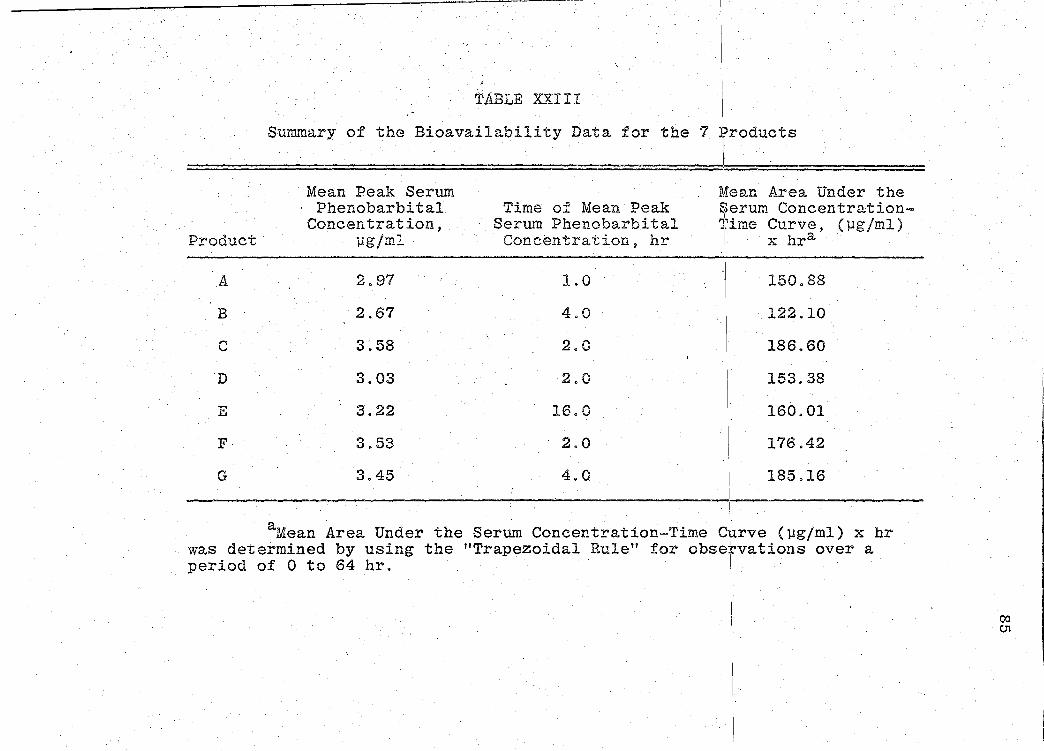
for the 7 products. A sunm1ary o:f the rE:sults of the bio-
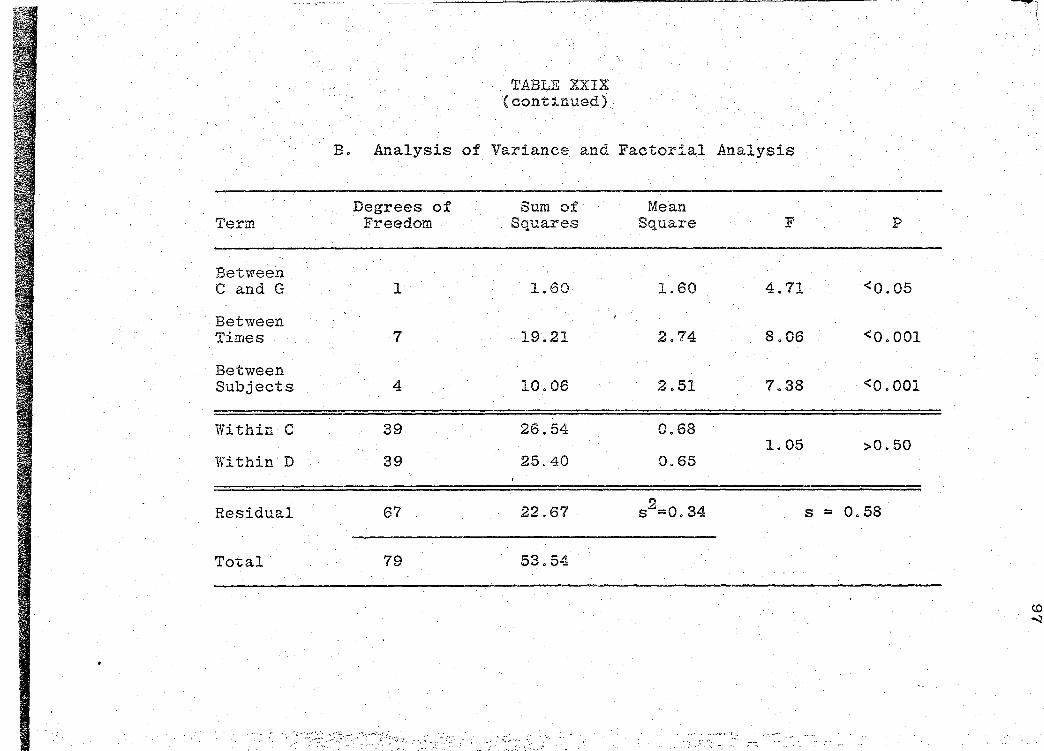
availability data obtained is presented in Table XXIII
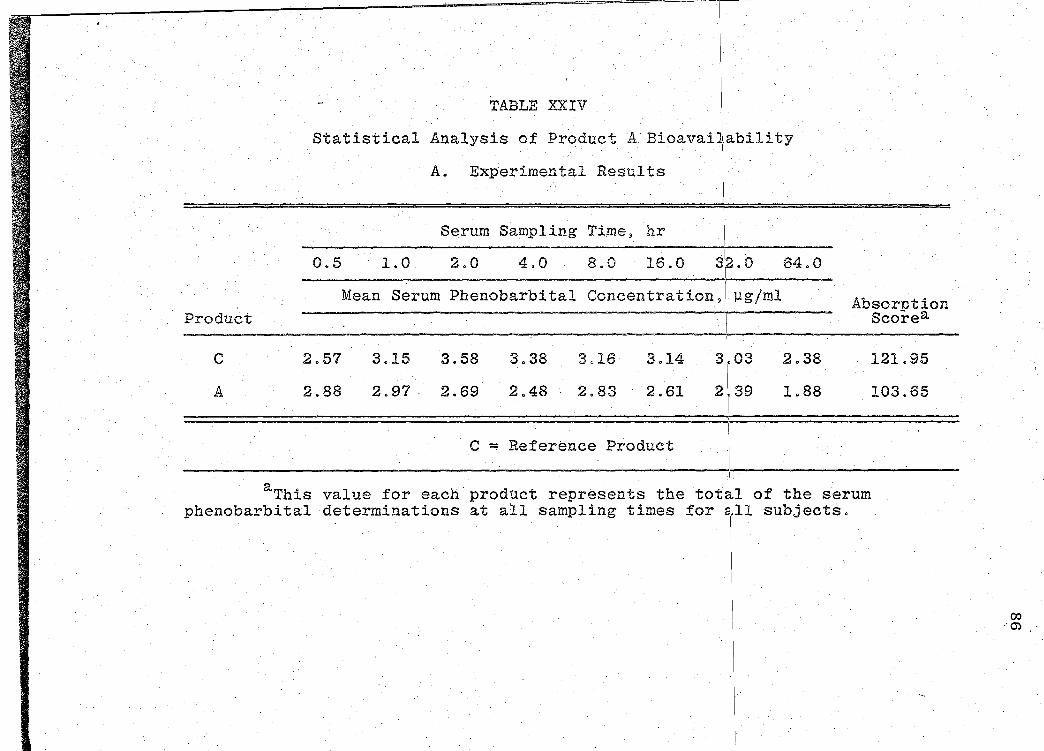
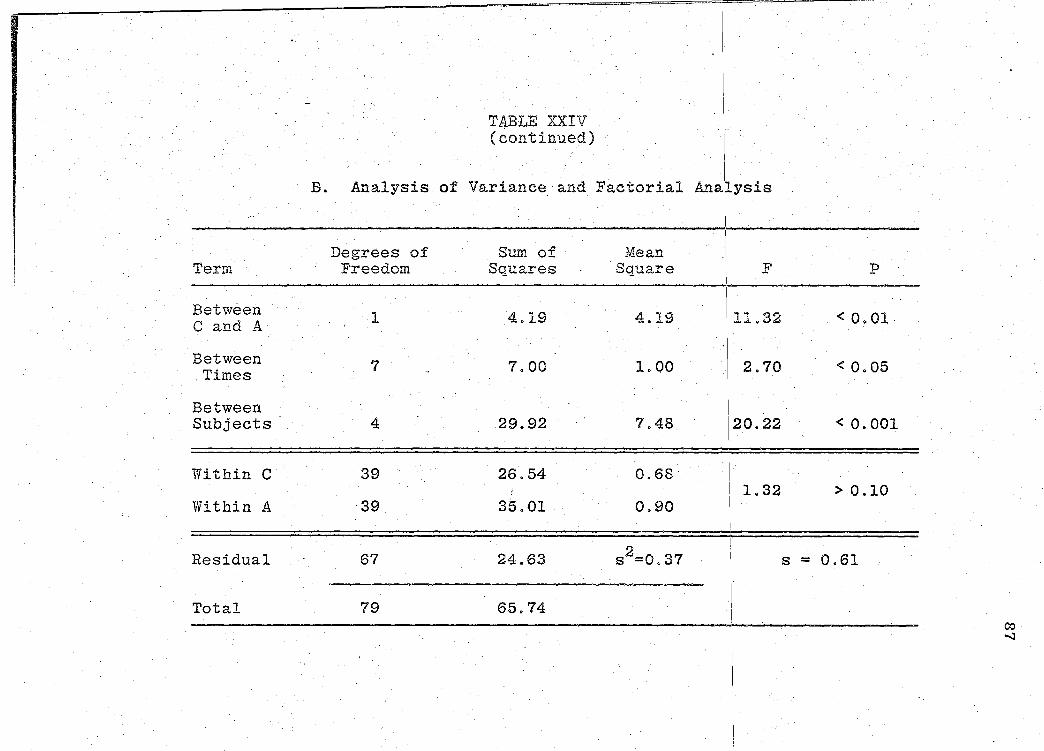
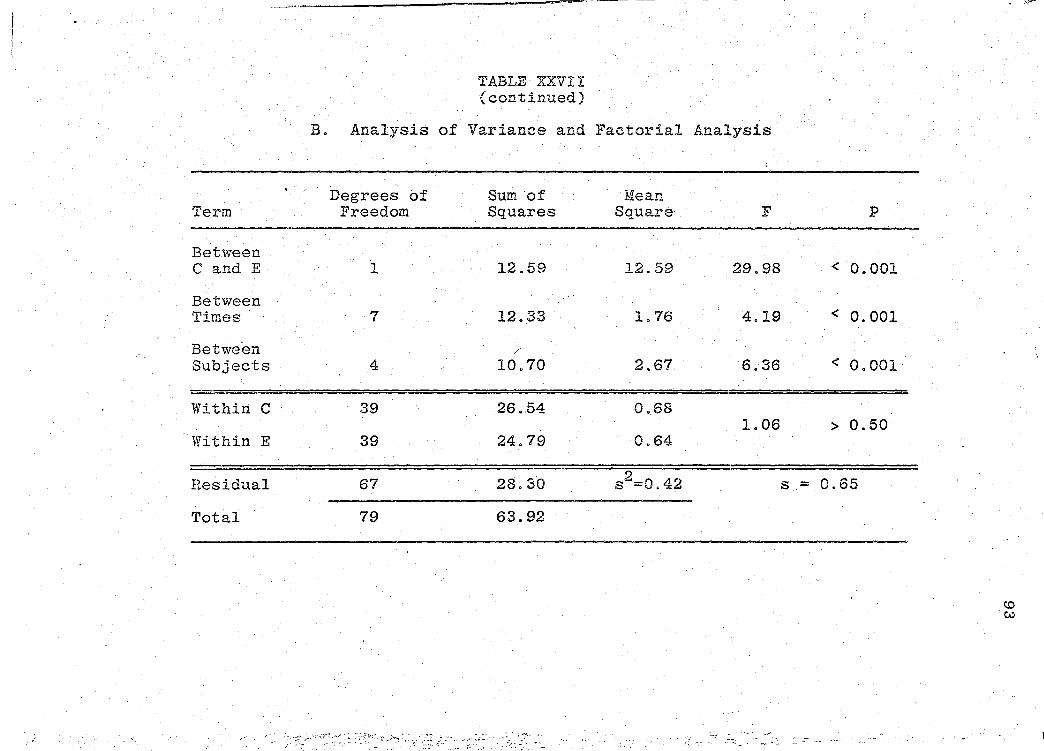
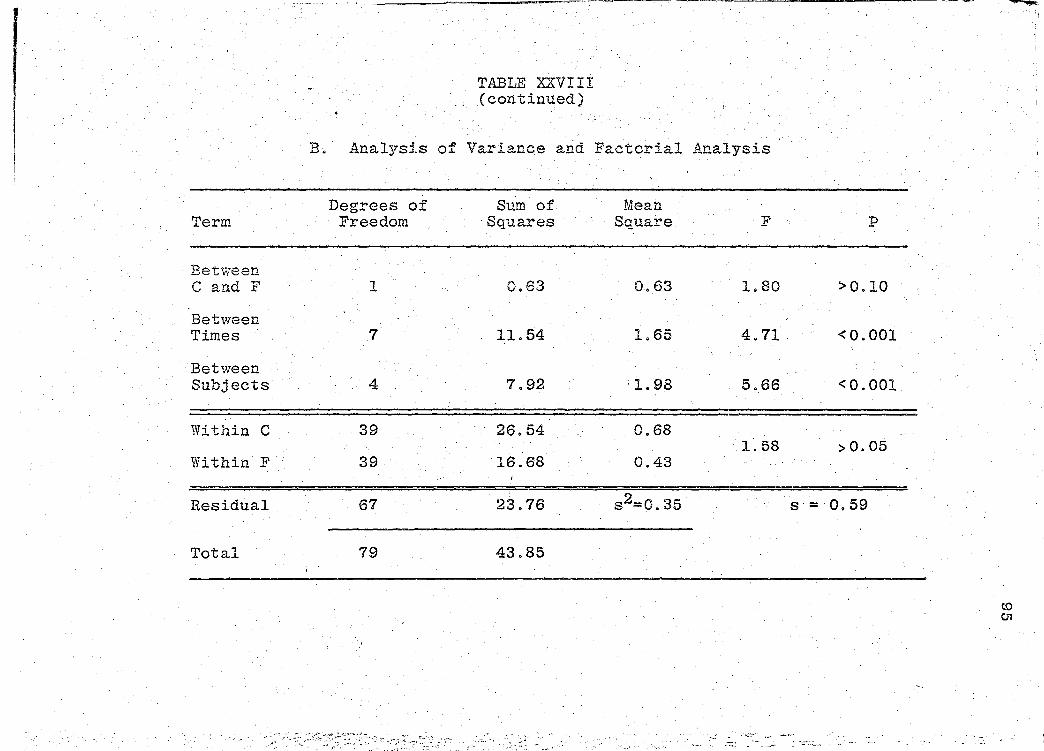
(p. 85). Statistical analyses of product bioavailability
are presented in Tables XXIV-XXIX (pp. 86-97).
The areas under the serum concentration - time
curves were· obtained by using the "'I'rapezoidal Rule" (54)
for observations over a period of 0 to 64 hr. Since these
areas indicate the relative amount of phenobarbital absorbed
in the physiological system, they also are estimates of the
bioavailability of the drug from the various products. The
significance of the bioavailability determinations for all
products, was determined by "Analysis of Variance" (55).
Page 42
RESULTS
Verification of experimental methods, the results
of the physical property data, and the results of the bio
availability data obtained throughout this project have been
compiled and are presented in the tables and figures that
follow.
of:
of:
The results of the physical property data consist
1) Tablet Weights
2) Tablet Weight Variation Determinations
3) Tablet Hardness
4) Disintegration Times
5) Dissolution Characteristics
The results from the bioavailability data consist
1) Serum Phenobarbital Concentration Levels
2) Peak Serum Phenobarbital Concentration Levels
3) Time of Peak Serum Phenobarbital Concentration
Levels
4) Areas Under the Serum Concentration-Time Curves
5) Statistical Analyses of Product Bioavailability
32
Page 43
~ __ --;:_-;-_-.. """""--
TABLE II
Tablet Weight in Milligrams for the 7 Products
Tablet Weight, mg Sample Number tProduct A Product B Product C Pi~oduct D Product E Product F Product G
1 178.5 > 301.4 345.2 175.0 197.1 185.4 227.5 .
2 176.2 304.8 351.1 173.3 205.1 177.9 227.7
3 177.9 292.7 353.2• 175.2 204.6 179.5 229.5
4 174.9 305.8 347.8 184.3 203.2 178.1 229.8
5 178.8 298.8 352.8 178.8 206.2 181.3 228.5
6 177.6 302.1 347.8 178.8 200.0 179.5 227.5
7 180.0 297.3 345.5 173.6 210.0 180.0 . 228.7
8 179.8 296.0 350.4 174.0 209.0 180.6 227.0
9 180.0 295.3 350.7 177.9 206.3 176.3 230.4
10 177.3 299.2 348.6 172.9 209.8 175.4 229.2
11 178.4 303.5 346.8 181.0 211.4 177.3 228.8
12 176.0 301.0 350. o. 175.7 205.6 179.5 231.3
13 179.9 307.4 354.9 173.1 205.5 184.3 231.4 w w
........ _., ... ,.,, .. ;;;:-,..,... ...... r ... .,..,..,~~
Page 44
'
Sarnp1e
Table II (continued)
Tablet Weight; mg
Number Product A Product B Product C ·Product D Product E Product.F Product G
14
15
16
17
18
19
20
Mean + S.D.
180.0 307.1
178.7 300.0
177.7 297.0
181.5 302.0
176.6 296.8
179.0 303.0
181.7 297.2
178. 5+1. 8 300.4+4.1
350.3 171.4'
350.0 ' 181.1
348.3 173.8
346.5 179.2
346.3 182.2
347.7 165.8
347.9 177~6
349.1+2.6 176.2+4.3
.f
209.3 178.8 228.1
212.2 180.6 228.0
207.2 182.6 227.2
202:6 180.8 227.7
206.5 181.6 229.7
206.8 180.4 229.8
204.4 186.3 229.1
206.2+3.7 180.3+2.8 228. 9+1. 3
': ~::: ..
CAl ~
-~~·
Page 45
~__,.........,~,..--,-!-~-~~~~~~---~·=·-··~-- = :nat!i m-rtnz=~·rllllfPU' P ''•·,·.: .. • · ··.·:· .• ·;·_:;:\.·
TABLE III
Weight Var-iation in Percentage Difference for the 7 Products that Meet USP XIX Requirements
Sample Weight Variation.Difference~ % Number Product A Product B Product C Product D Product E Product F Product G
l 0 0.3 1.1 0.7 4.4 2.8 0~.6
2 1.3 1.5 0.6 1.7 0.5 1.3 0.4
3 0.3 2.6 1.2 0.6 0.8 0.4 0.3
4 2.0 1.8 0.4 4.6 1."5 1.2 0.4
5 0.2 0.5 Ll 1.5 0 0.6 0.2
6 0.5 ' 0. 6 0.4 1.5 3.0 0.4 0.6
7 0.8 1.0 1.0 1.5 1. 8 . 0.2 0.1
8 0.7 1.5 0.4 1.3 1.·4 0.2 0.8 I !
9 0.8 .1.7 0.5 i 1.0 0.1 2.2 0.7
10 ·0.7 0.4 0.1 1.9 1.8 2.7 0.1
11 0.1 1.0 0.7 2.7 2.5 1.7 0
12 1.4 0.2 0.3 0.3 0.3 0.4 .1.1 c.u,
13 0.8 2.3 1.7 1.8 0.3· 2.2 1.1 CJ,
.14 0.8 2.3 0.3 2.7 ·1. 5 0.9 0.4
.--....-~...:--······· ......... ~-~ ... - ..... ....__ •. ...,.,.,.._~-.:-.-................ ,._,._......_.~~-~~?]K~~i..~·...:;~.;:~ ... o<l..\.:''·.t!'~-~~···,.<.:·'·""J.·..,~~'lo·'<l-~~j~ .... -·
Page 46
Satnple Number Product. A Product B
15 0.1 . 0.1
16 0.5 1.1
17 1.7 0~5
18 1.1 1.2
19 0.3 0.9
20 L8 1.1
. ,,.,,~~j~'\'.'~k; : 'i[:t:··'';;;i,i; '; ''\'!'• •:ff~~~~!·
TABLE III (continued)
Weight Variation Difference, % Product C Product D ·Product E Product F
0.3 2.8 3.0 0.2
0.2 1.4 0.5 1.3
0.7 1.7 1.8 0.3
0.8 3.4 0.2 0~7
0.4 6.0 0.3 0.1
0.3 0.8 0.9 3.3
Product G
0.4
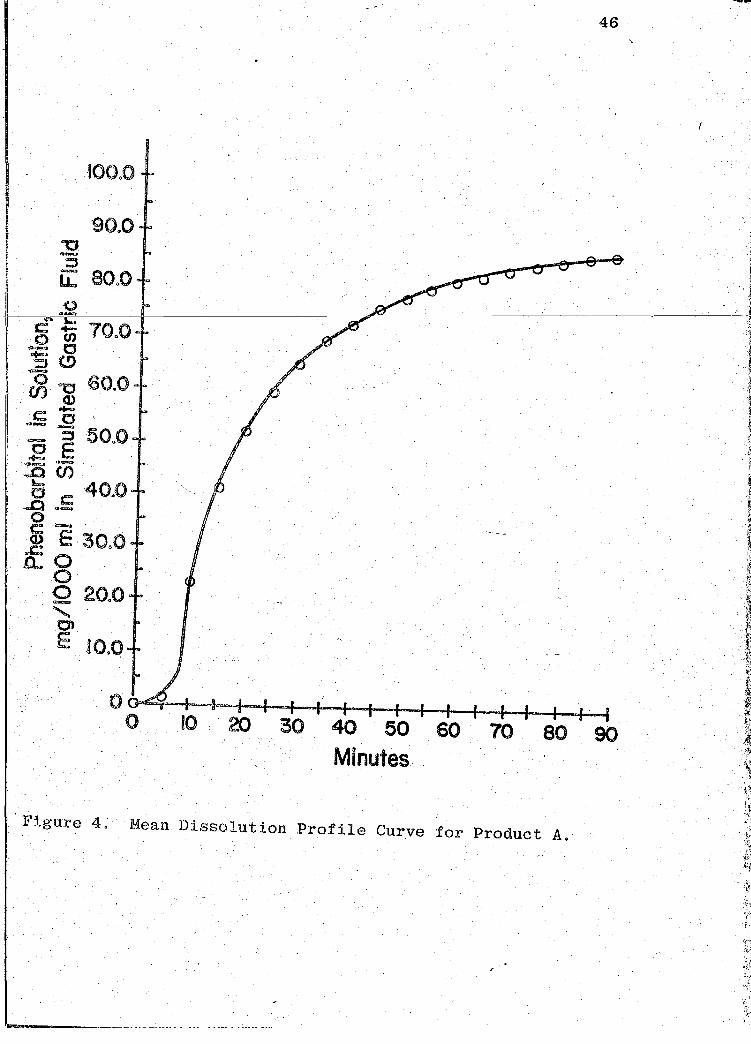
0.7
0.5
0.4
0.4
0.1
·-. ..
w .0':1
Page 48
~----~~~~~~~~~--~~=
TABLE IV (continued)
-'---·--·-----·---~---·
. a Tablet Hardness, kp
Sample ·Number Product A Product B Product C Product D .Product E Product F Product G
14 3.5 3.5 10.9 4.6 4.0 6.5 9.7
15 3.4 2.6 9.1 4.5 3.4 6.9 8.4
16 3.8 3.7 9.1 4.1 4.4 6.8 8.1
17 3. 8. 3.6 10.8 3.7 2. 8, 6.3 7.1
18 . 3.1 3.4 9.5 4.4 4.2 7.5 9.6
19 3.6 3.8 10.6 5.5 4. 8. 7.3 9.3
20 2.8 4.0 10.6 5 .0. 4.6 7.7 10.0
Mean+ 3.5 + 0.4 3.5 + 0.4 10.3 +0.8 4.9 + 0.9 -4.1:+ 0.6 6.9-+ 0.6 9.1 + 0.9 S.D~
aA Kilopond is defined as gn x (I· kg), where g =Acceleration due to gravity = 9.806 mjs2. · n
··.'
w /00
~' '-~· ,. . ·'"·---~ :··:-:-·'·~~~~ii.iiil'"!.fjj!/:i"''tt'l>:· "''•''\~~J>;"'"'*:"'~ --,.,..._,.., ·v-~'"'-"'-:~·,. .. ,.,_., . .,..;,_,_..J.'-"'-",....,-.:. ~-•·""""·~.;.;....,~-.-~,.,--,,,..ri-,.,"".'"'·•..._•.""~"""""'""'~"'-:~-·~----•·~----- '"'"
Page 49
Product
A I I B,
c
D
E
F
G
,~,~-~---~~-----------
TABLE V
· Disintegration Time in Minutes· for the 7 Products that Meet USP XIX Requirement
~isintegration Time) min
11.43
1.47
1.03
4.05
3.68
11.93
0.73
w (,0
Page 50
~-__L....-~-_._-=---=-----=-----
0.0
0.2
0.4
Q) o0.6 c 0
..0 '-~0.8 .0 c::(
1.0
L2
1.4
200 250 300
Wavelength, n m 350
Figure 1. Ultraviolet Scan of Phenobarbital in Simulated Gastric Fluid at .a concentration of 0.10 mg/ml.
390
~ 0
-:.,....., ..... _,,., ...... , ... ~---.-~."i':t:il"
Page 51
,._:.._---..,.....-'--------~----~---·" =-------~--~=· O•·C"''""''"'~'~~=~
Phenobarbital in Solution,
mg/ml in Simulated Gastric Fluid
0.01
0.02
0.03
0.04
0.05
0.06
0.07
0.08
0.09
0.10
TABLE VI
Standard Cu~ve Data for Phenobarbital in Simulated Gastric Fluid.
Absorbance at 240 nm
Trial I Trj_al II Triz.l III
0.072 0.070 0.070
0.138 0.140 0.140
. 0. 204 0.201 ·o.2o3
0.270 0.271 0.270
0.335 0.335 0.334
0.403 0.402 0.403
0.470 0.469 0.470
0.538 0.536 0.538 !
0.603 0.601 0.603
0.672 0.677 0.676
,,, ________________ _
Mean + S.D.
0.071 + 0.0012
0.139 + 0.0012
0.203 + 0.0015 . -0.270 + 0.00058
0.335 + 0.00058
0.403 + 0.00058
0.470 + 0.00058
0.537 + 0.0012
0.602 + 0.0012
0.675 + 0.0026
~ 1-'
j I
Page 52
OJO
"'0 0.08 ~-·
-E
' Ol
E 0.02
o.oo ...,._..==-=-+==--t----=-t---'"1-------t----t-~ 0 0.20 0.40 0.60 :
Absorbance at 240 nm
·}'igure 2. Standard Curve for Pheno})~rbita1 _in SimulatedGastric FLuid.
fll~l!l!ili. mlliiiiW!III!IZ -----------------·-
42
Page 53
'
. Minutes
0 0 eo 00 m
c. -· ::I
.... ~~----, 100. :r -o ~
. - c 3 0 c 3 tT c «.0 '"""' . _., 0" (1) ' _., a. a e:
50.0 G) 0 _,~ filO::J ~.30 (J) o·..,.,.,-
c :!1 s: E.. :;:, c.. ...
Figure 3. Simulated Dissolution Strip-Chart Readout: ' . .
aLines 1 through 6 represertt :fl~w cells 1 through 6 a~d indicate dissolution vessels 1 through 6 containing dissolved amounts of phenobarbital from th~ Phenobarbital Products tested. · I ·
- ; I •
bLine 7 represents :flow cell 7 ~hich contains the thebretical maximum pheno-barbital concentration of 0.10 mgfmlp against which the disso!l.ved amounts of pheno- ~ barbital in flow cells 1 through 6 were measured and then rechrded. w
I J
Page 54
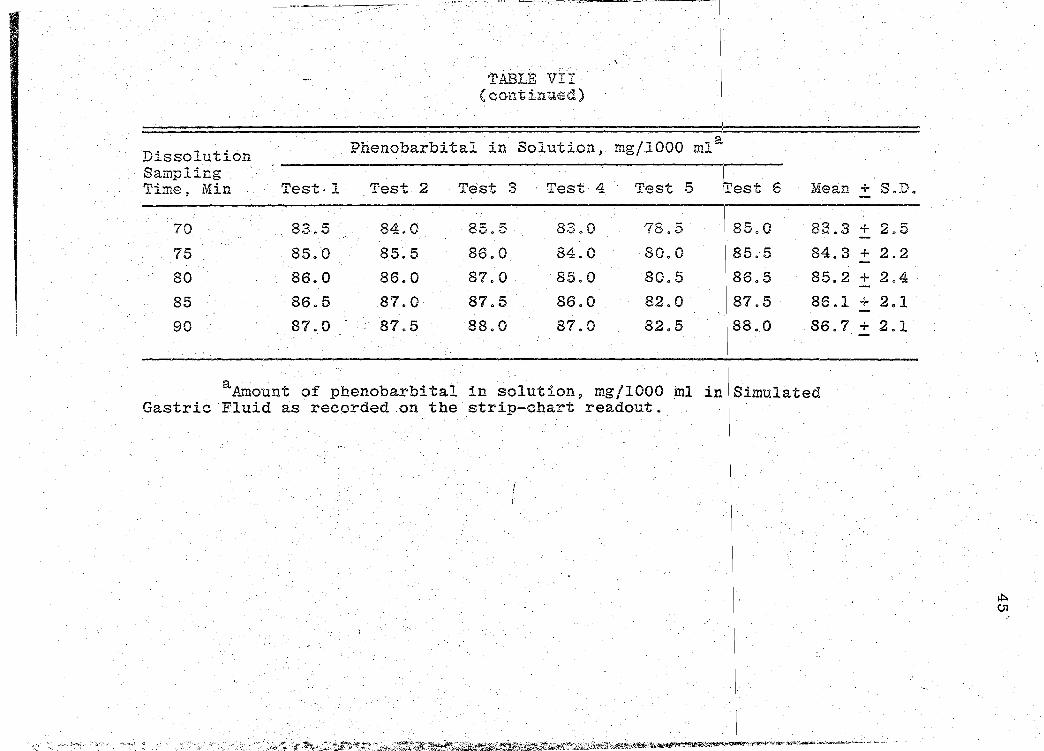
TABLE VII
Dissolution Data for Product A
Di::;solution Phenobarbital in Solution, mg/1000 mla
Sampling Time,. Min Test l Test 2 Test 3 Test 4 Test 5
5 0 1.5 4.5 1Q5 0
10 22.5 24.5 27.5 23.0 18.0
15. 41.5 43.0 45.0 41.0 36.0
20 53.0 53.5 54.5 52.5 47.0
25 61.0 60.5 62.5 .. 60.5 54.0
30 "66. 5 66.5 .67.0 65.0 59.0
35 71.0 71.0· 71.5" 69.0 63.5
40 74.0 74.5 75.0 72.0 67.0
45 77.0 77 .. 5 78.0 •75.0 69.5
50 78.5 79.5 80.0 77.0 72.0
55 8LO 81.5 . 81.5 79.0 74.0
60 82.0 ·s3.o 83.5 . f 81.0 76.0 ;
65 83.0 83.5 84.0 81.5 77.0
......
·-~~- ..... ··' ,;· . :· ~"'' .·\:. ···: ... _ . .,_ ,..,_ •. ,·<'"'.~ t ·'h--·. ~ .i,::~~ :.:.,~-::~ ,:...,~.:: ·:..:~-...:.:.~~.c.:.·~~~z.:·'"·~:"''·~-.... ~.:"fl'-:,. · · ·:::---.
=-= II I
I ·r .
TE!St 6 !I_
Mean + S.D.
1.5 1.5 + 1.6 I . -
214.5 23.3 + 3~.1
42- 0 41.4 + 3.0 I •
52.3 + 2.7 513.0
610.0 59. 8. + 3. 0
65.0 + 3.0 615.5
710.5 69.4 + 3.0
7·r .0 . 72.8 + 3 0 0
71~ 5 75.6 + 3.2 ,. 79.0 77.7 + 3.0
I -81.0 79.7 + 2.9
I -8:~. 5 81.3 + 2.8
I - .
8:3.5 82.1 + 2.6. I
-I
~ ~
i
I I
l ~
Page 55
Dissolution Sampling Time, Min Test·l
70 83.5
75 85.0
80 86.0
85 86.5
90 87.0
TABLE VII (continued)
. \
~henobarbital in Solution, mg/1000 ml,
Test 2 Test 3 · Test 4 Test 5 fest 6
84.0 85.5 83.0 78.5 85.0
85.5 86.0 84.0 80.0 85.5
86.0 87.0 85.0 80.5 86.5
87.0 87.5 86.0 82.0 87.5
87.5 88.0 87.0 82.5 88.0
Mean + S.D.
83.3 + 2.5
84.3 + 2.2
85.2 + 2.4
86.1 + 2.1
86.7 + 2.1
aAmount of phenobarbital in solution~ mg/1000 ml iniSimulated Gastric Fluid as recorded on the strip-chart readout.
! !
~ ..,:';;.;::,.;;.:... , ... ~;'··. :;,t>o~'::¥. f'~~;,_;~t;·""t~·~:_,i;;~'t£~~~~;,.~~i;i;~~R(,~~~~~~1;;),~:li>~~.;>t<.;~~"#~l"-""""'.,.i...,..,.,....... .. ,.,,,. .. =..,_..•~~· ~· ---·· --~-
~ til
i
Page 56
46
100.0
90.0
o~~~~~-+-4~~~~~+-+-4-~~~-+~ 0 ~ ·~ ~ ~ oo ~ ro oo ~
Minutes.
·Figure 4. Mean Dissolution Profile Curve for Product A .
..,.,_, ___ _
-
Page 57
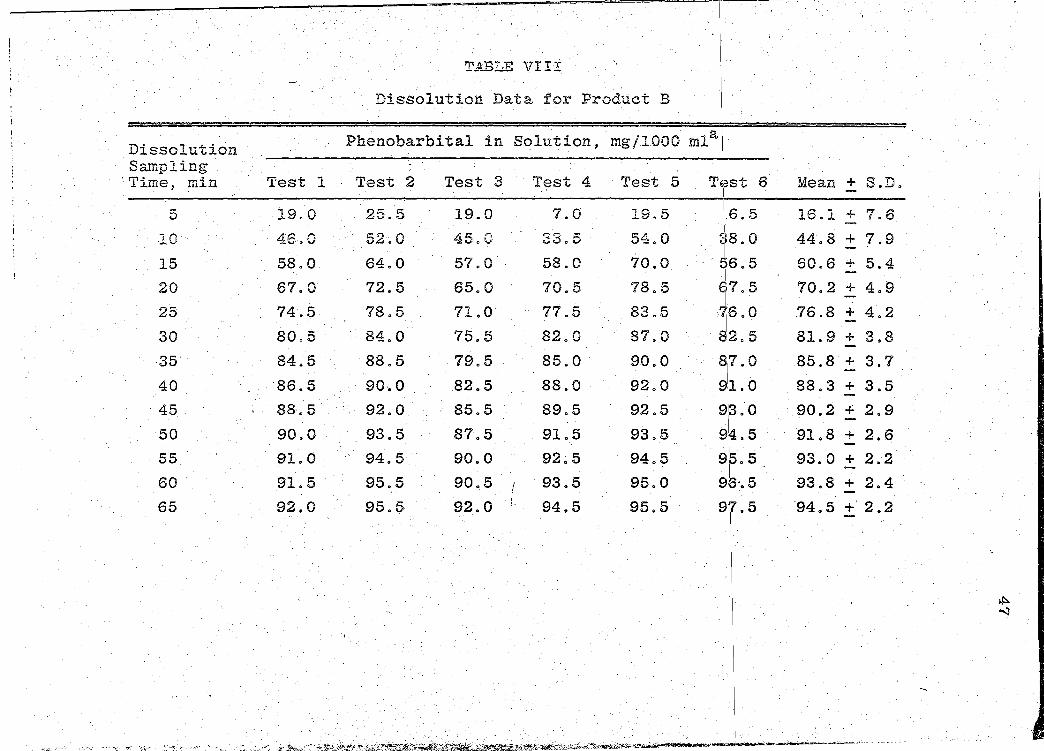
TABLE VIII
Dissolution Data for Product B 1.
Dissolution Phenobarbital in Solution 1 mg/1000 mla[
Sampling I 'Time, min Test 1 Test 2 Test 3 Test 4 Test 5 TE:!St 6 Mean + S.D. I
5 19.0 25.5 19.0 7.0 19.5 '16. 5 16.1 + 7.6
10 46.0 52.0 45.0 33o5 54.0 38 0 44.8 + 7.9 I 0
15 58o0 64.0 57o0 58o0 70.0 ti6. 5 60.6 + 5.4 I
70.2 + 4.9 20 67o0 72.5 65.0 70.5 78.5 1t7. 5
25 74.5 78.5 71.0 77.5 83.5 !ii6. 0 .76 .8 + 4 0 2
30 80.5 84.0 75.5 82.0 87.0 812.5 81.9 + 3.8
·35' 84.5 88.5 79.5 85.0 90.0 817.0 85.8+ 3.7
40 '86. 5 90·. 0 82.5 88.0 92.0 911.0 88.3 + 3.5
45 88.5 92.0 85.5 89.5 ·92.5 9\3.0 90.2 + 2~9 ' -
50 90.0 93.5 87.5 91.5 93.5 914.5 91.8 + 2.6
55 91.0 94.5 90.0 92~5 94.5 915.5 93.0 + 2.2
60 91.5 95.5 90.5 f '93. 5 95.0 91(3·. 5 93.8 + 2.4 I
65 92.0 95.5 92.0 i. 94.5 95.5 9'7 5 '94.5 +' 2.2 I .
,.·.-: .. ,,·: ... · ····-.: ... :; ~-· '€"'··"'" .): ·;~ -,•··; '.,.. ~:; ... >~.;.·::t·:_i~Z;~~~.;.,;~~:_t~~-;~:)~j~~~ti~~~[t~~~~ .. :,~~~~~"fij:~i-~~-i!lr;'s.S:::.+:;j;..r..::~·~~~~:~.+'""'~~..m~~---·-· -·· --~-·
~
~
Page 58
:·
Dissolution Sampling Time, min
70
75
80
85
90
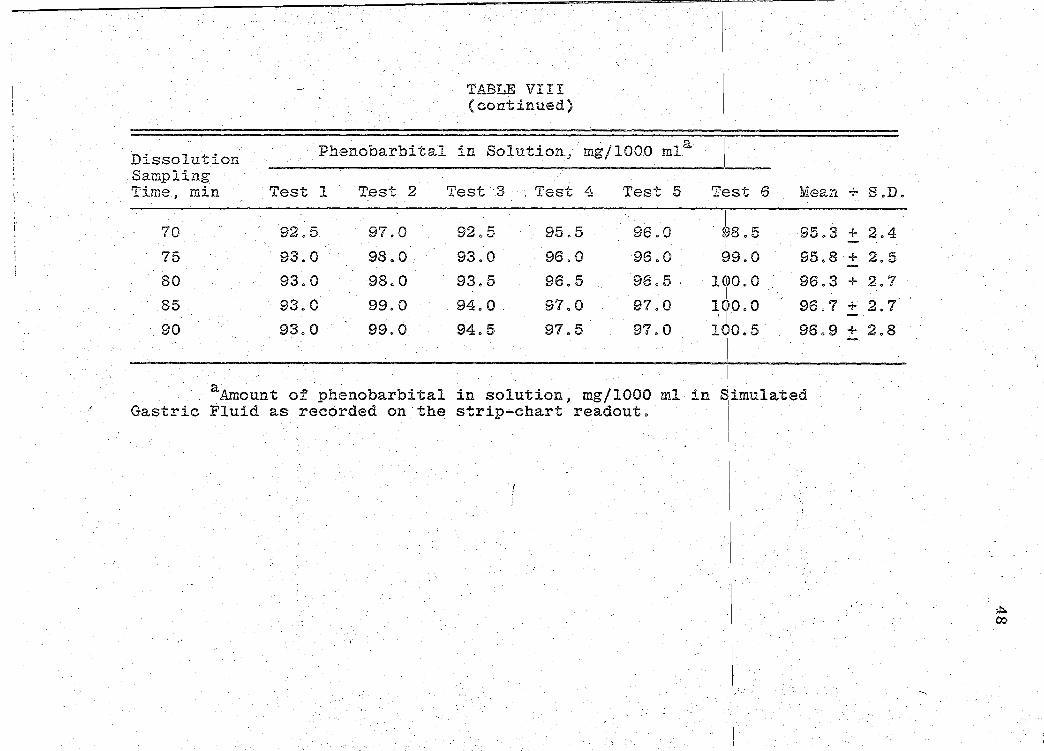
TABLE VIII (continued)
Phenobarbital in Solution, mg/1000 mla
Test 1 Test 2 Test ·3 . Test 4 Test 5
92.5 97.0 92 0 5, 95.5 96.0
. 93.0 98.0 93.0 96.0 96.0
93.0 98.0 93.5 96.5 96.5 .
93.0 99.0 94.0 97.0 97.0
93.0 99.0 94.5 97.5 97.0
aAmount of phenobarbital in solution$ mg/1000 ml in Gastric Fluid as recorded on the strip-chart readout.
I
TJ;;st 6 I
I 98.5 I S9.0
I
[email protected] I
100.0 , I .
110.5
I
Mean + S.D.
95.3 + 2.4
95.8·+ 2.5
96.3 + 2.7
96.7 + 2.7
96.9 + 2.8
S1imulated
I 1.
I I
A co
,. ...
Page 59
JOO.O
"'0 90.0 ,_ ~
ri: 80.0
f.~--,o
~ ... ~ c~ ~ ~-70.0 :::S(!)
0 (f)~- ..en 0
CD QV. . . ....,. .. S,g =-~ ~.§-50.0 ..0 (/) ..... :E .5 40.0 0 c:-.. . ~E a..·o 3o.o
0 Q '20.0 ~-
E 10.0
49
o~~~-r-+~~~~~r-+-T-+-~~-r-+-+-4 0 D oo ro ~ ~ oo ro ~ oo
Minutes
F'igure 5. Mean Dissolution Profile Curve for Product :S.
..
Page 60
TABLE !X
Dissolution Data for Product C
--Dissolution Phenobarbital in Solution, mg/1000 mla
Sampling Time~ min Test 1 Test 2 Test 3 Test 4 Test 5 !Test 6 Mean + S.D.
5 25.5 33.0 30.0 21.. 5 21.0 28.0 26.5 + 4.8
10 53.5 58.0 54.5 65.0 58.5 58.0 57.9 + 4.0
15 70.0 74.5 65.0 74.5 71.0 72.5 71.3 + 3.6
20 . 78.5 . 83.0 73.0 79.0 76.5 80.5 78.4 + 3.4
25 85.0 90.0 . 79.5 82.0 77.0 85.5 83.2 + 4.7
30 ·89.0 93.0 84.0 85.0 79.0. 88.5 86.4 + 4.8
35 91.0 94.5 86.5 87.5 84.5 90.0 89.0 + 3.6
40 93.0 96.0 88.0 89.5 89.0 92.0 91.3 + 3.0
45 94.5 96.5 89.0 91.5 92.0 93.5 92.8 + 2.6
50 95.0 96.5 90.0 93.0 94.0 94.0 93.8 + 2.2
55 96.0 97.0 90.5/ 94.0 95.5 95.0 94.7 + 2~3 i
60 96.5 97.0 91.0 95.0 96.5 96.0 95.3 + 2.2
65 97.0 97.0 92.0· 97.0 97.5 96.0 96.1 + 2.1
c.n 9
--I
L--- ,_. ... ... ~~-:--" ., .·,: ." ~.. r ·-
;;,•~. 0
, ~.;>~,.,.-.t·:~.,;.t.;":..~~~~~,.;~;:-:rj'~;~~l·~·~.i:£ •. "!-.'• ...... ~~"f:'""~'~-v"·•>•;o" ''""..,._.,"~•' ~·-ooU'•~~- Oh- '•--·
Page 61
Dissolution Sampling Time, min .
70
75
80
85
90
Test 1
97.0
97.5
98.0
98.0
98.0
TABLE IX (continued)
Phenobarbital in Solution, mg/1000
Test 2 . Test .3 Test 4 Test 5
97.0 92.5 99.0 98.0
97.0 93.0 100.0 98.5
97.0 93.5 101.0 98.5
97.5 94.5 101.5 99.0
97.5 95.0 102~0 99.0
aAmount of phenobarbital in solution~ mg/1000 ml Fluid as recorded on the strip-chart readout.
I' ll_-'---L-'-'------------"
mla\
·I ']'est 6
I
Mean + S.D.
96.0 96.6 + 2.3
96.5 97.1 + 2.4
97.0 97.5 + 2.5
97.0
198.0
I
97.9+ 2.3
. 98.3 + 2. 3
in Simulated Gastric . I
I
c.n .....
·~ ·.~ ~· -~-:_~ •.• ...;.~ ·:. ... ~ ~- ~ ..... ';~;.,:.:.;·.· ·:."',;,~ ... -~ ... ~t~ •• -» ..... "t.~~ll5bf-1
1
·i-·· .. :-~.:.:_-...,_., ..... --.- ... r·>"
Page 62
52
100.0
I OJ)
o~~-+-T~~~r-+-~~~-r-+~~~~+-4-~ 0 10 20 30 40 50 60 70 80 90
Minutes
Figure 6. Mean Dissolution Profile Curve for Product C.
., ''i '~ ~-:;
Ji i
11 '"l :< ~
·.·~~ ~1
. fl ~· )'
.r •.
' i
···. i
?i I
~
Page 63
Dissolution Sampling Time, min Test 1
5 0
10 0
15 0.5
20 3.0
25 7.0
30 . 13.5
35 22.0
40 ·29.0
45 34.5
50 39.0
55 43.5
60 47.5
65 52,. 5
'TABLE X·
Dissolution Data for Product D. 1 .
. Phenobarbital in S.olution, mg/1000 ml;\ ·
Test 2 Test 3 Test 4 Test 5 i 'rest 6
1, .
0 0 0 0 0
0 0· 0 0 0
2.0 2.0 0 0 2.5
5.5 5.0 1.5 2.0 6.5
13.5 12.0 5.0 4.5 13.0
22 .. 0 23.0 9.0 8.0 20.5
30.0 32.5. 13.0 12.5 28.0
36.5 40.0 16.0 17.0 36.5
42.0 46.0 18.5 21.5 42.0
46.0 51.0 21.5 24.0 47.0
49.0 55.0 25.5 26.5 '51. 5 ;
156.0 52.0 59.5! 29.5 . 28.5
55.0 62.5 31.5 30.5 1159.5
Mean + S.D.
0
0
1.2 + 1.1
3.9 + 2.0
9.2 + 4.1
16.0 + 6.7
23.0 + 8.7 -29.2 + 10.5
34.1 + 11.6
38.1 + 12.5
41.8 + 12.8
45.5 + 13.4
48.6 + 14.1
c.n w
j I . -... .•' . &,. .. ~· .,..-. ,, _.,~ , .. ,_,.j, • ~·- -· . ' "' •" .. ""* , ·~ ·r ·~,.,··· • .L • ' - ·~ '" .. '· , '' ~ . .., ,_. ~---~,.. .-. ~ · •. :, .··;.t ..._ .r .... ~-- ..... '::
0s-- ~ •"'"'~"::l"TI&C"'~i"'-'!'t.~;( "."'" .................. .,.,.»,...~""'"'~h~"';\~r .. ,-r .. .;. "'~,.. • ~"'""'"""'·~-~ '"'-$"'--;:"~vff;.."';~~=~¥ ~~:.~lk'.t:.:~~~;(~~~·:.:.r.~\~~.~"'-,:,,~~-'!!:"~~-~;;.;'-~ ,_..,~ .. ~:!
&& - ' -· .. -------~--_.,. __ _.c.\' ~ - ~- -
Page 64
IJ."'ABLE X (continued)
I
Dissolution Phenobarbital in Solutiori, mg/1000 mla I Sampling
'Test 4 I Test 6 Time, min Test 1 Test 2 Test 3 Test 5 Mean + S.D .
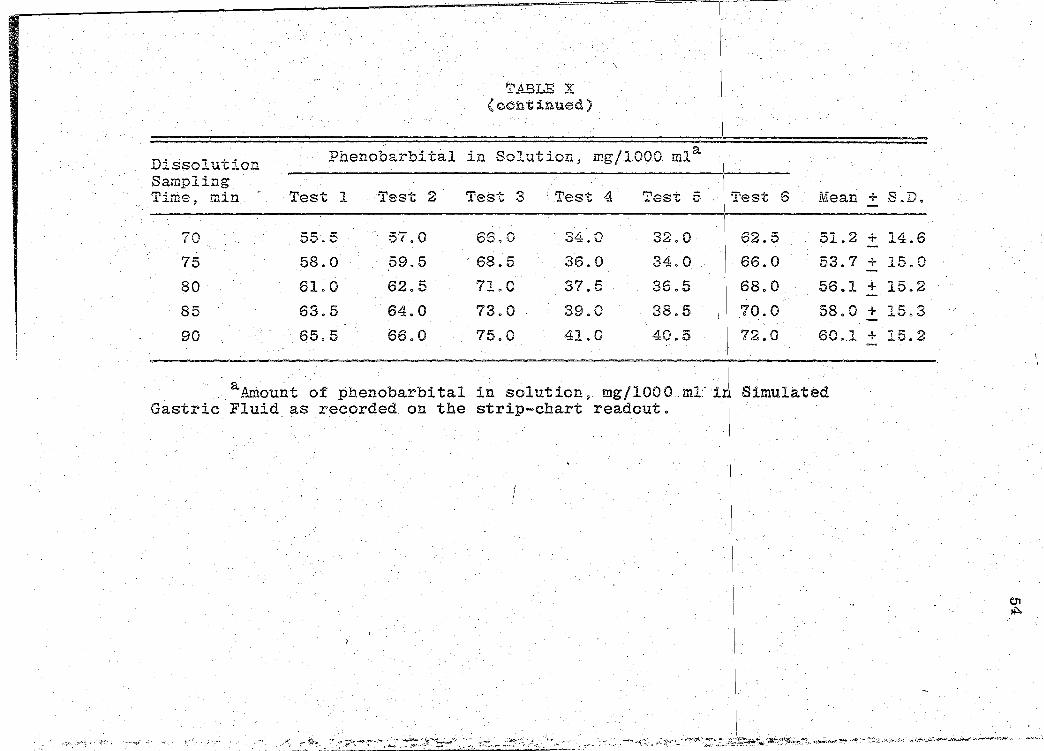
70 55.5 57.0 66.0 ...,.d. f'l .j) ~. v 32.0 62.5 51.2 + 14.6
75 58.0 59.5 68.5 36.0 34.0 66.0 53.7 + 15.0
80 61.0 62.5 71.0 37.5 36.5 68.0 56.1 + 15.2
85 63.5 64.0 73.0 39.0 38.5 70.0 58.0 + 15.3
90 65.5 66.0 75.0 41.0 40.5 72.0 60 .. 1 + 15.2
a Amount of phenobarbital in solution, mg/1000 mL iJl Simulated Gastric Fluid as recorded on the strip-chart readout.
c.n ~
•':·"·-·: ·~'·; ' ' ~-· ; ._._ ..... · ". ' ; ·"/. "~ r :~:.-, • ~'4' .~ ;;·-.~~·""'"'";""'"'"': •• h .... ~,.:--=·:,r~· .... ?;-r~,, :• ••. ·~·~~ .. -- .;~~~ ... ~--·;· \'•• ·:"'T.., • ...,,.,. ···=· -·~ "-' ·-"' -~ , .• io-.·_,;:;l.;_~·~"'-.}o~-">i<'>'~--. ....... ___ _,,. __ ..
Page 65
""0 .,_ ·::s
-=-.u_
0 "'='::::;;:~
$-. .....
c*"' 0(/J --~ 0 "5(.!) 0 "'CJ. (}) Q)
<t=o c· o "d=! \::.:-•:;:.:)
::3 ~ E 0 :!: (Jj ..0 b. 0 c lO :,_, 0 s:: ·.~ E <1>
0 0 0
,. . 55
100.0·
90.0
80.0··
7Q .. O
·60~0 /
50;0 -~
40.0
o~~~~-+--~+-~•~--~~+1-+~•~~~•-+-;l~lr~~~rl-+~1 0102030405060708090
Minutes
l''igure 7. Hean Dissolution Profile Curve for Product D.
lfllk&iii&i&Jii
;
/'
( :·
i"i :.l
;i
' ·; l
I !
·~ . !
I 1 I
i ' i ' iJ I
•· • ( J
f·,
Page 66
Dissolution Sampling Time, min
"' OJ
10
15
20
25 30.
35
40
45
50
55
60
,. TABLE XI
Dissolution Data for Product E
1.
Phenobarbital in Solut~on, mg/1000 ~la[
Test l Test 2 Test 3 Test 4 Test 5 i
'Test 6 I
Mean +.S.D.
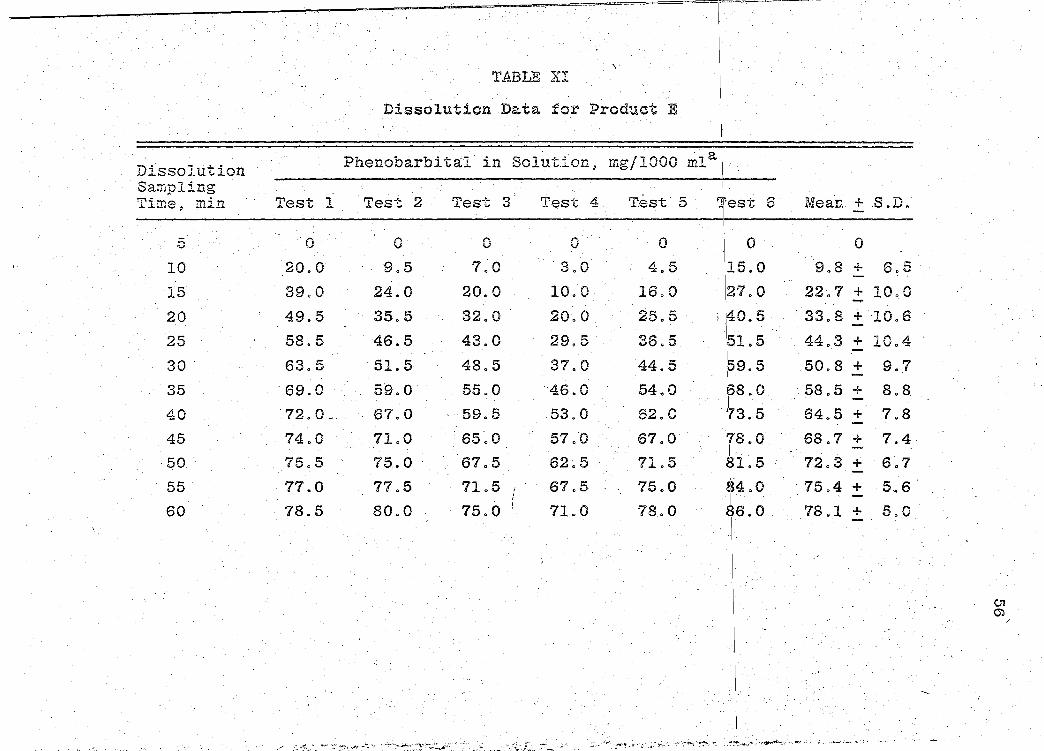
0 0 0 0 0 0 0
20.0 9.5 7~0 ·s.o 4.5 15.0 9.8 + 6.5
39.0 24.0 20.0 10.0 16.0 27.0 22.7 + 10.0
49.5 35.5 32.0 20.0 25.5 I ,40, 5 33.8 + 10.6
58.5 46.5 43.0 29.5 36.5 I 44.3 + 10.4 151.5 63.5 51.5 48.5 37.0 44.5 .159. 5 50.8 + 9 .. 7
·69.0 59.o· 55.0 46.0 54.0 68.0 58.5 + 8.8 I
. 72. 0 ~ 67.0 59.5 53.0 62.0 '73 5 I •
64.5 + 7.8
74.0 71.0 65.0 57.0 67.0 ''18. 0 68.7 + 7.4 I . -
75.5 75.0 ·. 67.5 62~5 71.5 81.5 72.3 + 6.7 . I. -
77.0 77.5 71.5 1 67.5 75.0 84.0 . 75.4 + 5.6 I -
78.5 80.0 75.0 I 71.0 78 .. 0 86.0 78.1 + 5.0
I -
I
I / ~:... •f-o..c,"' ..... ;, : ,:"'~·~ -..4 -':, ·~~
0 ...... · .. ·(~.: ... _ ...... _ ;: .• ··.w -~~~-:·:,: .. 'h"'' ,;.'f~ ....... ~. ,~. ":':'":-........... ··-~~"-·,~~<,o:~:
CJl m
' I
. I
Page 67
TABLE XI · (continued)
Dissolution Phenobarbital in Solution, mg/1000 mla\
Sampling I m• . .~.~me, m~n Test l Test 2 Test 3 Test 4 Tes~ 5 '['est 6 Mean + S.D.
65 79.5 81.0 78.0 73.5 80.0
70 80.0 82.5 81.0 75.5 81.0
75 82.0 84.0 83.5 77.5 83.0
80 ·82. 0 84.5 84.5 78.0 83.5
85 82.5 85.0 86.0 79.5 84.0
90 83.5 86.5 87.0 81.0 85.0
aAmount of phenobarbital in solution, mg/1000 ml · Gastric Fluid as recorded on the strip-chart readout.
j_
87.5 79.9 +
89.0 81.5 +
90.0 83.3 +
90.5 83.8 +
91.0 84 0 7 +.
92.0 85.8 +
in !simulated
I
~ ~· . . ... ,, z~. ·i·~ ~ · ·- ;~f~: · ·: ~··:'i'~-•- ~~-.~,_,~, _,...;;. .,. -~"- -~·"""'-~- ·:~:o ·~·-~.:" ·~·_.:(:. ;~~~.;·•':: ~~-~ "'"' ~::~-....... ---· .-.
4.6
4.4
4.0
4.1
3.8
3.7
01 ....:]
. ...... . _, ....... ~'<"-~ '""""-~~---~·~.:.......·-"'·
Page 68
58
100.0
10,.0
o~-~~~+-4-~~-+-4~~~r-+-~~-r-+~~ 0 10 20 30 40 50 60 70 80 90
Minutes·
Figure 8. Mean Dissolution Profile Curve for Product E.
' t·'' ' \ .,..,.
•' ,< r;
Page 69
Dissolution Sampling m· . 11.me, m1.n · Test·· 1
5 3.5
10 28.0
15 50.0
20 63.5
25 79.0
30 86.5
35 92.0
40 95.0
45 98.5
50 100.0
55 102.0
60 103.0
65 103 •. 5
TABLE XII
Dissolution Data for Product F . 1.
Phenobarbital in Solutions. mg/1000 mla- I
TJ~st 6 Test 2 Test 3 Test 4 Test 5
I o 6.5 3 .. 5 1.0 3.0
29.5 21.5 16.5 21.0 ~~2. 5 I
51.0 41.0 33.5 36.0 j~2. 0 51.0 45.0 47.5 50.0 ...
17. o
78.0 64.5 59.0 64.0 . 716.5
86.0 72.5 70.0 76.5 81:4. 5 90.0 77.5 78.5 82.5 819.5
92.0 86.0 I
81.5 82.5 9i2. 5. 94.0 84.0 . 86.5 90.0 . 9i5. 5 95.5 87.5 89.0 91.5 917.0 96.5 89.0 . ! 91.5 93.0 918.5
I 97.0 90.0 93.0 95.0 919.5 97.0 92.0 95.5 96.0 10,0.0
Mean + S.D.
2.9 + 2.3
23.2 + 4.8
42.3 + 7.1
52.3 + 6.8
70.2 + 8.7
79.3 + 7 .. 3
85.0 + 6.3
88.3 + 5.7
91.4 + 5.6
93.4 + 4.9
95.1 + 4.8
96.3 +· 4.6
97.3 +· 4.0
c.n <D
Page 70
/· ... ;~
·Dissolution Sampling Time~ min
70
75
80
85
90.
TABL~ XII ( c·ontinued)
Phenobarbital in Solution, mg/1000 mla
Test 1 . Test 2 Test 3 Test 4 Test 5
103.5 97.5 93.5 96.5 96.5
103.5 97.5 94.0 97.5 97.0
103.-5· 98.0 95.0 98~5 97.5
103.5 98.0 95.5 99.0 98.0
103.5 98.0 96.0 99.5 . 98 0 0
aA~ount of phenobarbital in solution~ mg/1000 ml in Gastric Fluid as recorded on the strip-chart readout.
Te~~t 6 Mean + S.D .
I
98.0 + 3.5 10e.s
1011~. 5 98.3 + 3.3
lOjl. 0 98.9 + 3.0 . I
10l.5 99.3 + 2.8 I
101.5 99.4 + 2.7
I
'I s~~.mulated
i .
I . I
. _·!...:,- -~-- :y.< '-''·: '-"-· ..,•'.•s:'. •r .,.r-M _,.,_,,., .. "C.,.·.:~ ~~:".~~~..:....;r.!":'j.~~~r.::=t~~~:>.t-~~~-.';;ti~:~::_~..,_ -~~~-""=':..:· ~v~·:::""-·'e-' ~-~-~ .. '?'!"~"-~·=;~----~·~~n·"!'':""?~.·'-'.~-"'-·•=-·•~-.... ,,,;;;;~~~"'-""'~-'""" .... .?.<A.o ... ~.,_.. ...... ~ ·-·-·-~--· •-··. -- ••
m 0
Page 71
100.0
o :::;E.·. 50~0 .,..,.., ,:Q ;-n . ·~o.. v~
E c 40J> .. 0 .,_, ~
·1:: "'"""'
. .! E 30.0 tl,.Q
0 Q 20.0
' ~ E 10.0
61
0 I I I I I I I I· I I I. I I o D ~ ~ ~ ~ oo ro oo ~
Minutes·
Figure 9. Mean Dissolution Profile Curve for Product F.
Page 72
TABLE XIII
Dissolution Data for Product G
Dissolution Phenobarbital in Solution, mg/100 m1a
Sampling Te!st 6 '"". . Test 1 Test 2 Test 3· Test 4 Test 5 Mean + S.D. .~..·lme , mln· ·' .
I .
'i 5 0 3.0 0.5 0 0 ';). 5 ,1;.., 0 1.0 + 1.4
10 16.0 26.5 18.0 11.0 16.0 I
l!~. 0 17·. 8 + 5.1
15 33.0 43.5 36.5 23.0 30.0 3'~ 5 ~~ G
33.1 + 6.8
20 47.5 55.0 48.0 33. o. 40.0 4:3 0 5 . I
44:.5 + 7. 6
25 57.5 64.0 56.5 42.0 49.5 5'•) 0 41 • 53.6 + 7.6
30 65.5 64.0 63.0 50.0 56.5 5~~. 0 59.7·+ 5.8 I -
35 71.0 75.0 70.0 56.0 62.5 6~L5 I
66.3 + 6.9 .
70.6 + 6.5 40 75.0 79.0 73.5 61.0 68.0 67.0
78.0 82.5 77.0 65.0 I
45 72.0 71.0 74.3 + 6.2 I
.. -50 80.5 84.5 .. . 80.0 69~0 75.0 74.0
I
77.2 + 5.6
55 83.0 86.5. 82.5 ., 72.0 78.0 71~0 79.8 + 5.2
60 84.5 88.0 84.5 I 76.0 81.0 7~.5 82.3 + 4.3
65 86.5 89.0 86.5 77.5 83.0 I
82 .. 0 I
84.1 + 4.'1 i .
I
I .
m tlj
-~
-~ ~.;· .. ·~ .. ~_,. .. ~- -" ~~- ..,.; • .:;:r~ ._ ~~~ .. :.-~"-"'•-·- ·-,;;'.<jli'_. ~-~- •ll"'-""'·-"-·""'! ..
Page 73
Dissolution · Sampling Time. min Test 1
70 8'7 .5
75 88.0
80 . 88.5
85 89.0
90 89.5
TABLE XIII {continued)
. Phenoharbi tal in Solution, mg/1000 mli. Test 2 Test 3 Test 4 Test 5 ~est 6
90.0 87.5 79.0 85.0 83.5
90.5 89.0 81.5 86.5 85.5
91.0 90.0 83.0 88.0 86.5
.91. 5 90.0 84.0 88.5 87.5
91.5 91 .. 0 85.0 90.0 188.0
Mean + S.D.
85.4 + 3.9
86.8 + 3.2
87.8 + 2.8
88.4 + 2.6·
89.2 + 2.4
aAmount of phenobarbital in solution, mgflOOO ml in !Simulated Gastric Fluid .as recorded on the strip-chart readout.
, .. "~-"'' ... .( . .. .,- ~··. . - ·~ :.:.'-:- _...~·~~ .!'.:· '. '' ~· ~~ -~· .. :rp•~ ... _...,.,........,. ~
,.., ___ <···
0)
w
Page 74
0~ 80.0 ...... c ..... ooo -~ ~ 70.0 0 ·"0. (Jj OJ
c~ ,12 60.0 "'~ ·~·
cE . ~ U) 50.0 b 0 c
..0 0-. g- 40.0 Q)·E
.,.,C:: 0 (L 0 30J)
0 -'·· ·~2000
64
0•-~-~~-+~~~~+-+-~~~-+~~~~~ . 0 10 20 30 40 50 60 70 80 90 .
Minutes
Figure 10. Mean Dissolution Profile Curve for PrtiduGt G.
Page 75
"0 . §3 90.0 -LL
~2 80.0 ._
65
Products· · A= o o 8 =. • c = • • D = o o E =A ~ F = A . - ...
G = t t
10 20 30 40 50 GO· 70· 80 90 Minutes
l''igure lL Composite Mean Dissolution Profile Curves.
------'-;-- l
Page 76
'
TABLE XIV
Summary of Physical Property Data for the 1 ~rocfucts
· Mean Tablet Mean Tablet /Disintegration Mean Dissolution Product Weight, mg Hardness, kp Time, min Rate? TeO%' minq
A. 178.5 3.5 11.43 I 25.0
B 300.4 3.5 1.47 14.5
c 349.1 10.3 1.03 10.5
D 176.2 4~9 4.05 . I 88.5
E 206.2 4.1 3.68 36.0
F 180.3 6.9 11.93 21.0
G 228.9 9.1 0.73 I 30.0
"Mean Dissolution Rate,· Tso% in )nin .• represents the val[ue as extrapolated from the Dissolution Profil~s Curves and is the time i
1
n minutes required for 60% of the labeled amount of Phenobarbital in the t:ablets to dissolve. I
I Q') Q')
Page 77
TABLE XV
Standard Curve Data for EMIT Phenobarbital As::;;;ay . I
Serum b.A - 6.A0
Values at 340 nm Phenobarbital Concentration;
1-!g/ml Trial I. Trial.II Trial III M~an .:_S.D.
·o.s 0.059 0.057 0'.053 I 0. 0156 2: 0. 0031
1:.0 0.086 0.083 0.080 0. 0183 + 0 0 0030
2.0 0.109 0.111 0.108 0.119 :t. 0.0015
4.0 0.154 0.151 0.151 0.1.52 + 0. 0017 I -
8.0 0.197 0.194 0.195 0.1:95 + 0.0015 I I
0') ....:!
~
Page 78
liWI!& --. IT rrrmm.
0.250
OJ90 E .
ir-------·c:------0.150-+-·------------c-- --0
.o
~~_/_e··_o·· _· ~ v f()
~
·:0
0 '<1: <1
i
<! <J
.OJOO 0.090 0~080 0.070. 0.060
0.050
0.040
0.030.
0.020 .. "-=!· lf--="""""""'--lli--o--·.-........fJ----tl---..... 1-. o.so too 2.oo 4.oo a.oo
Serum Phenobarbital Concentration, fL.9 /ml
Figure 12. Standard Curve for the EMIT Phenobarbital Assay.
Page 79
'I' ~~--"--~-'----'-------"
TABLE XV!
Serum Phenobarbital Concentration Levels for Prolduct A
Serum Phenobarbital Concentration, pgfml
Serum . Group - Sub.j ect
.Sampling Time, h.r A-1 A-2 B-1 B-2 B-3 Mean + S.D.
0.5 2.10 1.70 4.50 2.00 4.10 2.88 + 1.31
1.0 2.10 2.25. 4.1'0 2.40 4.00 2.97 + 0.99
2.0 l. 90 l. 90 4,20 3.05 2.40 2.69 + 0.97
4.0 1.85 1.70 3.60 2.70 2.55 2.48 .:!:. 0 .. 76
8.0 1.80 2.00 3.90 3.50 2.95 2.83 + 0.92
16~0 1. 55 1.20 3.20 3.80 3.30 2.61 + 1.16
32.0 1. 35 ·1. 50 3.30 2.60 3.20 2.39 + 0.92 I
64.0 1.30. 1.20 2.70 2.40 1.80 1. 88 + 0. 66
Q') tO
r ··:.- ,. "~·~. '"•'."'i(:...r:~.~ ~ •"," --
Page 80
4.00
~ O'b
:t c: 3.00 0
+= 2 +c CD 0 c 0
(.) 2.00 -.E ·-..0 t.... 0
..0 0 c: Q)
..c. a.. E :::J 'Q)
1.00
-o)fi( o/o~o...___. . .. oY...<....._o. ·. . ~o-- 'Y~
0
I en
0-~ I I I I ' I I ; I I '- I I I I I # I ,p I #-i o 2 .· 4 s 1 a 1s 32 64
Hours '
Figure ·13. Mean Serum Concentration-Time Curve for Product! A ..
I
·-··:;~::.~~~
~ 0
J
Page 81
Serum Phenobarbi.tal Concentration,. 1..1 g/m1
Serum Group - Subject:
Sampling 'T' • . • ~lme: .nr A-1 A-2 B-1 B-2 B ':I -~ Mean + S.D.
0.5 1.00 2.80 0 0.78 2.50. 1.42 + 1.19
1.0 1.00 3.55 0.50 1.75 2.90 1.94 + 1.28
2.0 1. 50 3.00 1.50 2.20 3.45 2.33 + 0.88
4.0 3.20 2.85 2.10 2.10 3.10 2.67 + 0.54
8.0 2.30 2.45 2.20 2.20· 2.90 2.41 + 0.29
16.0 2.75 2.45 2.20 l. 75 1.90 2.21 + 0.41
32.0 1. 65 . 2.50 1. 95 2.00 1.75 1. 99 + o. 37. ! ·.
. 64.0 0.90 1.00 1.55 1.55 1.15 1.23 .:t 0.3l
....:] 1-'
Page 82
E ........ en ~
...
4.00
§ 3.00 += e +c: (1) 0 §
·. _,----· (.) 2.00 ./·. .
=~~
•y""· -0 ...... :0 '-0
..c 0 c:: Q)
..c: a.. E ::s "(1)
CJ)
1.00
\\ •
~·
I
II ( .I .
0 _, I I I I I I I I I I I ' I ' J I :~, I ~~ I . /~ 0 2 4 6 18 16 32 64
Hours Figure 14. Mean Serum Concentration-Time Curve for Product B; "" l:\:1
i
I 1
Page 83
TABLE XVIII
Serum Phenobarbital Concentration Levels for Prbduct C I
Serum Phenobarbital Concentrs.tion, !l.gjml
Seru..m · · .·Group - Subject ·~
Sampling
I Time, hr A-1 A-2 B-1 . B-2 B-3 Mean + S.D.
0.5 2.90 2.60 1.50 2.25 3.50 I 2.57 + 0.71
1.0 2.40 2.80 2.65 3.20 4.70 , I 3.15 + 0.91.
2.0 2.40 2.80 3.90 3.70 5.10 3.58 + 1.05
4.0 2.00 2.90 4.50 3.20 4.30· 3·. 38 + 1. 03
8.0 2.20 2.40 3.20 4.00 4.00 3.16 + 0.85
16.0 2.10 2.60 3.40 3.80 3.80 3.14 + 0.76
32.0 2.60 2.70 3.55 3.40 2.90 3.03 + 0.42
64.0 2.10 2.10 3. 1i5 2.65 1.90· 2.38 + 0.51 ...
....:) CJJ
I ·' • __ -- ... - ~' """'"'"~~; ... -... - .v:.:-• ..•. ,, ~~ -
Page 84
...
-E
' ~ ...
c: 0
-o-e· -o-c Q) 0 c 0
(.)
-0 ...... ·-..0 i... 0
..c 0 c C1>
..c: a.. E ::::s s... Q)
U)
4.00r
3.00
..
·~--/ -----·-- .. -- ...... ..,.. .... ~. . . \ I . it
2.00
1.00
I 0 " I I I I I l I I I I I I ' I ' 1-#1 ·1' I •'"--l 0 2 4 6 Sl 16 32 64
Hours 1
Figure 15. Mean Serum Concentration-Ti~e Curve for Product c.
.. -.-··.-:::, .... ~:1;-.~"'~·_ .. ,:- .~-~· ':t. .• (~-.'::..
'I »:o
!
Page 85
Serum Sampling
.Time, hr
0.5
1.0
2.0
4.0
8.0
16.0
.32. 0
64.0
TABLE XIX I
Serum Phenobarbital Concentration Levels for Profuct D
Serum Phenobarbital Conc.entrat.ion, 11 gfml
.Group- Subject
A"""l A-2 B-1 · B-2 B-3 Mean + S.D.
1.50 0.80 1.07 2.95 1.30 1.52 + 0.84
2.70 0.70 2.70 3.75 2.10 2.39 + 1.12
2.95 2.10 2.90 3 •. 20 4.00 3.03 + 0.68
1.90 2.20 2.55. . .3 .15 3.60 I 2. 68 + o. 69
2.65 1.60 3 .. 30 2.75 3.90 2.84 + 0.85
2.40 1.90 2.70 2.70 3.10 2.56 + 0.44
2.60 1.85 2.80 ·2.50 2.80 . 2.51 + 0.39
0.80 2.00 . I
2.4q 1.95 2.30 1.89 + 0.64
·--:.- -~:" c;·;" ·, _, .... ~-~ ·>."-~ ··","S'::··~ -·.:.. , .. :·::· ...... ' .. ·· ·~k .. ·-~· ... l" ... ,.
~ \Jl .·
Page 86
-E ......... en ::l ...
4.00
§ 3.00
0-----· ltJ . tJ I ~~ += e
+c: CD 0 c: 0
(.) 2.00
. tJ 0~0~ -g ...a
ll... 0
..a 0 c: Q)
..c: a. E ::J ,_ Q)
en
~0 1.00
I 0-0 I I I I ' I . I I I I I I I I I f ~ I ,:< I JL--f
6 2 4 6 Sl 16 32 . 64 Hours
I
Figure le. Mean Serum Concentration-Time Curve for Product D.
~~~ -·· -' ·:,"': ) .. · -~· ~-~:. :~~·.;"'··· -.,-. .. :~- -···-~·: ~ .. :~. ,_,._..., ... _ -~-
'I m
Page 87
TABLE XX
Serum Phenobarbital Concentration Levels for Product\E ._1.
Serum Phenobarbital Con.c.entration ,. J..t gjm,l --
Serum Sampling Time, hr A-1
Group - Subject
. I A-2 B-1 B-2 B-3 Mea.n + S.D.
I -
0.5 0.98
1.0 . 1.15
2.0 1. 50
i 1.49 L.'$5 1.30 1..60 l.r :': 0.23
2.95 101-5 1.00 .1.30 1.15 + 0.81
2.1\8 + 0.61 ·. 3.10 2.10 1.80 2.40 I
4.0 1.90 3.15 2.45 1.80 3.10 2 .41~ + o. 64
8.0 1.70 2.85 3.05 3.00 3.10 I 2. 7,r . + o. s9
16.0 2.30 2.80 3.65 3.80 3.55 I
3.22 + 0.64 1-32.0 1. 80 2.50 2.55 3.50 1.66 2.41 + 0.75
1-64.0 1.75 2.10. 2.30 ! 2.15 2.50 2 .ri:> + o. 28
I 'I-I
'i .I I
I
I
I 'I
I 'I !
I I
··"' -'" ;'. -·· _"";•-\""">----<•;:.:
Page 88
-~ en ~ ~
c .Q +-E +c ~ o. c: 0 u
.E :e 0 ..c 0 c: CD
..c a_
E :::s 'Q)
CJ)
~)'l\\ ~I :A,_ ~ I . ~A
3.00
2.00 /A~
6/ .
1.00
0-~ I I I I I I I I I I I I I I I 1-# I -pt. I -P'--j
o 2 4 6 a 16 32 64 I . Hours 1· ·
Figure 17. Mean Serum Concentration-Time Curve for Product E. I
.~- .~~ ·-_ ........ :.~~}<. , .. + ,.. •• ·,,,{' , ..... .:-.,.. : .. •
--J co
Page 89
Serum Sampling Time, hr
0.5
1.0
2.0
4.0
8.0
16.0
32.0
64.0
TABLE XXI
Se:t'um Phenobarbital Concentration Levels for Proruct F
Serum Phenobarbital Concent.ra tion, il g/ml
Group - Subject
"'-J m
Page 90
E
' t
4.00
c 3.00 .Q +-E
-o-c Q) 0 c: 0 (.) 2.00
.E :e 0 .a 0
ffi 1.00 if E ::s i-<D
U)
/~
I .&.
i ; . i
.. . ---------~~---~-- ~. .... - . -,.,-..:._ ...
')A.
' ...
0 • I ! I I I I ' . J i I I I I I I I /L f "'L I ./""'--t
•.• . 7~ ,, ;, -----.
0 2 4 6 8 16 32 64 Hours
Figure 18. Mean Serum Concentration-Time Curve for PropuctiF.
-~· ' •• :~.~- ': ··,.: • ~;·: "< \
00 0
i
j I
J
Page 91
1' ~~--'-'--"-..:....----------"
TABLE XXII.
Serum Phenobarbital Concentration Levels for Prc>duct G I
Serum Phenobarhi tal Concentration$. 11 gjml
Serum Group - Subject
Sampling Time, hr A-1 A-2 B-1 B-2 B-3 Mean + S.D.
0. 5. 1.80 1.60 1.10 0~89 1.30 1.34 + 0.37
1.0 2.90 1.95 2.45 2.80 2.10 2.44 + 0~.42
2.0 3.05 L90 3.35 3.20 3.50 3. 00 +. 0. 64
4.0 3.05 3.40 3.60 3.40 3.80 3.45 + 0.28 . -
8.0 2.80 3.00 3.65 3.75 3.60 3.36 + 0.43
16.0 2. 4!::· 2.80 .3. 80 3.65 3.75 3.29 + 0.62 ' i
32.0 2.15 3.05 3.10 3.30 3.50 3.02 + 0.52 I 2.30
f 64.0 1.70 2.60 2.60 1.95 2.23 + 0.40 ! - t
I
r ~ . ~ 1
f 00 r 1-'.
t ,. , . • f t
f ~ t·
........ _ ....... -····
Page 92
-~ en ::L
.... c 0 ·-...... e +c Q) 0 c: 0
(.)
0 .... ---..c ~
0 ..c 0 s: Q)
..c a.. E ;::,
4~00 - I
.· __ · ~· /.~ .
•
I -- . . ... , t•~.Y-<..._
.\ \
~ II , I
I 0 .. I I . ' I 8
I I I i I I I I I I 1-h?' I . Jf" I 7~ - Ia 16 32 64
Hours I
Figure 19. Mean Serum Concentration-Time Curve for Product G. !
. I
I
00 ~
Page 93
....._
E
' 0'8
~ ...
c 0
+= e 1:· <1) 0 c 0
4.00
3.00
u 2.00
~
·~--• I II/ / ~
~ j/. /·. . Products ..p A= o---o 1 - ~ '
I f I
. . I
_g ¥ .· '8 = ·---· : g ~ C=• II I I ~ 1.00 D = 0 0 I I I
~ I I E = .o. A - r •
1 E tf F = • • I f I I 2 . G -· ' • ! I I I
I i I
a> - 1 I, 1 I (/) . I I
I I I I oe I I I I I I I I I I ' l I I I +7.?1 #- I #---l I
0 2 4 6 ~3 16 32 64 Hours . I .
Figure 20. Composite Mean Serum Concentration-Time Curves.
00 UJ
Page 94
I c 200 0
:,;: e 'E. '- 160 Q)J::.
gx o_ u-E ~ 120 :;) t;j)
~:i.. (/)....-
... ..... Q) 80 Q) > -o,._ c: :::J ::>u
e ~ 40 <( i=· c: c <D
0 :?!
Figure 21 ..
cr B Product
A II
I . I I
Composite Bar Graph of Bean Areas Under Serum Conc11
entration-Time Curves. 'I
l \
I
co ~
Page 95
Product ·
A
B
c
D
E
F-
G
TABLE XXIII
Summary of the Bioavai1ability Data for the 7
Mean Peak Serum Phenobarbital Time of Mean Peak
Concentration, Serum Phenobarbital 11gjml Concentration, hr
-2.97 1.0
2.67 4.0
3.58 2.0
3.03 2.0
3.22 16.0
3.53 2.0
3.45 4.0
-I -I
Products
l J[ean Area Under the
I
Serum Concentration-' Time Curve, (ilg/m1)
.\ x hra
150.88
122.10
186.60
153.38
160.01
176.42
185.16
• I
aMean Area Under the Serum Concentration-Time Chrve (llgfml) x hr wa.s determined by using the "Trapezoidal Rule" for observations over a period of 0 to 64 hr. I
co Cl
Page 96
Product
c
A
TABLE XXIV
Statistical .Analysis of Product A.' BioavaiJ!,ability
0.5
2.57
2.88
A. Experimental Results
Serum Sampling Time~ hr
1.0 2.0 4.0 8.0 16.0 3'12.0
Mean Serum Phenobarbital Concentration;! ~gjml
3.15
2.97
3.58
2.69
3.38
2.48
3.16
2.83
3.14
2.61
C = Reference Product
3 03
2 39
64.0
2.38
1.88
Absorption Scorea
121.95
103.65
aThis value for each phenobarbital determinations
. . i
product represents the total of the serum at all sampling times for ' subjects.
00 0')
Page 97
TABLE XXIV (continued)
I _ _ _ __ -~· -~n-~lysis a~-variance -a~~ ~a:~r~~-An:rsis
Term
Between C and A
Between .Times
Between Subjects
Within c·
Within A
Residual
Total
Degrees of Freedom
1
7
4
39
39
67
79
Sum of Squares
4.19
7.00
29.92
26.54
35.01
24.63
65.74
Mean Square F p
4.19 11.32 < o. 01·
1. 00 2.70 < 0. 05
7.48 20.22 < 0. 001
0.68• 1.32 > 0.10
0.90
s 2=0.37 s = 0.61
00 -..J
Page 98
TABLE XXV.
Statistical Analysis of Product B · Bioavaiilabil~ity
A. Experimental Results
Serum Sampling Time, hr
0.5 1.0 2.0 4.0 8.0 16.0 32.0 64.0 I
Mean Serum Phenobarbital Concentrationl ~gfml I Absorption
Product I Scorea
. I c 2.57 3.15 3.58 3.38 3.16 3.14 a.o3 2.38 . 121.95
B 1.42 1.94 2.33 2.67 2.41 2.21 JJ .• 99 1.23 80.98
C = Reference Product
aThis value for each product represents the phenobarbital determinations at a;ll sampling times for
of the serum 1 subjects.
!
... ,~ ~· .;., ..,;.,.. •,'":;..,(1";::.~ ... :,..-w•" .... -::: -::.,. .........
00 00
Page 99
Term
Between Cand B
Between Times
Between Subjects
Within C
Within B
Residual
Total
TABLE XXV (continued)
B. Analysis of Variance ·and Factorial
Degrees of Freedom
l
7
4
39
39
61
79
.......... _., ~ •• "1-~-· ........
Sum of Squares
20.98
13.26
9.46
26.54
26.86
30.68
74.38
Mean Square
20.98
1.89
2.36
0.68
0.69
s 2=0.46
I
I . Analysis
I .
F p
45.61 < 0. 001
4 .11' < 0. 001
5.13 < 0. 001
1. 01 > 0. 50
s = 0.68
co <0
Page 100
TABLE XXVI
Statistical Analysis of Product D Bioa~~il~bility
A.· Experimental Results
Serum Sampling Time, hr I
0.5 1.0 2.0 4.0 8. 0 16.0 321.0 64.0
Mean Serum Phenobarbital Concentration, ~gjml Absorption
Product I
Scorea - . I
3.S8 3.16 3.14 3.f3 2.38 c 2.57 3.15 3.58
D 1.52 2.39 3.03 2.68 2.84 2.56 2.f>l 1.89 I
C = Reference Product
I
aThis value for each product represents the to tali. of the serum phenobarbital determinations at al+ sampling times for a]l subjects.
i
••,.. '""' ~:~-· ~ ::>:?.._;.',T.>-.:;.r~;~~·~:-.~·C- - ...... "-~"
121.95
97.12
CD 0
Page 101
Term
Between C and D
Between Times
Between Subjects
Within C
Within D~
Residual
Total
TABLE XXVI (continued)
B. Analysis of Variance and Factorial Anal~sis
Degrees of Freedom
1
7
4
39
39
67
79
,. ~·. · ...... ~" ' .
Sum of Squares
~ 7. 71
13.31
17.39
26.54
26.17 ' f
22.:01
60.42
Mean Square
7.71
l. 90
4.35
0.68
0 .~67
2 s =0.33
I '
F
l3.36 I 5.76
]3.18 II
.01
I ~ I
p
< 0. 001
< o. 0'01
< 0. 001
> 0. 50
s = 0.57
<.0 ~ 1-'
Page 102
.--'~' .. .. -- -~
Product
c
.E
TABLE XXVII
Statistical Analysis of Product E Bioavailability
0.5
2.57
1.35
. A. Experimental Results
Serum Sampling Time, hr
1.0 2.0 4.0 8.0 16.0 32.0 64.0.
Mean Serum Phenobarbital Concentration, ~gjml
3.15
1.51
3.58
2.18
3.38
2.45
3.16
2. 74
3.14
3.22
C = Reference Product
3.03 2.38
2.41. 2.16
Absorption Scorea
121.95
90.23
aThis value for each product represents the total of the serum "phenobarbital determinations at alrl sampling times for all. subjects.
~ .... ~.~ . ~-'~ --------~-......:.;.~~~~~-. _ _-··c;_e:::··' ,._, ;c~· ..... ~;···;:·
. ~- ~....... . ;~--~ -~-:~·;. !_0::: . ~·~-:.: .. ~:;;_~~~~- • ::.·-.:_ •. _:_~-
c.o ~
I
Page 103
I I .
TABLE XXVII (continued)
B. Analysis of Variance and Factorial Analysis
Degrees of Sum of He an Term Freedom Squares Square F
Between C and E 1 12.59 12.59 29.98
Between Times 7 12.33 1.76 4.19
Between /
Subjects 4 10.70 2.67 6.36
Within c 39 26.54 0.68 1.06
Within E 39 24.79 0.64
Residual 67 28.30 s 2=0.42
Total 79 63.92
·.:;~~.-::····· - ;".::·;:.... .......... ----------------~~~~ . :.~ .. ' ·~·'.· ... ., ·- ·-
p
< 0.001
< 0.001
< 0.001·
> 0.50
s = 0.65
to w
I ·~
Page 104
,,,, ,,,,,,,,,, "'''' c' ~
TABLE.XXVIII ·<
Statistical Analysis of Product i:.Bioav~ilability
A. Experimental /Results
·serum Sampling Time~ hr
0.5 1.0 2.0 4.0 8,0 16.0 32.0 64.0
Mean Serum Phenobarbital Concentration,. ].Jlgjml Absorption Product
("' 2.57 3.15 3.58 3.38 3.16 3.14 3.02 2.38 .......
F 2.27 2.85 3.53 3.09 3.19 2.92 2.81 2.31
C = Reference. Product
aThis value for each product represents the total of the serum phenobarbital determinations at all sampling times for all subjects.
Scorea
121.95
114.85
c.o . ~ i
i
I -<:~;:f'"tc?~"'"''~:'c" ~ ·'.r ::_ · ::- -- · ~ ;- :;,,-- :;;;~:.:- ~~~:-----~o:=- .;: "_:""- ~ - --"' ' -- J
Page 105
Term
Between C and F
Between Times
Between Subjects
WithinC
Within F.
Residual
Total
.... .... ·'
B.
TABLE XXVIII (continued)
Analysis of Variance and F~ctoria1 Analysis
Degrees of Sum of Mean Freedom ·Squares Square F p
1 0.63 0.63 1.80 > 0.10
.7 11.54 1.65 4. 71' < 0. 001
4 7.92 ·1.98 5.66 < 0. 001
39 26.54 0.68 l. 58 > o. 05
39 16.68 0.43 i
'67 23.76 s 2=0.35 s·=·0.59
79 43.85
···~":· .... · -!··:. ·~· . .;;.. .. ·"<·
.,,_ .- - ·-~··
(.0 CJ1
I,
!1 .
Page 106
-·--· --~--=~·------ ----~·=----~. ·--------·-~:)d~':'\:JI.J,J,.,....,.·; ~
Product
c
G
TABLE XXIX
Statistical Analysis. of Product u·.Bioa~ail~bility
I Oo 5
2.57
1.39
A. Experimental Results
Serum Sampling Time, hr
1.0 2.0 4.0 8.0 16.0 32.0
Mean Serum Phenobarbital Concentration, ug/ml
3.15
2.44
3.58
3.00
3.38 3.16 3.14
3.45 3.36 3.29
C = Refe~ence Product
3.03
3.02
64.0
2.38
2.23
AbsorPtion Sc~rea
121.95
110.64
aThis value for each product represents the total of the serum phenobarbital determinations at atl sampling times for all subjects.
;
_ .. - ,-:, ·:;....--. .-,.-,.,;~ . . ::"" ~->·-· :,. .;, "'-.:.: . . ·.::~?:;:~. ;: .. _ ._-;..~. . . .J-'
..... ~. ,,. ,,._. ..•. ,..__,_._ .·,;::::-- - - -·- --_____ .,_ :~·:.:·:·:.~-:-·;;< -- .:- .=- '"'- -~::::.. :.-::=::- . ._ -·· -~ ·-·· ....:._ . __ -,.
c.o G)
Page 107
Term
Between C and G
Between Times
Between Subjects
Within C
Within·n
Residual
Total·
<:
~--------~--------===-·==-==--------------------,-¥~
TABLE XXIX (continued)
B • .Analysis of Variance. and Factorial Analysis
Degrees of Sum of Mean Freedom Squares Square F
1 1.60 1.60 4.71
7 19.21 2.74 8.06
4 10.06 2.51 7.38
39 26.54 0.68 1. 05
39 25.40 0.65
67 22.67 s 2=0.34
79 53.54
.......... "~; ..... ;· :. :<-~ ·-· ··., •'.
. ~ ': .:·
p
<o.o5
<o. oo1
<0.001
>0.50
s = 0.58
<.0 ..:)
Page 108
DISCUSSIONS AND CONCLUSIONS
For products to meet the compendia! requirements
of the Weight Variation test as stated in the USP XIX for
uncoated tablets, the tablets must conform to. certain
weight variation tolerances which are expressed. in terms
of the percentage difference from the mean weight of a
sample of 20 individually weighed whole tablets.
Uncoated tablets that exhibit a mean weight in the
.range of 130 mg through and including 324 mg are allowed
a 7.5% variation, wherBas uncoated tablets with a mean weight
of more than 324 mg are allowed a 5.0% variation. In ad-
dj_tion, the weights o:f not more than. 2 of the tablets from
the sample may differ from the mean weight by more than the
indicated percentage and also no tablet may differ by more
than double the indicated percentage (56).
Products A, B, C) D, E, F, and G exhibited a mean ..
weight of 178.5, 300.4, 349.1, 176.2, 206.2, 180.3, and
228~9 mg, respectively. All of these products met the com
pendial requirements for the Weight Variation test for un-
coated tablets as stated in the USP XIX (Table III, p. 35).
Content uniformity was therefore also demonstrated through
the Weight Variation test for all of the phenobarbital.pro-
ducts employed in this study.
The USP XIX defines complete disintegration as that
98
uaa :a au ew+
'' I ; '!'
!': •i,·
,'J!
' :I
Page 109
99 ..
state in which any residue of the tablet, except fragments
of insoluble coating, remaining on the .screen of the test ap-
paratus · is a soft mass having no palpably firm core. To
meet the compendial requirement as stated in the USP XIX
Phenobarbital Monograph, phenobarbital tabl~ts mtist com
pletely disintegrate in 30 min {57).
· Products A, B, C, D, Ei F, and G exhib~ted dis
integration times of 11.43, 1.47, 1 .. 03, 4~05, 3.68; 11.93,
and 0.73 min, respectively, with all of the products meeting
the compendial requirement (Table V, p. 39).
For a solid dosage form, suitable dissolution charac~
t;eristics are an important property, since the bioavail-
ability of a drug is dependent upon having that drug .in the
dissolved state.
The mean dissolution profiles for all the products.
tested resulted in smooth uniform curves {Figs.. 4-10, pp. 46,
49, 52, 55, 58, 61, 64). Although the data points at the 5~
10, 15, and 20 min intervals do not fall on the line for
Product F, the curve is the line representing the best fit
since these data points fall within the standard deviation
observed·(Table XII, p. 59, Fig. 9, p. 61).
Dissolution rates are the times taken to release a
certain amount of the labeled drug in a solid dosage form.
The time in minutes required for 60% of the labe~ed amount
of phenobarbital in the tablets t6 dissolve as extrapolated
from the mean. dissolution profile curves was used as the
'B..ii2£&JUiEM LUbE &&& M«<i.&&iM4i&MZW . AWl £LEX ZA
;.
l t' '! . ~
;,-,
,_' \
---·----
Page 110
100
criteria to establish the mean dissolution rate (T60%) of
each product. These values were then used to compare the
mean dissolution rates for the products tested. On this
basis, Product C exhibited the fastest mean TGO%' followed
by Products B, F, A, G, E, and D. On comparison of all
the phenobarbital products tested, Product D exhibited the
slowest mean T60~ (Fig. 11, p. 65, Table XIV, p. 66). This· . /0
~lower rate of dissolution may be due to pharmaceutical
formulation factors.
Even though variations in tablet hardness and in
dissolution were observed for all the phenobarbital tablets
tested, no comparisons can be made because there are no com--
pendial standards at present for these physical properties.
The extent and rate of bioavailability can be charac-
terized by three parameters: 1) peak serum.concentration~
2) time· of peak serum concentration, and 3) the area under
the serum concentration-time curve (AUC). The magnitude of
the peak serum level is a function of the rate and extent of
drug absorption, whereas the tim~ of peak serum concentration
is a function of the rate of drug absorption .into the physi-
ological system. The AUC indicates the relative amount of a
drug absorbed from a dosage form into the physiological system.
Product C attained the highest· mean peak serum con-
centration level of all the phenobarbital products tested
and was followed by Products F, G, E, D, A, and B (Table
XX I I I , p . 8 5 ) .
--------------·-------------·- .
~ ' . 'i
.. i:
.. : . .
.. j;· <.\,
. \ \ .
:• '; .·\.
Page 111
101
The most rapid mean peak serum concentration, 1 hr.
was achieved by Product A {'rable XXIII, p. 85)~ Products
C, D, and F attained their mean peak serum concentrations
in 2 hr (Table XXIII, p. 85). The time of mean peak serum
concentration for Products B and G was 4 hr, while for
Product E it was 16 hr (Table XXIII, p. 85). ·\
Bioavaila1JiJ.lty . is estimated best by the AUC. . Product
C exhibited the greatest mean AUC and was followed by Pro-
ducts G, F, E, D, A, and B (Fig. 21, p. 84, Table XXIII,
p. 85). Therefore, Product C was selected as the refere~ce
product for the statistical analysis by "Analysis of Variance. 11
These analyses of product bioavailability (Tables
XXIV-XXIX, pp. 86-97) demonstrated that there was a sig-
nificant difference among Products C and A (p < 0. 01), Pro
ducts C and B {p < 0.001) 3 Products C and D (p < 0.001),
Products C and E (p < 0.001), and Products C and G (p < 0.05).
However, no significant difference was demonstrated between
Products C and F (p > 0.10).
For dissolution data to be useful in the prediction
of product bioavailability, a correlation between dissolution
rate and the area under the serum concentration-time curve
should exist. In order to demonstrate this correlation among
the p'roducts tested: 1) the mean T60% was established (see
Table XIV, p. 66) and ranked on a numerical scale from 1 to
7, where 1 indicates the fastest mean T60% and 2) the mean
AUC was established (see Table XXIII, p. 85) and ranked
:q •'
'• <'
'.
Page 112
102
on a numerical scale from 1 to 7~ where 1 indicates the
greatest mean AUC. The results of these comparisons are
presented in 'J.'able XXX (p. 103 ) .•
Products A, B, D, E, and G demonstrated no correla-
tion between the mean •r60% and the mean AUC (Table XXX, p.
103). Products C and F demonstrated a definite correlation
between the mean T60% and the mean AUC 0Table XXX, p. 103).
In addition, Products C and F demohstrated very similar mean
peak serum concer\trat ion levels, as well as exhibiting
identical times to achieve their mean peak serum concentra-
tions (Table XXIII, p. 85). Furthermore, the statistical
analysis demonstrated that theie was no significant difference
(p > 0.10) between these phenobarbital products (Table XXVIII,
p. 94). In conclusion, Products C and F can be designated
as pharmaceutically equivalent products that-.are also bio
equi valent. ·
LJL lll!RU1l - .. --- Pt~·-·
t.;
>·
·,; ·,
.. '.
Page 113
TABLE XXX
Correlation Data Profiles for the 7 Products
Dissolution Data Bioavailability Data
Mean Area Under the
Product Mean Dissolution Rate
TSO%' min Rank a Serum Concentration-Time Curve
AUC, (~gjml) x hr Rank b.
A
B
cc
D
E
Fe
G
25.0
14.5
10.5
88 .. 5 '
36.0
21.0
30.0
4 150.88
2 1:22.10
1 186.60
7 153.38
6 1E30. 01
3 176.42
s· 185.16
aNumerical rank assigned to the mean T60% from 1 to 7, where 1 indicates the fastest mean T60%. 0
bNumerical rank assigned to the mean AUC from l.to 7, where 1 indicates the greatest mean AUC.
6
7
1
5
4
3
2
0 Indicates Products that are pharmaceutically equivalent and also b.ioequivalent. 1-' 0 w
.. ·;:~:?:;· .. :~:;::.~~;~~~~.::··: <"":.:- ,. -<--~'"?..::~~~:_5~:\ _;_~· ~;~ . ·-. . I ·~ '. ·-4 ·-~ ~~.~;;;_h: ...... ~~
Page 114
I
SUMMARY
.The physical properties of Phetiobarbital Tablets;
USP, 100 mg, from 7 manufacturers were characterized by
determining tablet weight, weight variation, hardness,
disintegration time, and dissolution rate.
The dissolution profiles for these products were
characterized by using the Beckman Spectrophotometric System,
an analytical instrument specifically designed for tablet dis-
solution studies.
'l'he bioequivalency among these products were also de
termined by conducting bioavailabi1ity studies employing 5
normal, healthy human adult male subjects.
All the products tested conformed to the USP XIX
Weight Variation and Disintegration tests. The physical
property data showed variations in tablet hardness and in
dissolution among the 7 products.
The bioavailability data of these products exhibited
variances in mean·peak serum concentration levels, time of
mean·peak serum concentration levels, and the mean area under
the serum concentration-time curves.
Statistical analyses of the bioavailability data demon-
strated significant differences among 5 of the products, while
1 of the products showed no significant difference in regards
to the assigned reference product.
104
. l
. '· . :
;, ,I
, I\ ' <i •.
t !' ~:: I< t .!:'· j! .{'
1 . ·; . ~.
': ~
'';
-:. > _;,_··
',',1.·
Page 115
------. ----------·--==-. _?_[,_
105
A correlation between the mean dissolution rate and
the mean area under the ~erum concentration~time curve was
observed between 2 of the products tested.
i
j ! ' •{
., '.;
_. ,.;·;. . ~~ :
Page 116
BIBLIOGRAPHY
1. Wagner, John G., J. Pharm. Sci.,_50:359-387 (1961)."
2. Garrett, Edward R., Acta. Pharmacal. Toxicol., 29:1-29 (1971).
3. National Research Council, Division of Medical Sciences, Drug EfficacY, Stud~: Final Report to _:the Commissioner of Food and Drugs, Food and Drug Administrat-ion, National-Academy of Sciences, Washington, D. C., 1969' pp'. 1-2.
4. Ibid., pp. 1, 39.
5. Ibid. , pp. 4~-5.
6. Anon., FDA: J3ep_o~! on Enforcement and Compliance~ 1964, pp. 3-4.
7. op. cit.,(:~) p. 57.
8. Ibid., (3), pp. 61, 63.1> 79, 80, 86, 87., __ 88.
9. Anon., Med. )Vo!:.!E. News, 15:71-88 (1974).
10. Barr, William H., Drug _Inf. Bull., .9.:27-4~ (1969).
11. Brice, George W. and Henry F. Hammer, JAMA, 208:1189-1190 (1969).
12. Blair, Donald C., Roger W. Barnes, E. Lincoln Wildner, and William J. Mur:ray, JAMA, 215:251-,254 (1971).
13 .. ;. Lindenbaum, John,. Mark H. Mellow; Michael 0 .. Blackstone, and Vincent P. Butler, N. _;Engl.!!_. Med., 285:1344-1347 ( 19'71).
14. Varley, Alan B., JAMA, 206:1745-1748 (1968).
15. · Meyer, M. C., G. W. A. Slywka, R. E. Dann, and P. L. Whyatt, J. _!?h_arm. Sci., 63:1693-1698 ( 1974).
106
-...
. ~.'
.<';
,l'
Page 117
107
16. Poole, John W., Se~in. Drug Trea:!:_., 1:148-176 (1971).
17. Koch-Weser, Jan, N. Eng. J. Med., 291:233-237 (1974).
18. Nikore, H. L.~ Indian J. Hosp. Pharm., 4:181-192 (1967).
19. Speiser, P., Pharma Int., 3/71:5-.16 (1971).
20. IJevy, Gerhard and Eino Nelson, JAMA, 177:689-691 (1961).
21. Davis, S. S., Br. Med. J., !:102-106 (1972).
22~ Noyes, Arthur A. and Willis R. Whitney, J. Am. Chern. Soc., _19: 930-934 ( 1897). - -
23. Rosenstein, Sol ana .t-Je'ter P. Lamy, Am. J. Hosp. Pharm., . 26: 598-601 ( 1969) .
24. Sokoloski, Theodore, D.,~· Phar~., 3:15-18 (1968).
25. Blake, Martin I. , J. Am. Ph arm. Assoc. , NS 11: 603-·611 ( 1971).
26. The United St~te~ Pharmacopeia, Nineteenth Revision. Board of Trustees of the United States Pharmacopeia! Convention. Inc., Hockville, :MD, 1975, pp. XVI, 705.
27. Pocock, Stuart. and C. T. Rhodes, Can. J. Pharm. Sci., 9:61-63 (1974).
28. ~E· cit. (26) p. 650.
29. Ibid., (2~), p. 651.
30. Ibid., (26), pp. 651, 706.
31. Harris, Lewis E., Drug and Cosmet. Ind., 106:42-43, 138-139 ( 1970) .-. - -
· 32. Academy of Pharmaceutical Sciences, Guidelines For Biopharrnaceutical Studies· In :11-fa·n;- American -Pharmaceutical -As.socia.tion-,-Washington~ D. C., 1972, p. 6.
33. Harris, Lewis E., Drug and Cosmet. _!nd., 107:38-40, 143 (1970).
34. Hayes, Thomas A., pyug ~nd Cosmet. Ind., 109:44-47, 132-138 (1971).
35. Moss, Jack N. and C. T. Rhodes, Can. J. Pharrn. 9:30-31 (1974).
•' . ; •'
~: _l, -
~· 1: .~t tr, • ·~ • ~ ~ .) (l
\
. . ~
Page 118
36. National Prescription Audit: General Information --Report., HIS-~America, Ltd.~ Ambler, PA, 19'74,
pp. 22-25.
37.
38.
Sedam, .Richard L., Alfonso R. Gennaro, and Arthur Osol, J. P!_F~£El· Sci., 54:215-218 (1965).
Leuall"E;n··, E. E.·, J. Am. Pharm. Assoc. Pract.· Ed~ · 10:722--724 ( 1949 )-. -- '
"108
39. Krause, George M. and John.M. Cross, J. Am. Pharm. Assoc. Sci .. Eq., 40:137-139 (1951)-:- --
LJO. Urdang, Arnold and E. Emerson Leua1len, J. Am. Ph~. Assoc. Sci. Ed., 45:525-526 (1956). ---- ---- - - .
41. Edmonson, 'I'. D.. and J: E. Goy an, J. Ain. Ph arm. Assoc. Sci. Ed. , :1'{.; 810-812 ( 1958). - - ----
42. Mesley, R. J., R. L. Clements, B. Flaherty, and K. Goodhead, J.. 1-:!_larm. Pharmacol. , 20:329--340 ( 1968) .
43. Clements, J. A. and D. Stanski 3 Can. J. Pharm. Sc_:!:_. , 6:9-14 (1971).
44. Jacob, James ~I'. and Elmer l\L Plein, J. Pharm. Sci. _57: 798-801 ( 1968).
45. Jacob, James '1'. and Elmer M. Plein, J. Pharm. SeL 57: 802-805 ( 1968) •·
46. Solvang, Sissel. and Per Finholt, J. Pharm. Sci., 59:49-52 (1970).
47. op. cit. (26), pp. 670--671.
48. Ibid. (~6), p. 650.
49. Beckman Instr~ments, Inc., Industrial Product Data Sheet: Model 25-7 System for Tablet Dissolution Testing, Fuilerton. CA, _19?4.
50. Booker, Harold E. and Barbara A. Darcy,· Clin. Chern., . 21:1766-1768 0.975).
51. Syva, C6rp., Emit Antiepileptic Drug Assays, Palo Alto, CA, 1975.
52. Syva Corp., Syva Timer/Printer, Palo Alto, CA, 1975.
.. :'1
. I
,: i
i
l• I '· ,.,
, I
\"
. .,
Page 119
109
53. Syva Corp., Syva PipettorfDilutor, Palo Alto, CA, 1975.
54. Ritschel, W. A., Handbook of Basic Pharmacokinetics, Drug Intelligence Publication-,-I-nc., Hamil ton, IL, 1976, pp. 238-240.
55. Wagner, John G., Biopharmac~eutics and Relevant Pharmacokinetics, Drug Intelligence Publication, Inc., Hamilton, IL, 1971, p. 18L·
56. .2£· ~it., (26)1, p. 67L
57. Ibiq., (26), pp. 373, 650.
58. Anon., J. Pharmacokinet. Biopharm., 2:433~466 (1974).
-
·T•
;;,i' ,;.
'l .~· '· ,_, ... f ~ ~.'·
)_.
Page 120
----------------------------------------------------.__.._,. • ._._._~-.~r•-~'~WW w.
APPENDIX
Glossary of Terms (58)
Drug Product
Chemical equivalents
Pharmaceutical equivalents
Bioavailability
Bioequivalents
Therapeutic equivalents
Interchangeable drug products
A dosa~e form 66ntainirtg 6rie or more active therapeutic ingredients along with other substances incl~ded during the manufacturing process ..
Drug products that contain the.same amounts of the same therapeutically active ingredients in the same dosage forms and that meet present compendia! standards.
Drug products that contain the same therapeutically active ingredients in the same dosage forms and that meet standards to be established on the basis of the b~st available technology,
The extent and rate ·of absorption from a dosage form as reflected by the concentration-time curve of the administered drug in the systemic circulation.
Chemical equivalents which, when administered to the same individuals in the same dosage regim~n) will result in comparable bioavailabil1.ty.
Chemical equivalents which, when administered to the same individuals in the same dosage ~egimen, will provide essentially the same efficacy and/or toxicity.
·Pharmaceutical equivalents or hieequivalents that are accepted as therapeutic equivalents.
110
;i
• ,t,
' i
'' ' ( .:. t'
.....