'' CHARACTERISATION OF THE SOILS OF MASHURU AREA WITH RESPECT TO THEIR GENESIS AND CLASSIFICATION ^ BY FENDO M.jSHITAKHA dl8 ‘ \N U A c o ‘ '■* UN1V 1 * II’ 1 THESIS SUBMITTED IN PARTIAL FULFILMENT FOR THE DEGREE OF MASTER OF SCIENCE IN SOIL SCIENCE, DEPARTMENT OF SOIL SCIENCE, FACULTY OF AGRICULTURE UNIVERSITY OF NAIROBI APRIL 2000
Transcript
'' CHARACTERISATION OF THE SOILS OF MASHURU AREA WITH RESPECT TO THEIR GENESIS AND
CLASSIFICATION ^
BYFENDO M.jSHITAKHA
dl8 ‘
\ N U A c o ‘ '■*
UN1V 1 *
I I ’ 1
THESIS SUBMITTED IN PARTIAL FULFILMENT FOR THE DEGREE OF MASTER OF SCIENCE IN SOIL SCIENCE,
DEPARTMENT OF SOIL SCIENCE,FACULTY OF AGRICULTURE
UNIVERSITY OF NAIROBI
APRIL 2000
DECLARATION
This thesis is my original work and has not been presented for a degree in any other University.
FENDO M. SHITAKHA ^
This thesis has been submitted for examination with our approval as university supervisors.
Signature:Prof. J.P. Mbuvi
X -f l 0 *
Signature: _Ll ^ / /~wv0Dr. Kithome Musolini
t
TABLE OF CONTENTS
Declaration.....................................................................................................................................iTable of Contents.........................................................................................................................iiList of Tables................................................................................................................................vList of Text figures...................................................................................................................... vAbstract.........................................................................................................................................viAcknowledgements....................................................................................................................viiDedication.................................................................................................................................... ix
CHAPTER ONE: INTRODUCTION1.1 General introduction........................................................................................................ 11.2 Background to the study area......................................................................................... 31.3 The study objectives........................................................................................................4
CHAPTER TWO: LITERATURE REVIEW2.1 Introduction...................................................................................................................... 52.2 Geographical location and communication...................................................................72.3 Influence o f soil forming factors..................................................................................102.3.1 Parent m aterial...............................................................................................................102.3.2 Weathering and clay formation.....................................................................................132.3.3 Movement of materials within so ils ............................................................................ 162.4 C lim ate............................................................................................................................192.4.1 Temperature................................................................................................................... 192.4.2 Rainfall........................................................................................................................... 202.5 Relief................................................................................................................................222.6 Living organisms...........................................................................................................242.7 Time................................................................................................................................. 26
n
HAPTER THREE: SOIL SURVEY AND RESEARCH METHODS1 Previous soil studies in the area....................................................................................282 The present study...........................................................................................................292.1 Office methods..............................................................................................................291.2 Field methods..................................................................................................................30!.3 Laboratory methods......................................................................................................311.4 Cartographic methods...................................................................................................34
IAPTER FOUR: RESULTS AND DISCUSSIONl General properties of the soils..................................................................................... 37l.l Soils of the hills............................................................................................................38l .2 Soils of the footslopes...................................................................................................42. .3 Soils of the uplands...................................................................................................... 44.4 Soils of the piedmont plains.........................................................................................52.5 Soils of erosional plains................................................................................................54.6 Soils of the volcanic plains.......................................................................................... 58.7 Soils of the bottomlands.............................................................................................. 62
Soil classification, correlation and genesis................................................................. 65. 1 Major classification units.............................................................................................66.2 Soil genesis................................................................................................................... 69.2.1 Influence of parent material............................................................................ 70.2.2 Influence of climate........................................................................................... 84.2.3 Influence of relief...............................................................................................85
CHAPTER FIVE: SUMMARY AND CONCLUSIONS.................................................... 97References.................................................................................................................................... 101AppendicesAppendix 1: Description and classification of the representative
soil profile pits with analytical data.............................................................. 113Appendix 2: Soil map of part of Mashuru Division (Kajiado District)
scale 1:50,000............................................................................................ in folder
IV
LIST OF TABLESTable 1: Average monthly rainfall at Simba Railway Station (in m m ).....................21
Table 2: Petrographic analysis o f rock samples of Mashuru area.............................. 70
Table 3: Sand mineralogy composition of the samples................................................. 71
Table 4: Geochemical composition of selected soil sam ples...................................... 72
Table 5: Percentages of pyrophosphate (Fep), oxalate (Feox)
and dithionite (Fed) extracTable iron oxide and active
Fe ratios in so ils ................................................................................................ 78
Table 6: Results of pF-analyses..........................................................................................90
Table 7: Porosity and bulk density................................................................................... 91
Table 8: Available nutrient classification.........................................................................92
Table 9: Available nutrient (0-20 cm ).............................................................................. 93
Table 10: Total nutrient reserve.......................................................................................... 95
LIST OF TEXT FIGURESFigure 1: Location map of the survey area....................................................................... 9
Figure 3-4: Depth functions o f extractable iron oxides
in profiles 174/1-1 and profile 174/1-3.........................................................81
Figure 5-6: Depth functions o f extractable iron oxides
in profile 174/2-2 and profile 173/2-4.......................................................... 83
Figure 7a and 7b: Schematic cross sections showing influence
of relief on soil developm ent.......................................................................... 88v
ABSTRACT
Soils are a component o f the ecosystem vital for the maintenance of the land-based life-support systems and hence, reliable soil information is essential in planning for sustainable development and environmental conservation. Nevertheless, reliable soil information required for development planning is scarce. A semi- detailed soil survey of an area in Mashuru division, Kajiado district was conducted with the principal objective o f mapping and characterizing the soils. Specifically, the morphology, mineralogy, physical and chemical properties o f the soils were studied. The soils were classified according to FAO/UNESCO (1994) and SOIL SURVEY STAFF (1992) versions. The survey provides information on the area’s major soil types and their distribution. A physiographic soil map at scale 1:50,000 is presented while interpretative soil information is presented in Tables.
The soils mapped in the area include Ferralsols, Vertisols, Cambisols, Leptosols, Acrisols, Luvisols and Lixisols. Ferralsols are found on uplands and erosional plains. Shallow Leptosols occur on the hills and scarps while brownish sandy clay to clay Acrisols occur on the footslopes. Luvisols are found on uplands and on volcanic plains while Lixisols are found on erosional plains. The saline-sodic Vertisols are found in the bottomlands whereas Cambisols occur on the piedmont plains and volcanic plains. Based on parent material, relief, climate and soil characteristics, four genetical groups of soils have been identified in the area. The Vertisols with high sodium contents and unique physical properties constitute the first group. Ferralsols and Cambisols with an irregular clay distribution in the profile form the second group. The Acrisols, Luvisols and Lixisols constitute the third group because o f the higher clay contents in the subsoils. The last group consists o f the shallow Leptosols. These soils are developed on various volcanic rocks and basement system rocks and occur in agro-climatic zone V.
The soil forming factors of parent material (geology), climate (past and present) and relief have played a significant role in the morphology, chemical and physical properties o f the soils o f the area.
vi
ACKNOWLEDGEMENTS
I would like to thank everybody whose physical or moral participation helped me carry out this
work to completion. First, I would like to express my sincere gratitudes to my supervisors Professor
J.P. Mbuvi and Dr. Kithome Musolini for their continued support and guidance during all the
execution stages o f this work. It is not however possible to mention everybody and every institution
that contributed, but the following people and institutions have been singled out.
First, the Kenya Agricultural Research Institute, for granting me the chance and study leave to
follow the MSc. Course at the University of Nairobi and the Kenya Soil Survey Project
through the Netherlands Liaison Office (NLO) for the financial support.
I would like to thank the Department o f Soil Science, University of Nairobi for giving me the
chance to follow the course and at the same time providing a conducive environment for my
study.
The Mines and Geology Department for analyzing some of the samples and the National
Agricultural Research Laboratories for their tireless efforts to analyze most o f the samples
during the period o f study.
My appreciation and gratitude goes to the following:
All the staff of Soil Science Department, University of Nairobi, for scientific and technical support.vii
Messrs. P F Okoth, S.N. Wanjogu, A.E. Ekirapa and W.W Aore, for professional comments, advice and encouragement.
Mr M.O Aguno o f Kenya Soil Survey library for giving me access to reports and relevant documents.
Mr Michael Ngaru and Thomas Ondigo, the driver, for endurance in the difficult field survey conditions.
.Messrs Kimigo and Kimanthi for their assistance during the analyses o f samples.
Mr. I. Osiemo for cartographic assistance and KSS (GIS staff) for digitizing the map.
Mr. Owiti Abok fortyping this report.
Final acknowledgements are extended to all who have helped in many aspects.
viii
DEDICATION
This thesis is dedicated to Millicent, Laetia, Chris, Cindy and Alex
IX
CHAPTER ONE: INTRODUCTION1.1 General introductionThe Arid and Semi-arid Lands (ASAL) in Kenya comprise about 455,408 km: which is more than four-fifths of the country's total land surface and support over 35% of the total human population (Darkoh, 1990). Rainfall reliability in these semi-arid areas is very low, sporadic and always punctuated with constant failures and continued drought.
The study area is located in Mashuru Division of Kajiado District. The area is an ASAL and is approximately 15km from Emali town along the Emali-Loitokitok Road. The area lies between longitudes 37° 251 and 37° 30‘E and latitudes 2° 051 and 2° 15‘S. The project area has a ratio of mean annual rainfall to mean annual evaporation (r/E0) of 0.25-0.40 placing it in agro-climatic zone V. The average annual rainfall is in the range o f 500-600 mm and mean annual temperature is 18-20°C (Sombroek el al., 1982). Major limitations to crop production include rainfall, husbandry techniques and soil fertility.
Due to a limited acreage of farmland and a high population increase rate of 3.4% (National Development Plan. 1997-2001), Kenya is currently facing land scarcity. The high rate of population increase is causing pressure on land especially in the high rainfall areas. As a result, there has been a recent acceleration o f migration into the ASAL. This often leads to land degradation and crop failure due to unreliable rainfall and unfavourable soil conditions. To keep up with a population growth rate of 3.4% , food production must increase at the same rate or higher. It is becoming increasingly difficult to maintain such food production rate because the rainfed areas are already overpopulated and overused. In order to attain self-sufficiency in national food requirement, the Kenya Government drew up a national food policy in the session paper No 1 of 1996, outlining the objectives, constraints and strategies of maintaining a position of broad self-sufficiency in production o f the main foodstuffs so as to enable the nation to be fed without using scarce foreign exchange on food imports. A feasible alternative is to open up semi- arid areas for agricultural production. Unfortunately, these are the areas that have the so called
1
“problem soils” (Muchena, 1982). The problems in these regions include crusting, impeded drainage, salinisation, sodification and low rainfall. These areas were formally designated as ranching zones with very fragile ecosystem. An alternative use of such an environment requires careful planning and proper management.
Soils should be considered at all levels of land related planning. No meaningful agricultural development can take place without proper knowledge o f soils. Soil survey can provide information on soil characteristics and their distribution. It involves the description and characterization o f soils as they occur naturally in the environment, their classification and location on a map. The soil data, maps and classification enable the environment to be characterized so that an interpretation can be made from the data about the suitability, capabilities and limitations of areas of land for various uses. Using soil maps, soil and land resources can be managed properly in order to achieve optimum yields of specified crops. Soil losses through erosion can also be predicted and control measures established where losses are excessive. Soil data gathered from soil surveys can also be used for correlation purposes with other areas of similar environment.
Kenya Soil Survey section of the Kenya Agricultural Research Institute carries out soil surveys in the country both for national planning and for land utilization. Among the many duties assigned to the Kenya Soil Survey is soils research with a view to the identification o f constraints for optimal agricultural production which is currently a matter o f national importance. Constraints include soil parameters such as acidity, toxicity, salinity, sodicity, credibility, lack of foot hold, unavailability of moisture and soil nutrients and unfavourable soil mechanical characteristics.
As part of the Kenya Soil Survey work programme, Kajiado District was selected for a reconnaissance soil survey starting in Mashuru Division. The area has been under group ranches and is currently being converted to small scale farming involving growing o f maize, beans, potatoes, onions and tomatoes. Because this is done without proper knowledge of soils, there is an
2
urgent need for soil information in this low rainfall area in order to assess the hazard of land degradation and at the same time introduce appropriate technologies and management practices for sustained agricultural production.
1.2 Background to the study areaThe study area is confined within agro-climatic zone V which is semi-arid (Sombroek et al., 1982). Analysis o f rainfall data for the two wet seasons indicate that the study area receives about 50% of the total annual rainfall during the March-May seasons and 30% during October to December season (Kajiado District Development Plan, 1997-2001). The general topography is characterized by plains and volcanic hills. The plains are dissected by several valleys. Group ranching has been the main land use until recently. The semi-arid climate does not only affect the type of agriculture that can successfully be practiced in the area but also poses a problem on soil conditions. The high temperature favour rapid decomposition of organic matter when the soil is ploughed. Removal of vegetative cover exposes the soil to high evapotranspiration rates removing some of the water that would have been used by plants. The solution to these problems is management methods appropriately designed for them e.g. mulching.
Severe water shortages pose a major constraint to agricultural production. The area is served by Noilturesh water pipeline and supplemented by boreholes, shallow wells and water pans. Most of the boreholes are non operational due to poor maintenance and management. The water sources available are not protected and as a consequence, water for domestic use is fetched at the same source where livestock is watered.
Except for the Emali-Simba tarmac road, the study area is poorly accessed. The Emali-Loitokitok road is in a poor state and hence more access roads are required in the newly sub-divided group ranches to allow access of farm produce to the market.
3
The existing soil map of the area is of a small scale (1:250,000), Touber (1983). This scale of mapping is not adequate for proper land use planning at the farming level, hence the reason for the current study at a large scale 1:50,000.
1.3 The study objectivesThe broad objective of the current study was to map and characterize the soils o f Mashuru area of Kajiado District. The underlying principle is that soil is a component o f the ecosystem vital for the maintenance o f the land-based life-support systems and hence, reliable soil information is essential in planning for sustainable development and environmental conservation.The specific objectives are:1. To identify and map the soils and other terrain features of the area2. To characterize the soils in terms of their physical and chemical properties and mineralogical
composition3. To classify the soils according to the two international systems used in East Africa i.e.
FAO/UNESCO and USDA soil classification systemsTo achieve these objectives, a semi-detailed soil survey was conducted in the study area. A physiographic soil map at scale 1:50,000 (appendix 2) was produced and interpretative soil information is presented in Tables. This information is intended to contribute to long-term understanding and planning for sustainable management in the project area.
4
CHAPTER TVVO: LITERATURE REVIEW
2.1 IntroductionThe term ‘pedology’ is used widely throughout the world but in different contexts. In the European sense, pedology has been used synonymously with ‘soil science’ (Buol et al., 1989). The same author defined pedology as ‘a phase of soil science that deals with factors and processes of soil formation including description and interpretation of soil profiles, soil bodies and patterns of soil on earth’s surface. The concept of pedology as used in this review is the science of soil development (Sposito & Reginato, 1992). More specifically pedology is defined herein as ‘that component of earth science that quantifies the factors and processes of soil formation including the quality, extent, distribution, spatial variability and interpretation of soils from microscopic to megascopic scales” .
Pedology is both an interpolative and extrapolative science (Wilding, 1986; Sposito & Reginato, 1992). The discipline provides a hierarchical framework to integrate components of soils (e.g., mineral structures, mineral-organic complexes, soil aggregates, and soil horizons) into basic soil individuals called pedons. Pedons are assembled into toposequences, which in turn comprise regional physiographic units that collectively represent the pedosphere or global soil cover. Pedology provides the basic framework to examine soils at various scales of resolution using different methodologies so that the system can be viewed in holistic terms for component integration and system extrapolation (Arnold, 1991).
Dokuchaev (1883) established that soils develop as a result o f the interplay of the five factors i.e. parent material, climate, organisms, topography and time. The first four are the tangible factors reacting through time to create a number of specific processes leading to horizon differentiation and soil formation. The pioneering work of Jenny (1941, 1980) demonstrated methods by which the soil system could be quantitatively investigated. It gave forth to a more scientific approach by
5
synthesizing conceptual ideas into a mathematical syllogism - a more scientific grounding topedology.
Smeck et al. (1983) comprehensively evaluated the strengths and weaknesses of pedogenic models including the factorial analysis model of Jenny (1941). The factorial model states that soil (S) is a function of climate (cl), organisms (o), topography (r), parent material (p) and time (t). It is expressed as
S = f (cl, o, r, p, t, ...)where the dots indicate additional unspecified factors. Accordingly, the factors define the soil in terms of controls on pedogenesis and soil distribution factors.
Jenny (1941) originally hoped that the equation could be reformulated into quantitative expressions which could be solved to predict soil types and properties on the basis of state factors. This has proved to be difficult, and likely impossible, because of difficulties in quantifying the
broadly-defined factors, the interdependence of all but the time factor (Yaalon, 1975), and because in its most general formulation the system is undetermined (Phillips, 1989). An inability to ‘solve’ this equation does not diminish the utility of the state factor model as a conceptual framework (Birkeland, 1984; Phillips, 1989; Amundson and Jenny, 1991).
Perhaps one of the major limitations of the state factor model as viewed from breakthroughs in modem pedology is the recognition and general acceptance that soils are developed along polygenetic pathways, on dynamically evolving landforms under the influence of paleoclimates, in non-uniform parent materials and through combinations of processes (Simonson, 1978; Wilding, 1986). This has enhanced the morphogenetic model of soil and moved us farther from purely genetic concepts. This backdrop serves as a yardstick in evaluating possible constraints of Jenny’s factorial model. The following should be considered as limitations to the model:1. Independence of state factors.2. Extension to older landforms.
6
3. Poly genetic pathways o f soil genesis.4. Factor interchangeability.5. Anthropogenic influences.6. Knowledge o f precise processes.7. Difficulty in testing and validating models.
Application of factorial model to recent or late Quartemary landforms probably has the best opportunity for success. Extension to older landforms are more risky because of greater probability of factor interactions and multiple polygenetic pathways of soil genesis (Simonson, 1978). Examples of this have been reported by Wilding and Flach (1985) for many properties and diagnostic horizons in soils including: albic, spodic, cambic, argillic and calcic.
The human influence confounds factor variables - liming, drastically disturbed lands, drainage of wetlands, compaction, irrigation, salinity/sodicity (Fanning & Fanning, 1989). Anthropogenic influences on pedogenesis were not outside the scope of the first text by Jenny (1941) but were given more prominent consideration in his last text (Jenny, 1980).
It is not easy to rigorously reconstruct the time effects on pedogenesis (Van Cleave et al., 1991). Numerous chronosequences have been offered in literature (e.g. Birkeland, 1984), but establishing such effects on resultant soil attributes are still open to question.
2.2 Geographical location and communicationThe study area is situated between longitudes 37° 25’ and 37° 30’E and latitudes 2° 05’ and 2° 15’S. It covers an area of about 216 km2 within Mashuru division of Kajiado district. The area lies between Simba and Emali and is about 15 km from Emali along the Emali - Loitokitok road. The area is found on topographical map sheet Nos 174/1 (Simba) and 173/2(Sultan Hamud) scale 1: 50,000 (Survey o f Kenya, 1974).
7
The area can be accessed using the Emali - Simba tarmac road. Also, the Emali - Loitokitok road traverses the area in a North - South direction. The Mombasa rail line passes through Simba and Emali on its way to Nairobi. The access roads are suiTable only for four wheel drive vehicles. Figure 1 shows the location of the study area.
8
F io 1 • I .n rs itin n IYI iin n f th p S tu rlv A rp n
imba
KEY
O
Study area boundary Rail line Road Track Town
.Hill River
SOMALIA
2.3 Influence of soil forming factors2.3.1 Parent materialParent material can be classified according to the mode of origin, that is igneous, metamorphic and sedimentary rocks. Further subdivisions can be done using the chemical composition of the rocks into acid, intermediate, basic and ultra-basic groups. These groups give an indication of the rate of weathering and the type of soils likely to develop (Birkeland, 1984). For instance, basic rocks weather easily giving rise to clayey materials whereas acid rocks are more sTable and result in the formation o f sands on weathering.
The nature of the parent material influences the morphologic, chemical, physical and mineralogic characteristics of the resultant soils (Wanjogu and Mbuvi, 1995). In their study of two catchments in Laikipia district, they found that the nature of parent material and the processes that they have undergone were reflected in the mineralogy of the sand fraction of the soils and the textural breaks.
Touber (1983) described how parent material clearly affected soil formation. He observed that non-calcareous, rocky and stony soils have formed on basement system hills whereas black, very friable and smeary soils with Humic topsoil have been formed on pyroclastic rocks. A variety of other soils rich in silt occur on olivine basalts and other volcanic rocks.
An ecological study on the influence of parent material was carried out in Blackhawk Island, USA. The island supports a continuous gradient of soil texture from sand to clay loam soils, and associated vegetation from pine to sugar maple (Pastor et al., 1982). The overall gradient has been used to examine the relationship between N availability, N cycling and primary productivity in forest ecosystems (Pastor et al., 1984). The results suggest that N availability is the proximate factor controlling vegetation composition and productivity. However, N availability is not an independent factor-rather its determined by soil-plant interaction on both short and long term scales (Pastor and Post, 1986). The texture of soils parent material is the ultimate controlling
10
factor; its effect on N availability is mediated through the effects of soil texture on moisture availability and o f clay content on the stabilization of soil organic matter (Parton et al; 1987).
Soils developed from volcanic materials are known to have morphological, chemical and physical properties different from those of other mineral soils developed under similar climatic conditions (Wada, 1985). In addition to a low bulk density, these soils are often characterized by surface areas as high as 600 nrg 1 and are capable of retaining 40 to 142% water expressed on an oven- dry weight (Maeda et al. 1977). They have high phosphate retention and organic C (Shoji and Ono, 1978). These unique properties are commonly associated with the presence and abundance of amorphous constituents and/or metal-humus complexes (Wada, 1980). Mohr et al. (1972) describes volcanic ash deposits (ash, pumice, tuff) as parent materials that probably control soil formation more than any other parent materials. Although they develop into Andosols, other soils such as Ferralsols form on old volcanic ash. An important but often undetected effect of parent material is the effect of volcanic eruptions on soils downwind of the eruptive centres. The effect was studied in the Kisii area (Wielmaker, 1979; Wielmaker and Boxem, 1982) where it was found to be very extensive and very important for soil formation. In Kiboko area (Michieka and Van der Pouw (eds.), 1977) reported a very limited volcanic ash influence north of the Chyulu Hills. Under conditions of relatively flat topography without free drainage, volcanic ash enrichment may contribute to the formation of fine textured soils with Vertic properties.
Birkeland (1984) observed that parent material influenced many soil properties to varying degrees. It’s influence is greatest in drier regions and in the initial stages of soil development. In wetter regions, and with time, other factors may overshadow the influence of parent material. Parent material, whether mineral or rock, exerts some control on the clay minerals that form because weathering releases constituents essential to the formation of the various clays (Sposito and Regnato, 1992). Parent material act on soil formation via its texture and chemical composition. Parent materials with a fine texture, and consequently low permeability, give rise generally to shallow soils. Permeable parent material are favourable for the formation of deep
11
soils. Materials consisting of resistant minerals such as quartz, orthoclase, microline, biotite and muscovite resist soil formation considerably and give rise to shallow soils (van Reeuwijk, 1994). In the opposite direction act materials with easily weatherable minerals, such as plagioclases, olivine, leucite, augite, hypersthene and volcanic glass.
According to geological surveys carried out between 1953 and 1956 (Searle, 1954 and Saggerson, 1963) the rocks o f the area can be subdivided into Basement System rocks and Quaternaryvolcanics.
The Precambrian Basement System rocks consist of gneiss which can be sub-divided into gneisses that are poor in ferro-magnesian minerals and gneisses rich in ferro-magnesian minerals (Searle, 1954 and Saggerson, 1963). The former are composed of mainly quartz-feldspar and granitoid gneiss, chemically poor Basement system rocks. Due to their relative hardness they form most of the hill masses in the project area. The gneisses rich in ferro-magnesian minerals include mainly biotite-hornblende, biotite and hornblende-garnet gneisses together with amphibolites. These chemically richer Basement System rocks occur in the eastern part of the project area (Searle, 1954 and Saggerson, 1963).
Volcanic activity has significantly enriched large areas of Basement System rocks with volcanic material. This enrichment coincided with major volcanic activities during the pleistocene time. It took place either directly, through deposition, or indirectly through redeposition (e.g. colluvia) of volcanic materials (Searle. 1954 and Saggerson, 1963). The volcanic cones and associated lavas of the Sultan Hamud - Simba area are considered as the north-westerly representatives of, and contemporaneous in age with, the Chyulu basalt range which lies to the south-east of the project area. Various olivine basalts of pleistocene age occur together with breccias, agglomerates and ashes in the Simba-Emali area.
12
2.3.2 Weathering and clay formationWeathering is the process of disintegration and decomposition of rocks and minerals under atmospheric conditions (Niewenhuyse and Van Bremen, 1997). It transforms the original rock into soil parent material. Knowledge about mineral weathering and neoformation in soils is important for estimating (i) nutrient supply by weathering (Stoorvogel, 1993) (ii) accepTable annual soil loss by erosion (Wischmeier and Smith, 1978) and (iii) the rate of buffering of soils by acid rain (Van Grinsen, 1988). There are two forms of weathering: physical and chemical.
2.3.2.1 Physical weatheringPhysical weathering is the process whereby rocks and minerals are cracked, crumbled, crushed and mellowed (Niewenhuyse and van Bremen, 1997). The result is a material that varies in size from boulders to very fine particles. The chemical composition of the rocks and minerals is not changed, hence, physical weathering is a mechanical disintegration of the solid mass that causes a change in shape, form and size of the rock and mineral debris (van Reeuwijk, 1994). Physical weathering is favoured by temperature variations, alternating heating and freezing, erosion agents such as moving water and wind, and by the activities of man and other living organisms. This kind of weathering is dominant in cold or desert climates.
2.3.2.2 Chemical weatheringChemical weathering is the decomposition of the complex substances of rocks and minerals into compounds with a lower energy content (Niewenhuyse and Van Bremen, 1997). Some of these decomposition products dissolve and others are emitted as gases. The bulk o f them, however, remain in place.
Chemical weathering gives rise to: (i) soluble material that are generally salts able to release ions which either become exchangeable or are leached; (ii) colloidal gels by hydration and polymerization o f the heavy cations of aluminium and/iron (Bruijnzeel, 1990). The insolubilisation of these heavy cations, which is rapid in most soils, decreases in acid conditions
13
rich in soluble organic matter, which favours complex formation; (iii) microcystalline entities with sheet structure (clays) which fix to their surface iron and aluminium hydroxides.
2.3.2.3 General processes of rock weatheringHydrolysis is the result of the dissociation of water into H + and OH ions and consists of the separation of salts containing the union o f a weak acid and or the cation of a weak base into the corresponding base and acid (Birkeland, 1992). This is the most important process of rock weathering. Other processes, which can be important in particular cases include: dissolution of saline rocks; hydration, which is the combination of solids with water to form hydrates; oxidation which causes the release of ferrous ions (Fe2+) contained in certain primary minerals, so disrupting their crystal lattices (Jongmans. et al., 1993). The process o f reduction occurs more rarely but, under hydromorphic and badly aerated conditions, it is responsible for the solution of ferruginous sandstone cements and hence for their breakdown (Jongmans, 1994).
2.3.2.4 Weathering stabilityWeatherability of the various minerals is very different. Some are very stable e.g. quartz, others offer only slight resistance, e.g. limestone. Differentiating the classes of weatherability in very unstable, unstable, moderately stable, stable, and very stable, it is possible to arrange the minerals in the following order (van Reeuwijk, 1994):
Very unstable UnstableModerately stableStableVery stable
Weatherability depends on several factors:a) The higher the silica content the higher the weathering stability.
14
b) The weaker the base (Na~ > NaOH) the more unstable.c) The higher the Fe2+ content the more unstable.
It is evident that weathering is a destructive process. However, parallel with this destruction, a building up process or synthesis may take place. It is possible that certain constituents, set free during weathering, react with each other, giving rise to secondary minerals (van Seeters, 1993). In this way, very important group of silicates, the clay minerals, are formed.
2.3.2.5 Clay formationAccording to Van Seeters (1993) clay minerals are formed in two ways:a) By rearrangement of the layer silicates (Phyllosilicates) muscovite and chlorite; the
original structure of the silicate remains unaltered, while the ions between the elemental layers are dissolved and removed.
b) By decomposition of the silicates, such as feldspars, augite and hornblende into ions or colloidal substances, from which clay minerals may be synthesized.
Formation from laver-silicatesAccording to Van Reeuwijk (1994) the micas muscovite, biotite and chlorite are of importance with respect to clay formation. In the case of the micas, the K-ions are gradually replaced by H30+-ions and hydro-muscovite is formed. By further loss of K, illite is formed and if K is completely removed, a swelling illite results. At the same time, the particles decrease in size, however, structure is maintained. If the Mg-content in the weathering-solution is relatively high, which may happen during the weathering of biotite, vermiculite can be formed. According to Van Seeters (1993), in acid medium, vermiculite can take up A1 or Fe-ions and form secondary chlorite. Chlorite loses Mg-ions upon weathering and forms vermiculte. Upon further removal of Mg, a swelling chlorite is formed. By uptake of Al, the process leads to the formation of secondary chlorite. The end-members are swelling minerals and resemble with respect to this property the montmorrilonite minerals. In the presence of K- and Mg-ions the minerals with
15
swelling lattices can be transformed into illite, vermiculite and chlorite (Van Reeuwijk, 1994). The weathering of illite, vermiculite and chlorite is through a reversible process.
Formation from decomposition products of silicatesFeldspar and other silicates decompose completely upon weathering into ions or molecules. From these ions or molecules clay minerals can be synthesized, if conditions are favourable. This is especially probable under alkaline conditions, because then the silicate-ion and aluminate-ion can occur simultaneously. This alkaline reaction can be found during the hydrolysis o f the silicates if the alkali- and alkali-earth metals are not removed rapidly. Under neutral conditions the silicate- ions polymerize into colloidal poly-silicic acid, while the aluminate-ions form colloidal A1 (OH)3. This latter substance can exchange OH-ions against silicate-ions, thus forming in first instance
allophane. Upon frequent dessication and wetting and with the cooperation of other cations, such as Mg and K, a layer-lattice of the clay minerals can be formed (Bruijnzeel, 1990).
It is very difficult to trace these reactions in nature, because the transformations require a long time to occur. Therefore, they were studied in the laboratory, thereby imitating most of the natural conditions as much as possible (van Reeuwijk, 1994).
2.3.3 Movement of materials within soilsThe water circulating in the soil pores (gravitational water) carries with it certain substances either in solution or suspension, and is responsible for their general movement. A great amount of the material thus mobilized can be removed completely from the profile. In contrast, another portion of the mobilized material is deposited at lower levels in the profile, i.e. is redistributed enabling two main horizons to be differentiated: (a) A horizons that are in general impoverished-eluvial horizons: (b) B horizons that are in general enriched-illuvial horizons. Duchaufour (1982) identifies four ways in which materials move within the soil.
16
2.3.3.1 Pervection (lessivage): movement of particles in suspensionAccording to Duchaufour (1982), lessivage is the washing in suspension of fine clay and lesser amounts of coarse clay and fine silt down cracks and other voids in a soil body reflected by (1) depletion of A horizon in clay, (2) enrichment of the B horizon in clay content relative to the C and/or A horizon, (3) higher fine clay: total clay ratio in the B horizon than in the A horizon, and (4) presence of argillans in the B and C horizons. The mobile clay involved may be a product of weathering in the A horizon or may be o f eolian origin added to the soil during development.
2.3.3.2 Lixiviation: migration of soluble saltsLixiviation is concerned mainly with most mobile cations, those capable of forming soluble salts at the pH of the soil: essentially the alkali and alkaline earth cations (Na+. K +, Mg2+ , Ca2+) which occur in soil solutions in equilibrium with the exchangeable cations retained by the adsorbent complex (Duchaufour, 1982). The anions that migrate may be in the inorganic form for example nitrates or carbonates, or organic such as lactates. The heavy polyvalent cations rarely migrate as salts, except Mn:* and Fe2+ ions in reducing conditions and sometimes AI3+ in very acid conditions.
The gradual movement of alkali and alkaline earth cations generally leads to their replacement on the adsorption complex by H + or AT3" ions, which result in desaturation of the complex and soil acidification. The loss of cations by lixiviation affects not only the upper part o f the profile (A horizon) but often the profile as a whole. Re-adsorption of cations in the B horizon can occur, but the general balance indicates a deficit, particularly in humid climates with a strong element of climatically controlled drainage.
Soils containing carbonates are subject to a particular kind o f lixiviation - decarbonation which generally occurs as a result of the action o f dissolved carbon dioxide.
The loss by deep drainage occurs in humid climate. Translocation also occur in drier climates where precipitation o f the calcium bicarbonate occurs at a certain depth as a particular kind of illuvial horizon (calcic horizon). More rarely, in rather more acid areas the loss o f calcium from the A-horizon occurs as gypsum (CaSOj); then a gypsic horizon can form at a certain depth.
2J-3J Cheluviation: movement of organometal complexesSoluble organic substances produced by microbial (mainly fungal) attack on plant litter, move downward with the soil solution and form complexes with Al3’ and Fe’* ions. There’s little known of the rates at which such reactions proceed in natural soil systems; they seem to depend on the nature and concentration of the organic compounds in solution, the pH, the mineral surface area that is susceptible to attack, and the nature o f the minerals (Duchaufour, 1982).
Fulvic acids are the dominant complexing organic compounds; their carboxylic and phenolic groups act as ‘claws’ which preferably grab polyvalent metal ions such as AT’* and Fe3+. Chelation continues as long as the fulvic acids are not saturated with metal ions. Fulvic acids are comparatively abundant where low temperatures, low chemical soil fertility and/or periodic water saturation retard the microbial decomposition of organic matter.
Fulvic acids are soluble in water, however, as more reaction sites become occupied by AlJf, the solubility product decreases: fully saturated fulvic acids are practically insoluble in water. If the soil supplies Al3 and or Fe3' at low rates compared with the rate o f fulvic acid production, fulvic acids can migrate over considerable distances northern the profile. Normally, the bulk o f all fulvic acids is saturated with AT'* and/or Fe'* after migration over only a few decimeters so that an illuvial B- horizon (spodic B-horizon) forms in the profile. In sandy soils that are very low in Fe3+ and Al3+, the spodic B-horizon may occur at a depth of several metres or, in the extreme case, a spodic B- horizon may not form at all and (the bulk of) the fulvic acid is discharged in effluent ‘black water’.
2.3.3.4. Movement of silica within the soilAccording to Duchaufour (1982), silica migrates in the soluble form (monosilicic acid). It’s maximum solubility is low (about 100 mg/kg) and relatively independent o f the pH; any
18
considerable increase in soil solution concentration, as a result of the drying out. causes silica precipitation as a polymerized gel. However, when the profile is well provided with water, the silica concentration is less and variations in this concentration are to a large extent related to environmental factors, particularly the pH. In addition, it depends also on the source of the silica which may be either biological (litter) or geochemical (weathering of silicates or even very slow dissolution o f quartz). It should be mentioned that, as yet there is little information on the forms of silica present in litter and the causes of its mobilization.
2.4 ClimateThe effect of climate on soil formation is direct and indirect. The direct effect is that of precipitation (moisture), temperature, evaporation and wind. The indirect effect is in its effect on flora and fauna (the biosphere). The climate factor accounts for the largest amount o f variation in soil properties (Vitousek, 1994). Indeed, moisture and temperature (independently) probably account for more o f that variation than any other single factor.
These variations in the soils originate from such processes as organic matter influx and decomposition, presence or absence of chelating agents, soil-water chemistry and the depth and rate of leaching of water through the soil. The main soil morphological and mineralogical properties that correlate with climate are organic matter content, clay content, kind o f clay and iron minerals, colour, various chemical extracts, the presence or absence o f C aC 03 and more soluble salts, and depth to the top o f salt-bearing horizons (Holiday, 1989b).
For a full appreciation of the role of climate in soil formation it is necessary to discuss temperature and moisture separately.
2.4.1 TemperatureAccording to Retallack (1994), the higher the temperature, the greater the evaporation and transpiration and the lower the effective precipitation that percolates through the soil. The result is that, with the same precipitation in two different isothermal belts, different types o f soil profiles will develop. In the cold temperate regions, and in the high mountain country long and severe winters
19
occur; hence, percolation is hindered with the result that many lakes, swamps and peats are formed. The conditions for peat formation are favourable in spite o f the scarce vegetation because the
microbial activity responsible for the rapid destruction of the organic material is restricted during the long winters. Prolonged freezing and consequent drying favours the stabilization of humus, rendering it more resistant to decomposition by micro-organisms. The O-horizon is therefore very thick. 30cm or more. Below the O-horizon there is generally no soil formation because the decomposition products formed in the O-horizon cannot percolate into the mineral mass and, consequently, cannot react with it.
In the humid tropics and subtropics, on the contrary, a very dense vegetation occurs, but at the same time an intense activity of micro-organisms. The plant residues are therefore rapidly mineralized. The result is that very little organic matter accumulates in O-layer, except in areas o f poor drainage where anaerobic conditions prevail. Peat formations can therefore also occur in the humid tropics.
Based on the difference between the mean maximum temperature, Soil Survey S taff (1975) came up with various soil temperature regimes. These include pergellic (<0°C), cryic (0°C-8°C), frigid (5°C-8°C), mesic (8°C-15°C), thermic (15°C-22°C), hypothermic (>22°C). The iso prefix is used for the last four temperature regimes if the mean summer and winter soil temperature differ by less than 5°C at a depth o f 50cm or at a lithic or paralithic contact, whichever is shallower.
2.4.2 RainfallWhen rain falls onto the earth's surface, it may penetrate into the soil flow along the surface if topography allows, or evaporate. It is generally accepted that 15-50% of the total rainfall percolates and reaches groundwater (Fitzpatrick, 1986). The part that penetrates and percolates is very important with respect to soil formation. This water reacts with mineral particles o f the parent material, dissolves some constituents o f it, removes this dissolved material from the surface and deposits it at a lower part of the solum. In this way the mass is differentiated into horizons and the soil body is formed. This process is only effective, if there is established vegetation. Roots protect the material from being eroded, leaves protect the soil against the impact o f raindrops, anddecomposition products of the organic material become increasingly important as they contribute
20
effectively in the reactions between the percolating waters and the materials with which they come in contact.
The effective rainfall (actual rainfall-surface runoff-evaporation-transpiration) depends on the total actual rainfall and determines the rate o f profile development (Retallak, 1990). In the deserts there is no profile differentiation, because there is no water for percolation. Some soil profiles are however found in deserts which is an indication of earlier more humid climates. Precipitation varies from place to place but the actual total amount entering the soil is determined by rainfall intensity, vegetation cover, inflitration capacity, permeability and slope, speed of snow melting and original moisture content o f the soil (Fitzpatrick, 1986).
Soil moisture regimes are classified by Soil Survey Staff (1975) based on ground water and the presence or absence o f water held at a tension o f less than 15 bars in the middle o f the pedo units. These soil moisture regimes are aquic. aridic, torric, udic, ustic and xeric.
The climate data available in the project area is on rainfall for a period of 45 years upto 1976, obtained at Simba Railway Station (Met. Sta. No. 9237003). The station is located at the eastern end of the study area. The monthly and annual average rainfall is given in Table 1.
Table 1: Average Monthly Rainfall at Simba Railway Station (in mm)
No. and altitude
Years of rec
Ann.Rainf.ram
Jan Feb M ar Apr May Ju n Jul Aug Sept Oct Nov Dec
9237003 1036 m
45 636 43 39 76 128 40 5 0 2 5 27 163 108
The average annual rainfall is about 600 mm and the area shows a bimodal rainfall pattern. The long rains extend from March through May followed by a long dry season from June to October. The short rains appear in November and December. The short dry season usually begin in January and ends in February.
21
2.5 ReliefTopography or local relief influences the distribution o f soils in the landscape to such an extent that soils of markedly contrasting morphologies and properties can merge laterally with one another and yet be in equilibrium under existing local conditions (Mbuvi el al., 1997). The nature o f the topography can influence soils in many ways, for example, the thickness o f the pedo unit is often determined by the nature of the relief (Fitzpatrick. 1986). Topographic features fall into three main categories, mountains and hills, those formed by erosion and those formed by deposition.
Macrotopographical (hilly or mountainous topography) conditions favour the formation of intrazonal soils (Birkeland. 1984). The continuous geologic erosion hinders the development and formation of distinct soil profiles, because some of the products o f weathering are removed from the slopes. Consequently, the soils remain immature and young. Such soils are called skeletal or Leptosols (Entisols) and consist o f fresh rock fragments, large stones and boulders imbedded within the mass o f the young soil body. Soil formation is also affected by the effect of exposure. Southern exposures are generally warmer (and therefore drier) and subject to strong fluctuation in temperature and moisture. The reverse is true for northern exposures. As a consequence o f this difference entirely different soils can be formed on both slopes, even if the parent material is similar.
Nearly all landscapes show evidence o f erosion and deposition as well as areas o f relative stability, thus within any one area there may be soils of widely differing ages and degree o f development (Swahney et al., 1992). In areas o f rolling terrain, soil properties vary because lower areas are likely to be areas of accumulation of water runoff and sediment derived from surrounding higher-lying areas. Also, low areas might be influenced by a high water Table, which could have considerable effect on the soil. In these areas of rolling topography, it is common to find well drained soils on the uplands whereas those in the depressions are poorly drained and rich in clay and organic matter, with signs of various degrees o f gleying. In dry climates, saline and alkaline soils occupy the depressions, better-leached soils the slopes, and the less-leached soils the summits (Holiday, 1989b). The differences in soil properties with position could be due to pedogenesis in place, resulting from differences in moisture, leaching, and vegetation over the rolling landscape. In this case, the various
22
parts of the landscape are assumed to be approximately the same age, and soil differences are attributed to the relief factor. Position with respect to groundwater is an important aspect of microtopography. An example is the formation of ground-water-laterites in small depressions o f an area occupied by Oxisols.
Numerous studies have shown that many soil properties are related to the gradient o f the slope as well as to the particular position o f the soil on a slope. Milne (quoted in Birkeland (1984) proposed the term catena to describe this lateral variability on a hillslope and emphasized that each soil along a slope bears a distinct relationship to the soils above and below it, for a variety of geomorphological and pedologic reasons.
It can be concluded that topography is o f great importance as a site factor in pedogenesis both in temperate climates, where it either prevents the complete development o f the profile by slowing down processes or modifies the climatically controlled development as a whole by affecting lateral movement, and in the tropics, where it can completely reverse the climatically controlled processes of weathering.
2.6 Living organismsThe biotic factor is a logical topic in the study of soil formation - but as Jenny (1941) made clear, the biotic factor provides conceptual difficulties more severe than those for other factors. Jenny (1980) wrote; ‘The real bugbear was the biotic factor. Like everybody else, I could see that vegetation affects the soil and that soil affects the vegetation, the very circulus vitiosis that I was trying to avoid'. Jenny’s solution was to identify the regional flora (and fauna), the potential occupants of a site, as the factor of interest. This definition avoids the problem o f trying to determine cause and effect in the feedback system that characterizes plant-soil interaction.
The biosphere is composed of two elements, viz, the plant kingdom (phytosphere) and the animal kingdom (the zoosphere). The two elements have opposing effects on soil formation (ITC Notes, 1986). Whereas the phytosphere promotes soil horizon formation, the zoosphere retards the differentiation of the soil into horizons.
23
2.6.1 The phytosphereAccording to Fitzpatrick (1986), plant roots penetrate into rock and parent material and open channels for the movement of water and air. As the roots and other subterranean parts o f plants die and decompose, many organic and inorganic acids are released. These acids react with the minerals or the weathering products o f minerals and the reaction products can be transported with the percolating waters and can be either accumulated at one place in the profile or completely removed with the draining waters. In this way, a differentiation of the soil into horizons starts. In this reaction mechanism, complex-formation (or chelation), hydrolysis, oxidation and reduction play the most important roles in humid and semi-humid climates. The results o f these processes are a redistribution of iron, aluminium, silica, clay, calcium and magnesium in the profile. In arid and semi-arid climates, where the effect of organic matter is negligible, solublization and precipitation of soluble salts are the most important phenomena (van Reeuwijk, 1994). In the humid hot climates hydrolysis and oxidation are very intensive leading to the formation of typical soils (Ultisols and Oxisols).
Plants act as soil binders and prevent soil erosion from taking place. Plant roots, especially of grasses, bind soil particles together to form crumb and granular structures. The roots also cause redistribution of minerals. Plant roots exude various substances on which many microorganisms thrive so that the soil in immediate proximity to the root or rhizophere is an area o f prodigious microbiological activity and frequently, the concentration of iron immediately next to the live root is reduced imparting a bleached appearance to the soil (Metting, 1993).
The vegetation in the study area falls under wooded bushed grassland (Touber, 1983). Except for seasonal burning, vegetation has little been disturbed by man. Vegetation species are quite heterogenous and have been described extensively by Touber (1983).
On the hills and piedmont plains, are found grasslands and bushed grasslands o f Digitaria macroblephara and Aristida keniemis with Combretum zeyheri and Balanites aegyptiaca.
24
Uplands consist of grasslands and wooded bushed grasslands o f Digitaria macroblephara and Sporobolus fimbriatus with Acacia totilis. Other grasses are Penniselum mezianum and Lintonianutans.
Various grasses and bushes are found on erosional plains. Examples are Chloris roxburghiana and Sporobolus angustifolia with Commiphora schimperi and Acacia mellifera.Bottomlands support grasses such as Penniselum mezianum. Lintonia nutans and Echinochloahaploclada.
2.6.2 The zoosphereThe contribution o f the animal kingdom to the processes of soil formation is primarily mechanical in nature. Metting (1993) says that whereas the phytosphere causes a differentiation o f the soil, the zoosphere has the tendency to hamper and even to nullify this. They homogenize the soil more or less. In reality, they disturb the profile. Rodents carry down much materials from the A down into their nests (mostly located in the B-horizon) and bring up B-material to the A-horizon. This animal effect is important from the viewpoint o f agriculture, because plant roots frequently follow the abandoned channel borings of rodents, worms, and insects.
According to Coleman and Crossley (1996) worms appear to be capable o f bringing every year about 10 tons of soil material per acre to the surface, being about 2.5 cm in five years. They drag down leaves and grasses from the surface into their burrows. The depth to which worms penetrate :he soil varies from a few centimeters to 7.5 meters. In 10 months they consume about 1.0% of the plant residues of the forest floor and they prefer a neutral to an alkaline medium. However worms can also be found in moderately and even strongly acid medium.
Ants and termites carry material form lower to higher levels, build galleries and underground passageways, throw out a great deal of material to the surface and frequently form hills and mounds.
Wielemaker and Boxem(1982), found that the construction o f termite mounds, nests and galleries from soil or mixtures o f soil and other materials or within soil horizons affect the physical and
25
chemical characteristics of both the soil used for construction and the soil o f the surrounding areas from which the materials are derived. This is because soil particles are selected, transported, rearranged, cemented together and mixed with organic matter.
Mice and rodents, found mainly in treeless regions, are very active in transporting material. They can throw out 50 tons of materials per year per hectare (Coleman and Crossley, 1996). The formation o f crotovinas in the chernozems is an essential feature o f these soils and is the result ofthe activity o f rodents.
It can be stated that the activity of the zoosphere is strongly influenced by the amount of food present in and on the soil and of the composition of the food. It is frequently found that the dressing of pastures with fertilizers increase the worm-population strongly, giving rise to the formation ofagric horizons.
Termites are found all over in the study area. Termite mounds as tall as 2-3 meters were sighted and sometimes they are as close as 50 m apart. These insects are adapted to a wide range o f semi-arid ecosystems where earthworms are not found. They feed on wood and humus. Termites influence soil structure by:1) Mixing organic and mineral particles2) Redistribution o f organic matter3) Creation o f biopores4) Promoting humification process.Farmers in the project area consider them pests and a hazard to farm structures.
2.7 Tim eIt must be stressed that time means the stage o f development o f the soils or in other words, the grade of maturity. According to Buol (1989) terms such as youth, maturity and old age (senile) have been applied to soils. Entisols and some Inceptisols may be considered youthful while mature soils are thought to be in equilibrium with the environment. Senile soils are pedogenicaccumulations o f inert material - sesquioxides and heavy minerals. Mature soils have fully
26
developed profiles and young soils have only indications of horizon development, independent of the geological age o f the land. Acid rocks will resist weathering and soil formation stronger than basic rocks. Soils developed over acid rocks will therefore possess less well developed profiles than those of basic rocks under the same climatic conditions. Therefore, soils on acid parent materials need more time for full development than those on basic materials.
Soils pass through a number of stages as they develop, culminating in deep pedo units with many well differentiated horizons. Most soils are not developed by a single set o f processes but undergo successive waves o f pedogenesis (Fitzpatrick, 1986). Soils are thus regarded as having developmental sequences which manifest not only the present factors and processes of soil formation but also a varying number of preceding phases. The various progressive changes in soils are known as soil evolution.
The relationship o f soils to time can be discussed with respect to (1) relative stage o f development, (2) absolute dating o f horizons and profiles, (3) rate o f formation, (4) relation to age of slope and land form and associated weathering complexes. The time o f formation for a particular soil is determined by its stratigraphic position relative to adjacent deposits and soils (Birkeland, 1984). It is important to understand landscape evolution and its strong effect on the time factor in soil formation. Although a given landscape may appear quite uniform and simple from a casual glance, chances are that it has a complex geomorphic history and that some soils differ on this landscape because o f differences in their time of soil formation related to the landform they occupy. In a single toposequence, the dynamics within the soil mantle can assist in deducing which soil unit is older than the other (Okoth, 1988).
The effect o f time is frequently obscured because of past climates that are different from present - day climate. In such cases it is difficult to establish whether the soils are different as a consequence o f time or o f climate.
27
CHAPTER THREE: SOIL SURVEY AND RESEARCH METHODS3.1 Previous soil studies in the areaThe area is covered by the general countrywide Exploratory Soil map at a scale o f 1:1 million (Sombroek et al., 1982) and the "Soils and Vegetation o f the Amboseli-Kibwezi area" by Touber (1983) at a scale o f 1:250,000. The above reports are based on photo-interpretation and extrapolation with very limited fieldwork. The soil units identified in these reports describe the soils in general and lack detailed soil characterization in terms of laboratory analysis and fieldwork. In the above maps, the study area is shown to fall under Luvisols, Regosols, Nitisols and Vertisols as the major soils. According to Touber (1983), in the study area, hills, scarps and ridges have shallow, stony and rocky soils. Undulating uplands have moderately deep to deep soils, whereas all the plains have in general deep soils. Chemical soil fertility is reported to be high in the area due to the presence of many weatherable primary minerals. CEC figures are moderately low while base saturation figures are above 50%. The topsoils are reported to be weakly developed and low in organic matter content due to truncation by sheet erosion. This study was aimed at characterizing soils of the area in detail to provide soil information in a standard format.
Some soil information exists for isolated areas in the region but outside the study area. Three major soil units were mapped in Kiboko area by Michieka and van der Pouw (1977). The three soil units comprised o f shallow soils (Leptosols) of the volcanic area; well drained, deep soils (Ferralsols and Luvisols) of the Basement plains, and moderately well drained calcareous soils (Chernozems, Fluvisols, Vertisols) of the floddplains, bottomlands and swamps.
Van Wijngaarden and van Engelen (1985) distinguished the following soil mapping units in Tsavoarea:
- Mountains, hills, low ridges and minor scarps (Leptosols)- Footslopes, piedmont plains and plateaus (Ferralsols, Luvisols, Cambisols)- Uplands (Acrisols, luvisols, Cambisols)
Fluvisols)- Volcanic plains and lava flows (Andosols, Chernozems)
In the soils of Makueni (Njoroge, 1996) several major groups o f soils were mapped. Leptosols were mapped on mountains, hills and major scarps. Ferralsols were mapped on footslopes and plateaus. Uplands had Arenosols, Ferralsols, Luvisols and Cambisols. Fluvisols and Vertisols were mapped on river terraces and bottomlands, respectively. Vertisols were mapped in minor valleys. These reports give information that is useful to the present study.
3.2 The present study3.2.1 Office methods
This involved the acquisition of aerial photographs at a scale o f 1:50,000 and a review of any literature on the study area like geological reports, soil survey reports and topographical maps at scale 1:50,000 (Survey of Kenya, 1974). The aerial photographs were systematically interpreted using a mirror stereoscope. A combined physiographic and element analysis method was used (FAO/UNESCO, 1967a; Mulder, 1987; Vink, 1968). Photo interpretation was based on the recognition of visible features on the photos which are assumed to correlate with soil differences (FAO/UNESCO, 1967). The features include landform, surface drainage, natural vegetation, slope gradient and form, photo-tone and photo-texture. The aim o f the interpretation was to arrive at a classification of the land units which through subsequent fieldwork and laboratory analysis would be transformed into soil mapping units.
Photo-interpretation boundaries were transferred to the 1:50,000 topographical maps, resulting in a photo interpretation map covering the study area. The units delineated on the photo
29
interpretation map were classified and analyzed resulting in characterizing each by a combination of elements. The units were given preliminary symbols and described in the provisional legend.
3.2.2 Field methods
Fieldwork was carried out between October and December 1998. The field survey begun with a general orientation of the area to get a broad view of the geology, landforms and vegetation in relation to the soils.
Field observations were carried out in a grid system of 500 m by 500 m thus making one observation per 25 hectares. Some free survey was exercised where surface features indicated soil differences not necessarily on the traverse. Augerings were made to a depth o f 120 cm and mini pits upto 50 cm deep if soil depth permitted. Augerings and mini pits were described and recorded on the standard Kenya Soil Survey forms which are based on the FAO/UNESCO guidelines for soil profile description (FAO/UNESCO, 1977).
At each observation site, information was described and recorded on: landform, relief, geology, slope, drainage conditions, vegetation, rock outcrops, surface stoniness and geographic location. Soil material from the auger and the mini-pit was described for colour, texture, consistency, occurence of lime, characteristics and thickness of soil horizons and soil depth. Differences in these characteristics from the top to the bottom of the hole enabled the sub-division o f the soil into horizons. Soil colours were determined using soil colour charts (Munsell, 1990).The boundaries on the photo interpretation map were checked and changed where necessary during fieldwork. The augerings and mini-pits helped in the identification of landscape-geology- soil relationship and the different soil mapping units on the basis of soil depth, colour, texture, mottling, consistence, concretions and drainage.
30
All augerings were numbered and their positions recorded on the photo interpretation map. Representative profile pits were dug for each mapping unit and the profiles were fully described and sampled for chemical, physical and mineralogical analysis at the National Agricultural Research Laboratories. The method of genetic horizon sampling was followed in order to characterize A, E, B or Bt, and C horizons separately. For each horizon, soil samples were taken from various positions and mixed well, before being put into sealed and labelled plastic bags. Around every profile pit, composite sample were taken for mass analysis o f available nutrients. This was done at three different locations around the pit and mixed well. In addition, undisturbed samples for bulk density and pF determinations were collected. Three cores were taken from well distributed points from previously wetted horizons. Also, rock samples were taken for geochemical analysis.
3.2.3 Laboratory methodsSoil samples collected from the field were analyzed in the laboratory using the standard procedures followed at the National Agricultural Research Laboratories in Nairobi. All the detailed procedures are described by Hinga et al. (1980); Black (1965) and van Reeuwijk (1986). All the disturbed samples were first air-dried and ground into fine particles to pass through 2 mm sieve. The following methods were used:
Mechanical analysis: Soil texture was determined by the hydrometer method. The samples were shaken overnight with calgon (sodium hexametaphosphate and sodium carbonate) solution in an end-over-end shaker at 40 revolutions per minute. The measurement of silt plus clay was done after 40 seconds and clay after 2 hours, all with a soil hydrometer. Sand fraction was obtained by the difference. Texture classes were then read directly from textural triangle.
Bulk density: This was obtained using undisturbed core ring samples after oven drying for 24 hours at 105°C. The mass of the oven-dry soil was divided by the volume to obtain the bulkdensity.
31
Soil reaction (pH) and electrical conductivity (EC): The pH was measured with a glass electrode pH meter on 1:2.5 suspension of soil in water, and on IN KCL solution, in all cases after shaking for 1 hour. The electrical conductivity was also measured on the 1:2.5 soil water suspension using direct reading conductivity meter using electrodes and the results reported indS/m.
Cation exchange capacity (CEC) and exchangeable bases: 2.5g soil was leached with 100 ml 95% ethanol and percolated with 100 ml IN NH4OAc at pH 7; Na and K were determined directly on the flame photometer; Mg and Ca were then determined by automatic absorption spectroscopy (AAS) after dilution with lanthanum chloride. The samples were subsequently leached with IN sodium chloride and the leachate used for the determination o f CEC.
Mass Analysis for available nutrients: This was performed for the composite topsoil samples only. The soil was extracted by shaking for 1 hour at 1:5 ratio with 0.1N HCL and 0.025 N H2S 0 4. The Ca, K and Na were determined by flamephotometer after an anion resin treatment for Ca, for M g the same procedure as for exchangeable Mg. For phosphorus, soil was extracted with 0.5M sodium hydrogen carbonate solution at pH 8.5, a reagent which controlled the removal of calcium phosphate (Olsen et al., 1954). Manganese was measured colorimetrically using phosphoric acid-potassium periodate for colour development.
Total nu trien ts (K, Mg and P): The samples were digested with IN Hcl and 30% H20 2 and then filtered. The amounts of K, Mg and P in filtrate were then determined (Hinga et al., 1980).
Organic carbon (C%) and total nitrogen (N%): Organic carbon was determined colorimetrically by mixing concentrated sulphuric acid and aqeous potassium dichromate (K2Cr20 7). 0.5g of the soil sample and the mixture were heated at 150HC for 30 minutes. After cooling, 0.4% barium chloride solution was added to the mixture. Organic carbon was then determined on the colorimeter (Anderson and Ingram, 1993). Nitrogen was determined by semi
32
micro Kjedahl method (Anderson and Ingram, 1993). To 0.2g o f soil, 4.4 ml of digestion mixture of 30% hydrogen peroxide, selenium powder and lithium sulphate were added. Digestion was done for 2 hours at 360°C. Total N was then determined on the colorimeter.
Standard calculations
Base saturation = Sum of exchangeable cations X 100Cation Exchange Capacity
Porosity (%) = i l-( bulk density ) r1 X 100 where particle densityParticle density
is assumed to be 2.65 g/cm3 for most mineral soils.
Soil moisture characteristics
This was determined by moisture percentages at sunctions o f 0.001, 0.2 and 0.5 bars and
pressures of 5.0 and 16.0 atmospheres (pF 0, 2.3, 2.7, 3.7 and 4.2, respectively). Undisturbed
core samples for the three lowest pF-values were subjected to sunction (Kaolin box apparatus) to
remove water. Disturbed samples for the two highest pF-values were subjected to positive
external gas pressure until the soil water and the external gas pressure came into equilibrium. To
transfer the weight/weight data of the disturbed samples to weight/volume, they were multiplied
by the bulk density (Hinga et al., 1980).
Sand mineralogy: Selected soil samples were sieved and the sand fraction between 50 and 250
microns were retained on a 300-micron mesh. The samples were cleared with 2N Hcl and boiled
with 30% H20 2 until no frothing occurred at boiling point. The sand fraction was mounted on
33
glass slides (“ 1X3”) with Canada balsam and covered with a thin glass (1” x 1”). The
mineralogical indentification was done with a standard polarizing petrographic microscope (Hinga
etal., 1980).
Iron oxides: Selected soil samples were analyzed for three forms of iron oxides. Soil samples
were shaken with a complexing and reducing buffer of sodium citrate and sodium dithionate to
extract both active and sTable iron oxides. To extract active iron, soil samples were shaken with a
mixture of oxalic acid and ammonium oxalate. Soil samples were shaken with sodium
pyrophosphate solution to extract iron complexed to organic matter. The iron was measured in the
extracts by AAS (van Reeuwijk, 1986).
Geochemical analysis o f soils: Selected soil samples were digested by the hydrofluoric acid -
Boric acid dissolution method. The oxides o f the various elements were determined by the atomic
absorption spectrometer (Laboratory Manual for Geochemical Analysis, 1989).
3.2.4 Cartographic methods
The boundaries on the photo-interpretation map at scale 1:50,000 were transferred onto the translucent base maps at the same scale using an optical pantograph and a Vertical sketch master. Observation points were also transferred onto the base map. The base map was then used for printing of the soil map.
The soil survey approach used related the soils to the landforms and the type of parent material on which they occur, resulting in a physiographic soil map. In the construction of the legend of the
34
soil map, the physiographic classification provided the framework of the soil map units. A three level hierarchical system of legend construction has been used (KSS, 1987; Van de Weg, 1978). The landform sub-division is at the highest level, a geological sub-division at the second level, and soil characteristics separated within each physiographic-geological unit at the third level.
Areas delineated on the map are identified by codes which represent physiography, geology and soil characteristics. The first code refers to the landform while the second refers to geology. The third entry in the legend describes the soil units and refers mainly to characteristics o f the subsoil, usually to a depth of 100 cm. All soil descriptions follow the FAO/UNESCO guidelines for soil profile description (FAO/UNESCO, 1977).
In addition, each soil map unit is characterized by the dominant slope class for which a code is written under the soil map unit code. The map unit description in the legend is followed by the taxonomic classification o f the soil using FAO/UNESCO (1994) system. The following codes areused:-
Physiography:H — Hills and minor scarpsF = FootslopesY — Piedmont plainsU = UplandsP = Volcanic and erosional plainsB = BottomlandsGeology:B = olivine basaltsF = gneisses rich in ferromagnessian mineralsU — colluvium from various rocksV = various volcanic rocks
35
various parent materials
red colour pre-dominant general sub-division of the soil units
36
CHAPTER FOUR: RESULTS AND DISCUSSION4.1 General properties of the soilsParent material and relief largely determine the distribution of soil types in the project area. Hills and scarps have shallow, stony and rocky soils. Undulating uplands have deep to very deep soils whereas all the plains have in general very deep soils. Most of the soils are well drained and the imperfectly drained soils are found in the bottomlands.
Soil textures vary according to parent material and physiography. Soils developed on volcanic material have textures with low sand percentages, mainly clays and clay loams. The soils on basement system rocks have in general sandy clay loams to sandy clays, with sandy loam to sandy clay loam topsoils, especially in the more undulating and hilly areas. Red sandy clays dominate on Basement system rocks rich in ferro-magnesian minerals (biotite-homblende gneisses) while brown coloured sandy clay loams prevail on the undifferentiated Basement System rocks (mainly quartz feldspar gneisses).
Most o f the top soils are weakly developed (ochric A-horizon), thin, light coloured and low in organic matter content, owing to truncation by sheet erosion. The workability of the soils is good except the imperfectly drained soils of the bottomlands. Sealing of the topsoil is a widespread unfavourable characteristic, most pronounced on soils on Basement Systems rocks. On volcanic soils, sealing o f the topsoil is much less pronounced but in many cases still an important factor with regard to erosion hazard (for complete profile description and chemical data see appendix 1).
The natural soil fertility is generally high in the project area. This could be due to the presence of many weatherable primary minerals, which either occur in the weathering material from Basement System rocks rich in ferro-magnesian minerals or were added later by volcanic ash enrichment of chemically poor soils. Base saturation figures vary from medium to high. CEC figures of the topsoils range from low to very high
37
4.1.1 Soils of the hillsMapping Unit HVP
1) EnvironmentThe total area of the unit is 1853.02 ha. The parent material is various volcanic rocks, which are
predominantly olivine basalt’s in the form of boulders, breccia and agglomerates. The vegetation
is bushed grasslands Digitaria macroblephara and Aristida keniensis with Combretum Zeyheri and
Balanites aegyptiaca. The unit falls within agro-climatic zone V with rainfall of about 600 mm.
Relief is small rounded singular hills with convex to straight slopes of 16-30%.
2) Soil properties and classificationThe soils are excessively drained, shallow, bouldery and gravelly with a weakly developed
horizon differentiation. The soils are classified as Humic Cambisols (FAO/UNESCO, 1994) or
Dystric Ustochrepts (Soil Survey Staff, 1992).
Profile 174/1-9a) Morphology
The profile is located on the apex of the hill. The A-horizon is 25 cm thick, dark reddish brown
(5YR 3/4), clay, sub-angular blocky structure and friable. The B-horizon is 22 cm thick, dark
reddish brown (5YR 3/4), clay loam, sub-angular blocky structure and friable. Below this is a
hard layer of weathering material. Soil horizon boundary is abrupt and wavy.
38
b) ChemicalThe pH-H:0 increased with depth from 6.3 to 6.5. Electrical conductivity (EC) increased with
depth from 0.29 dS/m in topsoil to 0.34 dS/m in subsoil. Cation exchange capacity (CEC)
decreased with depth from 21.12 cm ol(+)/kg in the topsoil to 18.36 cmol(+)/kg soil in the El-
horizon. There is a general decrease with depth in the exchangeable cations. Base saturation is
between 81% and 88% in the profile.
c) Physical
The sand content decreased from 42% in the topsoil to 29% in the subsoil. The silt content
increased with depth from 15% in the topsoil to 42% in the subsoil. Clay content decreased from
43% in the topsoil to 29% in the subsoil.
d) InterpretationThe thick A-horizon is due to a sTable condition with Vertical processes exceeding lateral ones.
Climate has played a role by letting exchangeable cations be concentrated in the topsoil. This
means that the drainage water has not been enough to leach the soil. A similar argument can be
made for the distribution o f clay in the profile. The higher clay content in the topsoil than the
subsoil is due to limited drainage water.
39
Mapping Unit HUP
1) Environment
The total area of the unit is 322.74 ha. Parent material is Basement System rocks that consist of
gneisses poor in ferro-magnesian minerals, predominantly quartz-feldspar and granitoid gneisses.
Vegetation is wooded bushland and grassland of Commiphora schimperi, Acacia tortilis, Chloris roxburghiana and Pennisetum mezianum. The unit falls within agro-climatic zone V with rainfall
of about 600 mm. Relief is variable and irregular slopes that are generally over 16%.
2) Soil properties and classificationThe soils are somewhat excessively drained, shallow to deep, rocky and stony. The soils are
classified as Eutric Regosols (FAO/UNESCO, 1994) or typic Ustorthents (Soil Survey Staff,
1992).
Profile 173/2-3
a) Morphology
The profile is located on the shoulder of the hill. The A-horizon is 14 cm thick, dark yellowish
brown (7.5YR 3/6) to dark reddish brown (5YR 3/2), silty clay loam, sub-angular blocky
structure and friable. Below this is weathering material. Soil horizon boundary is abrupt and
wavy.
40
b) ChemicalThe pH-H:0 increased from 6.3 in the topsoil to 6.4 in the weathering material. EC increased
with depth from 0.32 dS/m to 0.35 dS/m. Organic carbon is 1.13% in the profile. CEC is 17.60
cmol(+)/kg soil in the A-horizon and 16.0 cmol(+)/kg soil in the weathering material. Ca and
Mg are about 7.0 cmol(+)/kg soil and 3.0 cm ol(+)/kg soil, respectively in the profile. K and Na
are 0.96 cmol(+)/kg soil and 0.57 cm ol(+)/kg soil, respectively. Base saturation increases with
depth from 67% in the topsoil to 75% in the weathering material.
c) PhysicalThe sand content increased from 13% in the A-horizon to 33% in the weathering material. Silt
and clay contents decreased with depth.
d) Interpretation
The thin A-horizon is evidence of limited soil formation occasioned by lateral truncation that
dominates Vertical soil forming processes. The abrupt change from an A-horizon to a C-horizon
is typical of Leptosols. Parent material may have played a role as can be observed by the high
content of sand immediately below the A-horizon.
41
1) EnvironmentThe total area of the unit is 522.49 ha. Parent material is collovium derived from various
gneisses, predominantly quartz-feldspar gneisses and in places gneisses rich in ferro-magnessian
minerals (biotite and hom-blende-biotite gneisses). The vegetation is bushed grassland of Acacia tortilis, Combretum apiculatum, Themeda triandra and Chloris roxburghiana. The unit falls
within agro-climatic zone V with rainfall o f approximately 600 mm. Relief is composed of
uniform, slightly concave to straight slopes ranging from 4% to 16%.
2) Soil properties and classificationThe soils are well drained, very deep, dark reddish brown to dark red, friable sandy clay to clay.
The soils are classified as Haplic Acrisols (FAO/UNESCO, 1994) or Typic Rhodustults (Soil
Survey Staff, 1992).
Profile 173/2-4a) Morphology
The profile is located on the upper part of the footslope. The A-horizon is 18 cm thick, dark
reddish brown (5YR 2.5/2), sandy loam, sub-angular blocky structure and friable. The Btl
horizon is 40 cm thick, dark reddish brown (2.5YR 3/4), sandy clay loam, weak angular blocky
and friable. The Bt2 horizon is 50 cm thick, dark red (2.5YR 3/6), sandy clay, weak angular
4.1.2 Soils of the footslopesMapping Unit FUr
42
blocky and friable. The Bt3 horizon is 42 cm thick, dark red (2.5YR 3/6), clay, weak angular
blocky and friable. All the horizon boundaries are gradual and wavy.
b) ChemicalThe pH-H:0 decreased with depth from 5.3 in the top soil to 4 .4 in the sub-soil. EC decreased
with depth from 0.06 dS/m in the topsoil to 0.03 dS/m in the sub-soil. Organic carbon decreased
with depth from 0.49% in the topsoil to 0.19% in the sub-soil. Topsoil CEC is 9.80 cmol(+)/kg
soil while that o f sub-soil is between 7.40 and 10.80 cm ol(+)/kg soil . Ca ranges between 0.09
cmol(+)/kg soil to 1.47 cmol(+)/kg soil in the profile. Mg increased with depth from 0.67
cmol(+)/kg soil in the top soil to 2.36 cm ol(+)/kg soil in the sub-soil. Na and K decreased with
depth in the profile. Base saturation is less than 50% in all horizons.
c) Physical
The sand content decreased with depth from 83% in the top soil to 46% in the subsoil. The clay
content increased with depth from 14% to 52%. Silt content is approximately uniform in the
profile.
d) In terpretation
The low exchangeable cations and CEC are indications of poor chemical characteristics of these
soils. The increase in clay with depth is an indication of Vertical soil processes that have taken
place. The dark red sub-surface colours and the thin, brown ochric A-horizon are characteristics
typical of Acrisols.
43
1) EnvironmentTotal area o f the unit is 75070.10 ha. Parent material comprises pleistocene volcanics that are
mainly olivine basalts in the form of agglomerates and breccias. Vegetation is wooded bushed-
grassland of Digitaria macroblephara, Acacia tortilis, Pennisetum mezianum and Lintonica nutans. The unit falls within agro-climatic zone V with rainfall of about 600 mm. Relief is
uplands with smooth, slightly concave and convex slopes surrounding the hills o f unit HVP.
Slopes range from 3-7%.
2) Soil properties and classificationThe soils are well drained, very deep, dark reddish brown to dark red, friable clay. The soils are
classified as Rhodic Ferralsols (FAO/UNESCO, 1994) or Rhodic Halpustox (Soil Survey Staff,
1992).
Profile No. 174/1-3
a) M orphology
The profile is located on a flat terrain in the uplands. The A-horizon is 24 cm thick, dark reddish
brown (2.5YR 3/4), loam, sub-angular blocky structure and friable. The AB-horizon is 21 cm
thick, dark reddish brown (2.5YR 3/4), clay loam to loam, sub-angular blocky structure and
friable. The B-horizon is 145 cm thick, dark red (2.5YR 3/6), clay loam to silty clay, porous
4.1.3 Soils of the uplandsMapping unit UVrl
44
massive to weak, very fine angular blocky and friable. Soil horizon boundaries are gradual and
wavy. There are active biological activities throughout the profile.
b) ChemicalThe pH-H,0 increases with depth from 6.0 to 7.10. EC decreases with depth from 0.19 dS/m to
0.11 dS/m. Percent carbon decreases with depth from 0.42% to 0.23%. CEC of the topsoil is
12.0 cmol(+)/kg soil while that of the sub-soil ranges between 12.52 to 18.71 cm ol(+)/kg soil.
There is a general increase of Ca and Mg with depth in the profile. K decreases with depth
whereas Na ranges between 0.60 to 0.85 cm ol(+)/kg soil. The base saturation ranges from 67%
in the topsoil to 98% in the sub-soil.
c) PhysicalThe sand content decreased from 42% in the topsoil to 24% in the sub-soil. Silt content increased
with depth from 36% to 56%. Clay content increased with depth from 22% to 34%.
d) Interpretation
These soils have a deep solum, diffuse boundaries and lack well developed blocky structures,
characteristics that are typical for Ferralsols. The distinct red colours in the B-horizon are
indicative of high iron content. The sTable micro-aggregates, porous structure and many biopores
account for excellent porosity, good permeability and high infiltration in these soils. The low
CECs are an indication that these soils are chemically poor.
45
1) EnvironmentThe total area of the unit is 197.34 ha. Parent material is pleistocene volcanics, mainly olivine
basalts in the form of agglomerates and breccias. Vegetation is wooded bushed grassland of
Digitaria macroblephara, Aristida keniensis with Combretum zeyheri and Balanites aegyptiaca.
The mapping unit falls within agro-climatic zone V with rainfall of about 600 mm. Relief is
characterized by slightly concave and convex slopes surrounding the hills o f unit HVP. Slope
percentages range from 3-8%.
2) Soil properties and classificationThe soils are well drained, deep, dark reddish brown, friable clay loams with a stony phase. The
soils are classified as Rhodic Ferralsols (FAO/UNESCO, 1994) or Rhodic Haplustox (Soil Survey
Staff, 1992).
Profile No. 174/1-12a) MorphologyThe profile is located on gently undulating slopes within the soil mapping unit. The A-horizon is
20 cm thick, dark reddish brown (2.5YR 3/4), clay, sub-angular blocky structure and friable. The
B-horizon is 97 cm thick, dark reddish brown (2.5YR 3/4), silt loam, porous massive to weak,
very fine angular blocky structure and friable. Soil horizon boundaries are gradual and wavy.
Mapping Unit UVr2
46
b) Chemical
The pH-H,0 increases with depth from 5.8 in the topsoil to 6.5 in the sub-soil. EC decreases wi depth from 0.11 dS/m in the topsoil to 0.06 dS/m in the sub-soil. The topsoil has organic cartx content of 0.48%. CEC decreases with depth from 13.20 cmol( + )/kg soil in the topsoil to 10.< cmol(+)/kg soil in the subsoil. Ca, K and Na decrease with depth. Mg increases with depth fro 2.24 cmol(+)/kg soil in the topsoil to 3.76 cmol( + )/kg soil in the sub-soil. Base saturation between 52% and 60% throughout the profile.
c) Physical
There was an increase in sand content with depth with a maximum of 28% in the B-horizon. Si content increased with depth from 22% in the topsoil to 59% in the sub-soil. Clay contei decreased from 74% in the topsoil to 17% in the subsoil.
d) InterpretationThis unit has similar characteristics to unit UVrl. It is important to note that the Vertici distribution of the exchangeable cations suggest that percolating water is limited. Due to littl relief intensity and limited soil moisture most processes of the soil formation take place Verticall
and the lateral dynamics are minimal.
47
1) EnvironmentThe total area of the unit is 37.84 ha. The parent material is pleistocene volcanics, mainly olivine
basalts in the form of agglomerates and breccias. Vegetation is composed of wooded bushed
grassland of Digitaria macroblephara and Aristida keniensis with Combretum zeyheri and
Balanites aegyptiaca. The mapping unit falls within agro-climatic zone V with rainfall of about
600 mm. Relief is made up of undulating slopes of 4-8%.
2) Soil properties and classification
The soils are well drained, deep, dark brown, firm, stony and bouldery clay showing Vertic
properties. The soils are classified as Vertic Luvisols (FAO/UNESCO, 1994) or Vertic
Haplustalfs (Soil Survey Staff, 1992).
Profile No. 174/1-2a) MorphologyThe profile is located on an undulating position on the upland. The A-horizon is 25 cm thick,
clay, dark brown (7.5YR 3/2), sub-angular blocky structure and friable. The Bt horizon is 88 cm
thick, silty clay to clay, dark brown (7.5YR 3/2), sub-angular blocky structure and firm. There
are pieces of weathering rock in the Bt3 horizon. Below the Bt3 horizon is a layer o f weathering
material. Soil horizon boundaries are clear and smooth.
Mapping Unit UVd
48
b) Chemical
Organic carbon in the A-horizon is 0.86%. pH -H ,0 increases with depth from 7.3 in the top soil
to 7.9 in the sub-soil. EC of the topsoil is 0.57 dS/m while that of the subsoil ranges from 0.52
dS/m to 0.55 dS/m. CEC decreases with depth from 66.61 cmol( + )/kg soil in the topsoil to 65.52
cmol(+)/kg soil in the sub-soil. Ca and K decreased with depth while Mg and Na increased with
depth. Base saturation is approximately 100% in the profile.
c) Physical
There was a slight increase with depth in the sand content (9% to 12%). Silt content increased
from 31% in the A-horizon to 45% in the Bt2 horizon and then decreased to 32% in the Bt3
horizon. Clay distribution in the profile is irregular with Btl horizon of 50%, Bt2 horizon 48%
and Bt3 horizon 56%.
d) InterpretationThe argillic horizon in these soils was most likely formed by transport of peptized clay particles
percolated through the cracks. Clay translocation is particularly prominent in soils, which crack in
the dry season but become wet during occasional downpours. The soils have favourable physical
properties as indicated by the sTable blocky structures. It should be pointed out that the high silt
contents pose a risk to slaking and erosion. The high base saturation indicates that these soils are
chemically fertile.
49
1) EnvironmentThe total area of the unit is 352.80 ha. Parent material comprises gneisses rich in ferro-magnesian
minerals, mainly biotite and hornblende-biotite gneisses. The vegetation is bushed grassland of
Chloris roxburghiana and Cenchrus ciliaris with Combretum apiculatum and Combretum collinum. The mapping unit falls within agro-climatic zone V with rainfall of about 600 mm.
Relief is undulating to gently undulating uplands with rather uniform convex slopes ranging from
4-8%.
2) Soil properties and classification
The soils are well drained, deep to very deep strongly weathered friable sandy clays. The soils are
classified as Rhodic Ferralsols (FAO/UNESCO, 1994) or Rhodic Haplustox (Soil Survey Staff,
1992).
Profile No. 174/1-5a) Morphology
The profile is located on an undulating position on the upland. The A-horizon is 26 cm thick, dark
reddish brown (2.5YR 3/4), sandy clay, sub-angular blocky structure and friable. The B-horizon
is 119 cm thick, dark reddish brown (2.5YR 3/4), sandy clay, porous massive to weak, medium
angular blocky and friable. There are common small pores in all the horizons. Soil horizon
boundaries are gradual and wavy.
Mapping Unit UFr
50
b) ChemicalpH-H,0 increased with depth from 5.8 in the topsoil to 6.7 in the sub-soil. EC increased with
depth from 0.09 dS/m in the topsoil to 0.26 dS/m in the sub-soil. Organic carbon in the A-horizon
is 0.34%. CEC increased with depth from 13.08 cm ol(+)/kg soil in the topsoil to 16.45
cmol(+)/kg soil in the sub-soil. Ca and Mg increased with depth while K and Na decreased with
depth. Base saturation ranges from 92% to 103% in the profile.
c) Physical
The sand content decreased with depth from 55% in the topsoil to 40% in the sub-soil. Silt
content increased slightly with depth from 9% in the topsoil to 13% in the sub-soil. Clay content
increased with depth from 36% in the A-horizon to 47% in the BU3 horizon.
d) InterpretationThe deep solum and diffuse boundaries are characteristics that are typical of Ferralsols. The
porous massive structure gives good permeability and high infiltration rates. The low CECs
indicate that the soils are chemically poor.
51
1) EnvironmentThe unit lies on a total area of 523.92 ha. Parent material comprises o f colluvia and alluvia
derived from various gneisses, mainly quartz-feldspar gneisses, which are poor in ferro-
magnessian minerals. The vegetation is bushed grassland o f Themeda triandra, Digitaria macroblephara with Combretum species, Acacia Senegalensis and other shrubs/trees. The soil
mapping unit falls within agro-climatic zone V with rainfall of about 600 mm. Relief is composed
of gently sloping area with slopes of about 3% and upto 4 km long.
2) Soil properties and classificationThe soils are well drained, very deep, dark greyish brown to dark brown, friable, sandy clays.
The soils are classified as Humic Cambisols (FAO/UNESCO, 1994) or Dystric Ustochrepts (Soil
Survey Staff, 1992).
Profile No. 173/1-5a) MorphologyThe profile is located in the middle of the slope. The A-horizon is 22 cm thick, very dark grey
(5YR 3/1), sandy clay loam to sandy clay, sub-angular blocky structure and friable. The B-
horizon is 128 cm thick, dark reddish brown (5YR 3/3), sandy clay, sub-angular blocky structure
4.1.4 Soils of the piedmont plainsMapping unit YUd
52
and friable. There are very many small pores throughout the profile. The soil horizon boundaries
are gradual and wavy.
b) Chemical
Organic carbon content of the topsoil is 0.56%. pH-H20 increased from 4.60 in the topsoil to
4.90 in the sub-soil. The EC decreased with depth from 0.06 dS/m in the topsoil to 0.03 dS/m in
the subsoil. CEC increases with depth from 12.60 cm ol(+)/kg soil in the topsoil to 22.18
cmol(+)/kg soil in the subsoil. There is a general decrease with depth in the amounts of Ca, K
and Na. Mg increased with depth from 1.58 cmol(+)/kg soil in the topsoil to 2.01 cmol(+)/kg
soil in the B-horizon. Base saturation ranges from 23% to 28% in the profile.
c) Physical
The sand content decreased from 61% in the topsoil to 52% in the subsoil. Silt content was
approximately 5% in the profile. Clay content increased from 35% in the A-horizon to 42% in the
B-horizon.
d) Interpretation
These soils have medium texture, good structural stability, high porosity and good internal
drainage, characteristics that are common in Cambisols. The strongly acid soil reaction and low
base status may pose restriction on the use o f these soils. The thick, dark grey A-horizon may be
as a result of the influx o f colluvium on the piedmont plain.
53
1) Environment
The total area of the unit is 938.87 ha. Parent material is composed of undifferentiated gneisses
that are poor in ferro-magnessian minerals. Vegetation is wooded bushland and Chloris roxburghiana and Sporobolus angustifolia with Commiphora schimperi and Acacia mellifera. The
unit falls within the agro-climatic zone V with rainfall of about 600 mm. Relief comprises flat to
gently undulating uniform convex-concave slopes of upto 5 %.
2) Soil properties and classificationThe soils are well drained, very deep, dark brown to dark reddish brown, friable to firm, sandy
clay to clay. They are classified as Haplic Lixisols (FAO/UNESCO, 1994) or Typic Haplustalfs
(Soil Survey Staff, 1992).
Profile No. 173/2-6a) MorphologyThe profile is located on a flat area within the erosional plains. The A-horizon is 20 cm thick,
dark brown (7.5YR 4/4), sandy clay loam, sub-angular to porous massive structure and friable.
The Bt horizon is 180 cm thick, dark reddish brown (2.5YR 3/4), sandy clay to clay, porous
massive to angular blocky structure and friable to firm. There are many fine pores throughout the
profile. Soil horizon boundaries are gradual and wavy.
4.1.5 Soils of erosional plainsMapping unit PU1
54
b) ChemicalOrganic carbon in A-horizon is 0.74%. pH-H20 increased with depth from 6.3 in the topsoil to
7.2 in the sub-soil. EC is approximately 0.05 dS/m in the profile. CEC increased with depth from
11.6 cmol( + )/kg soil in the topsoil to 15.2 cmol(+)/kg soil in the subsoil. Ca increased with
depth from 5.6 cmol(+)/kg soil in the A-horizon to 8.6 cm ol(+)/kg soil in the Bt4 horizon. Mg
increased with depth from 2.3 cmol(+)/kg soil in the topsoil to 4.8 cm ol(+)/kg soil in the
subsoil. K decreased with depth from 1.4 cm ol(+)/kg soil in the A-horizon to 0.3 cmol(+)/kg
soil in the B-horizon. Na ranges from 0.1 cmol(+)/kg soil to 1.0 cm ol(+)/kg in the profile. Base
saturation ranges from 64% to 97% in the profile.
c) Physical
The sand content decreased from 61% in the topsoil to 49% in the subsoil. Silt content ranges
between 6% to 12% in the profile. There was an increase in clay content with depth with a
maximum of 47% in the Btl and Bt2 horizons.
d) Interpretation
The porous massive surface structure poses a problem of structure stability and hence there is a
risk of slaking and cracking of the surface soil. The higher soil pH and absence o f serious Al-
toxicity makes these soils better than the Ferralsols and Acrisols.
55
Mapping unit PU21) EnvironmentThe size of the unit is 2209.50 ha and the parent material comprise of undifferentiated gneisses
that are predominantly quartz-feldspar gneisses poor in ferro-magnessian minerals. Vegetation is
bushed grassland of Chloris roxburghiana and Sporobolus angustifolia with Commiphora schimperi. Acacia ancistroclada and Acacia mellifera. The unit is in agro-climatic zone V with
rainfall o f about 600 mm. Relief is gently undulating to undulating with convex-concave uniform
slopes o f upto 5 %.
2) Soil properties and classificationThe soils are well drained, deep to very deep, dark reddish brown to dark red, friable clays. They
are classified as Rhodic Ferralsols (FAO/UNESCO, 1994) or Rhodic Haplustox (Soil Survey
Staff, 1992).
56
Profile No. 173/2-2a) Morphology
The profile is located in the middle of a slope on the erosional plains. The A-horizon is 23 cm
thick, dark reddish brown (2.5YR 2.5/4), sand clay loam, sub-angular blocky to porous massive
structure and friable. The B-horizon is 105 cm thick, dark reddish brown (2.5YR 3/4) to dark red
(2.5YR 3/6), sandy clay to clay loam, porous massive to very weak angular blocky structure and
friable. There are many fine pores in the profile. Soil horizon boundaries are gradual and wavy.
b) ChemicalpH-H20 increased with depth from 5.3 in the topsoil to 5.9 in the subsoil. EC decreased with
depth from 0.07 dS/m in the topsoil to 0.03 dS/m in the B-horizon. Organic carbon in the A-
horizon is 0.57%. CEC is approximately 12 cmol(+)/kg soil in the profile. Exchangeable cations
decrease with soil depth. Base saturation is between 39% and 62% in the profile.
c) Physical
The sand content decreased from 54% in the topsoil to 39% in the subsoil. Silt content increased
with depth from 12% in the A-horizon to 23% in the BU3-horizon. Clay content increased from
34% in the topsoil to a maximum of 42% in the sub-soil.
57
d) InterpretationThese soils exhibit characteristic morphological features of Ferralsols i.e. deep solum, gradual
horizon boundaries, good internal drainage, distinct red colours and absence of well developed
blocky structures. The many biopores and sTable micro-aggregates account for good porosity,
permeability and high infiltration rates in these soils. The low base saturation account for poor
chemical fertility in these soils.
4.1.6 Soils of volcanic plains
Mapping Unit PBr
1) EnvironmentThe total area of the unit is 4803.95 ha and parent material is olivine basalts. The unit is mainly
flat and falls within agro-climatic zone V with rainfall of about 600 mm. Vegetation is grassland
of Digitaria spp., Sporobolus spp, Cenchrus ciliaris and Themeda triandra.
2) Soil properties and classificationThe soils are well drained, very deep, dark reddish brown to dark red, friable clays. They are
classified as Eutric Cambisols (FAO/UNESCO, 1994) or Typic Ustochrepts (Soil Survey Staff,
1992).
58
Profile No. 174/1-1a) Morphology
The profile is located in a flat area on the volcanic plains. The A-horizon is 22 cm thick, dark
reddish brown (5YR 3/4), clay loam, sub-angular blocky structure and friable. The B-horizon is
178 cm thick, dark reddish brown (2.5YR 3/4) to dark red (2.5YR 3/6), clay loam angular blocky
structure and friable. There are many fine pores throughout the profile. Soil horizon boundaries
are gradual and wavy and there are weatherable minerals in the profile.
b) ChemicalOrganic carbon is 0.59% in the A-horizon. pH-H20 increased with depth from 6.0 in the topsoil
to 6.5 in the subsoil. EC decreased with depth from 0.16 dS/m in the topsoil to 0.09 dS/m in the
subsoil. Topsoil CEC is 20 cmol(+)/kg soil while that of the subsoil ranges from 15.20
cmol(+)/kg soil to 18.93 cmol(+)/kg soil. There is a general decrease with depth of the
exchangeable cations. Base saturation ranges from 71% to 81% in the profile.
c) Physical
The sand content is highest in the Ap2-horizon with 43% and lowest in the BU2-horizon with
29%. Silt content distribution is irregular with 29% in the topsoil and a maximum o f 44% in the
B-horizon. Clay content is also irregularly distributed with 34% in the topsoil and a maximum of
35% in the subsoil.
59
d) InterpretationThese soils are best described by the following characteristics that are common in Cambisols.
- The presence of weatherable minerals in the profile
- The medium texture that makes them have a good structural stability, a high porosity and
good water holding capacity.
- The near neutral to weakly acid soil reaction and a satisfactory chemical fertility
Mapping unit PBd
1) Environment
The unit occupies an area of 48.15 ha and the parent material is olivine basalts. Vegetation is
grassland o f Digitaria spp., Cenchrus cilliaris, Sporobolus spp and Themeda triandra. The unit is
on flat land and falls within agro-climatic zone V with rainfall of about 600 mm.
2) Soil properties and classification
The soils are well drained, deep, black, friable calcareous clays. The soils are classified as Haplic
Luvisols (FAO/UNESCO, 1994) or Typic Haplustalfs (Soil Survey Staff, 1992).
60
Profile No. 174/1-4a) Morphology
The profile is located in the middle of the plains. The A-horizon is 25 cm thick, black (2.5YR
2/0), clay, sub-angular blocky structure and friable. The B-horizon is 67 cm thick, black (2.5YR
2/0), clay, sub-angular blocky structure and friable. There are fragments o f weathering rock in
Bt, horizon. Below the Bt3 horizon is weathering rock. There are may fine pores in the profile.
Soil horizon boundaries are clear and wavy.
b) Chemical
Organic carbon is 1.37% in the topsoil and decreased to 0.69% in the subsoil. pH-H20 increased
with depth from 6.5 in the A-horizon to 8.0 in the lower B-horizon. EC increased with depth
from 0.34 dS/m in the topsoil to 0.52 dS/m in the subsoil. CEC increases with depth from 46.59
cmol(+)/kg soil in the topsoil to 61.15 cmol(+)/kg soil in the subsoil. Exchangeable cations
increased with depth with Ca showing the most increase. Base saturation is 46% in the topsoil and
increases to over 100% in the subsoil.
c) Physical
Sand content decreased from 37% in the topsoil to 18% in the subsoil. Silt content is
approximately 12% in the profile. Clay content is 49% in the topsoil and increased to 68% in the
B-horizon.
61
The thick black A-horizon is an indication o f sTable conditions that allowed Vertical processes
instead of lateral ones. Drainage waters have led to pervection resulting in the formation of an
argic horizon. The Vertical processes have also resulted in the relative accumulation of
exchangeable cations in the subsoil. The high base status is an indication that the soils are fertile.
With sTable blocky structures and a porous well aerated profile, these soils have favourable
physical properties.
4.1.7 Soils of bottomlands
Mapping unit BXC
1) EnvironmentThe unit occupies an area of 5892.4 ha and the parent material is alluvial and colluvial clay
deposits mainly derived from volcanic rocks and ashes. Vegetation is grassland o f Pennisetum mezianum, Lintonia nutans and Enchinochloa hapoclada. The landscape is flat to very gently
undulating with slopes o f less than 2%. The unit falls within agro-climatic zone V with rainfall of
about 600 mm.
2) Soil properties and classification
The soils are a complex o f imperfectly drained, very deep, very dark brown to dark grey, firm
cracking clays o f varying calcareousness. They are classified as Eutric Vertisols, saline-sodic
phase (FAO/UNESCO, 1994) or Typic Haplusterts (Soil Survey Staff, 1992).
d) Interpretation
62
Profile No. 174/1-7a) MorphologyThe profile is located in the middle of the bottomland. The A-horizon is 24 cm thick, very dark
brown (10YR 3/3), clay, crumb structure and firm. The C-horizon is 81 cm thick, very dark
brown (10YR 3/3), clay, angular blocky structure and firm. There are many thick slickensides
throughout the profile. Soil horizon boundaries are generally gradual and the profile is cracked up
to a depth of 50 cm.
b) ChemicalOrganic carbon is about 0.74% in the profile. pH-H20 increased with depth from 7.6 in the
topsoil to 8.4 in the subsoil. EC of the topsoil is 0.67 dS/m while that of the subsoil is 0.87 dS/m.
CEC is approximately 64 cmol(+)/kg soil in the profile. There is a general increase with depth of
the exchangeable cations. Base saturation is more than 100% throughout the profile.
c) Physical
Sand content decreased with depth from 36% in the topsoil to 22% in the subsoil. Silt content also
decreased with depth from 17% in the topsoil to 12% in the subsoil. Clay increased with depth
from 47% in the topsoil to 66% in the subsoil.
d) Interpretation
The thick and dark A-horizon may have resulted from an influx o f material from higher positions
to the bottomlands. The relatively low moisture in the depressions and the material (organic
63
matter) mix resulting into thick and dark A-horizon. The deep cracks and slickensides are as a
result of swelling and shrinking of these soils. The very hard consistence when dry and very
sticky and plastic when wet are unfavourable physical characteristics. The fine texture and poor
internal drainage account for poor workability of these soils. These soils are fertile as shown by
high CEC and high base saturation. The saline/sodic phase occurs in these soils because they are
located in depressions without an outlet.
64
4.2 SOIL CLASSIFICATION, CORRELATION AND GENESIS
The soils o f the study area are classified according to FAO/UNESCO-UNESCO (1994) system and the Soil Survey Staff (1992) system. The classification systems define a soil unit in terms of diagnostic horizons and diagnostic properties. Diagnostic horizons are soil horizons that combine a set of properties that are used in identifying soil units. These characteristics are expressed in terms of quantitatively defined morphological, chemical and physical properties that were developed during the process o f soil formation. Most of the properties refer to permanent soil characteristics that are not easily altered.
The current FAO/UNESCO system of classification comprises 28 major soil groupings, subdivided at the second level into 153 soil units. The Revised Legend (FAO/UNESCO, 1990) introduced a third level o f soil sub-units, devised in support of soil mapping at larger scales (> 1:5.000). Phases are specific none taxonomic mapping units. They mark surface or sub-surface features of the land, limiting the agricultural use and often cutting across the boundaries of soil units or soil sub-units. This system is used as a framework for classification in Kenya.
Soil Taxonomy and FAO/UNESCO systems have a similar structure, but in line with its wider application in both large scale and small-scale soil mapping, Soil Taxonomy uses more hierarchical levels (categories) than the FAO/UNESCO system. The definitions of both diagnostics criteria (horizons) and properties o f the FAO/UNESCO system were copied largely from the Soil Survey Staff Soil Taxonomy. This has the advantage that it is relatively easy to correlate the soils of both systems.
In this section, the description of the main soil classification units identified in the project area is given. Each of the identified classification units are described with respect to diagnostic horizons and diagnostic properties as far as they are relevant in the survey area.
65
4.2.1 .Major classification units
FerralsolsThe essential diagnostic feature of ferralsols is the presence of a ferralic B-horizon. A ferralic B- horizon is at least 30 cm thick with a texture that is sandy loam or finer and has at least 8 per cent clay in the fine earth fraction. It has a CEC of <L 16 cm o l(+ )/kg 1 clay and less than 10% weatherable minerals in the 50-200 /xm fraction. It has less than 10% water-dispensable clay and silt-clay ratio of 0.2 or less (FAO/UNESCO, 1994). The horizon does not show andic properties and has less than 5% by volume showing rock structure. Rhodic Ferralsols have been mapped in the study area.
Rhodic ferralsols have a red to dusky red ferralic B horizon which are not strongly Humic and lack geric properties. They also lack plinthite within 125 cm of the surface. In the study area, ferralsols are found on volcanic plains, footslopes and the uplands. They are developed from volcanic rocks and have good physical properties but are chemically poor. Ferralsols occupy nearly half of the project area. Their low natural fertility, virtual absence of weatherable minerals, and very low cation retention capacity are serious limitations.
VertisolsThese soils consist of the dark cracking clays that expand and contract with changes in moisture content resulting in the formation of polished and grooved surfaces called slickensides. The clays are dominantly montmorillonite, which is characteristically sticky and plastic when, wet and very hard when dry. These soils have an AC profile, the A horizon consisting o f both the surface mulch (or crust) and the underlying structure profile that changes only gradually with depth (FAO/UNESCO, 1994). When dry, the cracks extend from the surface to depths of more than 50 cm and the cracks are at least 1 cm wide. Eutric Vertisols with a saline-sodic phase are found in the study area. Eutric Vertisols have a base saturation of 50% or more at least between 20 and 50 cm from the surface and lack calcic or gypsic horizon.
66
In the study area, Vertisols are found in bottomlands and are developed on various parent materials. Vertisols occupy nearly one fifth o f the project area. The fine texture and poor internal drainage account for the often poor workability of Vertisols, both in wet and dry conditions.
LeptosolsLeptosols are soils, which are limited in depth by continuous bedrock or continuous cemented layer within 30 cm of the surface (FAO/UNESCO, 1994). In the project area, these soils are found on hills and scarps and are classified as eutric Leptosols. Eutric Leptosols have an ochric A-horizon and base saturation of 50% or more and lack hard rock and continuous cemented layer within 10 cm. The surface is stony and bouldery and the steep scarps have prominent rock outcrops. These shallow soils have developed due to steep eroded slopes.
LuvisolsLuvisols have an ochric or umbric epidedon and base saturation by ammonium acetate of 50% or more throughout the B-horizon and a cation exchange capacity equal to or more than 24 cmol(+)/kg soil in the argic B-horizon (FAO/UNESCO, 1994). Evidence of argic B-horizon includes a sufficient increase in clay content between A and B horizons and the presence of clay cutans on ped faces and in pores in part of the B-horizon. In the study area, Luvisols are found on the uplands and on plains. They have developed on volcanic rocks and have favourable physical properties and are generally fertile.
CambisolsThe cambic B-horizon is the only diagnostic feature that all Cambisols have in common. A cambic B-horizon can also occur in other major soil groupings but it is not a differentiating characteristic there because other properties are given a higher priority (salic properties in Solonchaks, gleyic properties in Gleysols and andic properties in Andosols).
67
The fact that Cambisols key out last in the taxonomic hierarchy o f major soil groupings implies that Cambisols include many soils that just missed out on one or more requirements for other soil groupings. In other words, many Cambisols are in a transitional stage of development from a young soil to a mature soil with an argic, natric, spodic or ferralic B-horizon. Nonetheless, a cambic B-horizon can be quite sTable, viz: where the environment counteracts pedogenetic change, e.g. by low temperatures or even permafrost, or by low precipitation, or impeded drainage or weathering-resistant parent materials, or by a continuous supply o f ions to relinquish ions lost by leaching, (i) recognizable soil structure (ii) greyish reduction colours and/or (iii) a stronger chroma, redder hue or higher clay content than the underlying horizon mark a cambic B- horizon (FAO/UNESCO, 1994). Eutric Cambisols have an ochric A-horzizon and a base saturation o f 50 per cent or more at least between 20 and 50 cm from the surface but which are not calcareous within this depth. Humic cambisols have an umbric A-horizon or a mollic A- horizon overlying a cambic B-horizon with a base saturation of less than 50 per cent. In the study area the cambisols are found on the plains.
AcrisolsAcrisols are characterized by the presence of an argic B-horizon, a dominance o f sTable low activity clays and a general paucity of bases. The argic B-horizon forms through (i) clay dispersion (ii) clay transport and (iii) clay accumulation in a Bt-horizon.
Most Acrisols have a thin, brown, ochric A-horizon; darker colours occur where (periodic) water-logging, augmented perhaps by oligotrophy hinders mineralization of soil organic matter. Most Acrisols have bright red and yellow sub-surface colours. Gleyic soil properties and/or plinthite are common in Acrisols in low terrain positions. Eluviation of the surface horizons of Acrisols has lowered their sesquioxide content. The soil structure is weak and individual elements collapse readily under the impact of tropical rains showers, particularly where the E-horizon has become exposed by erosion. The structure of the Bt-horizon is more sTable. Haplic Acrisols are strongly Humic, lack ferric properties, lack plinthite within 125 cm of the surface and lack gleyic
68
properties within 100 cm of the surface (FAO/UNESCO, 1994). The Acrisols in the study area are found on the footslopes.
LLxisols
Most LLxisols have a brown ochric A-horizon (not seldom shallow as a result of erosion) over a brown or reddish brown argic B-horizon. The sub-surface soil may show signs of iron redistribution. The horizon of eluviation o f clay and free iron oxides may be sufficiently developed to qualify as an albic E-horizon. Lixisols have an argic B-horizon which has a cation exchange capacity of less than 24 cmol (+ )/kg clay at least in some part o f the B-horizon and a base saturation o f 50 percent or more throughout the B-horizon (FAO/UNESCO, 1994). Haplic Lixisols lack an albic E-horizon, lack ferric properties and plinthite within 125 cm o f the surface and lack gleyic and stagnic properties within 100 cm of the surface. Lixisols are found on the plains in the study area.Correlation o f the units found in the project areaFAQ/UNESCO-UNESCO system SOIL SURVEY STAFF TaxonomyLeptosols EntisolsFerralsols OxisolsLuvisols AlfisolsVertisols VertisolsCambisols InceptisolsAcrisols UltisolsLixisols Alfisols
4.2.2 Soil genesisSoil forming factors of parent material, topography (relief), climate, organisms and time determine development of soils. Understanding of the influence o f these factors helps greatly in the mapping and classification of soils. In order to understand better the pattern o f soils in the survey area, an overview on soil genesis is presented in relation to the soil forming factors.
69
4.2.2.1 Influence o f parent material
The soils of the survey area have developed on basement system rocks and various volcanic rocks. The mineralogy of five rock samples was examined and the analysis revealed that the rocks were predominated by iron oxides, vesicles, clays, feldspars, rutile and pyroxenes (Table 2).
Table 2: Petrographic analysis o f rock samples o f Mashuru area
The high silica and aluminium oxide contents of the soils resulted from the weathering of calc-
feldspars and the orthoclases (K-felspars). According to Allen and Hajek (1989), calc-feldspars
have a higher weathering potential than the orthoclases. The weathering of K-feldspars resulted
in relatively high levels o f K + while that of plagioclases gave rise to Ca2+ (Table 4). Although
these soils show low levels of Ca2+, it should be noted that the weathering o f plagioclase
feldspars has a direct bearing on the presence o f Ca2" in soils.
72
According to Longwell et a /.(1969), ferro-magnesian minerals (pyroxenes in the study area)
weather to give Fe2+ and Mg2+ as metallic ions and silica and aluminium as colloids.
Pyroxenes are considered unsTable in pedogenic environments (Allen and Hajek, 1989). They
weather easily giving cations of Fe2+, Mg2+ and Ca2+.
The sand fraction of the soils (Table 3) was dominated by quartz, calcic-feldspars, magnetite,
biotite and haematite. The assemblage of the minerals reflected the nature o f the parent
material i.e. volcanic rocks are typified by basic plagioclase feldspar and pyroxenes whereas
the basement system is characterised by orthoclases (K-feldspars). Since calcic feldspars
weather fairly rapidly, their presence indicated a relatively short period o f pedogenesis. The
presence of magnetite in both the rocks and the soils indicated that its presence in the soils was
geo-genetic i.e. as a result of rock weathering. Haematite was present in most of the soil
samples but was not observed in the rocks. This indicated that the mineral was a secondary
product o f the weathering o f magnetite. Biotite was present in the soils but absent in the rocks.
This indicated that the biotite in soils was of pedogenetic origin.
According to Longwell et a / .(1969), magnetite upon weathering produce Fe2+ as metallic ions
and iron oxides as colloids while haematite and limonite are the secondary minerals. The high
amounts of Fe20 3 in the soils explains the red colours on the hills, footslopes, uplands and
plains. The red colours are due to the presence of haematite as confirmed by the sand
mineralogy. According to Allen and Hajek (1989), haematite is an effective soil-pigmenting
73
agent. It has colours of 5YR to 2.5YR and forms extremely small crystallites. Schwertmann
and Taylor (1989) noted that even at low concentrations in soil, haematite has a high
pigmenting power and determine the red colour in soils.
The S i0 2:Al20 3 ratios (Table 4) were nearly constant throughout the profiles. This reflected an
environment devoid of the leaching typical o f the semi-arid conditions in the survey area.
Mohr at al. (1972) suggested that S i02:Al20 3 ratios greater than 2 indicates fersiallitic
weathering. Higher ratios reflect intense chemical activity in the soil. In the survey area, the
ratio for the soils was less than 2, implying little chemical activity. This is confirmed by the
low cation exchange capacities. According to Allen and Fanning (1983), rutile weathers to give
titanium oxides. The high levels of T i0 2 in the soils resulted from the weathering o f rutile.
As indicated and confirmed by chemical, mineralogical and geo-chemical analyses, it can be
concluded that parent material has greatly influenced chemical and mineralogical properties of
soils in the study area. The mineralogy of the sand fraction reflected the processes that the
parent materials have undergone. The presence of calcic-feldspars and haematite indicated
incomplete weathering and that there is a high nutrient reserve potential.
74
Iron oxides
With the high amounts of iron oxides in these soils, it is appropriate to illustrate the manifold
significance of the oxides in the soils so as to better understand the genesis of the soils and
their behaviour as plant growth mediums. The iron oxides (a term used to embody oxides,
oxyhydroxides and hydrated oxides) are the most abundant o f the metallic oxides in soils
(Schwertmann and Taylor, 1989). They are present in most soils of the different climatic
regions as very fine particles in one or more o f their mineral forms and at variable levels of
concentration. They may occur evenly dispersed throughout the soil in horizons or in friable or
loose consistency, or concentrated in discrete horizons or in particular morphological features
as in ferricretes, mottles, nodules or pipestems (Aniku and Singer, 1990).
The many different mineral phases previously have been referred to as “free iron oxides” in an
attempt to differentiate between true oxides and the Fe bound in other minerals such as the
silicates (Torrent et al., 1980). This distinction is unnecessary, since Fe in other minerals is
not really present as an oxide; therefore, it will be more meaningful to refer to the minerals
collectively as “ iron oxides” , and subsequently distinguish primary and secondary or
pedogenic forms (Schwertmann and Taylor, 1989).
Pedogenic Fe-oxide minerals form under the influence of the common soil-forming factors
(climate, relief, parent material, organisms and time) and therefore reflect the pedo-
environmental conditions under which they have formed (Schwertmann, 1988). Once formed.
75
the mineral phases, composition and distribution of Fe oxides may be subject to continual
modification in an approach towards equilibrium with the changing soil environment
(Newman. 1987). Even at low concentrations in soils, Fe oxides have a high pigmenting power
and determine the colour of many soils. Thus, yellow, brown and red soil colours as
determined by the type and distribution of Fe oxides within a profile, help explain soil genesis
and are used in all languages for naming and classifying soils (e.g. Red-Yellow Podzolic,
Braunerde, sols rouges tropicaux, terra rossa and Kransnozem).
According to Schwertmann and Taylor (1989), the chemical nature and high specific surface
area o f sub-microscopic Fe-oxide particles make them efficient sorbents and therefore sinks for
(i) inorganic anions such as silicate, phosphate and molybdate; (ii) organic anions and
molecules such as citrate, fulvic and Humic acids and biocides; and (iii) cations such as Al,
Cu, Pb, V, Zn, Co, Cr and Ni, some of which are essential for plant growth. The cations can
be adsorbed on the surface or incorporated into the oxide structure. Barberis et al (1991) found
that Fe-oxides affect soil structure often including the formation of aggregates and the
cementation of other major soil components giving rise to nodules, pipestems, plinthites,
ortsteins and bog iron ores.
Of the crystalline pedogenic Fe-oxides, geothite and haematite are the most common (Aniku
and Singer, 1990). Lepidocrosite has occasionally been found in well drained soils and in some
buried paleo-soils. Maghemite, also rare, has been reported by Abreu and Robert (1985). This
mineral, when present in the A-horizon, usually results from the transformation o f other Fe-
76
oxides by forest fires. However, it has also been found in B-horizon, where it seems to be
neoformed.
Geothite occurs in almost every soil type and climatic region and is responsible for the
yellowish-brown colour o f many soils and weathered materials (Schwertmann, 1993).
Rubification (i.e. reddening due to pedogenic haematite formation) is favoured by a pedo-
environment where soils are warm, dry for long periods and low in organic matter
(Schwertmann et al., 1982). Haematite refers to the bright red colour of this mineral in a finely
dispersed state. This colour makes haematitic soils red (5YR and redder) and because of its
greater pigmenting power, can mask the yellow colour of higher concentrations o f geothite.
The redness of various soils has been found to be significantly correlated with their haematite
content (Torrent et al, 1983).
The distribution of three forms of iron oxides developed from various volcanic rocks and
Basement system rocks was carried out. Table 5 gives the results of the three forms of iron
oxides.
77
Table 5: Percentages o f pyrophosphate (Fep), Oxalate (Fe0I) and dithionite (FeJ extracTable iron oxide and active-Fe and Fed clay ratios in the soils.
Homan Depth Colour Fe,(% ) Fe„(% ) Fe„(% ) F e .,/F e , F e^C lay C lassification(cm)
Profile No. 174/1-1A pl 0-10 d .r.b 0.10 1.67 5.88 0.28 0.17A p2 10-22 d .r.b 0.13 0.42 4.96 0.08 0.17 Eutric CambisolsM2 72-117 d .r. 0.07 0.99 6.31 0.16 0.23Bu3 117-200+ d .r 0.06 0.14 6.29 0.02 0.18Profile N o . 174/ 1-3 Rhodic FerralsolsAB 24-45 d .r.b 0.02 2.80 5.94 0.47 0.22B ui 45-77 d .r 0.03 0.01 7.86 0.001 0.23Bu2 77-106 d .r 0.01 1.06 2.54 0.42 0.09Bu3 106- 150+ d .r 0.02 1.21 5.86 0.21 0.29Profile N o . 173/ 2-2 Rhodic FerralsolA 0-23 d .r.b 0.15 1.67 2.46 0.68 0.07B ui 23-47 d .r.b 0.16 1.86 2.87 0.65 0.07Bu3 74- 128+ d .r 0.14 1.68 2.95 0.57 0.08Profile N o . 173/2-4 Haplic AcrisolsA 0-18 d .r.b 0.16 0.44 0.77 0.57 0.06B tl 18-58 d .r.b 0.09 0.99 1.20 0.83 0.05B(2 58-108 d .r 0.09 0.34 2.09 0.16 0.06Bc3 108- 150+ d .r 0.23 1.02 1.33 0.77 0.03
In the above Table, nearly all of the pyrophosphate-extracTable Fe values were lower than the
corresponding oxalate values. The organic bound iron (Fep) in the soils ranges from 0.01 to
0.23%, indicating that Fep contributes a negligible proportion o f total iron oxides in the soils.
Low values of Fep in soils may be attributed to low organic carbon contents. There is irregular
variation in the Fep content in the soils within profiles.
Profiles Nos. 174/1-3 and 173/2-2 have each nearly uniform contents of Fep due to almost
similar values o f organic carbon contents. Profile No. 174/1-1 has relatively high values of
organic carbon contents in the topsoil, which is consequently reflected by the relatively high78
Fcr contents. The high organic carbon content in the topsoil is probably due to an accumulation
of vegetative materials. Profile No. 173/2-4 shows the highest Fep content in the sub-soil. This
profile has a coarse topsoil texture and the subsoil is clay. The relatively high Fep content in
the subsoil may be due to the migration of the iron oxides, bound as organic complexes, from
the coarse-textured surface soil to the finer textured subsoil.
Oxalate extracTable iron oxide (Feox) content is higher in the surface soils o f profile pits Nos.
174/1-1 and 174-1-3 than in the subsoils. Feox values in the surface soil range between 1.67%
and 2.80% whereas values for the sub-soils range between 0.01% and 1.21. Profile pit no.
173/2-2- has an average Feox value o f 1.74% whereas Feox values for profile pit no. 173/2-4
ranges between 0.34% and 1.02%. The degree o f crystallinity o f Fe oxides is determined by
the pedo-environment (Schwertmann and Taylor, 1989). Excessive temperatures and relatively
low contents of inhibitors of crystallization (organic matter and silicate) determine that the
ferrihydrite formed when Fe is released from the primary Fe-bearing minerals be converted
into crystalline Fe-oxides (Schwertmann, 1985). The prolonged high temperatures and low
organic matter in the project area may serve to explain the low content of Feox in the soils.
The total iron oxides (Fed) content o f the soils ranged from approximately 1% to 8% . This is
high when compared with values of soils developed on volcanic ash. Okoth (1988) presented
values of dithionite extracTable iron of soils developed on volcanic ash that were
79
approximately 1.0%. The high values in the Fed in the project area are piobablv b tcau
soils are rich in ferro-magnesian minerals.
Except for profile pit no. 174/1-3, there is a general increase with depth in the contents
in the soils of the other profiles. Profile pit no. 174/1-1 and 174/1-3 contain the highest
amounts of the total iron oxides (Fed) throughout the profile (4.96 to 6.31% and 2.54 to
7.86%, respectively). In well drained soils, Fe-oxides occur as isolated crystals or in small
aggregates concentrated in the clay-fraction (Torrent et al., 1980). Consequently, Fed is
correlated to the clay content of the soil. In the study area, however, there is no correlation
between the clay content and the distribution of the Fed in the profiles. The Fed/clay ratio
generally ranged from 0.03 to 0.29 (Table 5), which means that on a weight basis, about 3-
29% of the clay fraction corresponds to Fe oxides.
The distribution of oxalate extracTable Fe to dithionite extracTable Fe within each pedon can
be conveniently expressed as “active Fe ratio” (Lekwa and W hiteside. 1986). The F e 1)(/Fe
ratio measures the degree of activity of the Fe-oxides and has often been used in pedogenic
studies where it generally decreases with soil age (Aniku and Singer, 1990). The active Fe
ratios are generally higher in the topsoil than the subsoil in the profile nos. 174/1-1 1 7 4 / 1 3
and 173/2-2. The decrease in the active Fe ratio with depth indicated that higher proportions o f
Fe are present in more crystalline forms in the lower horizons o f the profiles In prufil „ 173/24,
80
81
the ratio is higher in the subsoil than the topsoil. This indicates illuviation and accumulation of
Fe from topsoil into the subsoil.
It can be concluded that the organic bound iron oxides constitute a negligible proportion of the
total iron oxides in the soils. The amorphous iron oxides are generally low as compared to the
total iron oxides. It should be pointed out that there is a high correlation between the P
adsorbed by a soil and the level of oxalate-soluble Fe and also between P adsorption and the
more crystalline Fe oxides (Borgaard, 1988a).
Figures 3-6 show graphical representations o f the distribution o f iron oxides in the soils. The
Fep content o f the soils is low while the oxalate extracTable iron content is generally high in
the topsoils than the sub-soils. The total iron oxides (Fed) content of the soils is high as
compared to results presented by other workers.
82
83
4 J J J Influence o f climateMoisture and temperature are the two aspects of climate most important in controlling soil
properties (Birkeland, 1984). Moisture is important because water is involved in most of the
physical, chemical and biochemical processes that go on in soil, and the amount o f moisture
delivered to the soil surface influences the weathering and leaching conditions with depth in the
soil. Temperature influences the rate o f chemical and biochemical processes. In the project area,
soil moisture is at a deficit for five months (from June to October). The probability that the
rainfall exceeds 600 mm in any one year is about 40% (Table 1).
A considerable part of the soils in the survey area are deep, reddish, non-calcareous and
predominantly kaolinite in their clay mineral composition. They have few weatherable primary
minerals left and show a weak or non-argic horizons (Ferralsols). These strongly weathered soils
cannot be attributed to the present climate. The present-day rainfall and seasonal distribution
would not be able to cause such a strong weathering. Therefore it must be assumed that soil
formation was strongly influenced by humid and hot conditions in the past.
Temperature has an effect on the amounts of organic carbon in the soil. High temperatures lead to
high decomposition rates o f organic carbon (Sanchez, 1976) and this explains the low topsoil
carbon contents (< 1% ). Though the soil to some extent has a stabilizing effect on the
decomposition of organic carbon (Duchaufour, 1982) the influence of temperature seems to
outweigh the chemical and mineralogical soil components. The result is lower organic carbon
84
contents than would be found under cooler, more humid conditions (Mizota, 1987).
4.2.23 Influence of relief
According to Daniels and Hammer (1992), topography influences soil formation by controlling
the dynamics within and above the soil mantle. Generally, the higher parts are better drained than
the lower parts giving different environments for clay formation. The migration of silica, calcium
and magnesium salts is normally downslope resulting in neo-formation of montmorillonitic clays
on foot slope positions. Aluminium is normally less mobile and its concentration reduces
downslope.
Topography influences soil formation in terms o f spatial redistribution within the soil mantle of
the bases, aluminium, iron and silica. The better drained summits have higher concentrations of
A1 than the slopes. The more mobile basic cations like sodium migrate to the downslope positions
accompanied by calcium. Clay and silica are also translocated in the same way. The steeper
midslope positions sometimes have shallower soils than the summit and footslope positions. This
is caused by truncation of the steeper slopes by flowing surface water (Birkeland et al., 1991).
Within the study area, the influence of topography is seen by the systematic arrangement of
different soil units from the hill summits down to the bottomlands. Soil variations occur from
Entisols on the relief summits, Alfisols on footslopes and Inceptisols in the Swale positions.
W'ithin the uplands, Oxisols occupy the summits and middle positions while Vertic Alfisols
85
occupy the lowest positions. The drainage is generally better on the higher parts than on the lower
parts. Soil depth increases downslope.
On the piedmonts, the higher slopes are normally well drained, the middle moderately well
drained and the lower ones somewhat imperfectly drained. Soil units vary from Dystric
Ustochrepts on upslope and midslope positions to Typic Ustochrepts on downslope position. The
thickness of B-horizon is highest on the downslope position.
In the study area, Rhodic Ferralsols are mainly found on uplands and on plains. It is significant
to note that these soils occur on old landscapes i.e. landscapes of gentle relief not or little
affected by erosion.
86
I'nder conditions of a relatively flat topography without free drainage, volcanic ash enrichment
may contribute to the formation of fine textured soils with Vertic properties (Daniels and
Hammer. 1992). In combination with certain base rich parent materials, imperfect drainage may
also lead to the formation of fine-textured soils with Vertic properties. An example is the Eutric
Vertisols of unit BXC. As they are formed under imperfect drainage conditions, the Vertisols
have saline-sodic subsoil. With increasing relief intensity and erosion, younger and shallower soils
may be expected. Such a sequence has been observed in the project area on those basement
system rocks, which are not affected by more recent ash enrichment.:
Ferralsols on plains (mapping unit PU2)
Acrisols on footslopes (mapping unit FUr)
Leptosols on hills and scarps (mapping unit HUP).
Figures 7a and 7b are N-S cross sections showing the influence o f topography in relation to soil development.
87
n)
l»
Fi” 7. Schem atic cross sections showing inlliicncc ot relief on soil developm ent
For growth and survival, plants depend on the moisture they can extract from the soil. The soils
retain moisture from infiltrated rain or irrigation water against the force of gravity; the amount
retained is called field capacity (F.C). Near field capacity the soil holds the water with little force
and plants can extract water easily. However, the force with which the soil holds water increases
w ith a decreasing moisture content, making it increasingly difficult for the plant to extract water
from the soil. For practical purposes, it is generally accepted that permanent wilting point (W.P),
occurs when the binding forces with which the soil holds the water exceeds 15 bar (Hillel, 1982).
The binding forces of the soil water are often expressed as pF-values, being the logarithm of the
binding forces in cm water. Field capacity coincides with binding forces equivalent to 0.1 to 0.33
bar, or pF 2.0 to 2.5. Permanent wilting point is reached at pF 4.2 (15 bar = 15,000 cm water;
log 15,000 = 4.2). The Kenya Soil Survey uses 0.2 bar (pF 2.3) for field capacity and pF 3.7 for
the upper limit of uninhibited plant growth. The difference in moisture content at these two pF
values is considered as the amount of soil water easily available for the plant growth.
4J Soil physical aspects
89
Table 6: Results o f pF-analysesL-i
D r p th(cm )
M o istu re c o n te n t (vo L % ) a t pFA v a ila b le*m o is tu re
Available moisture = moisture content at pF 2.3 - moisture content at pF 3.7
Table 6 presents average results of the pF analyses from A and B horizons o f four profile pits.
The Table shows a difference in moisture between the Rhodic Ferralsols and the other two soils
(Vertic Luvisols and Humic Cambisols). The Rhodic Ferralsols (units UVR1, UVR2, PU2) have
about 11 volume % available moisture in their A and B horizons while the Luvisols (unit Uvd)
and Cambisols (unit YUd) have about 13% and 8% respectively.
The very high silt+ clay % of the Vertic Luvisols can account for the high moisture retention of
the soils. The Rhodic Ferralsols have a somewhat limited available water holding capacity
because o f low silt content. The relatively less favourable water retaining capacity o f the Humic
Cambisols may have been influenced by their topographic position. Other physical aspects on
90
which data are available are porosity and bulk density. The data given in Table 7 are for the soilslisted in Table 6, averaged per soil classification unit.
Table 7: Porosity and bulk density
Soil classification Porosity (%) Bulk density (g/cm3)A-horizon B-Horizon A-horizon B-Horizon
Rhodic Ferralsol 31 42 1.37 1.20
I Vertic Luvisols 38 42 1.28 1.23
Rhodic Ferralsols 33 30 1.38 1.39
Humic Cambisols 52 48 1.18 1.26
The porosity (%) is that proportion of the volume of an undisturbed soil, which is not occupied by
solid soil material. Theoretically, the volume of water in a completely saturated, undisturbed soil
equals the porosity. As this condition is supposed to occur at pF 0, the % water (vol.) at this pF
was taken as a measure for the porosity. The relevant data are presented in Table 7.
Bulk density is expressed in g/cm3 and is a measure for the weight of undisturbed, air-dry soil.
Average data are given in Table 7 for the listed soils. The combined data of Table 7 does not
allow for detailed conclusions. However, the Cambisols have a higher porosity and a lower bulk
density than the Ferralsols and the Luvisols. This means that there is less root penetration
impedence in the Cambisols than in the Ferralsols and the Luvisols.
91
4.4 Soil fertility statusFor the soil fertility appraisal of the survey area, composite topsoil (0-20 cm) samples were taken
it the sites of representative profile pits and analyzed according to a “mass analysis’ method for
soil fertility evaluation (Chapter 3.2.3). Total nitrogen in the soil was obtained empirically from
the content of organic carbon in the soil. The C:N ratio in a soil is approximately 10:1 (Landon,
1984). From this relationship, total nitrogen was thus calculated. Total nitrogen is considered
deficient if less than 0.2%. Based on Landon (1984) and Okalebo et al., (1993). Table 8 presents
classes for available P, K, Ca and Mg. The Table shows general tendencies since fertilizer
response depends on soil chemical characteristics and the various crops under consideration.
The analytical data on the available nutrients are presented in Table 9.
Table 8: Available nutrient classification
Nutrient Deficiency level Adequate level Excessive or reactionary levelPhosphorus mg/kg Less than 20 20-80 greater than 80
Potassium cmol(+)/kg Less than 0.2 0.2-1.5 greater than 1.5
Calcium cmol(+)/kg Less than 2.0 2.0-15.0 greater than 15
Magnesium cmol(+)/kg Less than 1.0 1.0-3.0 greater than 3.0
92
Table 9: Available nutrients (0-20 cm)Mapping U nit P B r U vd L’V r l U F r U V r 2 H V P H U P P U 1 Y U d B X C
Apart from soils of mapping unit BXC that are moderately alkaline, the soils o f the other
mapping units are moderately acid to near neutral. Except soil mapping units Uvd and HUP
- where organic carbon is in moderate amounts, the other units have registered low amounts.
Na. K, Ca, Mg and Mn are adequate to excessive in all the soil mapping units.
Mapping unit PU1 and PBr are deficient in P while the other mapping units show adequate to
excessive levels o f the nutrient. According to Sanchez (1976), highly weathered Oxisols,
Ultisols and slightly weathered Andepts and Vertisols have a common problem of phosphorus
deficiency. This is due to fixation and immobilization of phosphorus by aluminium oxides, iron
oxides, calcium and magnesium ions when present in large quantities. Given that the soils in
the survey area are highly weathered, it is strange that they contain adequate to excessive93
amounts of phosphorus. Even with the high levels of phosphorus, these soils are
characteristically low in the portion utilizable for crop growth. This condition is aggravated by
unfavourable environmental conditions such as low soil moisture and high temperatures when
crops are heading and ripening.
The project area has recorded less than 0.2% N and hence there is a deficiency o f total
nitrogen. Nitrogen occurs in soils as organic compounds, nitrate and nitrite anions and
ammonium ions (Tisdale et al., 1985). Nitrates are the main forms of N used by plants.
Mineralization of organic N compounds takes place through aminization, ammonification and
nitrification. These processes are influenced by soil and climatic conditions (M atson and
Vitousek, 1981). Therefore, the amount of nitrogen that will be mineralized depends a lot on
the soil mineral and chemical properties. The low levels o f N in these soils could be attributed
to both the soil and climatic conditions. Application of nitrogenous fertilizers to these soils is
recommended.
It can be concluded that these soils have got adequate to excessive levels of Na, K, Ca, Mg and
Mn. Mapping units PU1 and PBr are deficient in P while the other mapping units have sufficient
supplies of the nutrient. Level of %N is low in all the soils.
94
Total nutrient reserve
For optimum growth of most agricultural crops, the total as well as the proportion o f nutrients
play a major role. The proportions of Ca, K and Mg in relation to one another is important in that
over-supply of one may hinder the uptake of the other resulting in deficiency although the element
exist in adequate amounts in the soil (Medina and Cuevas, 1989). For proper growth the optimum
ratios of Ca:K and Ca:Mg are 10:1 and 4-2:1, respectively (Landon, 1984). The following key
(Braun and Van de Weg, 1977) was used in the appraisal o f the total nutrient reserve.
Nutrient reserve P (mg/kg) K (cm ol(+)/kg) Mg (cmol(-(-)/kg)
Low <250 < 5 < 1 0
Moderate 250-500 5-25 10-40
high >500 > 2 5 > 4 0
Soil samples from a selected few soil profiles were analyzed for total nutrient reserve o f P, K and
Mg and the results are presented in Table 10.
Table 10: Total nutrient reserve o f selected soil profilesSoil mapping
unitClassification Profile No. Tota nu trien t reserve
P K M gPU1 Haplic Lixisols 173/2-6 44 3.2 2.8
UVrl Rhodic Ferralsols 173/1-3 120 2 15
PBr Eutric Cambisols 174/1-1 210 2 33
BXC Eutric Vertisols 174/1-7 65 3 135
YUd Humic Cambisols 173/2-5 650 14 180
95
In Table 10, except for soil mapping unit Yud that has high levels o f total P, the other units
ret:stered low amounts of the nutrient. Similarly, total K content is low in the same units
except YUd where it is moderate. Soil mapping units BXC and YUd are high in total Mg, unit
PBrhas moderate amounts and units PUI and U V rl registered low amounts o f the nutrient.
The group of soils with the lowest nutrient reserve are the Haplic Lixisols and Rhodic
Ferralsols of mapping units PUI and UVrl (Table 10). The second group of soils are the
Eutric Cambisols and Eutric Vertisols o f mapping units PBr and BXC. This group has low
nutrient reserve of P and K but moderate to high reserves of Mg. The last group o f soils are
the Humic Cambisols of unit YUd. This group has high amounts o f P, K and Mg.
The total nutrient reserve correlates in general with the pattern discussed on available nutrients
both for individual elements as well as for the general fertility status. In terms o f fertility,
mapping unit PUI has the poorest soils while unit YUd has the richest soils. The other soil
mapping units have moderately fertile soils.
96
CHAPTER FIVE: SUMMARY AND CONCLUSIONS
The physical, morphological, chemical and mineralogical properties of the soils in the study
area can be summarized as follows:
Physical
The Rhodic Ferralsols have a somewhat limited available water holding capacity because of
low silt content. The Vertic Luvisols retain more available moisture relative to their high
silt+clay % due to the high silt content in these soils. The Humic Cambisols have a relatively
less favourable water retaining capacity. The Cambisols have a higher porosity and lower bulk
density than the Ferralsols and the Luvisols. The Leptosols have silty clay loam textures while
the Acrisols tend to be sandy clay. The texture o f Ferralsols vary from clay loams to sandy
clays while the Lixisols have silty loam to sandy clay texture. The Cambisols have texture that
varies from clay loam to sandy clays. The Vertisols and Luvisols have clay texture.
Morphological
The Ferralsols and Lixisols have sub-angular blocky topsoil structures with porous massive
subsoil that break into angular blocks. The other soils have in general subangular blocky
structures in the topsoil and angular blocks in the subsoil. Most o f the soils have dark reddish
brown topsoils and dark red subsoils. The Vertisols are very dark brown. Soil horizon
boundaries tend to be gradual and wavy.
97
Chemical
The carbon contents range from very low to moderate (0.31-1.63% ). There is an increase of
carbon contents down the topo-sequences, a fact conditioned by higher soil moisture in the
louer slope positions or accretion by downslope translocation. Most of the project area has
adequate (20-80 mg/kg) to excessive (80 mg/kg) levels o f P while most soils have adequate
(0.2-1.5 cmol(+)/kg) amounts of K. The soils recorded adequate (2.0-15 cmol( + )/kg) to
excessive (> 15 cm ol(+)/kg) levels of calcium. Magnesium levels are also adequate (1.0-3.0
cmol(+)/kg) to excessive ( > 3 .0 cm ol(+)/kg). The CECs are generally high (mean 25.2
cmol(+)/kg soil) and the base saturation is high except in a few cases when values below 50%
were obtained.
Mineralogical
The soils are rich in iron (Fe3+), aluminium, titinium, silica but low in manganese. The high
amount o f Fe3+ is due to the presence o f iron oxide (magnetite). High amount of silica (S i02)
in the soils is due to the predominance of feldspars and quartz. The pyroxenes weathered
resulting in cations o f Fe2+, M g2+ and Ca2+. The high levels of T i0 2 in the soils resulted from
weathering of rutile. Augites and amphiboles were detected in three rock samples and are
probably responsible for the high amounts of A120 3 in the soils. The organic bound iron oxides
constitute a negligible proportion of the total iron oxides in the soils and the amorphous iron
oxides are generally low as compared to the total iron oxides. Low values o f organic bound
iron oxides may be attributed to low organic carbon contents. The prolonged high temperatures
98
and low organic matter in the study area are responsible for the low values o f amorphous iron
oiides. The sand mineralogy analysis shows two things: (i) the presence of quartz, orthoclase,
biotite and hornblende are indications of the Basement system rocks (ii) the volcanic
assemblage is characterized by calc-feldspars and alterites.
Genesis and classification
Parent material, topography and climate have influenced soil formation in the area. Most soils
have been classified as Ferralsols according to the FAO/UNESCO (1994) classification and
Oxisols according to Soil Survey Staff (1992). Other soils include Vertisols, Cambisols,
Leptosols, Acrisols, Luvisols and Lixisols. Vertisols are found in the bottomlands whereas
Cambisols are found on the piedmont plains and volcanic plains. Leptosols are found on hills
and Acrisols on footslopes. Luvisols are found on uplands and on volcanic plains. Lixisols are
found on erosional plains. Four genetical groups, separated according to parent material,
relief, climatic conditions and soil characteristics are identified in the area.
The first group consists of the Leptosols. This group has higher clay contents in the topsoil
than the subsoil. Found on hills, soil formation o f these soils is slow and as a result, they are
poorly developed. The second group consists of Acrisols, Luvisols and Lixisols. The group has
higher clay content in the Bt-horizon when compared to the other groups. Found on flat to
slopping land, the soils are strongly weathered. The third group consists o f Ferralsols and
Cambisols. The group has an irregular distribution of clay in the profile. The soils are found
on level to undulating land. The last group consists of Vertisols that are found in bottomlands.
99
Hr group is separated from the rest because o f its physical characteristics and the relatively
high sodium contents.
100
REFERENCESAbreu, M.M. and M. Robert, 1985. Characterisation of maghemite in B-horizon of
three soils from Southern Portugal. Geoderma 36:97-108.
2. Allen. B.L. and B.F. Hajek, 1989. Mineral occurrence in soil environments. In: J.B.
Dixon and S.B. Weed (eds). Minerals in soil environment. Soil Science Society of
America. Wisconsin.
3. Allen. B.L. and D.S. Fanning, 1983. Composition and soil genesis. In L.P. W ilding et. a i , (eds). Pedogenesis and Soil Taxonomy. IIA: Concepts and Interactions. Elselvier,
Amsterdam.
4. Amundson, R. and H. Jenny, 1991. The place of humans in the state factor theory of
ecosystems and their soils. Soil Sci. 151:99-109.
5. Anderson. J.M . and J.S .I. Ingram, 1993. Tropical Soil Biology and Fertility. A
textbook of methods. CAB International, Wallingford, U.K.
6. Aniku, J.R .F, and M .J. Singer, 1990. Pedogenic iron oxide trends in a marine terrace
chronosequence. Soil Sci. Soc. Am. J. 54:147-152.
Arnold R.W ., 1991. Soil geography and factor functionality: Interacting concepts. In:
R. Amudson et al., (eds,.). Factors o f Soil formation: A fiftieth anniversary
110. Woodhead, T ., 1968. Studies of potential vaporization in Kenya. Ministry o f Natural
Resources, Nairobi.
111. Yaalon, D.H., 1975. Conceptual models in Pedogenesis. Can soil forming functions be
solved ? Geoderma 14:189-205.
112
APPENDIX 1: DESCRIPTION AND CLASSIFICATION OF THE REPRESENTATIVE SOIL PROFII F ITI S WITH ANALYTICAL DATA Mapping Unit HYPTotal area Parent materialReliefVegetation and land use Soils generalColourTextureStructureConsistenceChemical properties
1853.02 haVarious volcanic rocks, which are predominantly olivine basalts in the form of boulders, breccia and agglomerates.Small rounded singular hills with convex to straight slopes of >16%.Bushed grassland/grazing.Somewhat excessively drained, shallow, bouldery and gravelly soils with a weakly developed horizon differentiation.The colour is dark reddish brown (5YR 3/4) throughout.Gravelly clay loam, with stones and gravel increasing with depth.Weak, medium, sub-angular blocky throughout.Slightly hard when dry, friable when moist, slightly sticky and slightly plastic when wet throughout the profile.The organic carbon (OC) in the A-horizon is 1.25%. The pH-H20 is 6.3 in the top soil and 6.5 in the subsoil respectively.Electrical conductivity (EC) is between 0.29 and 0.34 dS/m in the topsoil and subsoil respectively. The cation exchange capacity (CEC) of top soil is 21.12 cmol(+)/kg soil while that of the B-horizon is 18.36 cmol( + )/kg soil. Calcium (Ca) is 12.20 cmol( + )/kg in the top soil and 9.4 cmol(+)/kg B horizon. Magnesium (Mg) ranges between 4.32 cmol(+)/kg in the topsoil to 6.2 cmol( + )/kg in the sub-soil. Potassium (K) is 0.39 cmol( + )/kg throughout the profile. Sodium (Na) is 0.30 cmol(+)/kg in the topsoil and 0.1 cmol( + )/kg in the B-horizon. Base saturation (BS) is between 81% and 88% in the profile.
113
R ep resen ta tive profile pit No. 174/1-9
H o r iz o n D e p th(c m )
B o u n d a 7 C o lo u r( M o is t)
S t ru c tu r e T e x tu re%
T e x tu r a lc la s s
E x c h a n g e a b le b a s e s ( c m o l( + ) /k g ) C E C( c m o l ( + ) / k g ) p H 7 .0
% C %B S
P H -K cl
S u s p e n s io n R e m a rk s
W id th T o p S a n d S ilt C la y C a M g K N a p H -H jO
Total area 322.74 haParent material Basement system rocks: gneisses poor in ferro-magnesian minerals, predominantly quartz-r
Relieffeldspar and granitoid gneisses. £. Variable and irregular slopes, in general over 16%
. . , ST ^ m . " V * —Vegetation and land use Soils general
Wooded dense bushland and gcassland/semi-nomadic and sedentary grazing. Somewhat excessively drained, shallow to deep, rocky and stony.
Colour Colours range from dark yellowish brown (7.5YR 3/6) to dark reddish brown (5YR 3/2).Texture Gravelly sandy clay loam.Structure Weak, medium, sub-angular blocky throughout. VConsistence Slightly hard when dry and friable to firm when moist, slightly sticky and slightly plastic when
wet.Chemical properties Organic carbon is 1.13% in the profile. pH-H20 and EC are 6.31 and 0.31 dS/m respectively.
CEC is 17.60 cm ol(+)/kg soil in the top soil and 16.0 cm ol(+)/kg in the subsoil. Ca and Mg are about 7.0 cm ol(+)/kg and 3.0 cm ol(+)/kg respectively in the profile. K and Na are 0.96 cm ol(+)/kg and 0.57 cm ol(+)/kg respectively. Base saturation is 67% in the topsoil and 75% in the subsoil.
115
R epresen tative profile pit No. 173/2-3
H o r iz o n D e p th(c m )
B o u n d a ry C o lo u r( M o is t)
S t r u c tu r e T e x tu r e%
T e x tu r a l c la s s
E x c h a n g e a b le b a s e s ( c m o l( + ) /k g )
C E C (c m o l( + ) /k g ) p H 7 .0
* C %
B Sp l l - K c l S u s p e n s io n Remarks
W id th T o p S a n d S ill C la y C a M g K N a p H -h 2o
E C( d S /m )
A 0 -1 4 A A 7 Y R /3 /2
d . r . b
S b 13 5 7 3 0 S iC L 7 .1 1 3 .1 7 0 .9 6 0 .5 7 1 7 .6 0 1 .1 3 6 7 5 .5 6 .3 1 0 .3 2
C 1 4 -6 6 S b 3 3 3 8 2 7 C L 7 .3 0 3 .2 4 0 .8 4 0 .6 1 1 6 .0 0 1 .0 2 7 5 5 .6 6 .4 0 0 .3 5
a = abruptw = wavyd.r.b = dark reddish brown sb = sub-angular blockyTop = Topography
Mtipping unit KllrTotal area 5 2 2 .4 9 haParent m aterial Colluvium derived from various gneisses, predominantly quartz-feldspar gneisses and in places
gneisses rich in ferro-magnesian minerals (biotite and hornblende-biotite gneisses).Relief Uniform, slightly concave to straight slopes ranging from 4 to 16%.Vegetation and land use Bushed grassland/rainfed fallow cultivation and semi-nomadic grazing.Soils general Well drained, very deep, strongly weathered soils.Colour Topsoil is dark reddish brown (5YR 2.5/2) and the subsoil is dark red (2.5YR 3/6).Texture The top soil is sandy whereas the sub-soil is sandy clay.Structure Weak, medium sub-angular blocky structure in the topsoil and weak, angular blocky in the
subsoil.Consistence Slightly hard when dry, friable when moist and slightly sticky and non-plastic when wet.Chemical properties The pH-H20 decreases with depth from 5.3 in the top soil to 4.4 in the sub-soil. EC decreases with depth
from 0.06 dS/m in the topsoil to 0.03 dS/m in the sub-soil. The topsoil has 0.49 and the sub-soil has between 0.19 and 0.30% organic carbon. CEC of the topsoil is 9.80 cmol( + )/kg soil while that of the subsoil is between 7.40 and 10.80 cmol( + )/kg soil. Ca in the topsoil ranges between 0.09 and 1.47 cmol(+)/kg soil. Mg increases with depth from 0.67 cmol(+)/kg soil in the topsoil to 2.36 cmol( + )/kg soil. K decreases with depth from 0.84 cmol(+)/kg soil in topsoil to 0.08 cmol( + )/kg soil in the subsoil. Na decreases with depth from 0.32 cmol(+)/kg soil in the topsoil to 0.07 cmol( + )/kg soil in the sub-soil. Base saturation is less than 50% in all horizons.
117
K cpre.sfiitativc profile pit No. 173/2-4
H orizon D epth(cm )
B oundary C olou r(M oist)
S tructure T ex tu re%
T exturalclass
E xchangeable bases (cm ol( + )/kg) C E C(crnoK + ) / kg) pH 7 .0
% C %BS
pH -K cl Suspension R em arks
W idth T op Sand Sill C lay C a Mg K Na pH-H,0 EC(dS /m )
Vegetation and land useSoils generalColourTextureStructure
Consistence Chemical properties
75070.10 haPleistocene volcanics, mainly olivine balsalts in the form of agglomerates and breccias.Uplands with smooth, slightly concave and convex slopes surrounding the hills of unit HVP. Slope percentage ranges from 3-7 %.Wooded bushed grassland/semi-nomadic grazing.Well drained, very deep soils that surround the hills.Topsoil is dark reddish brown (2.5YR 3/4) and the sub-soil is dark red (2.5YR 3/6).Clay throughout the profile.Weak, medium sub-angular blocky structure in the topsoil and porous massive to weak, very fine, angular blocky in the subsoil.Slightly hard when dry, friable when moist, sticky and plastic when wet.The topsoil has organic carbon content of between 0.36 and 0.42%. The topsoil has a pH-H20 range of 5.97 to 6.37 while that of the subsoil ranges from 6.10 to 7.08. The EC of the topsoil ranges from 0.17 to 0.19 dS/m while that of the subsoil ranges from 0.10 to 0.17 dS/m. CEC of the topsoil ranges between 12.0 and 18.71 cmol( + )/kg soil while that of the sub-soil ranges between 12.52 to 18.70 cmol(+)/kg soil. Ca increases with depth from 3.9 cmol(+)/kg in the topsoil to 12.3 cmol(+)/kg in the subsoil. Mg ranges between 2.66 cmol(+)/kg to 3.70 cmol(+)/kg in the topsoil to 3.01 cmol(+)/kg in the B-horizons. K decreases with depth from 1.45 cmol( + )/kg in the top soil to 0.79 cmol( + )/kg in the subsoil. Na ranges between 0.60 to 0.65 cmol(+)/kg in the topsoil while the subsoil has a range of 0.55 to 0.60 cmol( + )/kg. The base saturation ranges from 67% in the topsoil to 98% in the subsoil.
119
K cpresentu tivc pro file pit No. 174/1-3
H o r i z o n D e p th( c m )
B o u n d a r y C o lo u r( M o is t)
S t ru c tu re
T e x tu r e%
T e x tu r a l c l a s s
E x c h a n g e a b le b a s e s ( c m o l( + ) /k g )
C E C (c m o l( + ) /k g ) p H 7 .0
% C %B S
p l lK c l
S u s p e n s io n R e m a rk *
W id th T o p S a n d S ilt C la y C a M g K N a p l l -H jO
E C( d S /m )
A 0 -2 4 g w 2 .5 Y R /3 /4d . r . b
s b 4 2 3 6 2 2 L 3 .9 0 2 .6 6 1 .4 5 0 .6 0 1 2 .0 0 .4 2 71 5 .5 5 .9 7 0 .1 9 F r e e i r o n o x id e s
A B 2 4 -4 5 g w 2 .5 Y R * d . r . b
s b 3 4 3 9 2 7 C L / L 6 .6 3 .7 1 .3 8 0 .8 5 1 8 .7 1 0 .3 6 6 7 5 .4 6 .3 7 0 .1 7
M a p p in g U n i t U V r2Total area 197.34 haParent material Pleistocene volcanics, mainly olivine basalts in the form of agglomerates and breccias.Relief Slightly concave and convex slopes surrounding the hills of unit HVP. Slope percentages range
from 3-8%.Vegetation and land use Wooded bushed grassland/semi-nomadic grazing.Soils general Well drained, deep soils that are shallower and have a stony phase as compared to unit U V rl.Colour Dark reddish brown throughout the profile.Texture Silty clay throughout the profile.Structure Moderate, fme to medium sub-angular blocky structure in the topsoil and porous massive to
weak, very fine, angular blocky in the subsoil.Consistence Slightly hard when dry, friable when moist, slightly sticky and slightly plastic when wet.Chemical properties The top soil has organic carbon content of 0.48%. Topsoil pH-H20 is 5.8 while that of the subsoil ranges
from 6.4 to 6.5. The EC of the topsoil is 0.11 dS/m while that of the subsoil ranges from 0.06 to 0.09 dS/m. CEC of the topsoil is 13.20 cmol(+)/kg soil while that of the subsoil decreases from 12.60 cmol(+)/kg soil to 10.92 cmol( + )/kg soil. Ca is 3.31 cmol(-l-)/kg in the topsoil and decreases to 1.20 cmol(+)/kg soil in the B-horizon. Mg increases with depth from 2.24 cmol(+)/kg in the topsoil to 3.76 cmol( + )/kg in the subsoil. K decreases with depth from 1.52 cmol( + )/kg in the topsoil to 0.38 cmol( + )/kg in the B-horizon. Na decreases with depth from 0.82 cmol( + )/kg in the topsoil to 0.42 in the subsoil. Base saturation is between 52% and 60% throughout the profile.
121
R epresen ta tive profile pit No. 174/1-12
Horizon Depth(cm)
Boundary Colour(Moist)
Structure
Texture%
Textur al class
Exchangeable bases (cmol( + )/kg)
CEC (cmol( + )/kg) pH 7.0
%C %BS
pH-Kcl
Suspension Remarks
Width Top Sand Silt Clay Ca Mg K Na pH- EC
HjO (dS/m)
A 0-20 g w 2.5YR3/4 sb 4 22 74 c 3.31 2.24 1.52 0.82 13.20 0.48 60 5.3 5.77 0.11
d .r.b
Bui 20-47 g w 2.5YR3/4 pm-ab 28 52 20 SiL 2.11 3.14 1.04 0.52 11.60 0.39 59 5.7 6.42 0.08d .r.b
Bu2 47-79 g w 2.5YR3/4 pm-ab 26 56 18 SiL 2.21 2.80 1.04 0.72 12.60 0.37 54 5.8 6.47 0.06
d .r.b
Bu3 79-119 2.5YR3/4 Pm- 24 59 17 SiL 1.20 3.76 0.38 0.42 10.92 0.26 52 5.8 6.51 0.09d .r.b ab
g = gradual w = wavyab = angular blockyd.r.b = dark reddish brown d .r = dark red sb = sub-angular blockyTop = Topographypm = porous massive
Mapping unit UVdTotal area 37.84 haParent material Pleistocene volcanics, mainly olivine basalts in the form of agglomerates and breccias.Relief Undulating with slopes of 4-8%Vegetation and land use Wooded bushed grassland/semi nomadic grazing.Soils general Well drained, deep, bouldery and stony soils showing Vertic properties.Colour Dark brown (7.5YR 3/2) throughout.Texture Clay throughout with pieces of weathering rock in the lower part of the subsoil.Structure Moderately strong, medium sub-angular blocky structure throughout.Consistence Slightly hard when dry, friable when moist, sticky and plastic when wet.Chemical properties Organic carbon in the A-horizon is 0.86%. The pH-H20 increases with depth from 7.3 in the topsoil to 7.9
in the subsoil. EC of the topsoil is 0.57 dS/m while that of the subsoil ranges from 0.52 dS/m to 0.55 dS/m. CEC of the topsoil is 66.61 cmol(+)/kg soil and decreases in the subsoil to 65.52 cmol( + )/kg soil. Ca decreases with depth from 59 cmol(+)/kg in the topsoil to 46.8 cmol(+)/kg in the subsoil. Mg is low in the topsoil (1.04 cmol(+)/kg) while the subsoil has approximately 18.00 cmol(+)/kg. K decreases from topsoil with 1.10 cmol(+)/kg to 0.65 cmol(+)/kg in the subsoil. Na increases with depth from 0.55 cmol(+)/kg in the topsoil to 1.25 cmol( + )/kg in the subsoil. Base saturation is approximately 100% throughout the profile.
Mapping unit UFrT otal area Parent material Relief
Vegetation and land useSoils generalColourTextureStructure
Consistence Chemical properties
352.80 haGneisses rich in ferro-magnesian minerals: biotite and hornblende-biotite gneisses.Undulating to gently undulating uplands with rather uniform convex slopes ranging from 4-8% up to 500 m long.Bushed grassland/semi nomadic grazingWell drained, deep to very deep, strongly weathered friable soils.Dark reddish brown (2.5YR 3/4) throughout.Sandy clay throughoutWeak, medium, sub-angular blocky structure in the A-horizon and porous massive to weak, medium, angular blocky structure in B-horizon.Slightly hard when dry, friable when moist, sticky and plastic when wet.Organic carbon in the A horizon is 0.34%. The pH-H20 increases with depth from 5.75 in the topsoil to 6.72 in the subsoil. EC increases with depth from 0.09 dS/m in the topsoil to 0.26 dS/m in the subsoil. CEC increases with depth from 13.08 cmol(+)/kg soil in the topsoil to 16.45 cmol( + )/kg soil in the subsoil. Ca increases with depth from 8.1 cmol(+)/kg in the topsoil to approximately 10 cmol(+)/kg in the subsoil. Mg increases with depth from 2.96 cmol( + )/kg in the topsoil to 6.17 cmol(+)/kg in the subsoil. K decreases with depth from 1.08 cmol(+)/kg in the topsoil to 0.63 cmol(+)/kg in the subsoil. Na decreases with depth from 0.45 cmol( + )/kg in the topsoil to 0.20 cmol(+)/kg in the subsoil. Base saturation ranges from 92% to 103% in the profile.
125
R epresen ta tive p ro file p it N o. 174/1-5
H o r iz o n D e p th(c m )
B o u n d a ry C o lo u r( M o is t)
S t ru c tu rc
T e x tu r e*
T e x tu r a l c la s s
E x c h a n g e a b le b a s e s ( c m o l( + )/lcg )
C E C (c m o l( + ) /k g ) p H 7 .0
*c %B S
pH-Kcl S u s p e n s io n R e m a r k s
W id th T o p S a m i S ilt C la y C a M g K N a p H -H , 0
E C( d S /m )
A 0 -2 6 g w 2 .5 Y R 3 /2d . r . b
s b 5 5 9 3 6 S C g . l 2 .9 6 1 .0 8 0 .4 5 1 3 .0 8 0 .3 4 9 6 5 .5 IT s — 0 .0 9
B u i 2 6 -4 5 g w 2 .5 Y R 3 /4d . r . b
p m -a b 5 0 9 41 S C 1 0 .0 3 .8 3 0 .6 2 0 .2 5 1 5 .9 0 0 .3 6 9 2 5 .1 5 .8 3 0 .1 1
B u 2 5 5 - 1 2 0 g w 2 .5 Y R 3 /4d . r . b
p m -a b 4 7 7 4 6 S C 9 .7 2 4 .3 2 0 .3 5 0 .2 0 1 6 .4 5 0 .2 9 8 9 5 .8 6 .2 9 0 .1 3
B u 3 1 2 0 -1 4 5 2 .5 Y R 3 /4d . r . b
p m -a b 4 0 13 4 7 S C 8 .6 4 6 .1 7 0 .6 3 0 .5 5 1 5 .4 5 0 .2 5 103 5 .7 6 .7 2 0 .2 6
g = gradual w = wavyab = angular blockyd.r.b = dark reddish brown d .r = dark red sb = sub-angular blockyTop = Topography
Mapping unit YUdTotal 523.92 haParent material Colluvia and alluvia derived from various gneisses, mainly quartz-feldspar gneisses, which are poor in
ferro-magnesian minerals.Relief Very gently sloping area with slopes of less than 3% and upto 4 km long.Vegetation and land use Bushed grassland/semi-nomadic grazing and ranching.Soils general Well drained, very deep sandy clays.Colour The topsoil is very dark grey (5YR 3/1) while the subsoil is dark greyish brown (10YR 3/2).Texture Topsoils are in general of a much sandier texture than the subsoils, which are sandy clay loams or sandy
clays.Structure Moderate, medium to coarse sub-angular blocky structure throughout the profile.Consistence The A-horizon is slightly hard when dry, friable when moist, slightly sticky and slightly plastic when wet.
The B-horizon is hard when dry, friable when moist, slightly sticky and slightly plastic when wet.Chemical properties The topsoil has organic carbon content of 0.56%. pH-H20 of the topsoil is 4.66 while that of the subsoil
ranges from 4.60 to 4.90. The EC decreases with depth from 0.06 dS/m in the topsoil to 0.03 dS/m in the subsoil. CEC of the topsoil is 12.60 cmol( + )/kg soil and that of the subsoil ranges from 10.80 cmol(+)/kg soil to 22.18 cmol(+)/kg soil. Ca decreases with depth from 1.23 cmol(+)/kg in the topsoil to 0.46 cmol(+)/kg in the subsoil. Mg increases with depth from 1.58 cmol(+)/kg in the topsoil to 2.01 cmol( + )/kg in the subsoil. K decreases with depth from 0.30 cmol(+)/kg in the topsoil to 0.08 cmol(+)/kg in the subsoil. Na is 0.17 cmol( + )/kg in the topsoil and nil in the subsoil. The base saturation ranges from 23% to 28% in the profile.
127
Representative profile pit No. 173/2-5
H orizon Depth(cm )
Boundary C o lou r(M oist)
S truc tu re T ex tu re%
T ex turalclass
R xchangcable bases (cm ol( + )/kg) C E C(c m o l(+ )/kg)pH 7 .0
% C *BS
pH -K cl S uspension R em arks
W idth T op Sand Silt C lay C a M g K Na pH -H .O E C (dS /m )A 0-22 & w 5Y R 3/1
v .d .gsb 61 4 35 S C L /S C 1.23 1.58 0 .3 0 0 .1 7 12.60 0 .5 6 26 4 .0 4 .6 6 0 .0 6
M apping un it PU1Total area Parent material Relief
Vegetation and land use Soils general Colour
TextureStructure
Consistence
Chemical properties
938.87 haUndifferentiated gneisses, poor in ferro-magnesian mineralsFlat to very gently and gently undulating with uniform convex-concave slope of maximally 5% and about 2 km long.Wooded bushland/rainfed fallow cultivation and semi-nomadic grazing Well drained, very deep, weakly developed soils.Top soil is dark brown (7.SYR 4/4) to dark reddish brown (5YR 3/2). The subsoil is dark reddish brown (2.5YR 2/4) to yellowish and (7.5YR 4/4).The topsoil is sandy loam to sandy clay and there is always less clay than in the B-horizon.The A-horizon is weak, medium, sub-angular blocky to moderately coherent porous massive. The subsoil is moderately coherent porous massive to weak, medium and coarse, angular blocky. Slightly hard when dry, friable to firm when moist, and sticky and plastic when wet throughout the profile.Organic carbon in A-horizon is 0.74%. The pH-H20 increases with depth from 6.3 in the topsoil to 7.2 in the subsoil. EC in the topsoil is 0.05 dS/m and decreases to 0.04 dS/m in the subsoil. CEC increases with depth from 11.6 cmol( + )/kg soil in the topsoil to 15.2 cmol( + )/kg soil in the subsoil. Ca increases with depth from, 5.6 cmol(+)/kg in the topsoil in the topsoil to 8.6 cmol( + )/kg in the subsoil. Mg increases with depth from 2.3 cmol(+)/kg in the topsoil to 4.8 cmol(+)/kg in the subsoil. K decreases with depth from 1.4 cmol(+)/kg in the A-horizon to 0.3 cmol(+)/kg in the B-horizon. Na ranges from 0.1 cmol(+)/kg to 1.0 cmol( + )/kg in the profile. Base saturation ranges from 64% to 97% in the profile.
129
Representative profile pit No. 173/2-6
H orizon D epth(cm )
Boundary C o lour(M oist)
S truc tu re T ex ture%
T ex turalclass
E xchangeab le bases (cm ol( + ) /k g )
C E C( c m o l(+ ) /kS>pH 7 .0
% C %BS
pH -K cl Suspension R em arks
W idth T op Sand Silt C lay C a m 8 K Na pH -H .O E C (dS /m )A 0-20 8 w 7 .5 Y R 4/4
d .bsb-ab 61 12 27 S C L 5 .6 2 .3 1.4 0.1 11.6 0 .7 4 81 5 .5 6 .3 0 .0 5
M apping unit PU2Total area 2209.50 haParent material Undifferentiated gneisses, predominantly quartz-feldspar gneisses, poor in ferro-magnesian
minerals.Relief Gently undulating to undulating with convex-concave uniform slopes of upto 5% and 1 km long.Vegetation and land use Bushed grassland/semi-nomadic grazing.Soils general Well drained, deep to very deep clays with a weakly developed A-horizon.Colour The A-horizon is dark reddish brown (2.5YR 3/4) while the subsoil is dark red (2.5YR 3/6).Texture Clay throughout the profileStructure The topsoil has weak, medium sub-angular blocky to moderately porous massive. The subsoil is
moderately coherent porous massive to very weak, medium to coarse angular blocky.Consistence Slightly hard when dry, friable when moist, sticky and plastic when wet throughout the profile.Chemical properties Organic carbon in the A-horizon is 0.57%. The pH-H20 is 5.32 in the topsoil and increases with depth to
5.86 in the subsoil. EC decreases with depth from 0.07 dS/m in the topsoil to 0.03 dS/m in the B-horizon. CEC is approximately 12 cmol( + )/kg soil in the profile. Ca is 3.53 cmol( + )/kg in the A-horizon and ranges between 1.66 cmol(+)/kg to 2.27 cmol(+)/kg in the B-horizon. Mg is 1.91 cmol(+)/kg in the subsoil. K decreases with depth from 1.20 cmol(+)/kg to 0.62 cmol(+)/kg in the subsoil. Na also decreases with depth from 0.67 cmol(+)/kg in the topsoil to 0.42 in the subsoil. Base saturation is between 39% and 62% in the profile.
131
Representative profile pit No. 173/2-2
H orizon D epth(cm )
Boundary C olour(M oist)
S truc tu re T ex tu re%
T ex turalclass
E xchangeab le bases (cm ol( + )/kg) C E C(c m o l(+ )/k g ) pH 7 .0
M ap p in g un it P R rTotal area Parent material ReliefVegetation and land use Soils general Colour
TextureStructure
Consistence Chemical properties
4803.95 ha Olivine basalts.Nearly flat.Grassland/Ranching and fallow cultivationWell drained, very deep well developed soils that cover the flat plains.Dark reddish brown (5YR 3/4) topsoil that changes to dark red (2.5YR 3/6) deep down the profile.Clay loam throughout the profile.Moderate, medium, sub-angular blocky in the A-horizon. The subsoil has weak, medium to coarse, angular blocky structure.Slightly hard when dry, friable when moist, sticky and plastic when wet throughout the profile. Organic carbon decreases with depth from 0.59% in the A-horizon to 0.22% in the subsoil. EC decreases with depth from 0.16 dS/m in the topsoil to 0.09 dS/m in the subsoil. CEC of topsoil is 20.57 cm ol(+)/kg soil while that of the subsoil ranges from 15.20 to 18.93 cm ol(+)/kg soil. Ca decreases with depth from 10.70 cm ol(+)/kg in the topsoil to 8.63 cmol( + )/kg in the subsoil. Mg is 2.05 cm ol(+)/kg in the topsoil and varies from 1.89 cm ol(+)/kg to 2.74 cm ol(+)/kg in the subsoil. K decreases with depth from 1.96 cm ol(+)/kg in the A-horizon to 0.22 cm ol(+)/kg in the B-horizon. Na decreases with depth from 0.80 cm ol(+)/kg in the topsoil to 0.20 cm ol(+)/kg in the subsoil. Base saturation ranges from 71 % to 81 % in the profile.
133
R epresen ta tive pro file pit No. 174/1-1
H orizon Depth(cm )
B oundary C olou r(M oist)
S truc tu re T ex tu re%
T exturalclass
E xchangeab le bases (cm o l(+ ) /ltg ) C E C(cm o l(+ ) /k g ) pH 7 .0
% C %BS
pH -Kcl
Suspension R em ark*
W idth T o P Sand Silt C lay C a Mg K Na pH -H .O E C (dS /m )A pl 0-10 ( w 5Y R 3/4
48.15 haM apping unit PBdTotal area 48.15 haParent material Olivine basalts.Relief Nearly flat.Vegetation and land use Grassland/semi nomadic grazingSoils general Well drained deep, calcareous clays showing Vertic propertiesColour Black (2.5YR 2/0) throughout the profile.Texture Clay throughout the profile.Structure Weak, medium, sub-angular blocky in the topsoil and moderate, medium to coarse sub-angular
blocky in the subsoil.Consistence Friable, sticky and plastic throughout the profile.Chemical properties Organic carbon is 1.37% in the topsoil and decreases to 0.69% in the subsoil. pH-H20 increases
with depth from 6.5 in A-horizon to 8.0 in the lower B-horizon. EC increases with depth from 0.34 dS/m in the topsoil to 0.52 dS/m in the subsoil. CEC increases with depth from 46.59 cm ol(+)/kg soil to 61.15 cm ol(+)/kg soil in the subsoil. Ca increases with depth from 16.8 cm ol(+)/kg in the topsoil to 62.55 cmol( + )/kg in the subsoil. Mg increases with depth from 3.01 cm ol(+)/kg in the topsoil to 17.15 cmol( + )/kg in the subsoil. K is 0.79 cm ol(+)/kg in the topsoil and varies between 4.20 cmol(-l-)/kg to 4.40 cm ol(+)/kg in the subsoil. Na increases with depth from 0.60 cmol(-t-)/kg in the topsoil to approximately 2.0 cm ol(+)/kg in the subsoil. Base saturation is 46% in the topsoil and it is over 100% in the subsoil throughout the profile.
135
Representative profile pit No. 174/1-4
H orizon Depth(cm )
B oundary C o lour(M oisi)
S truciurc T ex tu re%
T ex turalclass
E xchangeab le bases (c m o l(+ )/k g ) C E C(c m o l(+ ) / kg) pH 7 .0
% C %BS
pH -K cl Suspension R em arks
W idth T op Sand Silt C lay C a M g K Na pH -H jO E C (dS /m )
g = gradualw = wavyab = angular blockyd.r.b = dark reddish brownd .r = dark redsb = sub-angular blockyTop = TopographyBl = BlackSoil classification FAO/UNESCO (1994) : Vertic Luvisols
Soil Survey S taff (1992) : V ertic H aplustalfs
5892.49 haM apping unii BXCTotal area Parent material ReliefVegetation and land use Soils general
ColourTextureStructure
Consistence Chemical properties
Alluvial and colluvial clay deposits, mainly derived from volcanic rocks and ashes.Flat to very gently undulating with slopes of less than 2%.Grassland/semi-nomadic grazingComplex of imperfectly drained, very deep, cracking clays of varying calcareousness, salinity and sodicity.Very dark brown (10YR 3/3) throughout the profile.Clay throughout the profile.Moderate to strong, medium, angular blocky in the topsoil and strong, medium to coarse, angular blocky in the subsoil.Very hard when dry, firm when moist, sticky and plastic when wet throughout the profile.Organic carbon is approximately 0.72% in the profile. pH-H20 increases with depth from 7.6 in the topsoil to 8.4 in the subsoil. EC of the topsoil is 0.67 dS/m while that of the subsoil is 0.87 dS/m. CEC is approximately 64 cm ol(+)/kg soil in the profile. Ca is 47 cmol( + )/kg in the topsoil and ranges between 43 cm ol(+)/kg soil to 48 cm ol(+)/kg soil in the subsoil. Mg increases with depth from 17.8 cm ol(+)/kg in the topsoil to 23.0 cm ol(+)/kg in the subsoil. K is 0.2 cm ol(+)/kg in the profile. Na increases with depth from 1.8 cm ol(+)/kg in the topsoil to 3.9 cm ol(+)/kg in the subsoil. Base saturation is more than 100% throughout the profile.
137
R epresen ta tive p ro file p it N o. 174/1-7H orizon D epth
(cm )
B ouiklat) C olou r(M oisi)
S truc tu re T ex tu re%
T ex tu ra lclass
E xchangeab le bases (cm ol( + )/kg)
C E C(c m o l(+ ) / kg) pH 7 .0
%c %BS
pH-K CL
Suspension R ental ks
W idth T op Sand Sill C lay C a M g K Na pH -H jO E C
(dS /m )
A 0-24 g w 10Y R 3/3
v .d .b
C r 36 17 47 C 47 17.8 0 .2 0 1.8 64 0 .7 2 104 4 .7 7 .6 0 0 .6 7 Slickcnsidcs


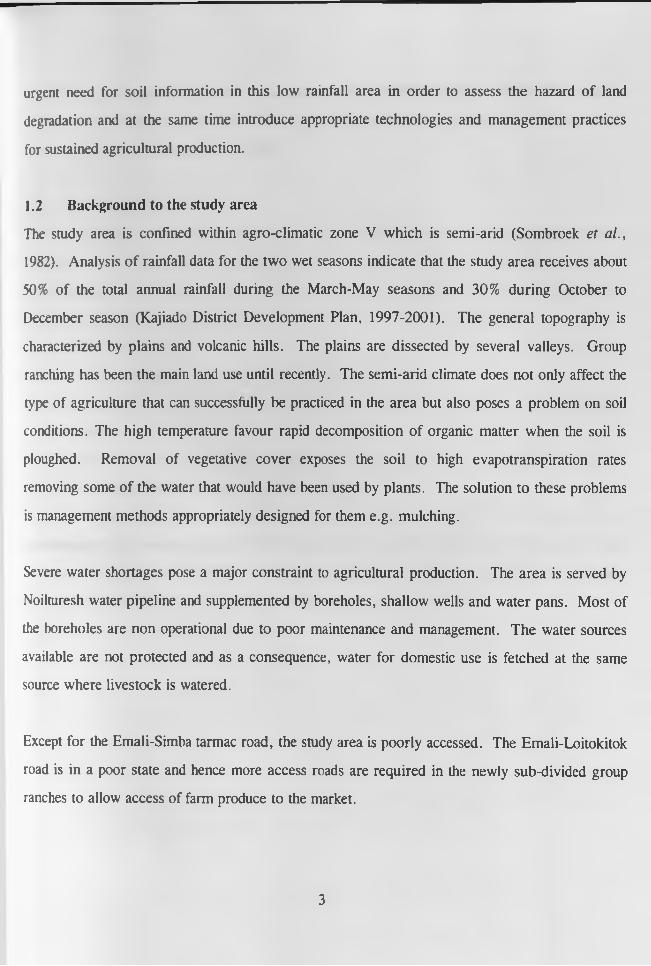
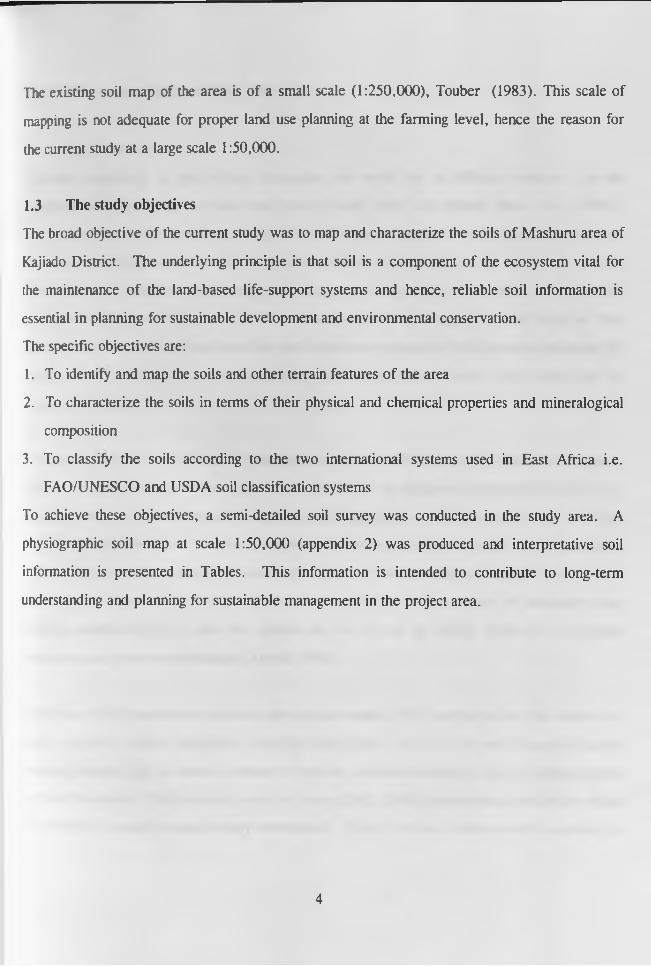


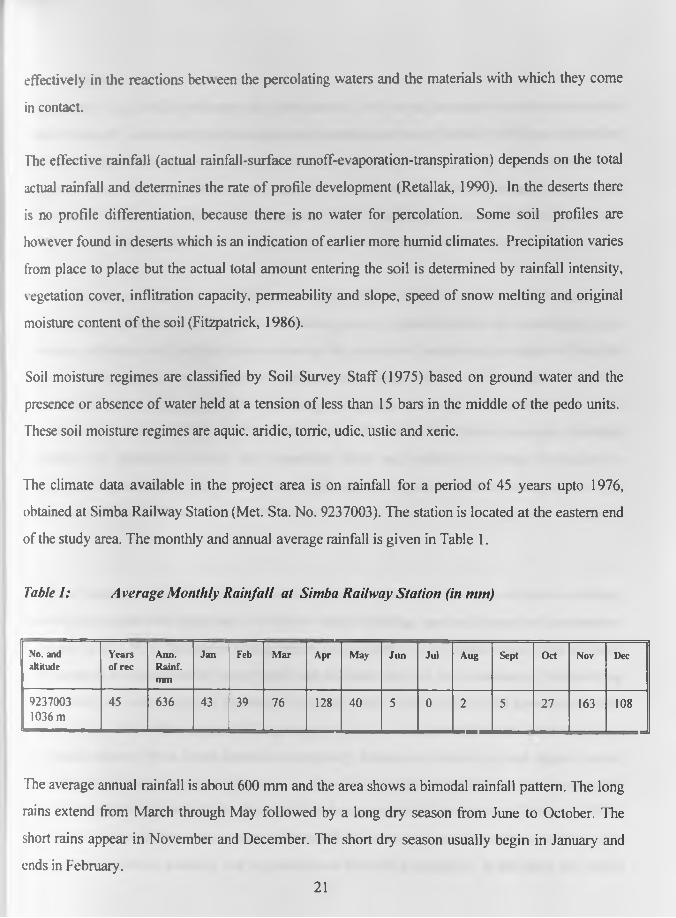


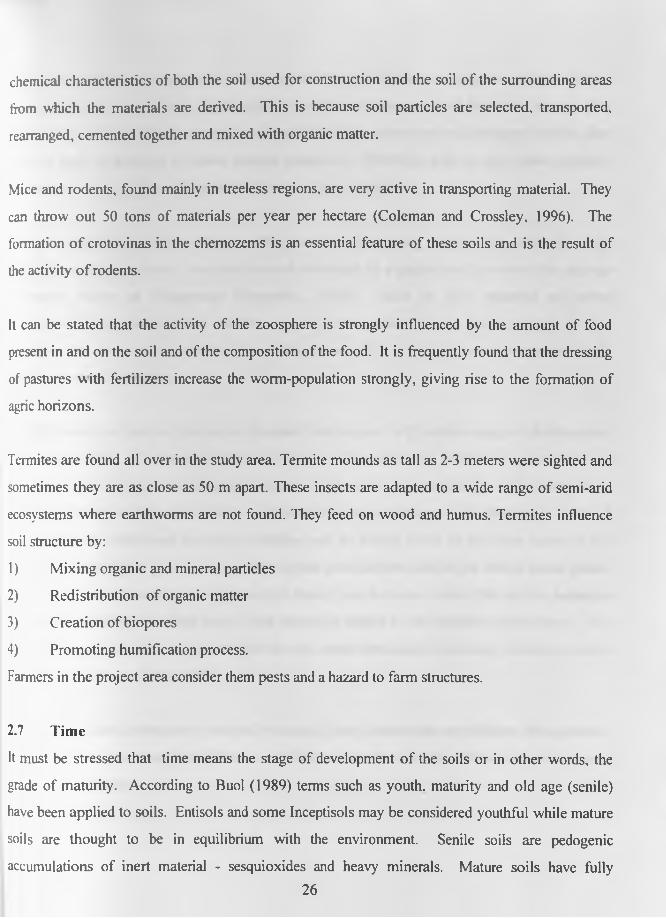


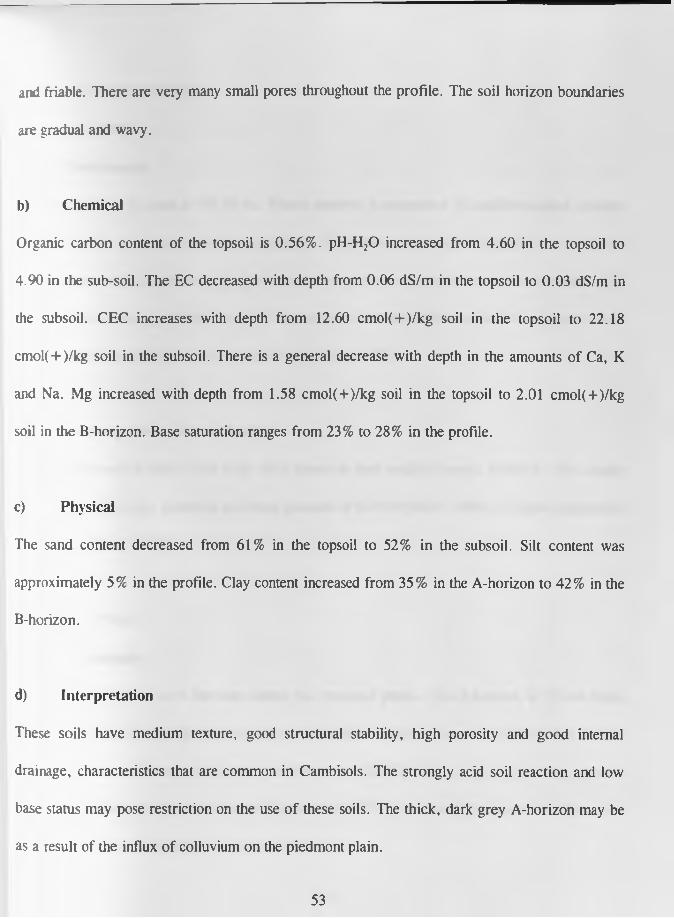


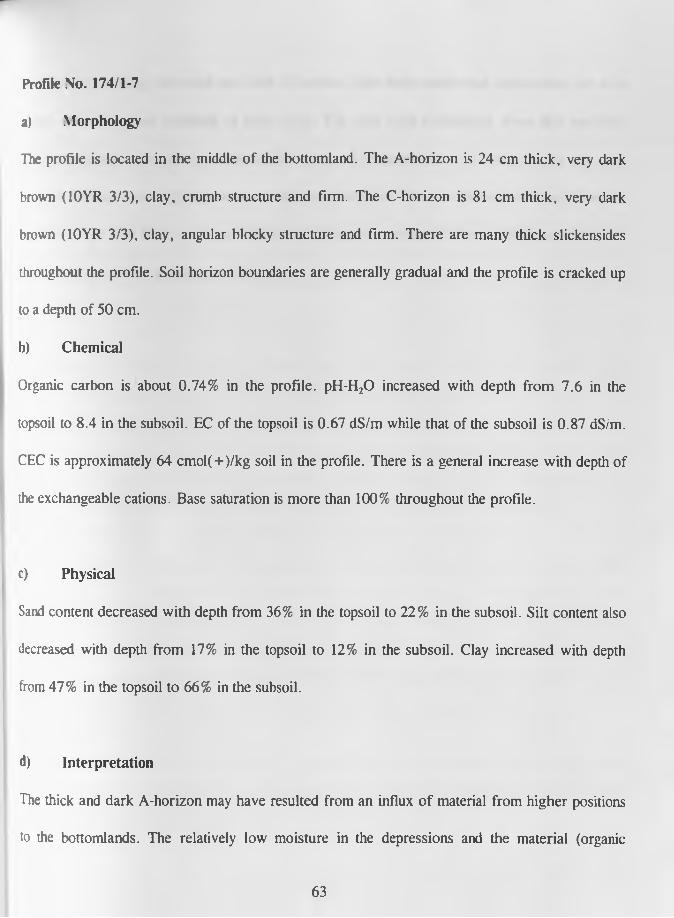


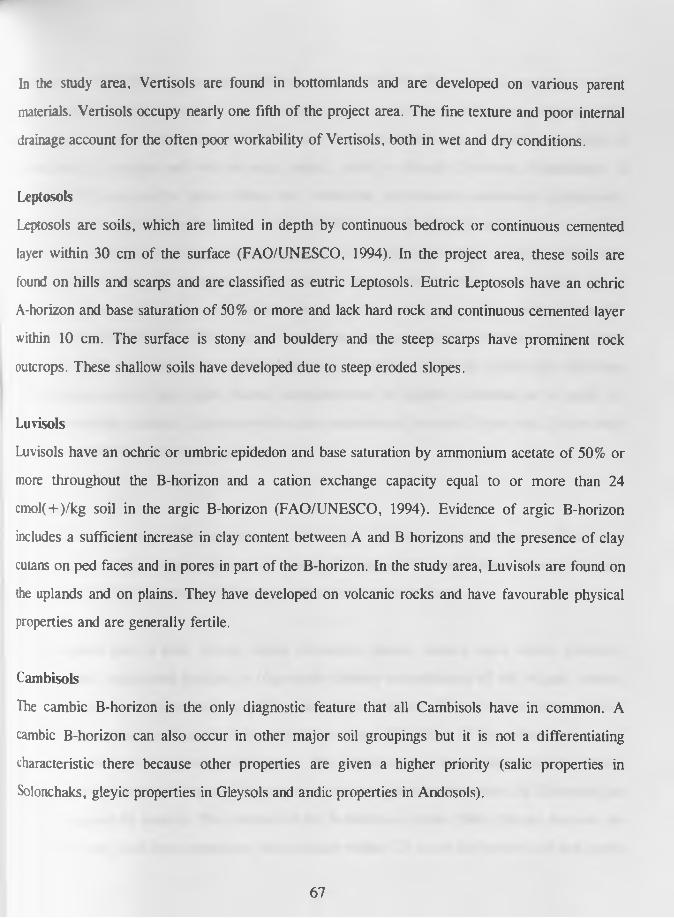


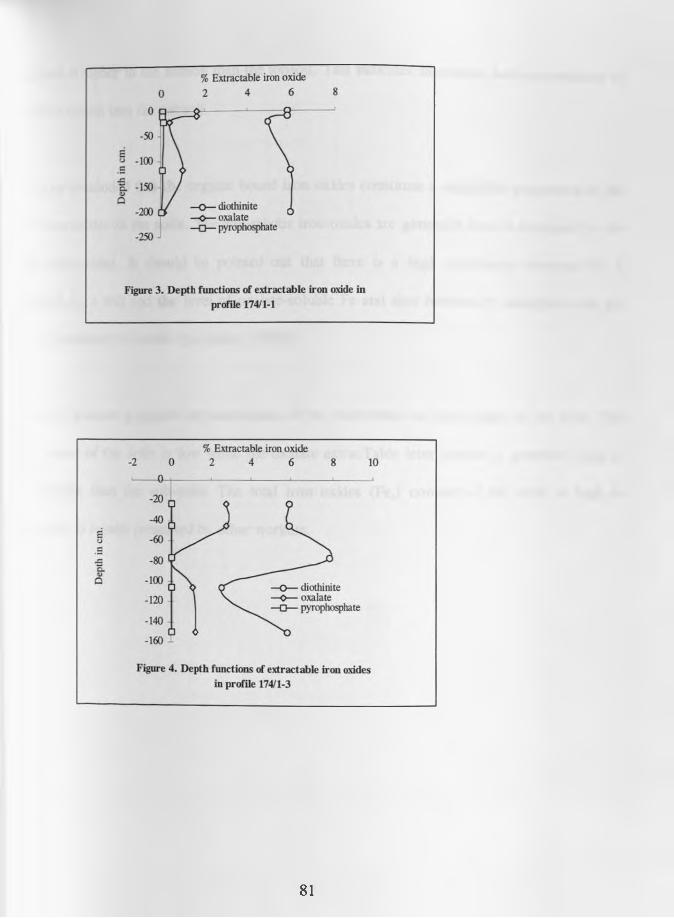


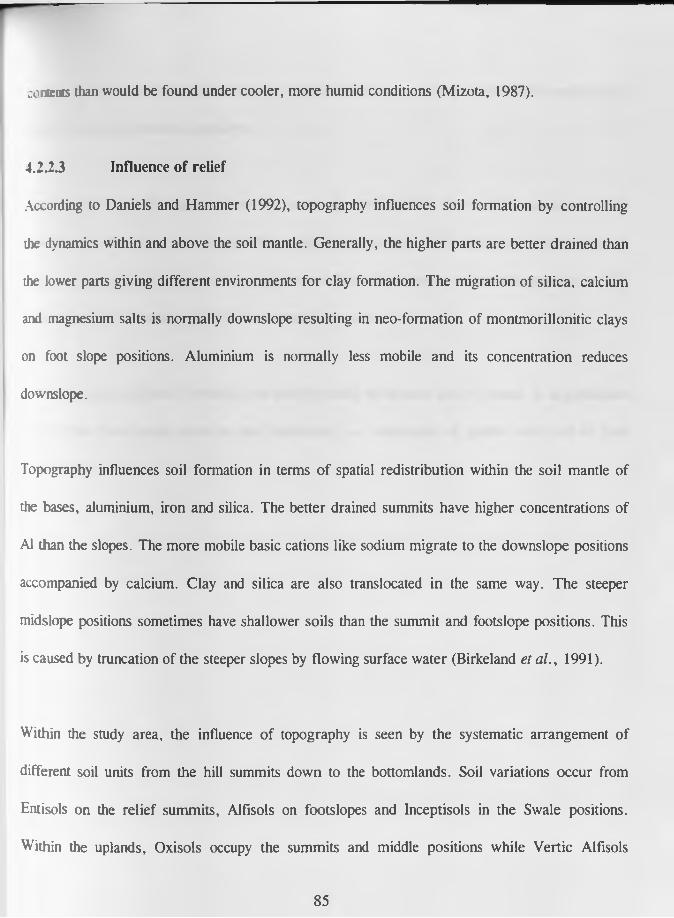


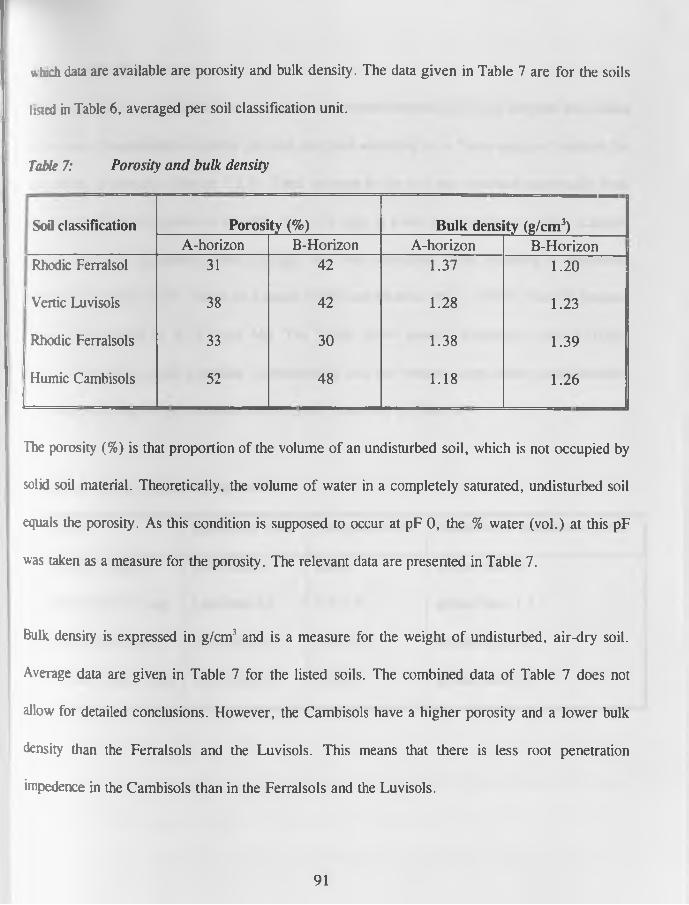
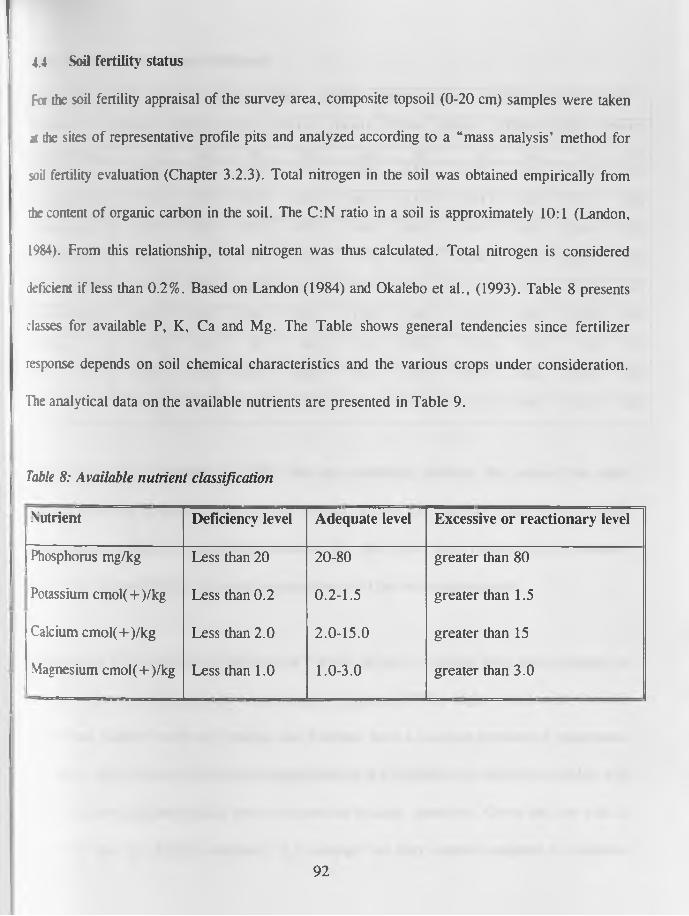
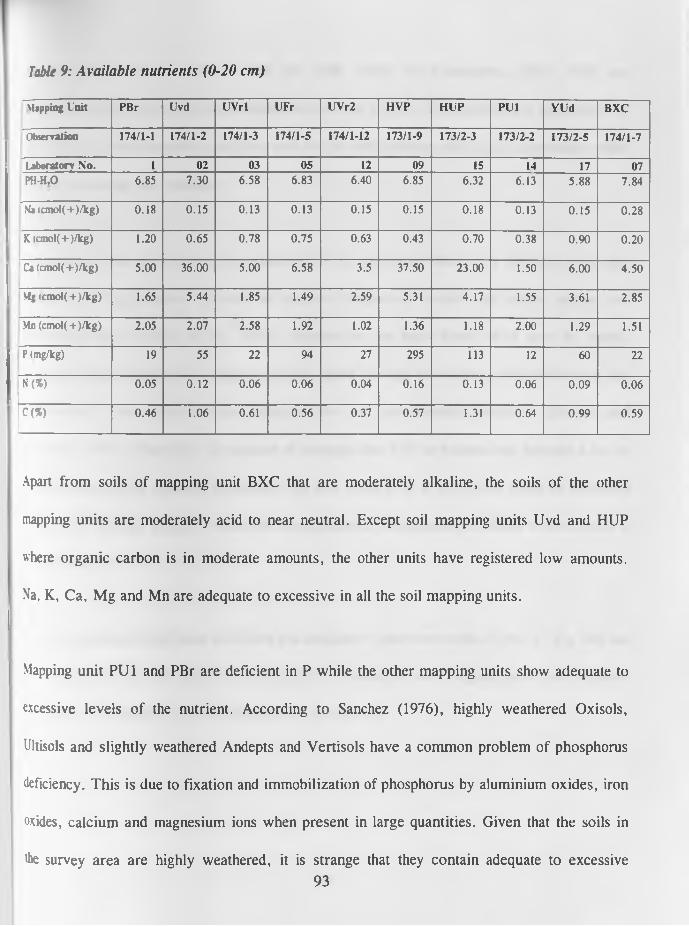


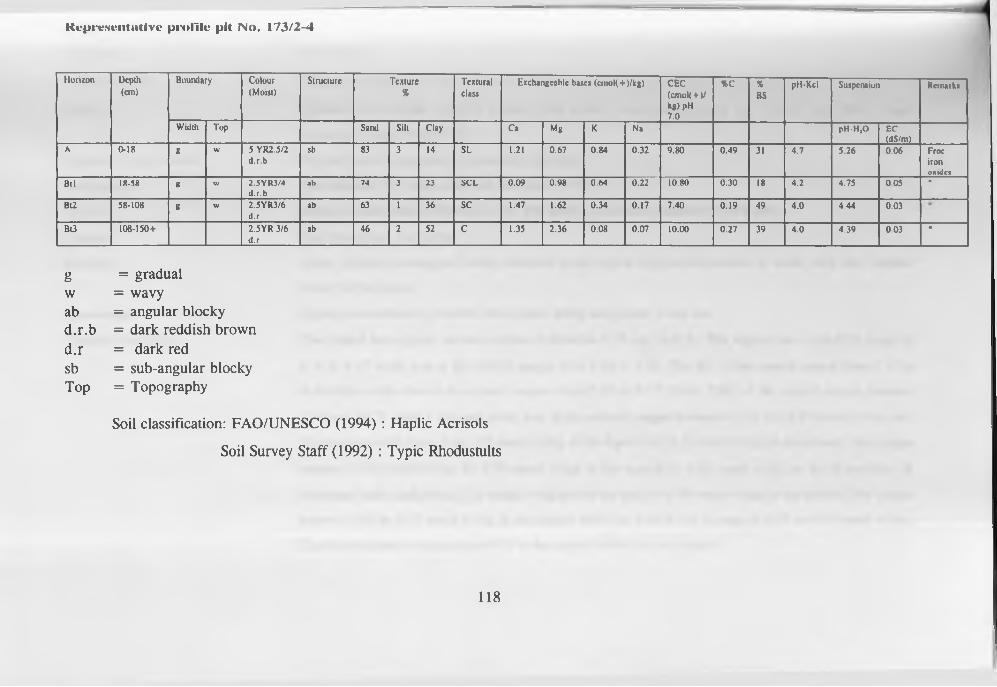


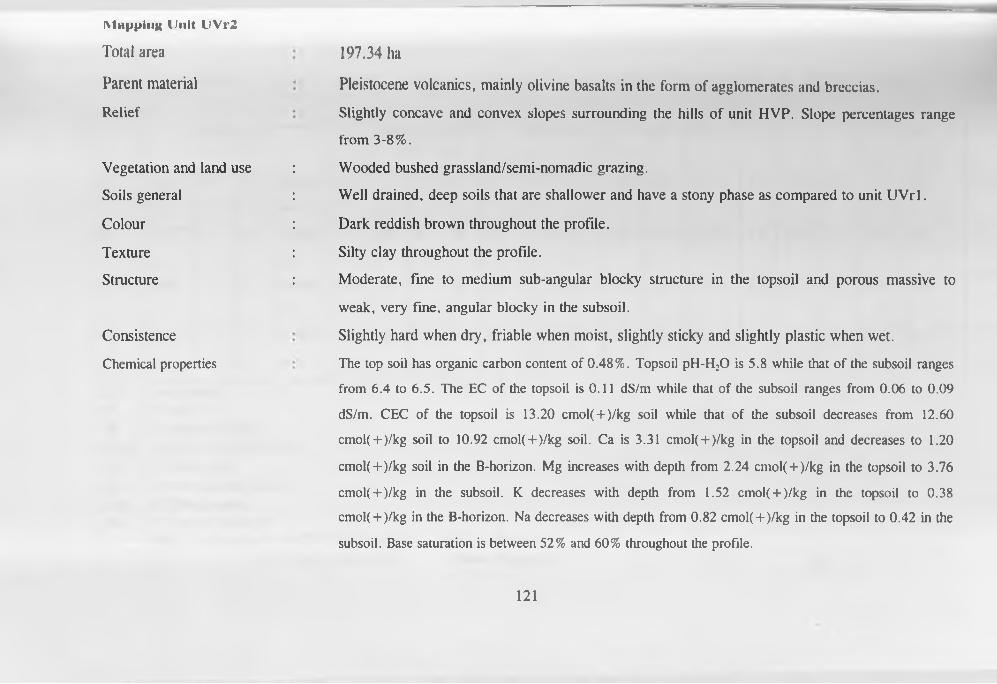
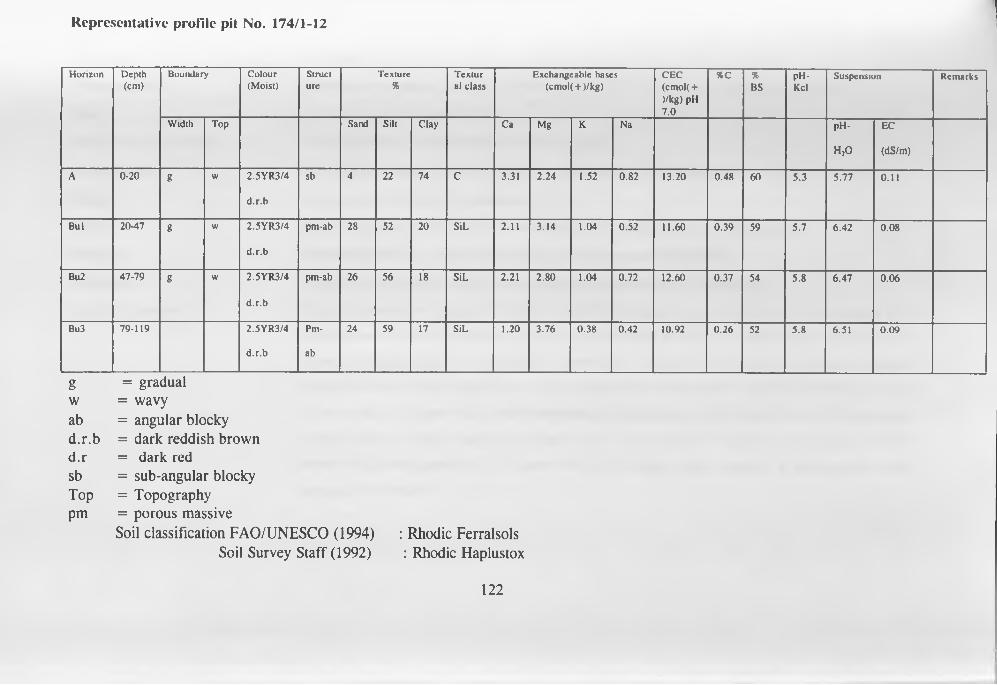


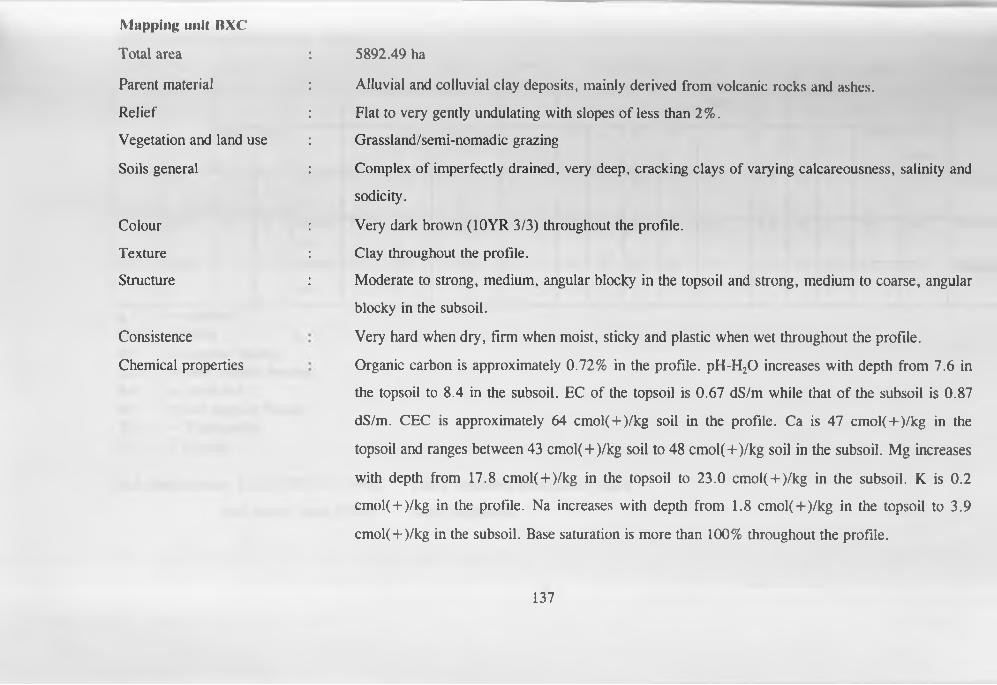


![11.[6 16]characterization of soils at angacha district in southern ethiopia](https://static.documents.pub/doc/80x56/557d21bed8b42a3d3d8b53a7/116-16characterization-of-soils-at-angacha-district-in-southern-ethiopia.jpg)


