International Journal of Computer Science & Information Technology (IJCSIT), Vol 3, No 1, Feb 2011DOI : 10.5121/ijcsit.2011.3114 Characterization of tumor region using SOM and Neuro Fuzzy techniques in Digital Mammography Anamika Ahirwar1 , R.S. Jadon2 1 Department of Computer Application, Madhav Institute of Technology & Science,GwaliorE-mail: [email protected]2 Department of Computer Application, Madhav Institute of Technology & Science,GwaliorE-mail: [email protected]om Abstract Nowadays the most common type of cancer in women is breast cancer. This is the second main cause ofcancer deaths in women. Digital mammography is the technique which is used to examine the breast. This is very much useful for the detection of breast diseases in women. The automatic detection of tumoror some type of deformity in the medical imaging is done by many researchers to develop some algorithms and methods. In this paper we are using SOM and Fuzzy c-means clustering techniques fortumor detection in digital mammography images. We then further calculate the statistical features oftumor like location of tumor, area, energy, entropy, idm, mean, contrast, mean and standard deviation which helps the radiologist to study the statistical information regarding breast cancer, so that the doctors can give better treatment to patients. For calculating these statistical properties we use region growing and region merging techniques. Keywords Gray level cooccurrence matrix (GLCM), Best Matching Unit (BMU), epoch number, idm (inverse difference moment), micro-calcifications. 1. Introduction Breast cancer has been one of the major causes of death among women since the last decades. This disease became a commonest cancer among women. If the cancer can be detected early, the options of treatment and the chances of total recovery will increase. Several efforts have been devoted to the improvement of breast cancer detection in the population. For example, via screening campaigns, breast self-examination orientation, clinical examinations, etc. The results of several years of research indicate that mammography is the main test used for screening and early diagnosis of breast cancer [23]. Small clusters of micro-calcifications [5,7,11,12] appearing as collection of white spots on mammograms show an early warning of breast cancer. A mammogram is 85-90 percent accurate. Therefore, 10-15 percent of cancers cannot be seen by mammogram. Some women are anxious about the consequences of radiation from a mammogram. Nowadays, the amount of radiation received is less for a mammogram than a chest X-ray. If in the early stage the cancer is detected, the death rate can be reduced. Radiologist takes the mammogram readings, so that the mammographers visually examine the
Transcript
8/7/2019 Characterization of Tumor Region Using SOM and Neuro Fuzzy Techniques in Digital Mammography
AbstractNowadays the most common type of cancer in women is breast cancer. This is the second main cause of cancer deaths in women. Digital mammography is the technique which is used to examine the breast.This is very much useful for the detection of breast diseases in women. The automatic detection of tumor or some type of deformity in the medical imaging is done by many researchers to develop somealgorithms and methods. In this paper we are using SOM and Fuzzy c-means clustering techniques for tumor detection in digital mammography images. We then further calculate the statistical features of tumor like location of tumor, area, energy, entropy, idm, mean, contrast, mean and standard deviationwhich helps the radiologist to study the statistical information regarding breast cancer, so that thedoctors can give better treatment to patients. For calculating these statistical properties we use regiongrowing and region merging techniques.
Keywords
Gray level cooccurrence matrix (GLCM), Best Matching Unit (BMU), epoch number, idm (inversedifference moment), micro-calcifications.
1. IntroductionBreast cancer has been one of the major causes of death among women since the last decades.This disease became a commonest cancer among women. If the cancer can be detected early,the options of treatment and the chances of total recovery will increase. Several efforts havebeen devoted to the improvement of breast cancer detection in the population. For example, viascreening campaigns, breast self-examination orientation, clinical examinations, etc. The resultsof several years of research indicate that mammography is the main test used for screening andearly diagnosis of breast cancer [23]. Small clusters of micro-calcifications [5,7,11,12]appearing as collection of white spots on mammograms show an early warning of breastcancer. A mammogram is 85-90 percent accurate. Therefore, 10-15 percent of cancers cannotbe seen by mammogram. Some women are anxious about the consequences of radiation from amammogram. Nowadays, the amount of radiation received is less for a mammogram than achest X-ray. If in the early stage the cancer is detected, the death rate can be reduced.Radiologist takes the mammogram readings, so that the mammographers visually examine the
8/7/2019 Characterization of Tumor Region Using SOM and Neuro Fuzzy Techniques in Digital Mammography
International Journal of Computer Science & Information Technology (IJCSIT), Vol 3, No 1, Feb 2011
200
presence of deformities. And these deformities can infer as cancerous changes. Due to humanerrors which are caused by visual fatigue, the manual readings may consequence misdiagnosis.Computer aided diagnosis techniques are bring into play to improve the diagnostic accuracyand efficacy of screening mammography. In this work, we propose a clustering based hybridtechnique combining the advantages of SOM (Self Organizing Map) and FCM (Fuzzy C-means), implemented for digital mammogram image segmentation process to detect variousproperties of image and tumor in digital mammography to find the deformity in the medicalimages. SOM or FCM separately as one of the tool for the image segmentation for tumoranalysis and finding the cancer in mammography images. SOM and FCM are the imageprocessing and image analysis algorithms. The benefit of using SOM is that it is very simple,very easy to understand and they work very well. As SOM classifies the data well and are easyto evaluate their own quality, so that we can calculate a good map and the strong similaritiesbetween the objects. Another technique which is used in this paper is fuzzy c-means. FCMalgorithm is one of the popular fuzzy clustering algorithms which are classified as constrainedsoft clustering algorithm. FCM algorithm based on the concept of fuzzy C partition, which wasintroduced by various researcher in this field Ruspini [25], developed by Dunn [26] andgeneralized by Bezdek [27]. A soft clustering algorithm finds a soft partition of a given data setby which an element in the data set may partially belong to multiple clusters. Besides, there is aconstriction on the function that the membership degree of a point in all the clusters adds up to1. The researchers in this field have used SOM or HSOM or FCM separately as one of the toolfor the image segmentation for the analysis of tumor.
2. Related work:The image segmentation is the separation of the image into regions of similar feature. In a largenumber of image processing applications the aim is to extract important features from theimage. By using this we can get the description, interpretation or understanding of the image.The segmentation of tumor from images is an important but time-consuming task performed bymedical experts. It is very difficult for doctors to see the image again and again, when there is
some type of doubt that whether the tumor is present or not in the image (like brain or breast).Several authors suggested various algorithms and methods for detecting tumor automatically inimage (Tobias Christian Cahoon et.al (2000); Maria-Luiza Antonie et. al (2001); S. SAHEBBASHA et. al (2005 – 2009); S. Murugavalli et. al (2007); Nahla Ibraheem Jabbar et. al(2008)).
Maria-Luiza Antonie et. al (2001) [13] presented two methods for tumor classificationin mammograms. One system exploited the use of neural networks using back-propagation andthe second one was built employing association rule mining with constraint form. Theysegment the image into regions and these regions of interest use single link region growingalgorithm. And the features of each region are used as the attributes of the image.
A new approach is presented by S.SAHEB BASHA et. al (2005 – 2009) [15] toidentify the existence of breast cancer mass in mammograms. The proposed work utilizes
morphological operators for segmentation and fuzzy c- means clustering for clear identificationof clusters. The morphological operations and FCM is a new approach, using this theysuccessfully detected the breast cancer masses in mammograms. The results indicate that thissystem can facilitate the doctor to detect breast cancer in the early stage of diagnosis process.The proposed technique shows better results.
Nahla Ibraheem Jabbar and Monica Mehrotra (2008) [10] used a fuzzy kohonen neuralnetwork for medical image segmentation. They analyses the tumor by extraction of the features
8/7/2019 Characterization of Tumor Region Using SOM and Neuro Fuzzy Techniques in Digital Mammography
International Journal of Computer Science & Information Technology (IJCSIT), Vol 3, No 1, Feb 2011
201
(area, entropy, means and standard deviation).These measurements gives a description for atumor.
S. Murugavalli et. al (2007) [21], implements a neuro-fuzzy segmentation process of the MRI data to detect various tissues like white matter, gray matter, csf and tumor. A neurofuzzy based segmentation process is used to detect brain tumor was implemented and theystudied the performance of the MRI image in terms of weight vector, execution time and tumorpixels detected and compared the results with the existing ones. A layer by layer abstractionlevel with fuzzy clustering technique was implemented to detect various tissues like whitematter, gray matter, csf and tumor. They achieved a higher value of detected tumor pixels thanany other segmentation techniques, also achieved the weight vector value for the neuro fuzzy is(6×6) with the additional input features. The weight vector value, the number of tumor cells andthe execution time will also be studied with different distance classifier technique. The changeof growth rate of the tumor of the same patient analyze may also be undertaken in this paper.
Tobias Christian Cahoon et.al (2000) [18] describe the use of segmentation with Fuzzymodels and classification by the crisp k-nearest neighbor algorithm for assisting breast cancerdetection in digital mammograms. Their research utilizes images from the DDSM. They showthe supervised and unsupervised methods of segmentation. When only intensity is used as thediscriminating features, the k-nn and fuzzy c-means methods will have high misclassificationrates in digital mammograms. Adding window means and standard deviations to the featurevisually improves segmentations produced by the k-nn rule. While their results areencouraging, other methods are needed to detect smaller pathologies such asmicrocalcifications.
Sameer Singh and Reem Al-Mansoori [1] find that the fuzzy enhancement methodscoupled with either gradient based or fuzzy segmentation techniques are very useful insketching tumor boundaries in non-dense breasts. Its main aim is to accurately determineregions of interest and to identify and classify tumors as benign or malign, they usedinformation on the textural, shape and spectral characteristics of mammograms.
T.J. Jose et. al (2009) [31] propose a new hybrid approach to content-based imageretrieval. In this method a two step approach is used. For clustering the images they use SOM
with respect to their basic characteristics in the first step. In the second step, the GA basedsearch will made on a subset of images which were having some basic characteristics of theinput query image. This approach was applied to a database of high resolution mammogramimages and shows that this method thoroughly improves the retrieval correctness over thesingle feature vector approach. The results show that the system using GA retrieval doubled thedoctors’ diagnostic accuracy. As compared to the single stage methods this method is faster andhas higher retrieval accuracy.
For MRI brain image segmentation Jianhua Xuan et. al (1995) [6] presents a method oncombining the region growing and edge detection methods. Starting with a simple regiongrowing algorithm which produces an over segmented image, they apply a sophisticated regionmerging method which is capable of handling complex image structures. Integrate edgeinformation to verify and to correct region boundaries. This method is reliable and efficient for
MR brain image segmentation.Luiza Antonie [14] developed a project that performs classification and segment the
tumor from the images. He had no extra information that could be very useful in detecting somepatterns in developing a certain disease. In this system, the images as well as some patientinformation are important. Overall, the system performed well, but there is still a lot toimprove.
Túlio César Soares dos Santos André et. al [16] develop a digitized mammograms’feature extraction approach using Kohonen’s Self-Organizing Maps (SOM). Once developed,
8/7/2019 Characterization of Tumor Region Using SOM and Neuro Fuzzy Techniques in Digital Mammography
International Journal of Computer Science & Information Technology (IJCSIT), Vol 3, No 1, Feb 2011
202
the SOM network will be used as the first processing stage in a breast cancer computer aideddiagnosis (CAD) system. Its role will be to offer segmented data as input to a second stagededicated to the diagnosis task, which will be implemented via a multi layer perceptron (MLP)trained by the backpropagation algorithm.
3. Self Organization MapProfessor Teuvo Kohonen developed the most popular neural network model, the Self Organizing Map (SOM). A self-organizing map (SOM) or self-organizing feature map (SOFM)is a type of artificial neural network that is trained using unsupervised learning to produce alow-dimensional (typically two-dimensional), discretized representation of the input space of the training samples, called a map. Self Organizing Map (SOM) [17] is a member of theCLNNs. When implementing vector quantization using neural network [28-30] this can be oneof the greatest choice. SOMs operate in two modes: training and mapping, Training is acompetitive process, also called vector quantization. Mapping automatically classifies a newinput vector. To extract information from complex medical images, segmentation is animportant process. Segmentation has wide application in medical field [19,20,22]. The main
purpose of the image segmentation is to divide the image into mutually exclusive and exhaustedregions. The partition of these regions is such that each region of interest is spatiallycontiguous and the pixels within the region are homogeneous with respect to a predefinedcriterion. The SOM [8,9] is a tool for statistical analysis and visualization, for the developmentof complex applications. Self organizing maps uses a neighbourhood function which aredifferent other than artificial neural networks, to preserve the topological properties of the inputspace. The arrangement of nodes is a hexagonal or rectangular grid. The mapping in self-organizing map is from higher to lower dimensional input space. To find the node with theclosest weight vector, first place a vector taken from data space and second to assign the mapcoordinates of the node to the vector. The training uses competitive learning. The Euclideandistance to all weight vectors are calculated when a training data is fed to the network. Theneurons with weight vectors which are most alike to the input are called as the best matching
unit. In the lattice of self organizing map the weights of the best matching unit and the neuronswhich are close to it are adjusted towards the input vector. From the best matching unit themagnitude of the change decreases with time and distance. The update formula for a neuronwith weight vector Wv(t) is
( ) ( ) ( ) ( ) ( ) ( )( )t Wvt Dt at vt Wvt Wv −Θ+=+ ,1 where α(t) is a monotonically decreasing learning coefficient and D(t) is the input vector. Theneighborhood function Θ (v, t) depends on the lattice distance, and this lattice distance isbetween the best matching unit and the neuron v. For all neurons which are close to the bestmatching unit is one and for others it is zero. The neighborhood function shrinks with time, inspite of the functional form. At the beginning, the self organizing map takes place on the wholescale when the neighborhood is big and the weights are congregated to local estimates, whenthe neighborhood shrunk to a couple of neurons. For each input vector the process is repeated.
The significance of self organizing map is mainly due to the similarity between the competitivelearning process, which is used in the method of SOM and vector quantization. In thesegmented image the main drawback of the self organizing map is that the number of neuralunits in the competitive layer needs to be equal to the desired number of regions. It is notpossible to determine a priory the correct number of regions M in the segmented image. This isthe main limitation of the conventional SOM for image segmentation.
8/7/2019 Characterization of Tumor Region Using SOM and Neuro Fuzzy Techniques in Digital Mammography
International Journal of Computer Science & Information Technology (IJCSIT), Vol 3, No 1, Feb 2011
203
4. Feature extractionThe purpose of feature extraction is to reduce the original data set by measuring certainproperties or features that distinguish one input pattern from another pattern. The extractedfeature gives the characteristics of the input by considering the description of the properties of
the image to the classifier into a feature space. In this work we calculate three textural featuresnamely contrast, energy and entropy based on the gray level co-occurrence matrices (GLCM).In spite of these we calculate some other features like mean, inverse difference moment andstandard deviation. Gray Level Cooccurrence Matrix (GLCM) features are used to distinguishbetween normal and abnormal image. Five co-occurrence matrices are constructed in fourspatial orientations horizontal, right diagonal, vertical and left diagonal (0°, 45°, 90°, and 135°).
GLCM {P (d,θ) (i,j)} represents the probability of occurrence of the pair levels(i,j) separated bya given distance d at angle θ . In this paper we are considering value of θ=0º and distance (d)=1.The commonly used unit pixel distances and the angles are 0º, 45º, 90º and 135º. A detailedalgorithm of calculation of GLCM {P (d,θ)( ,i j)} has been given in [2]. The features are calculatedusing the formulae given below.
Contrast:
∑∑= =
−=n
i
m
jc jipjiS
0 0
),()(
Entropy:
( ) ( ){ }∑=
−=n
ie jipjipS
0
,log,
Energy:
[ ][ ]jipSn
i
m
j
en ∑∑= =
=
0 0
2
Mean:
[ ] [ ]( )+×
= ∑∑= =
n
i
m
jm jijpjiip
nmS
0 0
,,1
Inverse Difference Moment:
[ ] [ ]∑∑= =
−=n
i
m
jidm jI jI pS
0 0
, i≠ j
Standard Deviation:
( )
−
−−= ∑∑
= =
n
i
m
jmd Sjip
nmS
0 0
2]][[)1)(1(
1
Each set of features are individually normalized to the range of 0 to 255. These features work well especially for mammograms.
8/7/2019 Characterization of Tumor Region Using SOM and Neuro Fuzzy Techniques in Digital Mammography
International Journal of Computer Science & Information Technology (IJCSIT), Vol 3, No 1, Feb 2011
204
5. Implementation of SOM and Fuzzy C-Means5.1. SOM Implementation:
A self organizing map is an unsupervised clustering property, consists of components callednodes or neurons. This clustering property classifies high dimensional data sets into clusters of similar features. Each node contains a corresponding weight vector of same dimension.
On every step of the learning process a random vector is chosen from the initial data setand then the best-matching (the most similar to it) neuron coefficient vector is identified. Selectthe winner which is most similar to the input vector [24]. The distance between the vectorsusually measured in the Euclidean metric and is given by
[ ]{ }iic W xW x −=− min
Where, x is the neuron, W C is the winning neuron vector and W i is the weight vector. Themodified weight vector coefficients can be calculated by ( ) ( ) ( ) ( ) ( ){ }t W t xt ht W t W ciii
−×+=+ 1 .Where t is the epoch number (discrete-time index), x(t) is the vector and is obtained byselecting a sample randomly for iteration t. The function h ci(t) is called neighborhoodfunction and it represents a non-increasing function of time and the distance between thewinning neuron and its neighbors on the grid. The function h ci(t) divides into of two parts, firstpart is the proper distance function and second is the learning rate function. And this can bedefined as ( ) ( ) ( )t ar r ht h ic
×−= where, r c is the position of winning neuron and the position
of its neighbor is r i. The result of neighborhood function h(t) is an initial cluster center(centroids) for fuzzy c means algorithms. Stepping through the algorithm
1.
Randomize the map's nodes' weight vectors.2.
Grab an input vector.
3.
Traverse each node in the map
i. Find similarity between the input vector and the weight vector, using Euclideandistance formula.
ii.
Track the node which shows the smallest distance (this node is called as bestmatching unit).
4.
Update the nodes in the neighborhood of BMU by pulling them closer to the inputvector.
where W i is current weight vector.
5.
Increment t and repeat from step 2 while t < λ , where t is current iteration and λ is limiton time iteration.
5.2. FCM Implementation:
Fuzzy c-means is a clustering method which allows to find cluster centers that minimizedissimilarity functions [3,4]. In order to accommodate the fuzzy partitioning technique, themembership matrix (U) is randomly initialized as:
( ) ( ) ( ) ( ) ( ){ }t W t xt ht W t W ciii−×+=+ 1
8/7/2019 Characterization of Tumor Region Using SOM and Neuro Fuzzy Techniques in Digital Mammography
International Journal of Computer Science & Information Technology (IJCSIT), Vol 3, No 1, Feb 2011
205
njU c
iij ,.......1,1
1
=∀=∑=
where i and j are the number of cluster and image data points respectively. The dissimilarityfunction can be computed as:
2
1 1121 ),.....,,( ij
c
i
n
j
mij
c
iic d uJ cccU J ∑∑∑
= ==
==
where u ij lies between 0 and 1. d ij is the Euclidian distance between ith centroid ( ci) and jth datapoint. The weighting exponent is m and its value is greater than one. The minimum of dissimilarity function can be computed as:
( )12
1
1−
=
∑
=mc
k kj
ijij d
d u
where, d ij = ||x i-cj||, dkj = ||x i-ck ||, xi is the i th of d-dimensional data, cj is the d-dimension centerof the cluster and ||*|| is any norm expressing the similarity between any measured data andcenter. This iteration will stop when Max ij{|u ij
(k+1)-uij(k)| } < ε, where ε is a termination criterion
between 0 and 1, whereas k are the iteration steps. Fuzzy c-means algorithm (FCM): Step1:
Initialize the membership matrix, U=[u ij].
Step 2:At k th number of iteration:Calculate the center vectors c i with u ij
∑∑==
×=n
j
mij
n
ii
miji uxuc
11
Step3:Update the membership matrix U for the k th steps and (k+1) th step.
( )( )12
1
1−
=
∑=mc
k kjijij d d u
where d ij = x j - ci
Steps4:
If ||U(k+1)-U(k)|| < ε then STOP; otherwise return to step2.
6. ResultThe result of the implementation of the neuro fuzzy region classification process is discussed inthis section. For analyzing medical images, execution time is one of the main constraints of anycomputer aided analysis. We calculate the number of tumor pixels which are affected by tumorcells in the medical image. In this paper we input fixed size and noiseless mammogram images(size=256x256) only. The images used are 256x256 gray level images with intensity valueranges from (0 to 255). In this paper we calculated the tumor properties like location, energy,
8/7/2019 Characterization of Tumor Region Using SOM and Neuro Fuzzy Techniques in Digital Mammography
International Journal of Computer Science & Information Technology (IJCSIT), Vol 3, No 1, Feb 2011
206
entropy, IDM, contrast, mean, standard deviation and image properties like type of the region,average gray value of region, area of that region, centroid of the region.
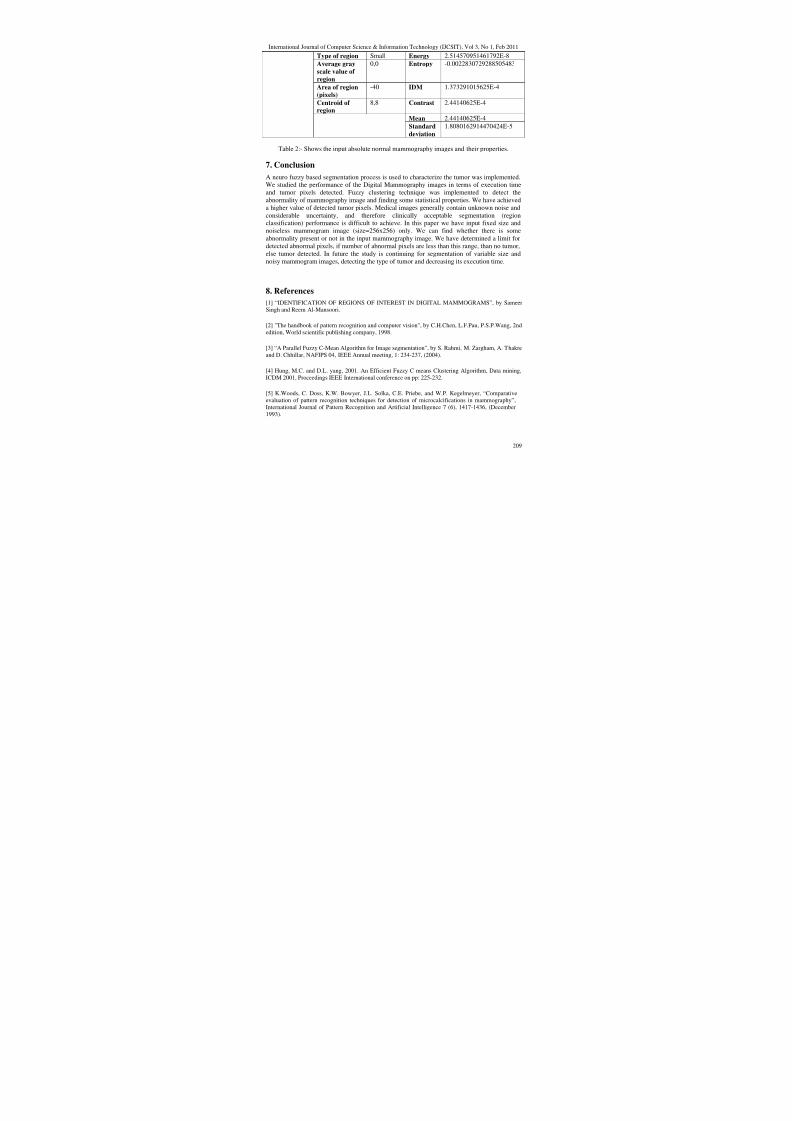
The execution time of this technique found to be 50 to 65 seconds and detected tumorpixels are approximately 588. Table-1 and Table-2 shows the input of abnormal and normalmammography image and their tumor properties respectively. Some screenshots of the GUI areshown below by extracting tumor and their properties of normal and abnormal mammographyimages.
Figure1: Snapshot of GUI of Abnormal Mammography Image and its properties.
Figure2: Snapshot of GUI of Abnormal Mammography Image and its properties.
8/7/2019 Characterization of Tumor Region Using SOM and Neuro Fuzzy Techniques in Digital Mammography
International Journal of Computer Science & Information Technology (IJCSIT), Vol 3, No 1, Feb 2011
209
Type of region Small Energy 2.514570951461792E-8Average grayscale value of region
0,0 Entropy -0.0022830729288505483
Area of region(pixels)
-40 IDM 1.373291015625E-4
Centroid of region
8,8 Contrast 2.44140625E-4
Mean 2.44140625E-4Standarddeviation
1.8080162914470424E-5
Table 2:- Shows the input absolute normal mammography images and their properties.
7. ConclusionA neuro fuzzy based segmentation process is used to characterize the tumor was implemented.
We studied the performance of the Digital Mammography images in terms of execution timeand tumor pixels detected. Fuzzy clustering technique was implemented to detect theabnormality of mammography image and finding some statistical properties. We have achieveda higher value of detected tumor pixels. Medical images generally contain unknown noise andconsiderable uncertainty, and therefore clinically acceptable segmentation (regionclassification) performance is difficult to achieve. In this paper we have input fixed size andnoiseless mammogram image (size=256x256) only. We can find whether there is someabnormality present or not in the input mammography image. We have determined a limit fordetected abnormal pixels, if number of abnormal pixels are less than this range, than no tumor,else tumor detected. In future the study is continuing for segmentation of variable size andnoisy mammogram images, detecting the type of tumor and decreasing its execution time.
8. References[1] “IDENTIFICATION OF REGIONS OF INTEREST IN DIGITAL MAMMOGRAMS”, by SameerSingh and Reem Al-Mansoori.
[2] "The handbook of pattern recognition and computer vision", by C.H.Chen, L.F.Pau, P.S.P.Wang, 2ndedition, World scientific publishing company, 1998.
[3] “A Parallel Fuzzy C-Mean Algorithm for Image segmentation”, by S. Rahmi, M. Zargham, A. Thakreand D. Chhillar, NAFIPS 04, IEEE Annual meeting, 1: 234-237, (2004).
[4] Hung, M.C. and D.L. yang, 2001. An Efficient Fuzzy C means Clustering Algorithm, Data mining,ICDM 2001, Proceedings IEEE International conference on pp: 225-232.
[5] K.Woods, C. Doss, K.W. Bowyer, J.L. Solka, C.E. Priebe, and W.P. Kegelmeyer, “Comparativeevaluation of pattern recognition techniques for detection of microcalcifications in mammography”,International Journal of Pattern Recognition and Artificial Intelligence 7 (6), 1417-1436, (December1993).
8/7/2019 Characterization of Tumor Region Using SOM and Neuro Fuzzy Techniques in Digital Mammography
International Journal of Computer Science & Information Technology (IJCSIT), Vol 3, No 1, Feb 2011
210
[6] Jianhua Xuan, Tiilay Adali, Yue Wang, “SEGMENTATION OF MAGNETIC RESONANCEBRAIN IMAGE: INTEGRATING REGION GROWING AND EDGE DETECTION”, IEEE 1995.
[7] T. M. Freer and M. J. Ulissey, “Screening mammography with computer-aided detection: prospectivestudy of 12,860 patients in a community breast center,” Radiology 220, pp. 781–786, 2001.
[8] Juha Vesanto and Esa Alhoniemi. Clustering of the Self-Organizing Map. IEEE Transactions onNeural Networks, 11(2):586–600, March 2000.
[9] “Distance matrix based clustering of the self organizing map”, by Juha Vesanto and Mika Sulkava.International Conference on Artificial Neural Networks-ICANN 2002, Madrid, Spain, August 28-30,pages 951–956.
[10] “Application of Fuzzy Neural Network for Image Tumor Description”, by Nahla Ibraheem Jabbar,and Monica Mehrotra, proceedings of world academy of science, engineering and technology volume 34october 2008 ISSN 2070-3740.
[11] G. Lemaur, K. Drouiche, J. DeConinck, “Highly regular wavelets for the detection of clusteredmicrocalcifications in mammograms”. IEEE Trans. Medi. Imag., 22: 393-401. DOI:10.1109/TMI.2003.809580.
[12] “A CAD System for the automatic detection of clustered Microcalcification in digitizedmammogram films”, by Yu Songyang, and Guan Ling, IEEE Trans. Med. Imag., 19: 115-126. DOI:10.1109/42.836371, 2000.
[13] “Application of Data Mining Techniques for Medical Image Classification”, by Maria-LuizaAntonie, Osmar R. Zaiane, Alexandru Coman, proceedings of the International Workshop on MultimediaData Mining (MDM/KDD’2001), in conjunction with ACM SIGKDD conference, San Grancisco, USA,August 26, 2001.
[14] Luiza Antonie, project on “Automated Segmentation and Classification of Brain MagneticResonance Imaging”.
[15] “AUTOMATIC DETECTION OF BREAST CANCER MASS IN MAMMOGRAMS USINGMORPHOLOGICAL OPERATORS AND FUZZY C –MEANS CLUSTERING”, by S.SAHEBBASHA, DR.K.SATYA PRASAD, Journal of Theoretical and Applied Information Technology, 2005 -2009 JATIT.
[17] Parra CA, Iftekharuddin K, Kozma R (2003), “Automated Brain Tumor segmentation and patternrecognition using ANN”, Computational Intelligence Robotics and Autonomous Systems.
[18] “Breast cancer detection using image processing techniques”, by Tobia Christian Cahoon, MelanieA. Sutton, James C. Bezdek, IEEE 2000.
[19] “Neural Network based segmentation of Magnetic Resonance Images of the Brain”, by J Alirezaie,ME Jernigan, C Nahmias, IEEE Trans. Nucl. Sci. 44(2): 194-198, 1997.
8/7/2019 Characterization of Tumor Region Using SOM and Neuro Fuzzy Techniques in Digital Mammography
International Journal of Computer Science & Information Technology (IJCSIT), Vol 3, No 1, Feb 2011
211
[20] “Survey, image segmentation techniques”, by Haralick RM, Shapiro LG, Computer Vision,Graphics Image Process 29: 100-132, 1985.
[21] “An Improved Implementation of Brain Tumor Detection Using Segmentation Based on NeuroFuzzy Technique”, by S. Murugavalli and V. Rajamani, Journal of Computer Science 3 (11): 841-846,
ISSN 1549-3636, (2007).
[22] “A review on image segmentation techniques”, by Pal NR and Pal SK, Pattern Recognition 26(9):1277-1294, 1993.
[23] A. S. Feing, Decreased cancer mortality through mammographic screening: results of clinical trials,Radiology, 167: 659-665 (1988).
[24] “A Hierarchical SOFM for analysis of not well separable Clusters of different Feature Density”, byS. Schunemann, and B. Michaelies, Symposium on ANN, Bruges (Belgium), pp: 21-23, ESANN’1999.
[25] Ruspini, E., 1970. Numerical methods for fuzzy clustering, Information Sciences, 2: 319-350.
[26] “A fuzzy relative of the ISODATA process and its use in detecting compact, well Separatedclusters”, by Dunn, J.C., Journal of Cybernetics, 3: 32-51, (1973).
[27] “Cluster validity with fuzzy sets”, by J.C. Bezdek, Cybernetics, 3: 58-73, 1974.
[28] “Self-Organization and Associative Memory”, by T. Kohonen, 2nd Edition (Springer-Verlag,Berlin, Germany), 1988.
[29] “Segmentation using neural networks for automatic thresholding”, by A. Scherf and G. Roberts. in:S. Rogers (ed.), Proc. SPlE Conference on “Applications of Artificial Neural Networks”, (Orlando, FL,1294), pp: 118-124, 1990.
[30] “Constraint satisfaction neural networks for image segmentation”, by Lin W., E. Tsao and C. Chen,In: T.Kohonen, K. Mkisara, 0. Simula and J. Kangas (eds.), Artificial Neural Networks (Elsevier SciencePublishers), pp: 1087-1090, (1991).
[31] “Neural Network and Genetic Algorithm Based Hybrid Model for content based mammogramimage retrieval”, by T.J. Jose and P.Mythili, Journal of applied sciences 9(19): 3531-3538, 2009, ISSN1812-5654.