Page 1
General rights Copyright and moral rights for the publications made accessible in the public portal are retained by the authors and/or other copyright owners and it is a condition of accessing publications that users recognise and abide by the legal requirements associated with these rights.
• Users may download and print one copy of any publication from the public portal for the purpose of private study or research. • You may not further distribute the material or use it for any profit-making activity or commercial gain • You may freely distribute the URL identifying the publication in the public portal
If you believe that this document breaches copyright please contact us providing details, and we will remove access to the work immediately and investigate your claim.
Downloaded from orbit.dtu.dk on: May 28, 2018
Characterization of Vanadium Flow Battery
Bindner, Henrik W.; Krog Ekman, Claus; Gehrke, Oliver; Isleifsson, Fridrik Rafn
Publication date:2010
Document VersionPublisher's PDF, also known as Version of record
Link back to DTU Orbit
Citation (APA):Bindner, H. W., Krog Ekman, C., Gehrke, O., & Isleifsson, F. R. (2010). Characterization of Vanadium FlowBattery. Roskilde: Danmarks Tekniske Universitet, Risø Nationallaboratoriet for Bæredygtig Energi. (Denmark.Forskningscenter Risoe. Risoe-R; No. 1753(EN)).
Page 2
Ris
ø-R
-Re
po
rt
Characterization of Vanadium Flow Battery
Henrik Bindner, Claus Ekman, Oliver Gehrke, Fridrik Isleifsson
Risø-R-1753(EN)
October 2010
Page 3
Author: Henrik Bindner, Claus Ekman, Oliver Gehrke, Fridrik
Isleifsson Title: Characterization of Vanadium Flow Battery Division: IES
Risø-R-1753(EN)
October 2010
Abstract (max. 2000 char.): This report summarizes the work done at
Risø-DTU testing a vanadium flow battery as part of the project
“Characterisation of Vanadium Batteries” (ForskEl project 6555)
with the partners PA Energy A/S and OI Electric A/S under the
Danish PSO energy research program. A 15kW/120kWh vanadium
battery has been installed as part of the distributed energy systems
experimental facility, SYSLAB, at Risø DTU. A test programme
has been carried out to get hands-on experience with the
technology, to characterize the battery from a power system point of
view and to assess it with respect to integration of wind energy in
the Danish power system.
The battery has been in operation for 18 months. During time of
operation the battery has not shown signs of degradation of
performance. It has a round-trip efficiency at full load of
approximately 60% (depending on temperature and SOC). The
sources of the losses are power conversion in cell stacks/electrolyte,
power converter, and auxiliary power consumption from pumps and
controller.
The response time for the battery is limited at 20kW/s by the ramp
rate of the power converter. The battery can thus provide power and
frequency support for the power system.
Vanadium battery is a potential technology for storage based
services to the power system provided investment and O&M cost
are low enough and long term operation is documented.
ISSN 0106-2840
ISBN 978-87-550-3853-0
Contract no.:
Group's own reg. no.:
Sponsorship: ForskEl project no.: 6555
Cover :
Pages: 27
Tables:
References: 5
Information Service Department
Risø National Laboratory for
Sustainable Energy Technical University of Denmark
P.O.Box 49
DK-4000 Roskilde Denmark
Telephone +45 46774005
[email protected] Fax +45 46774013
www.risoe.dtu.dk
Page 4
Risø-R-1753(EN) 3
Contents
Preface 4
1 Introduction 5
1.1. Background for project 5 1.2. Outline of project 5 1.3. Introduction to Vanadium Flow Battery Technology 5
2 Experimental Setup and Operation 7
2.1. The experimental facility SYSLAB 7 2.2. The Vanadium Battery in SYSLAB 8 2.3. Communication and data acquisition 9 2.4. Operation of the battery in 2008-2009 10
3 Characteristics of the Vanadium Battery 11
3.1. Efficiency 12 3.1.1 Power converter efficiency 12 3.1.2 Cell stacks efficiency 12 3.1.3 Other storage losses 14 3.1.4 Auxiliary power consumption 15 3.1.5 Overall efficiency 15 3.2. Storage Capacity and State of Charge 17 3.2.1 State of Charge 17 3.2.2 Storage Capacity 17 3.3. Starting and stopping 18 3.4. Response time and transients 19 3.5. Degradation 20 3.6. Performance of new set of cell stacks 21 3.7. Summary of vanadium battery characterization 22
4 Future Perspectives of the technology 23
4.1. Technology improvements 23
5 Applications and Alternative Technologies 24
5.1. Role of Vanadium Flow Batteries in the Power System 24 5.2. Alternative Technologies 25
6 Summary 27
7 References 27
Page 5
4 Risø-R-1753(EN)
Preface
This report summarizes the work done at Risø-DTU testing a vanadium flow battery as
part of the project “Characterisation of Vanadium Batteries” (ForskEl project 6555)
under the Danish PSO energy research program. Project partners are Risø DTU, PA
Energy A/S and OI Electric A/S. The goal of the Danish TSO Energinet.dk has been to
get hands-on experience with the technology and evaluate its potential role in the future
Danish energy system. In order to reach this goal a vanadium battery has been acquired
and installed at the distributed energy research facility SYSLAB at Risø-DTU. The
control and data logging system of SYSLAB has made it possible to carry out a variety
of tests of the battery system, thereby gaining understanding of the performance and
experience with the integration of the technology in a renewable dominated energy
system. This report presents the results of the analyses carried out during 2008 and 2009.
Page 6
Risø-R-1753(EN) 5
1 Introduction
1.1. Background for project In the development towards a more sustainable power system the level of renewable
energy, in particular wind and solar, is reaching levels were it has a very significant
impact on the operation of the system due to the fluctuations in the production and the
limited predictability. Since the power system has to be balanced at all time instances the
fluctuations coming from the RE has to compensated for by the rest of the system either
the production, the consumption or using energy storage. Increasing amounts of RE also
implies reduced production from conventional sources and there is thus a desire to shut
down these plants but they are often required to be online because of their capability to
participate in the control of the system. This indicates that the case for energy storage
including batteries is becoming increasingly more attractive.
Many types of energy storage exist ranging from ultra capacitors to large pumped hydro
installations. Electrochemical batteries have many attractive features in a power system
context for applications in the minutes to hour timescale. These features include power
and energy densities, response time and efficiencies that make them suitable for utility
applications.
One of these technologies is the all vanadium redox flow battery investigated in the
present project.
1.2. Outline of project The objective of the project is to characterize a vanadium battery from a power system
point of view, in particular with respect to applications related to integration of wind
energy.
The project has involved procurement and installation of a 15kW/120kWh vanadium
battery. It has been integrated as part the the test facility for distributed power systems,
SYSLAB, at Risø DTU. A number of tests has been conducted to carry out a
characterization of the battery in a power system context. Emphasis has been on getting
real hands-on experience and quantifying performance measures in particular the
efficiency under different operating conditions.
The objective of the project is to contribute to establish a foundation for decisions on
future development and demonstration activities involving vanadium batteries in the
Danish power system with respect to large scale application. This will be achieved
through measurements on a prototype in order to
Obtain first hand operating experience with a vanadium battery
Establish system characteristics of the vanadium battery based on application in
the Danish power system including comparison with expected performance
characteristics
Assess the development perspectives of the technology
Enumerate possible applications and assess the suitability of the vanadium
battery for these applications
Compare with alternative technologies such as other types of batteries,
compressed air etc.
1.3. Introduction to Vanadium Flow Battery Technology Vanadium battery technology is based on electron/H
+ transfer between different ionic
forms of vanadium. The battery consists of two closed electrolyte circuits and the liquid
electrolytes containing the vanadium ions flow from two separate containers for each
half cell through an electrochemical cell on each side of the membrane and back to the
Page 7
6 Risø-R-1753(EN)
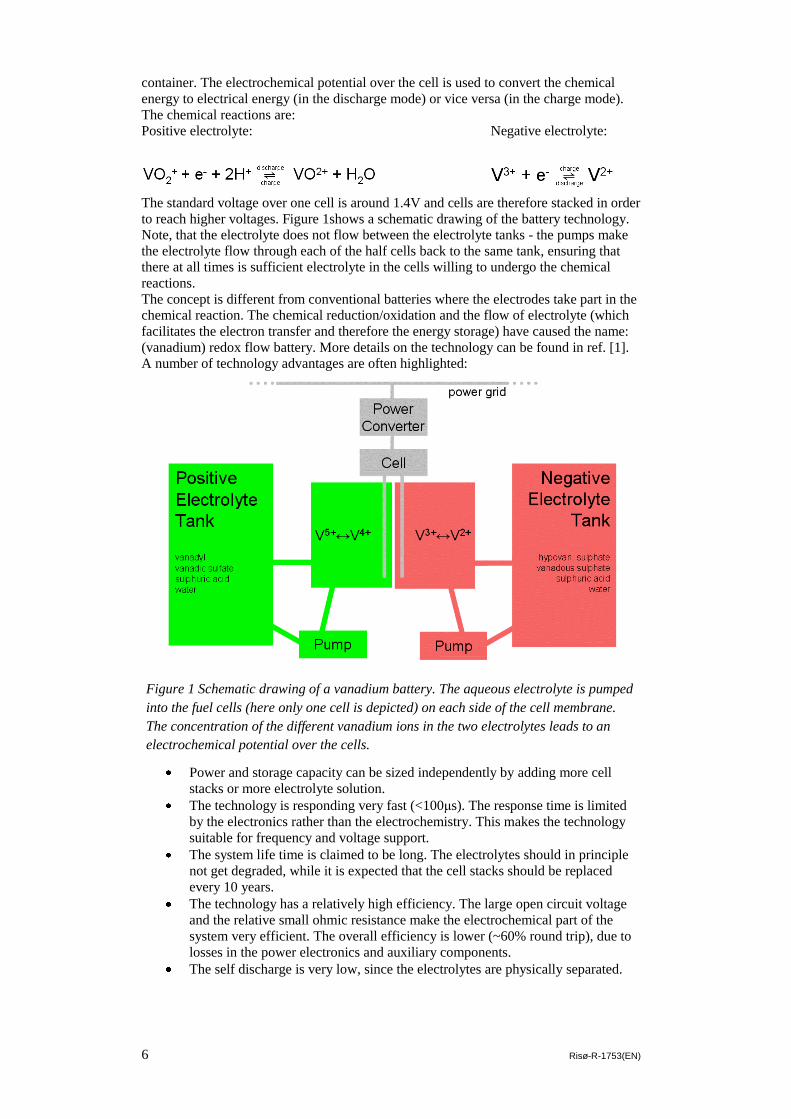
container. The electrochemical potential over the cell is used to convert the chemical
energy to electrical energy (in the discharge mode) or vice versa (in the charge mode).
The chemical reactions are:
Positive electrolyte: Negative electrolyte:
The standard voltage over one cell is around 1.4V and cells are therefore stacked in order
to reach higher voltages. Figure 1shows a schematic drawing of the battery technology.
Note, that the electrolyte does not flow between the electrolyte tanks - the pumps make
the electrolyte flow through each of the half cells back to the same tank, ensuring that
there at all times is sufficient electrolyte in the cells willing to undergo the chemical
reactions.
The concept is different from conventional batteries where the electrodes take part in the
chemical reaction. The chemical reduction/oxidation and the flow of electrolyte (which
facilitates the electron transfer and therefore the energy storage) have caused the name:
(vanadium) redox flow battery. More details on the technology can be found in ref. [1].
A number of technology advantages are often highlighted:
Power and storage capacity can be sized independently by adding more cell
stacks or more electrolyte solution.
The technology is responding very fast (<100μs). The response time is limited
by the electronics rather than the electrochemistry. This makes the technology
suitable for frequency and voltage support.
The system life time is claimed to be long. The electrolytes should in principle
not get degraded, while it is expected that the cell stacks should be replaced
every 10 years.
The technology has a relatively high efficiency. The large open circuit voltage
and the relative small ohmic resistance make the electrochemical part of the
system very efficient. The overall efficiency is lower (~60% round trip), due to
losses in the power electronics and auxiliary components.
The self discharge is very low, since the electrolytes are physically separated.
Figure 1 Schematic drawing of a vanadium battery. The aqueous electrolyte is pumped
into the fuel cells (here only one cell is depicted) on each side of the cell membrane.
The concentration of the different vanadium ions in the two electrolytes leads to an
electrochemical potential over the cells.
Page 8
Risø-R-1753(EN) 7
The technology offers the possibility of overloading the cell stacks - up to twice
the rated power for minutes (this has not been verified or tested in the studies
presented in this report).
However, there are also a number of disadvantages:
The energy density of the storage system is relatively low (~0.02MWh/m3),
comparable to natural gas at atmospheric pressure. This makes the footprint of a
vanadium battery large.
The large quantity of electrolyte consists of sulphuric acid and is thus classified
as corrosive. Measures have to taken to avoid leakage to the environment.
The technology is (still) relatively expensive – both in terms of price per unit of
power (cell stacks) and price per unit of electricity storage (electrolyte). In
particular the cost reduction potential of the electrolyte is limited due to the high
dependency on the cost of vanadium.
2 Experimental Setup and Operation
The vanadium battery is installed at Risø as part of SYSLAB. SYSLAB
(www.syslab.dk) is a research platform for distributed intelligent energy systems with a
high penetration of renewable energy. It can be used for testing of components including
characterization, control of components as part of a larger system and investigating
system control concepts such as decentralized control or large scale participation of the
demand side in system balancing. SYSLAB is very flexible both with respect to
configuration of the system under study and with respect to control.
2.1. The experimental facility SYSLAB
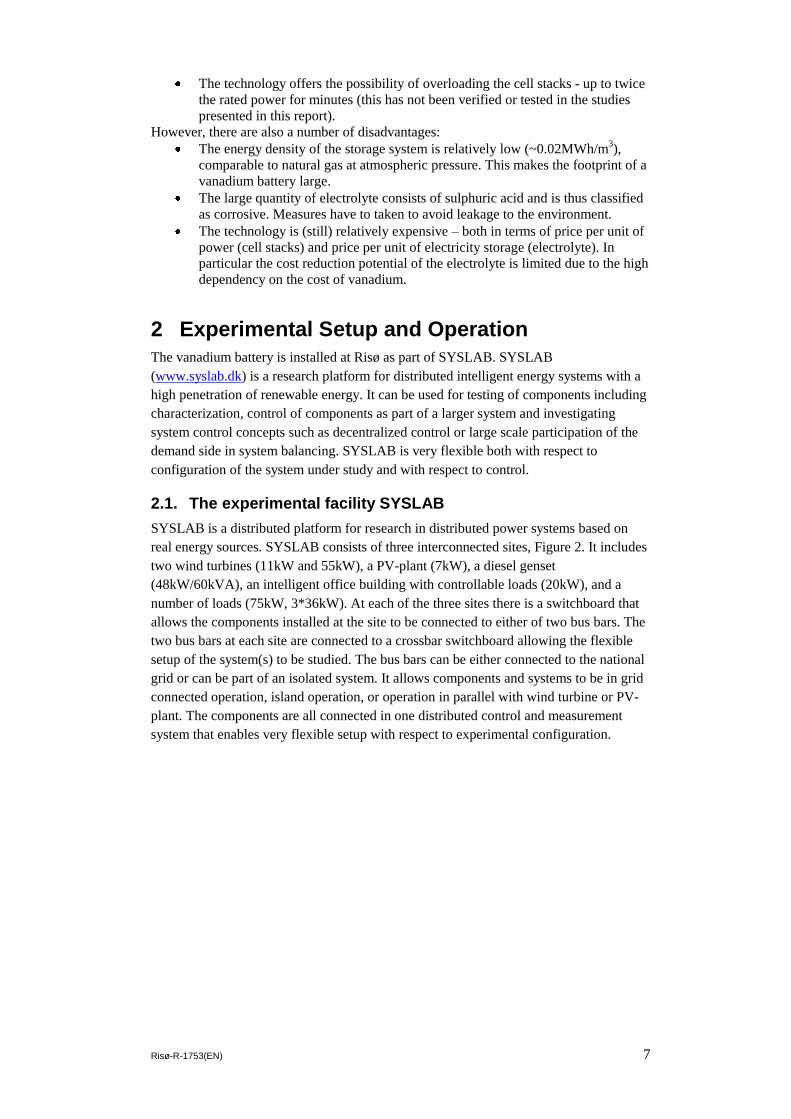
SYSLAB is a distributed platform for research in distributed power systems based on
real energy sources. SYSLAB consists of three interconnected sites, Figure 2. It includes
two wind turbines (11kW and 55kW), a PV-plant (7kW), a diesel genset
(48kW/60kVA), an intelligent office building with controllable loads (20kW), and a
number of loads (75kW, 3*36kW). At each of the three sites there is a switchboard that
allows the components installed at the site to be connected to either of two bus bars. The
two bus bars at each site are connected to a crossbar switchboard allowing the flexible
setup of the system(s) to be studied. The bus bars can be either connected to the national
grid or can be part of an isolated system. It allows components and systems to be in grid
connected operation, island operation, or operation in parallel with wind turbine or PV-
plant. The components are all connected in one distributed control and measurement
system that enables very flexible setup with respect to experimental configuration.
Page 9
8 Risø-R-1753(EN)
The control platform provides infrastructure for control of the components as well as for
groups of components or systems. It makes it possible to program complex control
sequences that can be automatically executed as well as to program control algorithms to
investigate the performance of components as part of a system e.g. as a virtual power
plant or parallel operation of wind turbine and battery with the objective of firming the
wind power.
SYSLAB also provides an infrastructure for measurements. It includes measurement
devices installed in the switchboards and signals from the system components incl. the
battery control system. It can also provide signals from other parts of the system that can
be used in control algorithms.
2.2. The Vanadium Battery in SYSLAB
The vanadium battery system installed in SYSLAB is connected to the grid via a four
quadrant power converter and can deliver 15kW on the AC side and the nominal
storage capacity is 120kWh. Figure 3 shows a picture of the system during installation
Figure 2 Layout of power part of SYSLAB. The three sites each have a two bus bar
switchboard that can be either connected to the main grid or through the crossbar
switchboard to the other sites.
Page 10
Risø-R-1753(EN) 9
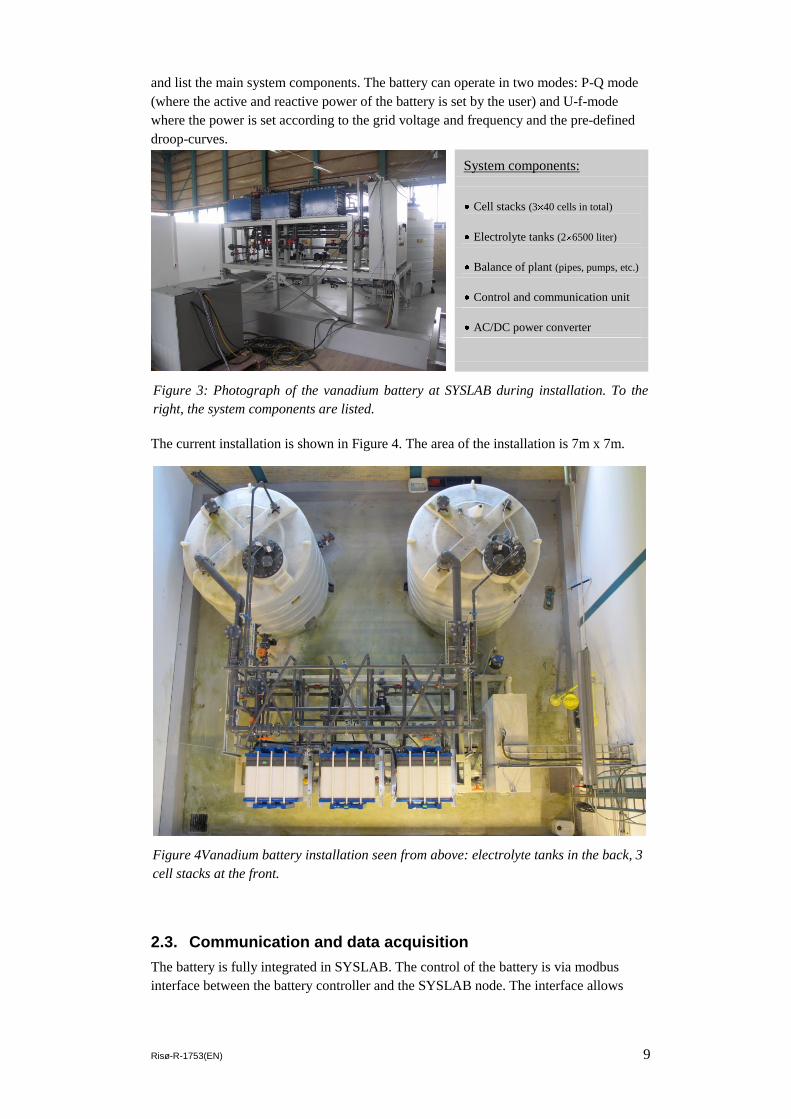
and list the main system components. The battery can operate in two modes: P-Q mode
(where the active and reactive power of the battery is set by the user) and U-f-mode
where the power is set according to the grid voltage and frequency and the pre-defined
droop-curves.
The current installation is shown in Figure 4. The area of the installation is 7m x 7m.
2.3. Communication and data acquisition
The battery is fully integrated in SYSLAB. The control of the battery is via modbus
interface between the battery controller and the SYSLAB node. The interface allows
System components:
Cell stacks (3 40 cells in total)
Electrolyte tanks (2 6500 liter)
Balance of plant (pipes, pumps, etc.)
(pumps, pipes, etc)
Control and communication unit
AC/DC power converter
Figure 3: Photograph of the vanadium battery at SYSLAB during installation. To the
right, the system components are listed.
Figure 4Vanadium battery installation seen from above: electrolyte tanks in the back, 3
cell stacks at the front.
Page 11
10 Risø-R-1753(EN)
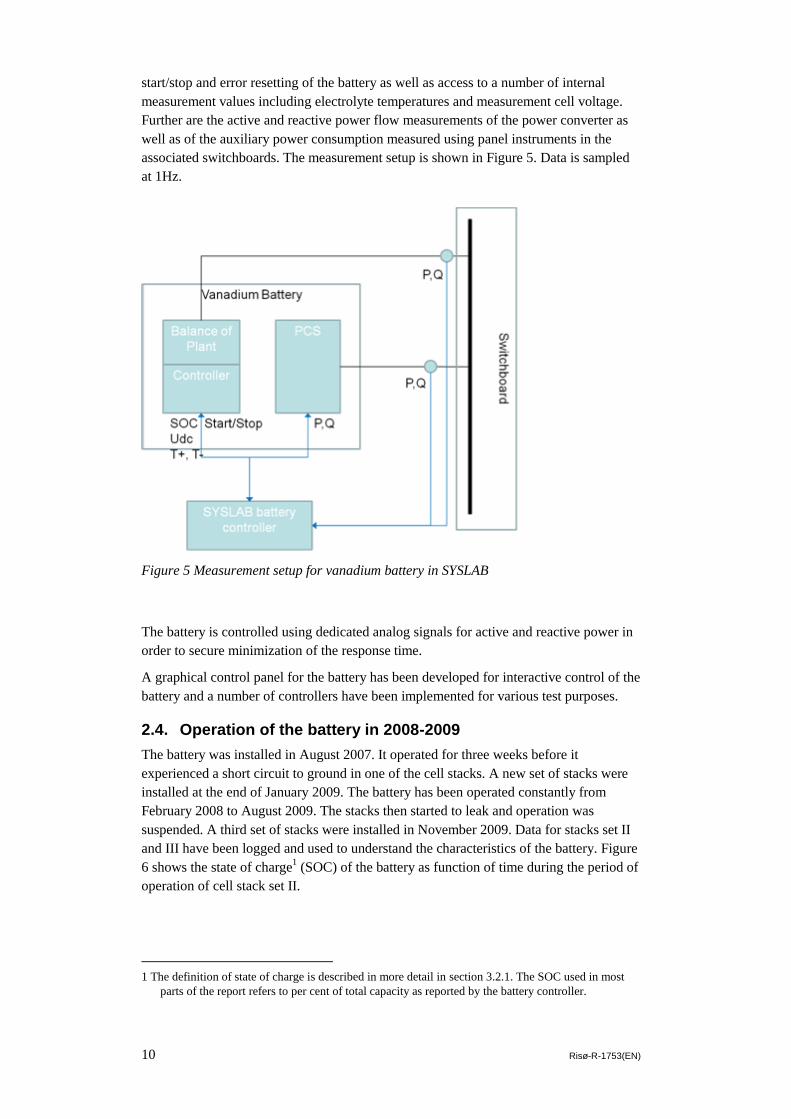
start/stop and error resetting of the battery as well as access to a number of internal
measurement values including electrolyte temperatures and measurement cell voltage.
Further are the active and reactive power flow measurements of the power converter as
well as of the auxiliary power consumption measured using panel instruments in the
associated switchboards. The measurement setup is shown in Figure 5. Data is sampled
at 1Hz.
The battery is controlled using dedicated analog signals for active and reactive power in
order to secure minimization of the response time.
A graphical control panel for the battery has been developed for interactive control of the
battery and a number of controllers have been implemented for various test purposes.
2.4. Operation of the battery in 2008-2009
The battery was installed in August 2007. It operated for three weeks before it
experienced a short circuit to ground in one of the cell stacks. A new set of stacks were
installed at the end of January 2009. The battery has been operated constantly from
February 2008 to August 2009. The stacks then started to leak and operation was
suspended. A third set of stacks were installed in November 2009. Data for stacks set II
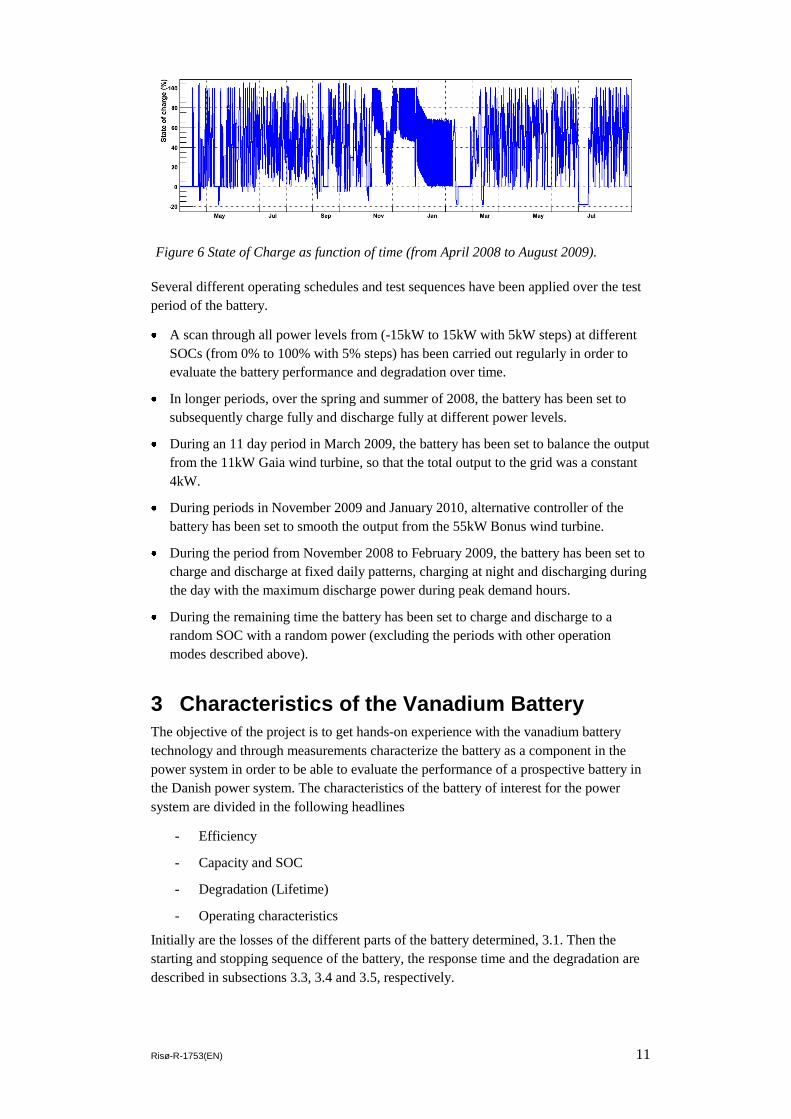
and III have been logged and used to understand the characteristics of the battery. Figure
6 shows the state of charge1 (SOC) of the battery as function of time during the period of
operation of cell stack set II.
1 The definition of state of charge is described in more detail in section 3.2.1. The SOC used in most
parts of the report refers to per cent of total capacity as reported by the battery controller.
Figure 5 Measurement setup for vanadium battery in SYSLAB
Page 12
Risø-R-1753(EN) 11
Several different operating schedules and test sequences have been applied over the test
period of the battery.
A scan through all power levels from (-15kW to 15kW with 5kW steps) at different
SOCs (from 0% to 100% with 5% steps) has been carried out regularly in order to
evaluate the battery performance and degradation over time.
In longer periods, over the spring and summer of 2008, the battery has been set to
subsequently charge fully and discharge fully at different power levels.
During an 11 day period in March 2009, the battery has been set to balance the output
from the 11kW Gaia wind turbine, so that the total output to the grid was a constant
4kW.
During periods in November 2009 and January 2010, alternative controller of the
battery has been set to smooth the output from the 55kW Bonus wind turbine.
During the period from November 2008 to February 2009, the battery has been set to
charge and discharge at fixed daily patterns, charging at night and discharging during
the day with the maximum discharge power during peak demand hours.
During the remaining time the battery has been set to charge and discharge to a
random SOC with a random power (excluding the periods with other operation
modes described above).
3 Characteristics of the Vanadium Battery
The objective of the project is to get hands-on experience with the vanadium battery
technology and through measurements characterize the battery as a component in the
power system in order to be able to evaluate the performance of a prospective battery in
the Danish power system. The characteristics of the battery of interest for the power
system are divided in the following headlines
- Efficiency
- Capacity and SOC
- Degradation (Lifetime)
- Operating characteristics
Initially are the losses of the different parts of the battery determined, 3.1. Then the
starting and stopping sequence of the battery, the response time and the degradation are
described in subsections 3.3, 3.4 and 3.5, respectively.
Figure 6 State of Charge as function of time (from April 2008 to August 2009).
Page 13
12 Risø-R-1753(EN)
3.1. Efficiency
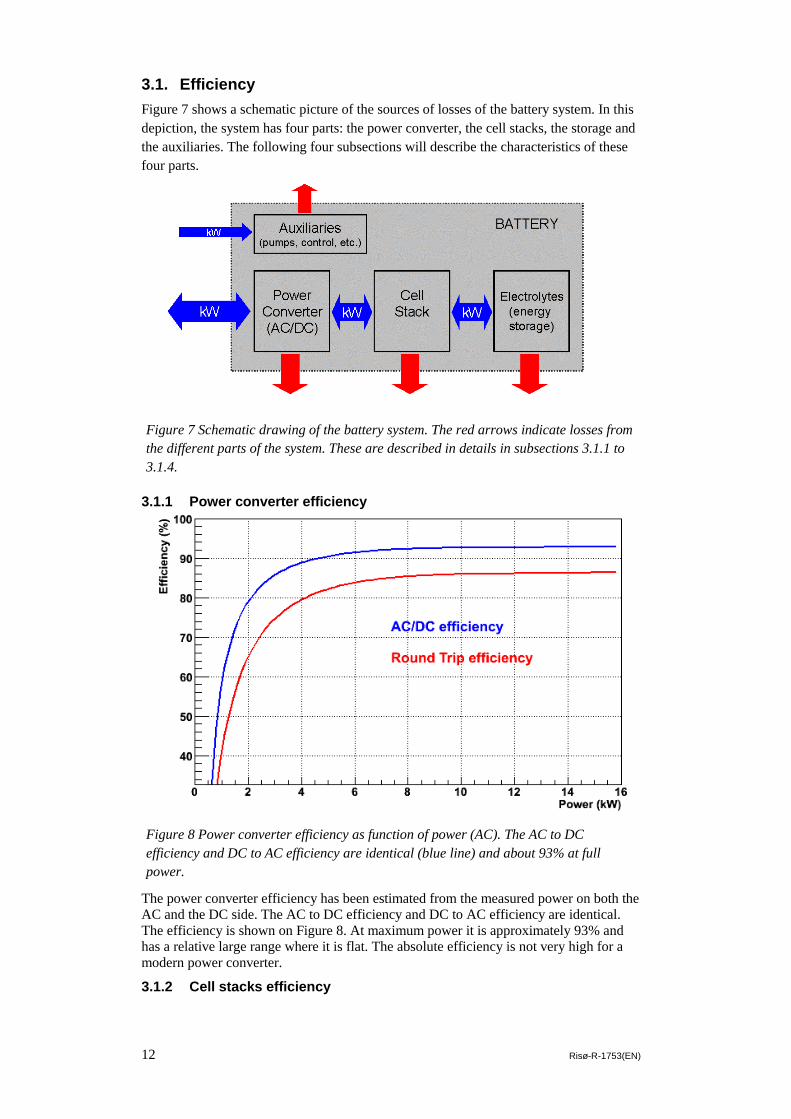
Figure 7 shows a schematic picture of the sources of losses of the battery system. In this
depiction, the system has four parts: the power converter, the cell stacks, the storage and
the auxiliaries. The following four subsections will describe the characteristics of these
four parts.
3.1.1 Power converter efficiency
The power converter efficiency has been estimated from the measured power on both the
AC and the DC side. The AC to DC efficiency and DC to AC efficiency are identical.
The efficiency is shown on Figure 8. At maximum power it is approximately 93% and
has a relative large range where it is flat. The absolute efficiency is not very high for a
modern power converter.
3.1.2 Cell stacks efficiency
Figure 7 Schematic drawing of the battery system. The red arrows indicate losses from
the different parts of the system. These are described in details in subsections 3.1.1 to
3.1.4.
Figure 8 Power converter efficiency as function of power (AC). The AC to DC
efficiency and DC to AC efficiency are identical (blue line) and about 93% at full
power.
Page 14
Risø-R-1753(EN) 13
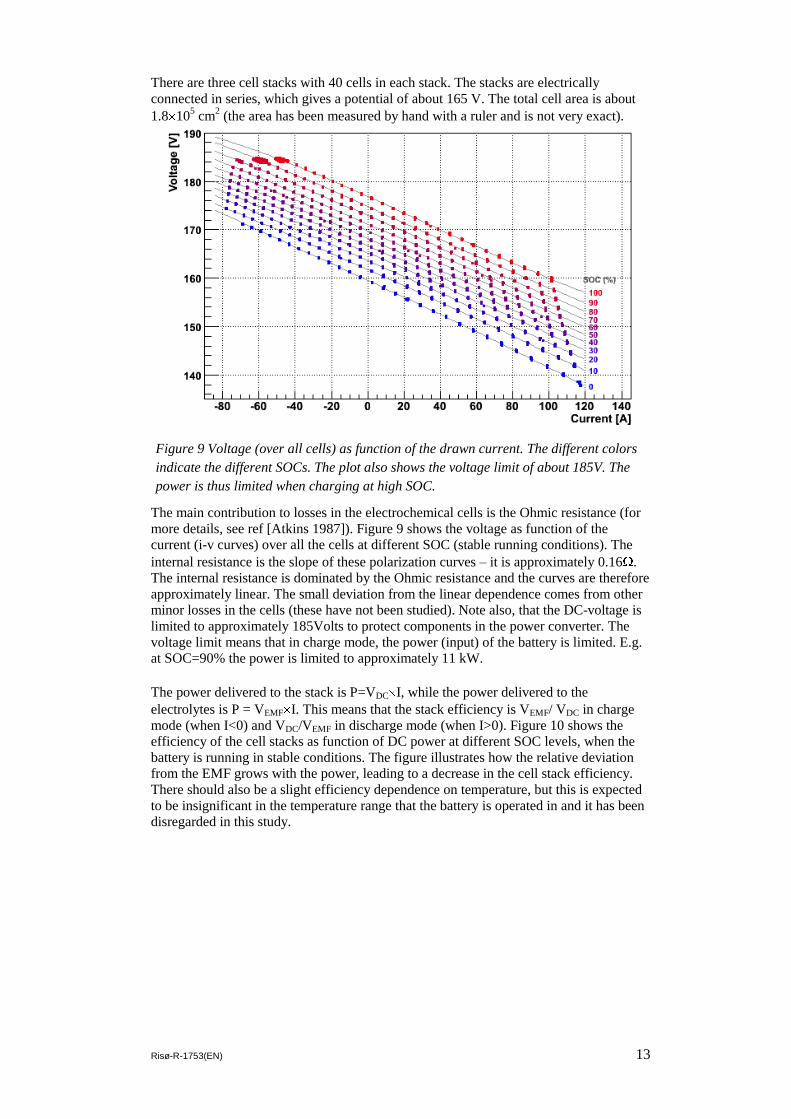
There are three cell stacks with 40 cells in each stack. The stacks are electrically
connected in series, which gives a potential of about 165 V. The total cell area is about
1.8 105 cm
2 (the area has been measured by hand with a ruler and is not very exact).
The main contribution to losses in the electrochemical cells is the Ohmic resistance (for
more details, see ref [Atkins 1987]). Figure 9 shows the voltage as function of the
current (i-v curves) over all the cells at different SOC (stable running conditions). The
internal resistance is the slope of these polarization curves – it is approximately 0.16 .
The internal resistance is dominated by the Ohmic resistance and the curves are therefore
approximately linear. The small deviation from the linear dependence comes from other
minor losses in the cells (these have not been studied). Note also, that the DC-voltage is
limited to approximately 185Volts to protect components in the power converter. The
voltage limit means that in charge mode, the power (input) of the battery is limited. E.g.
at SOC=90% the power is limited to approximately 11 kW.
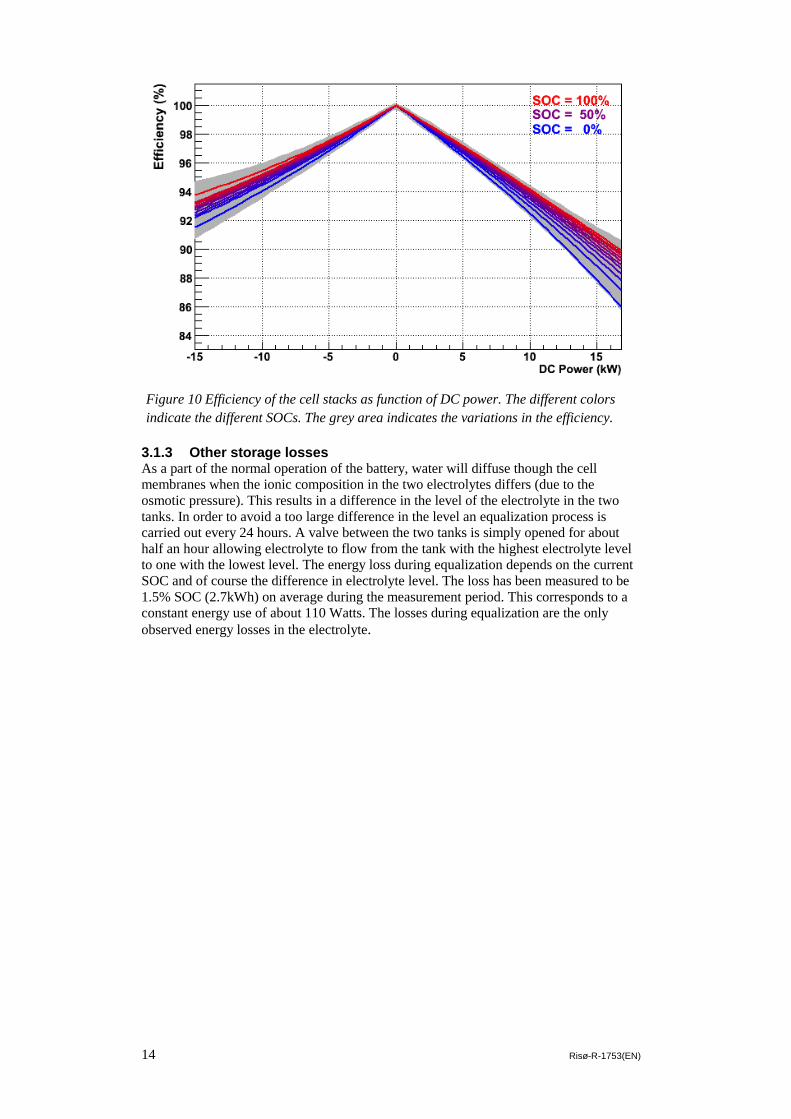
The power delivered to the stack is P=VDC I, while the power delivered to the
electrolytes is P = VEMF I. This means that the stack efficiency is VEMF/ VDC in charge
mode (when I<0) and VDC/VEMF in discharge mode (when I>0). Figure 10 shows the
efficiency of the cell stacks as function of DC power at different SOC levels, when the
battery is running in stable conditions. The figure illustrates how the relative deviation
from the EMF grows with the power, leading to a decrease in the cell stack efficiency.
There should also be a slight efficiency dependence on temperature, but this is expected
to be insignificant in the temperature range that the battery is operated in and it has been
disregarded in this study.
Figure 9 Voltage (over all cells) as function of the drawn current. The different colors
indicate the different SOCs. The plot also shows the voltage limit of about 185V. The
power is thus limited when charging at high SOC.
Page 15
14 Risø-R-1753(EN)
3.1.3 Other storage losses As a part of the normal operation of the battery, water will diffuse though the cell
membranes when the ionic composition in the two electrolytes differs (due to the
osmotic pressure). This results in a difference in the level of the electrolyte in the two
tanks. In order to avoid a too large difference in the level an equalization process is
carried out every 24 hours. A valve between the two tanks is simply opened for about
half an hour allowing electrolyte to flow from the tank with the highest electrolyte level
to one with the lowest level. The energy loss during equalization depends on the current
SOC and of course the difference in electrolyte level. The loss has been measured to be
1.5% SOC (2.7kWh) on average during the measurement period. This corresponds to a
constant energy use of about 110 Watts. The losses during equalization are the only
observed energy losses in the electrolyte.
Figure 10 Efficiency of the cell stacks as function of DC power. The different colors
indicate the different SOCs. The grey area indicates the variations in the efficiency.
Page 16
Risø-R-1753(EN) 15
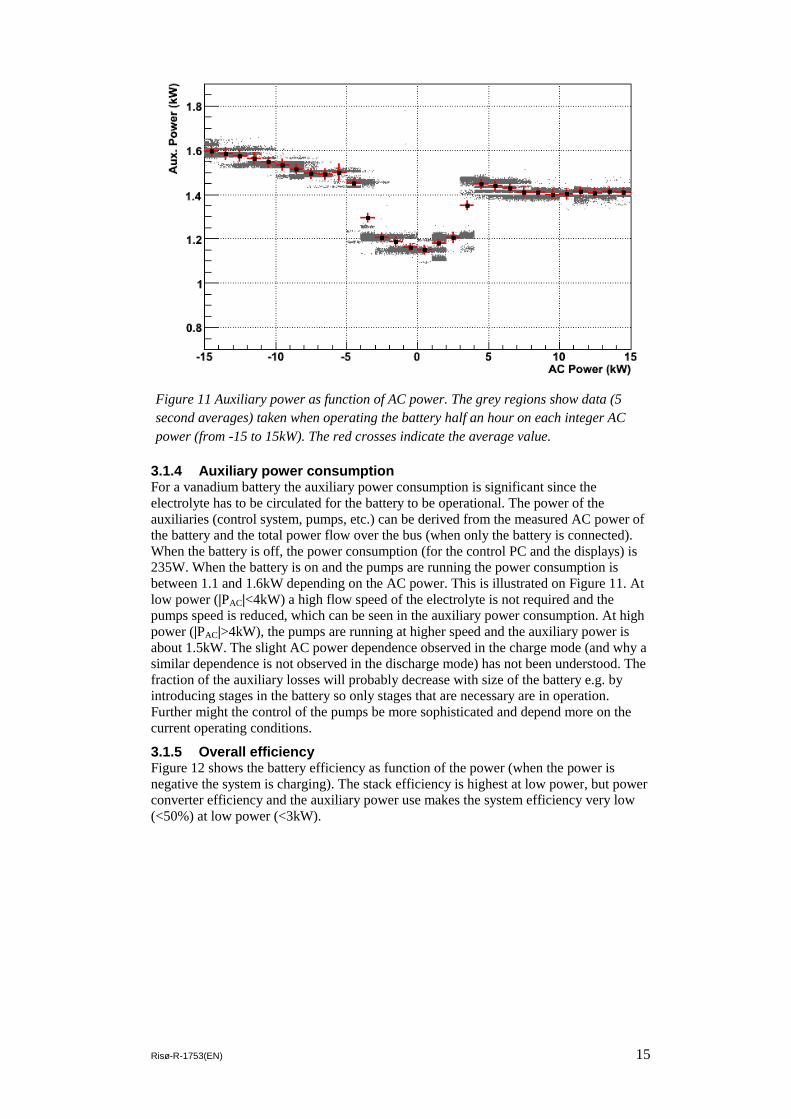
3.1.4 Auxiliary power consumption For a vanadium battery the auxiliary power consumption is significant since the
electrolyte has to be circulated for the battery to be operational. The power of the
auxiliaries (control system, pumps, etc.) can be derived from the measured AC power of
the battery and the total power flow over the bus (when only the battery is connected).
When the battery is off, the power consumption (for the control PC and the displays) is
235W. When the battery is on and the pumps are running the power consumption is
between 1.1 and 1.6kW depending on the AC power. This is illustrated on Figure 11. At
low power (|PAC|<4kW) a high flow speed of the electrolyte is not required and the
pumps speed is reduced, which can be seen in the auxiliary power consumption. At high
power (|PAC|>4kW), the pumps are running at higher speed and the auxiliary power is
about 1.5kW. The slight AC power dependence observed in the charge mode (and why a
similar dependence is not observed in the discharge mode) has not been understood. The
fraction of the auxiliary losses will probably decrease with size of the battery e.g. by
introducing stages in the battery so only stages that are necessary are in operation.
Further might the control of the pumps be more sophisticated and depend more on the
current operating conditions.
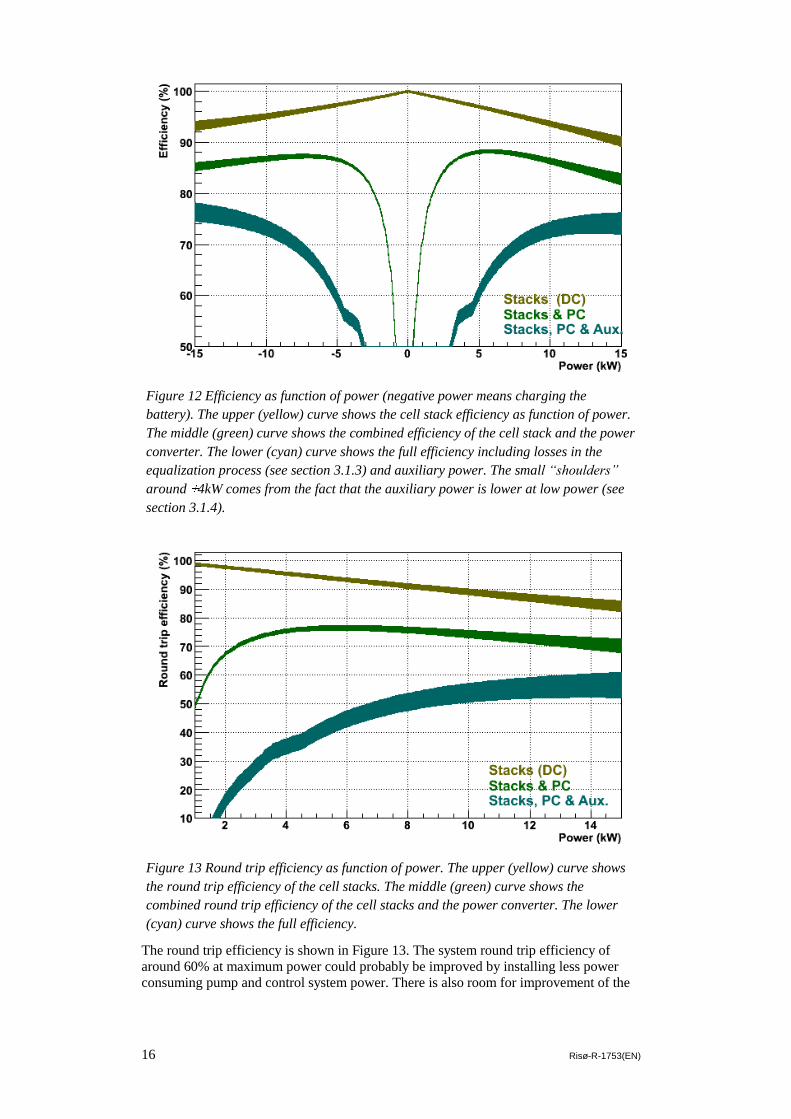
3.1.5 Overall efficiency Figure 12 shows the battery efficiency as function of the power (when the power is
negative the system is charging). The stack efficiency is highest at low power, but power
converter efficiency and the auxiliary power use makes the system efficiency very low
(<50%) at low power (<3kW).
Figure 11 Auxiliary power as function of AC power. The grey regions show data (5
second averages) taken when operating the battery half an hour on each integer AC
power (from -15 to 15kW). The red crosses indicate the average value.
Page 17
16 Risø-R-1753(EN)
The round trip efficiency is shown in Figure 13. The system round trip efficiency of
around 60% at maximum power could probably be improved by installing less power
consuming pump and control system power. There is also room for improvement of the
Figure 12 Efficiency as function of power (negative power means charging the
battery). The upper (yellow) curve shows the cell stack efficiency as function of power.
The middle (green) curve shows the combined efficiency of the cell stack and the power
converter. The lower (cyan) curve shows the full efficiency including losses in the
equalization process (see section 3.1.3) and auxiliary power. The small “shoulders”
around 4kW comes from the fact that the auxiliary power is lower at low power (see
section 3.1.4).
Figure 13 Round trip efficiency as function of power. The upper (yellow) curve shows
the round trip efficiency of the cell stacks. The middle (green) curve shows the
combined round trip efficiency of the cell stacks and the power converter. The lower
(cyan) curve shows the full efficiency.
Page 18
Risø-R-1753(EN) 17
power converter efficiency, but it could lead to an increase in price. It is not expected
that the cell stack efficiency can/will be improved significantly.
3.2. Storage Capacity and State of Charge The following subsections describe how the state of charge (SOC) is determined, how
the total storage capacity of the installed system is estimated.
3.2.1 State of Charge The state of charge (SOC) is a measure of the amount of stored energy relative to the
total energy storage capacity of the battery. Two definitions of SOC are used in the
current context. One SOC relates to the possible electrochemical energy storage capacity
of the electrolyte and the other SOC is the range that the battery controller allows to be
utilized during operation. The first SOC is related to the concentrations of vanadium ions
in the two electrolytes and it can be determined from the electromotoric force (VEMF)
over the cells. A (single) reference cell is installed in parallel to the cell stacks in order to
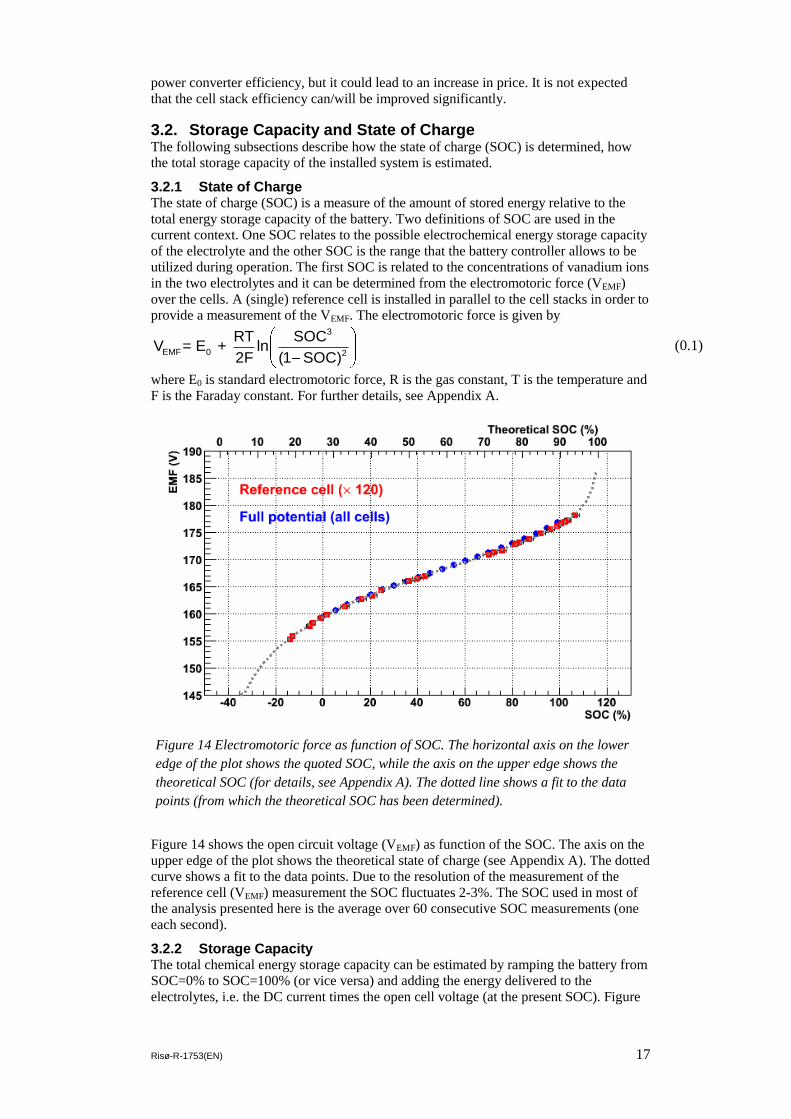
provide a measurement of the VEMF. The electromotoric force is given by 3
EMF 0 2
RT SOCV = E + ln
2F (1 SOC) (0.1)
where E0 is standard electromotoric force, R is the gas constant, T is the temperature and
F is the Faraday constant. For further details, see Appendix A.
Figure 14 shows the open circuit voltage (VEMF) as function of the SOC. The axis on the
upper edge of the plot shows the theoretical state of charge (see Appendix A). The dotted
curve shows a fit to the data points. Due to the resolution of the measurement of the
reference cell (VEMF) measurement the SOC fluctuates 2-3%. The SOC used in most of
the analysis presented here is the average over 60 consecutive SOC measurements (one
each second).
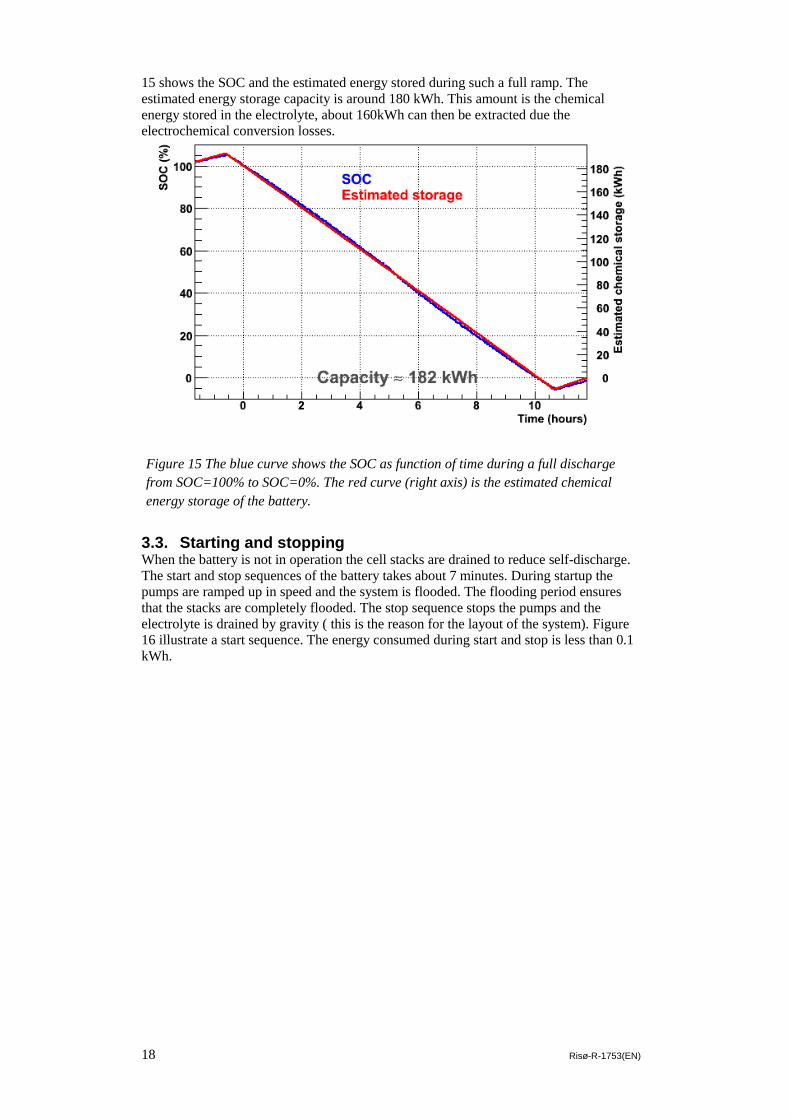
3.2.2 Storage Capacity The total chemical energy storage capacity can be estimated by ramping the battery from
SOC=0% to SOC=100% (or vice versa) and adding the energy delivered to the
electrolytes, i.e. the DC current times the open cell voltage (at the present SOC). Figure
Figure 14 Electromotoric force as function of SOC. The horizontal axis on the lower
edge of the plot shows the quoted SOC, while the axis on the upper edge shows the
theoretical SOC (for details, see Appendix A). The dotted line shows a fit to the data
points (from which the theoretical SOC has been determined).
Page 19
18 Risø-R-1753(EN)
15 shows the SOC and the estimated energy stored during such a full ramp. The
estimated energy storage capacity is around 180 kWh. This amount is the chemical
energy stored in the electrolyte, about 160kWh can then be extracted due the
electrochemical conversion losses.
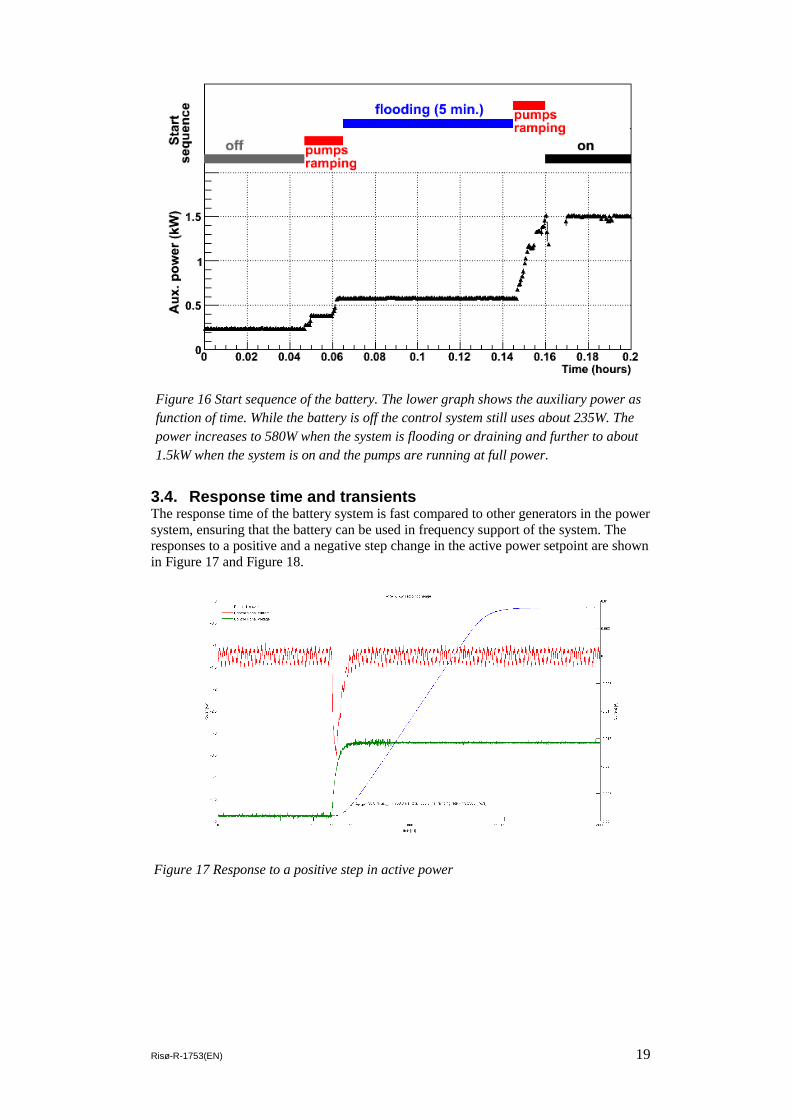
3.3. Starting and stopping When the battery is not in operation the cell stacks are drained to reduce self-discharge.
The start and stop sequences of the battery takes about 7 minutes. During startup the
pumps are ramped up in speed and the system is flooded. The flooding period ensures
that the stacks are completely flooded. The stop sequence stops the pumps and the
electrolyte is drained by gravity ( this is the reason for the layout of the system). Figure
16 illustrate a start sequence. The energy consumed during start and stop is less than 0.1
kWh.
Figure 15 The blue curve shows the SOC as function of time during a full discharge
from SOC=100% to SOC=0%. The red curve (right axis) is the estimated chemical
energy storage of the battery.
Page 20
Risø-R-1753(EN) 19
3.4. Response time and transients The response time of the battery system is fast compared to other generators in the power
system, ensuring that the battery can be used in frequency support of the system. The
responses to a positive and a negative step change in the active power setpoint are shown
in Figure 17 and Figure 18.
Figure 16 Start sequence of the battery. The lower graph shows the auxiliary power as
function of time. While the battery is off the control system still uses about 235W. The
power increases to 580W when the system is flooding or draining and further to about
1.5kW when the system is on and the pumps are running at full power.
Figure 17 Response to a positive step in active power
Page 21
20 Risø-R-1753(EN)
The two figures clearly illustrates that the response time of the battery in the present
configuration is limited by the ramp rate of the power electronics which is set at 20kW/s.
However, this response time is fast enough for the majority of the functions of a battery
in the power system and definitely fast enough for delivering frequency support.
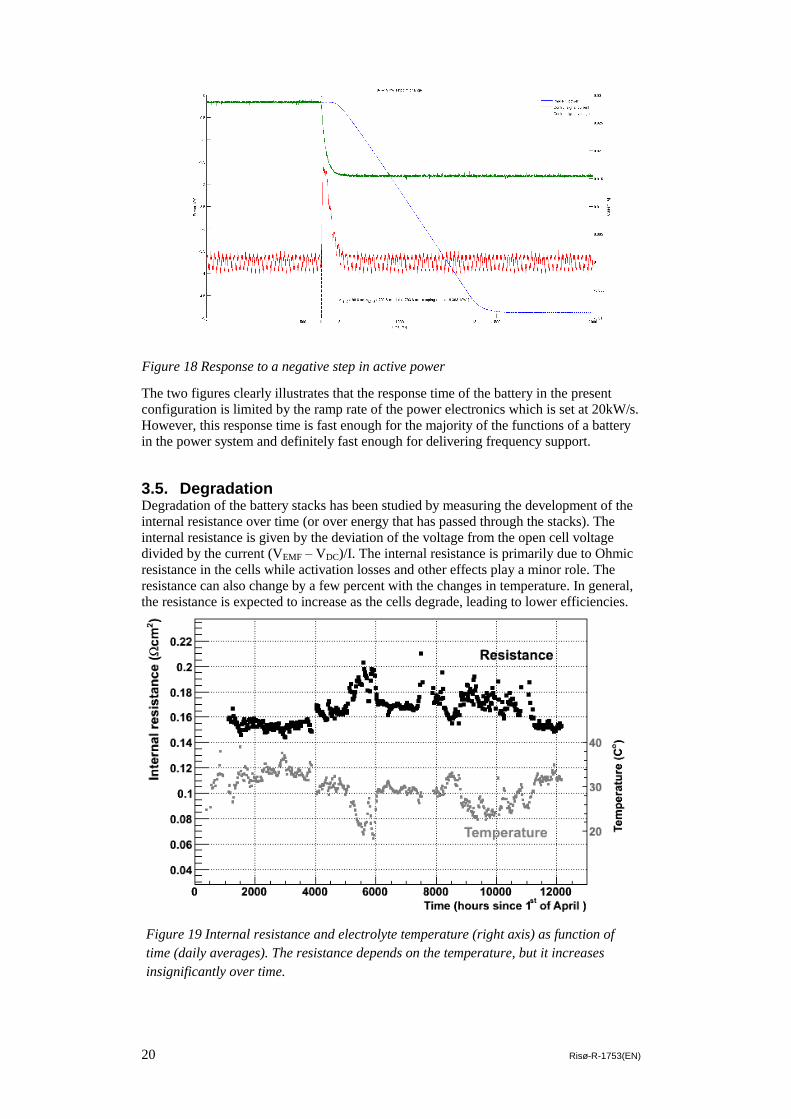
3.5. Degradation Degradation of the battery stacks has been studied by measuring the development of the
internal resistance over time (or over energy that has passed through the stacks). The
internal resistance is given by the deviation of the voltage from the open cell voltage
divided by the current (VEMF – VDC)/I. The internal resistance is primarily due to Ohmic
resistance in the cells while activation losses and other effects play a minor role. The
resistance can also change by a few percent with the changes in temperature. In general,
the resistance is expected to increase as the cells degrade, leading to lower efficiencies.
Figure 18 Response to a negative step in active power
Figure 19 Internal resistance and electrolyte temperature (right axis) as function of
time (daily averages). The resistance depends on the temperature, but it increases
insignificantly over time.
Page 22
Risø-R-1753(EN) 21
Figure 19 shows the resistance (and electrolyte temperature, right axis) as function of
time. While the resistance is clearly anti-correlated with temperature it does not seem to
increase over the 17 months of operation. The temperature dependence has been
subtracted assuming a second order correlation between temperature and internal
resistance and the result shows no increase in resistance.
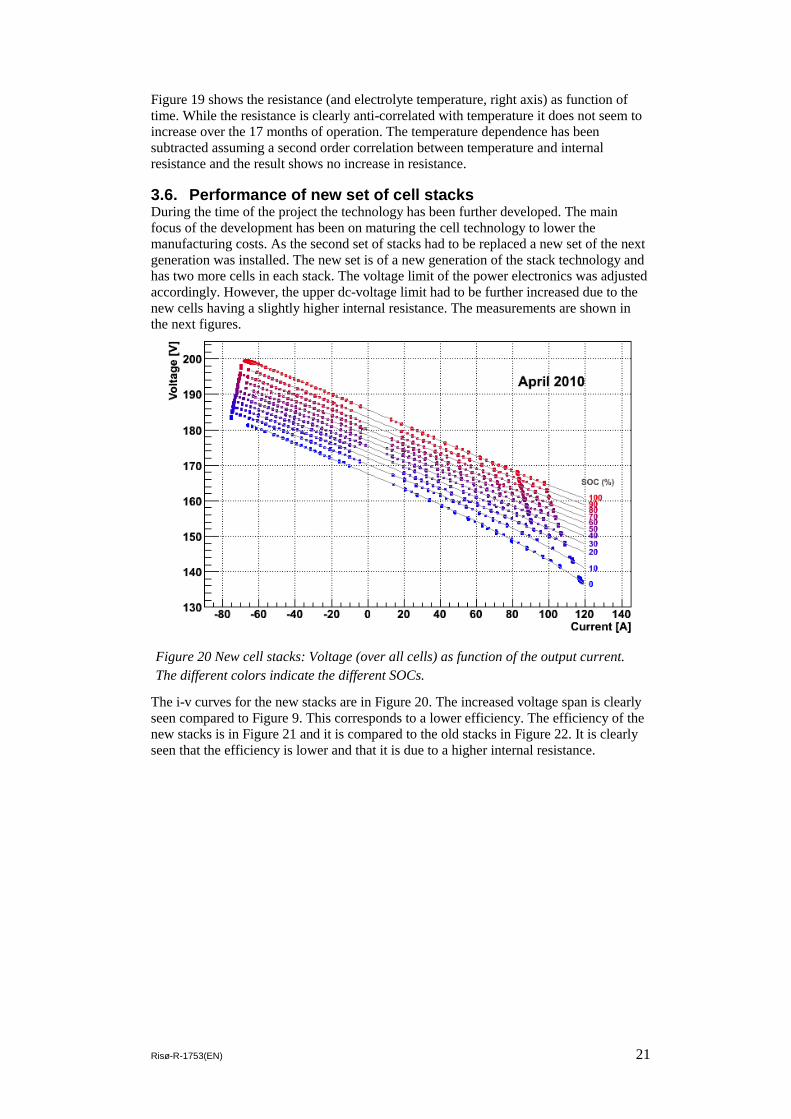
3.6. Performance of new set of cell stacks During the time of the project the technology has been further developed. The main
focus of the development has been on maturing the cell technology to lower the
manufacturing costs. As the second set of stacks had to be replaced a new set of the next
generation was installed. The new set is of a new generation of the stack technology and
has two more cells in each stack. The voltage limit of the power electronics was adjusted
accordingly. However, the upper dc-voltage limit had to be further increased due to the
new cells having a slightly higher internal resistance. The measurements are shown in
the next figures.
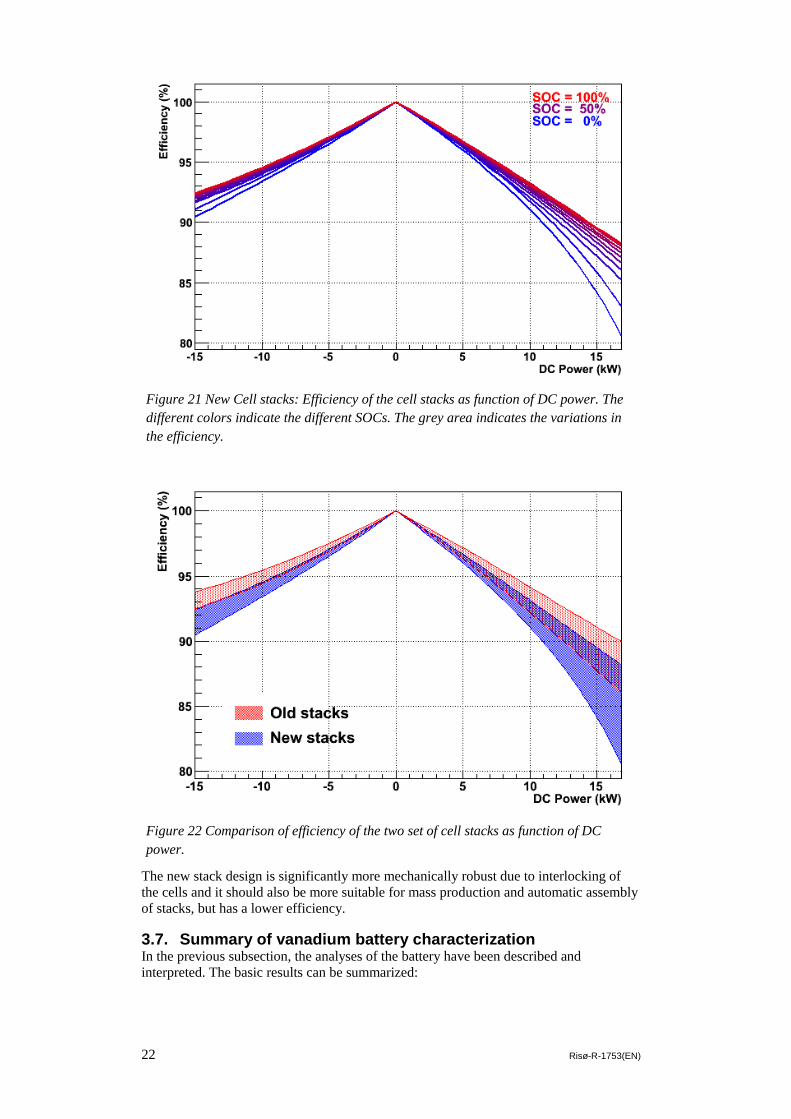
The i-v curves for the new stacks are in Figure 20. The increased voltage span is clearly
seen compared to Figure 9. This corresponds to a lower efficiency. The efficiency of the
new stacks is in Figure 21 and it is compared to the old stacks in Figure 22. It is clearly
seen that the efficiency is lower and that it is due to a higher internal resistance.
Figure 20 New cell stacks: Voltage (over all cells) as function of the output current.
The different colors indicate the different SOCs.
Page 23
22 Risø-R-1753(EN)
The new stack design is significantly more mechanically robust due to interlocking of
the cells and it should also be more suitable for mass production and automatic assembly
of stacks, but has a lower efficiency.
3.7. Summary of vanadium battery characterization In the previous subsection, the analyses of the battery have been described and
interpreted. The basic results can be summarized:
Figure 21 New Cell stacks: Efficiency of the cell stacks as function of DC power. The
different colors indicate the different SOCs. The grey area indicates the variations in
the efficiency.
Figure 22 Comparison of efficiency of the two set of cell stacks as function of DC
power.
Page 24
Risø-R-1753(EN) 23
System operation: The battery has been operated almost continuously since May
2008. There has been no need for maintenance and the battery has at any time
delivered the requested power.
Efficiency: The stack efficiency is high (>85%) and the system efficiency is slightly
lower due to the efficiency of the power converter, the equalization process and the
auxiliary power consumption. The round trip efficiency is about 60% when operating
at high power.
Storage: The chemical storage capacity is around 180kWh (from 0 to 100% SOC),
which makes it possible to extract approximately 135kWh from the fully charged
battery. This corresponds to 9 hours of discharge at full power.
Degradation: The degradation of the systems is very small. Over the 17 months of
operation, the internal resistance of the battery has not increased.
4 Future Perspectives of the technology
4.1. Technology improvements The installed and tested battery is an advanced prototype where emphasis by the supplier
has been to ensure that the system would be operating robustly. However, the
measurement results and the operational experience have indicated a number of potential
areas of improvement of the technology. The technology improvements can be divided
in three groups:
1. The battery itself, primarily stacks and pumping operation
2. Power converter/grid interface
3. Battery system functions
For the cells stacks the main lines of development are improvement of the expected
lifetime of the stacks and improvement of reliability. This is already central to the
current R&D activities at the manufacturers, but further improvements are essential and
documentation of the performance will be crucial.
The efficiency of the stacks can also be improved, but as is seen with the new set of
stacks is not necessarily an objective in itself since it could be more economic to reduce
the overall cost of the stacks rather than improve efficiency. The efficiency of the stacks
depends on the current density that the stacks are operated at. This means that operating
the stacks at low current densities results in high efficiencies, but requires large electrode
and membrane area which means more expensive stacks. Presently, the development
effort is primarily on lowering the manufacturing costs e.g. avoiding hand assembly as
much as possible and secondly improve efficiency.
As is already indicated in the previous sections the testing of the battery has indicated a
number of areas where the battery can be improved primarily from an efficiency point of
view. The circulation of the electrolyte is done in a very conservative way making sure
that there is always enough electrolyte available for the required reaction. It is, however,
clear from the measurements that the pumping is responsible for a large fraction of the
standing losses of the system and since these losses are occurring as soon as the battery
is in operation it is important that they are minimized. Making the pumping rate
dependent on the load of the battery will reduce these losses. For large installations the
battery could be segmented and only the required segments would be online thus
eliminating part of the pumping loss.
The equalization of the electrolyte level should be done on a need basis rather than by a
time and further could be done in periods where the SOC is low to reduce the amount of
energy that released with flow of the electrolyte.
The power converter efficiency can be improved compared to the installed unit. The
performance of the power converter is otherwise good.
Page 25
24 Risø-R-1753(EN)
A key improvement of the technology is development of functionality that can value to
the unit so that it can perform in the power system. This means development of
controllers that enable the battery to take on the roles mentioned below in section 5.1 and
integrate in the SCADA system.
There are a few manufacturers of vanadium batteries, Prudent Energy energy,
Cellennium, Cellstrom, developing slightly different types of batteries and it can be
expected that as the market of electricity storage develops these companies will improve
the technology.
5 Applications and Alternative Technologies Electricity storage can take different roles in the power system. These roles range from
improving the overall operation of the system to directly mitigate the impact of a
particular installation of renewable energy. Further, vanadium batteries are not the only
battery solution or even electricity storage technology available.
5.1. Role of Vanadium Flow Batteries in the Power System Energy storage systems can have many different roles in the power system. The
suitability of the different energy storage technologies for a particular application
depends very on the characteristics of the technology. This is of course one of the main
drivers for the current project.
Internationally there has been has been many projects involving analysis of the functions
of energy storage in large power systems and its associated value as well as the
suitability and cost of various storage technologies.
One of the most comprehensive studies has been carried out by EPRI and DOE in the
USA and the results have been published in the reports [1] and [2]. The reports are
published in 2003 and 2004 so they are fairly recent.
In the reports are several applications of energy storage defined as seen below: (the terms
used are based in US power system operation)
General Energy Storage Applications
- Grid stabilization
o Angular stability
Mitigation of frequency oscillations in the range of a few seconds
o Voltage stability
Provide voltage support by injecting both active and reactive power
o Frequency excursion suppression
Frequency support by droop control
- Grid operational support
o Regulation control
Frequency regulation in concert with load following in the 10 minute
range with 10min notice
o Conventional spinning reserve
Reserve power for at least 2hour duration at 10min notice
- Distribution Power Quality
o Short Duration PQ
Voltage distortion mitigation
o Long duration PQ
Voltage distortion mitigation combined with several hours of reserve
power.
- Load-shifting
o Short duration load shifting
3hour load shift
Page 26
Risø-R-1753(EN) 25
o Long duration load shifting
10hours load shift
Wind specific applications
- Transmission curtailment
Limiting output from wind farm combined with storage to transmission capacity
- Time-shifting
Shifting wind power from off peak hours to peak hours
- Forecast hedge
Mitigating forecast errors
- Grid-frequency support
Large event immediate spinning reserve
- Fluctuation suppression
Output smoothing from wind farm
In a Danish context it is of special interest how energy storage can be used to mitigate
some of the impacts of integrating large amounts of wind energy. The three applications
of primary interest are therefore Forecast hedge, Grid frequency support and Fluctuation
suppression.
One of the key elements to increase the wind penetration level is to mitigate the impact
of the large and rapid changes to the output of large wind farms that has already been
observed at Horns Rev I. These events can happen when the wind speed goes above the
cut-out wind speed of the wind turbines or when a front is passing. These events are
some of the critical events for the power system as large off shore wind farms are being
built and put into operation.
A function that is not mentioned in the US study is the ability to black start the grid. This
can also be a valuable function of an energy storage system.
In Denmark transmission curtailment will probably not be relevant since the grid
connections of the wind farms as well as the transmission system are/will be sized for the
expected very high penetration of wind.
In Denmark ESS could also play a significant role in general grid support as the role of
the large central power plants is being reduced due to the increasing penetration of wind
and therefore lower energy demand from large plants.
Forecast hedging is very much an economical issue for the owner of the wind farm/seller
of wind energy. The ability to better predict the production from wind farms will
increase the value of the energy on the market and can thus lead to higher penetration.
The role of ESS will depend on ownership, cost of the ESS, value of the services it can
provide and if it required e.g. according to grid codes.
5.2. Alternative Technologies A number of electricity storage technologies can compete with VRB technologies for a
number of different applications. This section summarizes these different technologies.
Important parameters for electricity storage are the range of power and storage capacity,
the response time, system lifetime, self discharge time, system size, operation and
maintenance cost and system cost (which in some cases can be split into the power
related costs and the storage capacity related costs). It is difficult (or impossible) to
obtain certain quantitative numbers for these parameters for any of the technologies. The
following gives a brief overview, while more detailed descriptions including estimates
for the different parameters can be found elsewhere [1][2][3].
Pumped hydro: Pumped hydro is the most common technology for large scale
electricity storage with more than 90GW installed worlds wide. The relatively low costs
for the storage capacity makes it suitable for large scale energy management, shifting the
demand and supply by hours, days or weeks. The response time of hydro turbines is
typically on the order of minutes and the technology is therefore not suited for primary
Page 27
26 Risø-R-1753(EN)
reserves. Construction of pumped hydro systems is limited to regions with the
appropriate topology (mountains). However, artificial reservoirs underground can also be
used, making it possible to construct pumped hydro systems in places like Denmark.
Underground pumped hydro is, due to the excavation of the reservoir, expensive
compared to conventional pumped hydro.
Compressed Air Energy Storage (CAES): In CAES systems the energy is stored
mechanically by compressing air. In the most common designs, air from the atmosphere
is compressed and stored in large storing volumes (typically underground) for later
expansion, which generates power via a turbine. The large pressure gradients in the
compression and expansion stages leads to undesirable heating and cooling of the air,
which is dealt with by intercoolers and heat recuperators. Two large CAES systems have
been constructed and have been operated for many years [4]. In both of these systems the
generating turbines are using both natural gas and the expanding air of the storage
caverns. By doing this, the expanding air gets heated by the gas combustion and the
problems arising from the large temperature drop is avoided. The efficiency of the
energy storage is not trivial to disentangle from the efficiency of the natural gas
combustion. The response time of CAES systems is relatively fast, comparable to that of
gas turbines (i.e. suitable for frequency controlled reserves).
Large Scale batteries: A number of other large scale battery technologies have been
developed and tested. Most common are the Sodium Sulfur and the Lead Acid batteries,
which have been installed in a number of MW scale projects around the world. At this
stage these technologies are more mature than the Vanadium battery technology, which
means that the costs of the battery systems are lower. However, these sodium sulphur
and lead acid batteries suffer from memory effects and relatively short lifetimes
(depending on the operation conditions). In general, large scale batteries are suited for
frequency controlled reserves, due to their very fast response time, but less suited for
energy management (long term storage of large amounts of energy), due to the relatively
high cost of the storage capacity.
Electrolysis-Fuel cells: Electricity storage in the form of hydrogen is done by water
splitting (electrolysis), hydrogen storage and subsequent conversion back to electricity
via a fuel cell (or an internal combustion engine). There are different technologies for
both electrolysis and fuel cells and they are used in various applications. However, the
market penetration is still very limited. Several projects demonstrating electricity storage
(using electrolysis, hydrogen storage and fuel cells) have been set up. The technology
suffers from relatively low round trip efficiency and high costs. It seems unlikely that
this technology will be able to compete (in terms of costs and round trip efficiency) with
vanadium battery technology in any foreseeable future.
Vehicle-to-grid: A large number of grid connected electric vehicles could also be used
for large scale energy storage (balance and reserves), if the required communication
infrastructure and control is in place. Only about 12% of cars are actually on the road
during rush hours [5], which means that a very large fraction of the electric vehicles
could function as energy buffer many hours every day. This concept naturally depends
on the future size of the electric vehicle fleet. The round trip efficiency of the batteries in
electric vehicles is expected to be comparable to that of the large scale battery systems
(>80%). The costs of the grid electricity storage are difficult to evaluate since this will be
a secondary service that the batteries provide. There will however be additional costs
related to the necessary fast communication and control.
Other technologies: Other technologies for special application (very high energy
density or power density) have been developed, e.g. flywheels, supermagnetic electricity
storage and super capacitors. These cannot be regarded as competitors to the vanadium
battery technology and are not treated here.
Page 28
Risø-R-1753(EN) 27
6 Summary As the fraction of renewable energy increases the challenge of maintaining economic
operation also increases in particular the need to handle the short term fluctuations and
the stable operation of the grid.
One of the options to handle these issues is use of batteries. Vanadium batteries are of
special interest in this context as they from a operational point of view has features that
make them well suited for this type of operation. This include the ability to withstand
very large number of cycles, independent sizing of power and energy capacity and
simplicity to maintain.
In the present to project a vanadium battery of 15kW/120kWh has been installed and
tested in SYSLAB at Risø DTU. The project had the objectives to get hand-on
experience with the technology, characterize it from a power system perspective and
assess the applicability of the technology in a Danish wind power integration context.
The battery has, after installation and initial exchange of cell stacks, operated
continuously for 18 months either cycling or in parallel with a wind turbine. During this
period the round trip efficiency has been measured to be approximately 60% at full load.
One of the main reasons for the rather low efficiency is the nearly constant auxiliary
power consumption from pumps and controller that amounts to almost 10% of rated
power. The stacks are quite efficient, round trip efficiency above 80% at full load, and
power electronics being the last main source of losses.
During the testing period the battery has not shown sign of degradation in the
performance do to the usage and operation of the battery.
The response time of the battery is fast and currently limited by the power electronics at
20kW/s. This is fast enough to deliver the ancillary services including frequency support
in the Danish power system.
The installed battery is of prototype character designed for robust performance. The
operation of the pumps has not been optimized for power consumption but for trouble-
free operation and the situation is the same for the power electronics for which the
controls has been designed for this application. The three sets of cell stacks have also
been quite different showing fast development of the stack technology.
Vanadium battery technology is interesting from a renewable energy perspective and has
potential for be a part of the future power system provided the technology is further
matured and competitive with other potential technologies offering similar service to the
grid.
7 References [1] EPRI-DOE, Handbook of Energy Storage for Transmission and Distribution
Applications, EPRI Palo Alto, CA, and the U.S. Department of Energy, Washington,
DC: 2003. 1001834
[2] EPRI-DOE Handbook Supplement of Energy Storage for Grid Connected Wind
Generation Applications, EPRI, Palo Alto, CA, and the U.S. Department of Energy,
Washington, DC: 2004. 1008703
[3] A. Gonzalez, B. Gallachóir, E. McKeogh, K. Lynch, Study of Electricity Storage
Technologies and their Potential to Adress Wind Energy Intermittency in Ireland,
Report 2004
[4] S. Succar, R. H. Williams, Compressed Air Energy Storage: Theory, Resources, And
Applications For Wind Power, CAES Report, Princeton University 2008
[5] Chandrashekhara, D. K., et al. V2G, vehicle to grid, 1 ed. - DK-Kgs. Lyngby :
Technical University of Denmark, 2008 (p. 105)
Page 29
28 Risø-R-1753(EN)
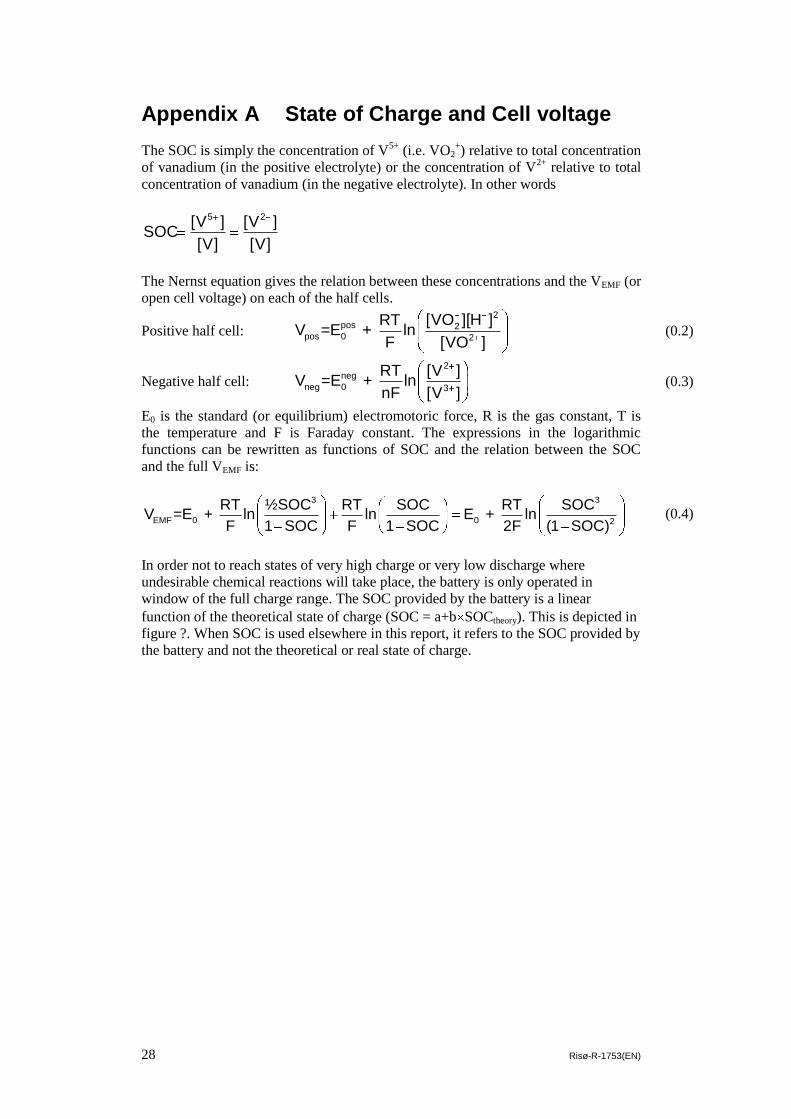
Appendix A State of Charge and Cell voltage
The SOC is simply the concentration of V5+
(i.e. VO2+) relative to total concentration
of vanadium (in the positive electrolyte) or the concentration of V2+
relative to total
concentration of vanadium (in the negative electrolyte). In other words
5 2[V ] [V ]
SOC[V] [V]
The Nernst equation gives the relation between these concentrations and the VEMF (or
open cell voltage) on each of the half cells.
Positive half cell:
2pos 2
pos 0 2
[VO ][H ]RTV =E + ln
F [VO ] (0.2)
Negative half cell:
2neg
neg 0 3
RT [V ]V =E + ln
nF [V ] (0.3)
E0 is the standard (or equilibrium) electromotoric force, R is the gas constant, T is
the temperature and F is Faraday constant. The expressions in the logarithmic
functions can be rewritten as functions of SOC and the relation between the SOC
and the full VEMF is:
3 3
EMF 0 0 2
RT ½SOC RT SOC RT SOCV =E + ln ln E + ln
F 1 SOC F 1 SOC 2F (1 SOC) (0.4)
In order not to reach states of very high charge or very low discharge where
undesirable chemical reactions will take place, the battery is only operated in
window of the full charge range. The SOC provided by the battery is a linear
function of the theoretical state of charge (SOC = a+b SOCtheory). This is depicted in
figure ?. When SOC is used elsewhere in this report, it refers to the SOC provided by
the battery and not the theoretical or real state of charge.
Page 30
Risø DTU is the National Laboratory for Sustainable Energy. Our research focuses on
development of energy technologies and systems with minimal effect on climate, and
contributes to innovation, education and policy. Risø has large experimental facilities
and interdisciplinary research environments, and includes the national centre for nuclear
technologies.
Risø DTU
National Laboratory for Sustainable Energy
Technical University of Denmark
Frederiksborgvej 399
PO Box 49
DK-4000 Roskilde
Denmark
Phone +45 4677 4677
Fax +45 4677 5688
www.risoe.dtu.dk