Materials and Methods ........................................................................................................................................... 4
Tensile test ............................................................................................................................................... 5
Compression test ..................................................................................................................................... 6
Data analysis ............................................................................................................................................. 7
Rsults and Discussion .............................................................................................................................................. 7
Tensile test ............................................................................................................................................... 8
Comression test ...................................................................................................................................... 16
Characterization of viscoelastic properties of PDMS silicon rubbers Luc Gervais Mbida
3
ABSTRACT
This work focuses on the viscous dissipation properties of polydimethylsiloxane (PDMS) relevant for encapsulation chambers for soft tissues and high deformable biomaterials mechanical tests applications. In view of the lack of dissipation consideration in biomaterials, and observing the increasing demand of such encapsulation chambers, we analyzed the dissipation of the commonly used PDMS (Sylgard 184 from Dow Corning). We focused on the effect of the thinner concentration and the polymerization temperature. We conclude that the PDMS dissipate less energy at a ratio of thinner of 1:5 and if polymerized at 37°C in tensile test. But in the chambers, in compression test, this material shows less energy dissipation at thinner ratio of 1:10 if polymerized at room temperature (20-25°C). Those results are indicatives because of the low number of tested samples and have to be verified by testing a large library of samples.
INTRODUCTION Elastomers, one of the major classes of polymers are widely used in different applications of our life. They are used in MEMS (microelectromechanical systems) where they act as embedding or encapsulation structures of electronic components and microfluidics in chips. Elastomers are also used in the shoes industry for soles fabrication, in the car industry for tires production, in medicine for the fabrication of different types of devices, in tissue engineering for scaffolds production and many others applications. For all those applications, the mechanical properties such as young modulus, stiffness, Viscosity, hardness, tensile strength and thermodynamics properties were the main parameters focussed on. But as new applications for elastomers appear, some others viscoelastic considerations have to be taken into account. In fact in life sciences it is very difficult to do mechanical tests on soft tissues or biomaterial like hydrogels that are very difficult to handle. So there is a need of encapsulation devices to test this kind of soft material. Among the different elastomers used, the polydimethylsiloxane (PDMS), a viscoelastic elastomer, is the one which is currently used for such application as material. The viscoelasticity is a consequence of the entropy production a given material and for a material to be considered as viscoelastic, it should present some phenomena such as the creep, the stress relaxation, the strain rate effect of the phase lag during tests. For visoelastic materials, the frictions in the material under cyclic mechanical tests give a mechanical hysteresis. Then using the linear theory the, viscous dissipation power of the material can be calculated with as follow:
Where E* is the norm of the complex dynamic modulus, f the frequency, ε the strain, and δ the phase lag. Knowing the cycle time, the energy dissipated can then be found, because the power is the energy per unit of time. The energy dissipated can also be directly assessed by calculating the area of the hysteresis between the ascendant and the
Characterization of viscoelastic properties of PDMS silicon rubbers Luc Gervais Mbida
4
descendant curves of the stress-strain plot obtain during test. This area can be obtained via the integral of the subtraction between those two curves. For hydrogels in unconfined compression and shear the viscous dissipation power have been estimated in a range from 1 to 250 *μW/ml+ for small deformations (≤ 5%) [7]. so, for high deformations, high values are expected. In this project we is to produce PDMS with the less viscous dissipation energy for the application of thin wall membrane uses as biocompatible chambers to support soft and high deformable sample biomaterials in large deformations mechanical compression tests. To achieve our aim we will play with two parameters when preparing the material such as the polymerization temperature or the crosslinking ratio.
MATERIALS AND METHODS
Moulds Assembly
Two types of moulds have been fabricated by my supervisor for this purpose.
For the shouldered test bars for the tensile test, the moulds are composed of three pieces in
stainless steel: two outer pieces and the inner one with the chamber that give the shape to
the sample. The three pieces were assembled and screwed together to give the functional
mould as shown in the figure1 A.
For the cylindrical chambers for the compression test, The molds is composed of two outer
pieces in a bi-component polyurethane (PU) resin (Neukadur multicast 20, Altrop, Germany)
and the inner piece composed of two stainless steel parts assembled by a screw [7]. The
assembly of the mould was done by lodging the inner piece in the outer ones and the
assembled moulds are held together by a pair of pliers as shown in figure1B.
Figure1. A: Mould assembly process for the production of the shouldered test bar. B: Mould
assembly process for the production of the encapsulation chamber production.
Characterization of viscoelastic properties of PDMS silicon rubbers Luc Gervais Mbida
5
Samples preparation
The sylgard 184 base and hardener (Sylgard 184, Dow Corning Corporation, USA) were weighted at different weight ratios (5:1; 10:1; 15:1 and 20:1). The compounds were mixed in a beaker for several minutes with a spatula. The preparations were degassed in the desiccators under the vacuum until there were no more bubbles in the bulk. The moulds were incubated in the oven for around 30minutes prior to casting (during the degassing process). The compounds were then poured into the moulds using injection casting and avoiding formation of air bubbles when transferring it in the syringe. The moulds with samples are incubated at different temperatures (room temperature; 37°C; 40°C and 70°C) in the oven or at room temperature for several hours or days. The excess of PDMS on the side was used to control the completeness of the process. The samples were then taken out of the moulds, the excess of PDMS on the sides removed using a scalpel and the samples stored in 50ml tubes.
Tensile Test
The tensile test was performed using the INSTRON machine (Electropulse E3000, Instron,
USA) and a camera (Vic2D, Limess Gmbh, Germany). The test consists on maintaining one
end of the sample fixe while pulling on the other on. And the machine equipped of sensors
determines the stress corresponding to the applied strain and compute the corresponding
hysteresis
The set up for the test were assembled. The software for the control of the INSTRON
machine and the camera were switched on and those equipments are calibrated via their
respective softwares. The Samples were prepared for test by drawing on some arrows that
delimit the tested region. The lines delimiting the loading region were drawn at 15mm from
each end and the lines delimiting the test zone were drawn at 12,5 mm of the previews ones
as shown in figure2C. The samples were then loaded on the INSTRON machine according to
the delimited zones as in the figure2A. The upper and lower positions and digital positions of
the moving part (upper) of the machine were set to calibrate the zero displacement and the
zero force with the height of the undeformed sample. The oscillatory test is set to a sine
shape and the amplitude of the strain for the test was set to 14% (corresponding to an
elongation of 26,4 mm) in the test zone. The camera was used to have a feedback when
adjusting the strain amplitude in the test zone because the shouldered test bar doesn’t have
a regular shape, the strain is not equally distributed in the sample so the camera with
markers that recognize the two lines delimiting the test zone and thus gives on the software
controlling the camera, the value of the strain that is really applied on this zone as shown in
figure2B. The cycle time was set to 5S the initial phase is set to 270°’ because the sine is at it
minimum at this value, thus the sample remains in tension during the whole test and it will
never bend. Each sample was then tested with several cycles (from 20 for the low
frequencies, to 200 for high frequencies) of the oscillatory sine shaped strain at four
different frequencies (0.2Hz; 1Hz; 5Hz and 10Hz). Data were recorded and saved for the
subsequent analysis.
Characterization of viscoelastic properties of PDMS silicon rubbers Luc Gervais Mbida
6
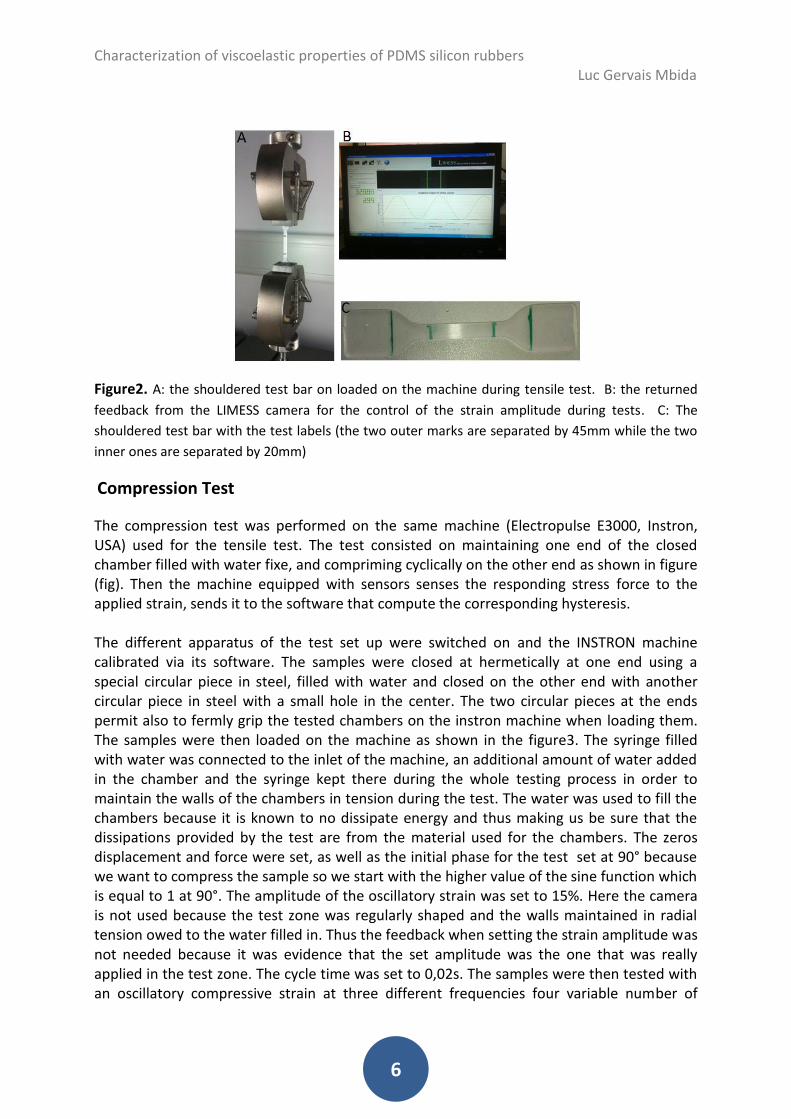
Figure2. A: the shouldered test bar on loaded on the machine during tensile test. B: the returned
feedback from the LIMESS camera for the control of the strain amplitude during tests. C: The
shouldered test bar with the test labels (the two outer marks are separated by 45mm while the two
inner ones are separated by 20mm)
Compression Test
The compression test was performed on the same machine (Electropulse E3000, Instron, USA) used for the tensile test. The test consisted on maintaining one end of the closed chamber filled with water fixe, and compriming cyclically on the other end as shown in figure (fig). Then the machine equipped with sensors senses the responding stress force to the applied strain, sends it to the software that compute the corresponding hysteresis. The different apparatus of the test set up were switched on and the INSTRON machine calibrated via its software. The samples were closed at hermetically at one end using a special circular piece in steel, filled with water and closed on the other end with another circular piece in steel with a small hole in the center. The two circular pieces at the ends permit also to fermly grip the tested chambers on the instron machine when loading them. The samples were then loaded on the machine as shown in the figure3. The syringe filled with water was connected to the inlet of the machine, an additional amount of water added in the chamber and the syringe kept there during the whole testing process in order to maintain the walls of the chambers in tension during the test. The water was used to fill the chambers because it is known to no dissipate energy and thus making us be sure that the dissipations provided by the test are from the material used for the chambers. The zeros displacement and force were set, as well as the initial phase for the test set at 90° because we want to compress the sample so we start with the higher value of the sine function which is equal to 1 at 90°. The amplitude of the oscillatory strain was set to 15%. Here the camera is not used because the test zone was regularly shaped and the walls maintained in radial tension owed to the water filled in. Thus the feedback when setting the strain amplitude was not needed because it was evidence that the set amplitude was the one that was really applied in the test zone. The cycle time was set to 0,02s. The samples were then tested with an oscillatory compressive strain at three different frequencies four variable number of
Characterization of viscoelastic properties of PDMS silicon rubbers Luc Gervais Mbida
7
cycles (from 30 for low frequencies, up to 100 for high frequencies). Data are finally registered and saved for the subsequent analysis
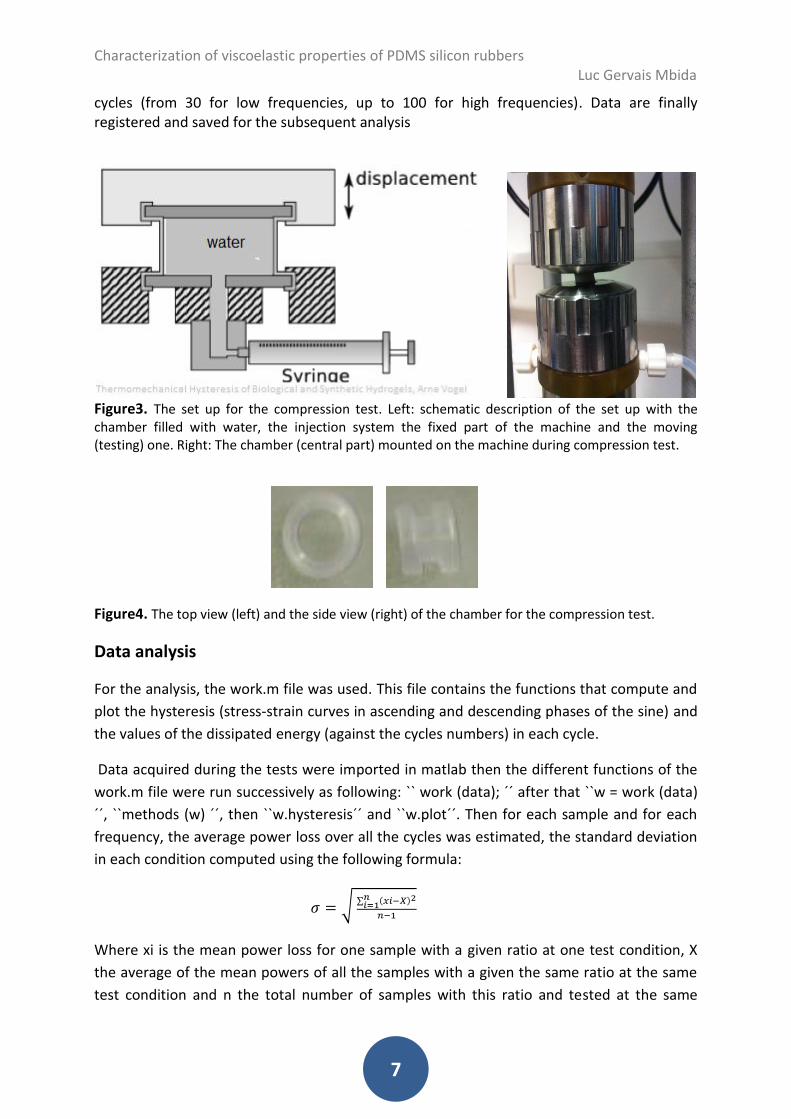
Figure3. The set up for the compression test. Left: schematic description of the set up with the chamber filled with water, the injection system the fixed part of the machine and the moving (testing) one. Right: The chamber (central part) mounted on the machine during compression test.
Figure4. The top view (left) and the side view (right) of the chamber for the compression test.
Data analysis
For the analysis, the work.m file was used. This file contains the functions that compute and
plot the hysteresis (stress-strain curves in ascending and descending phases of the sine) and
the values of the dissipated energy (against the cycles numbers) in each cycle.
Data acquired during the tests were imported in matlab then the different functions of the
work.m file were run successively as following: `` work (data); ´´ after that ``w = work (data)
´´, ``methods (w) ´´, then ``w.hysteresis´´ and ``w.plot´´. Then for each sample and for each
frequency, the average power loss over all the cycles was estimated, the standard deviation
in each condition computed using the following formula:
Where xi is the mean power loss for one sample with a given ratio at one test condition, X
the average of the mean powers of all the samples with a given the same ratio at the same
test condition and n the total number of samples with this ratio and tested at the same
Characterization of viscoelastic properties of PDMS silicon rubbers Luc Gervais Mbida
8
conditions. The volumes of the samples (volume between the two outer marks for the
shouldered bar and volume of the ventral part of the chamber) were then computed and the
volumic dissipations were finally calculated by dividing the energy dissipated by the volume.
Histograms were then plotted using the excel software to show the effect of the change of
composition ratios or the polymerization temperature on the power dissipation on our
material.
RESULTS AND DISCUSSION
Samples preparation
For the for ratios (1:5; 1:10; 1:15 and 1:20) selected for this work for the different
temperature of hardening (room temperature; 37°C and 70°C), 15 shouldered bars and 28
chambers were casted. But all the 15 shouldered bars were demolded successfully and only
7 chambers. This corresponds to a recovery percentage of 100% for shouldered bars and
25% for the encapsulation chambers. This difference could be explained by difference in the
thickness of the two types of samples and also the materials used to manufacture their
moulds. In fact the shouldered bars are 2mm thick and casted in mould made in steel while
the chambers walls are only 0.1mm thick and casted in mould made in polyurethane. It
seems that polyurethane which also an elastomer like our PDMS reacts more with the
injected material. Also any chamber was successfully demolded at polymerization
temperatures higher neither than 40°C nor for ratios lower than 1:10 (1:15 and 1:20). It
seems that for those ratios the hardener is so small that the crosslinking is low and thus
making the material difficult to handle. This is why it breaks when demolding. The lower
number of casted samples is due to the fact that only two moulds for shouldered bars and
six for encapsulation chambers were available. And the material was polymerized for an
average of three days each batch in order to be sufficiently stiff to be handled.
Tensile test
For the tensile test, after the data treatment on matlab, the stress (Force) – strain
(displacement) curves of the different samples were plotted. Here are some of them
(figure5)
Characterization of viscoelastic properties of PDMS silicon rubbers Luc Gervais Mbida
9
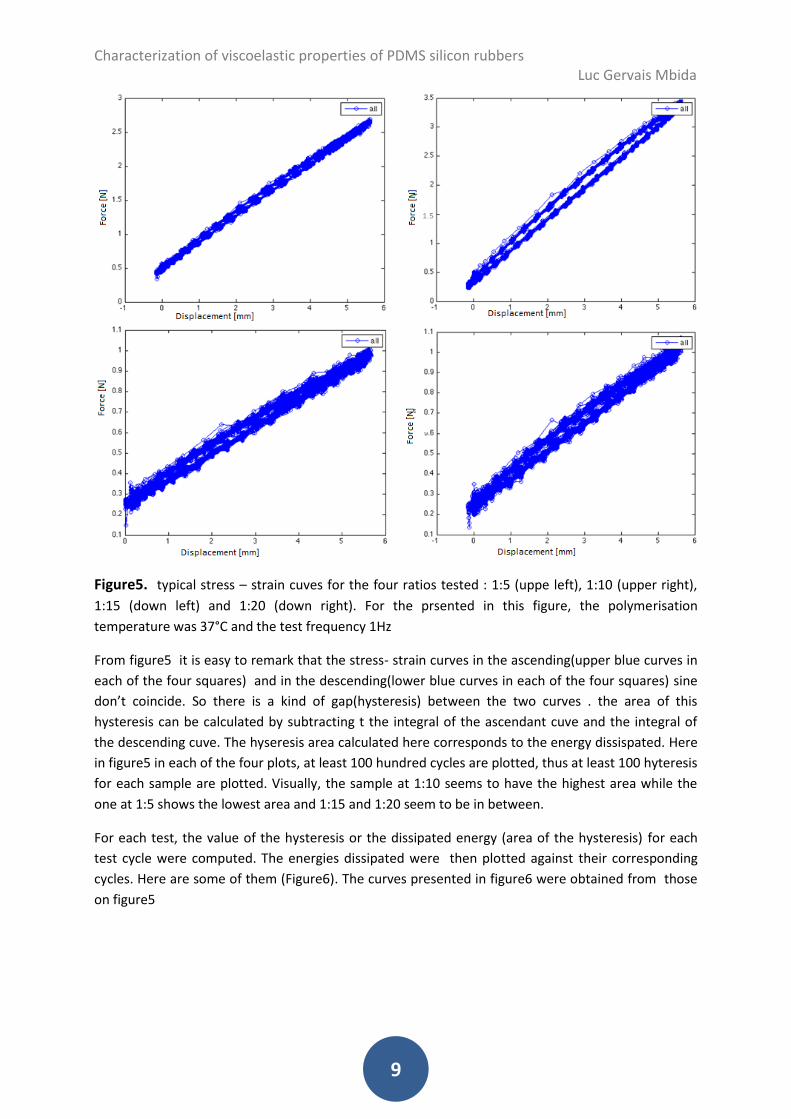
Figure5. typical stress – strain cuves for the four ratios tested : 1:5 (uppe left), 1:10 (upper right),
1:15 (down left) and 1:20 (down right). For the prsented in this figure, the polymerisation
temperature was 37°C and the test frequency 1Hz
From figure5 it is easy to remark that the stress- strain curves in the ascending(upper blue curves in
each of the four squares) and in the descending(lower blue curves in each of the four squares) sine
don’t coincide. So there is a kind of gap(hysteresis) between the two curves . the area of this
hysteresis can be calculated by subtracting t the integral of the ascendant cuve and the integral of
the descending cuve. The hyseresis area calculated here corresponds to the energy dissispated. Here
in figure5 in each of the four plots, at least 100 hundred cycles are plotted, thus at least 100 hyteresis
for each sample are plotted. Visually, the sample at 1:10 seems to have the highest area while the
one at 1:5 shows the lowest area and 1:15 and 1:20 seem to be in between.
For each test, the value of the hysteresis or the dissipated energy (area of the hysteresis) for each
test cycle were computed. The energies dissipated were then plotted against their corresponding
cycles. Here are some of them (Figure6). The curves presented in figure6 were obtained from those
on figure5
Characterization of viscoelastic properties of PDMS silicon rubbers Luc Gervais Mbida
10
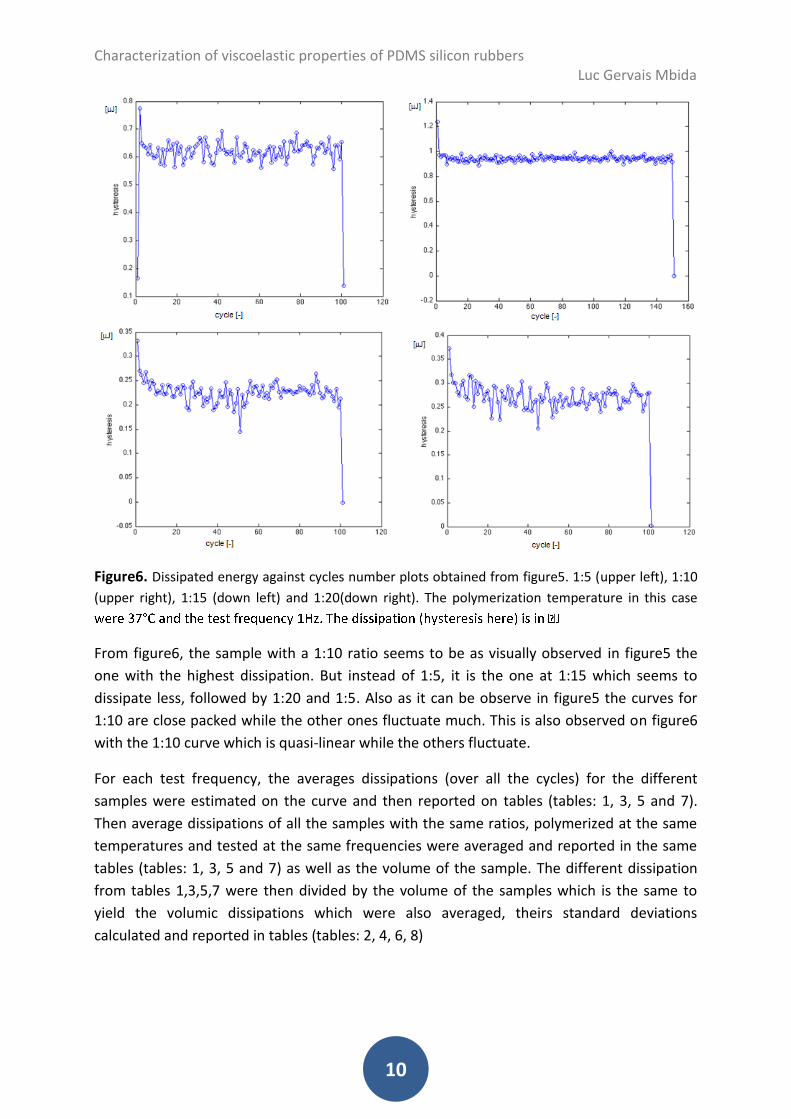
Figure6. Dissipated energy against cycles number plots obtained from figure5. 1:5 (upper left), 1:10
(upper right), 1:15 (down left) and 1:20(down right). The polymerization temperature in this case
From figure6, the sample with a 1:10 ratio seems to be as visually observed in figure5 the
one with the highest dissipation. But instead of 1:5, it is the one at 1:15 which seems to
dissipate less, followed by 1:20 and 1:5. Also as it can be observe in figure5 the curves for
1:10 are close packed while the other ones fluctuate much. This is also observed on figure6
with the 1:10 curve which is quasi-linear while the others fluctuate.
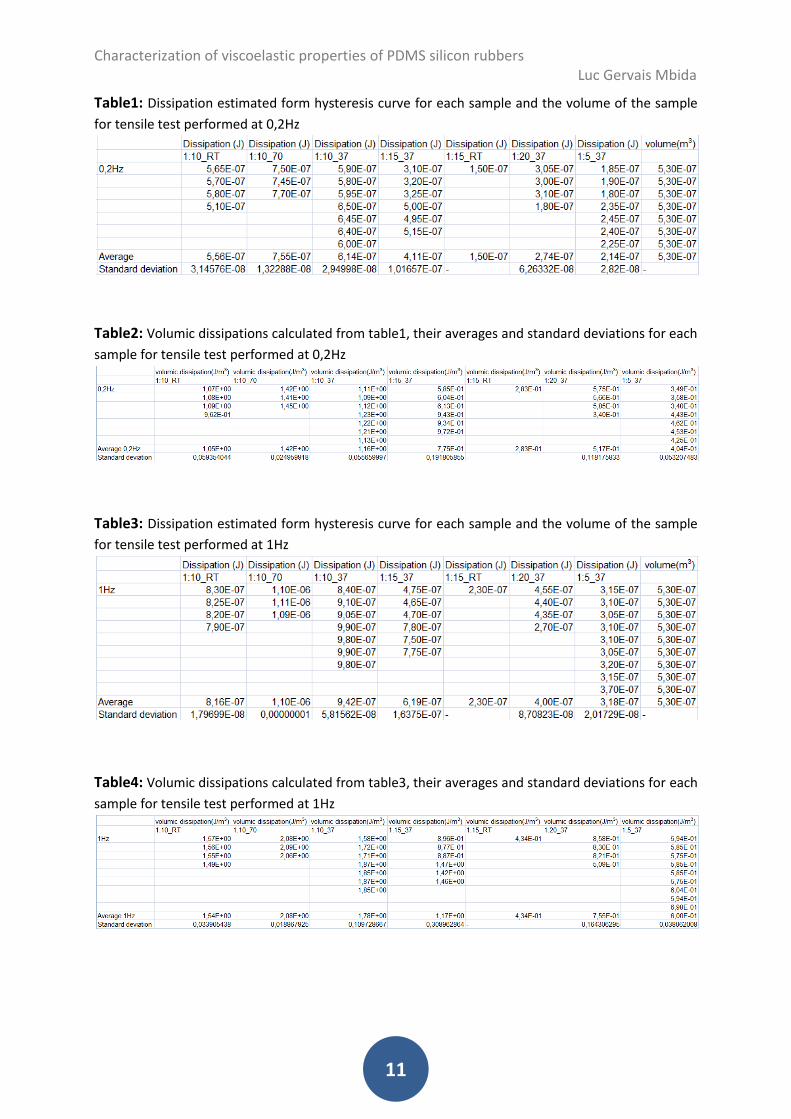
For each test frequency, the averages dissipations (over all the cycles) for the different
samples were estimated on the curve and then reported on tables (tables: 1, 3, 5 and 7).
Then average dissipations of all the samples with the same ratios, polymerized at the same
temperatures and tested at the same frequencies were averaged and reported in the same
tables (tables: 1, 3, 5 and 7) as well as the volume of the sample. The different dissipation
from tables 1,3,5,7 were then divided by the volume of the samples which is the same to
yield the volumic dissipations which were also averaged, theirs standard deviations
calculated and reported in tables (tables: 2, 4, 6, 8)
Characterization of viscoelastic properties of PDMS silicon rubbers Luc Gervais Mbida
11
Table1: Dissipation estimated form hysteresis curve for each sample and the volume of the sample
for tensile test performed at 0,2Hz
Table2: Volumic dissipations calculated from table1, their averages and standard deviations for each
sample for tensile test performed at 0,2Hz
Table3: Dissipation estimated form hysteresis curve for each sample and the volume of the sample
for tensile test performed at 1Hz
Table4: Volumic dissipations calculated from table3, their averages and standard deviations for each
sample for tensile test performed at 1Hz
Characterization of viscoelastic properties of PDMS silicon rubbers Luc Gervais Mbida
12
Table5: Dissipation estimated form hysteresis curve for each sample and the volume of the sample
for tensile test performed at 5Hz
Table6: Volumic dissipations calculated from table5, their averages and standard deviations for each
sample for tensile test performed at 5Hz
Table7: Dissipation estimated form hysteresis curve for each sample and the volume of the sample
for tensile test performed at 10Hz
Table8: Volumic dissipations calculated from table7, their averages and standard deviations for each
sample for tensile test performed at 10Hz
The tables 2, 4, 6, 8 were then used to plot the histograms (figure7) in order to show the
effect of the different parameters manipulated.
To show the crosslinker effect histograms were drawn for the different test frequencies
(figure 7) for samples prepared at the same temperature in order to avoid the interference
of another parameter.
Characterization of viscoelastic properties of PDMS silicon rubbers Luc Gervais Mbida
13
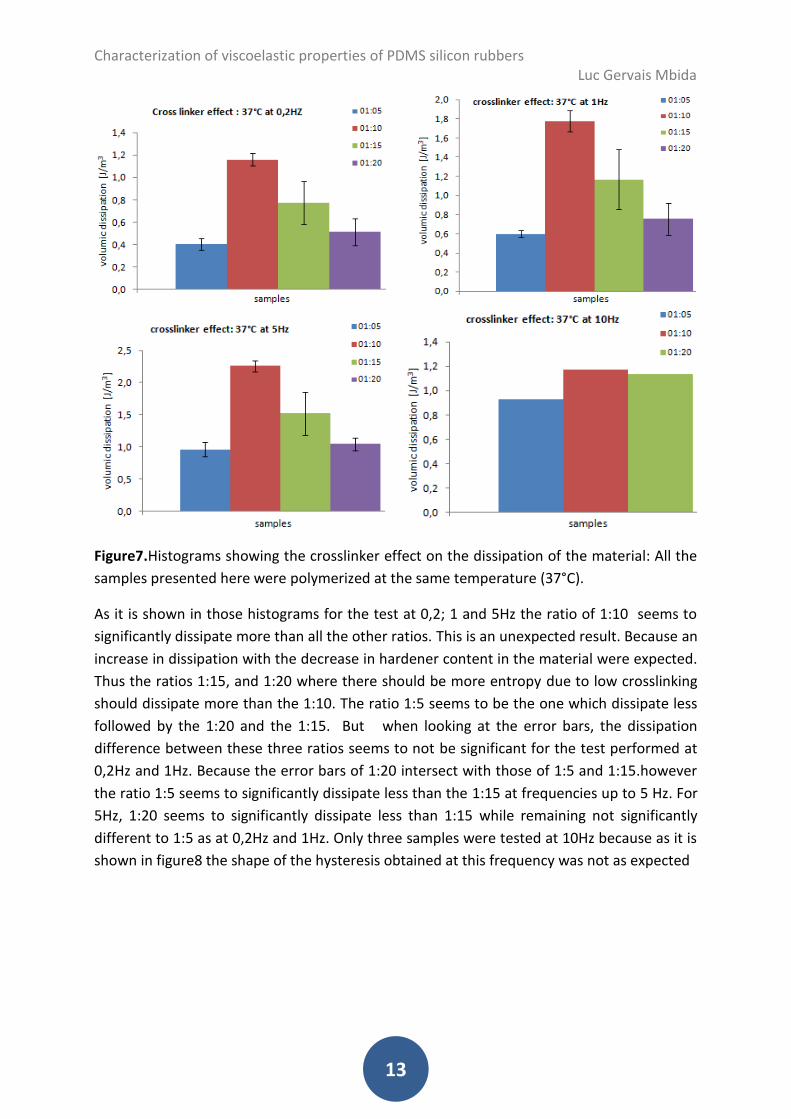
Figure7.Histograms showing the crosslinker effect on the dissipation of the material: All the
samples presented here were polymerized at the same temperature (37°C).
As it is shown in those histograms for the test at 0,2; 1 and 5Hz the ratio of 1:10 seems to
significantly dissipate more than all the other ratios. This is an unexpected result. Because an
increase in dissipation with the decrease in hardener content in the material were expected.
Thus the ratios 1:15, and 1:20 where there should be more entropy due to low crosslinking
should dissipate more than the 1:10. The ratio 1:5 seems to be the one which dissipate less
followed by the 1:20 and the 1:15. But when looking at the error bars, the dissipation
difference between these three ratios seems to not be significant for the test performed at
0,2Hz and 1Hz. Because the error bars of 1:20 intersect with those of 1:5 and 1:15.however
the ratio 1:5 seems to significantly dissipate less than the 1:15 at frequencies up to 5 Hz. For
5Hz, 1:20 seems to significantly dissipate less than 1:15 while remaining not significantly
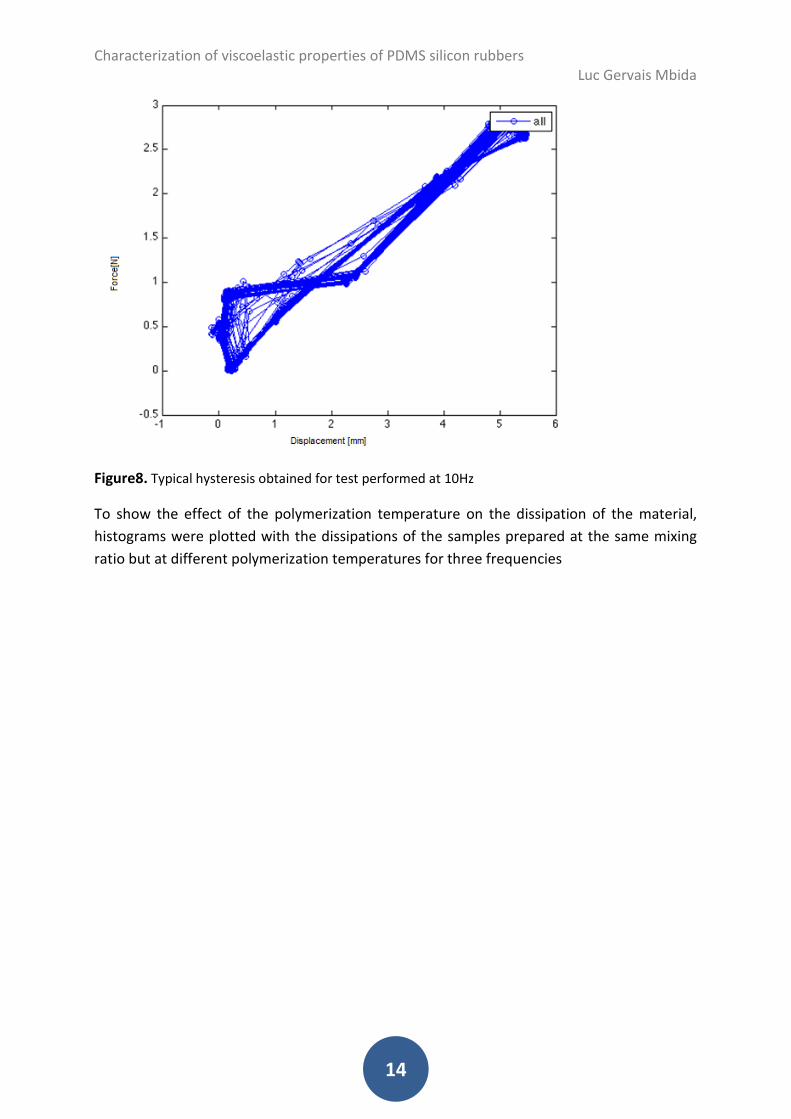
different to 1:5 as at 0,2Hz and 1Hz. Only three samples were tested at 10Hz because as it is
shown in figure8 the shape of the hysteresis obtained at this frequency was not as expected
Characterization of viscoelastic properties of PDMS silicon rubbers Luc Gervais Mbida
14
Figure8. Typical hysteresis obtained for test performed at 10Hz
To show the effect of the polymerization temperature on the dissipation of the material,
histograms were plotted with the dissipations of the samples prepared at the same mixing
ratio but at different polymerization temperatures for three frequencies
Characterization of viscoelastic properties of PDMS silicon rubbers Luc Gervais Mbida
15
Figure9. The effect of polymerization temperature on the dissipation of the material. All the samples
presented here were polymerized at the same ratio, 1:10 but different temperatures of
polymerization (Room temperature, 37°C and 70°C).
From the histograms above (figure9), at all the tested frequencies, the dissipation at 70°C
seems to be significantly higher than those at room temperature and 37°C but the
dissipations at room temperature and 37°C seem to be not significantly different. It seems
that a small increase in polymerization temperature doesn’t have any effect on the
dissipation (going from room temperature of around 25°C to 37°C). While after a certain
threshold the increase in polymerization begins to increase the dissipation (from room
temperature or 37°Cto 70°C). This might be explained by the fact that the elevated
temperature increases the entropy in the material. Thus the material polymerizing at high
temperatures polymerize in a disordered state that remains even after polymerization and
thus giving high dissipation values
By looking the crosslinker effect and the polymerization temperature effect histograms, it
can be seen that the testing frequency influences the dissipation. It is clear on the all those
histograms that, the increase in the test frequencies increases the dissipation of the
material. Thus the strain rate has an influence on the dissipation of the material. This might
be explained by the fact that at low frequencies the material deformed has enough time to
rearrange its molecules and thus there is less entropy when performing the following cycle.
Characterization of viscoelastic properties of PDMS silicon rubbers Luc Gervais Mbida
16
While at high frequencies the time to rearrange the molecules in the material between two
consecutive cycles is not enough and thus there is high entropy in the material in the next
cycle and high dissipation.
Compression test
For compression test the encapsulation chambers were used. The stress – strain curves were
plotted and hade the same shape as those shown in figure5. Then hysteresis were also
computed and plotted against their cycles numbers as in tensile test and those curves had
also the same shapes as those presented in figure6. As with the tensile test data the average
dissipations were estimated from the curves, the volume of the membrane of the tested
zone of the encapsulation chambers calculated. Finally the volumic dissipations were
calculated and reported in a table (table9). Here the averaged volumic dissipations and
standard deviations were not computed because we performed only on test for each
frequency and each sample. Only three samples were tested
Table9: Results obtained for compression tests.
From the table above (table9) one histogram was plotted to investigate the effect of the
crosslinker and the temperature on the dissipation of the encapsulation chambers.
Figure10. Histogram presenting the dissipations of the three chambers tested in compression and at
three frequencies
From figure, for the crosslinker effect, the trend observed with the tensile test seems to be
confirmed. In fact form to show the effect of the crosslinker, we can compare only the
Characterization of viscoelastic properties of PDMS silicon rubbers Luc Gervais Mbida
17
samples polymerized ate the same temperature: 1:5_37°C and 1:10_37°C. 1:5 seems to
dissipate less than 1:10 as observed in tensile.
For the polymerization temperature effect, only samples with the same mixing ratio should
be compared, thus 1:10_Room temperature and 1:10_37°C. But here rather than the
observation made in tensile test, the small increase in polymerization temperature (from
room temperature to 37°C) seems to increase the dissipation of the material. This might be
due to the thinness of the material membrane on the walls of the encapsulation device. By
combining the temperature and the crosslinker effect, the ratio at 1:10 polymerized at room
temperature seems to be the less dissipative. But those results are not significant because
only one test cycle was performed for each sample
The frequency increase seems to have the same effect on the dissipation as in tensile test.
As it increases, the dissipation increases also. And the material seems to dissipate more in
chambers walls than in shouldered bars. This might be due to the fact tests performed on
the two types of samples are different
CONCLUSION
As the dissipation considerations for materials properties are more and more needed, as the need of materials with less dissipation grows up, and due to the rather limited amount of published materials dissipation data. Our project focused on the characterization of the dissipation of the PDMS (Sylgard 184) for the potential use in fabrication of encapsulation chambers to be used when mechanically testing soft tissue and materials which are difficult to handle such as hydrogels. For this purpose different samples were prepared at different polymerization temperature and different mixing ratios between the Sylgard base and its hardener. Then tensile tests and compression tests were performed on the material. We observed that the 1:10 ratio which is the recommended one [8] and currently used is the ratio which dissipate the most. By decreasing or increasing the ratio, the material dissipated less energy. Increasing the polymerization temperature increased the dissipation of the material. The increase in strain rate showed also an increase in the dissipation of the material. The encapsulation chamber chambers were difficult to obtain with the used moulds. By now for our chambers and with our moulds the less dissipative chambers made were at the ratio of 1:10 at room temperature. The dissipations obtained with tensile test bar and with chambers were different but showed the same trend for crosslinker and temperature effects. But combining the two effects the less dissipative sample in tensile was 1:5 at 37°C which were different to the less dissipative chamber obtained. Due to the low number of samples used in this project, the observations made seem to be not consistent. They should be verified by testing a large library of samples and computing statistics. Our results are indicatives and we hope that they can serve as bases for further works on the designing of encapsulation chambers. Future research should focus on designing new molds (in another material) for the chambers or finding new materials that cloud be used in chambers instead of PDMS.
Characterization of viscoelastic properties of PDMS silicon rubbers Luc Gervais Mbida
18
ACKNOWLEDGMENTS
We gratefully thank to professor D. Pioletti who allows us to do this work in his laboratory,
to Mohamadreza Nassajian Moghadam who has supervised us and for his advises and finally
to all the LBO team for their kindness.
REFERENCES
[1]Mechanical properties of silicones for MEMS, F Schneider1, T Fellner2, JWilde2 and
UWallrabe1
[2]Viscoelasticity by Prof. Dominique P. Pioletti
[3 ]Evaluation of biocompatibility and mechanical behavior of polyurethane elastomers
based on chitin/1,4-butane diol blends, Khalid Mahmood Ziaa, Mohammad Zuberb,∗, Ijaz
Ahmad Bhattia, Mehdi Barikanic, Munir Ahmad Sheikha
[7]Thermomechanical Hysteresis of Biological and Synthetic Hydrogels: Theory, Characterization, and Development of a novel Deformation Calorimeter, Arne Vogel
[8] Dow Corning Product information sheet of Sylgard 184