Page 1
8/9/2019 Characterization of Warm Mix Asphalt (WMA) Performance in Differe
http://slidepdf.com/reader/full/characterization-of-warm-mix-asphalt-wma-performance-in-differe 1/247
Iowa State University
Digital Repository @ Iowa State University
Graduate Teses and Dissertations Graduate College
2012
Characterization of Warm Mix Asphalt (WMA)performance in dierent asphalt applicationsMohamed Hamada Rashwan Iowa State University , [email protected]
Page 2
8/9/2019 Characterization of Warm Mix Asphalt (WMA) Performance in Differe
http://slidepdf.com/reader/full/characterization-of-warm-mix-asphalt-wma-performance-in-differe 2/247
Characterization of Warm Mix Asphalt (WMA) performance in different asphalt
applications
by
Mohamed Hamada Rashwan
A dissertation submitted to the graduate faculty in partial fulfillment of the requirements for
the degree of
DOCTOR OF PHILOSPHY
Major: Civil Engineering (Geotechnical Engineering)
Program of Study Committee:
R. Christopher Williams, Major Professor
Fouad Fanous
Page 3
8/9/2019 Characterization of Warm Mix Asphalt (WMA) Performance in Differe
http://slidepdf.com/reader/full/characterization-of-warm-mix-asphalt-wma-performance-in-differe 3/247
Page 4
8/9/2019 Characterization of Warm Mix Asphalt (WMA) Performance in Differe
http://slidepdf.com/reader/full/characterization-of-warm-mix-asphalt-wma-performance-in-differe 4/247
Page 5
8/9/2019 Characterization of Warm Mix Asphalt (WMA) Performance in Differe
http://slidepdf.com/reader/full/characterization-of-warm-mix-asphalt-wma-performance-in-differe 5/247
iv
CHAPTER 4 PERFORMANCE EVALUATION OF LAB WARM MIXASPHALT MIXES INCORPORATING RAP USING
MEPDG……………………………………………………………..……71
4.1 Abstract………………………………………………………………….. .71
4.2 Introduction……………………………………………………………….72
4.2.1 Mechanistic-Empirical Pavement Design Guide…………...……………74
4.2.2 Objective……………………………………………………...………….74
4.3 Experimental Plan……………………………………………..…………74
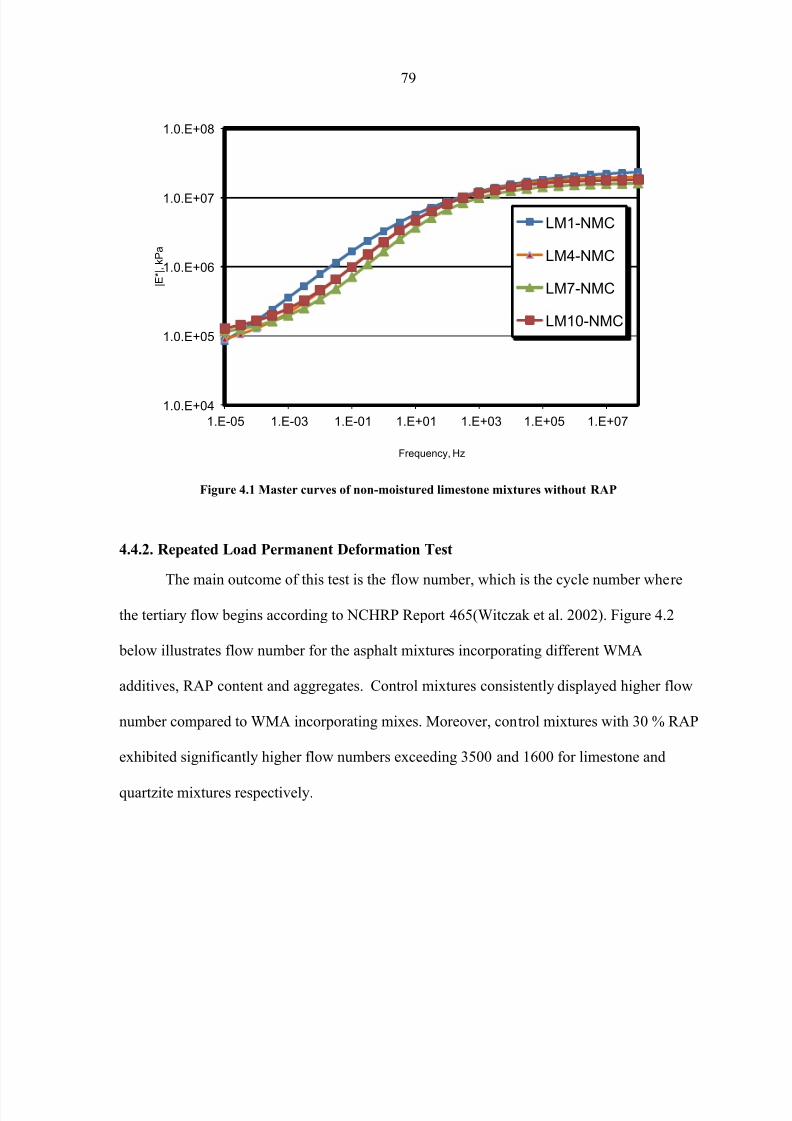
4.4 Results and Analysis…………………………………………….……….78
4.4.1 Dynamic Modulus………………………………………….…………… .78
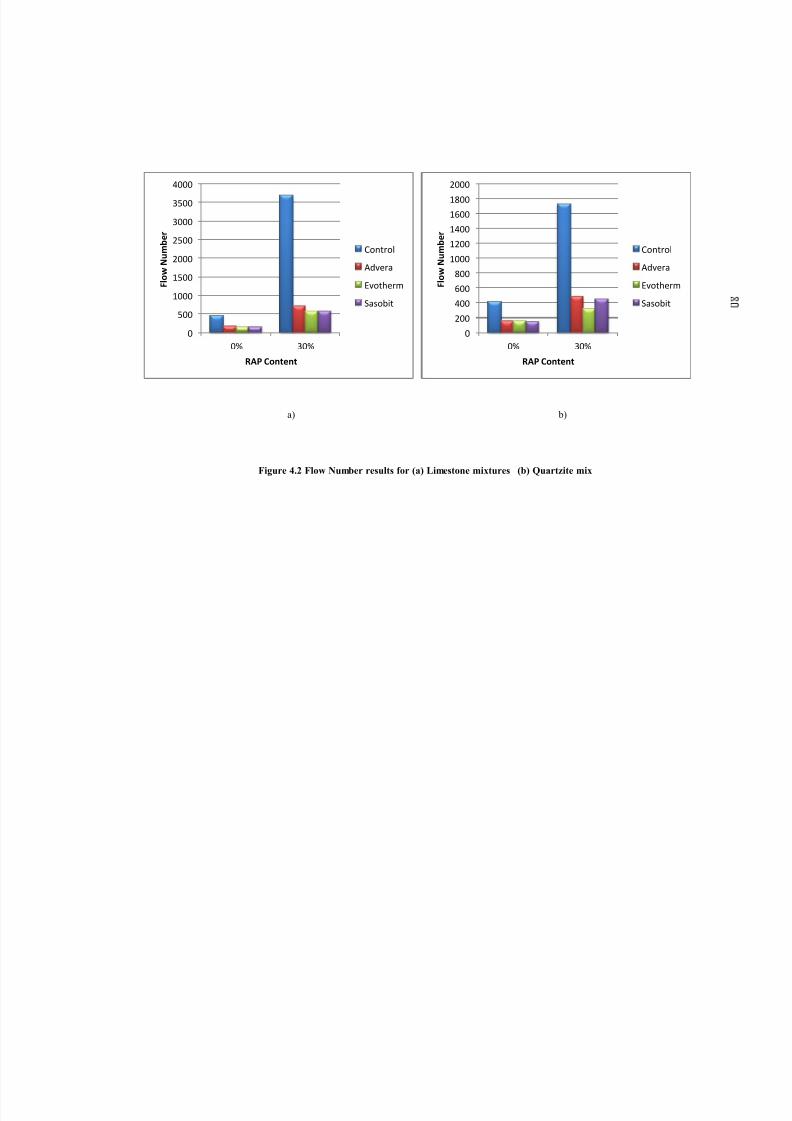
4.4.2 Repeated Load Permanent Deformation Test …………………...……...79
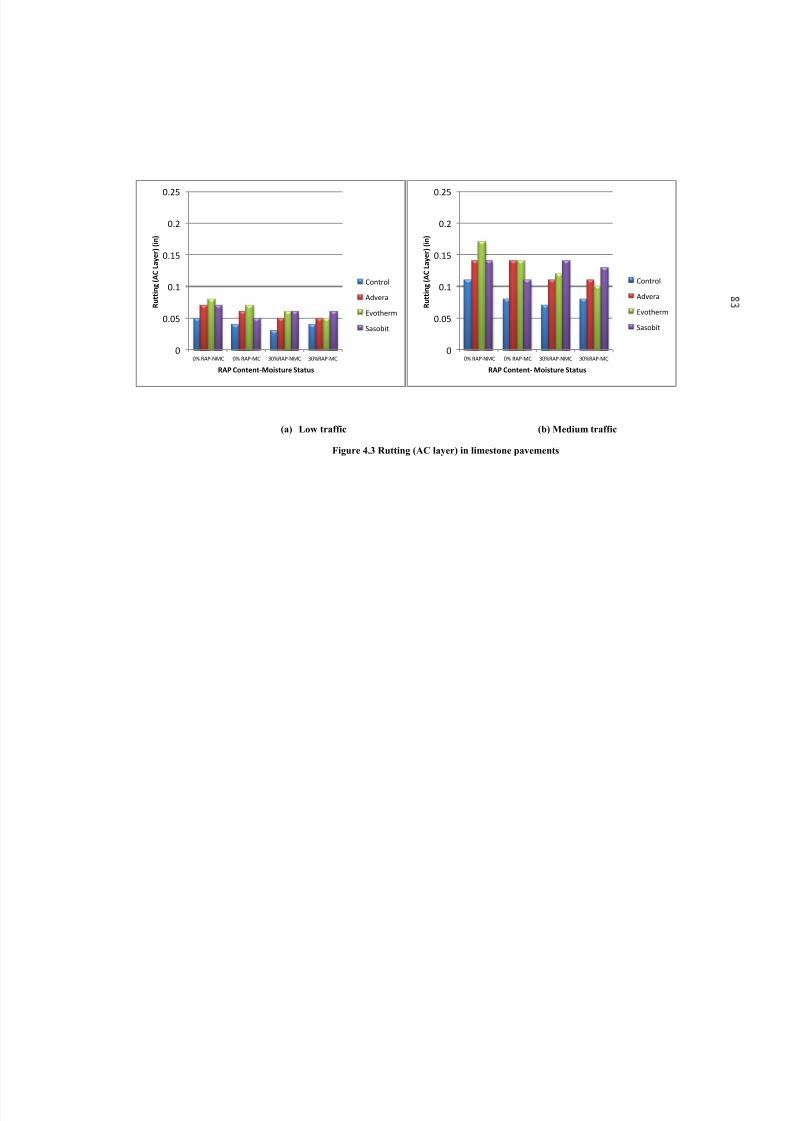
4.4.3 MEPDG Runs Output…………………………………………………....81
4.4.4 Statistical Analysis……………………………………………………… .88
4.5 Conclusions and Recommendations……………………………………..92
4.6 References…………………………………………………….………….93
CHAPTER 5 EVALUATION OF THE RHEOLOGICAL PROPERTIESOF POLYMER MODIFIED WARM MIX ASPHALT
BINDER 96
Page 6
8/9/2019 Characterization of Warm Mix Asphalt (WMA) Performance in Differe
http://slidepdf.com/reader/full/characterization-of-warm-mix-asphalt-wma-performance-in-differe 6/247
v
5.4.6 Creep......................................................................................................110
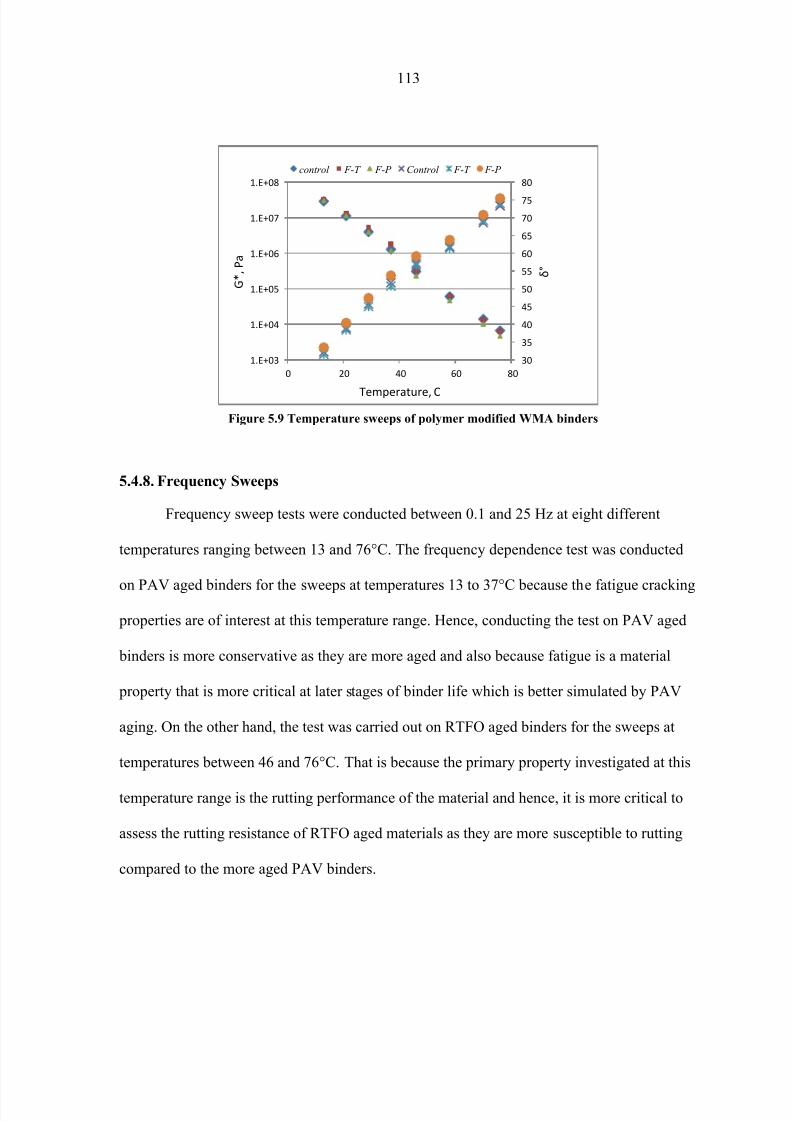
5.4.7 Temperature Sweeps..............................................................................111
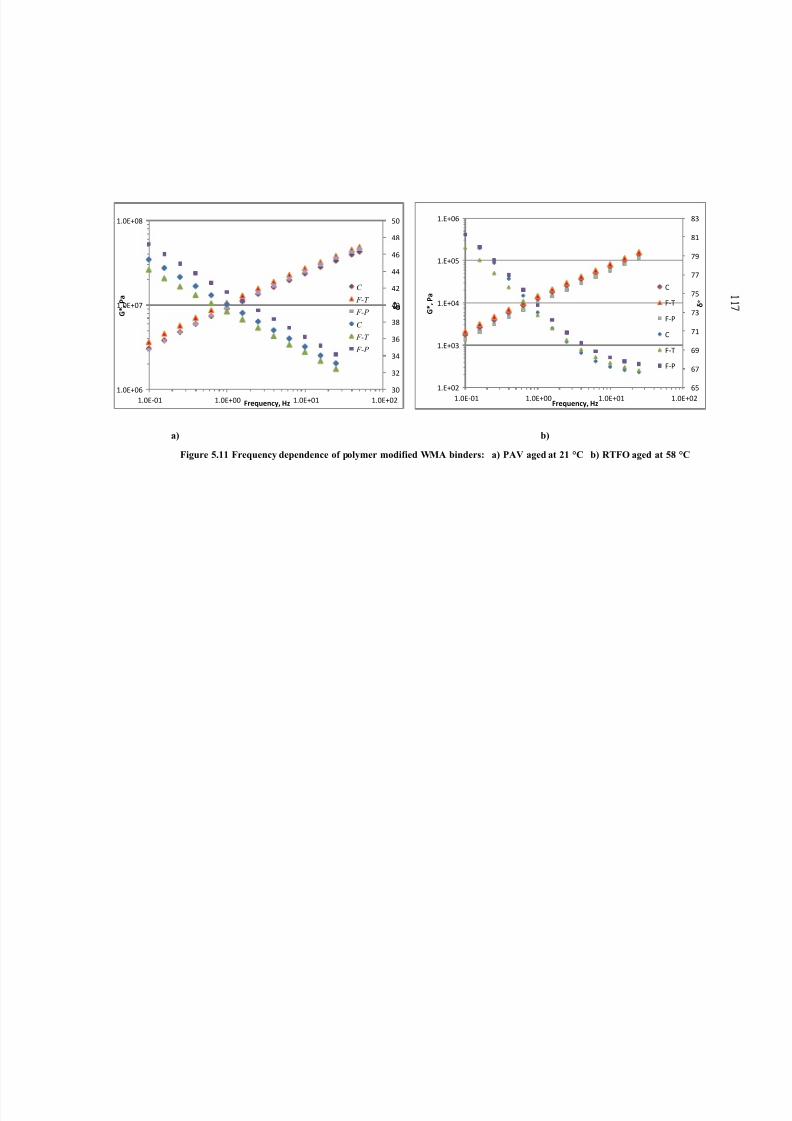
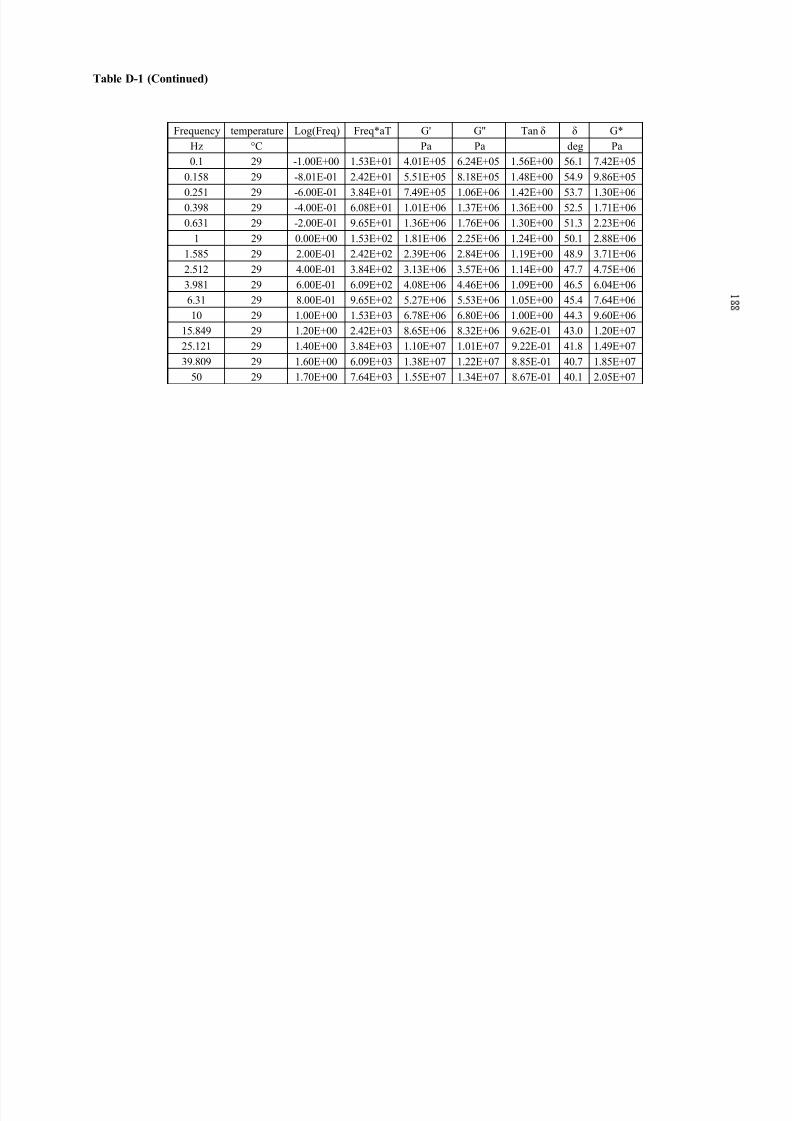
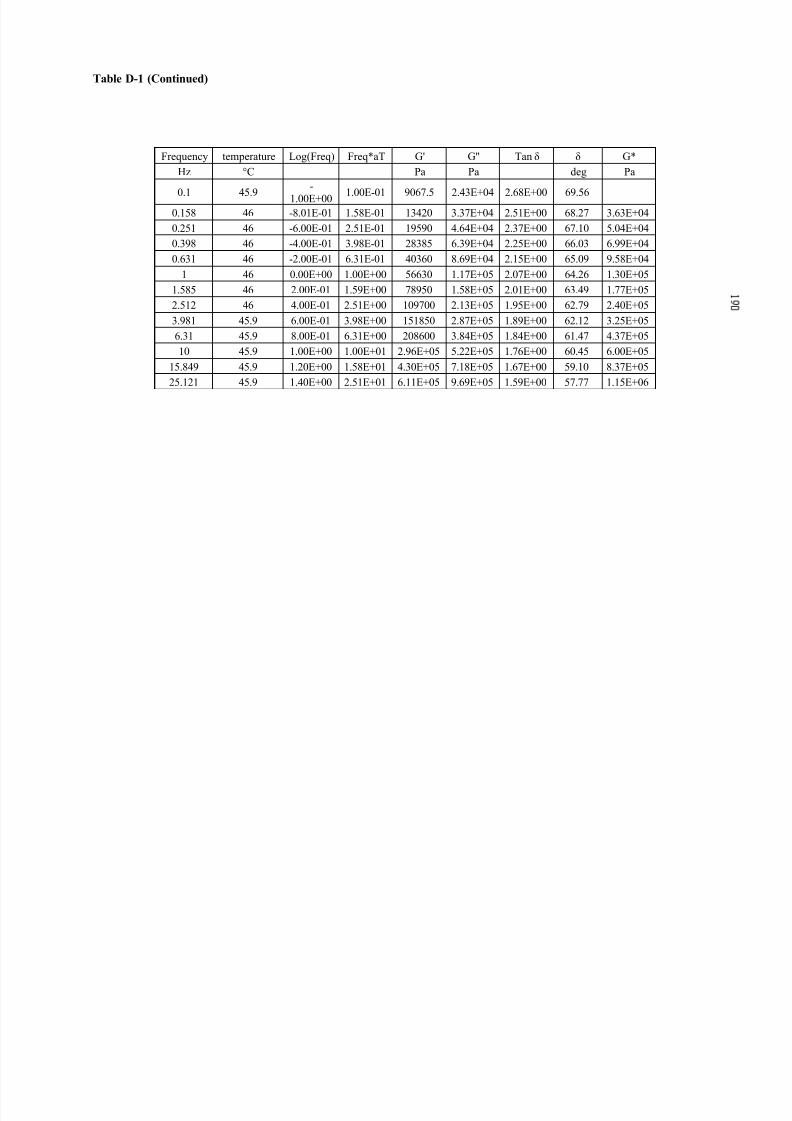
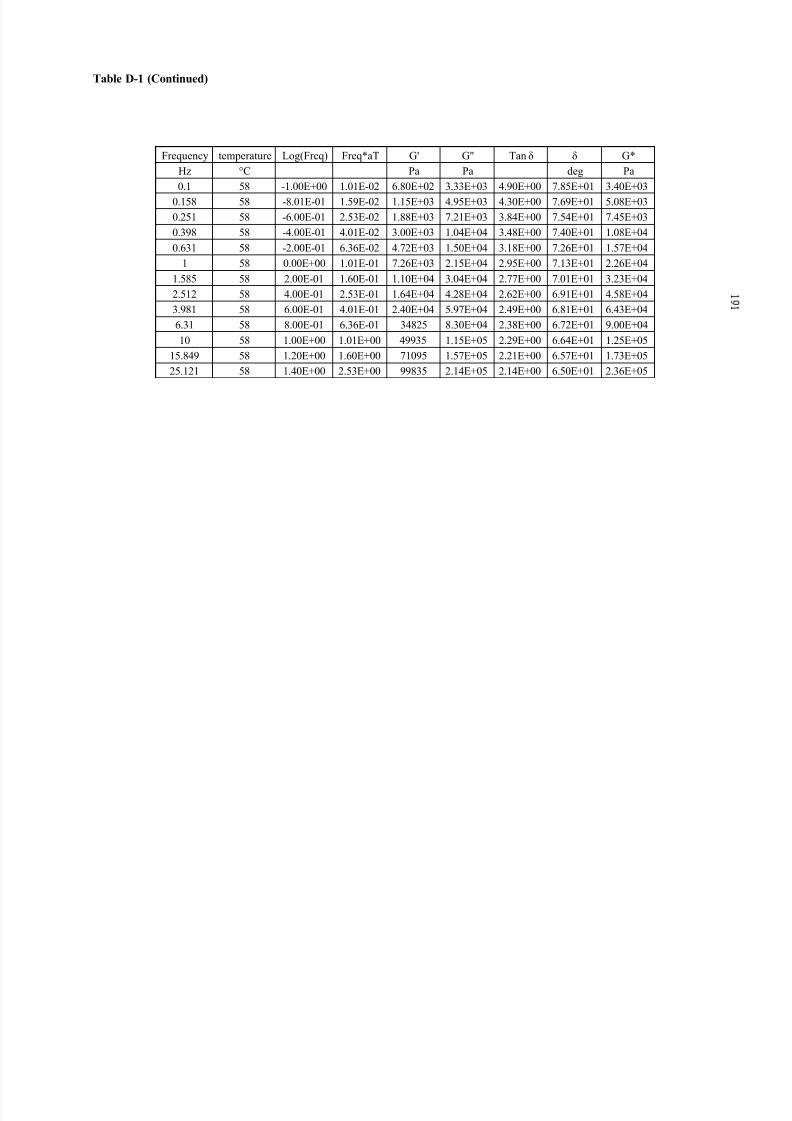
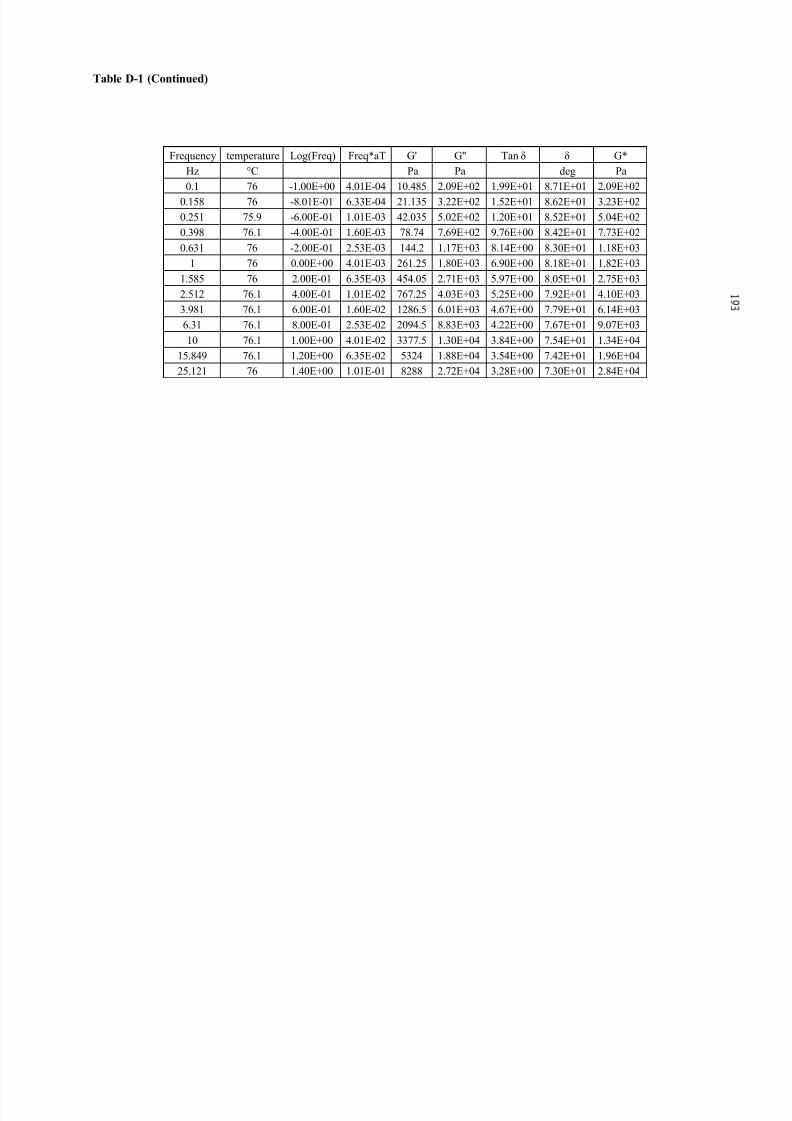
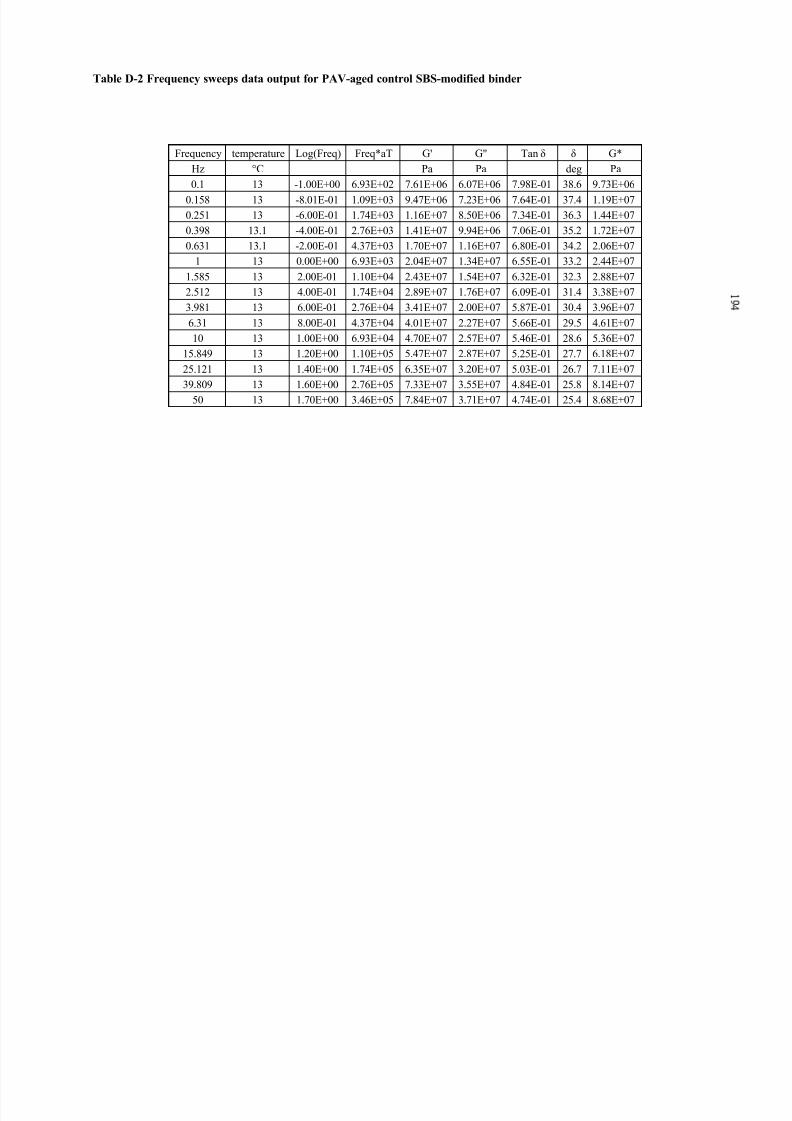
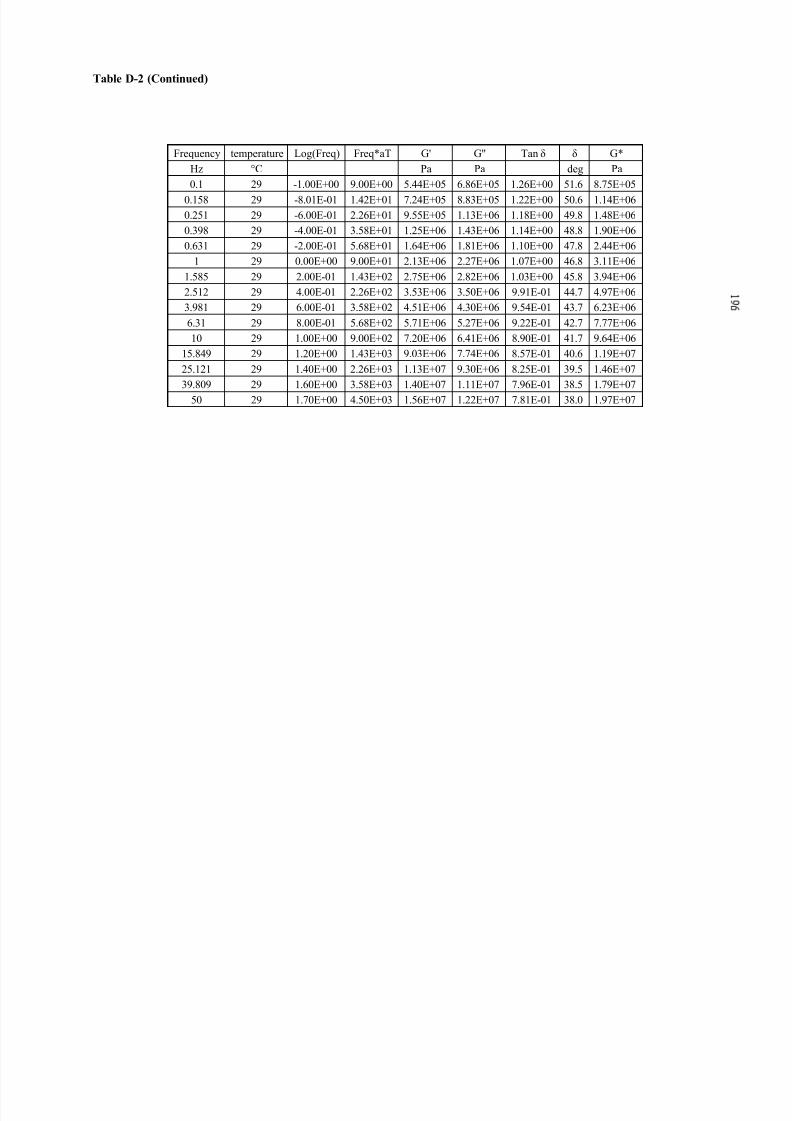
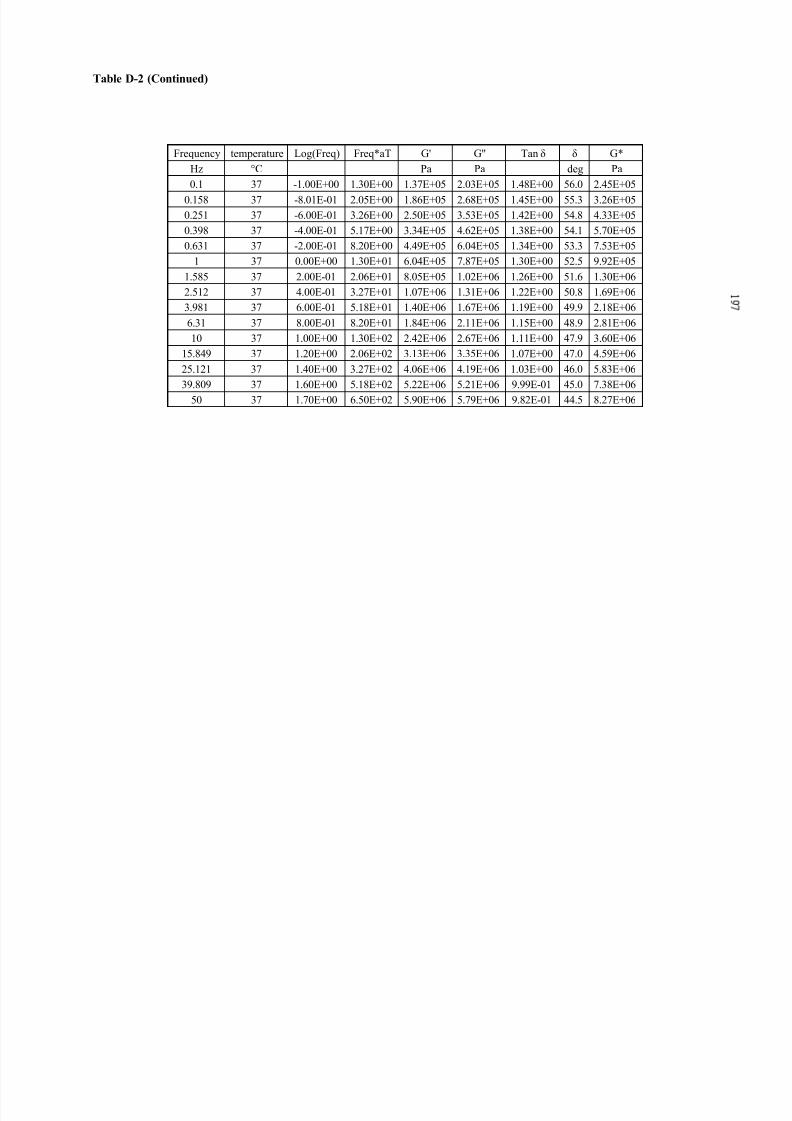
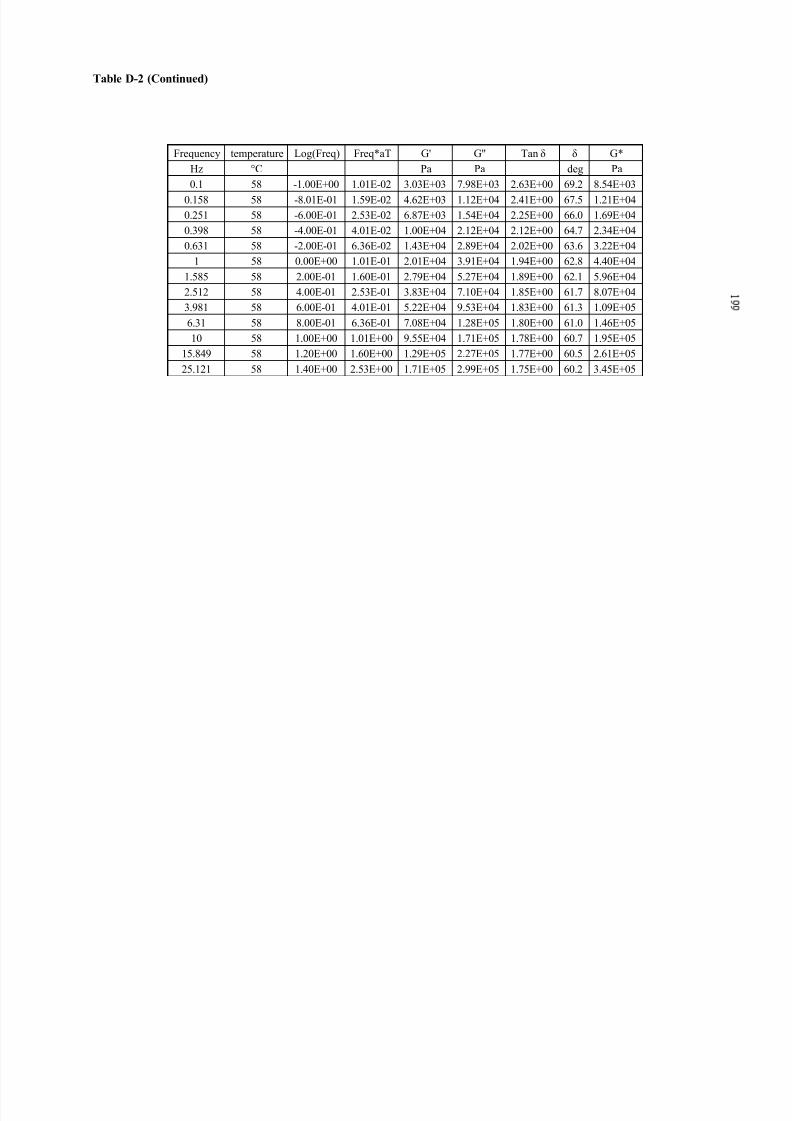
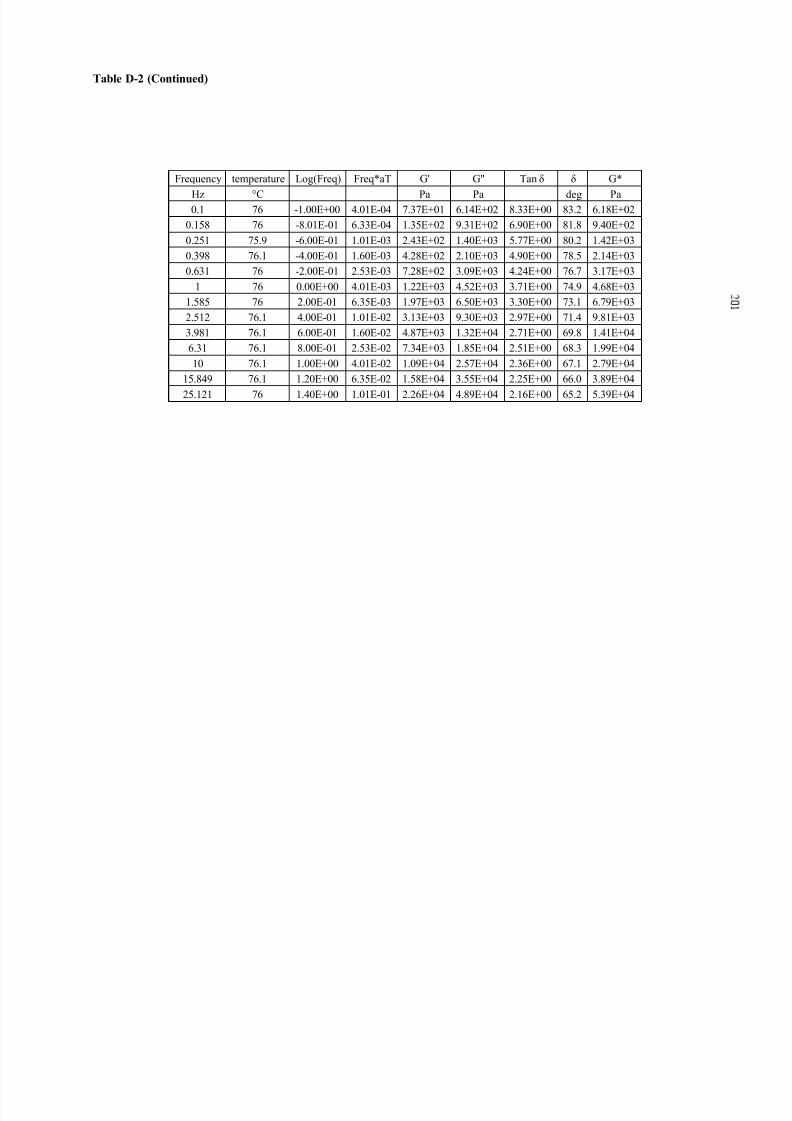
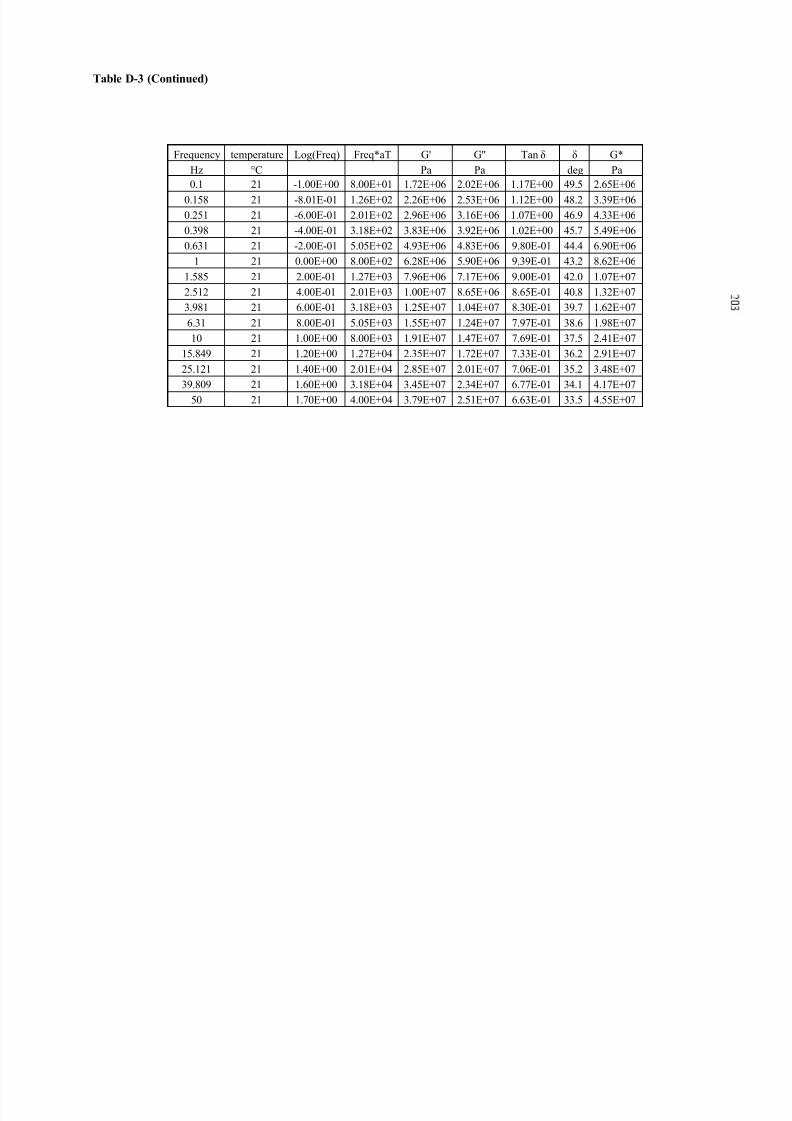
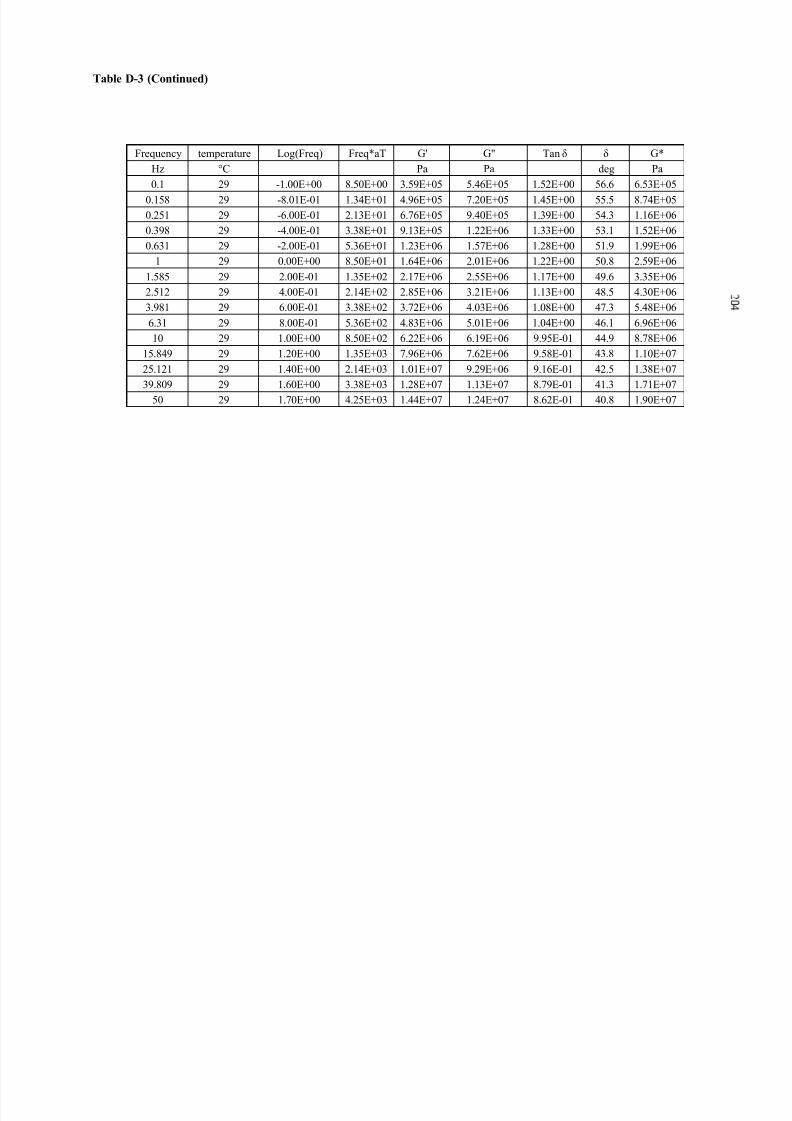
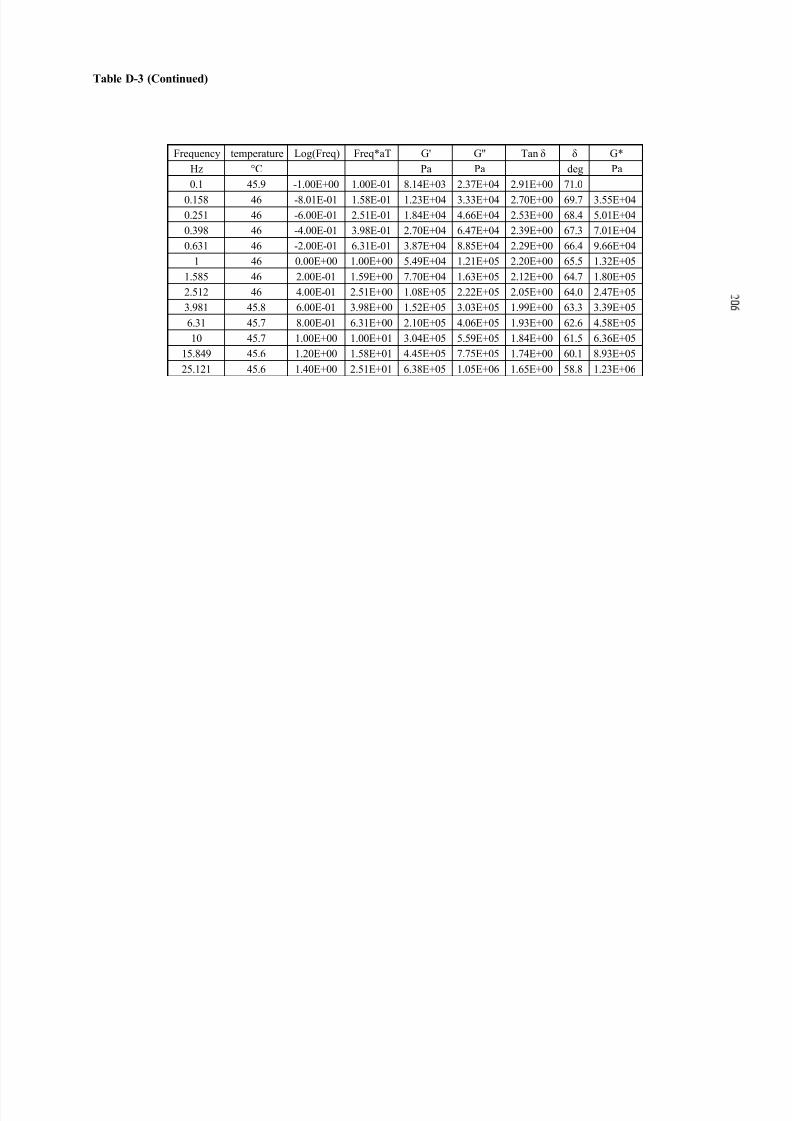
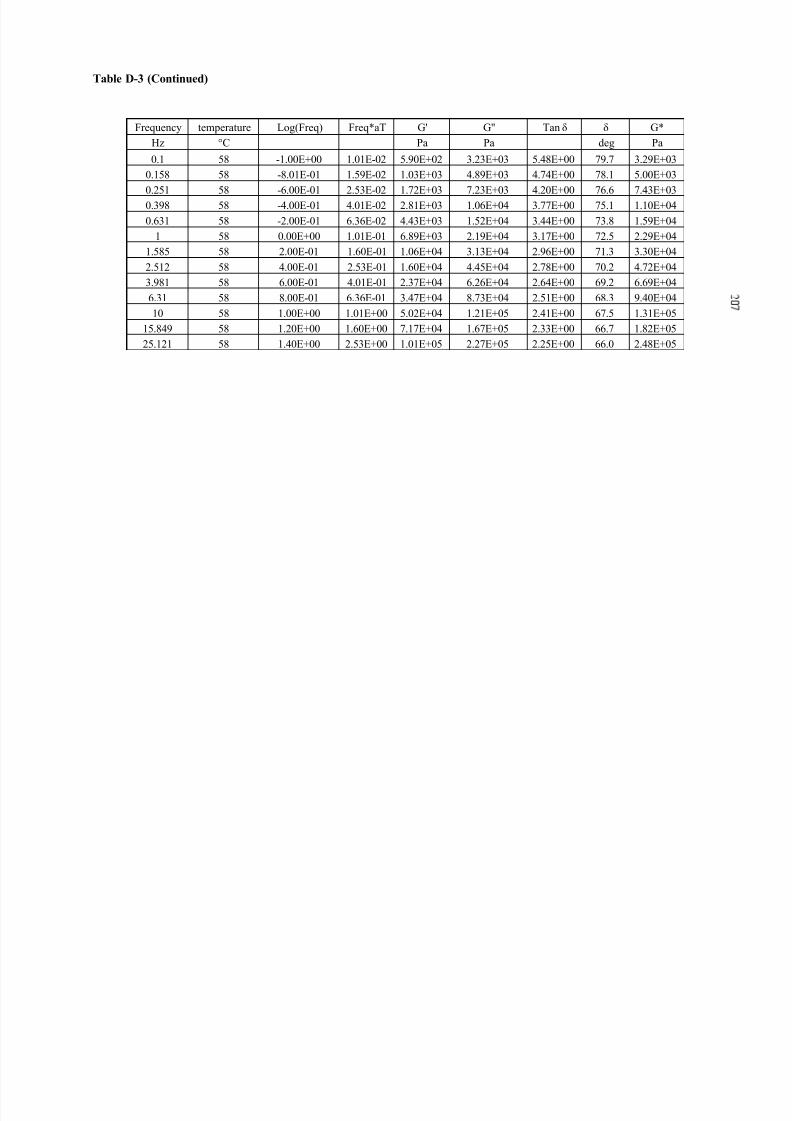
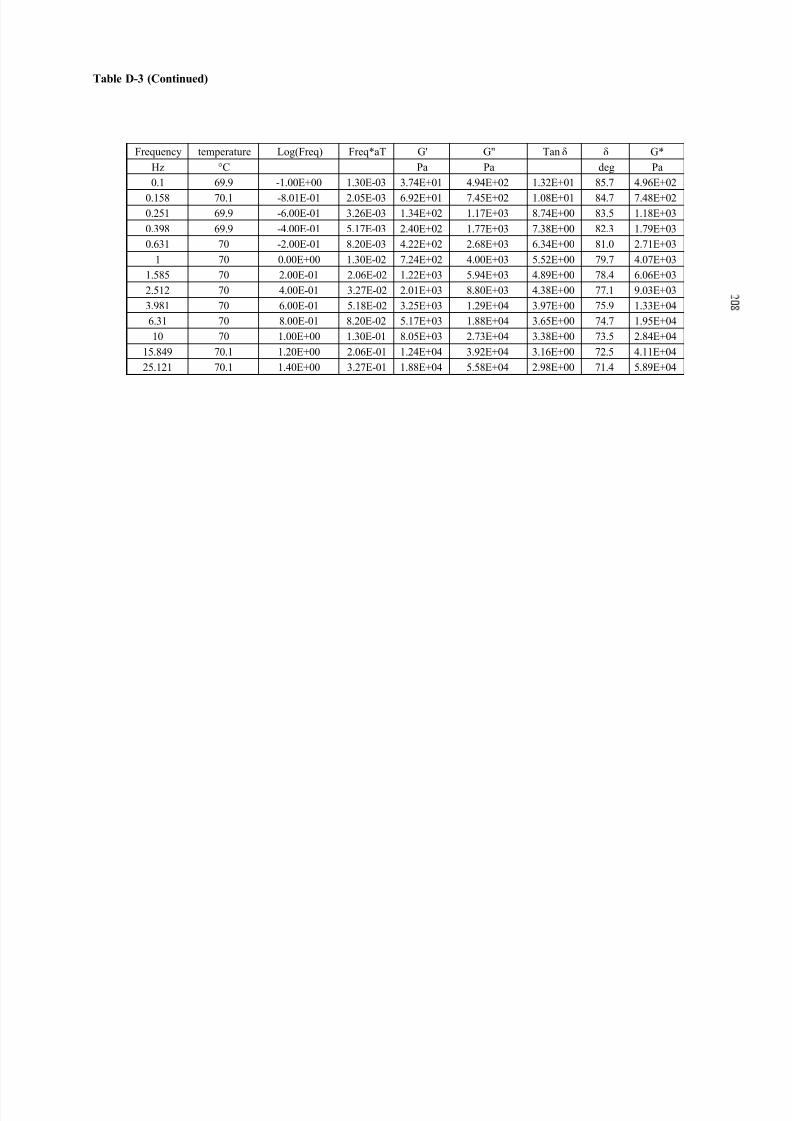
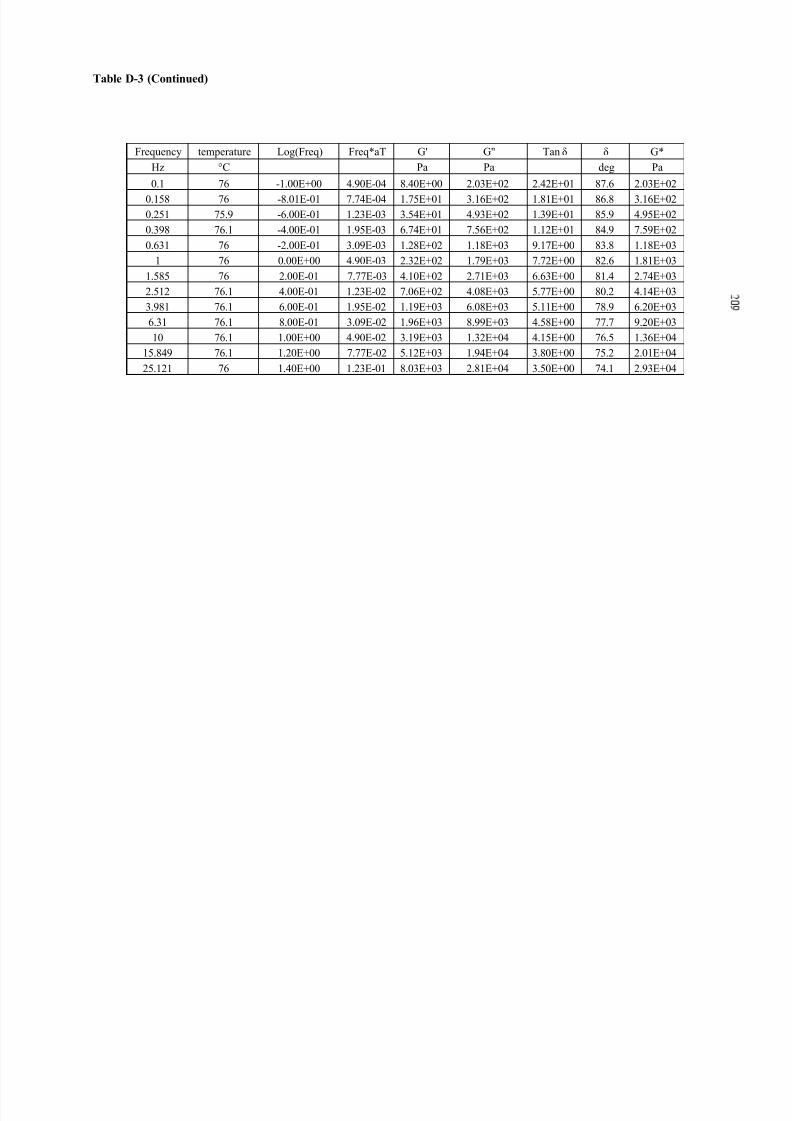
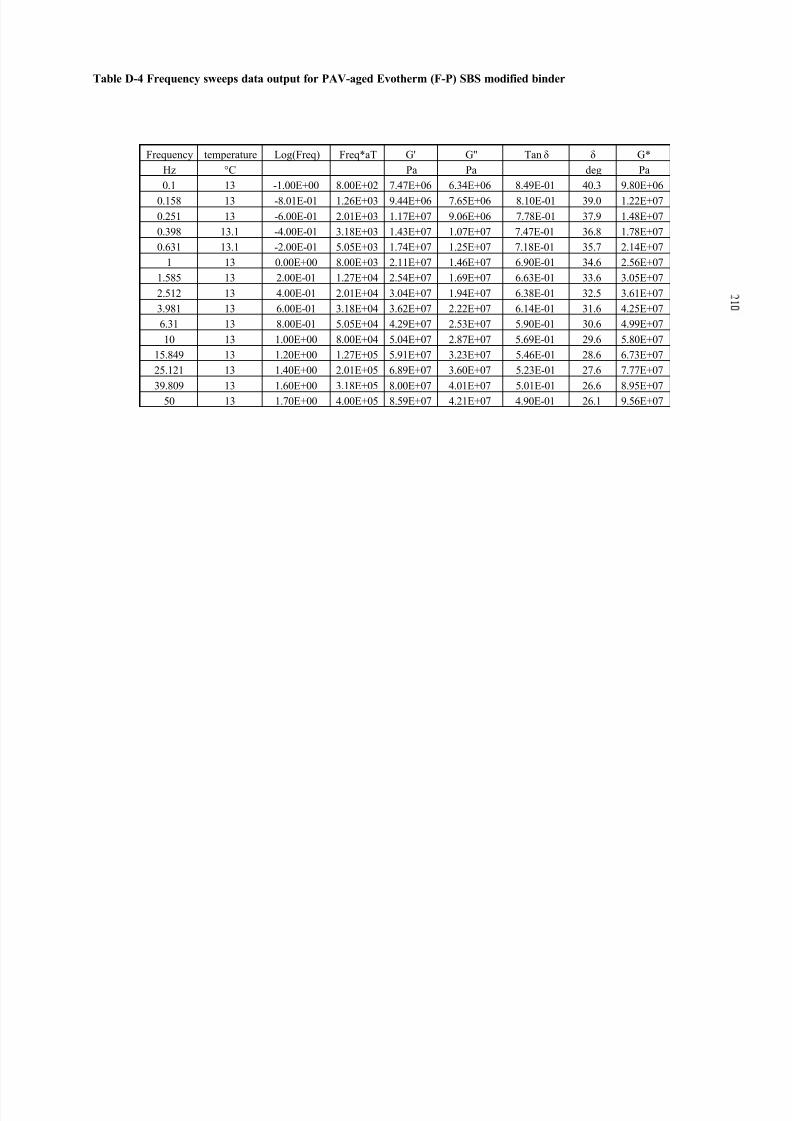
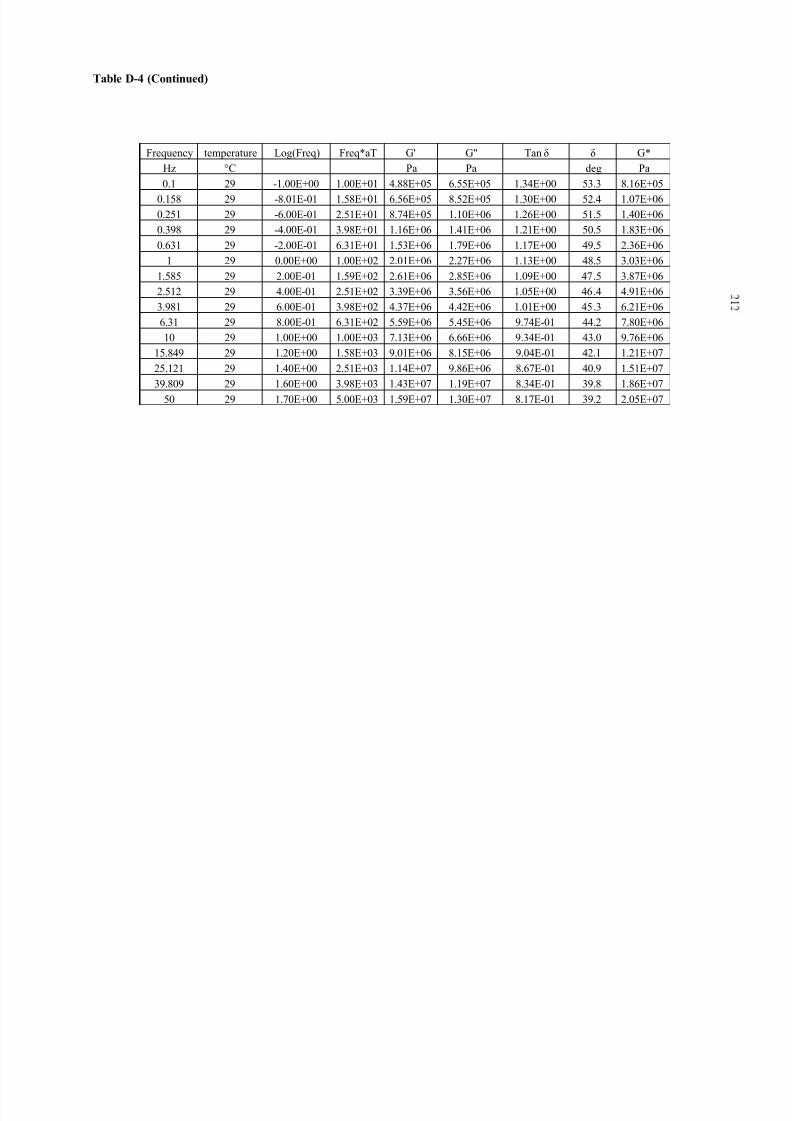
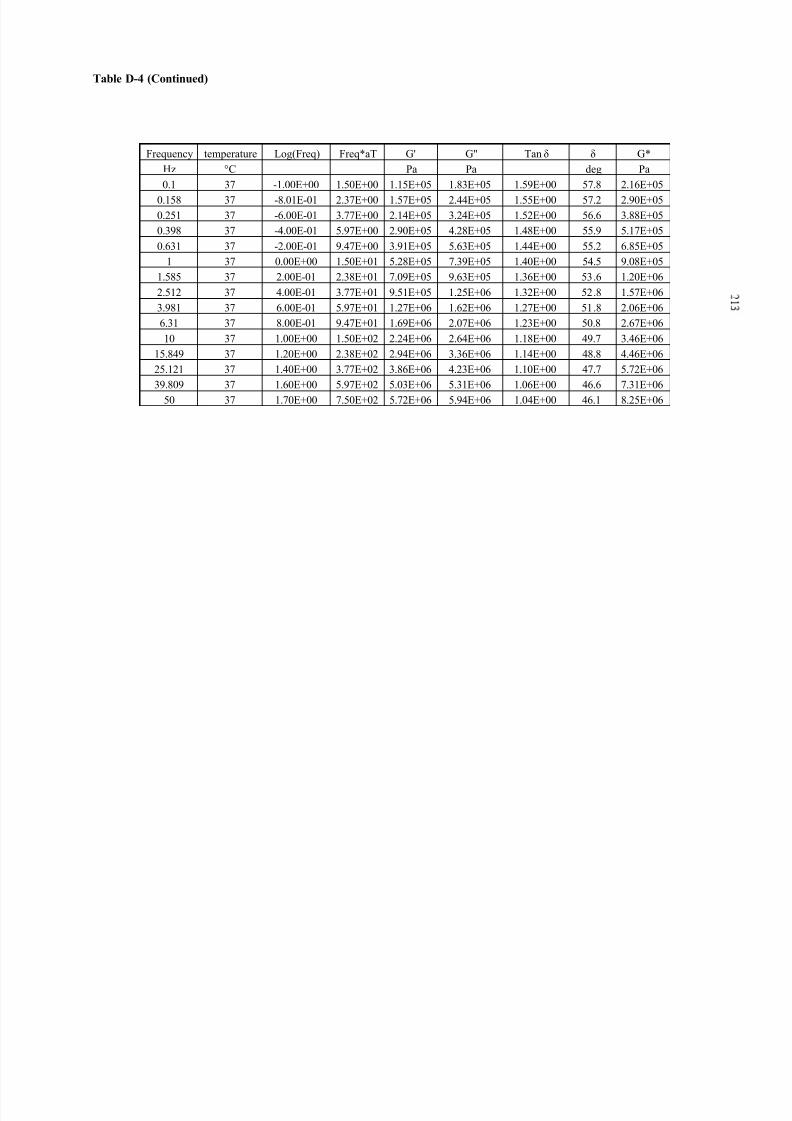
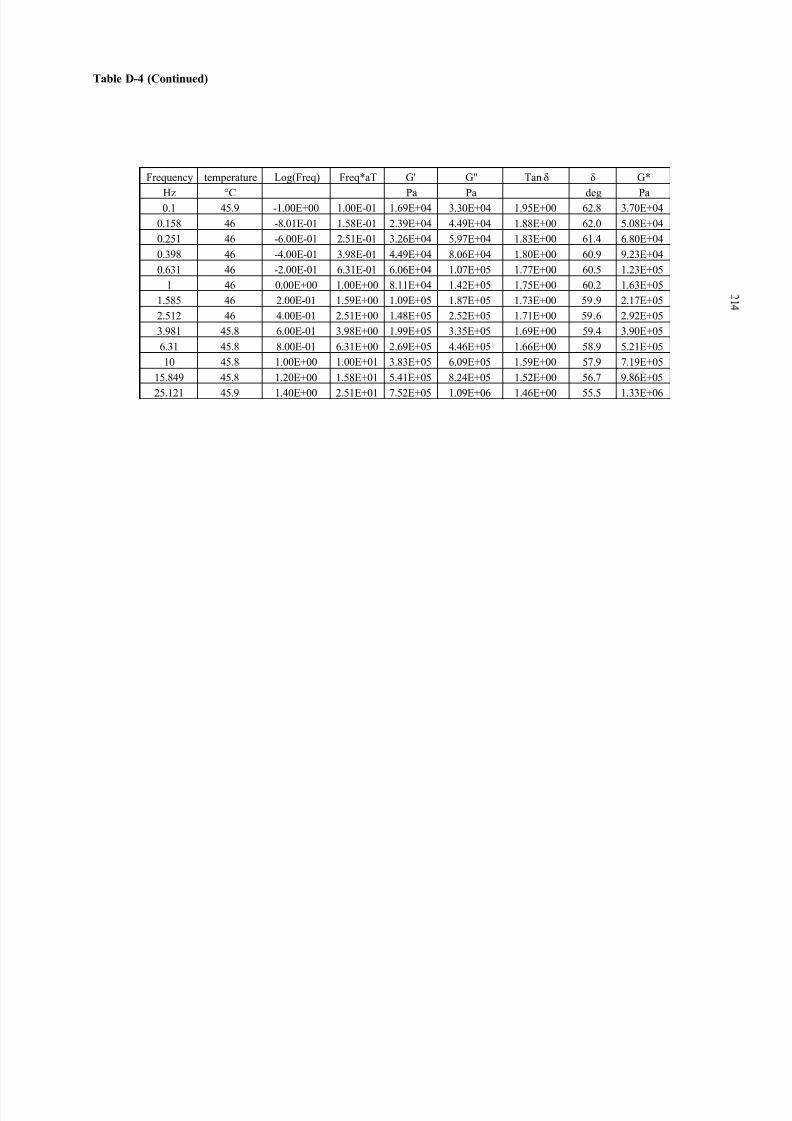
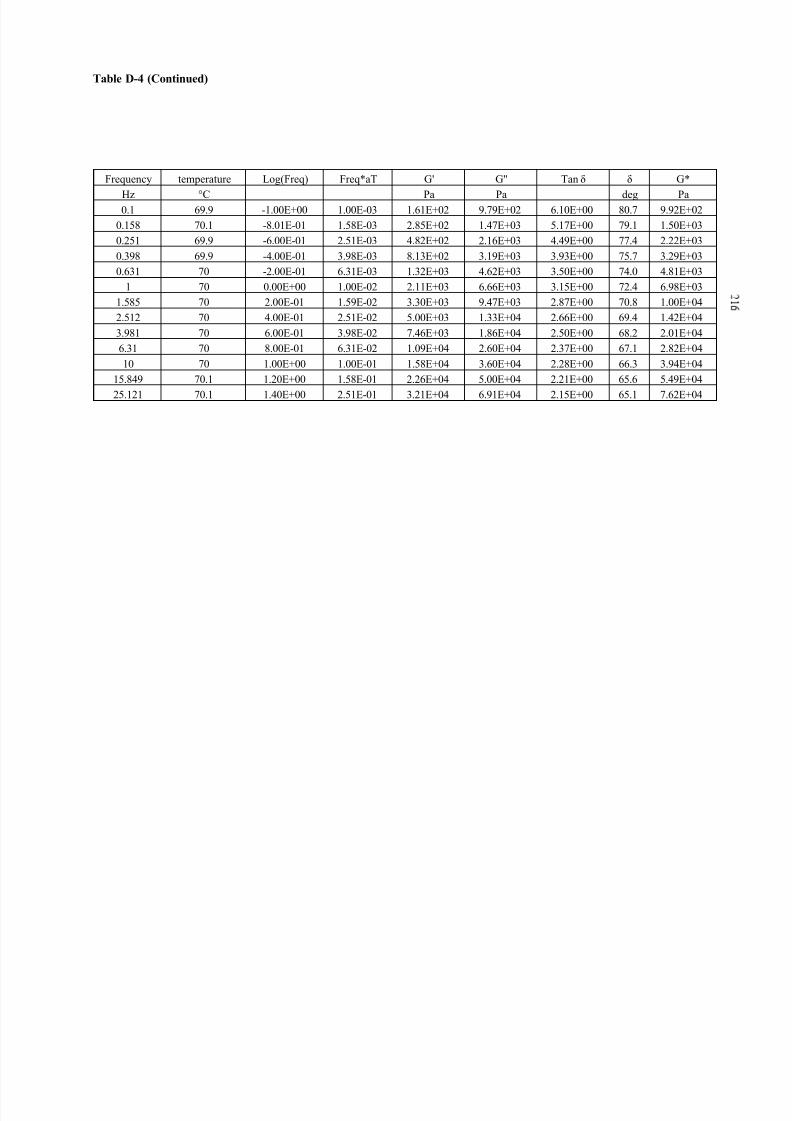
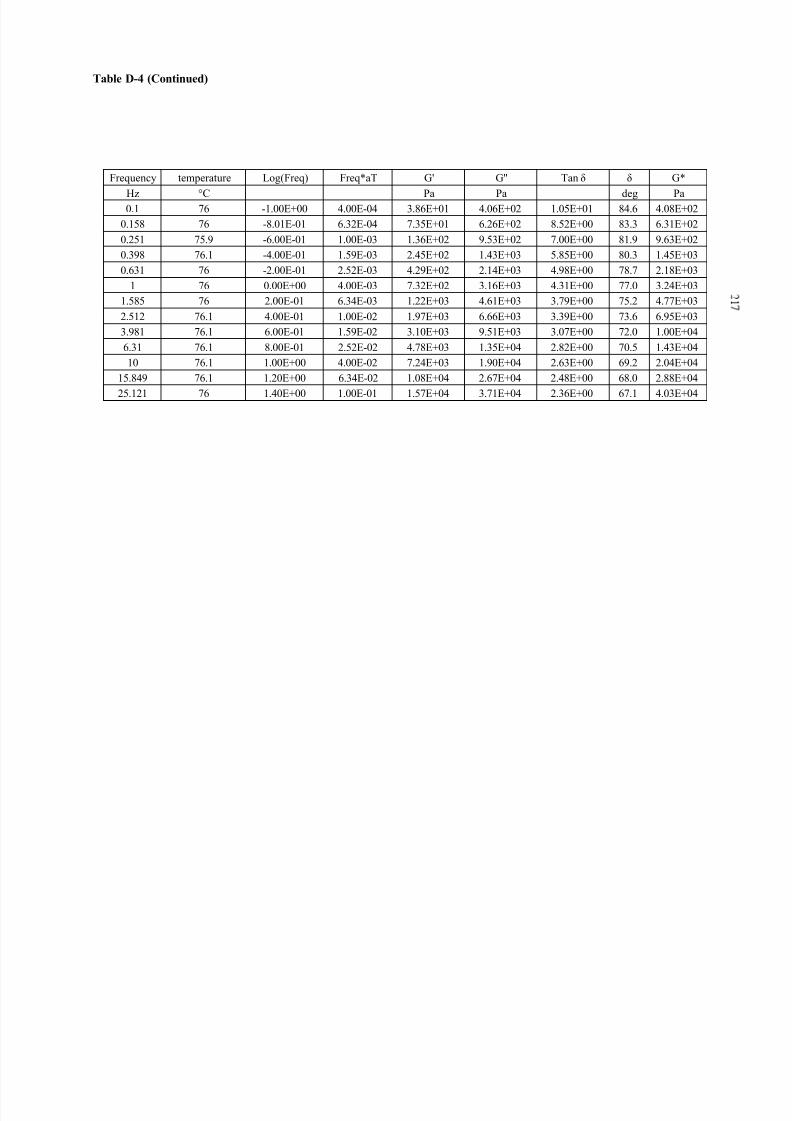
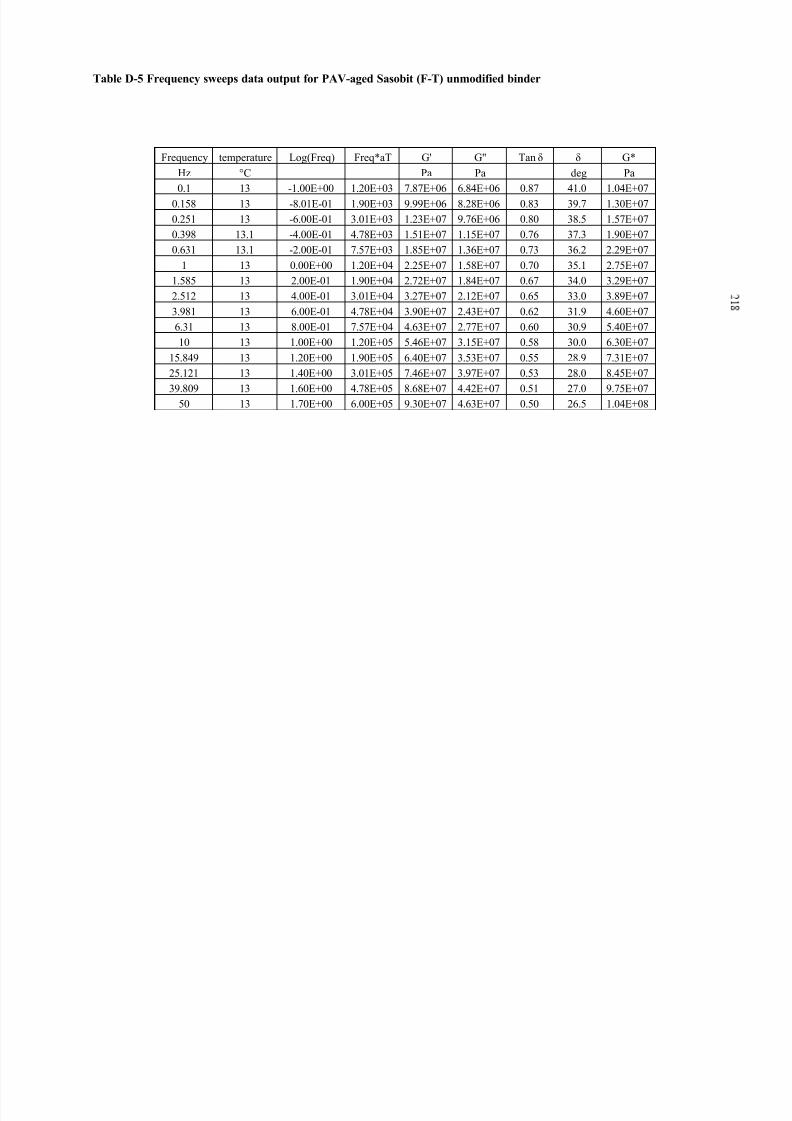
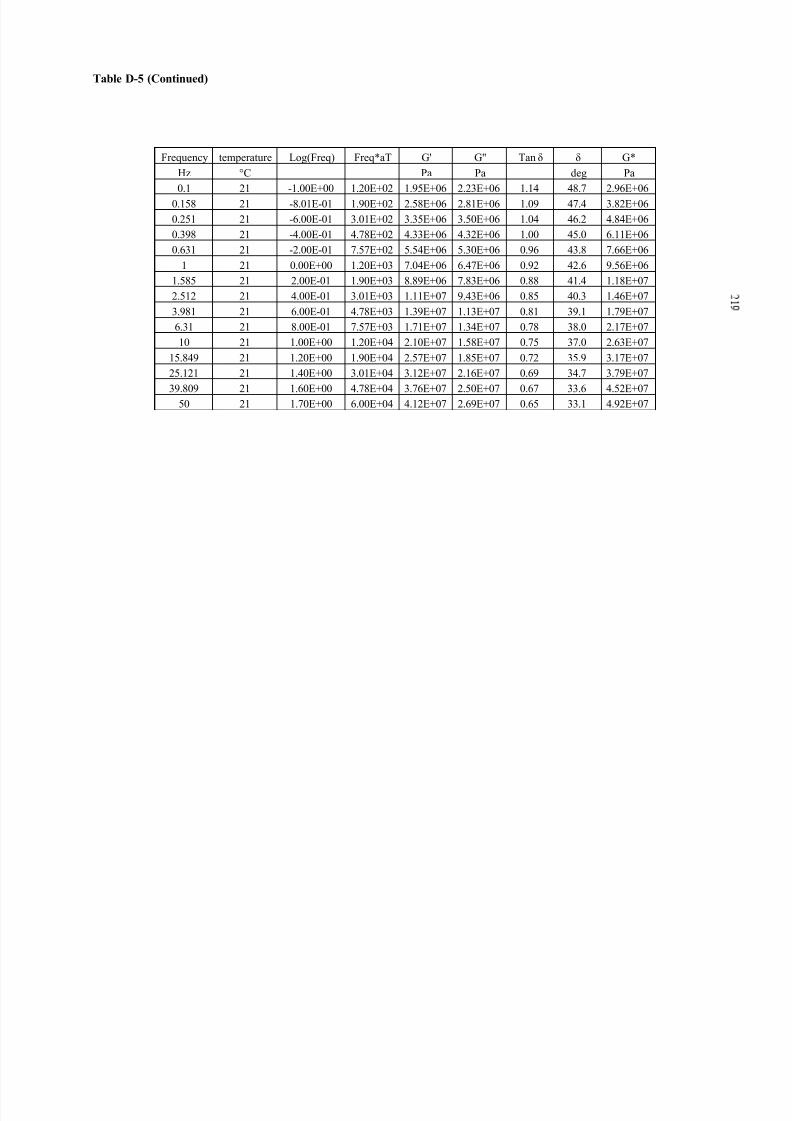
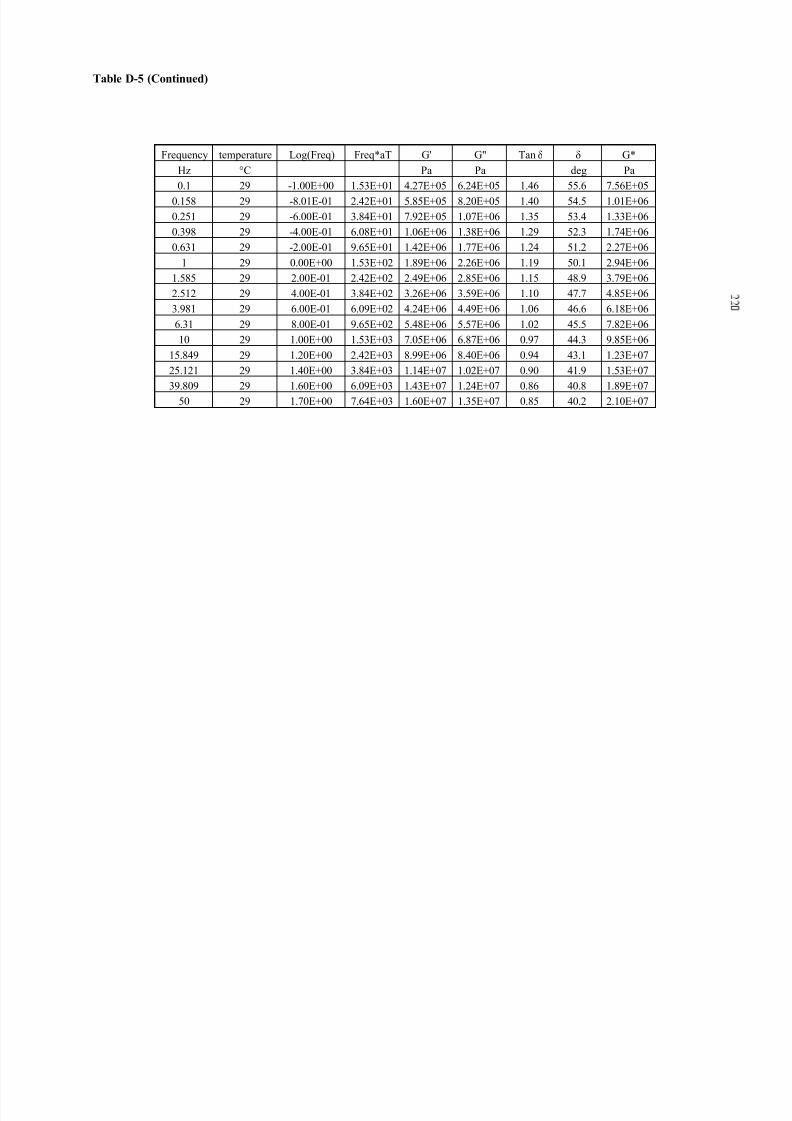
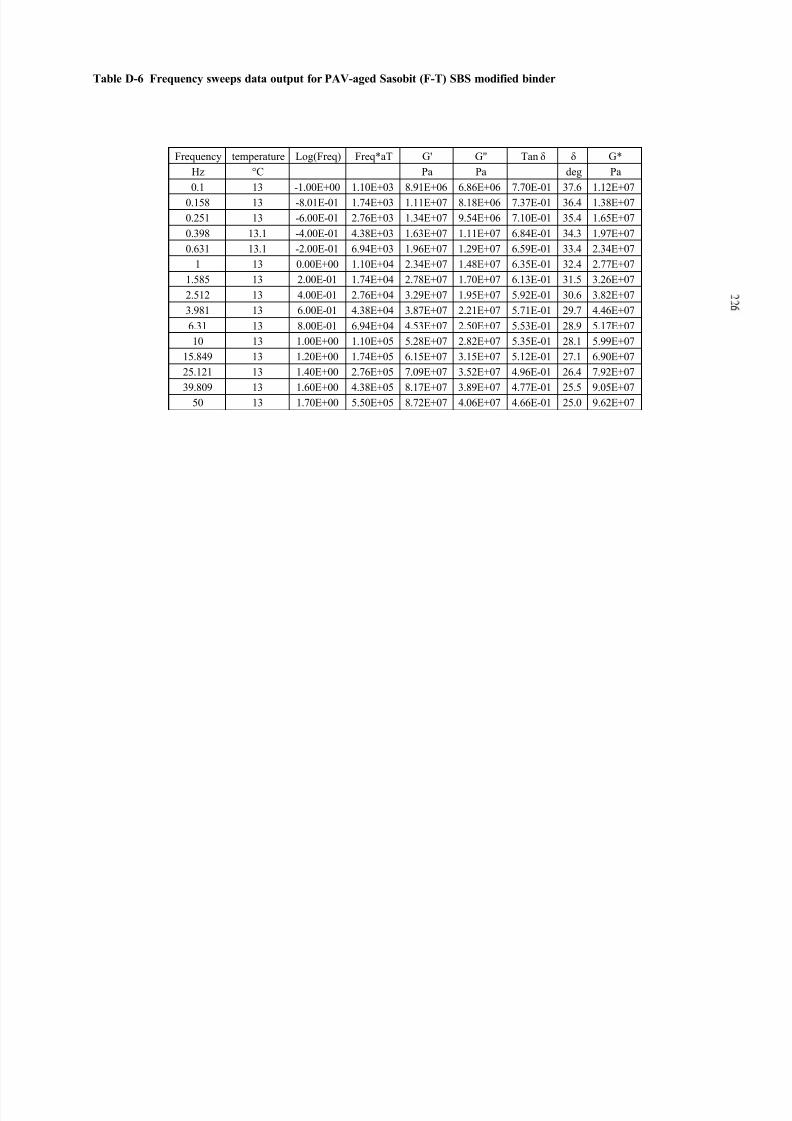
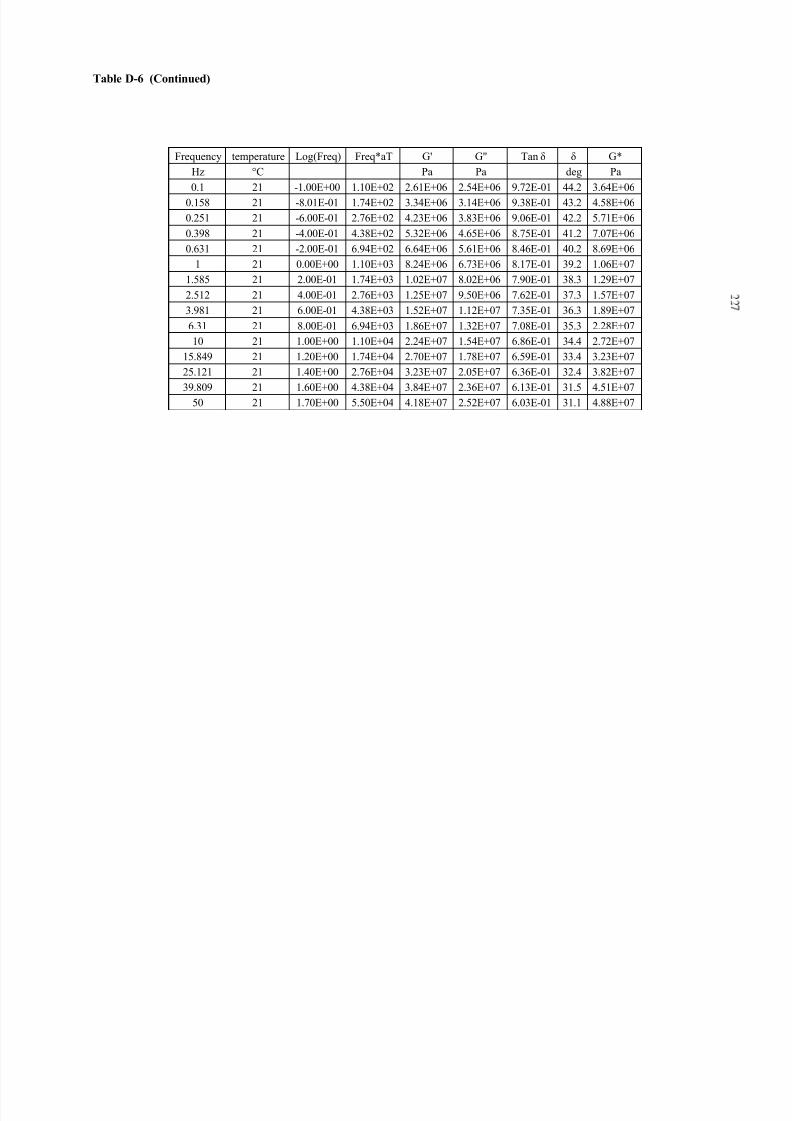
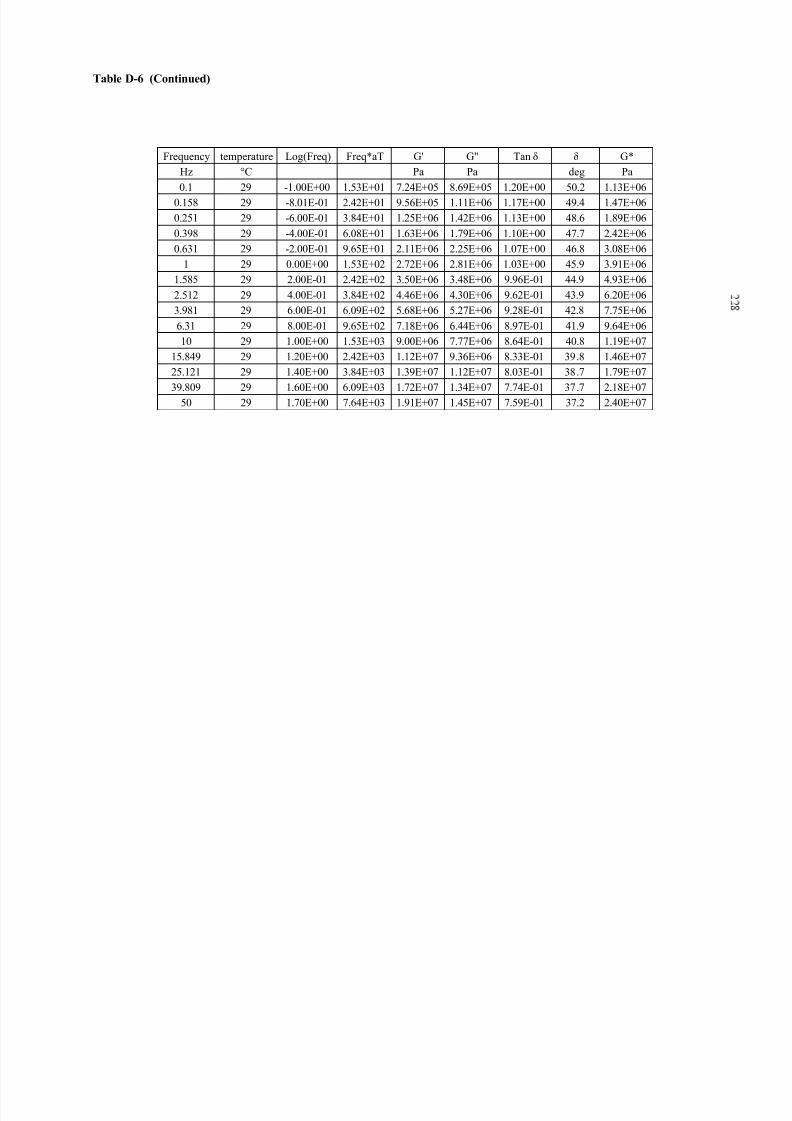
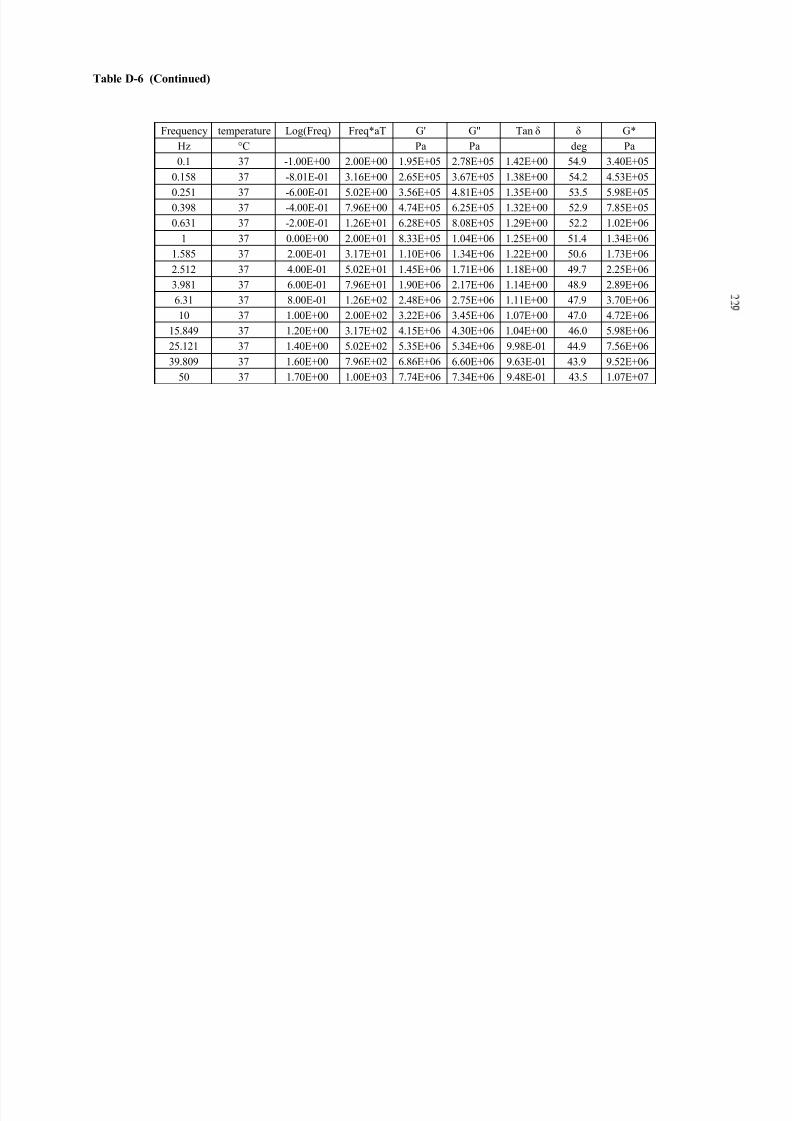
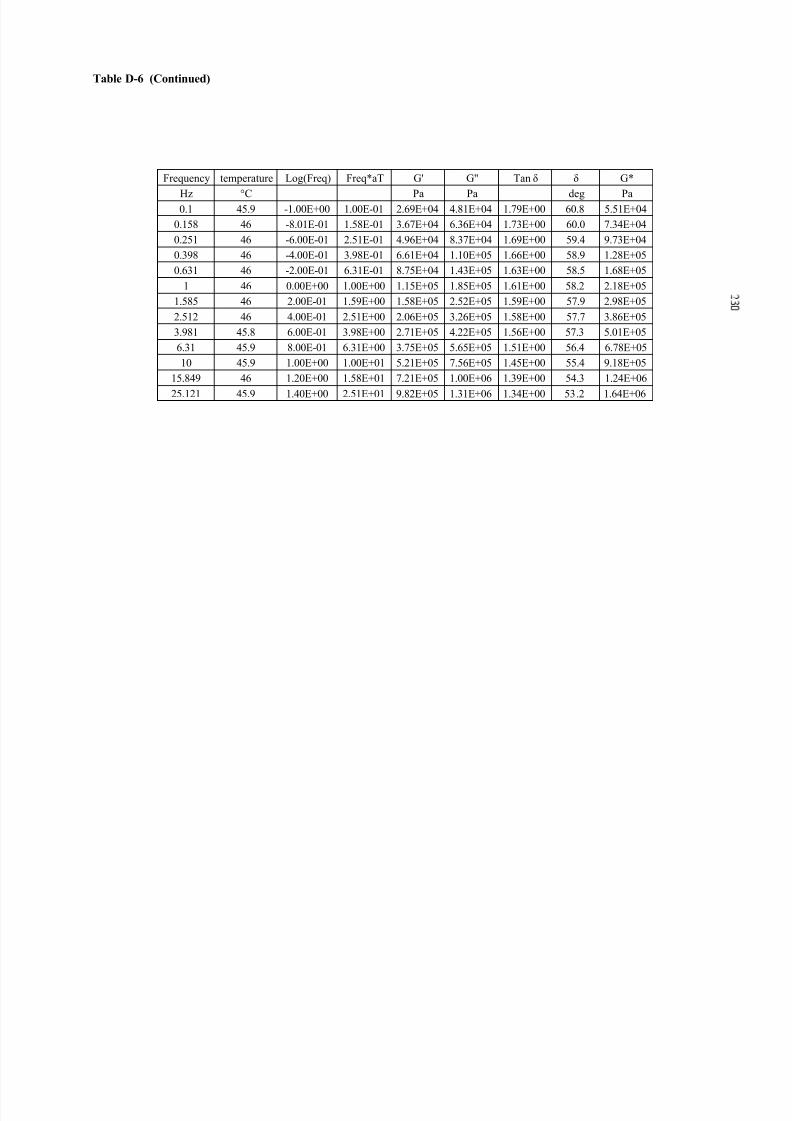
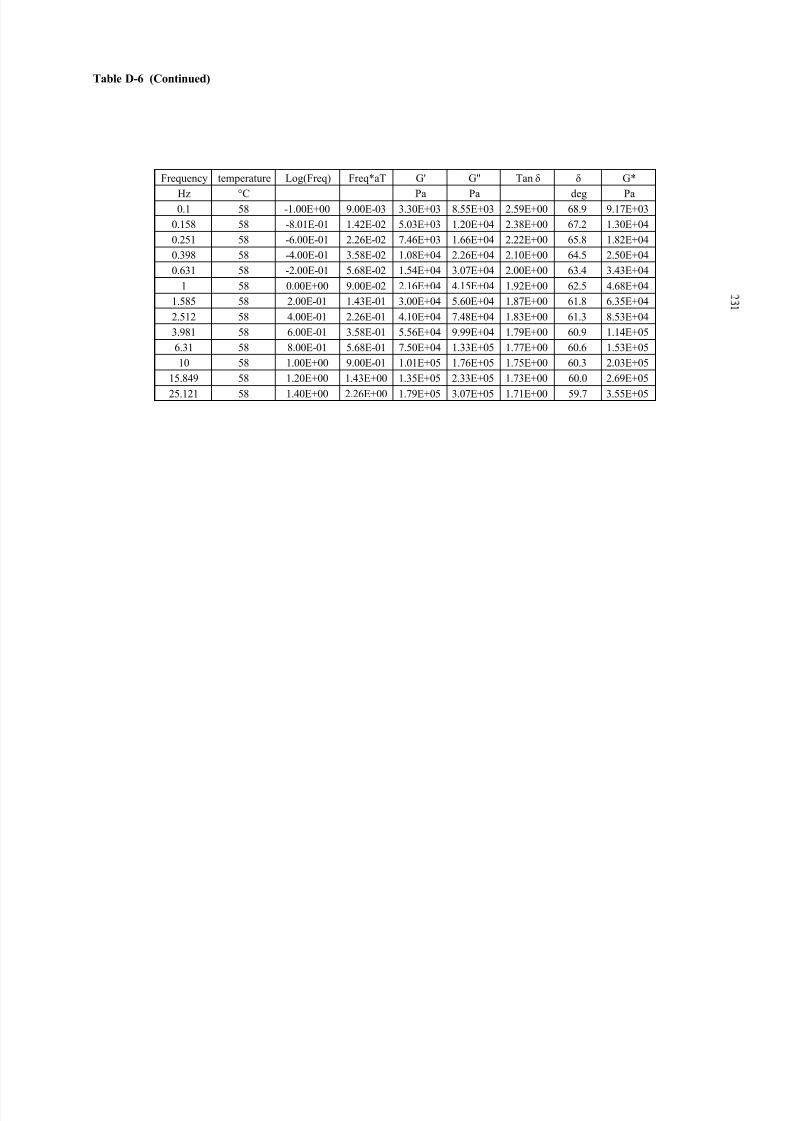
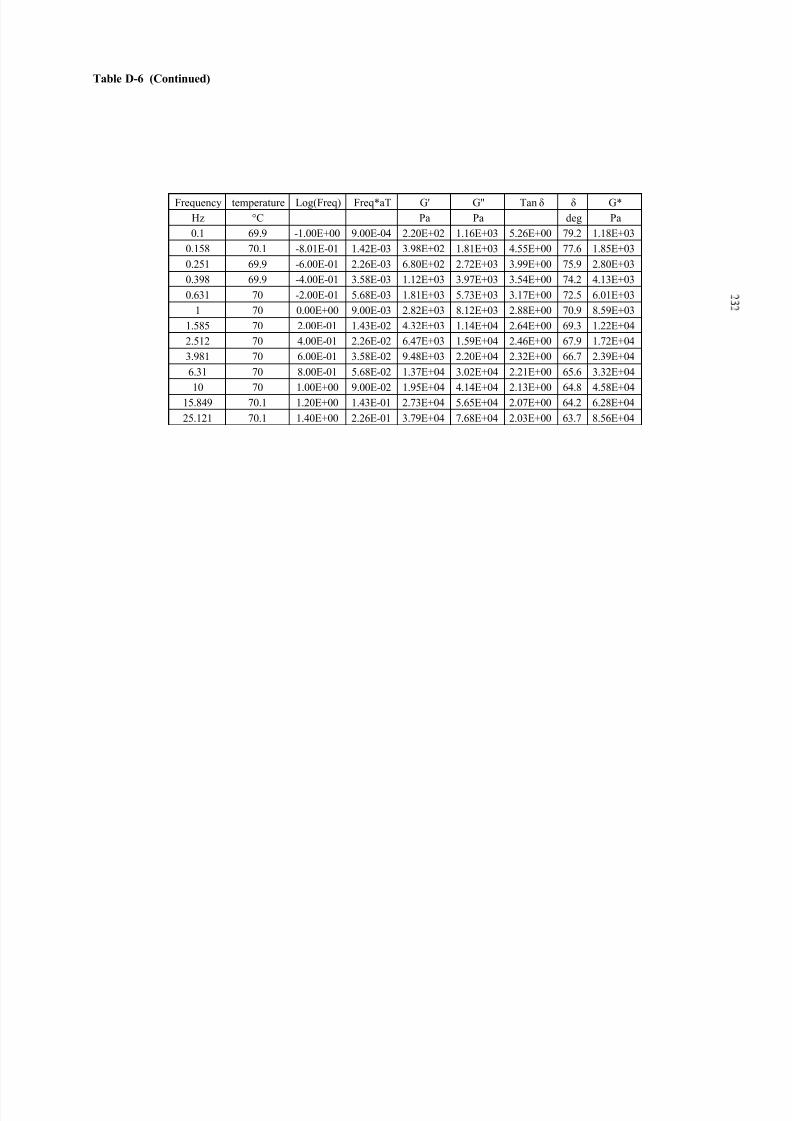
5.4.8 Frequency Sweeps................................................................................113
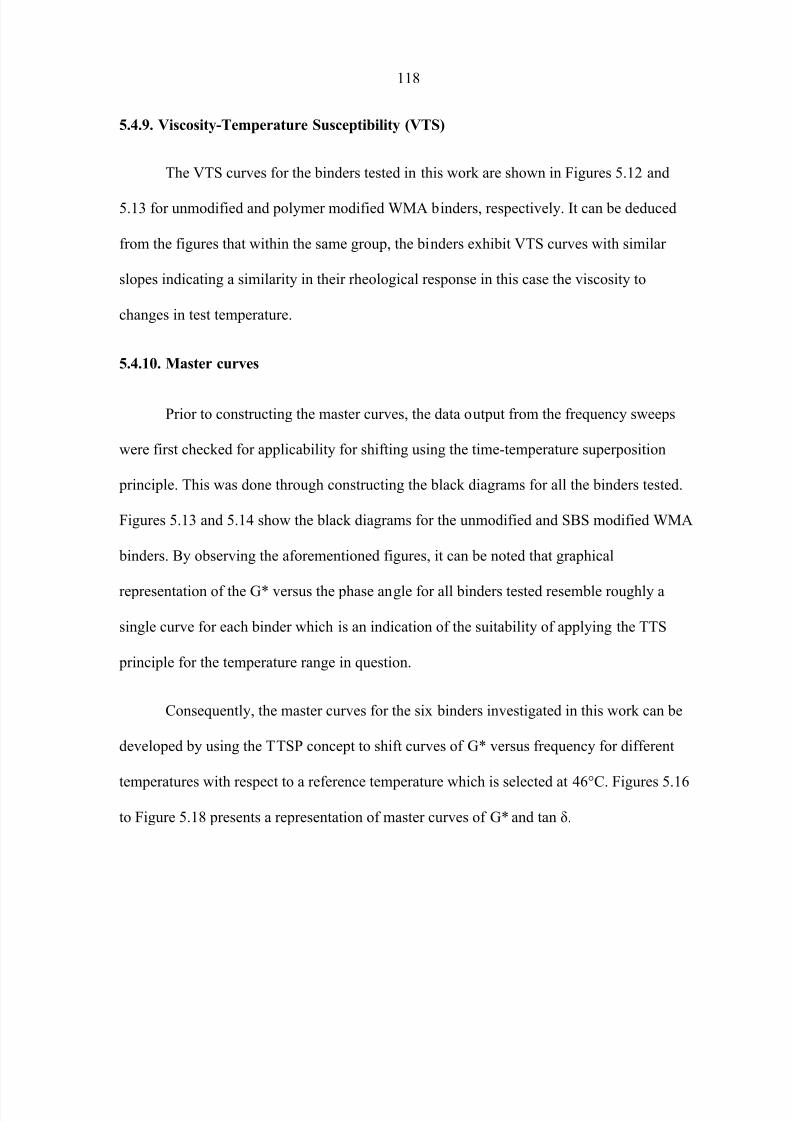
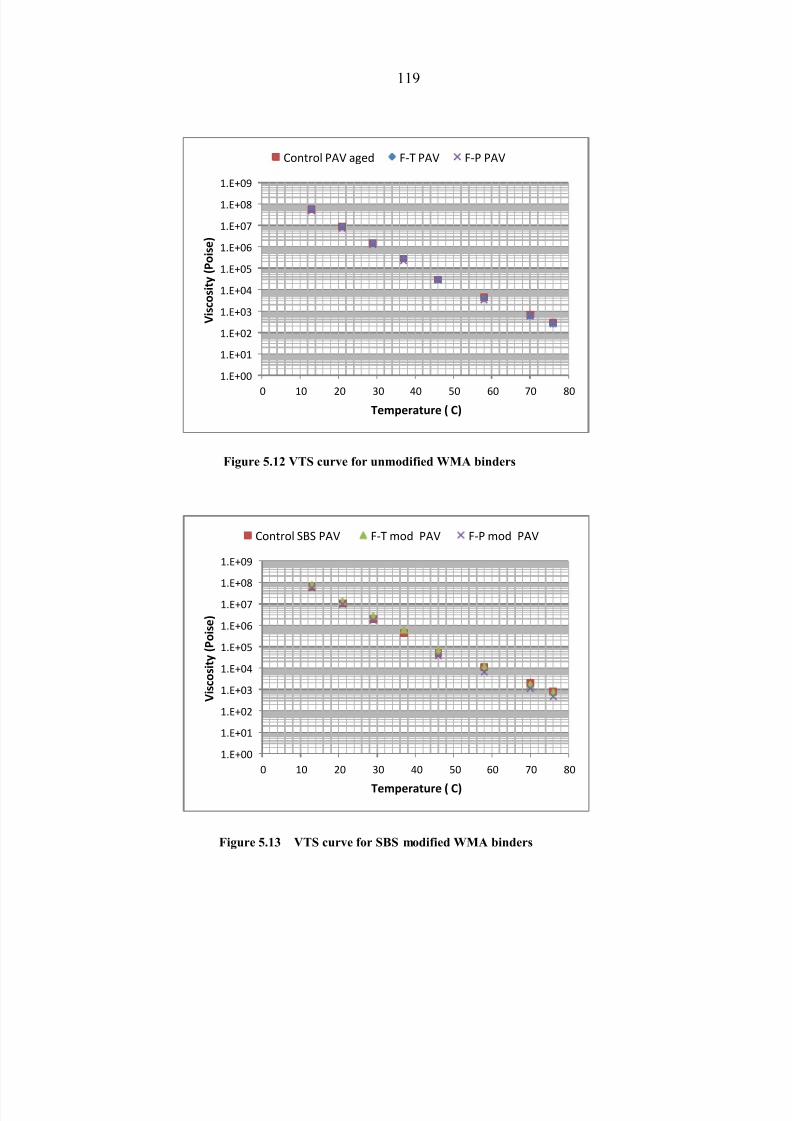
5.4.9 Viscosity-Temperature Susceptibility (VTS).........................................118
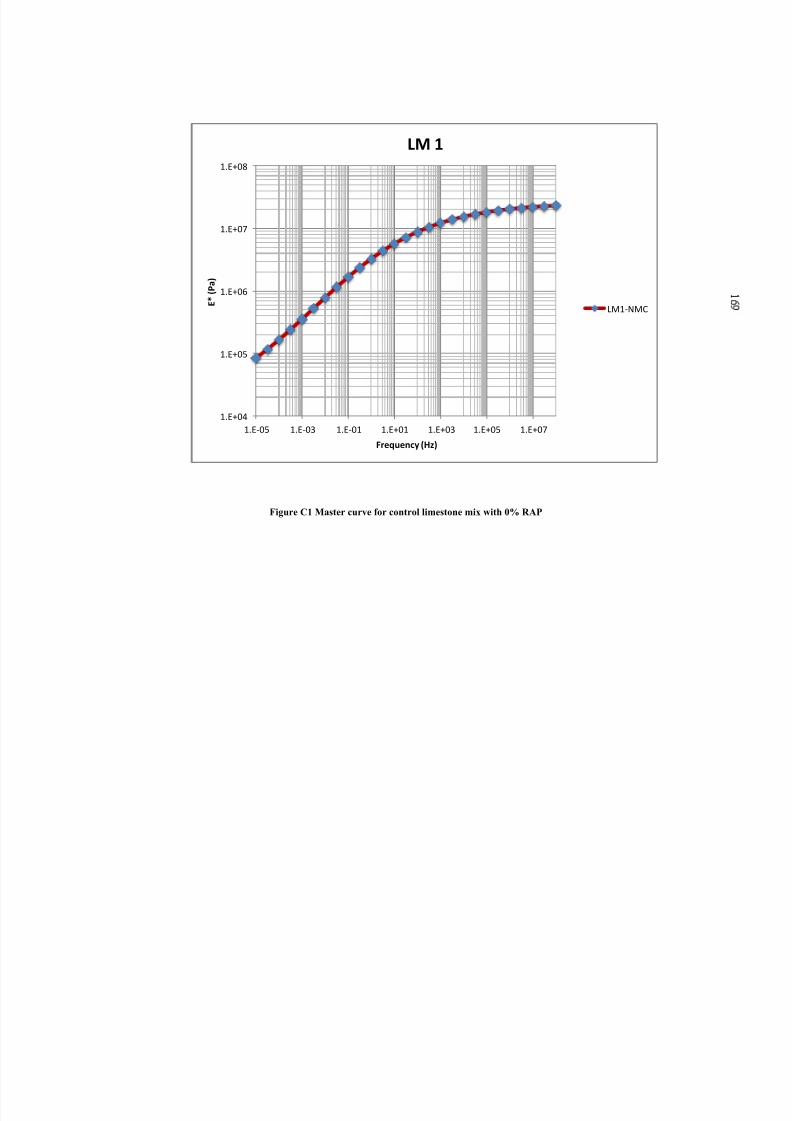
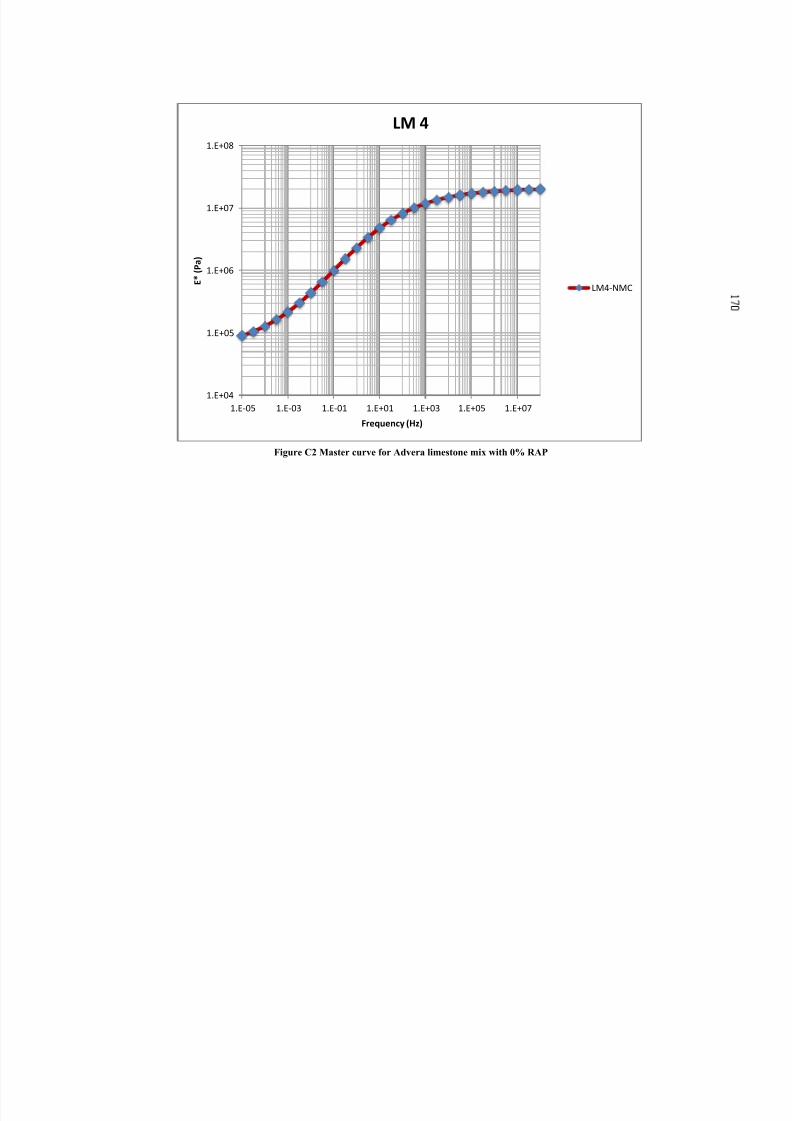
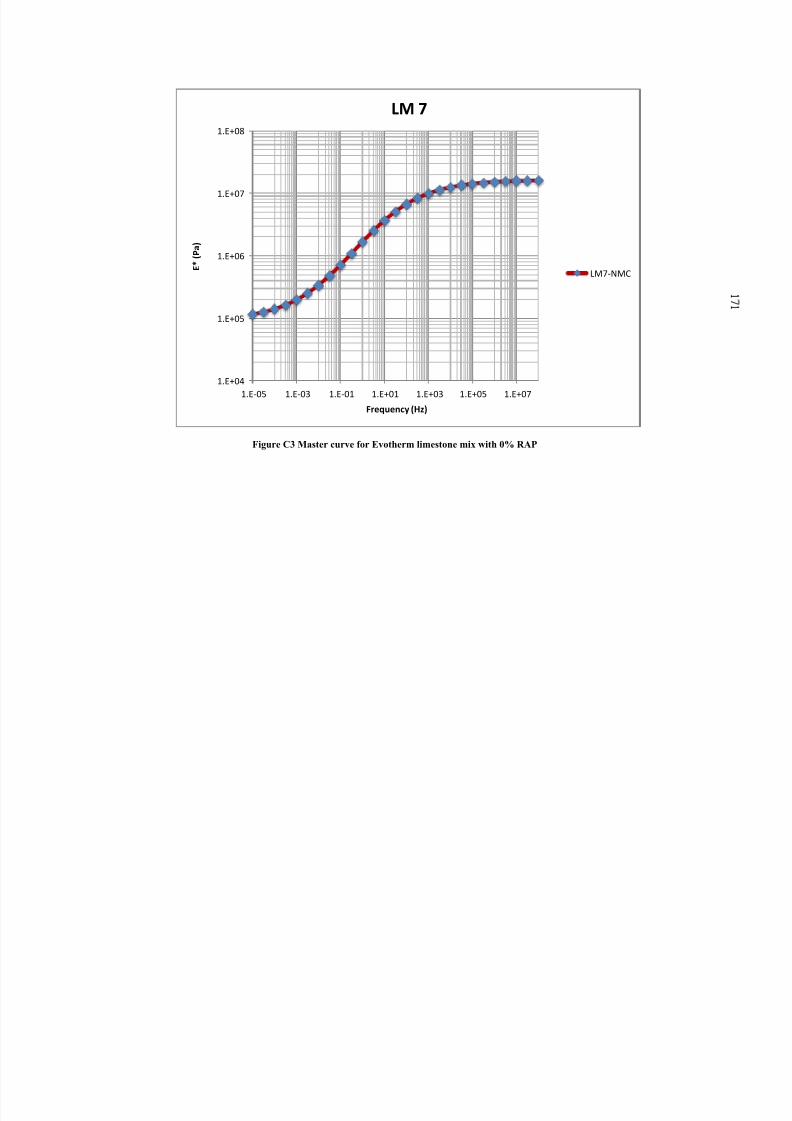
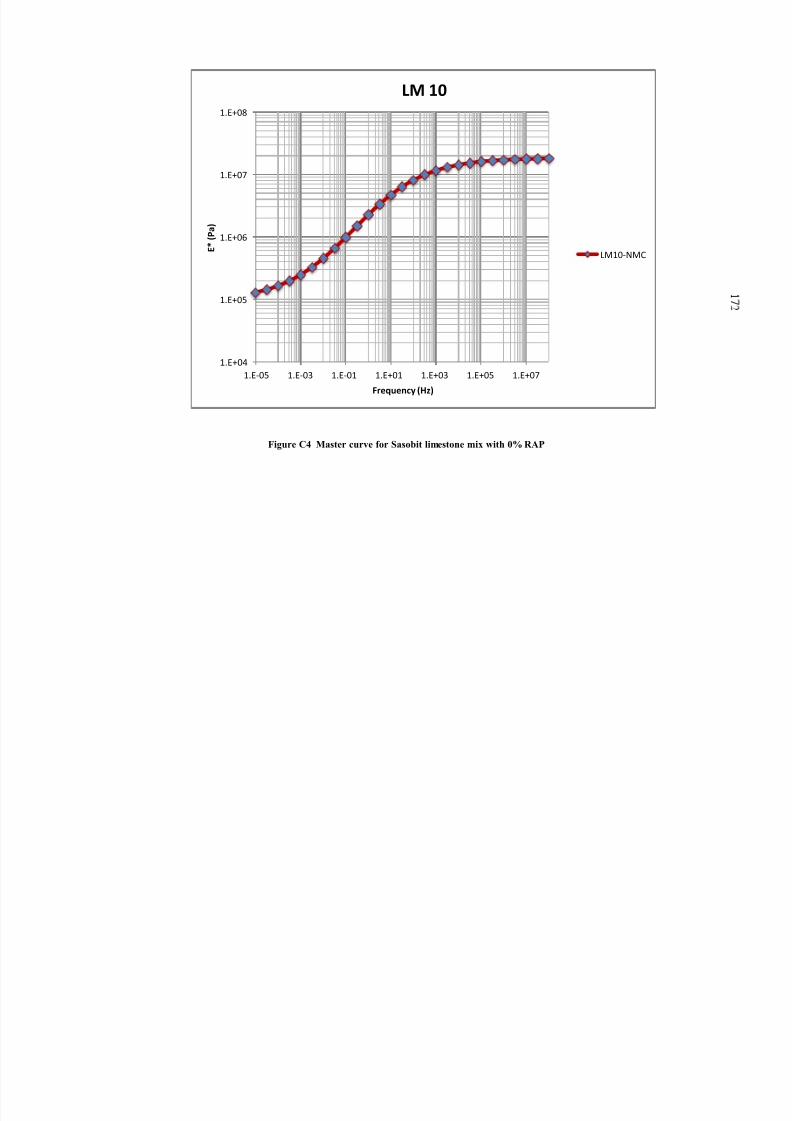
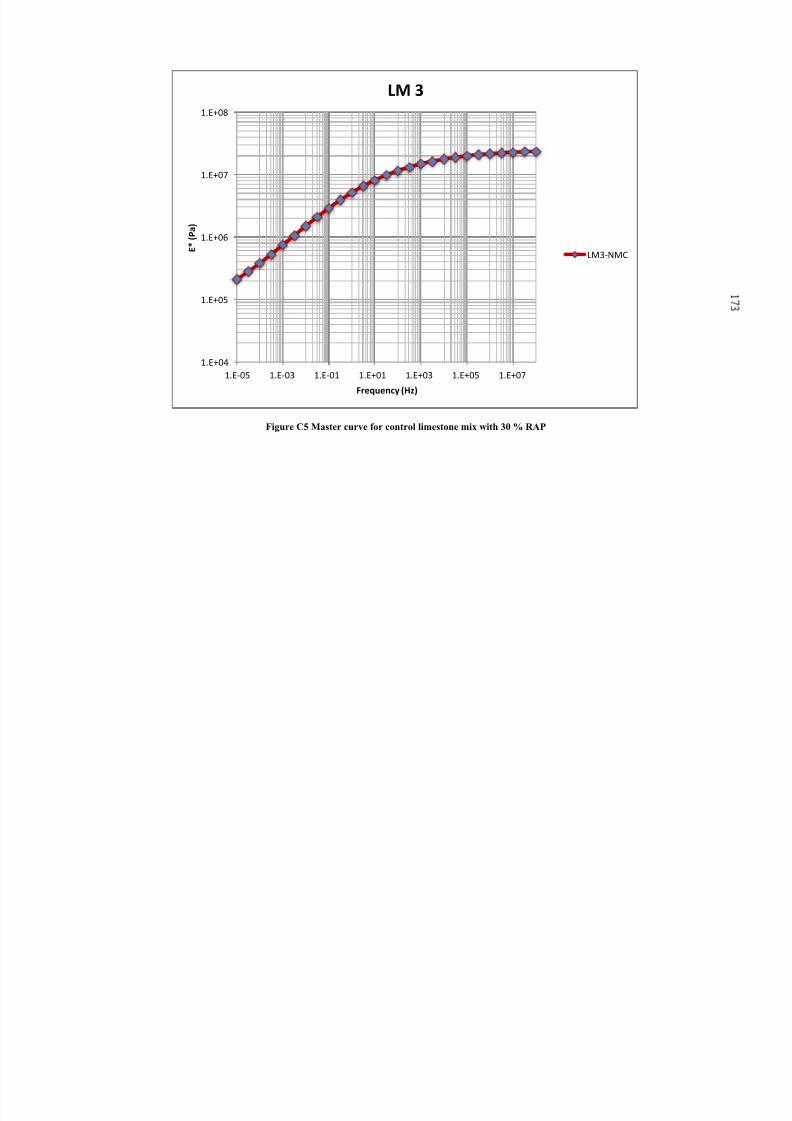
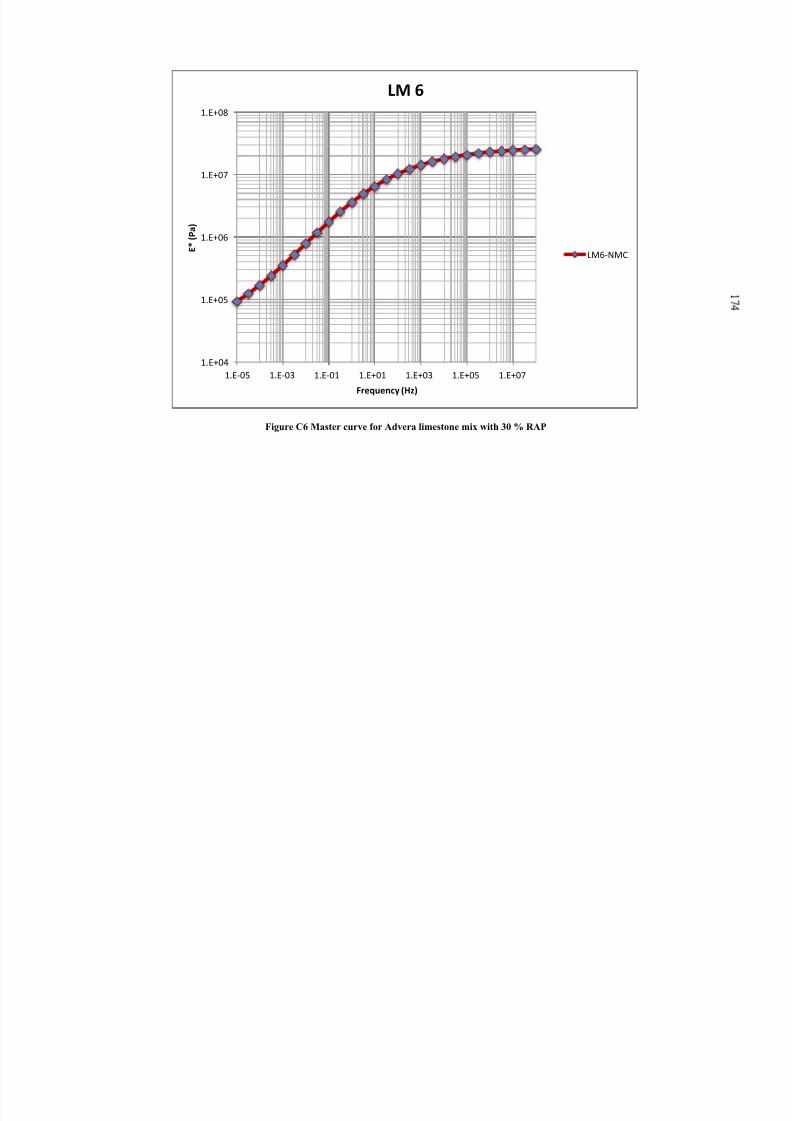
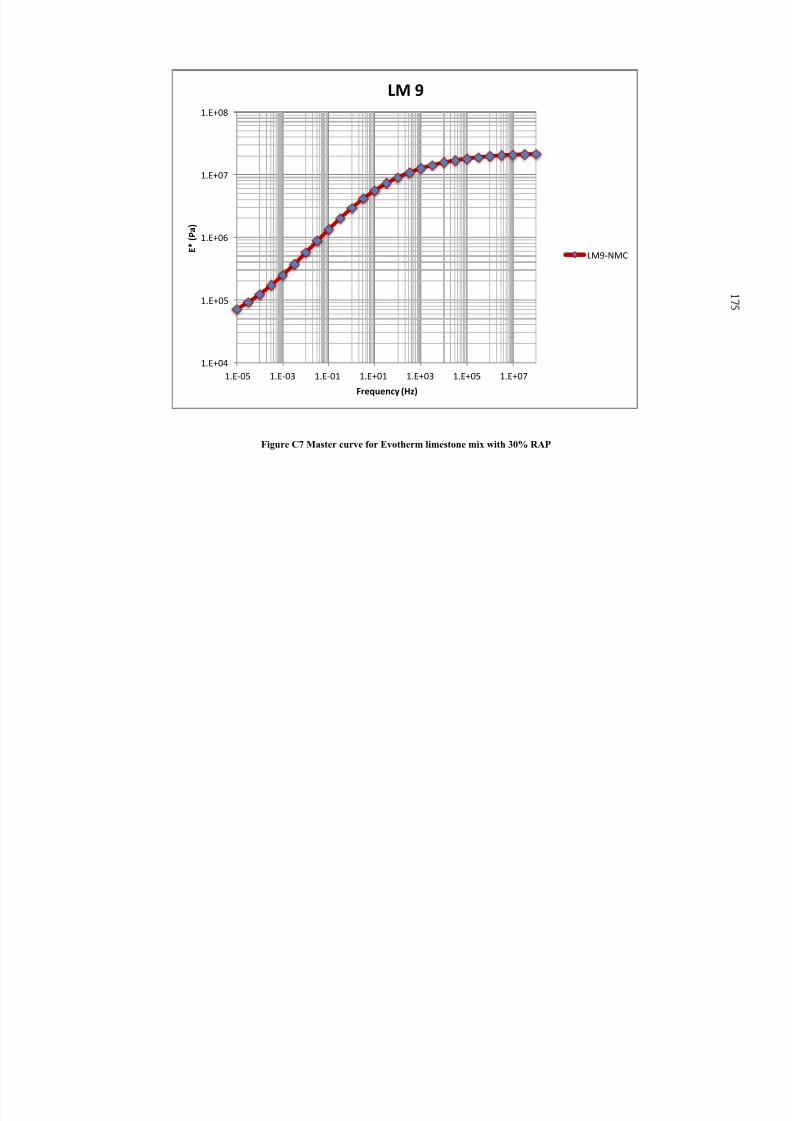
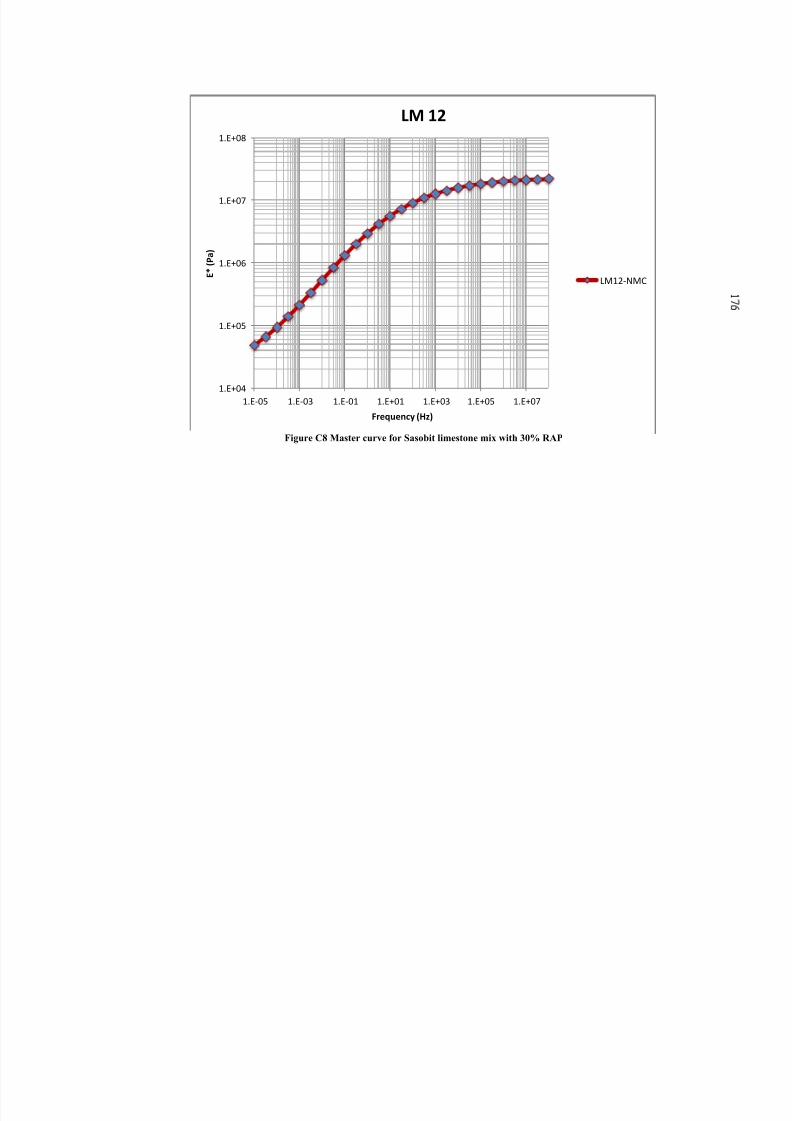
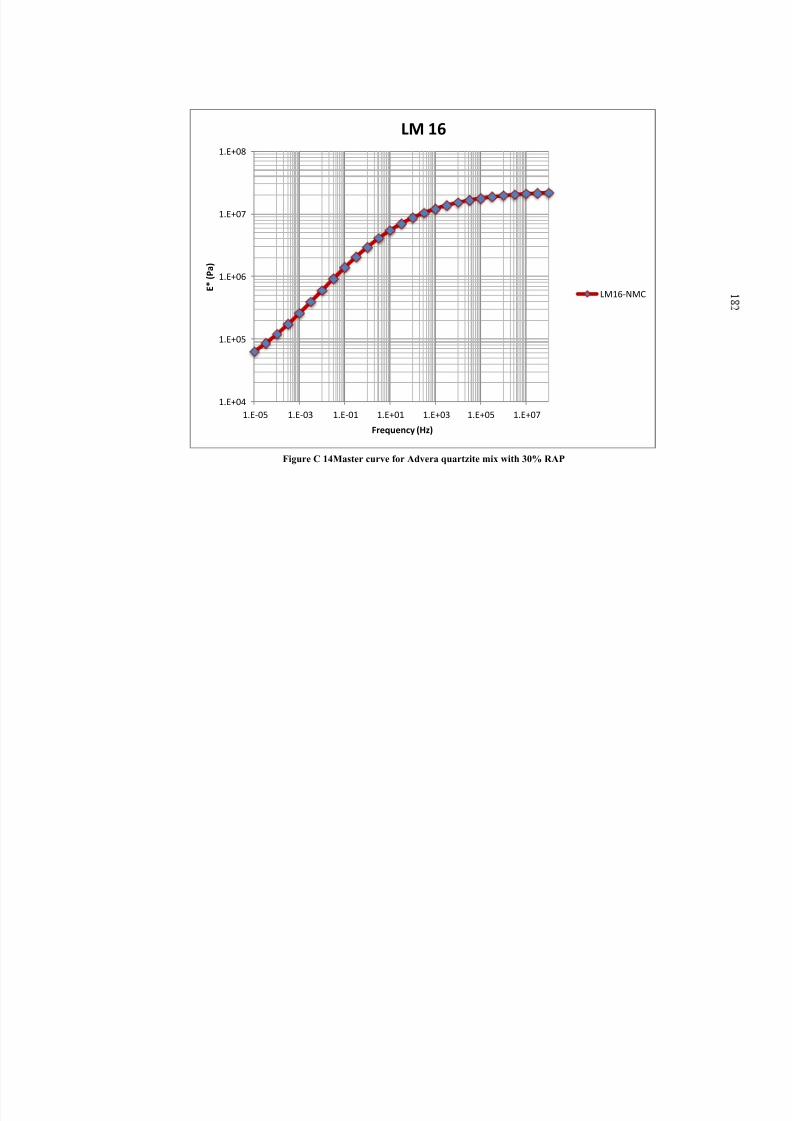
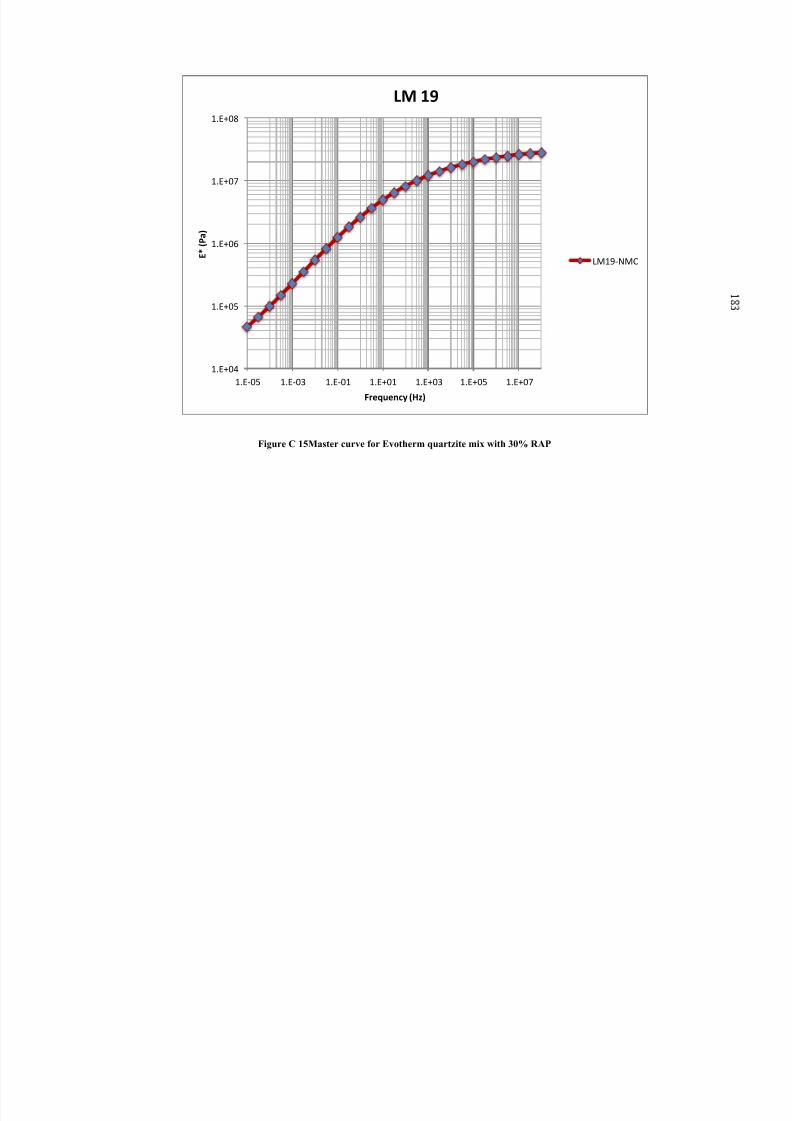
5.4.10 Master Curves........................................................................................119
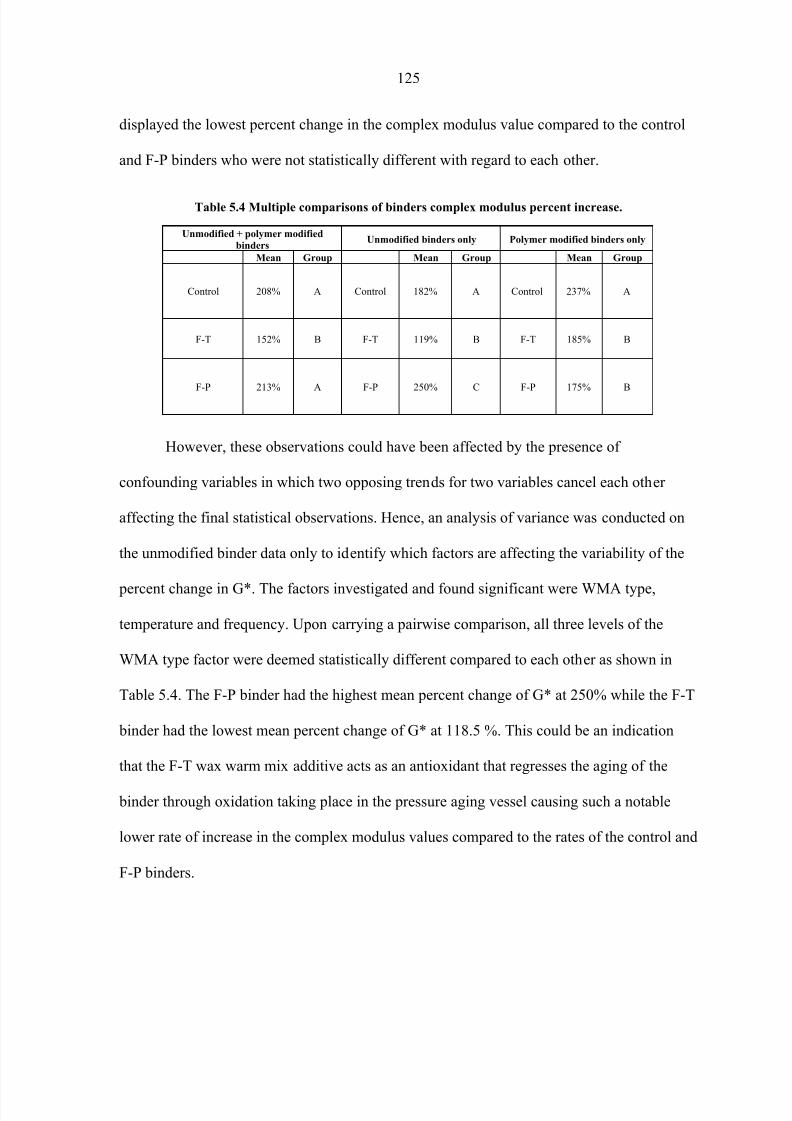
5.4.11 Rate of Complex Modulus Aging...........................................................124
5.5 Conclusions and Recommendations ......................................................126
5.6 References..............................................................................................128
CHAPTER 6 CONCLUSIONS AND RECOMMENDATIONS……….…….131
6.1 Summary…………………………………….………………………….131
6.2 Conclusions………………………………….………………………….133
6.2.1 Performance Tests of WMA Mixtures …….…………………………...134
6.2.2 Performance Prediction of Pavements with WMA using MEPDG…….135
6.2.3 WMA Binder Testing………………………………………………… ...137
6.3 Recommendations…………………………………………………… ....138
REFERENCES 141
Page 7
8/9/2019 Characterization of Warm Mix Asphalt (WMA) Performance in Differe
http://slidepdf.com/reader/full/characterization-of-warm-mix-asphalt-wma-performance-in-differe 7/247
vi
LIST OF FIGURES
Figure 2.1 LEA Process Phases (Button et al., 2007)…….….…………………………...….10
Figure 2.2 Temperature-viscosity relationships with the addition of organic additive
(Anderson, et al., 2008)…………………………………………………………....13
Figure 2.2 AWD torque vs. temperature curve for 260 °F starting temperature (Bennert
et al., 2010)……………………………………………………………………… ...36
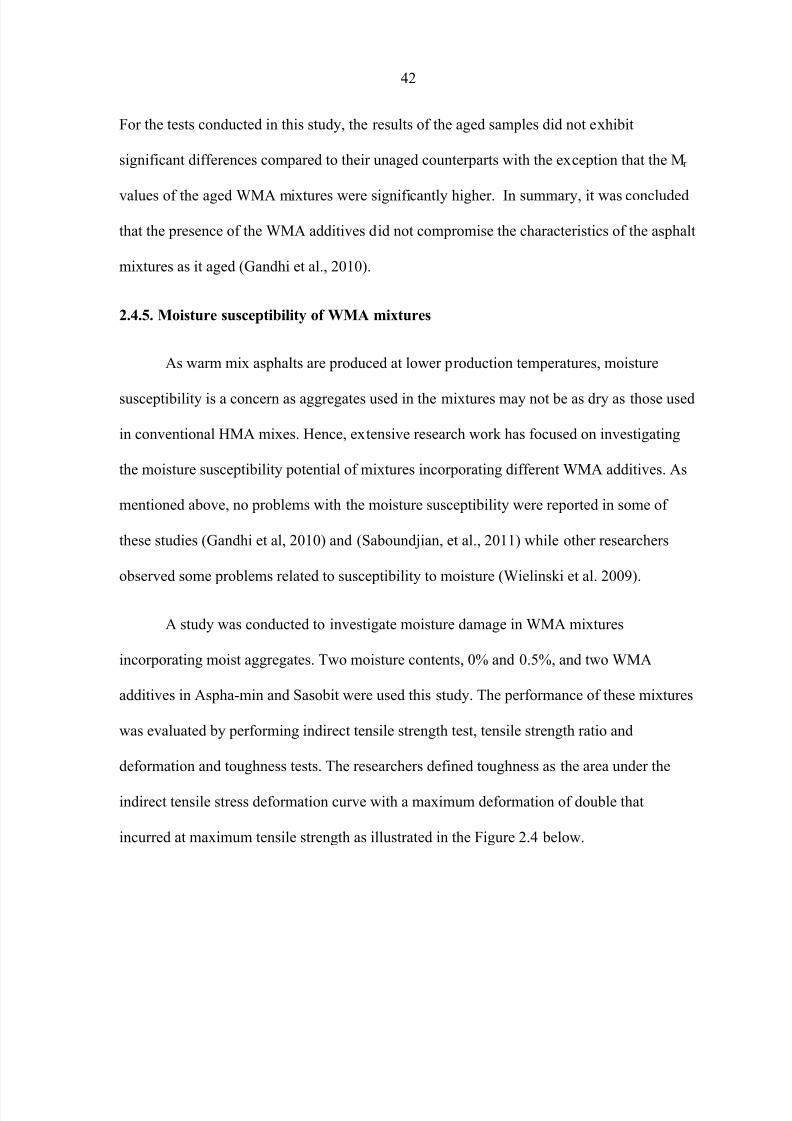
Figure 2.4 Definition of toughness (Xiao et al., 2009)………………………….…………..43
Figure 2.5 Modified Binder Bond Strength Test Setup (Mogawer et al., 2011).…………...44
Figure 2.6 Frequency dependence curve (H. Kim et al., 2011)………………….………….46
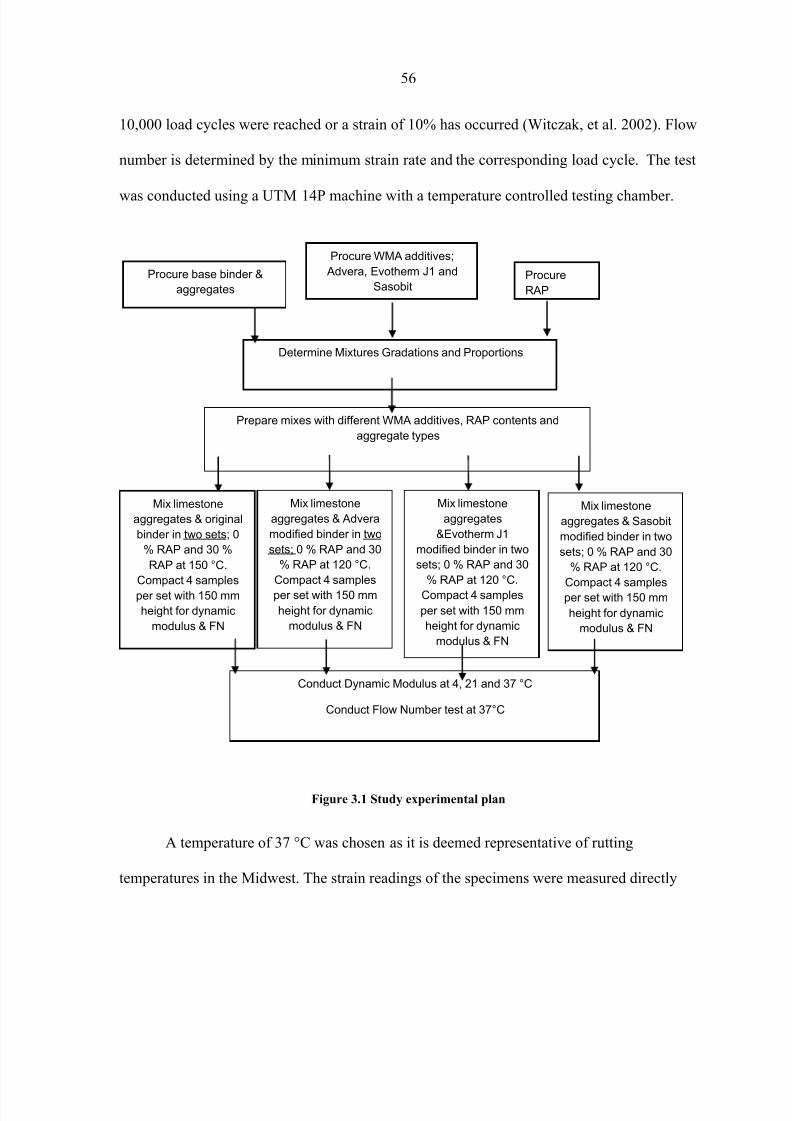
Figure 3.1 Study experimental plan……………………………………………… .………...56
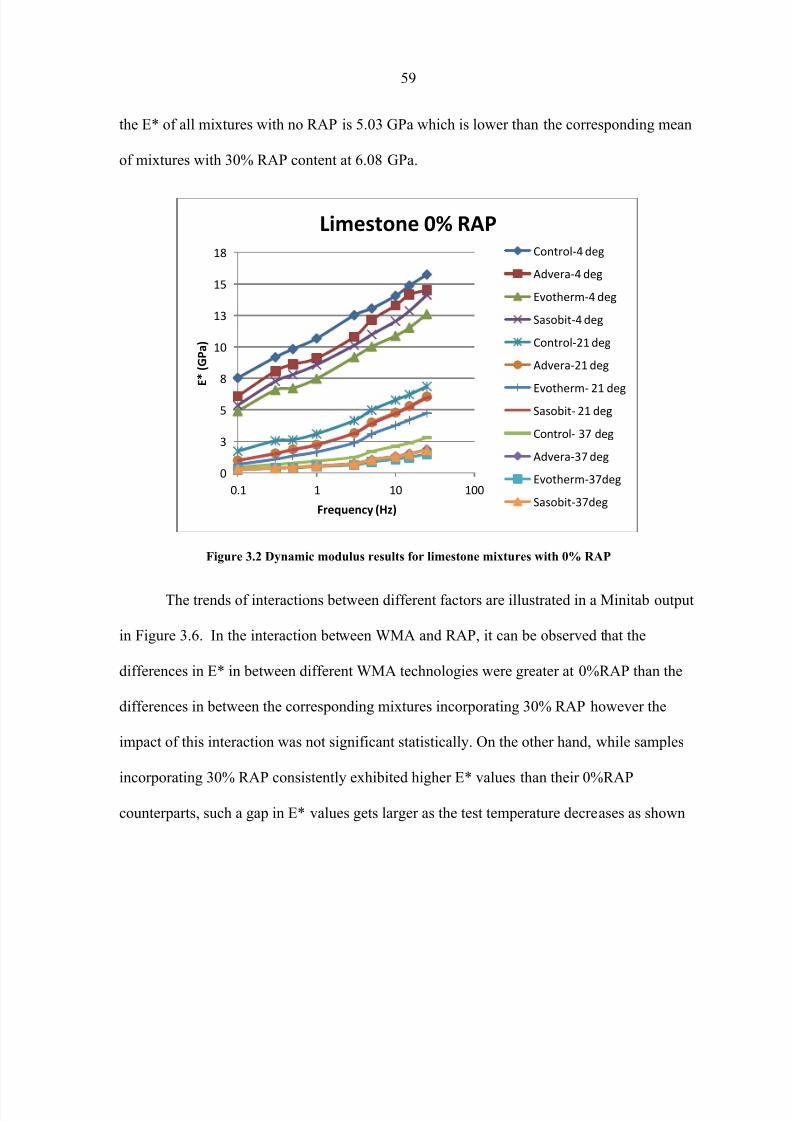
Figure 3.2 Dynamic modulus results for limestone mixtures with 0% RAP…….………… .59
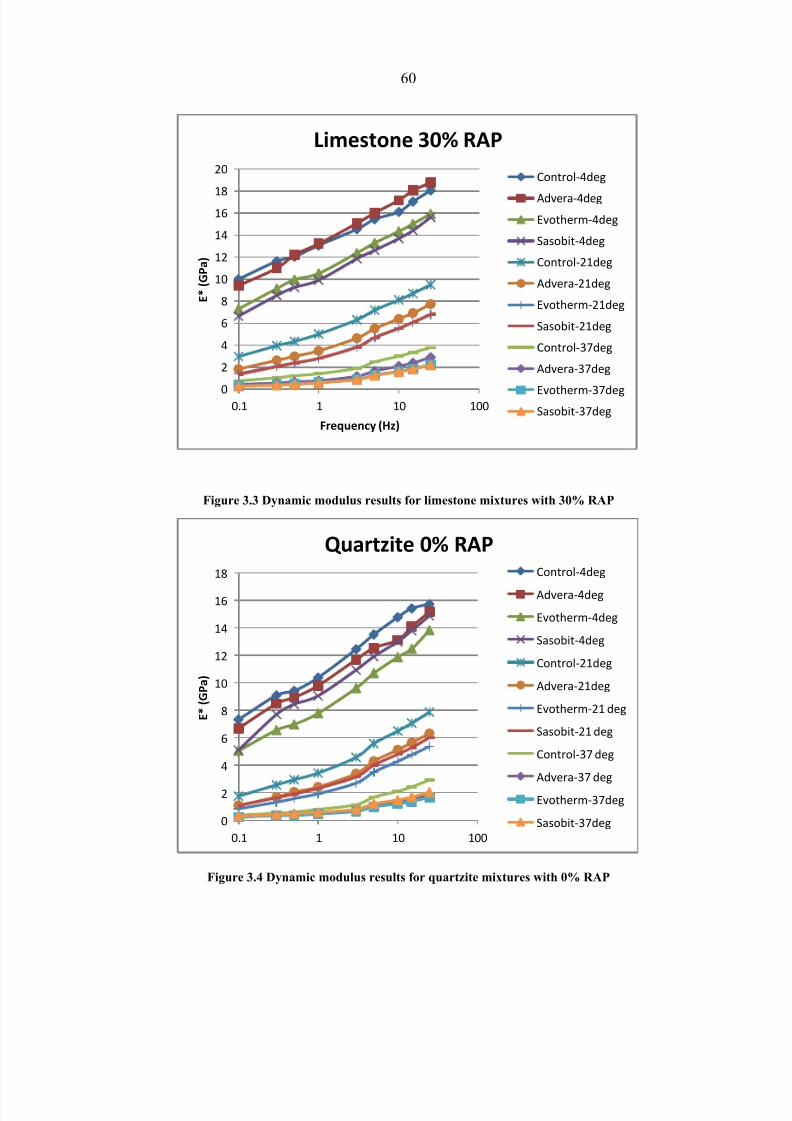
Figure 3.3 Dynamic modulus results for limestone mixtures with 30% RAP…….………...60
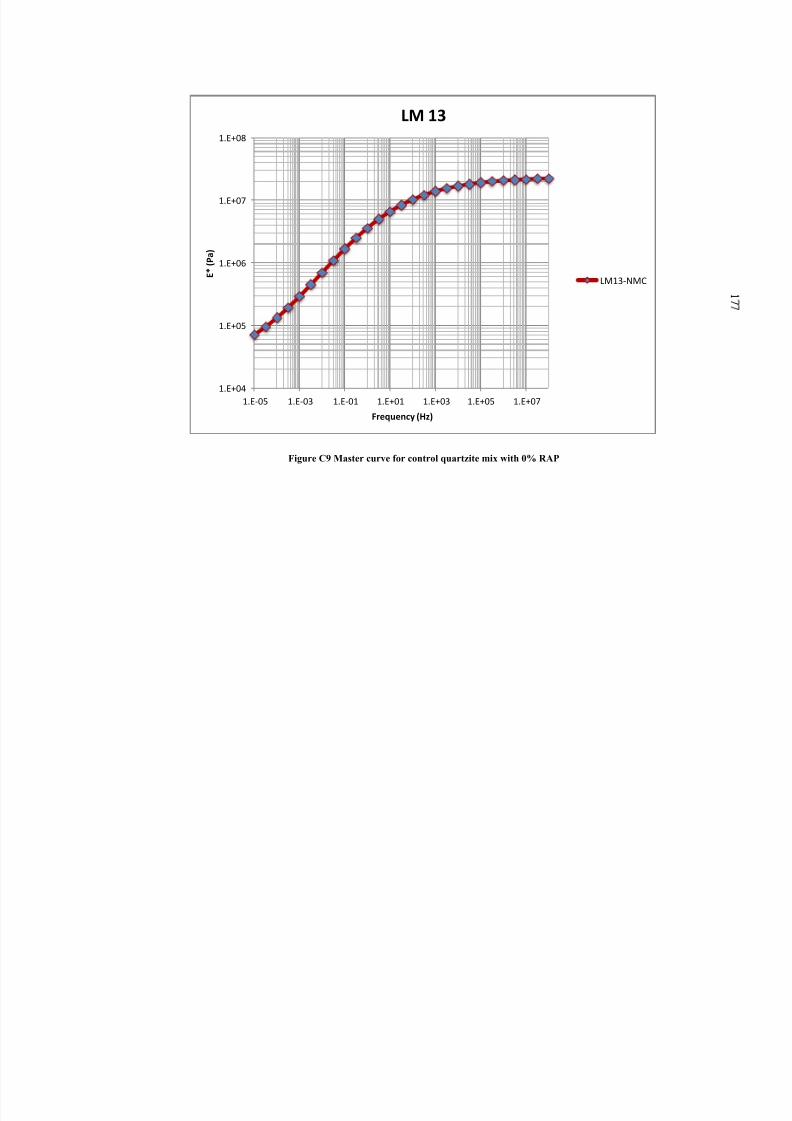
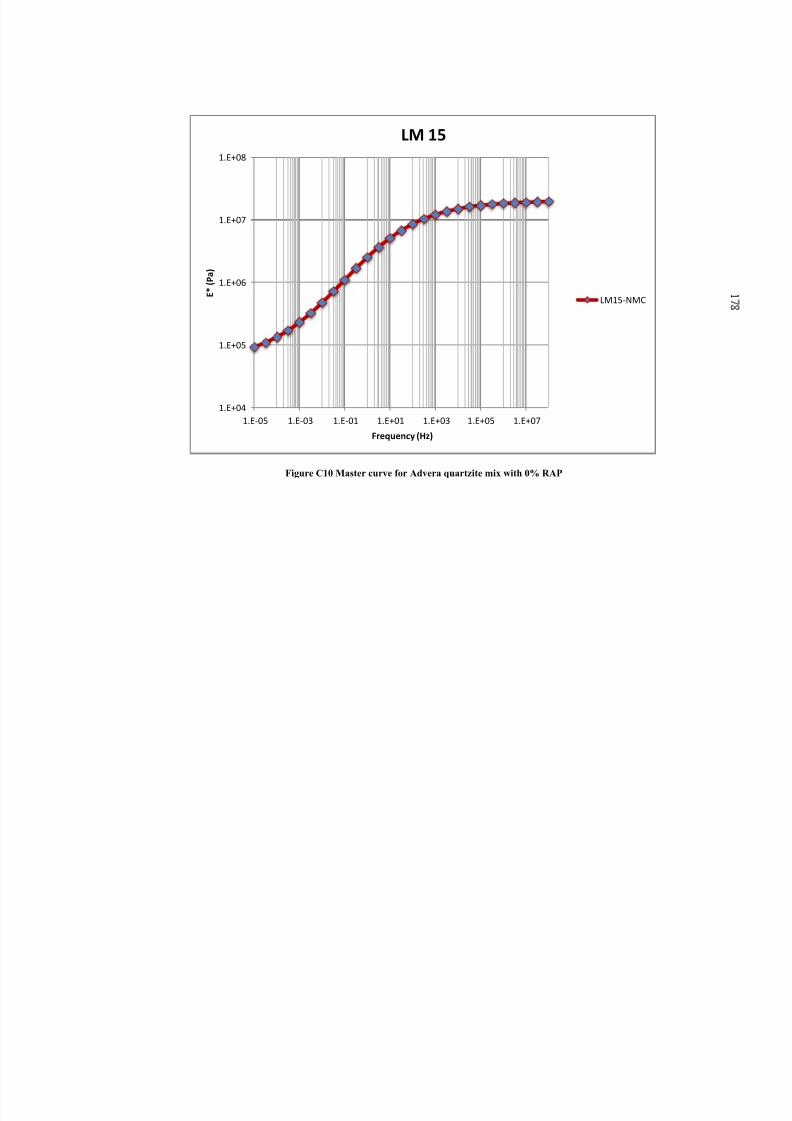
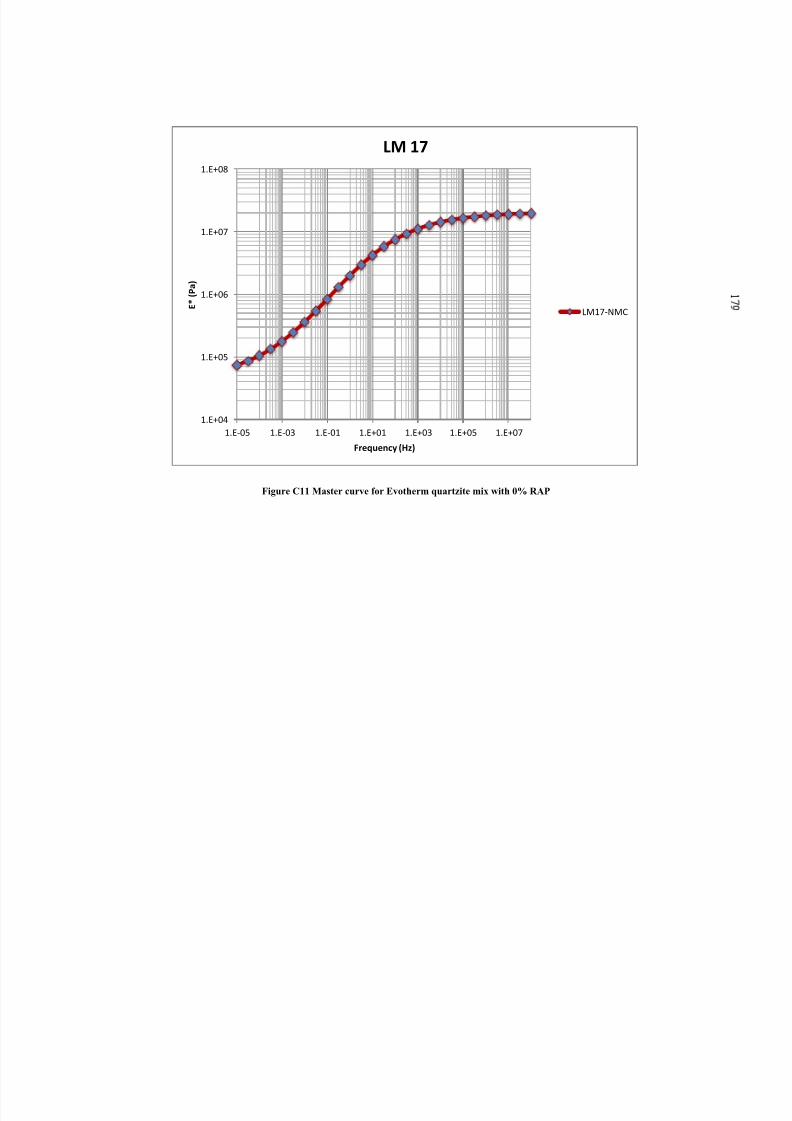
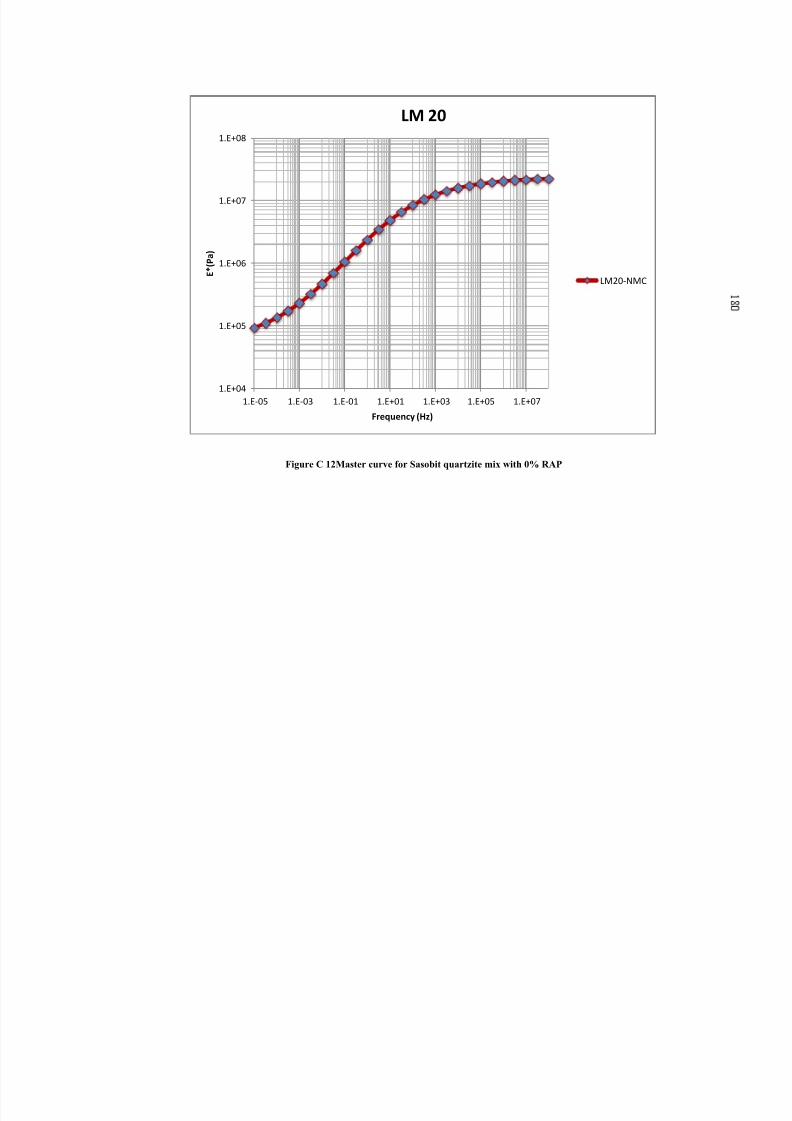
Figure 3.4 Dynamic modulus results for quartzite mixtures with 0% RAP……….………..60
Figure 3 5 Dynamic modulus results for quartzite mixtures with 30% RAP 61
Page 8
8/9/2019 Characterization of Warm Mix Asphalt (WMA) Performance in Differe
http://slidepdf.com/reader/full/characterization-of-warm-mix-asphalt-wma-performance-in-differe 8/247
vii
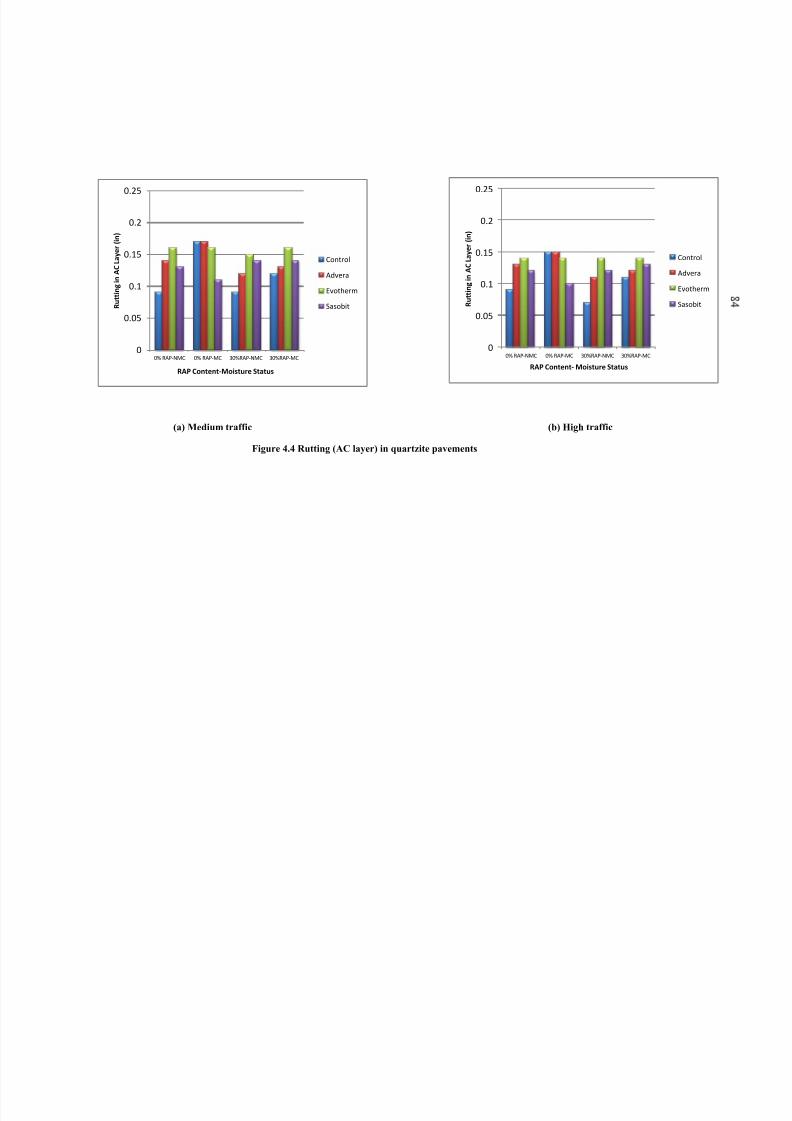
Figure 4.4 Rutting (AC layer) in quartzite pavements (a) Medium traffic (b) High traffic...84
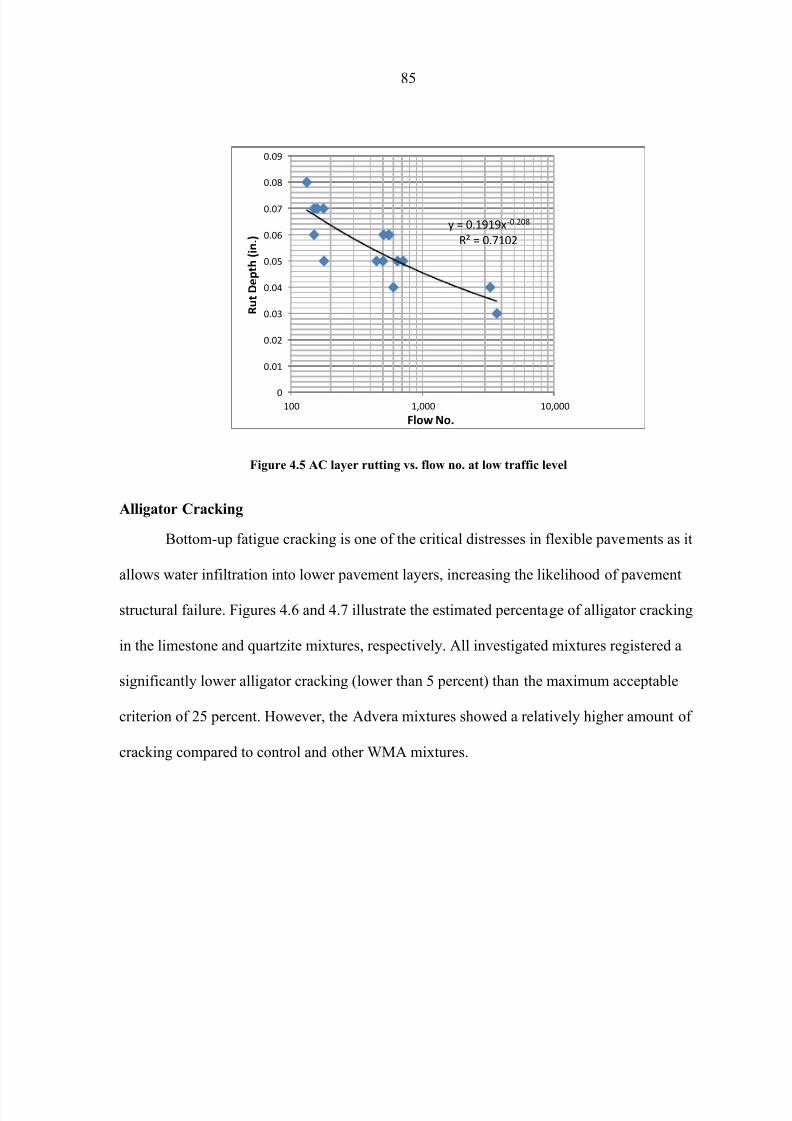
Figure 4. 5AC layer rutting vs. flow no. at low traffic level…………………………..…....85
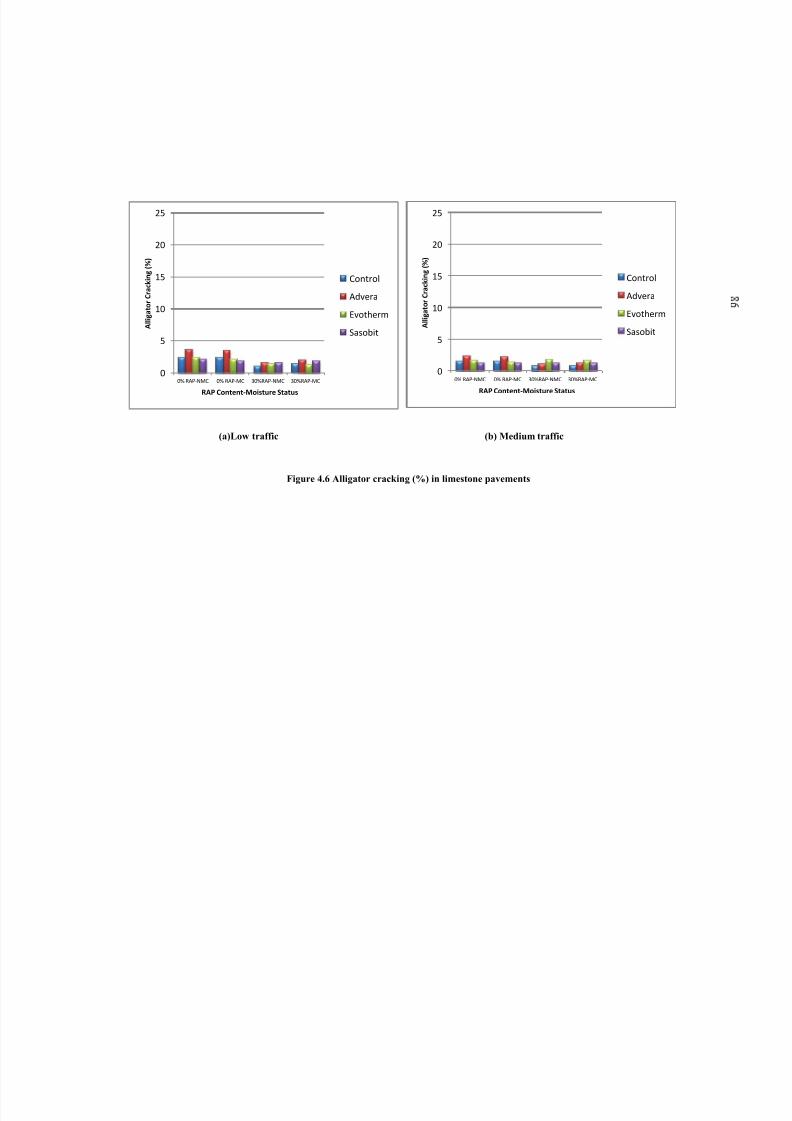
Figure 4.6 Alligator cracking in limestone pavements (a) Low traffic (b) Medium traffic...86
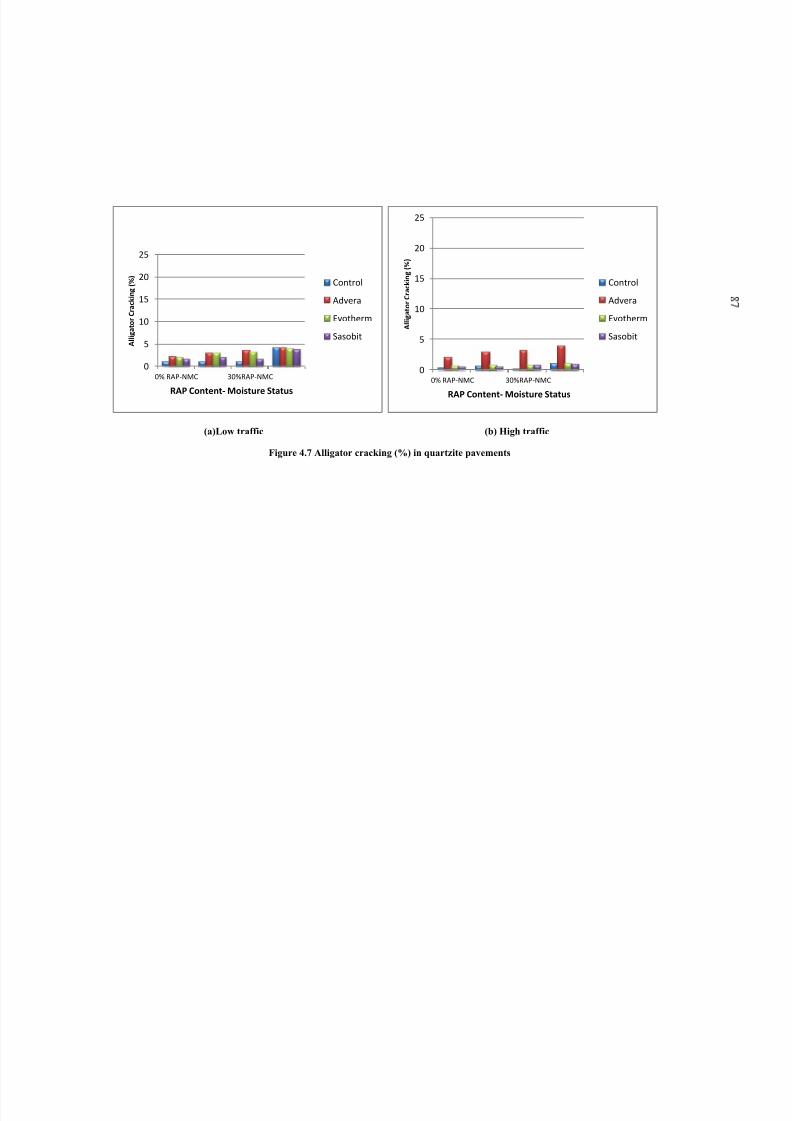
Figure 4.7 Alligator cracking (%) in quartzite pavements (a) Low traffic (b) High traffic... .87
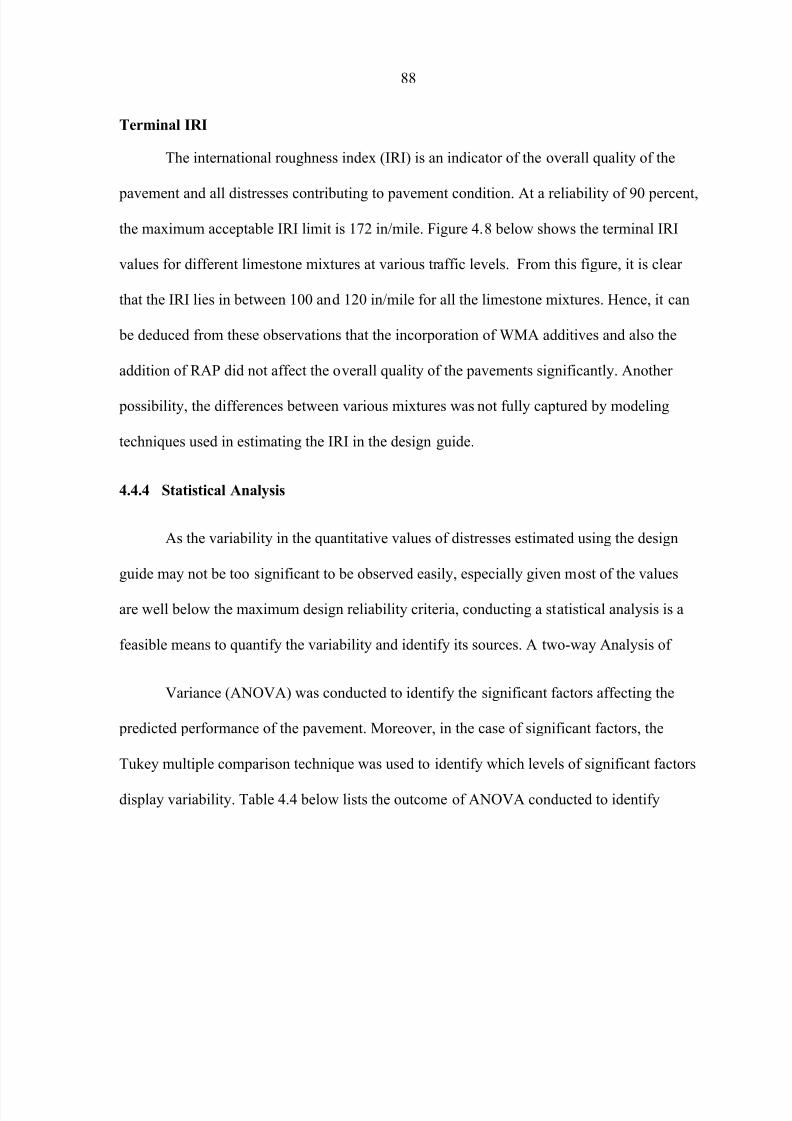
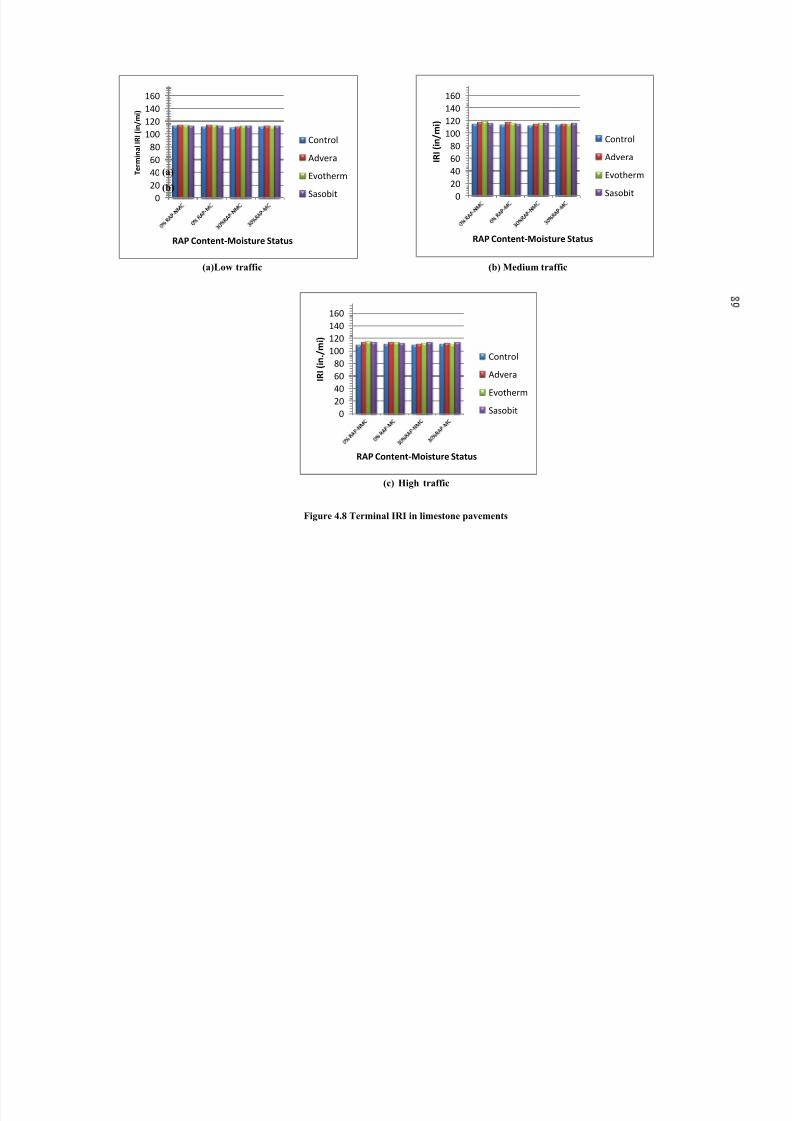
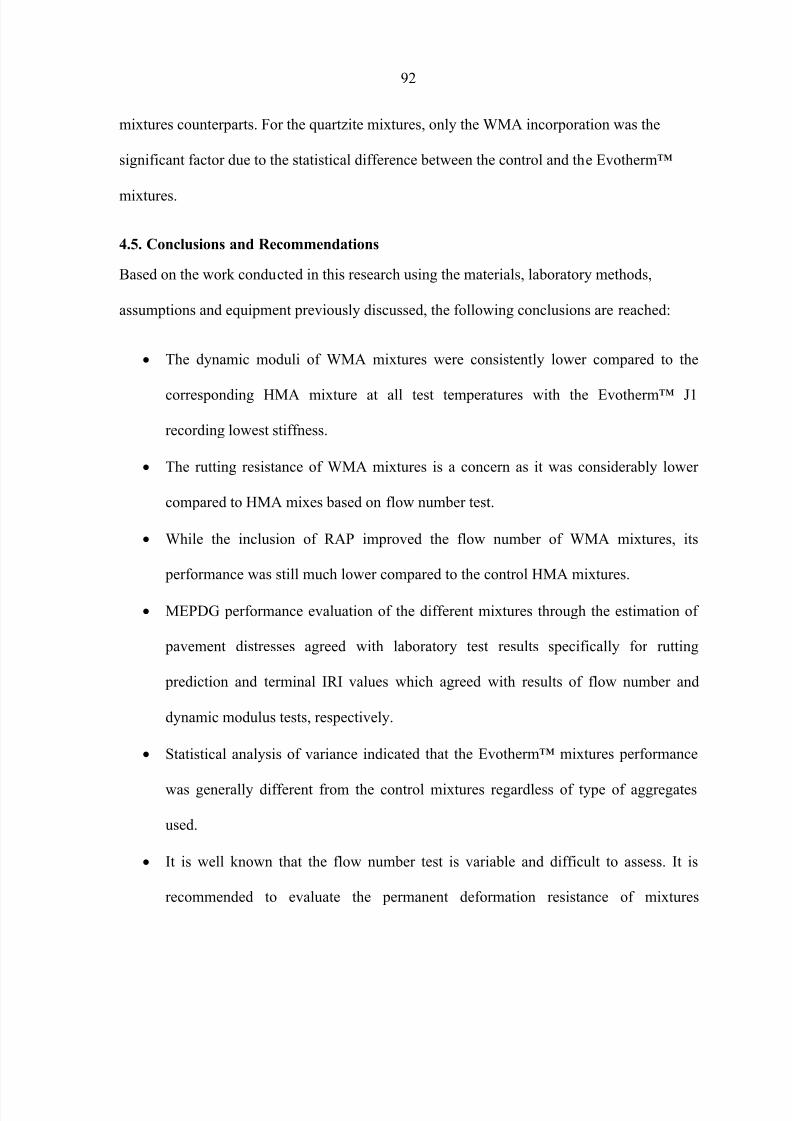
Figure 4.8 Terminal IRI in limestone pavements (a) Low traffic (b) Medium traffic
(c) High traffic………………………………………………………………… ....89
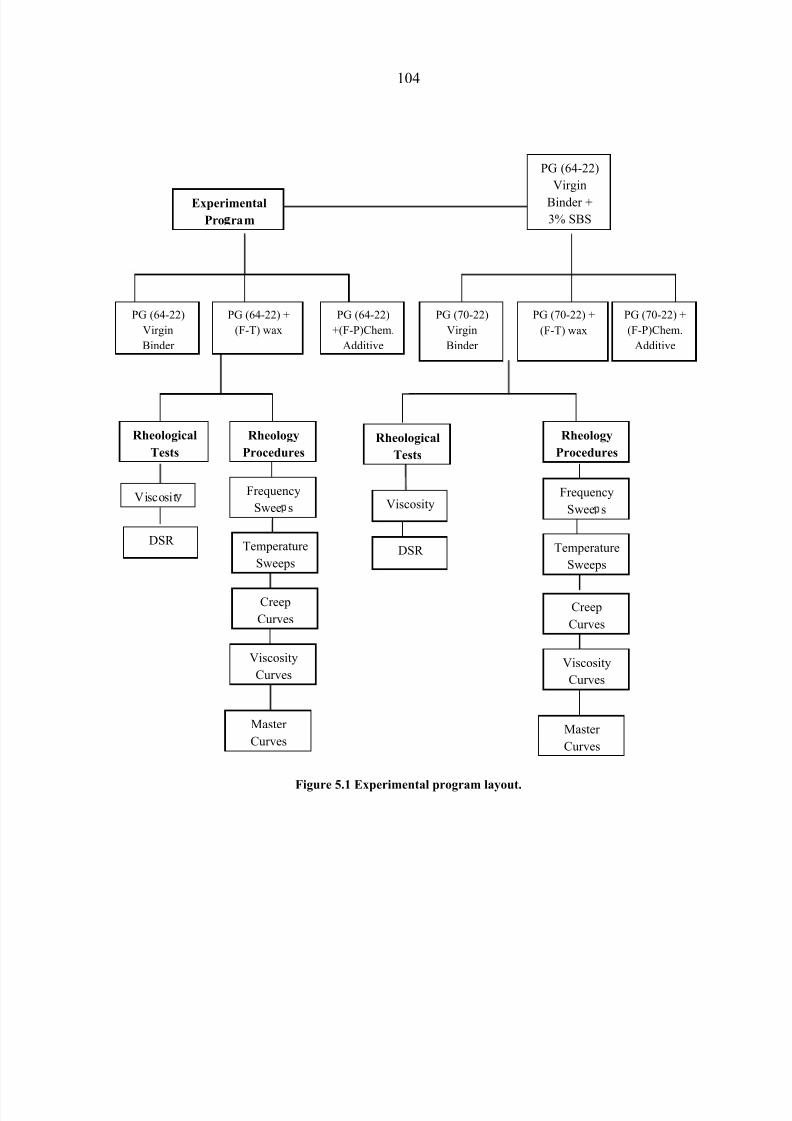
Figure 5.1 Experimental program layout………………………………….……………….104
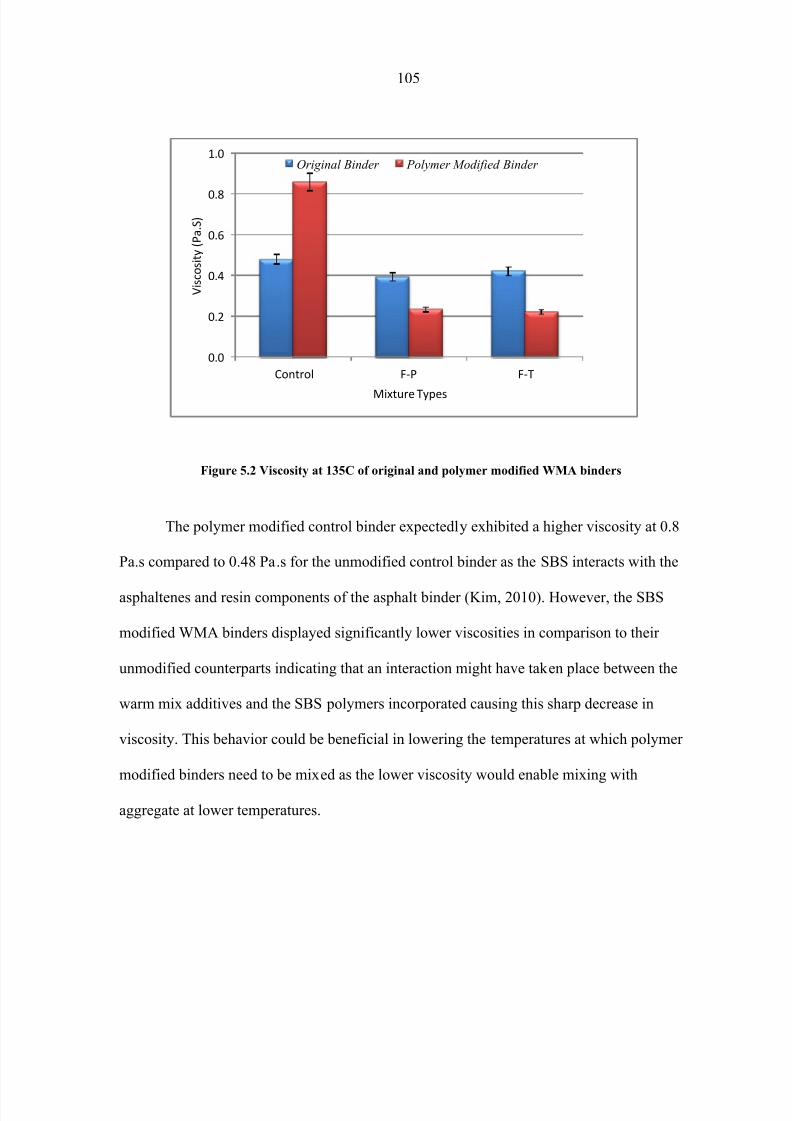
Figure 5.2 Viscosity at 135C of original and polymer modified WMA binders….……….105
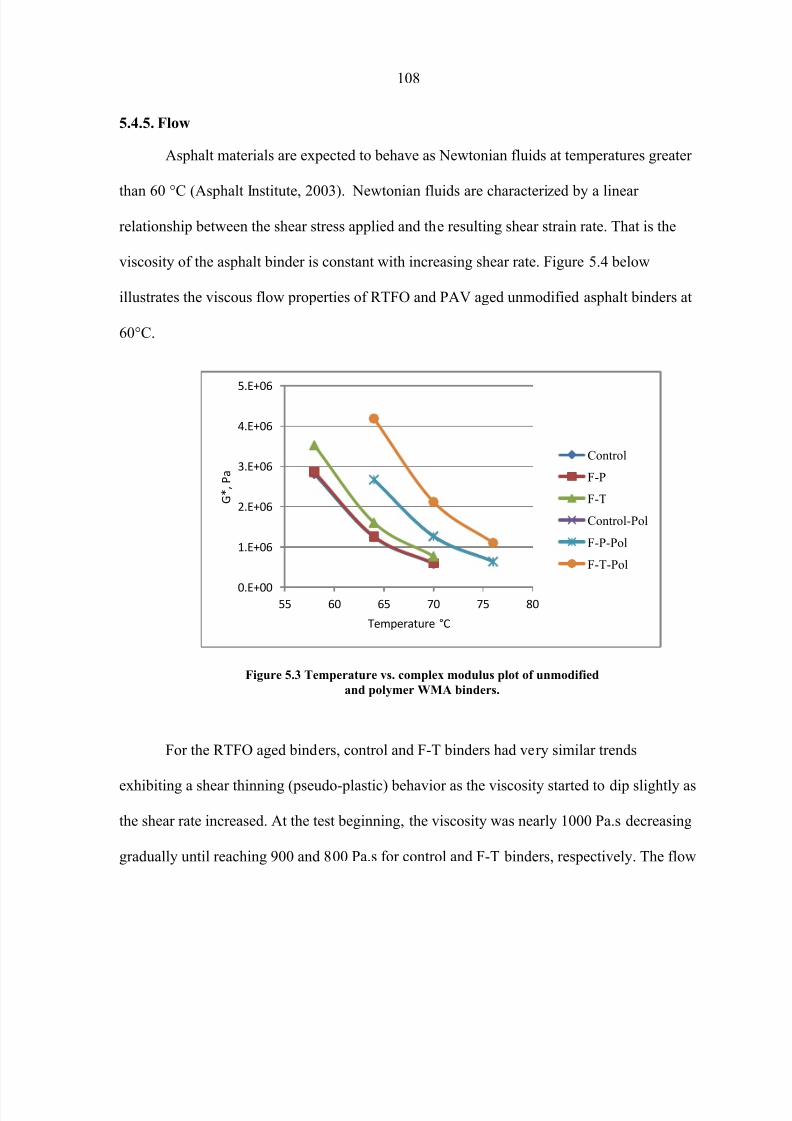
Figure 5.3 Temperature vs. complex modulus plot of unmodified and polymer WMA
binders…………………………………………………………………………....108
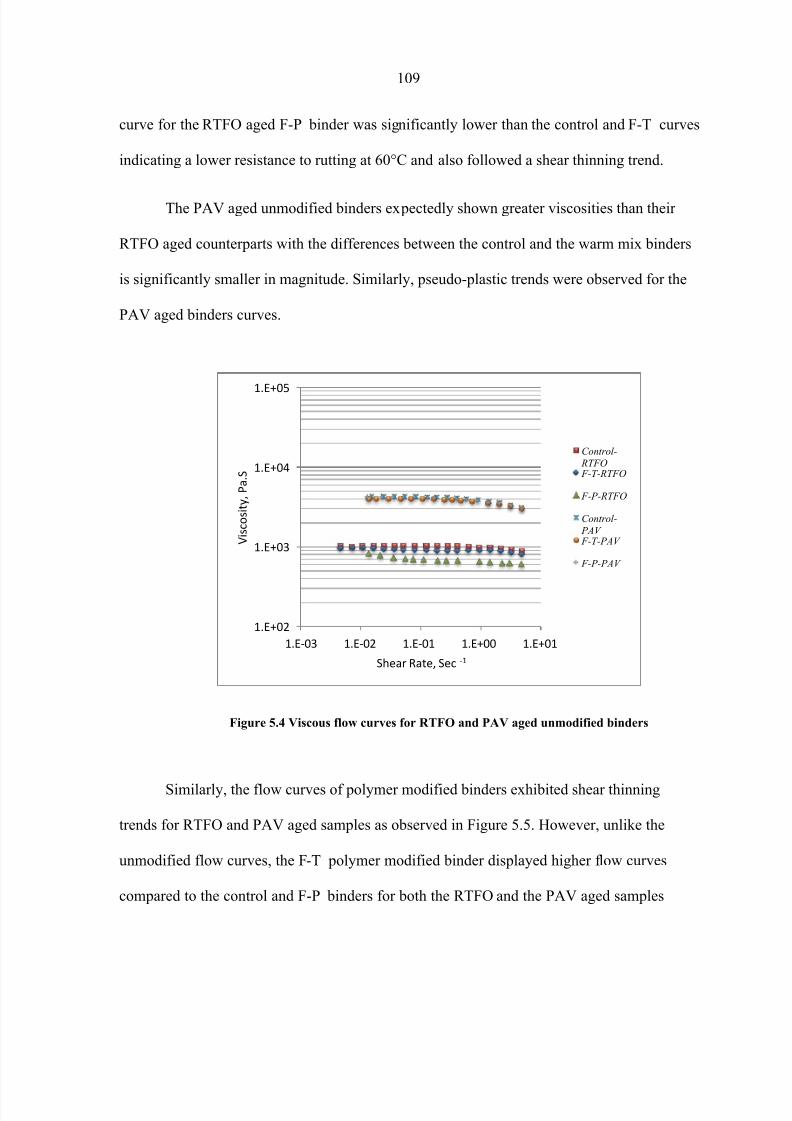
Figure 5.4 Viscous flow curves for RTFO and PAV aged unmodified binders…………...109
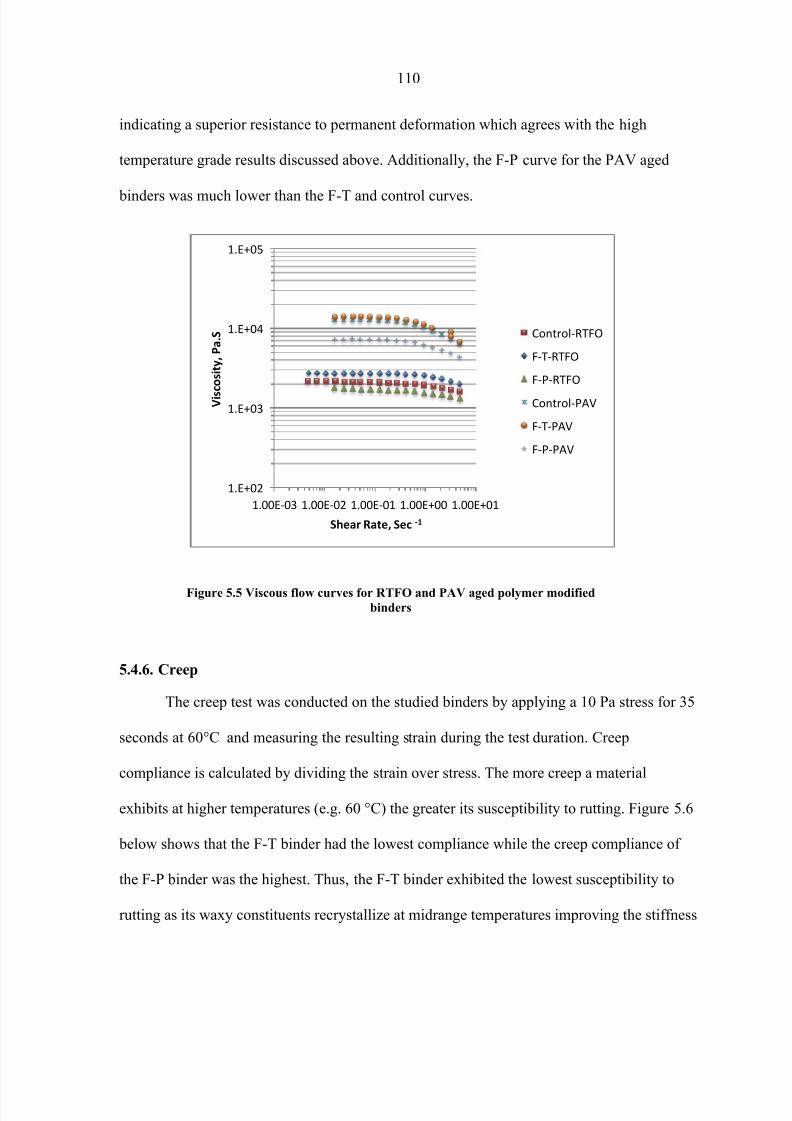
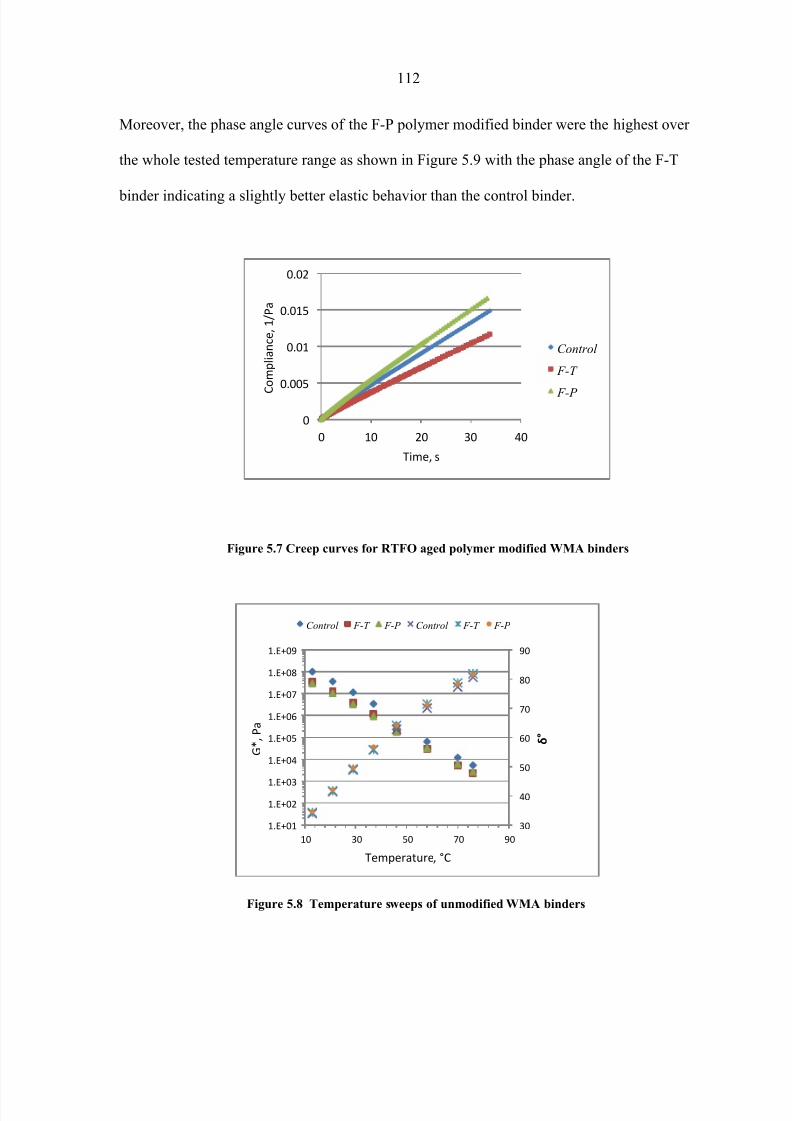
Figure 5.5 Viscous flow curves for RTFO and PAV aged polymer modified binders….....110
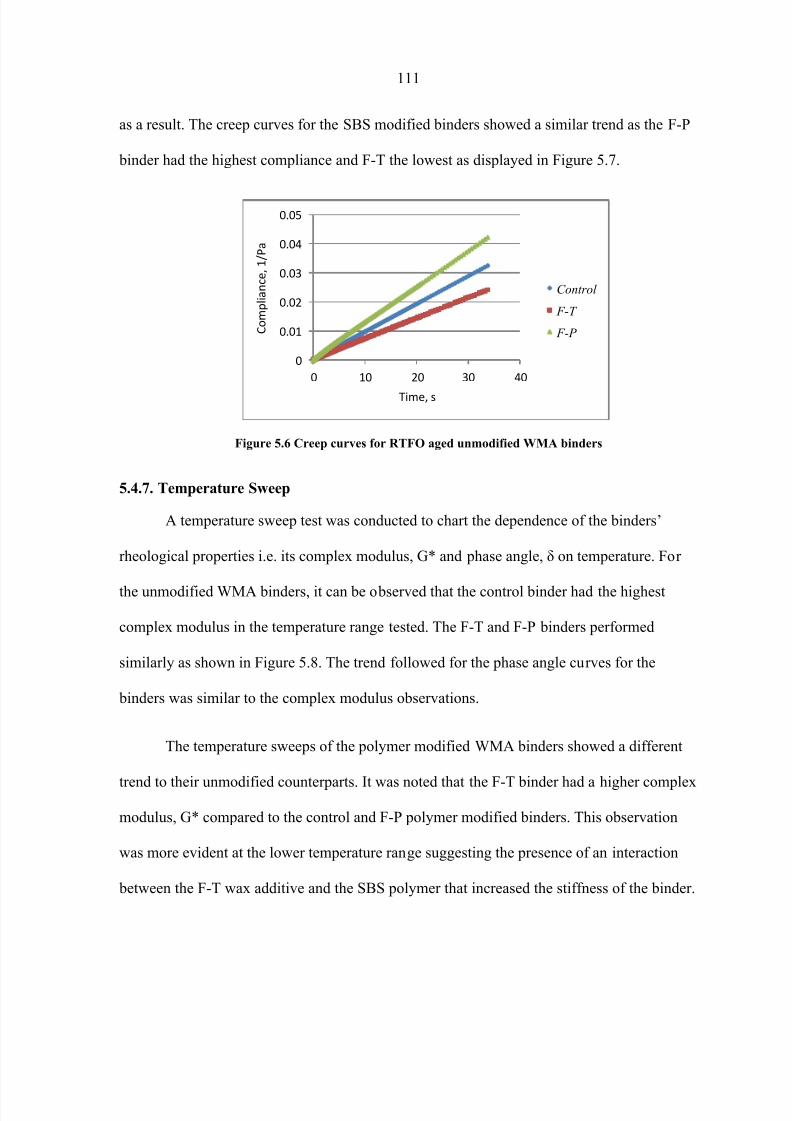
Figure 5.6 Creep curves for RTFO aged unmodified WMA binders……………………...111
Fi 5 7 C f RTFO d l difi d WMA bi d 112
Page 9
8/9/2019 Characterization of Warm Mix Asphalt (WMA) Performance in Differe
http://slidepdf.com/reader/full/characterization-of-warm-mix-asphalt-wma-performance-in-differe 9/247
viii
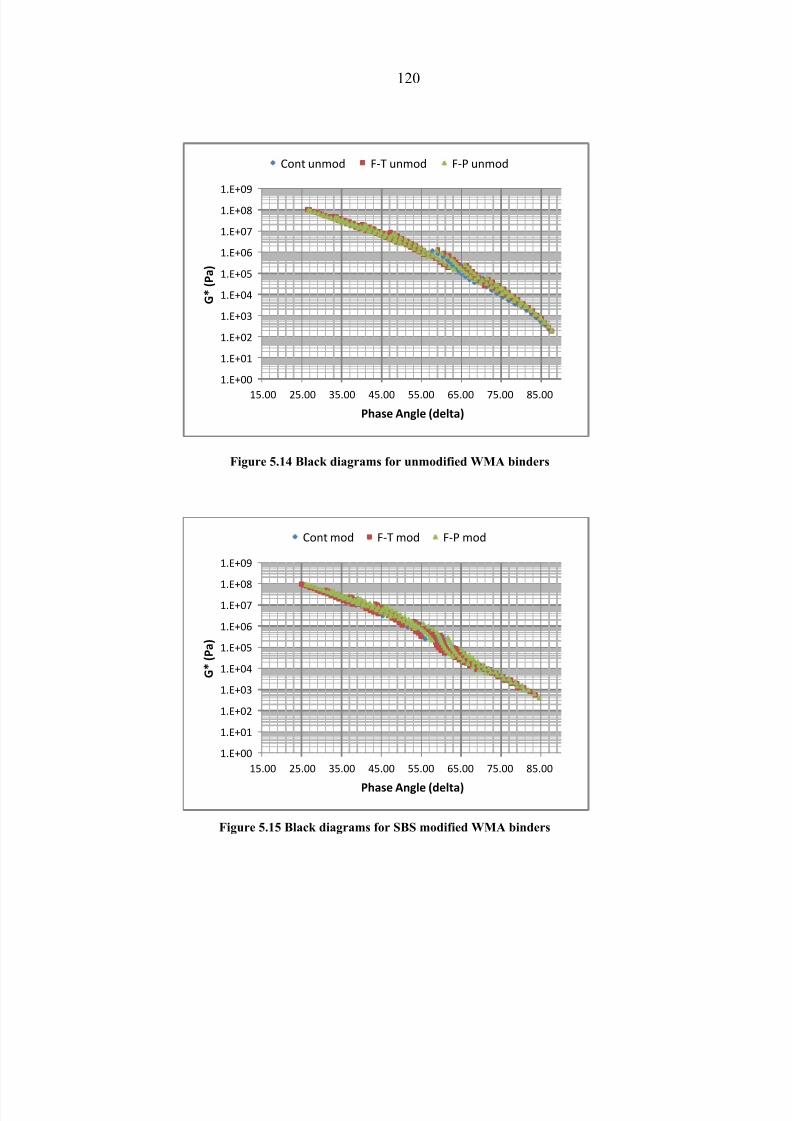
Figure 5.14 Black diagrams for unmodified WMA binders………………………………..120
Figure 5.15 Black diagrams for SBS modified WMA binders………………………….......120
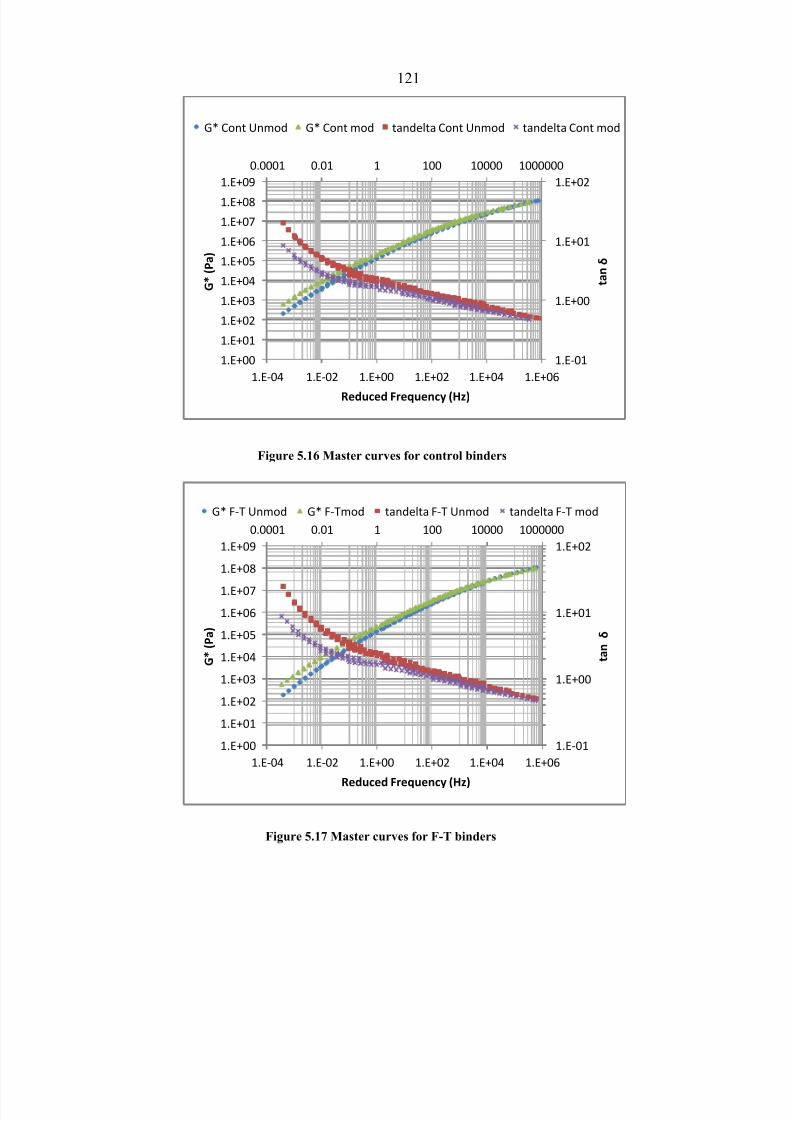
Figure 5.16 Master curves for control binders…………………………………………… ....121
Figure 5.17 Master curves for F-T binders……………………………………….………...121
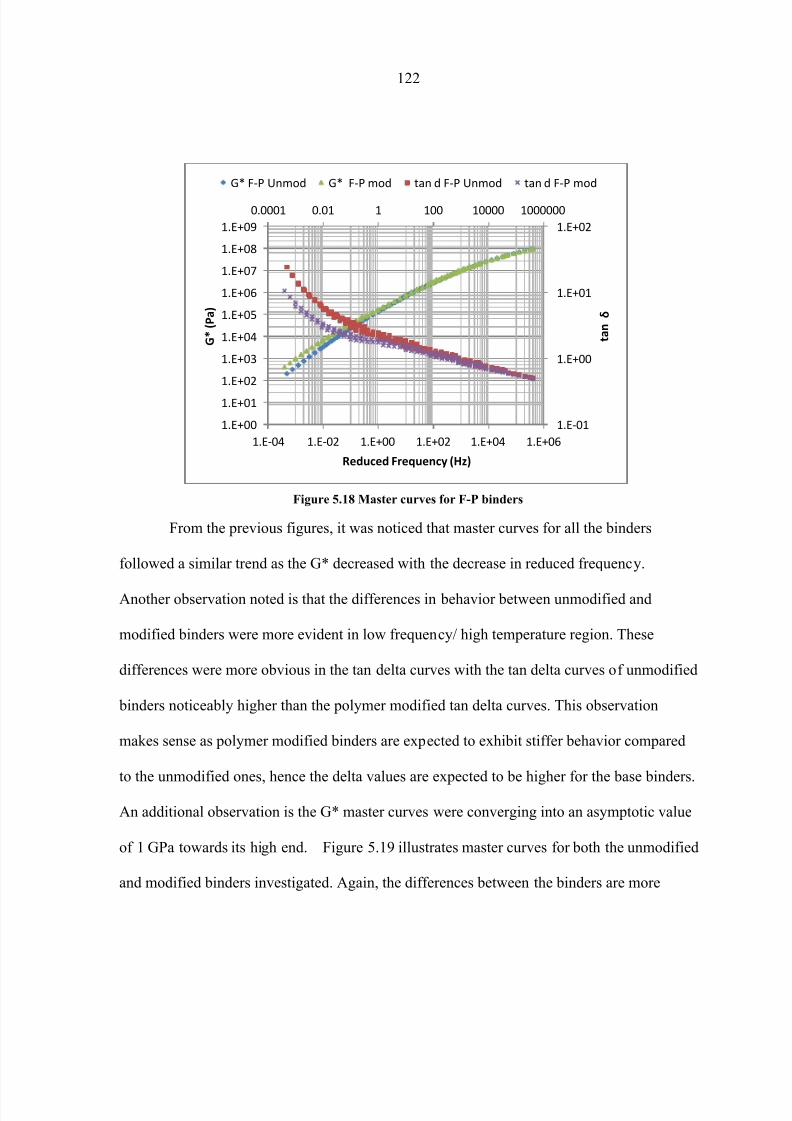
Figure 5.18 Master curves for F-P binders……………………………………….………....122
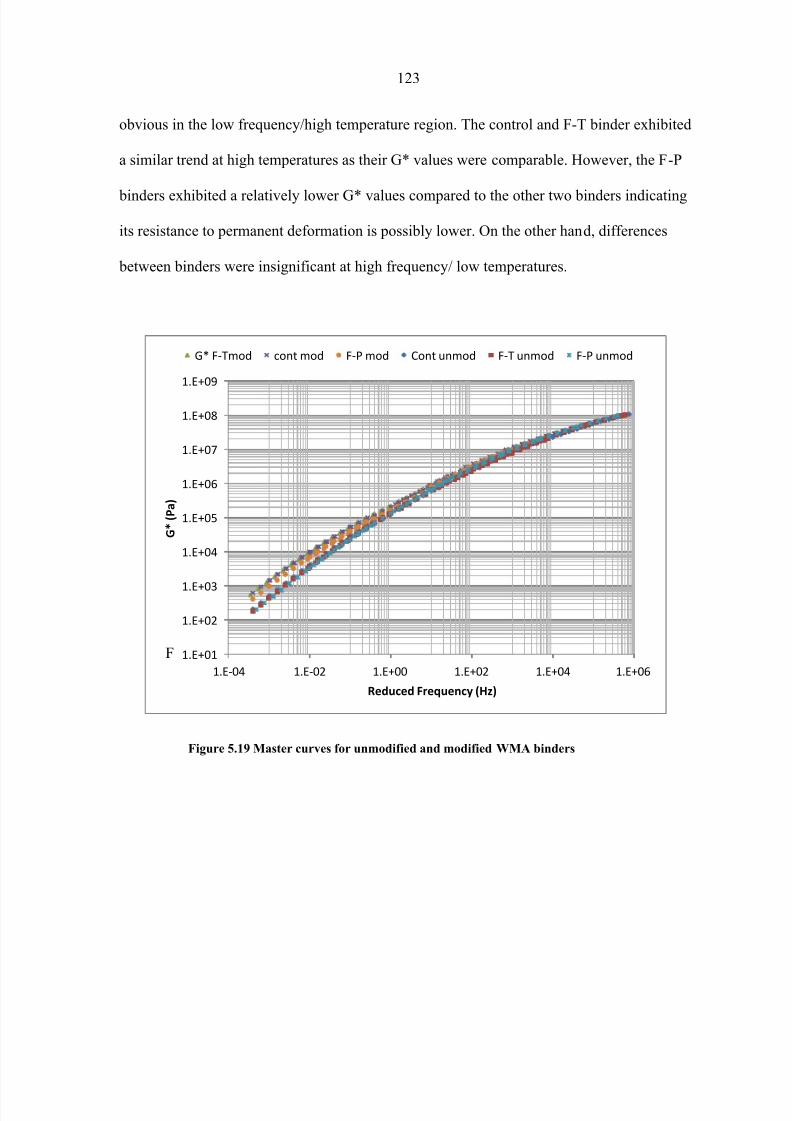
Figure 5.19 Master curves for unmodified and modified WMA binders……….…………..123
Page 10
8/9/2019 Characterization of Warm Mix Asphalt (WMA) Performance in Differe
http://slidepdf.com/reader/full/characterization-of-warm-mix-asphalt-wma-performance-in-differe 10/247
ix
LIST OF TABLES
Table 2.1 Emission Reduction in plants with WMA (%) (D’Angelo et al., 2008)………..….16
Table 2.2: Technologies observed in Europe by the scan team (D’Angelo et al., 2008)…….27
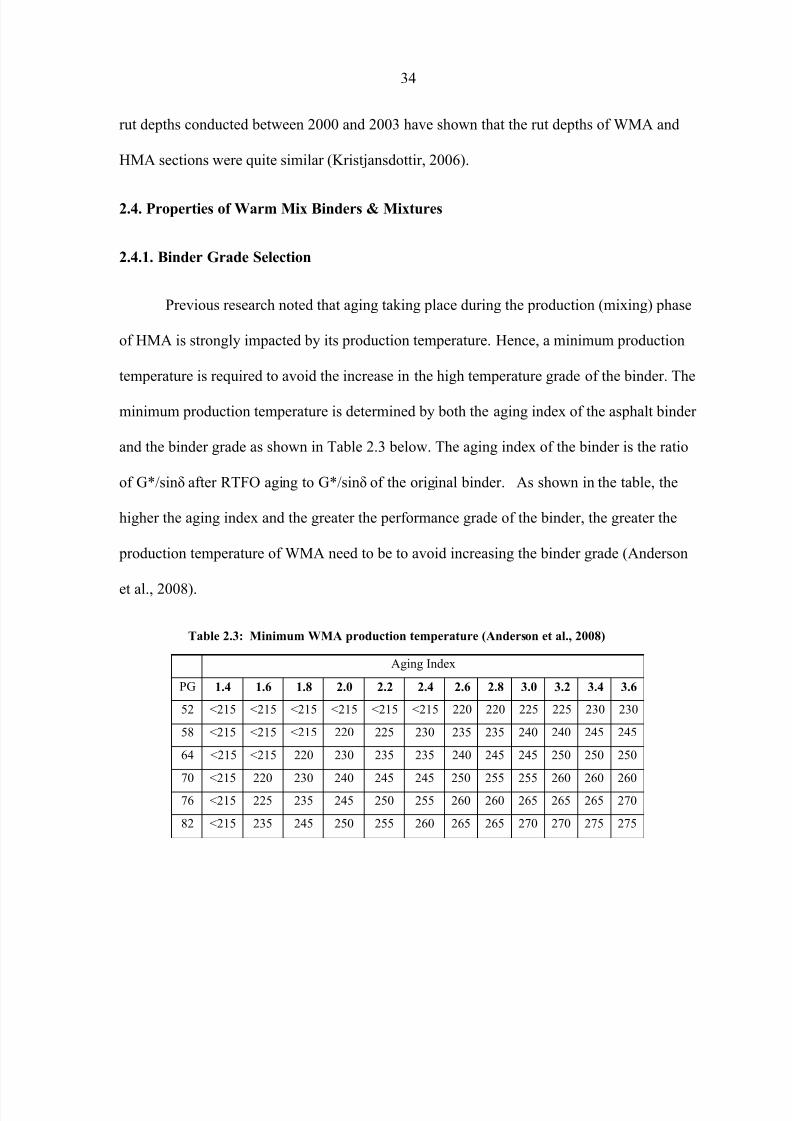
Table 2.3: Minimum WMA production temperature (Anderson et al., 2008)…………….....34
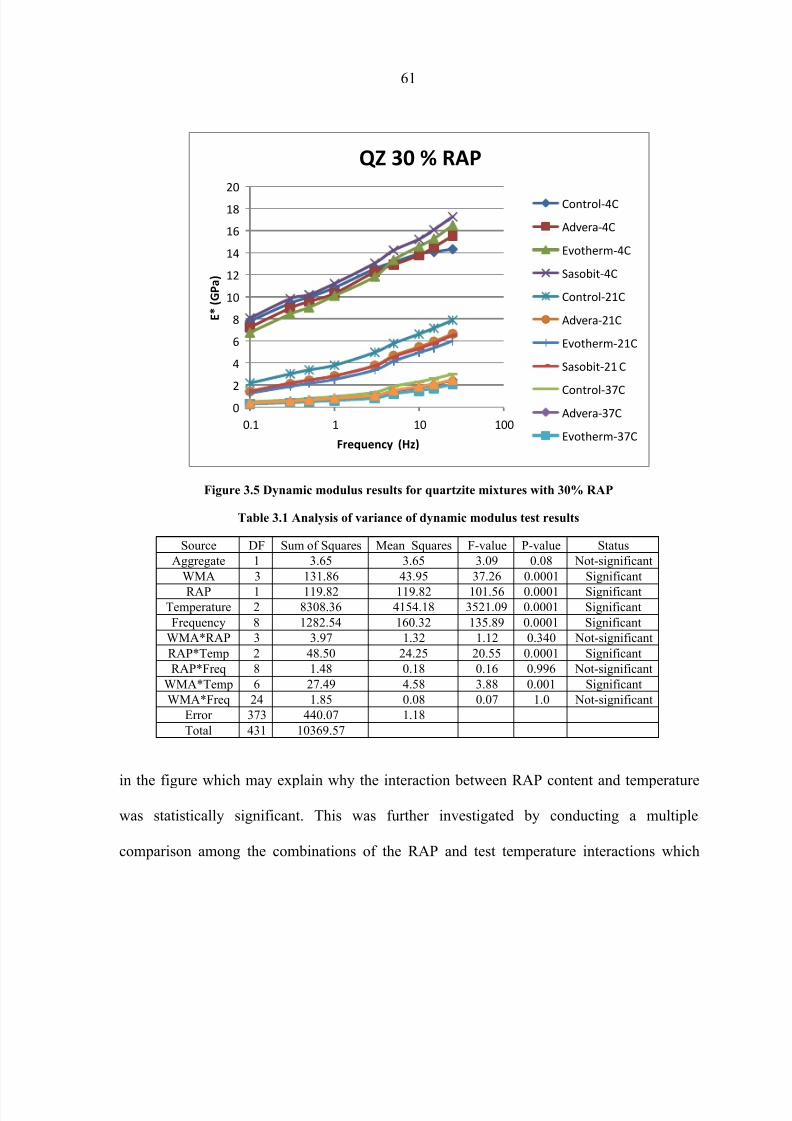
Table 3.1 Analysis of variance of dynamic modulus test results…………………………......61
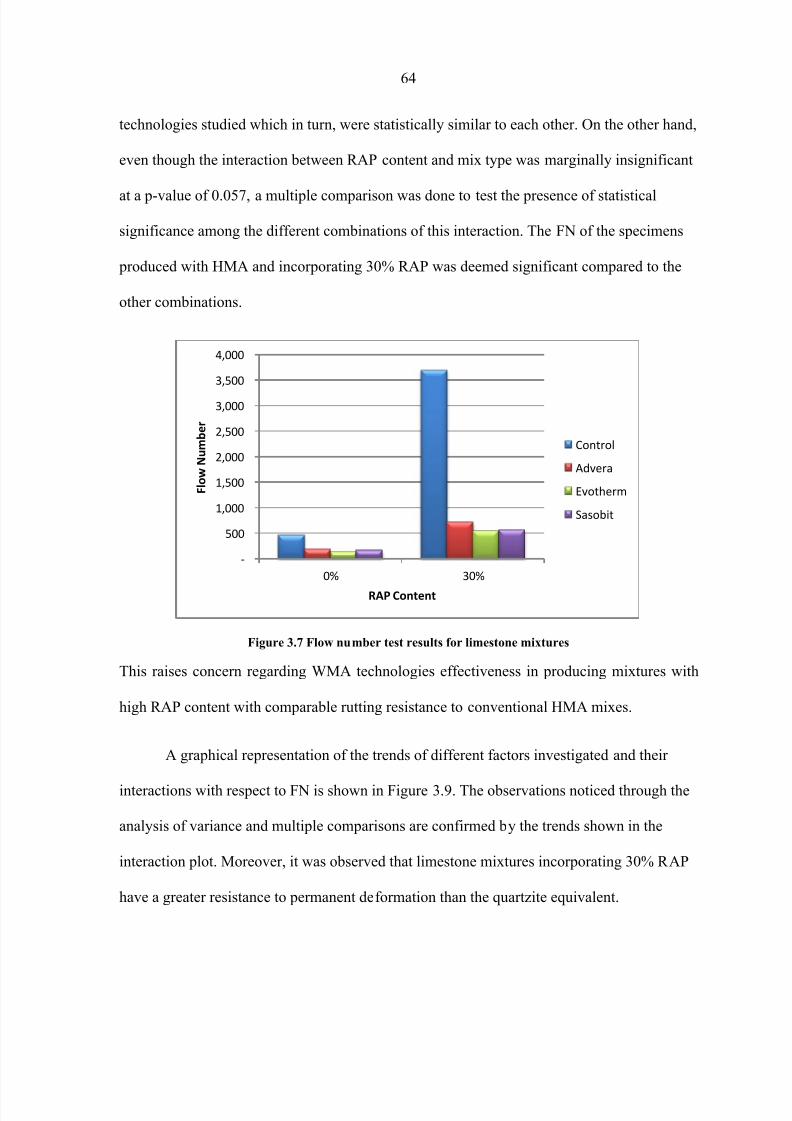
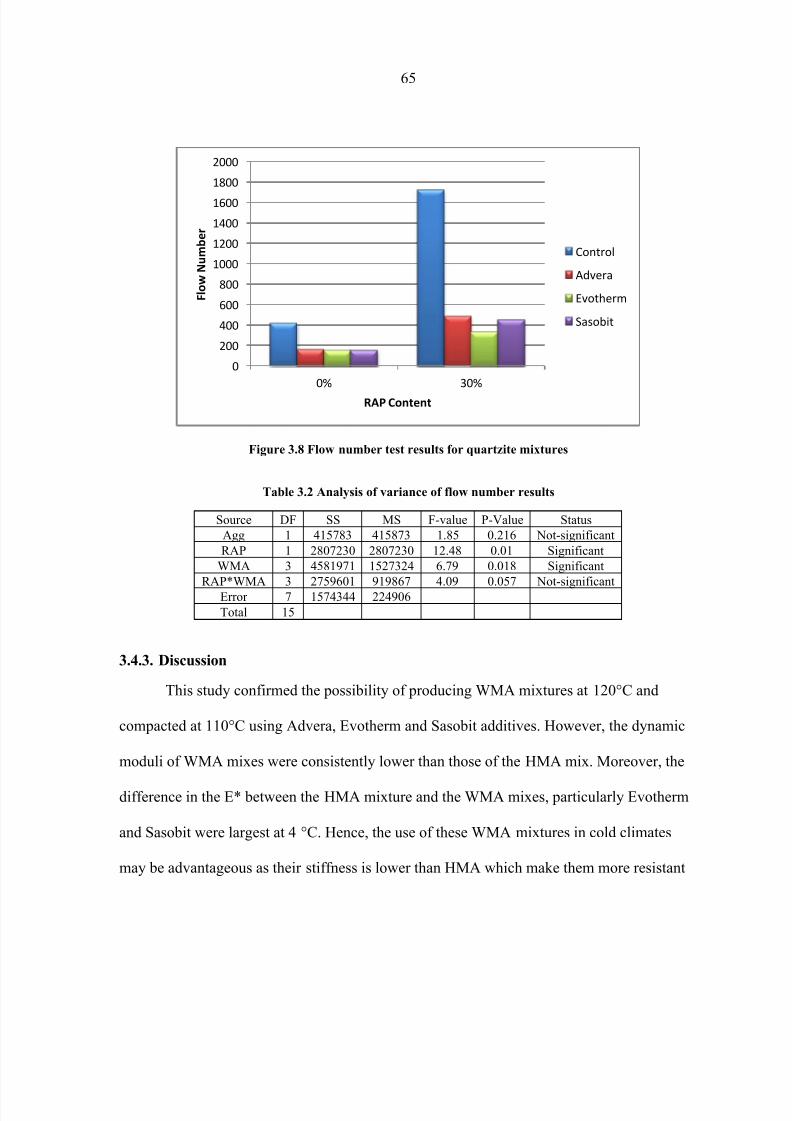
Table 3.2 Analysis of variance of flow number results……………………………………....65
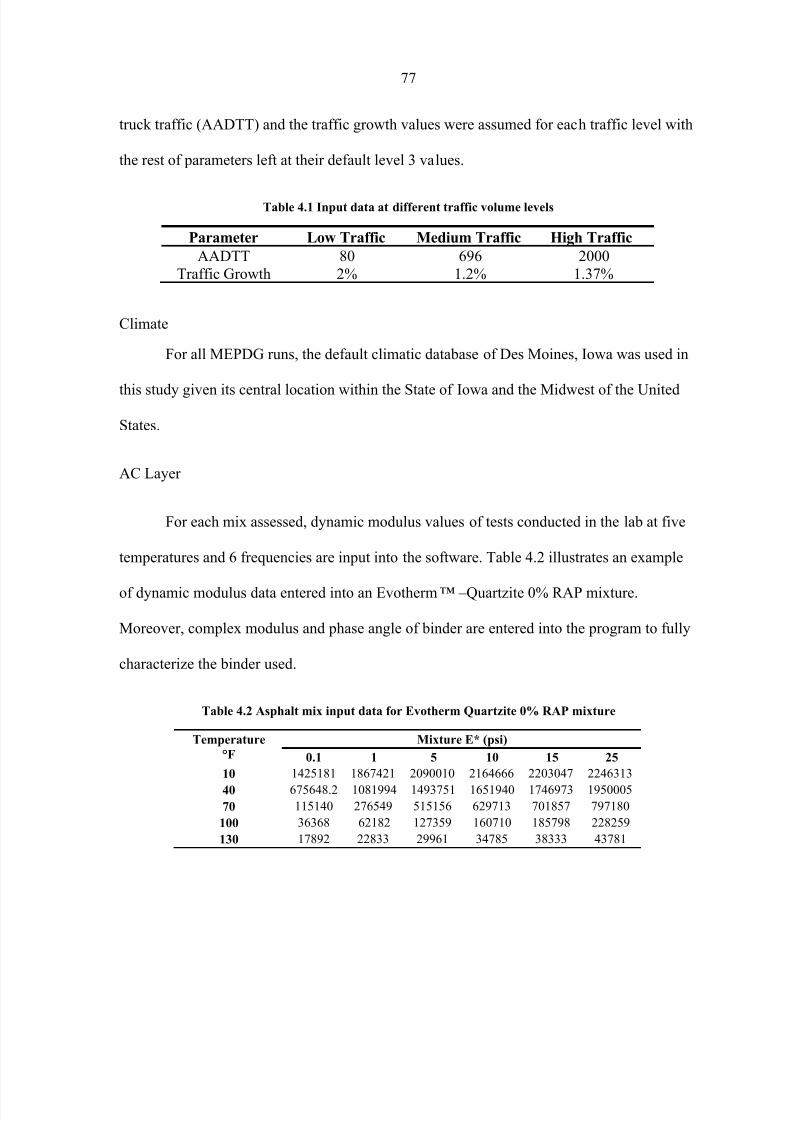
Table 4.1 Input data at different traffic volume levels…………………………………….....77
Table 4.2 Asphalt mix input data for Evotherm Quartzite 0% RAP mixture……………......77
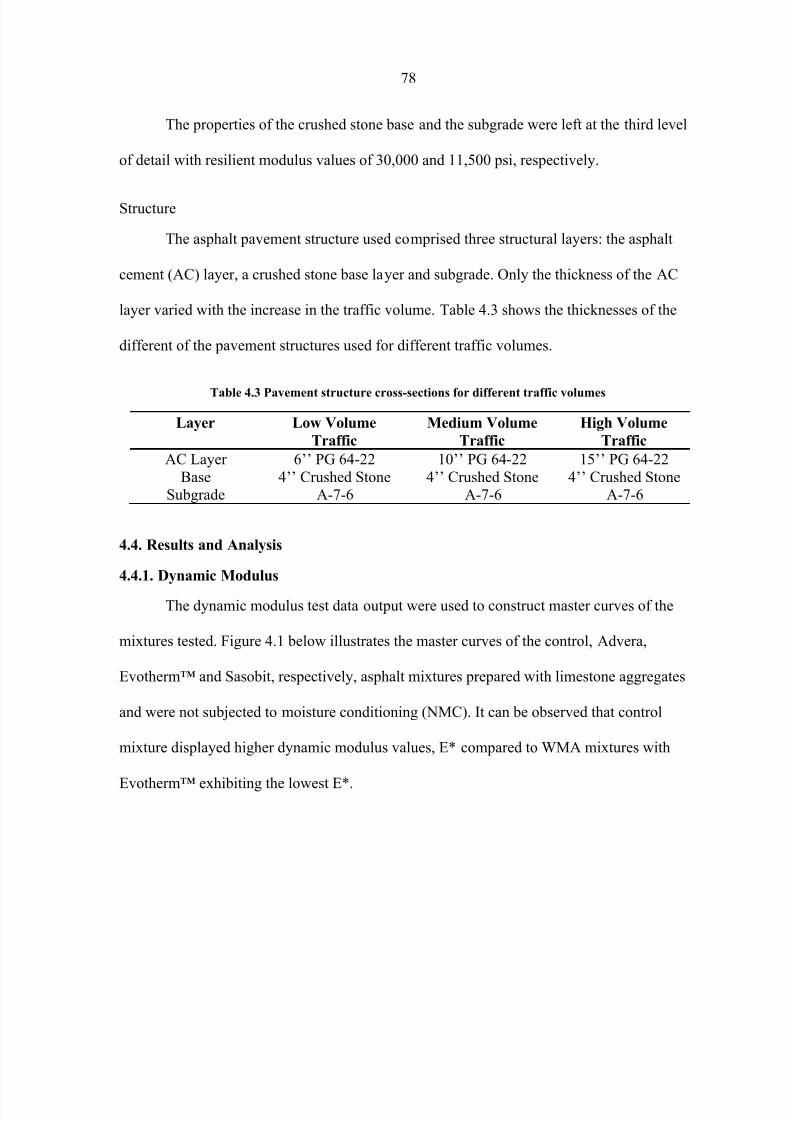
Table 4.3 Pavement structure cross-sections for different traffic volumes……………….….79
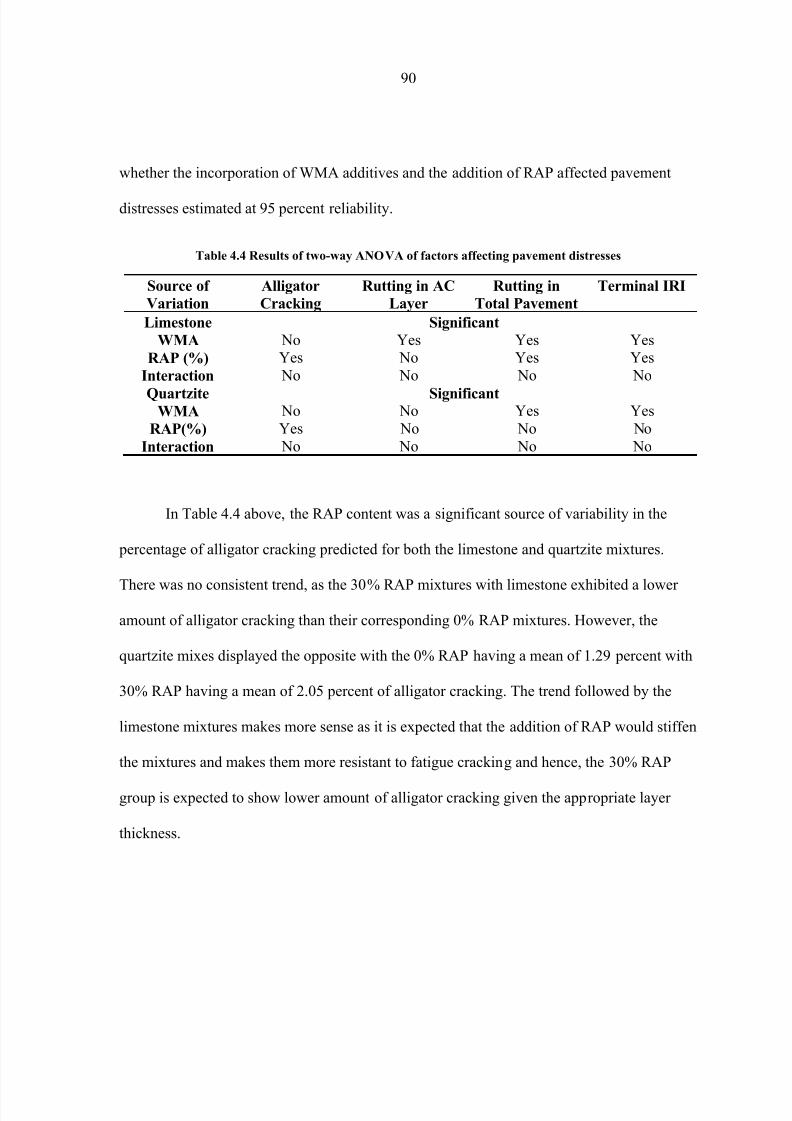
Table 4.4 Results of two-way ANOVA of factors affecting pavement distresses………..….90
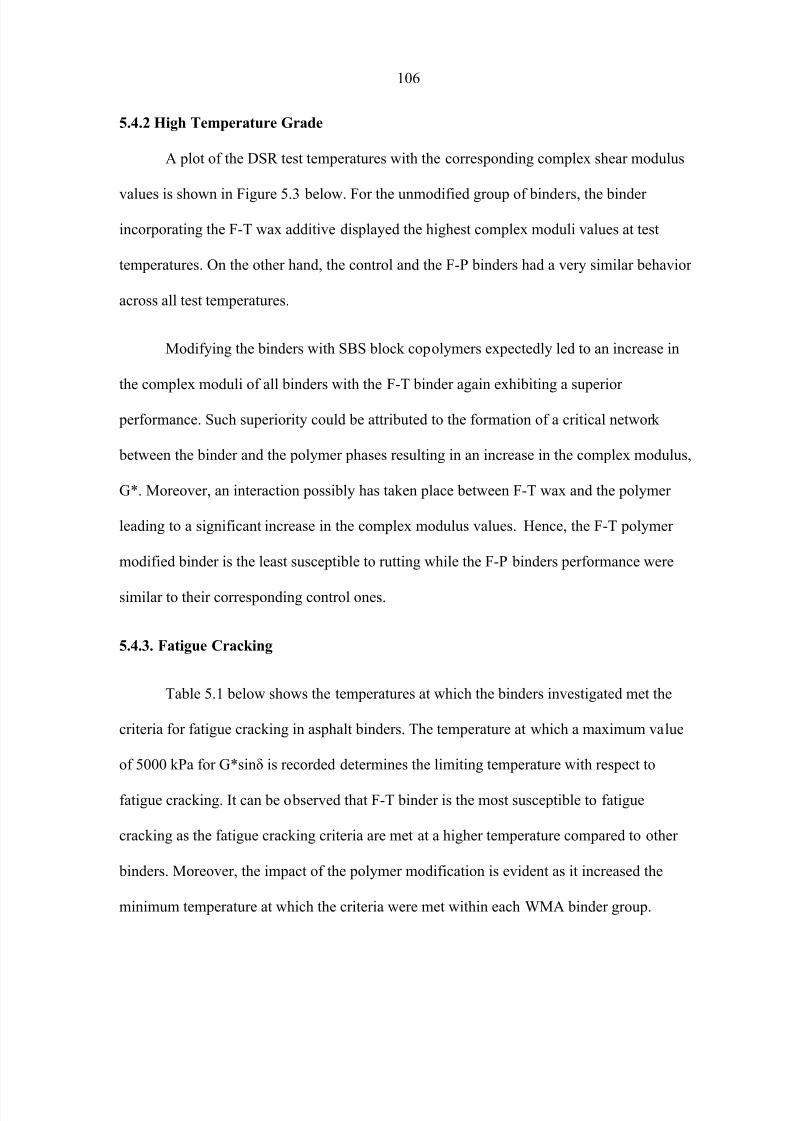
Table 5.1 Minimum temperature for fatigue cracking (°C)……………………………….....107
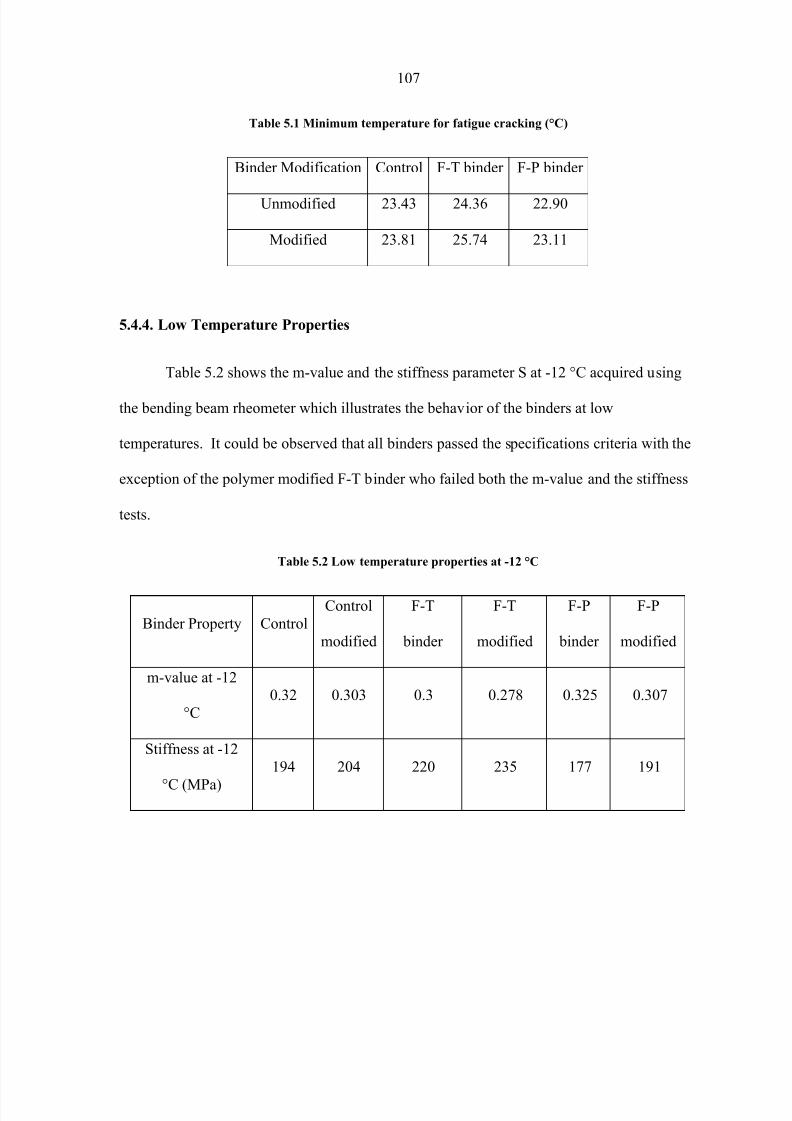
Table 5.2 Low temperature properties at -12 °C…………………………………………....107
Page 11
8/9/2019 Characterization of Warm Mix Asphalt (WMA) Performance in Differe
http://slidepdf.com/reader/full/characterization-of-warm-mix-asphalt-wma-performance-in-differe 11/247
x
ACKNOWLEDGMENTS
I would like to thank God for his numerous blessings and gifts given to man. I would like
also to dedicate this work to the soul of my father who was a friend and mentor before being
a parent. Also, my deepest gratitude goes to my mother and sisters who always encouraged
me throughout the course of my graduate studies.
I would like to thank my major professor, Dr. R.C. Williams for his effort in overseeing this
work. He always provided me with technical guidance and professional mentorship during
my time at Iowa State. I would like also to thank him for his support and encouragement
when I encountered some very testing personal issues amid my pursuit of this academic
degree.
I would like also to acknowledge the efforts and the academic guidance of my co-advisor,
Dr. Safwan Khedr, professor at my old alma mater, AUC. I appreciate his encouragement for
me to pursue my postgraduate studies and his constant availability for advice and his support
when I encountered very testing personal issues while pursuing my degree.
I would like to thank Dr.Vern Schaefer, Dr. Fouad Fanous, Dr. Kejin Wang and Dr. Eric
Cochran for serving on my POS committee and for their help and valuable assistance during
Page 12
8/9/2019 Characterization of Warm Mix Asphalt (WMA) Performance in Differe
http://slidepdf.com/reader/full/characterization-of-warm-mix-asphalt-wma-performance-in-differe 12/247
xi
ABSTRACT
With the prices of crude oil increasing and reserves of natural nonrenewable
resources dwindling over time, the needs for adopting greener and more sustainable
approaches in various construction activities are stronger. The asphalt production industry
has been keen during the last few decades to reduce the impact of its activities on the
environment especially regions adjacent to its operating activities and on natural resources.
Thus, recycled materials such as reclaimed asphalt pavement (RAP) and recycled asphalt
shingles (RAS) are increasingly being used in the production of asphalt mixtures. Moreover,
different techniques to produce and place asphalt mixtures at lower temperatures than the
typical hot mix asphalt (HMA) temperatures are recently being used. These techniques are
currently known as warm mix asphalt (WMA) technologies.
The performance of three commonly used warm mix technologies: Advera, Evotherm
J1 and Sasobit were examined in comparison to a control HMA mixture with respect to
Page 13
8/9/2019 Characterization of Warm Mix Asphalt (WMA) Performance in Differe
http://slidepdf.com/reader/full/characterization-of-warm-mix-asphalt-wma-performance-in-differe 13/247
xii
there is a significant difference in the performance of HMA mixtures and the three WMA
technologies investigated. Dynamic modulus data of WMA mixtures were consistently lower
compared to HMA, with the difference in E* values decreasing with increasing temperature.
The incorporation of RAP increased the dynamic modulus of all mixtures but HMA mixture
was still higher than WMA mixtures. The impact of RAP incorporation decreased as
temperature increased. Finally, the rutting resistance of WMA mixtures was considerably
lower compared to HMA mixes even after incorporation of RAP. Thus, WMA technologies
suitability for hot regions needs to further investigated.
MEPDG design runs were performed to assess the performance of lab produced
asphalt mixtures incorporating WMA and RAP and compare it to the performance of
corresponding control mixtures. MEPDG output agreed with laboratory test results
specifically for rutting prediction and terminal IRI values. The statistical analysis of variance
indicated that the Evotherm™ mixtures performance was generally different from the control
mixtures regardless of type of aggregates used.
Page 14
8/9/2019 Characterization of Warm Mix Asphalt (WMA) Performance in Differe
http://slidepdf.com/reader/full/characterization-of-warm-mix-asphalt-wma-performance-in-differe 14/247
xiii
temperatures. On the other hand, the modified binder incorporating the waxy WMA additive
exhibited stiffer behavior indicating the presence of more advanced polymer networks within
the binder structure. Moreover, the wax additive had an anti-oxidizing effect on the aging
rate of the binder using pressure aging vessel (PAV).
Page 15
8/9/2019 Characterization of Warm Mix Asphalt (WMA) Performance in Differe
http://slidepdf.com/reader/full/characterization-of-warm-mix-asphalt-wma-performance-in-differe 15/247
1
CHAPTER 1: INTRODUCTION
The rise in the prices of energy resources and the steadily increasing depletion of
nonrenewable natural resources that are considered input raw materials for plenty of
industries were cause for a rethink about adopting more sustainable approaches in utilizing
these natural resources. Persistent warnings regarding the adverse effects of the excessive
emission of greenhouse gases most notably, carbon dioxide led to intensive efforts on a
global scale to address these concerns culminating with the ratification of the Kyoto protocol
by the European Union in which they pledged to lower the carbon dioxide emissions by 15%
by 2010. These newly imposed environmental restrictions spurred the asphalt industry bodies
in European countries to look into new approaches and techniques that lower emissions and
energy consumption. The production of hot mix asphalt (HMA) raises a number of
environmental concerns because of the emission of gases such as CO2, SO2 and NOx into the
Page 16
8/9/2019 Characterization of Warm Mix Asphalt (WMA) Performance in Differe
http://slidepdf.com/reader/full/characterization-of-warm-mix-asphalt-wma-performance-in-differe 16/247
2
technologies, 2) water bearing additive technologies, 3) organic additive technologies, and 4)
chemical additive technologies.
In addition to its obvious benefits regarding the cleaner/environmental production of
asphalt, other benefits provided by the WMA technologies acted as additional drivers that
increased the interest in trying and using these technologies such as the lower viscosity of the
binders which in turn improved the compactability of mixtures, lower susceptibility to
oxidative hardening as the asphalt was exposed to lower mixing temperatures which meant
the binders have undergone less aging and finally the perceived lesser aging meant that there
is higher potential for accommodating higher contents of recycled/reclaimed asphalt
pavement (RAP).
After being introduced to the WMA technologies developed in Europe since the mid
1990s, governmental agencies and asphalt industry bodies in the United States focused on
establishing frameworks through which the suitability of applying WMA techniques in the
U it d St t i i ti t d H l h t di t i d t i ti t th
Page 17
8/9/2019 Characterization of Warm Mix Asphalt (WMA) Performance in Differe
http://slidepdf.com/reader/full/characterization-of-warm-mix-asphalt-wma-performance-in-differe 17/247
3
there is a concern regarding its resistance to moisture susceptibility as there is a worry that
the lower production temperature will not lead to the drying of the aggregates used in the
asphalt mix affecting the binder adhesion to the aggregate surface adversely as a result. In
addition, another concern is that WMA mixtures are less stiff than conventional HMA
mixtures due to its reduced aging as the binder was exposed to lower temperatures during
production which could make WMA pavements more vulnerable to rutting problems.
Moreover, the ability of WMA mixtures to incorporate higher RAP content while being
investigated in previous research, the impact of higher RAP incorporation needs further
verification. With the number of projects using WMA mixtures still small, the ability of
pavement performance evaluating software packages such as the Mechanistic Empirical
Pavement Design Guide (MEPDG) to predict the performance of WMA mixtures and
whether these predictions are comparable to the output test data from performance tests
conducted on these mixtures needs investigation.
Little research has been conducted on the rheological behavior of WMA binders and
Page 18
8/9/2019 Characterization of Warm Mix Asphalt (WMA) Performance in Differe
http://slidepdf.com/reader/full/characterization-of-warm-mix-asphalt-wma-performance-in-differe 18/247
4
loading (flow number tests). Secondly, this work looked into whether WMA additives enable
the production of high RAP content (30%) mixtures with comparable performance to HMA.
Thirdly, the performance of pavements using the asphalt mixtures prepared in this work is
predicted by the MEPDG software using the test data acquired from laboratory testing. The
performance of the pavement sections was assessed based on the amount of alligator
cracking and permanent deformation predicted by the software.
Fourthly, the basic characteristics of a PG 64-22 binder incorporating Evotherm and
Sasobit are studied by carrying out Superpave binder testing procedures on the binders in its
original form, rolling thin film (RTFO) aged and pressure aging vessel (PAV) aged states.
These tests were conducted using rotational viscometer, dynamic shear rheometer (DSR) and
bending beam rheometer (BBR). Fifthly, the basic rheological properties of SBS polymer
modified WMA binders were measured and the effect of polymer modification on the
characteristics of the binders was analyzed. Sixthly, additional rheological procedures such
as viscous flow, creep, frequency and temperature sweeps were performed to further
Page 19
8/9/2019 Characterization of Warm Mix Asphalt (WMA) Performance in Differe
http://slidepdf.com/reader/full/characterization-of-warm-mix-asphalt-wma-performance-in-differe 19/247
5
1.4. Dissertation Organization
This dissertation follows a journal paper format and is divided into six chapters
including three papers. Each paper appears as a chapter including its related literature review
and background, analysis, observations, conclusions and recommendations. The first chapter
is a general introduction that provides a brief account about the emergence of WMA
technologies and its potential benefits and concerns regarding its application. In this chapter,
a problem statement regarding the key research questions concerning the topic of this
dissertation is provided along with the research objectives this work attempts to achieve. A
brief outline of the methodologies used to achieve these objectives was briefly outlined.
Chapter 2 discusses the emergence of WMA technologies and previous research conducted
on WMA binders and mixtures in laboratories or field projects. The major findings of past
studies on the performance of binders and mixtures incorporating various WMA additives are
presented. Chapter 3 titled An Evaluation of Warm Mix Asphalt Additives and Reclaimed
Asphalt Pavement (RAP) on Performance Properties discusses the mechanical performance
Page 20
8/9/2019 Characterization of Warm Mix Asphalt (WMA) Performance in Differe
http://slidepdf.com/reader/full/characterization-of-warm-mix-asphalt-wma-performance-in-differe 20/247
6
performance to conventional control HMA mixtures. These findings were reached with the
help of statistical analysis of the output data generated from the software runs. Chapter 5 is a
paper titled Evaluation of the Rheological Properties of Polymer Modified Warm Mix
Asphalt Binders and discusses the rheological behavior of different unmodified and polymer
modified binders incorporating two WMA additives. The rheological behavior of the binders
was investigated by conducting basic Superpave binder testing in addition to frequency and
temperature sweeps at a wide range of test temperatures within which critical fatigue and
permanent deformation typical critical temperatures lie. The findings of this chapter included
which of the two WMA binder groups is more susceptible to permanent deformation
problems and the impact of polymer modification was quantified through qualitative and
quantitative analysis of the complex modulus and phase angles of the binders tested.
Moreover, the impact of the Sasobit and Evotherm additives on the aging trend of RTFO
aged binders was analyzed with Sasobit identified to have an antioxidant effect on the rate of
aging. Finally, Chapter 6 provides a summary, conclusions and recommendations for further
Page 21
8/9/2019 Characterization of Warm Mix Asphalt (WMA) Performance in Differe
http://slidepdf.com/reader/full/characterization-of-warm-mix-asphalt-wma-performance-in-differe 21/247
Page 22
8/9/2019 Characterization of Warm Mix Asphalt (WMA) Performance in Differe
http://slidepdf.com/reader/full/characterization-of-warm-mix-asphalt-wma-performance-in-differe 22/247
8
Patent rights of the Csanyi process were attained by Mobil of Australia in 1968 that
modified the process by substituting steam with 1-2% cold water and a more extensive
mixing process. The Mobil process, also known as Foamix, comprised the introduction of
cold water under controlled flow and pressure into the heated asphalt binder in a specially
developed foaming chamber. Consequently, the foamed asphalt is discharged into the cold,
moist aggregate using spray bar nozzles (Lee, 1980).
Chevron developed mixture and thickness design methodologies in their Bitumuls
Mix Manuals for paving mixtures stabilized with emulsified asphalts in the 1970s.
Moreover, agencies like, the Federal Highway Administration (FHWA) and Asphalt
Emulsion Manufacturers Association (AMEA) published similar guidelines in 1979 and
1981, respectively (Button, et al., 2007). In 1994, Button reported that Maccarone and his
team investigated cold-mixed asphalt-based foamed bitumen and reached the conclusion that
the use of cold mixtures on roads was becoming more acceptable due to its energy efficiency
and lesser emissions.
Page 23
8/9/2019 Characterization of Warm Mix Asphalt (WMA) Performance in Differe
http://slidepdf.com/reader/full/characterization-of-warm-mix-asphalt-wma-performance-in-differe 23/247
9
2.1 WMA Technologies Classification
WMA technologies can be classified differently, either according to degree of
temperature reduction or by type. If classified by type, WMA technologies can be classified
into two major types, technologies that rely on water or those that comprise a form of
chemical additive to force the temperature reduction.
2.1.1 Water-based WMA Technologies
WMA technologies that rely on water can be further classified into:
foaming processes such as Astec Double Green System, or
foaming techniques that rely on the introduction of foaming additives
such as Advera or Aspha-min.
Wielinski et al. (2009) and Middleton et al. (2009) described the foaming process as a
procedure where a given volume of water is added to the hot binder, with the water turning
Page 24
8/9/2019 Characterization of Warm Mix Asphalt (WMA) Performance in Differe
http://slidepdf.com/reader/full/characterization-of-warm-mix-asphalt-wma-performance-in-differe 24/247
10
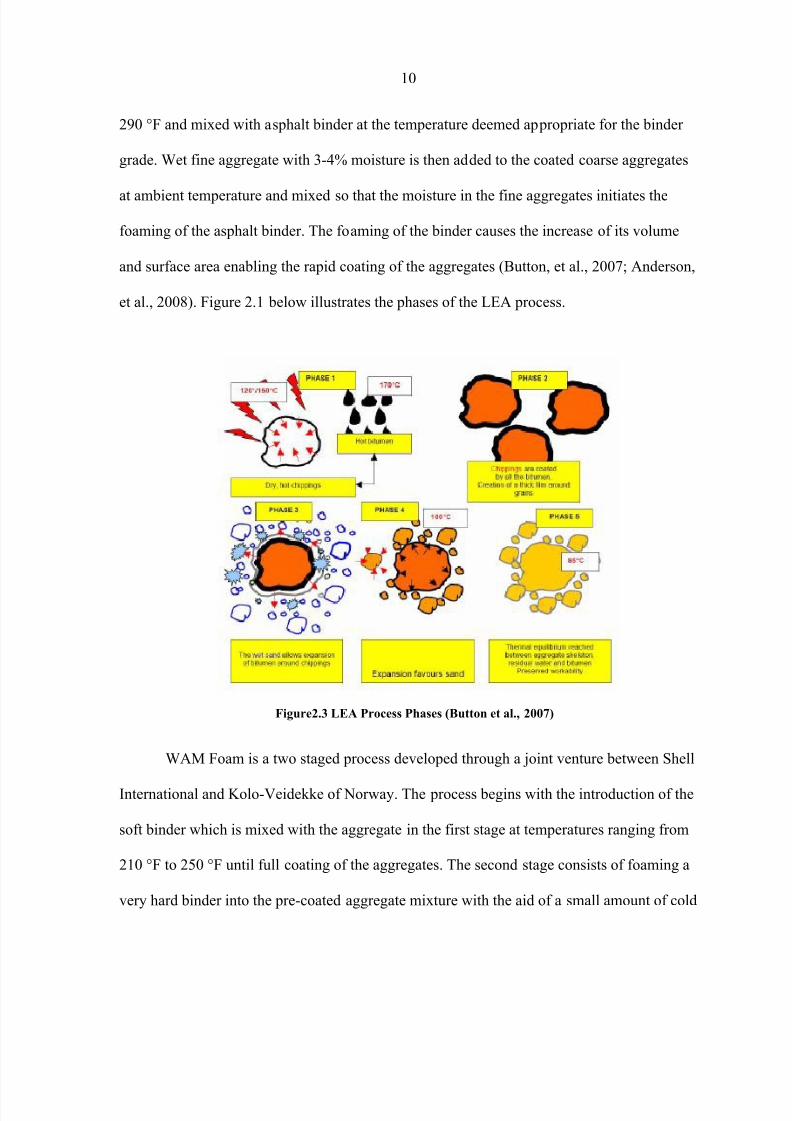
290 °F and mixed with asphalt binder at the temperature deemed appropriate for the binder
grade. Wet fine aggregate with 3-4% moisture is then added to the coated coarse aggregates
at ambient temperature and mixed so that the moisture in the fine aggregates initiates the
foaming of the asphalt binder. The foaming of the binder causes the increase of its volume
and surface area enabling the rapid coating of the aggregates (Button, et al., 2007; Anderson,
et al., 2008). Figure 2.1 below illustrates the phases of the LEA process.
Page 25
8/9/2019 Characterization of Warm Mix Asphalt (WMA) Performance in Differe
http://slidepdf.com/reader/full/characterization-of-warm-mix-asphalt-wma-performance-in-differe 25/247
11
water to induce foaming and improve the coating. The combination of a soft binder and
foaming of the hard binder interact to lower the collective viscosity of the mixture providing
the necessary workability which enables the placement and compaction of the mixture at
temperatures ranging from 175°F to 195°F (Button, et al., 2007). It was reported that
decreased production temperatures using WAM-Foam process can lead to plant fuel savings
up to 30 percent given the appropriate selection of the soft and hard binder components.
2.1.2 Water Bearing Additive Technologies
Another group of WMA technologies that comprise foaming is the water bearing
additives technologies group that rely on inducing foaming mechanisms in the asphalt binder
using water bearing additives. The most notable examples of water bearing additives are
Aspha-min and Advera which are available in the form of a very fine white powder. The
former is manufactured in Germany by Eurovia while the latter is processed in the United
States by PQ Corporation.
Page 26
8/9/2019 Characterization of Warm Mix Asphalt (WMA) Performance in Differe
http://slidepdf.com/reader/full/characterization-of-warm-mix-asphalt-wma-performance-in-differe 26/247
12
2.1.3 Organic-based WMA Technologies
In addition to foaming based WMA technologies, another common group of WMA
products is the organic based additives such as Sasobit, Sasoflex and Asphaltan B. Sasobit is
a long chained synthetic wax (chain lengths ranging between 40 to 115 carbon atoms) that is
produced using the Fischer-Tropsch (F-T) process. The greater length of chains assists in
preserving the wax in solution and help in reducing the asphalt binder viscosity at
conventional production and compaction temperatures. This is possible because Sasobit
incorporates an organic additive that chemically alters the temperature-viscosity curve of the
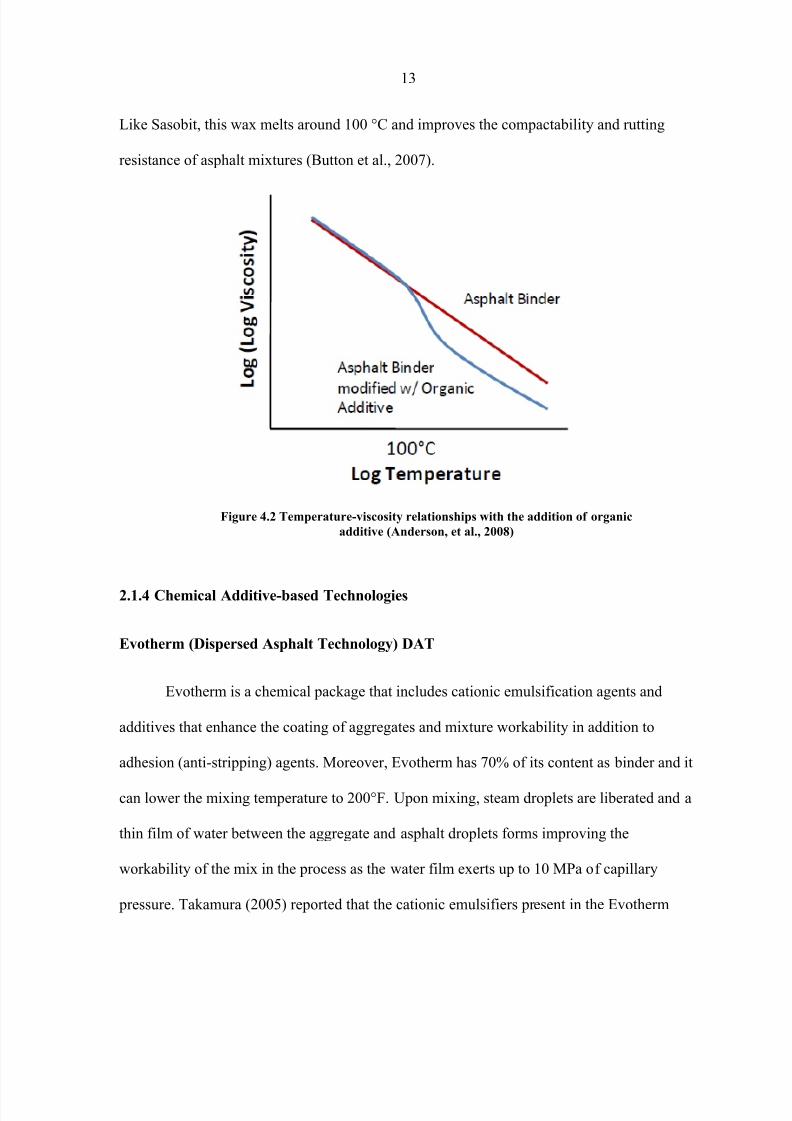
binder as this additive melts at approximately 210°F (100°C) as shown in Figure 2.2. At
temperatures below its melting point, Sasobit forms crystalline structures within the binder
that improves stability of the pavement during service (Anderson et al, 2008; Gandhi, 2008;
Hurley and Prowell, 2005). According to the manufacturers, Sasobit incorporation at 3-4
percent by weight of binder enhances the ability to reduce mixing temperatures by 20 to
40°C (Damm et al., 2004). Furthermore, Sasobit permits the incorporation of Styrene
Page 27
8/9/2019 Characterization of Warm Mix Asphalt (WMA) Performance in Differe
http://slidepdf.com/reader/full/characterization-of-warm-mix-asphalt-wma-performance-in-differe 27/247
13
Like Sasobit, this wax melts around 100 °C and improves the compactability and rutting
resistance of asphalt mixtures (Button et al., 2007).
2.1.4 Chemical Additive-based Technologies
Figure 4.2 Temperature-viscosity relationships with the addition of organic
additive (Anderson, et al., 2008)
Page 28
8/9/2019 Characterization of Warm Mix Asphalt (WMA) Performance in Differe
http://slidepdf.com/reader/full/characterization-of-warm-mix-asphalt-wma-performance-in-differe 28/247
Page 29
8/9/2019 Characterization of Warm Mix Asphalt (WMA) Performance in Differe
http://slidepdf.com/reader/full/characterization-of-warm-mix-asphalt-wma-performance-in-differe 29/247
15
Environmental Benefits
There are a number of environmental advantages reported when using WMA
technologies such as lower energy consumption, reduced emissions and better working
conditions (Anderson et al., 2008).
2.2.1 Lower Energy Consumption
Hossain et al. (2009) reported that based on the WMA technique used and conditions,
the energy consumption range is 20 to 75% of HMA while D’Angelo et al. indicated that
burner fuel savings range from 20 to 35% (D’Angelo et al., 2008; Hossain et al., 2009). For
processes such as low-energy asphalt concrete (LEAB) and low energy asphalt (LEA), fuel
savings could reach more than 50%. Previous studies showed that the WAM-Foam WMA
plant processing can be implemented with 40% lower energy consumption than HMA.
Moreover, a 30% in energy consumption reduction was reported in measurements conducted
for Eurovia when using Aspha-Min because of a 54 to 63°F decrease mix temperature
Page 30
8/9/2019 Characterization of Warm Mix Asphalt (WMA) Performance in Differe
http://slidepdf.com/reader/full/characterization-of-warm-mix-asphalt-wma-performance-in-differe 30/247
16
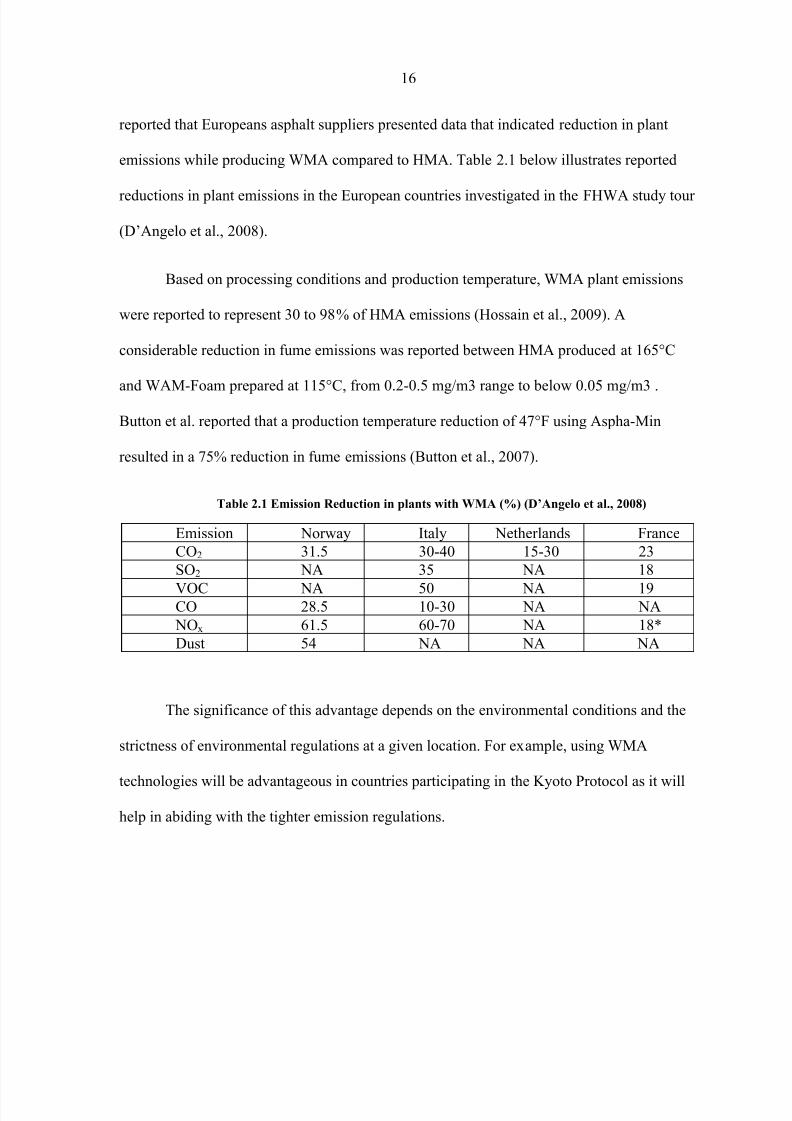
reported that Europeans asphalt suppliers presented data that indicated reduction in plant
emissions while producing WMA compared to HMA. Table 2.1 below illustrates reported
reductions in plant emissions in the European countries investigated in the FHWA study tour
(D’Angelo et al., 2008).
Based on processing conditions and production temperature, WMA plant emissions
were reported to represent 30 to 98% of HMA emissions (Hossain et al., 2009). A
considerable reduction in fume emissions was reported between HMA produced at 165°C
and WAM-Foam prepared at 115°C, from 0.2-0.5 mg/m3 range to below 0.05 mg/m3 .
Button et al. reported that a production temperature reduction of 47°F using Aspha-Min
resulted in a 75% reduction in fume emissions (Button et al., 2007).
Table 2.1 Emission Reduction in plants with WMA (%) (D’Angelo et al., 2008)
Emission Norway Italy Netherlands France
CO2 31.5 30-40 15-30 23SO2 NA 35 NA 18
VOC NA 50 NA 19
CO 28 5 10-30 NA NA
Page 31
8/9/2019 Characterization of Warm Mix Asphalt (WMA) Performance in Differe
http://slidepdf.com/reader/full/characterization-of-warm-mix-asphalt-wma-performance-in-differe 31/247
17
Paving Benefits
Although the driving factors for WMA development were mostly related to its
favorable impact on the environment and fuel economy, there are several paving benefits that
could be gained from adopting WMA technologies. These benefits are related to the effects
of the WMA process or additive on the asphalt binder. The main effects of WMA are
reducing the viscosity and the oxidative hardening of the asphalt binder (Hossain et al.,
2009).
2.2.3 Lower Viscosity
Generally, most WMA technologies have the ability to reduce the binder viscosity.
Several advantages are gained from the lower viscosity as the workability of the asphalt
mixture is improved. Better compaction can be achieved and a lower number of roller passes
are needed to reach the targeted density. Moreover, the incorporation of WMA allows for
better workability at lower temperatures. Hence, WMA can help extend the paving season
Page 32
8/9/2019 Characterization of Warm Mix Asphalt (WMA) Performance in Differe
http://slidepdf.com/reader/full/characterization-of-warm-mix-asphalt-wma-performance-in-differe 32/247
18
observations in their study of viscosity effects of Sasobit on asphalt binders. It was noted that
adding a 3% Sasobit to a polymer-modified asphalt binder decreased its viscosity. Wasiuddin
et al. (2007) reported similar findings regarding the effect of Sasobit. Moreover, they noticed
that Aspha-min did not exhibit any significant change in viscosity when added to a PG 64-22
binder.
D’Angelo et al. (2008) reported that in several projects in Germany, the paving was
completed with different WMA technologies at low ambient temperatures ranging between -
3 and 4°C. Base and SMA surface courses were placed using Aspha-min. The mixing
temperature behind the paver ranged from 102 to 139°C with better density achieved with
WMA compared to HMA with fewer roller passes. The researchers noted that the actual
production temperatures for WMA mixtures during cool weather depends on the nature of
WMA technology used, the surrounding conditions and the haul distance.
Furthermore, the lower rate of cooling of WMA, due to less difference between
bi t d i t t d th d d i it f WMA t l t t
Page 33
8/9/2019 Characterization of Warm Mix Asphalt (WMA) Performance in Differe
http://slidepdf.com/reader/full/characterization-of-warm-mix-asphalt-wma-performance-in-differe 33/247
19
in the stiffening and the hardening of the binder with the temperature of the asphalt oxidation
reaction a significant factor that determines the rate of formation and the type of oxidized
species formed (Hossain et al., 2009). Hence, theoretically, using WMA technologies can
possibly reduce the susceptibility of an asphalt mixture to aging and cracking as the mix is
not exposed to the elevated production and placement temperatures which can lead to a
longer pavement service life.
2.2.5 Potential for using higher percentage of (RAP)
The use of recycled asphalt pavement (RAP) in HMA pavements has become more
popular due to a number of factors, most notably, the scarcity of space available in landfills,
decrease in the amount of high quality virgin aggregate and the increasing prices of oil (Loria
et al, 2011).More than half of state DOTs allow high RAP (more than 25% RAP) to be used
in asphalt mixtures but the incorporation of high RAP content has been relatively low in
comparison to the available supply of RAP. An explanation for this is the concerns regarding
RAP i t i t t f ti d ki (C l d t l 2010) T i ll l
Page 34
8/9/2019 Characterization of Warm Mix Asphalt (WMA) Performance in Differe
http://slidepdf.com/reader/full/characterization-of-warm-mix-asphalt-wma-performance-in-differe 34/247
20
characteristics. The control mix was mixed at 155 °C and compacted at 149°C while the
water injection WMA mix was mixed at 133 °C and compacted at 127°C. It was concluded
that the high RAP-WMA mix had a lower performance grade than the high RAP-HMA mix
indicating that the binder in the WMA mix is softer. Moreover, the results of the dynamic
modulus displayed similar behavior for both mixes except that the RAP-WMA mix |E*|
values are a little lower than the RAP-HMA mix. The same way, flow number results show
that the flow number, Fn, value of the RAP-WMA mix is lower than the control mix.
2.3 Recent Warm Mix Research
2.3.1 United States
2.3.1.1 NAPA Study Tour, 2002
The National Asphalt Pavement Association (NAPA) sent out a study team to
Europe to evaluate and research three of the adopted European technologies in the summer of
2002. The NAPA study team visited asphalt production facilities, paving sites and completed
Page 35
8/9/2019 Characterization of Warm Mix Asphalt (WMA) Performance in Differe
http://slidepdf.com/reader/full/characterization-of-warm-mix-asphalt-wma-performance-in-differe 35/247
21
the European experience with WMA to the American HMA industry at the 2003 NAPA
annual meeting in San Diego (Cervarich, 2003).
2.3.1.2 2003 NAPA Annual Convention
The invited European delegation comprised a representative of the German Bitumen
Forum and representatives from several European companies. A representative of the
German Asphalt Pavement Association presented an overview on the use of organic additives
such as synthetic paraffin wax in producing warm mixtures. These long chained
hydrocarbons are extracted using the Fischer-Tropsch process to be used in reducing the
viscosity of the binder and thus the mixing and compaction temperatures. These additives
were validated by research conducted in the laboratory and the field spanning about five
years.
Representatives from the Shell Global Solutions and Kolo-Veidekke presented the
WMA technology developed through their joint venture in 1995 named the WAM-Foam®
Page 36
8/9/2019 Characterization of Warm Mix Asphalt (WMA) Performance in Differe
http://slidepdf.com/reader/full/characterization-of-warm-mix-asphalt-wma-performance-in-differe 36/247
22
by about 50° F. The performance of test sections constructed with Aspha-min® did not show
notable discrepancies in performance when compared to standard mixtures (Kuennen, 2004).
2.3.1.3 NCAT WMA Research Program
Following the 2002 NAPA study tour, a jointly funded research program was begun
in 2004 at the National Center for Asphalt Technology (NCAT) at Auburn University to
investigate the methodologies of reducing the production and the placement temperatures of
asphalt mixtures (Rea, 2003). This research program was started upon an agreement by
NAPA, the FHWA and several WMA technology suppliers. The investigations conducted by
the research program focused on the feasibility of utilizing WMA technologies in the United
States and the findings of those investigations on three technologies: Aspha-min®,
Evotherm® and Sasobit® were published by NCAT (Corrigan, 2007).
2.3.1.4 World of Asphalt Symposium, Nashville, 2004
A three hour demonstration of the Aspha-min® process was conducted at the World
Page 37
8/9/2019 Characterization of Warm Mix Asphalt (WMA) Performance in Differe
http://slidepdf.com/reader/full/characterization-of-warm-mix-asphalt-wma-performance-in-differe 37/247
23
and practices in a way that facilitate the sharing of information on various WMA
technologies among government agencies and the industry. The group includes
representatives from a variety of government agencies and industry bodies such as the
FHWA, NAPA, NCAT, State Highway Agencies, State Pavement Associations, HMA
industry, workforce, and National Institute for Occupational Safety and Health (NIOSH)
(Corrigan, 2007).
The WMA TWG has recognized several important research needs that would require
investigation that were incorporated into two projects by the National Cooperative Highway
Research Program (NCHRP); NCHRP project 09-43 and 09-47 (Corrigan, 2007).
2.3.1.6 NCHRP 09-43
The 09-43 project “Mix Design Practices for Warm Mix Asphalt Technologies” was
endorsed by the NCHRP in 2007 with the purpose of development of a manual of practice for
the mix design procedure of WMA that would be based on performance. This manual of
Page 38
8/9/2019 Characterization of Warm Mix Asphalt (WMA) Performance in Differe
http://slidepdf.com/reader/full/characterization-of-warm-mix-asphalt-wma-performance-in-differe 38/247
24
objectives of this project are to investigate the relationship between the engineering
properties of WMA binders and mixtures as well as the practical field performance of WMA
pavements. In addition, the project should provide relative relationships between the
performance of WMA pavements and those constructed with HMA. The same way, a
comparison of the practices and costs associated with the production and the placement of
pavements using the HMA and WMA will be conducted (Corrigan, 2007). The project
included multiple WMA technologies where each of these technologies will be used in a
minimum of two full scale trials. Full scale trials stipulate the use of a quantity ranging
between 1,500 to 5,000 tons of the WMA technology placed with conventional equipment on
an in-service road (Anderson, et al., 2008).
2.3.1.8 2007 FHWA European Scan Tour
Through the International Technology Scanning Program of the FHWA, a U.S.
materials team comprised of experts from different agencies and companies, visited the
f ll i E t i i 2007 B l i F G d N ith th
Page 39
8/9/2019 Characterization of Warm Mix Asphalt (WMA) Performance in Differe
http://slidepdf.com/reader/full/characterization-of-warm-mix-asphalt-wma-performance-in-differe 39/247
25
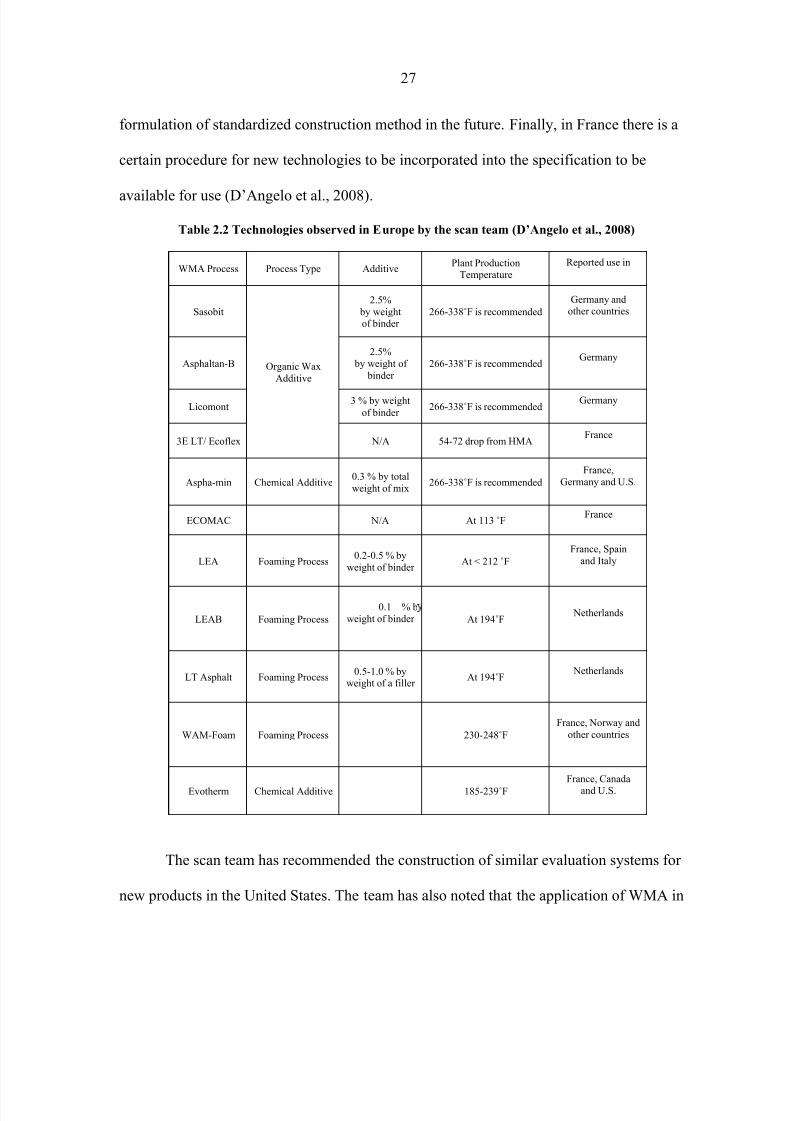
phase with an associated reduction in the mix viscosity. Table 2.2 outlines the WMA
technologies observed in Europe by the FHWA team. The number of processes being
developed promotes the need for a system of assessment for new technologies (D’Angelo et
al., 2008).
In all countries visited during the tour, WMA was expected to offer an equivalent
performance or even better than HMA. In Norway for instance, the delegates observed six
sections built with WAM-foam technology. Generally, the condition of the pavements was
very good except for the presence of some rutting that was attributed to the use of studded
tires which is allowed in Norway. The Norwegian Public Roads Administration has provided
data on 28 WAM-Foam sections with an age between 2 to 8 years. It was reported that the
performance of the WAM-Foam sections was similar to HMA overlays used previously
(D’Angelo et al., 2008).
In Germany, there are criteria for incorporating new materials in field trials as it must
b i t ll d th i ht h d l f hi h t ffi d ith th l th f th ti
Page 40
8/9/2019 Characterization of Warm Mix Asphalt (WMA) Performance in Differe
http://slidepdf.com/reader/full/characterization-of-warm-mix-asphalt-wma-performance-in-differe 40/247
26
Moreover, a number of WMA additive suppliers furnished performance data to the
scan team for a number of trial sections where the performance of the WMA was on par with
the HMA performance if not better (D’Angelo et al., 2008).
In France, the Department of Eure-et-Loir, a district located southwest of Paris has
conducted field trials with Aspha-min® and ECOMAC®. Meanwhile, the city of Paris has
performed some experiments with a number of WMA technologies starting from 2004. A
toll road operator managing a number of toll roads in the southwest region of Paris built a
trial section with Aspha-min® in 2003 on a road that carries a daily traffic of 21,000 vehicles
in both traveling directions. The performance of the trial section was satisfactory.
The scan team also looked into how different agencies in the visited countries
stipulate and integrate WMA into their established specifications and applications. One factor
identified by the scan team as very helpful in the process of incorporating WMA into
specifications is the fact that most European paving contracts contain a 2-5 year warranty
i d
Page 41
8/9/2019 Characterization of Warm Mix Asphalt (WMA) Performance in Differe
http://slidepdf.com/reader/full/characterization-of-warm-mix-asphalt-wma-performance-in-differe 41/247
27
formulation of standardized construction method in the future. Finally, in France there is a
certain procedure for new technologies to be incorporated into the specification to be
available for use (D’Angelo et al., 2008).
Table 2.2 Technologies observed in Europe by the scan team (D’Angelo et al., 2008)
WMA Process Process Type AdditivePlant Production
Temperature
Reported use in
Sasobit
Organic Wax
Additive
2.5%
by weightof binder
266-338˚F is recommended
Germany andother countries
Asphaltan-B
2.5%
by weight of
binder
266-338˚F is recommended Germany
Licomont3 % by weight
of binder266-338˚F is recommended
Germany
3E LT/ Ecoflex N/A 54-72 drop from HMAFrance
Aspha-min Chemical Additive0.3 % by total
weight of mix266-338˚F is recommended
France,
Germany and U.S.
ECOMAC N/A At 113 ˚F France
LEA Foaming Process 0.2-0.5 % byweight of binder At < 212 ˚F
France, Spain
and Italy
0 1 % b
Page 42
8/9/2019 Characterization of Warm Mix Asphalt (WMA) Performance in Differe
http://slidepdf.com/reader/full/characterization-of-warm-mix-asphalt-wma-performance-in-differe 42/247
28
Europe was not as widespread as they had expected and they cited two reasons for that. The
first reason is the fact that the oldest sections built with WMA were just elapsing their
workmanship warranty periods hence, contractors are still cautious until they can develop a
confidence in the long term performance of the technology before any further expansion in
its utilization. The second reason is the higher cost of using WMA technologies in place of
HMA even when fuel savings are taken into consideration.
2.3.1.9 WMA Projects in the United States
NCAT
An asphalt demonstration project incorporating Aspha-min® was built in Orlando,
Florida in February 2004. It was reported that the use of the warm mix technology has
lowered the production and compaction temperatures by 35° F than the temperatures of the
control mix. Testing samples from the field in the laboratory obtained results that came in
agreement with the laboratory study conducted by the NCAT (Hurley and Prowell, 2005).
Page 43
8/9/2019 Characterization of Warm Mix Asphalt (WMA) Performance in Differe
http://slidepdf.com/reader/full/characterization-of-warm-mix-asphalt-wma-performance-in-differe 43/247
29
Ohio
A demonstration project was conducted on sections of SR 541 in Ohio under the
supervision of the Ohio Department of Transportation. A section was laid using conventional
HMA as the control mix with other sections built using three WMA technologies: Aspha-
min®, Sasobit® and Evotherm® (Brown, 2007; Morrison, 2007; and Powers, 2007). The
Aspha-min® additive was added at 0.3% by total weight of the mix while Sasobit® was
added at 1.5 % of the total binder at the plant. Environmental testing on the emissions
produced by the four sections have shown that the Aspha-min® and Sasobit® had lower
emissions of sulfur dioxide, nitrogen oxides, volatile organic compounds and carbon
monoxide in comparison to the control mix. On the other hand, the Evotherm® section had
produced higher emissions of sulfur dioxide, nitrogen dioxide and volatile organic
compounds but it has reduced emissions of carbon monoxide (Morrison, 2007).
Wyoming
Page 44
8/9/2019 Characterization of Warm Mix Asphalt (WMA) Performance in Differe
http://slidepdf.com/reader/full/characterization-of-warm-mix-asphalt-wma-performance-in-differe 44/247
30
Missouri
Three warm mix technologies were utilized in sections of Hall Street in St. Louis,
Missouri in 2006. The high temperature of the HMA was the main reason suspected for the
formation of bumps in this slow moving traffic region. Hence, Sasobit®, Aspha-min® and
Evotherm® additives were used to investigate whether the use of WMA would eradicate the
formation of bumps on that street. Under the supervision of the Missouri DOT, a total of
7,000 tons of warm mix were placed with the field compaction temperature varying between
200 and 250°F. In addition to the testing efforts conducted by the contractor and the Missouri
DOT, mobile labs from FHWA and NCAT were available to conduct testing on the placed
sections. Satisfactory rut depths were reported for the WMA sections and no bumps were
observed (Prowell and Hurley, 2007).
Tennessee
A warm mix demonstration project was carried out in the city of Chattanooga,
Page 45
8/9/2019 Characterization of Warm Mix Asphalt (WMA) Performance in Differe
http://slidepdf.com/reader/full/characterization-of-warm-mix-asphalt-wma-performance-in-differe 45/247
31
Texas
WMA was demonstrated at the American Public Works Association in September
2007 where 3,000 tons of Evotherm® warm mix was used in applying the final surface of the
pavement on top of a lime stabilized subgrade a strong base layer. The warm mix was mixed
at 220 to 240° F and placed at 200° F with the compaction taking place without any noted
difficulty (Brown, 2008; EPA, 2008).
New York
In Courtland County, New York during September 2006, a demonstration project was
conducted utilizing the French WMA technology, Low Energy Asphalt (LEA). The results of
the demonstration were satisfactory as the technology permits the discharge of the mix at the
plant in the range between 190 and 200˚F (Harder, 2007). Several demonstration projects and
trials followed during 2006 and 2007 (Brown, 2007).
2 3 2 G
Page 46
8/9/2019 Characterization of Warm Mix Asphalt (WMA) Performance in Differe
http://slidepdf.com/reader/full/characterization-of-warm-mix-asphalt-wma-performance-in-differe 46/247
32
around 30°C. In June 2003, a larger runway in the same airport was paved with SMA that
incorporated Sasobit® (Sasol wax, 2009).
WMA was placed on a runway in a Berlin airport with a total area of 135,000 m2
and
an asphalt layer of about 12 cm in thickness. A 3% dosage of Sasobit was incorporated into
the asphalt mix used for this runway which was fully shutdown during the entire span of
construction (Sasol wax, 2009).
2.3.3. Canada
In August 2005, three trial sections of WMA were placed in Montreal, Canada using
Aspha-min® zeolite. The HMA control segment was mixed at a 160°C while the Aspha-
min® sections were mixed at temperature ranging between 130-135°C. The paving
temperature of the Aspha-min® sections was lower (110-125°C) than the hot mix asphalt
(140-150°C) (Davidson, 2007).
Three other projects were laid in 2006 using Aspha-min® The first was a
Page 47
8/9/2019 Characterization of Warm Mix Asphalt (WMA) Performance in Differe
http://slidepdf.com/reader/full/characterization-of-warm-mix-asphalt-wma-performance-in-differe 47/247
33
Evotherm® technology were conducted in Canada between 2005 and 2007 consuming nearly
10,000 tons of warm mix (Davidson, 2007).
2.3.4. United Kingdom
While the condition of the M6 motorway near Birmingham, United Kingdom was
deteriorating alarmingly fast, any road maintenance and renovation was impossible during
peak times of traffic. Thus, the only feasible time for the repair work was at night. Sasobit®
WMA technology was used in renovating the damage of nearly 1 Km over eight night shifts
so that proper compaction could be accomplished at relatively lower temperatures thus, the
repaired section would need less time to cool down and be able to withstand traffic in a
shorter time span than conventional hot mix asphalt. It was reported that all three layers of
the pavement were placed at temperatures lower than the conventional HMA by 20-30°C
(Sasol wax, 2009).
Additionally, a dense base course with a thickness of 20 mm which incorporated
Page 48
8/9/2019 Characterization of Warm Mix Asphalt (WMA) Performance in Differe
http://slidepdf.com/reader/full/characterization-of-warm-mix-asphalt-wma-performance-in-differe 48/247
34
rut depths conducted between 2000 and 2003 have shown that the rut depths of WMA and
HMA sections were quite similar (Kristjansdottir, 2006).
2.4. Properties of Warm Mix Binders & Mixtures
2.4.1. Binder Grade Selection
Previous research noted that aging taking place during the production (mixing) phase
of HMA is strongly impacted by its production temperature. Hence, a minimum production
temperature is required to avoid the increase in the high temperature grade of the binder. The
minimum production temperature is determined by both the aging index of the asphalt binder
and the binder grade as shown in Table 2.3 below. The aging index of the binder is the ratio
of G*/sinδ after RTFO aging to G*/sinδ of the original binder. As shown in the table, the
higher the aging index and the greater the performance grade of the binder, the greater the
production temperature of WMA need to be to avoid increasing the binder grade (Anderson
et al., 2008).
Page 49
8/9/2019 Characterization of Warm Mix Asphalt (WMA) Performance in Differe
http://slidepdf.com/reader/full/characterization-of-warm-mix-asphalt-wma-performance-in-differe 49/247
35
2.4.2. Workability & Compactability
With conventional binder and mixture tests for determining the mixing and
compaction temperatures deemed insensitive for WMA mixtures, Bennert et.al (2010)
investigated different approaches for evaluating the workability of asphalt material modified
with WMA additives. They evaluated potential binder and mixture tests that would enable
the ranking of the workability and compactability of binders incorporating warm mix
additives and WMA mixtures. Three binder workability tests: rotational viscosity (AASHTO
T316), NCHRP project 9-39 procedure and a lubricity test were conducted to evaluate their
suitability for classifying the workability properties of a binder (PG-76-22) modified with
different dosages of three WMA additives: Evotherm 3G, Rediset and Sasobit.
In the rotational viscosity test, a rotational viscometer was used to identify the
temperature ranges for mixing and compacting the asphalt binders. On the other hand, the
dynamic shear rheometer (DSR) was used to perform the NCHRP9-39 procedure to identify
th d ti d th l t t t b d th i l ti b h i f th
Page 50
8/9/2019 Characterization of Warm Mix Asphalt (WMA) Performance in Differe
http://slidepdf.com/reader/full/characterization-of-warm-mix-asphalt-wma-performance-in-differe 50/247
36
observation was noted for the results of the NCHRP 9-39 procedure. On the other hand, the
lubricity test showed that the workability of WMA binders is higher compared to that of the
control binder. Hence, the lubricity test provided the most reasonable ranking compared to
the other two binder tests used in that study.
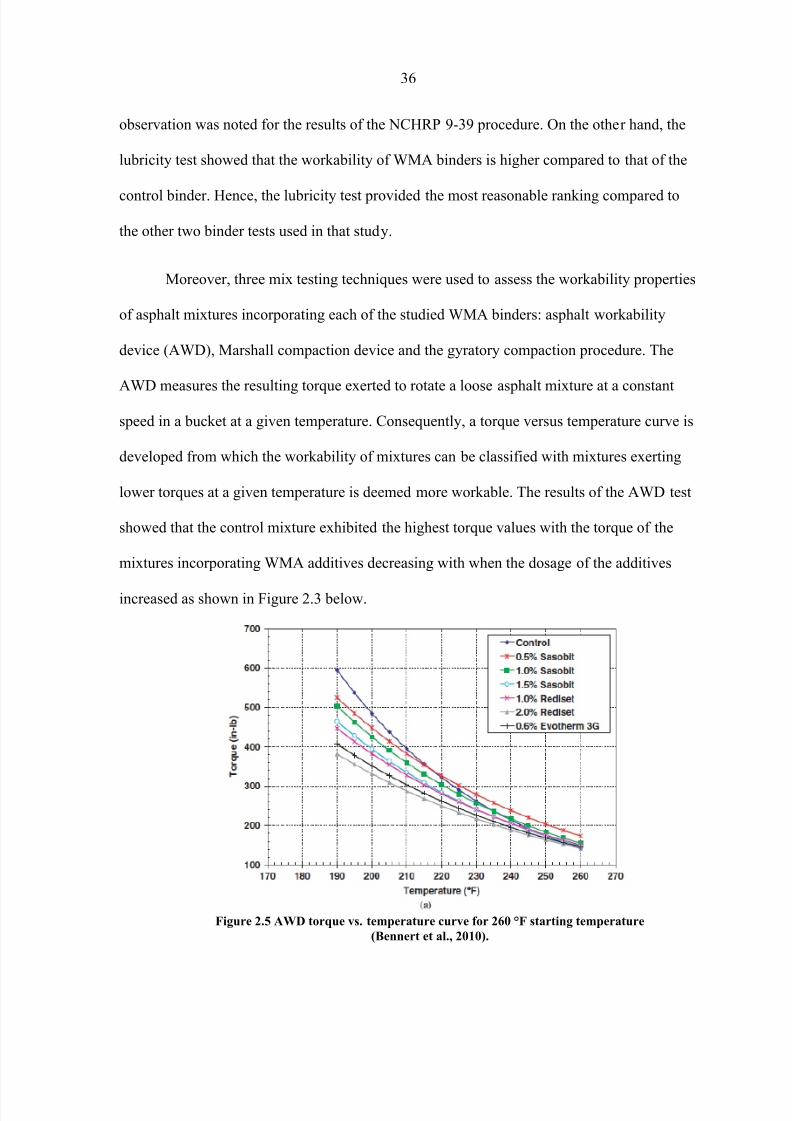
Moreover, three mix testing techniques were used to assess the workability properties
of asphalt mixtures incorporating each of the studied WMA binders: asphalt workability
device (AWD), Marshall compaction device and the gyratory compaction procedure. The
AWD measures the resulting torque exerted to rotate a loose asphalt mixture at a constant
speed in a bucket at a given temperature. Consequently, a torque versus temperature curve is
developed from which the workability of mixtures can be classified with mixtures exerting
lower torques at a given temperature is deemed more workable. The results of the AWD test
showed that the control mixture exhibited the highest torque values with the torque of the
mixtures incorporating WMA additives decreasing with when the dosage of the additives
increased as shown in Figure 2.3 below.
Page 51
8/9/2019 Characterization of Warm Mix Asphalt (WMA) Performance in Differe
http://slidepdf.com/reader/full/characterization-of-warm-mix-asphalt-wma-performance-in-differe 51/247
37
The Marshall compaction procedure was used in assessing the workability of
different mixtures by measuring the compacted density after the samples are subjected to the
same number of compactive blows at different temperatures. Mixtures with higher
workability would have higher densities at a given temperature. The results showed that the
control PG 76-22 would have the highest air void % compared to the mixtures incorporating
WMA when the same compactive effort was applied. It was observed that asphalt mixtures
incorporating 1.5% Sasobit and 2% Rediset would have the lowest air voids indicating
superior workability and compactability at temperatures well below the typical HMA
production temperature.
The gyratory compactor test was used to evaluate the workability and compactability
of WMA mixtures in two ways. In the first approach, the compactor was used to compact
different mixtures to 100 gyrations at different temperatures. Consequently, the densities of
th t d l d Th d t ti h i th t
Page 52
8/9/2019 Characterization of Warm Mix Asphalt (WMA) Performance in Differe
http://slidepdf.com/reader/full/characterization-of-warm-mix-asphalt-wma-performance-in-differe 52/247
38
asphalt undergone at 260°F could have necessitated greater compactive effort compared to
that needed at 215°F (Bennert et al., 2010).
2.4.3. Evaluation of production, lay down and compaction of warm mix
The Texas Department of Transportation conducted a WMA field trial using
Evotherm emulsion in which the production and placement characteristics of warm mix were
studied and compared to the behavior of a control HMA mixture. The WMA mixture was
produced at 220°F and was compacted after three different curing modes: no curing, curing
for 2 hours at 200 °F and curing for 240°F. On the other hand, the conventional control
mixture was produced and compacted at 320 and300°F, respectively. Lab compacted field
mixed samples were tested to measure density, susceptibility to moisture and resistance to
cracking. The reheated WMA samples were lab compacted at 240°F and 300°F to 93%
density with the control mix samples compacted at 300°F. Moreover, cores were extracted
from the road after one month of service and also after one year. The Hamburg Wheel
T k t t d t d t th tti t ti l d th i t tibilit f
Page 53
8/9/2019 Characterization of Warm Mix Asphalt (WMA) Performance in Differe
http://slidepdf.com/reader/full/characterization-of-warm-mix-asphalt-wma-performance-in-differe 53/247
39
failed the Hamburg test while the one year old samples met the test requirements. The
overlay test results were inconsistent and the lab compacted test samples for both the WMA
and HMA exhibited poor results. Finally, the X-ray chromatography results showed that the
air void distribution is more uniform in warm mix compared to the cores of the HMA mix
(Estakhri et al. 2009).
In 2008, Granite Construction researchers conducted two demonstration projects to
study the characteristics of sections paved with the Astec Double Barrel Green foaming
technology and compare it to the performance of control HMA sections. Both the WMA and
the HMA mixtures incorporated 15 % RAP content and were produced using PG 70-10
binders at 275 and 330°F plant discharge temperatures, respectively. Conventional testing of
mixture properties was conducted in addition to the Asphalt Pavement Analyzer (APA) test
and Tensile Strength Ratio (TSR) tests to evaluate the rutting resistance and the moisture
sensitivity of the mixtures investigated in the study, respectively.
R lt h d h th t it i ibl t d i WMA i t i ti l
Page 54
8/9/2019 Characterization of Warm Mix Asphalt (WMA) Performance in Differe
http://slidepdf.com/reader/full/characterization-of-warm-mix-asphalt-wma-performance-in-differe 54/247
40
10% lower than those of HMA mixtures indicating poor resistance to moisture and the
possible need to use anti-strip agents. (Wielinski et al., 2009).
A low volume gravel road in southeast Alaska was constructed using Sasobit warm
mix technology in 2008. The Sasobit pellets were added 1.5% by weight of a PG 58-28
polymer modified binder altering its performance grade to PG 70-22. The production
temperatures for the WMA and HMA mixtures were 265 and 315°F, respectively. It was
reported that fuel consumption of the plant was lower during the production of the warm mix
compared to the consumption of the HMA production. In addition, lower fumes were
visually noticed during production but no quantification of the fumes emitted from both the
HMA and WMA mixtures was conducted (Saboundjian et al., 2011).
Due to the lower production temperature of the WMA section, the main properties
that were of concern were the stiffness of the produced mixture, its resistance to rutting and
its moisture susceptibility. Hence, dynamic modulus, flow number and TSR tests were
d t d t dd th f ti d i t h t i ti Th d i d l t t
Page 55
8/9/2019 Characterization of Warm Mix Asphalt (WMA) Performance in Differe
http://slidepdf.com/reader/full/characterization-of-warm-mix-asphalt-wma-performance-in-differe 55/247
41
terms of tensile strength ratio. Finally, a field survey was performed at project completion to
determine whether there were any pavement distresses. Hence, the wearing course modulus
and the pavement smoothness were measured to determine any variations in the
performances of the WMA and HMA pavements. The survey showed there were no
significant discrepancies between the two pavements (Saboundjian et al., 2011).
2.4.4. Warm Mix aging performance
A laboratory study was conducted at Clemson University to investigate the aging
behavior of WMA mixtures. Samples for three mixtures: a control, Aspha-min and Sasobit
were prepared and indirect tensile strength (ITS), resilient modulus and APA tests were
performed to evaluate the moisture susceptibility, stiffness and rutting potential, respectively.
Moreover, the HMA control samples were mixed at 150°C and then compacted at 145°C. On
the other hand, the WMA samples were mixed and compacted at 120 and 115°C,
respectively. In order to study the effect of aging on the characteristics of the WMA mixtures
i i t HMA i i d f d t i i th i f
Page 56
8/9/2019 Characterization of Warm Mix Asphalt (WMA) Performance in Differe
http://slidepdf.com/reader/full/characterization-of-warm-mix-asphalt-wma-performance-in-differe 56/247
42
For the tests conducted in this study, the results of the aged samples did not exhibit
significant differences compared to their unaged counterparts with the exception that the Mr
values of the aged WMA mixtures were significantly higher. In summary, it was concluded
that the presence of the WMA additives did not compromise the characteristics of the asphalt
mixtures as it aged (Gandhi et al., 2010).
2.4.5. Moisture susceptibility of WMA mixtures
As warm mix asphalts are produced at lower production temperatures, moisture
susceptibility is a concern as aggregates used in the mixtures may not be as dry as those used
in conventional HMA mixes. Hence, extensive research work has focused on investigating
the moisture susceptibility potential of mixtures incorporating different WMA additives. As
mentioned above, no problems with the moisture susceptibility were reported in some of
these studies (Gandhi et al, 2010) and (Saboundjian, et al., 2011) while other researchers
observed some problems related to susceptibility to moisture (Wielinski et al. 2009).
Page 57
8/9/2019 Characterization of Warm Mix Asphalt (WMA) Performance in Differe
http://slidepdf.com/reader/full/characterization-of-warm-mix-asphalt-wma-performance-in-differe 57/247
43
It was concluded from the experiments performed that the dry indirect tensile strength
of mixtures and its deformation resistance containing moist aggregate were lower compared
to other mixtures. However, the addition of hydrated lime at 1 and 2 % improved the ITS of
these mixtures. Moreover, the incorporation of WMA additives did not have statistically
significant differences between them in ITS values under the same testing conditions (Xiao et
al., 2009).
.
Page 58
8/9/2019 Characterization of Warm Mix Asphalt (WMA) Performance in Differe
http://slidepdf.com/reader/full/characterization-of-warm-mix-asphalt-wma-performance-in-differe 58/247
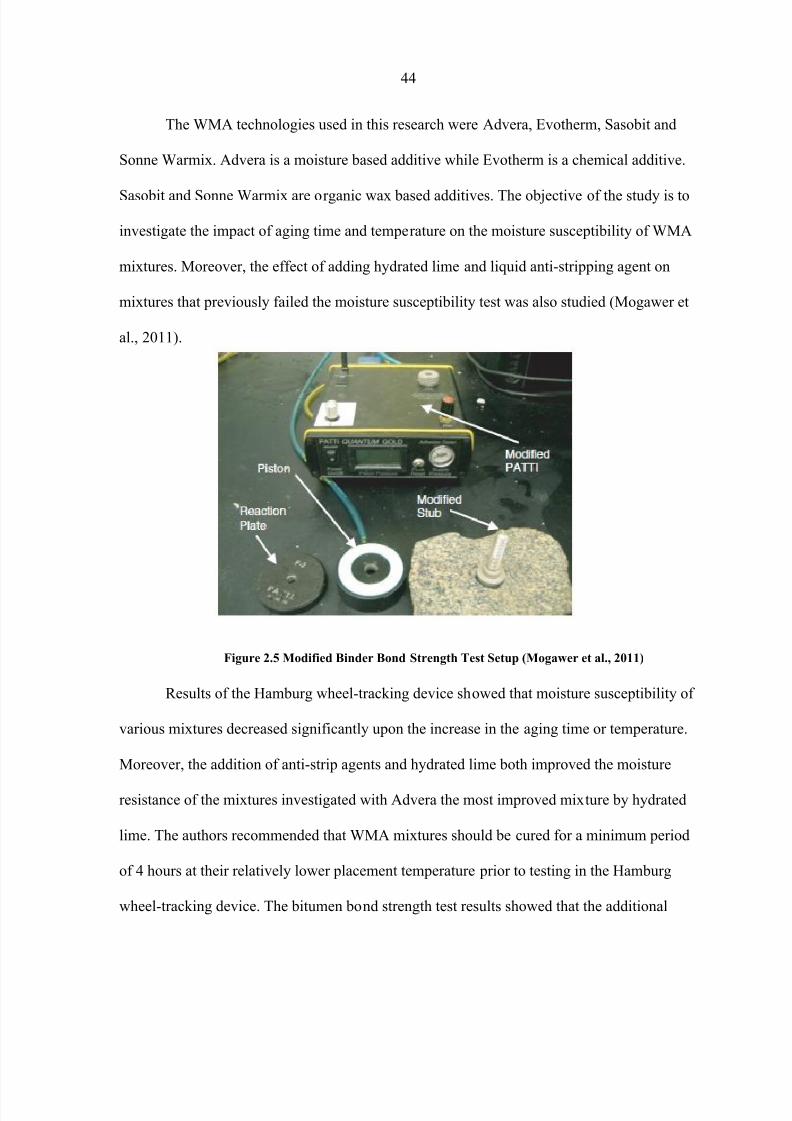
44
The WMA technologies used in this research were Advera, Evotherm, Sasobit and
Sonne Warmix. Advera is a moisture based additive while Evotherm is a chemical additive.
Sasobit and Sonne Warmix are organic wax based additives. The objective of the study is to
investigate the impact of aging time and temperature on the moisture susceptibility of WMA
mixtures. Moreover, the effect of adding hydrated lime and liquid anti-stripping agent on
mixtures that previously failed the moisture susceptibility test was also studied (Mogawer et
al., 2011).
Page 59
8/9/2019 Characterization of Warm Mix Asphalt (WMA) Performance in Differe
http://slidepdf.com/reader/full/characterization-of-warm-mix-asphalt-wma-performance-in-differe 59/247
45
stiffness of the Sasobit mixture made its binder much harder to pull away from the aggregate
surface in a dry state compared to the other mixtures. Finally, it was concluded that higher
stiffness binders were the most difficult to peel off the aggregates for both HMA and WMA
mixtures (Mogawer et al., 2011).
2.4.6. Rheological properties of WMA binders
Researchers at Clemson University studied the rheological behavior of asphalt
binders modified by two warm mix technologies: Aspha-min and Sasobit. Binders from five
different sources were used in this study with Aspha-min incorporated at 0.3 % by weight of
mix and Sasobit added at 1.5% by weight of binder at 120°C. The rheological attributes of
the WMA binders were investigated by conducting a number of testing procedures: viscous
flow, frequency sweeps, creep, creep recovery tests at 60°C and temperature sweeps ranging
from 25 to 80°C (Biro et al., 2009).
The results of the experiments conducted showed that all virgin asphalts exhibited
Page 60
8/9/2019 Characterization of Warm Mix Asphalt (WMA) Performance in Differe
http://slidepdf.com/reader/full/characterization-of-warm-mix-asphalt-wma-performance-in-differe 60/247
46
The compliance results showed that the Sasobit binders are more resistant to rutting as they
exhibited lower compliance values compared to virgin binders and the Aspha-min binders
(Biro et al., 2009).
Another study investigated the rheological characteristics of WMA binders that
contain aged binders in terms of shear stress loading and the ensuing strain response. The
long term aged binders were aged in the rolling thin film oven at 163 °C for 85 minutes and
then in the pressure aging vessel at 100°C for 20 hours. The binders tested were 85% virgin
binders and 15% long term aged binders with two WMA additives used in this study: Aspha-
min and Sasobit. Moreover, the tested binders were tested using the dynamic shear rheometer
for viscous flow, creep compliance and frequency and temperature sweeps.
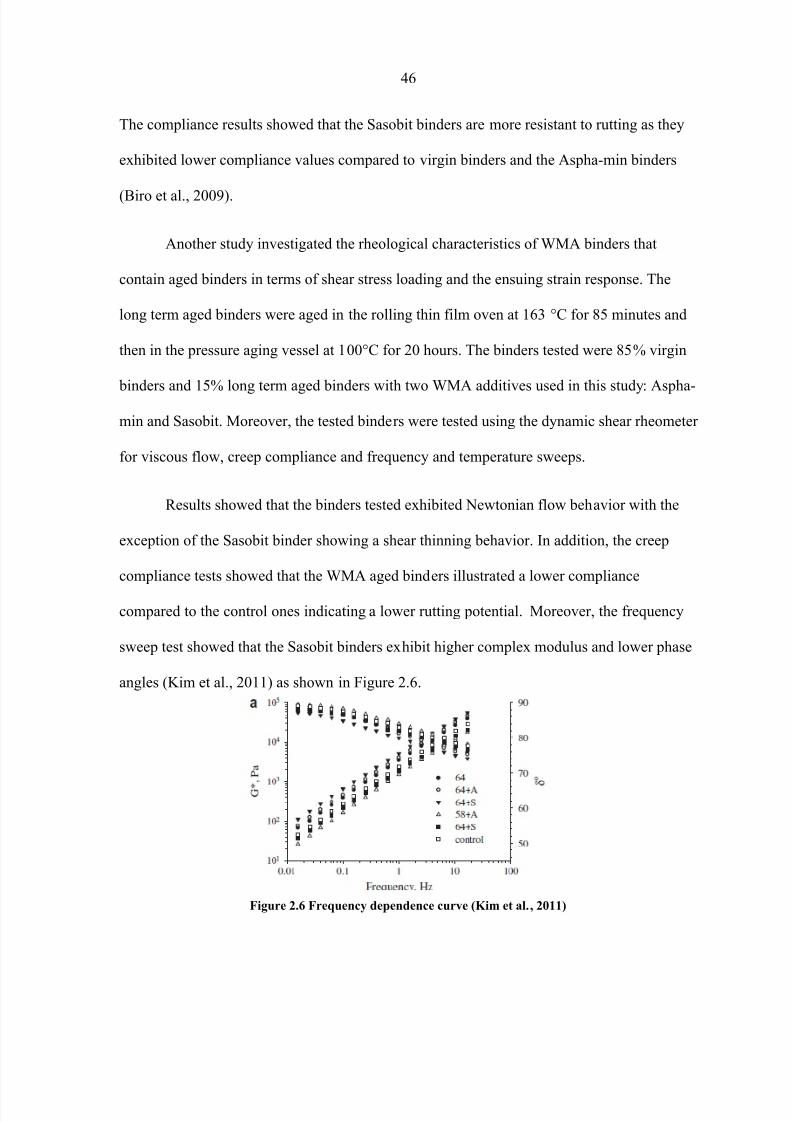
Results showed that the binders tested exhibited Newtonian flow behavior with the
exception of the Sasobit binder showing a shear thinning behavior. In addition, the creep
compliance tests showed that the WMA aged binders illustrated a lower compliance
d t th t l i di ti l tti t ti l M th f
Page 61
8/9/2019 Characterization of Warm Mix Asphalt (WMA) Performance in Differe
http://slidepdf.com/reader/full/characterization-of-warm-mix-asphalt-wma-performance-in-differe 61/247
47
2.4.7. Effect of WMA on polymer modified binders
Airey (2004) defined asphalt as an organic material extracted from crude oil that can
be divided into two major fractional groups: the Asphaltenes which possess a considerably
higher molecular mass and the maltenes which comprise fractions of bitumen with the lowest
molecular weight: saturates, aromatics and resins. Polymers are used to enhance one or two
aspects of the asphalt performance with the objective not to affect adversely other binder
properties. Polymers used to modify bitumen performance can be classified into two broad
classes known as plastomers and elastomers that differ in their mechanism of enhancement.
Plastomers alters asphalt by forming strong, rigid, three dimensional networks to counter
deformation in the binder induced by pavement distresses. On the other hand, elastomers
resist deformation by making use of their significantly high elastic response to stretch and to
regain their previous shape (Airey, 2004). Three different characteristics were identified as
crucial in determining the effectiveness of any polymer as a modifier: compatibility of
solvency parameters between polymer and binder, the ability of the polymer to form network
Page 62
8/9/2019 Characterization of Warm Mix Asphalt (WMA) Performance in Differe
http://slidepdf.com/reader/full/characterization-of-warm-mix-asphalt-wma-performance-in-differe 62/247
48
polymer tends to absorb the aromatic oil fractions present in the maltenes and expand in
volume so that at high temperatures, the binder and polymer coexist as a single phase. On the
other hand, at ambient temperatures, the different molecular characteristics of the polymer
and the binder form two separate phases. According to Airey (2004), the distribution and
layout of these heterogeneous phases have a profound effect on the behavior of polymer
modified binders.
A laboratory experimental examination of polymer modified WMA binders was
conducted to study the impact of the WMA additives on the rheological properties of
polymer modified binders. Two WMA additives, Aspha-min and Sasobit were incorporated
into three different PG 76-22 polymer modified binders. The modified binders were studied
through the performance of Superpave binder tests: rotational viscosity, dynamic shear
rheometer and bending beam rheometer test procedures. It was found out that the addition of
WMA additives increased the high temperature of the performance grade according to the
dynamic shear rheometer test. In addition, it was observed that the Sasobit additive reduced
Page 63
8/9/2019 Characterization of Warm Mix Asphalt (WMA) Performance in Differe
http://slidepdf.com/reader/full/characterization-of-warm-mix-asphalt-wma-performance-in-differe 63/247
49
CHAPTER 3: AN EVALUATION OF WARM MIX ASPHALT
ADDITIVES AND RECLAIMED ASPHALT PAVEMENT (RAP) ONPERFORMANCE PROPERTIES
Mohamed H. Rashwan; R. Christopher Williams
A paper accepted for presentation at the Transportation Research Board Annual Meeting
3.1. Abstract
The consumption of natural resources and climatic changes are regarded as key
factors in the deterioration and disruption of ecosystems. Hence, the asphalt paving industry
is trying to address these issues over the last few years. Two features of the efforts directed
towards sustainability have been in the use of warm mix asphalt technologies and reclaimed
asphalt pavement (RAP) in road applications.
The performance of three commonly used warm mix technologies: Advera,
Evotherm J1 and Sasobit were examined in comparison to a control HMA mixture with
respect to dynamic modulus and permanent deformation (flow number). Each mixture was
developed using a PG 64-22 binder and two types of aggregates: limestone or quartzite In
Page 64
8/9/2019 Characterization of Warm Mix Asphalt (WMA) Performance in Differe
http://slidepdf.com/reader/full/characterization-of-warm-mix-asphalt-wma-performance-in-differe 64/247
50
modulus data of WMA mixtures were consistently lower compared to HMA, with the
difference in E* values decreasing with increasing temperature. The incorporation of RAP
increased the dynamic modulus of all mixtures but HMA mixture was still higher than WMA
mixtures. The impact of RAP incorporation decreased as temperature increased. Finally, the
rutting resistance of WMA mixtures was considerably lower compared to HMA mixes even
after incorporation of RAP. Thus, WMA technologies suitability for hot regions needs to
further investigated.
3.2. Introduction
The consumption of natural resources and climatic changes are regarded as key
factors in the deterioration and disruption of ecosystems. Numerous industrial, agricultural
and transportation activities are deemed major contributors to such decline in the natural
ecosystems. Hence, the asphalt paving industry is trying to address these issues over the last
few years. Two features of the efforts directed towards sustainability have been in the use of
warm mix asphalt technologies and reclaimed asphalt pavement (RAP) in road applications.
Page 65
8/9/2019 Characterization of Warm Mix Asphalt (WMA) Performance in Differe
http://slidepdf.com/reader/full/characterization-of-warm-mix-asphalt-wma-performance-in-differe 65/247
51
seasons, reduced binder aging, and longer haul distances (D'Angelo et al., 2008). Three
common WMA technologies are zeolites, waxes derived from Fischer-Tropsch, and other
chemical additives.
Advera is fine powdered synthetic zeolite, a sodium silicate hydrate, with water
forming approximately 20% of its weight. Zeolites are typified by their ability to gain or lose
water by heating without losing their structure. When Advera is added to the mix
simultaneously with the binder, its water content is released, at temperatures higher than
85°F causing the foaming of the asphalt binder which improves the workability of the binder
temporarily and allows it to coat the aggregate properly at lower temperatures (PQ
Corporation, 2010).
Sasobit is a wax based material produced through the Fischer-Tropsch process and is
characterized by long chemical chains (40 to 115 carbon atoms). The structure and properties
of Sasobit particularly its low melting point, 210°F (99°C), allow its ingredients to alter the
t t i it f th bi d i d ti i th i it f bi d
Page 66
8/9/2019 Characterization of Warm Mix Asphalt (WMA) Performance in Differe
http://slidepdf.com/reader/full/characterization-of-warm-mix-asphalt-wma-performance-in-differe 66/247
52
The effect of the reduced aging of WMA binders on fatigue cracking resistance of
asphalt mixtures was studied by (Haggag et al., 2011). Three WMA technologies: Advera,
Evotherm G3 and Sasobit, were investigated using a PG 64-22 virgin binder. Uniaxial direct
tension-compression test was used in evaluating the fatigue characteristics of all mixtures. It
was indicated that there was no notable difference between the HMA control mixtures and
the corresponding WMA mixtures with the exception of Advera zeolite.
Reclaimed Asphalt Pavement (RAP) use has become more attractive recently due to
increase in the prices of virgin asphalt binders over the last few years. The incorporation of
RAP has several advantages, most notably, the preservation of natural and economic
resources, thus it is considered an environmentally friendly practice (Tao et al., 2009).
Numerous studies have reported the inclusion of RAP into HMA pavements and it
was reported that when adequately designed, RAP mixtures gave comparable performance to
conventional mixtures. (Kim et al., 2011). However, the inclusion of a significant RAP
t t i HMA i t t h ll i th i d i d t ti t d
Page 67
8/9/2019 Characterization of Warm Mix Asphalt (WMA) Performance in Differe
http://slidepdf.com/reader/full/characterization-of-warm-mix-asphalt-wma-performance-in-differe 67/247
53
and compaction compared to HMA mixtures containing the same amount of RAP. A
laboratory study has shown that the incorporation of Sasobit and Advera zeolite at
temperatures as low as 110°C improves the workability of a 100% RAP HMA.
Thin-lift asphalt overlays incorporating high percentages of RAP, 15%, 30%, and
50%, and WMA technology, Sasobit, in mixtures prepared using PG 64-28 and PG52-34
binders. The mixtures were investigated for stiffness and workability (Mogawer, et al. 2009).
Dynamic modulus data confirmed that blending had taken place between RAP binder and
virgin binder. On the other hand, workability results indicated that the higher RAP contents
lowered the workability of the mixtures.
3.2.2. Objective
This study aims to examine the performance of three commonly used warm mix
technologies: Advera, Evotherm J1 and Sasobit in comparison to a control HMA mixture
with respect to dynamic modulus, permanent deformation (flow number). In addition, this
study will look into whether WMA additives enable the production of high RAP content
Page 68
8/9/2019 Characterization of Warm Mix Asphalt (WMA) Performance in Differe
http://slidepdf.com/reader/full/characterization-of-warm-mix-asphalt-wma-performance-in-differe 68/247
54
performance grade (PG) 64-22 binder was chosen to be used in the preparation of all three
warm mixtures as it is a commonly used grade in the Midwest and other parts of the United
States.
The aggregates for the HMA control mixtures were preheated at 163 °C and blended
with the PG 64-22 binder at 150°C and then aged for two hours at 140 °C. All three warm
mix asphalt binders were prepared based on the recommendations of the warm mix additives’
manufacturers. Technique 1 involved the addition of Advera powder to the binder at a dosage
of 0.25% by weight of mix. The binder was stirred to enable the dispersing of the powder in
the binder. The second technique for warm mix asphalt binder preparation was conducted by
adding Evotherm J1 fluid at a concentration of 0.5% or 0.6%, by weight of binder, depending
on reclaimed asphalt pavement (RAP) content. The binder was stirred using a mechanical
stirrer for better blending of the Evotherm J1 fluid into the binder. Technique 3 involved the
addition of Sasobit particles at a concentration of 1.5% by weight of the binder. The Sasobit
was dispersed into the binder by a shear mixer operating at 700 rpm for five minutes based
Page 69
8/9/2019 Characterization of Warm Mix Asphalt (WMA) Performance in Differe
http://slidepdf.com/reader/full/characterization-of-warm-mix-asphalt-wma-performance-in-differe 69/247
55
the dynamic modulus and flow number tests. All specimens were compacted to 7±1% air
voids using a gyratory compacter.
In addition to warm mix asphalt technology, the effect of two other variables is
investigated: aggregate type and the reclaimed asphalt pavement (RAP) content. Thus,
mixtures studied comprised two different aggregates with nominal maximum aggregate size
of 12.5 mm: limestone, a common aggregate type used in the Midwest and quartzite which is
often used in pavements that require higher skid resistance. The possibility of using high
RAP content in WMA mixtures is also studied through preparing two sets of mixtures at 0%
RAP and 30% RAP. Figure 3.1 lays out the eight limestone asphalt mixtures prepared for this
study with eight equivalent mixtures prepared using quartzite aggregates. Thus 16 different
mixtures were prepared in this work.
Dynamic modulus test is conducted in this study to capture the stress to strain
relationship of warm mix asphalt under sinusoidal loading so that it can be compared to the
di h t i h lt i t Th t t i d t d i t i t ll d diti
Page 70
8/9/2019 Characterization of Warm Mix Asphalt (WMA) Performance in Differe
http://slidepdf.com/reader/full/characterization-of-warm-mix-asphalt-wma-performance-in-differe 70/247
56
10,000 load cycles were reached or a strain of 10% has occurred (Witczak, et al. 2002). Flow
number is determined by the minimum strain rate and the corresponding load cycle. The test
was conducted using a UTM 14P machine with a temperature controlled testing chamber.
Procure base binder &
aggregates
Procure WMA additives;
Advera, Evotherm J1 and
Sasobit
Determine Mixtures Gradations and Proportions
Procure
RAP
Prepare mixes with different WMA additives, RAP contents andaggregate types
Mix limestone
aggregates & original
binder in two sets; 0
% RAP and 30 %
RAP at 150 °C.Compact 4 samples
per set with 150 mm
h i ht f d i
Mix limestone
aggregates & Advera
modified binder in two
sets; 0 % RAP and 30
% RAP at 120 °C.Compact 4 samples
per set with 150 mm
h i ht f d i
Mix limestone
aggregates
&Evotherm J1
modified binder in two
sets; 0 % RAP and 30% RAP at 120 °C.
Compact 4 samples
t ith 150
Mix limestone
aggregates & Sasobit
modified binder in two
sets; 0 % RAP and 30
% RAP at 120 °C.
Compact 4 samples
per set with 150 mm
Page 71
8/9/2019 Characterization of Warm Mix Asphalt (WMA) Performance in Differe
http://slidepdf.com/reader/full/characterization-of-warm-mix-asphalt-wma-performance-in-differe 71/247
Page 72
8/9/2019 Characterization of Warm Mix Asphalt (WMA) Performance in Differe
http://slidepdf.com/reader/full/characterization-of-warm-mix-asphalt-wma-performance-in-differe 72/247
58
consistently recording the highest values of E* with the Evotherm mixture displaying the
lowest E* values. For mixtures incorporating a 30 % RAP content, the control mixtures
prepared with limestone aggregates again has shown in Figure 3.3 the highest E* except in
the 4°C setting.
A statistical analysis was conducted to further validate these observations. Hence, an
analysis of variance (ANOVA) was conducted to examine which factors of variability are
significant in affecting the dynamic modulus values. The factors examined are aggregate
type, WMA technology, RAP content, test temperature and test frequency. Moreover, the
interactions between RAP and WMA, RAP and temperature and RAP and frequency were
also studied. The ANOVA was run through Minitab software package with its results shown
in Table 3.1 below.
In Table 3.1, it is evident that temperature and frequency are statistically significant
sources of variability as expected. Moreover, the WMA technology, RAP content and the
i t ti b t WMA d RAP d RAP d t t l i ifi t T k
Page 73
8/9/2019 Characterization of Warm Mix Asphalt (WMA) Performance in Differe
http://slidepdf.com/reader/full/characterization-of-warm-mix-asphalt-wma-performance-in-differe 73/247
59
the E* of all mixtures with no RAP is 5.03 GPa which is lower than the corresponding mean
of mixtures with 30% RAP content at 6.08 GPa.
Figure 3.2 Dynamic modulus results for limestone mixtures with 0% RAP
The trends of interactions between different factors are illustrated in a Minitab output
0
3
5
8
10
13
15
18
0.1 1 10 100
E * ( G P a )
Frequency (Hz)
Limestone 0% RAPControl-4 deg
Advera-4 deg
Evotherm-4 deg
Sasobit-4 deg
Control-21 deg
Advera-21 deg
Evotherm- 21 deg
Sasobit- 21 deg
Control- 37 deg
Advera-37 deg
Evotherm-37deg
Sasobit-37deg
Page 74
8/9/2019 Characterization of Warm Mix Asphalt (WMA) Performance in Differe
http://slidepdf.com/reader/full/characterization-of-warm-mix-asphalt-wma-performance-in-differe 74/247
60
Figure 3.3 Dynamic modulus results for limestone mixtures with 30% RAP
0
2
4
6
8
10
12
14
16
18
20
0.1 1 10 100
E * ( G P a )
Frequency (Hz)
Limestone 30% RAPControl-4deg
Advera-4deg
Evotherm-4deg
Sasobit-4deg
Control-21deg
Advera-21degEvotherm-21deg
Sasobit-21deg
Control-37deg
Advera-37deg
Evotherm-37deg
Sasobit-37deg
16
18
Quartzite 0% RAPControl-4deg
Advera-4deg
Page 75
8/9/2019 Characterization of Warm Mix Asphalt (WMA) Performance in Differe
http://slidepdf.com/reader/full/characterization-of-warm-mix-asphalt-wma-performance-in-differe 75/247
61
0
2
4
6
8
10
12
14
16
18
20
0.1 1 10 100
E * ( G P
a )
Frequency (Hz)
QZ 30 % RAP
Control-4C
Advera-4C
Evotherm-4C
Sasobit-4C
Control-21C
Advera-21C
Evotherm-21C
Sasobit-21 C
Control-37C
Advera-37C
Evotherm-37C
Figure 3.5 Dynamic modulus results for quartzite mixtures with 30% RAP
Table 3.1 Analysis of variance of dynamic modulus test results
Source DF Sum of Squares Mean Squares F-value P-value Status
Aggregate 1 3.65 3.65 3.09 0.08 Not-significantWMA 3 131.86 43.95 37.26 0.0001 Significant
RAP 1 119.82 119.82 101.56 0.0001 Significant
Temperature 2 8308 36 4154 18 3521 09 0 0001 Significant
Page 76
8/9/2019 Characterization of Warm Mix Asphalt (WMA) Performance in Differe
http://slidepdf.com/reader/full/characterization-of-warm-mix-asphalt-wma-performance-in-differe 76/247
62
showed that there is a statistical difference between 0% and 30% RAP samples at a given
temperature with the exception of the samples tested at 37 °C.
In investigating the interaction between the mix type and the test temperature, it was
observed that at the 4 °C test temperature, there was no statistical difference between the E*
values of the control and Advera samples. However, those two sets were different from the
Evotherm and Sasobit sets who were similar to each other. At 21°C the control set is
statistically different from all other sets, which had no significant difference relative to each
other which may raise concerns regarding the performance of warm mix pavements
constructed with technologies investigated in this study at mid range temperatures. In
contrast, at 37 °C, the variability in the E* values was statistically insignificant in between all
four groups of mixtures which comes in agreement with previous work conducted by
Mohammad et al. (2008). In that study, it was observed that the difference in dynamic moduli
decreased as temperature increased between conventional and Sasobit modified mixture.
3 4 2 Fl N b (FN)
Page 77
8/9/2019 Characterization of Warm Mix Asphalt (WMA) Performance in Differe
http://slidepdf.com/reader/full/characterization-of-warm-mix-asphalt-wma-performance-in-differe 77/247
63
Figure 3.6 Interaction plot for dynamic modulus tests
Moreover, the incorporation of RAP increased the FN considerably, more than 3,500
for the 30% RAP control compared to less than 500 for the 0% RAP control which is
expected possibly by the presence of the relatively more aged constituents of RAP that may
h d h i i h i i H hil h d h
Page 78
8/9/2019 Characterization of Warm Mix Asphalt (WMA) Performance in Differe
http://slidepdf.com/reader/full/characterization-of-warm-mix-asphalt-wma-performance-in-differe 78/247
64
technologies studied which in turn, were statistically similar to each other. On the other hand,
even though the interaction between RAP content and mix type was marginally insignificant
at a p-value of 0.057, a multiple comparison was done to test the presence of statistical
significance among the different combinations of this interaction. The FN of the specimens
produced with HMA and incorporating 30% RAP was deemed significant compared to the
other combinations.
-
500
1,000
1,500
2,000
2,500
3,000
3,500
4,000
0% 30%
F l o w
N u m b e r
RAP Content
Control
Advera
Evotherm
Sasobit
Page 79
8/9/2019 Characterization of Warm Mix Asphalt (WMA) Performance in Differe
http://slidepdf.com/reader/full/characterization-of-warm-mix-asphalt-wma-performance-in-differe 79/247
65
Figure 3.8 Flow number test results for quartzite mixtures
Table 3.2 Analysis of variance of flow number results
Source DF SS MS F-value P-Value Status
Agg 1 415783 415873 1.85 0.216 Not-significant
RAP 1 2807230 2807230 12.48 0.01 Significant
WMA 3 4581971 1527324 6.79 0.018 SignificantRAP*WMA 3 2759601 919867 4.09 0.057 Not-significant
Error 7 1574344 224906
T l 15
0
200
400
600800
1000
1200
1400
1600
1800
2000
0% 30%
F l o
w
N u m b e r
RAP Content
Control
Advera
Evotherm
Sasobit
Page 80
8/9/2019 Characterization of Warm Mix Asphalt (WMA) Performance in Differe
http://slidepdf.com/reader/full/characterization-of-warm-mix-asphalt-wma-performance-in-differe 80/247
66
to low-temperature cracking. The fact that E* of WMA mixtures is also lower than HMA at
21°C may make them more resistant to fatigue cracking.
Figure 3.9 Interaction plot for flow number results
The incorporation of RAP improved the E* of various mixtures due to the increased
Page 81
8/9/2019 Characterization of Warm Mix Asphalt (WMA) Performance in Differe
http://slidepdf.com/reader/full/characterization-of-warm-mix-asphalt-wma-performance-in-differe 81/247
67
the HMA samples than WMA additives’ samples which raise concerns regarding the rutting
of mixtures incorporating WMA. The influence of RAP inclusion was higher in mixtures
incorporating limestone than those incorporating quartzite. Additional work examining the
low temperature fracture performance of the tested combinations provided in this paper needs
to be done to fully understand the performance expectations of the WMA technologies as
compared to typical HMA mixtures.
3.5. Conclusions
Some conclusions that can be deduced from this work include:
Preparing WMA asphalt mixtures using Advera or Evotherm J1 or Sasobit at 120°C
is feasible with no concerns regarding workability or compactability even in mixtures
where 30% RAP was incorporated.
The findings of this study suggest that there is a difference in the performance of
HMA mixtures and the three WMA technologies investigated.
The dynamic moduli of WMA mixtures were consistently lower compared to the
Page 82
8/9/2019 Characterization of Warm Mix Asphalt (WMA) Performance in Differe
http://slidepdf.com/reader/full/characterization-of-warm-mix-asphalt-wma-performance-in-differe 82/247
68
Incorporation of RAP increased the dynamic moduli of all mixtures with control RAP
mixtures still exhibiting higher E* than WMA RAP mixes.
The effect of RAP incorporation on the increase in dynamic moduli values, decreased
as test temperatures increased.
The rutting resistance of WMA mixtures is a concern as it was considerably lower
compared to HMA mixes based on flow number test.
While RAP inclusion improved the flow number of WMA mixtures, its performance
was still much lower compared to HMA mixtures. Thus, the suitability of the studied
WMA technologies for application in hot regions needs to be further studied.
3.6. Acknowledgments
The authors appreciate the assistance of Iowa DOT in this investigation of WMA and
help of John Hinrichson with laboratory testing and Scott Schram at the Iowa DOT. Special
thanks also go to Annette Smith of PQ Corporation.
3 7 R f
Page 83
8/9/2019 Characterization of Warm Mix Asphalt (WMA) Performance in Differe
http://slidepdf.com/reader/full/characterization-of-warm-mix-asphalt-wma-performance-in-differe 83/247
Page 84
8/9/2019 Characterization of Warm Mix Asphalt (WMA) Performance in Differe
http://slidepdf.com/reader/full/characterization-of-warm-mix-asphalt-wma-performance-in-differe 84/247
70
PQ Corporation. PQ Corporation. 2010. http://www.pqcorp.com/products/adverawma.asp
(accessed February 20, 2010).
Sasol Wax. Sasol Wax, Sasobit Production. Sasol Wax. November 22, 2010.
http://www.sasolwax.com/en/Applications/Bitumen+Modification/North+America/Sasobit-p-
540.html.
Tao, M. , and Mallick, R.. "An Evaluation of the Effects of Warm Mix Asphalt Additives
on Workability and Mechanical Properties of Reclaimed Asphalt Pavement (RAP)
Material." In Transportation Research Board 88th Annual Meeting Compendium of
Papers. CD-ROM, Transportation Research Board of National Academies, Washington,
D.C., 2009.
Witczak, M.W, Kaloush,K., Pellinen,T, El Basyouny, M. and Von Quintus, H.. "Simple
Performance Test for Superpave Mix Design", NCHRP Report 465. Washington, D.C.:
National Academy Press, 2002.
Page 85
8/9/2019 Characterization of Warm Mix Asphalt (WMA) Performance in Differe
http://slidepdf.com/reader/full/characterization-of-warm-mix-asphalt-wma-performance-in-differe 85/247
71
CHAPTER 4: PERFORMANCE EVALUATION OF LAB WARM MIX
ASPHALT MIXES INCORPORATING RAP USING MEPDG
Mohamed Rashwan and R. Christopher Williams
A paper submitted to the Construction Buildings and Materials Journal
4.1. Abstract
The consumption of natural resources and climatic changes are regarded as key
factors in the deterioration and disruption of ecosystems. Hence, the asphalt paving industry
is trying to address these issues over the last few years. Two features of the efforts directed
towards sustainability have been in the use of warm mix asphalt technologies and reclaimed
asphalt pavement (RAP) in road applications.
While the emergence of WMA technologies has increased the drive towards using
higher RAP percentages into asphalt pavements, national and state agencies efforts are
hindered by the scarcity of information available on the field performance of mixtures
Page 86
8/9/2019 Characterization of Warm Mix Asphalt (WMA) Performance in Differe
http://slidepdf.com/reader/full/characterization-of-warm-mix-asphalt-wma-performance-in-differe 86/247
72
performed to assess the performance of lab produced asphalt mixtures incorporating WMA
and RAP and compare it to the performance of corresponding control mixtures.
Dynamic moduli and flow number results of mixtures incorporating WMA were
consistently lower than those of corresponding HMA mixtures. While the inclusion of RAP
improved the flow number of WMA mixtures, its performance was still much lower
compared to the control HMA mixtures. MEPDG output agreed with laboratory test results
specifically for rutting prediction and terminal IRI values. Finally, statistical analysis of
variance indicated that the Evotherm™ mixtures performance was generally different from
the control mixtures regardless of type of aggregates used.
Keywords: warm mix asphalt; reclaimed asphalt pavements; mechanistic-empirical pavement
design guide; dynamic modulus; flow number
4.2. Introduction
With the prices of crude oil rising, quality aggregate sources scarce along with calls
Page 87
8/9/2019 Characterization of Warm Mix Asphalt (WMA) Performance in Differe
http://slidepdf.com/reader/full/characterization-of-warm-mix-asphalt-wma-performance-in-differe 87/247
73
production and compaction at significantly lower temperatures by lowering the binder
viscosity which in turn improves the mixture workability. Three common WMA technologies
are zeolites, waxes derived from Fischer-Tropsch, and other chemical additives. Hence,
producing warm mix asphalt with comparable strength and durability to HMA can have
extensive implications for producers and suppliers of asphalt. Using WMA technologies
offers a number of advantages such as reduction in fuel consumption and plant emissions
produced as the plant temperature required to produce the mix is significantly lower, in
addition to longer paving seasons, reduced binder aging, and longer haul distances (D'Angelo
et al., 2008). The lower production temperatures of WMA compared to HMA can allow for
the incorporation of higher percentages of RAP as the risk of RAP being further aged and
stiffened is evaded(Copeland et al., 2010).
As a result, the emergence of WMA technologies has increased the drive towards
using higher RAP percentages into asphalt pavements. Copeland et al. reported that by 2010,
only eleven states have experience working with WMA incorporating high RAP which
Page 88
8/9/2019 Characterization of Warm Mix Asphalt (WMA) Performance in Differe
http://slidepdf.com/reader/full/characterization-of-warm-mix-asphalt-wma-performance-in-differe 88/247
74
4.2.1. Mechanistic-Empirical Pavement Design Guide
The MEPDG adopts a hierarchical approach in which the designer can use three
different levels of analysis of the studied pavement structure based on the information
available. The hierarchical approach is applied in terms of three levels of inputs in which
traffic, materials and environmental/climatic information are fed to the software. Level 1
inputs offer the highest level of accuracy and hence its material inputs require laboratory or
field testing such as dynamic modulus test of HMA specimens and it needs more time and
resources than other levels of analysis (NCHRP, 2004). Level 2 offers an intermediary level
of accuracy and its inputs are acquired either from an organization’s database, correlations or
through a limited testing plan. For example, dynamic modulus can be estimated from
aggregates, binder and mix properties whereas traffic volume and classification data are site
specific. Level 3 inputs provide the lowest accuracy level and it is used when there is a real
lack of data or the least consequences of early failures.
4 2 2 Obj ti
Page 89
8/9/2019 Characterization of Warm Mix Asphalt (WMA) Performance in Differe
http://slidepdf.com/reader/full/characterization-of-warm-mix-asphalt-wma-performance-in-differe 89/247
75
different techniques of warm mix were selected for this study: Advera, a chemical powder
made of synthetic zeolite by PQ Corporation, Evotherm™ J1, a chemically developed fluid
by MeadWestvaco, Inc and Sasobit, a long chained hydrocarbon pellet procured from Sasol
Wax Americas, Inc. A performance grade (PG) 64-22 binder was chosen to be used in the
preparation of all three warm mixtures as it is a commonly used grade in the Midwest and
other parts of the United States.
The aggregates for the HMA control mixtures were preheated at 163 °C and blended
with the PG 64-22 binder at 150°C and then aged for two hours at 140 °C. All three warm
mix asphalt binders were prepared based on the recommendations of the warm mix additives’
manufacturers. Technique 1 involved the addition of Advera powder to the binder at a dosage
of 0.25% by weight of mix. The binder was stirred to enable the dispersing of the powder in
the binder. The second technique for warm mix asphalt binder preparation was conducted by
adding Evotherm™ J1 fluid at a concentration of 0.5% or 0.6%, by weight of binder,
depending on RAP content. For RAP content lower than 25%, a 0.5% of Evother m™ is
Page 90
8/9/2019 Characterization of Warm Mix Asphalt (WMA) Performance in Differe
http://slidepdf.com/reader/full/characterization-of-warm-mix-asphalt-wma-performance-in-differe 90/247
76
at 125 °C. Subsequently, mixtures were cured and compacted at 110 °C with the Advera
mixtures cured for four hours and, stirred every hour, prior to compaction.
Three performance tests were performed on the mixtures: indirect tensile strength,
dynamic modulus and flow number tests to assess the moisture susceptibility, cracking and
rutting resistance, respectively. Specimens were prepared to a height of 150mm and diameter
of 100 mm for the dynamic modulus and flow number tests. All specimens were compacted
to 7±1% air voids using a gyratory compacter.
Simulations Using MEPDG
The second part of the analysis consists of MEPDG design runs performed to assess
the performance of lab produced asphalt mixtures incorporating WMA and RAP and
compare it to the performance of a corresponding control mix. Version 1.0 of the MEPDG
software was used to address the objectives of this research.
Design Inputs
Page 91
8/9/2019 Characterization of Warm Mix Asphalt (WMA) Performance in Differe
http://slidepdf.com/reader/full/characterization-of-warm-mix-asphalt-wma-performance-in-differe 91/247
77
truck traffic (AADTT) and the traffic growth values were assumed for each traffic level with
the rest of parameters left at their default level 3 values.
Table 4.1 Input data at different traffic volume levels
Parameter Low Traffic Medium Traffic High Traffic
AADTT 80 696 2000
Traffic Growth 2% 1.2% 1.37%
Climate
For all MEPDG runs, the default climatic database of Des Moines, Iowa was used in
this study given its central location within the State of Iowa and the Midwest of the United
States.
AC Layer
For each mix assessed, dynamic modulus values of tests conducted in the lab at five
temperatures and 6 frequencies are input into the software. Table 4.2 illustrates an example
of dynamic modulus data entered into an Evotherm ™ – Quartzite 0% RAP mixture.
Page 92
8/9/2019 Characterization of Warm Mix Asphalt (WMA) Performance in Differe
http://slidepdf.com/reader/full/characterization-of-warm-mix-asphalt-wma-performance-in-differe 92/247
78
The properties of the crushed stone base and the subgrade were left at the third level
of detail with resilient modulus values of 30,000 and 11,500 psi, respectively.
Structure
The asphalt pavement structure used comprised three structural layers: the asphalt
cement (AC) layer, a crushed stone base layer and subgrade. Only the thickness of the AC
layer varied with the increase in the traffic volume. Table 4.3 shows the thicknesses of the
different of the pavement structures used for different traffic volumes.
Table 4.3 Pavement structure cross-sections for different traffic volumes
Layer Low VolumeTraffic Medium VolumeTraffic High VolumeTraffic
AC Layer 6’’ PG 64-22 10’’ PG 64-22 15’’ PG 64-22
Base 4’’ Crushed Stone 4’’ Crushed Stone 4’’ Crushed Stone Subgrade A-7-6 A-7-6 A-7-6
4.4. Results and Analysis
4.4.1. Dynamic Modulus
The dynamic modulus test data output were used to construct master curves of the
Page 93
8/9/2019 Characterization of Warm Mix Asphalt (WMA) Performance in Differe
http://slidepdf.com/reader/full/characterization-of-warm-mix-asphalt-wma-performance-in-differe 93/247
79
Figure 4.1 Master curves of non-moistured limestone mixtures without RAP
4.4.2. Repeated Load Permanent Deformation Test
The main outcome of this test is the flow number, which is the cycle number where
1.0.E+04
1.0.E+05
1.0.E+06
1.0.E+07
1.0.E+08
1.E-05 1.E-03 1.E-01 1.E+01 1.E+03 1.E+05 1.E+07
| E * | , k P a
Frequency, Hz
LM1-NMC
LM4-NMC
LM7-NMC
LM10-NMC
Page 94
8/9/2019 Characterization of Warm Mix Asphalt (WMA) Performance in Differe
http://slidepdf.com/reader/full/characterization-of-warm-mix-asphalt-wma-performance-in-differe 94/247
0
500
1000
1500
2000
2500
3000
3500
4000
0% 30%
F l o w
N u m b e r
RAP Content
Control
Advera
Evotherm
Sasobit
0
200
400600
800
1000
1200
1400
1600
1800
2000
0% 30%
F l o w
N u m b e r
RAP Content
Control
Advera
Evotherm
Sasobit
a) b)
Figure 4.2 Flow Number results for (a) Limestone mixtures (b) Quartzite mix
Page 95
8/9/2019 Characterization of Warm Mix Asphalt (WMA) Performance in Differe
http://slidepdf.com/reader/full/characterization-of-warm-mix-asphalt-wma-performance-in-differe 95/247
81
The superior flow number of control mixtures compared to WMA mixtures raises
concern regarding the rutting resistance of WMA technologies. An explanation for such an
observation could be the reduced aging experienced by WMA mixtures due to their relatively
lower production and compaction temperatures. The significant superiority of control
mixtures incorporating 30 % RAP could be attributed to the higher aging of the mixtures due
to higher production and compaction temperatures and the presence of high percentage of
RAP. However, it is important to note that the flow number test is known for its variability.
Hence, conclusions reached from its results should be used with caution particularly when
trying to differentiate the different WMA technologies used in this study.
4.4.3. MEPDG Runs Output
The design guide relies on input data concerning traffic, climate, structure and
material properties of the investigated road section to estimate the primary distresses
resulting from the accumulation of damage in the pavement structure during a specific period
f ti T i l di t ti t d b th d i id t d f ti i ll
Page 96
8/9/2019 Characterization of Warm Mix Asphalt (WMA) Performance in Differe
http://slidepdf.com/reader/full/characterization-of-warm-mix-asphalt-wma-performance-in-differe 96/247
82
different levels of traffic. The control limestone mixtures exhibited the lowest rut depth
regardless of RAP content, moisture conditioning and traffic level. The limestone mixtures
with 0 percent RAP incorporating Sasobit, displayed slightly better resistance to rutting in the
asphalt layer compared to other corresponding WMA mixtures. On the other hand, Sasobit
limestone mixtures registered the highest amount of rutting among mixtures with 30 percent
RAP content.
The control mixtures prepared with the quartzite aggregates showed the best
resistance to rutting in the asphalt layer as displayed in Figure 4.4 for the medium and high
traffic levels. Sasobit mixtures exhibited lower rutting depths than Advera and Evotherm™
mixtures. It is important to note all limestone and quartzite mixtures had predicted rutting
depths lower than maximum limit at 90 percent reliability which is set at 0.2.
AC Layer Rutting vs. Flow Number
The estimated asphalt layer rut depths for various mixtures were charted against their
Page 97
8/9/2019 Characterization of Warm Mix Asphalt (WMA) Performance in Differe
http://slidepdf.com/reader/full/characterization-of-warm-mix-asphalt-wma-performance-in-differe 97/247
0
0.05
0.1
0.15
0.2
0.25
0% RAP-NMC 0% RAP-MC 30%RAP-NMC 30%RAP-MC
R u t t i n g ( A C L a y e r ) ( i n )
RAP Content- Moisture Status
Control
Advera
Evotherm
Sasobit
0
0.05
0.1
0.15
0.2
0.25
0% RAP-NMC 0% RAP-MC 30%RAP-NMC 30%RAP-MC
R u t t i n g ( A C L a y e r ) ( i n )
RAP Content-Moisture Status
Control
Advera
Evotherm
Sasobit
(a)
Low traffic (b) Medium traffic
Figure 4.3 Rutting (AC layer) in limestone pavements
Page 98
8/9/2019 Characterization of Warm Mix Asphalt (WMA) Performance in Differe
http://slidepdf.com/reader/full/characterization-of-warm-mix-asphalt-wma-performance-in-differe 98/247
0
0.05
0.1
0.15
0.2
0.25
0% RAP-NMC 0% RAP-MC 30%RAP-NMC 30%RAP-MC
R u t t i n g i n A C L a y e r ( i n )
RAP Content-Moisture Status
Control
Advera
Evotherm
Sasobit
0
0.05
0.1
0.15
0.2
0.25
0% RAP-NMC 0% RAP-MC 30%RAP-NMC 30%RAP-MC
R u t t i n g i n A C L a y e r ( i n )
RAP Content- Moisture Status
Control
Advera
EvothermSasobit
(a) Medium traffic (b) High traffic
Figure 4.4 Rutting (AC layer) in quartzite pavements
Page 99
8/9/2019 Characterization of Warm Mix Asphalt (WMA) Performance in Differe
http://slidepdf.com/reader/full/characterization-of-warm-mix-asphalt-wma-performance-in-differe 99/247
Page 100
8/9/2019 Characterization of Warm Mix Asphalt (WMA) Performance in Differe
http://slidepdf.com/reader/full/characterization-of-warm-mix-asphalt-wma-performance-in-differe 100/247
0
5
10
15
20
25
0% RAP-NMC 0% RAP-MC 30%RAP-NMC 30%RAP-MC
A l l i g a t o r C r
a c k i n g ( % )
RAP Content-Moisture Status
Control
Advera
Evotherm
Sasobit
0
5
10
15
20
25
0% RAP-NMC 0% RAP-MC 30%RAP-NMC 30%RAP-MC
A l l i g a t o r C r a c k i n g ( % )
RAP Content-Moisture Status
Control
Advera
Evotherm
Sasobit
(a)Low traffic (b) Medium traffic
Figure 4.6 Alligator cracking (%) in limestone pavements
Page 101
8/9/2019 Characterization of Warm Mix Asphalt (WMA) Performance in Differe
http://slidepdf.com/reader/full/characterization-of-warm-mix-asphalt-wma-performance-in-differe 101/247
0
5
10
15
20
25
0% RAP-NMC 30%RAP-NMC
A l l i g a t o r C r a c k i n g ( % )
RAP Content- Moisture Status
Control
Advera
Evotherm
Sasobit
0
5
10
15
20
25
0% RAP-NMC 30%RAP-NMC
A l l i g a t o r C r a c k i n g ( % )
RAP Content- Moisture Status
Control
Advera
Evotherm
Sasobit
(a)Low traffic (b) High traffic
Figure 4.7 Alligator cracking (%) in quartzite pavements
88
Page 102
8/9/2019 Characterization of Warm Mix Asphalt (WMA) Performance in Differe
http://slidepdf.com/reader/full/characterization-of-warm-mix-asphalt-wma-performance-in-differe 102/247
88
Terminal IRI
The international roughness index (IRI) is an indicator of the overall quality of the
pavement and all distresses contributing to pavement condition. At a reliability of 90 percent,
the maximum acceptable IRI limit is 172 in/mile. Figure 4.8 below shows the terminal IRI
values for different limestone mixtures at various traffic levels. From this figure, it is clear
that the IRI lies in between 100 and 120 in/mile for all the limestone mixtures. Hence, it can
be deduced from these observations that the incorporation of WMA additives and also the
addition of RAP did not affect the overall quality of the pavements significantly. Another
possibility, the differences between various mixtures was not fully captured by modeling
techniques used in estimating the IRI in the design guide.
4.4.4 Statistical Analysis
As the variability in the quantitative values of distresses estimated using the design
guide may not be too significant to be observed easily, especially given most of the values
are well below the maximum design reliability criteria conducting a statistical analysis is a
Page 103
8/9/2019 Characterization of Warm Mix Asphalt (WMA) Performance in Differe
http://slidepdf.com/reader/full/characterization-of-warm-mix-asphalt-wma-performance-in-differe 103/247
0
20
40
60
80
100
120
140
160
T e r m i n
a l I R I ( i n / m i )
RAP Content-Moisture Status
Control
Advera
Evotherm
Sasobit
0
20
40
60
80
100
120
140
160
I R I ( i n . / m i )
RAP Content-Moisture Status
Control
Advera
Evotherm
Sasobit
0
20
40
60
80
100
120
140
160
I R I ( i n / m i )
RAP Content-Moisture Status
Control
Advera
Evotherm
Sasobit
(a)
(b)
(a)Low traffic (b) Medium traffic
(c) High traffic
Figure 4.8 Terminal IRI in limestone pavements
90
Page 104
8/9/2019 Characterization of Warm Mix Asphalt (WMA) Performance in Differe
http://slidepdf.com/reader/full/characterization-of-warm-mix-asphalt-wma-performance-in-differe 104/247
90
whether the incorporation of WMA additives and the addition of RAP affected pavement
distresses estimated at 95 percent reliability.
Table 4.4 Results of two-way ANOVA of factors affecting pavement distresses
Source ofVariation AlligatorCracking Rutting in ACLayer Rutting inTotal Pavement Terminal IRI
Limestone Significant
WMA No Yes Yes Yes
RAP (%) Yes No Yes Yes
Interaction No No No No
Quartzite Significant
WMA No No Yes Yes
RAP(%) Yes No No NoInteraction No No No No
In Table 4.4 above, the RAP content was a significant source of variability in the
percentage of alligator cracking predicted for both the limestone and quartzite mixtures.
There was no consistent trend, as the 30% RAP mixtures with limestone exhibited a lower
Page 105
8/9/2019 Characterization of Warm Mix Asphalt (WMA) Performance in Differe
http://slidepdf.com/reader/full/characterization-of-warm-mix-asphalt-wma-performance-in-differe 105/247
92
Page 106
8/9/2019 Characterization of Warm Mix Asphalt (WMA) Performance in Differe
http://slidepdf.com/reader/full/characterization-of-warm-mix-asphalt-wma-performance-in-differe 106/247
92
mixtures counterparts. For the quartzite mixtures, only the WMA incorporation was the
significant factor due to the statistical difference between the control and the Evotherm™
mixtures.
4.5. Conclusions and Recommendations
Based on the work conducted in this research using the materials, laboratory methods,
assumptions and equipment previously discussed, the following conclusions are reached:
The dynamic moduli of WMA mixtures were consistently lower compared to the
corresponding HMA mixture at all test temperatures with the Evotherm™ J1
recording lowest stiffness.
The rutting resistance of WMA mixtures is a concern as it was considerably lower
compared to HMA mixes based on flow number test.
While the inclusion of RAP improved the flow number of WMA mixtures, its
performance was still much lower compared to the control HMA mixtures.
MEPDG f l ti f th diff t i t th h th ti ti f
93
Page 107
8/9/2019 Characterization of Warm Mix Asphalt (WMA) Performance in Differe
http://slidepdf.com/reader/full/characterization-of-warm-mix-asphalt-wma-performance-in-differe 107/247
93
incorporating WMA and RAP using other testing procedures such as Hamburg Wheel
Track Test or Asphalt Pavement Analyzer to validate the results observed.
4.6. References
Bonaquist, Ramon, “Mix Design Practices for Warm Mix Asphalt”. National Cooperative
Highway Research Program (NCHRP), Report 691 , Washington D.C., 2011
Copeland, A., D'Angelo,J,, Dongre,R., Belagutti,S. and Sholar, G. "Field Evaluation of a
High Reclaimed Asphalt Pavement/Warm Mix Asphalt Project in Florida: A Case
Study." In Transportation Research Board 89th Annual Meeting Compendium of Papers.
CD-ROM. Transportation Research Board of National Academies, Washington, D.C.,
2010.
D’Angelo, J., Harm, E., Bartoszek, J., Baumgardner, G., Corrigan, M., Cowsert,J.,
Harman, T., Jamshidi,M., Jones, W., Newcomb, D., Prowell, B., Sines, R., and Yeaton,
B. "Warm Mix Asphalt: European Practice." Publication FHWA-PL-08-007. FHWA,
94
Page 108
8/9/2019 Characterization of Warm Mix Asphalt (WMA) Performance in Differe
http://slidepdf.com/reader/full/characterization-of-warm-mix-asphalt-wma-performance-in-differe 108/247
94
Hurley, G, and Prowell, B. "Evaluation of potential process for use in warm mix
asphalt."Journal of the Association of Asphalt Pavement Technologists”, Vol.75, p.41-85,
2005.
Kim, H., Lee, S-J., Amirkhanian, S.N. “Rheology of warm mix asphalt binders with aged
binders”. Canadian Journal of Civil Engineering. Vol. 37, p. 17-24, 2011
McDaniel, R., Anderson, R.M., “Recommended Use of Reclaimed Asphalt Pavement in
the Superpave Mix Design Method: Technician’s Manual”. National Cooperative
Highway Research Program, Report 452, Washington D.C., 2001
Meadwestvaco. September 17, 2010.
http://www.meadwestvaco.com/mwv/groups/content/documents/document/mwv025149.
pdf (accessed November 22, 2010)
Mogawer, W. S, Austeman, J. Engstrom. B., and Bonaquist, R.. "Incorporating High
Percentages of Recycled Asphalt Pavement (RAP) and Warm Mix Asphalt (WMA)
Page 109
8/9/2019 Characterization of Warm Mix Asphalt (WMA) Performance in Differe
http://slidepdf.com/reader/full/characterization-of-warm-mix-asphalt-wma-performance-in-differe 109/247
96
Page 110
8/9/2019 Characterization of Warm Mix Asphalt (WMA) Performance in Differe
http://slidepdf.com/reader/full/characterization-of-warm-mix-asphalt-wma-performance-in-differe 110/247
96
CHAPTER 5: EVALUATION OF THE RHEOLOGICAL PROPERTIES
OF POLYMER MODIFIED WARM MIX ASPHALT BINDERS
Mohamed H. Rashwan; R. Christopher Williams; Eric Cochran; Safwan Khedr
A paper to be submitted to the Applied Rheology International Journal
5.1. Abstract
The rheological behavior of two binders: a base binder and a polymer modified
binders incorporating two types of warm mix asphalt (WMA) additives were studied through
an extensive testing scheme. The warm mix additives used were an organic wax and an oily
chemical additive. Tests performed comprise basic rheological tests such as rotational
viscometer, viscous flow, creep, temperature and frequency sweeps. The output data of these
tests were used to construct Viscosity-Temperature Susceptibility (VTS) curves and master
curves to study the behavior of the binders tested. The performance of the unmodified WMA
binders was similar to the control binder at the midrange and high test temperatures. On the
other hand, the modified binder incorporating the waxy WMA additive exhibited stiffer
97
Page 111
8/9/2019 Characterization of Warm Mix Asphalt (WMA) Performance in Differe
http://slidepdf.com/reader/full/characterization-of-warm-mix-asphalt-wma-performance-in-differe 111/247
97
Protocol designated to reduce the concentrations of greenhouse gases. The protocol’s
objective is to reduce the generation of CO2 of 1990 levels by 5.2 percent between 2008 and
2012. Correspondingly, the European Union set the target of cutting CO2 emissions by 15
percent by 2010 (D'Angelo, et al., 2008). This legislation has facilitated the asphalt
pavement industries in several European countries to implement procedures and techniques
that foster a reduction in emissions and resource consumption which were identified by the
German Bitumen Forum established in 1997 as the most viable approaches to meet the newly
targeted cuts in CO2 emissions (Ruhl et al., 2003).
Intensive research efforts in that direction have resulted in the innovation of several
technologies and additives, generically known as warm mix asphalt (WMA) by European
companies. WMA technologies enable the production of asphalt mixtures at temperatures in
the range of 200° F to 275° F. Hot mix asphalt (HMA) is typically produced in the
temperature range of 285 °F to 340 °F while cold in-place recycling asphalt temperatures
occur at ambient temperatures in the range of 68°F to 120°F (Hurley and Prowell 2006).
Page 112
8/9/2019 Characterization of Warm Mix Asphalt (WMA) Performance in Differe
http://slidepdf.com/reader/full/characterization-of-warm-mix-asphalt-wma-performance-in-differe 112/247
99
Page 113
8/9/2019 Characterization of Warm Mix Asphalt (WMA) Performance in Differe
http://slidepdf.com/reader/full/characterization-of-warm-mix-asphalt-wma-performance-in-differe 113/247
the process (Kim et al.2010). Incorporating warm mix additives into polymer modified (PM)
mixtures could be a possible viable approach that enables the mixing and production of the
PM mixtures at lower temperatures without compromising the quality or the properties of the
mixtures produced. For this reason, this research investigates the effect of WMA additives on
the properties of polymer modified binders.
This study presents an assessment of the performance characteristics of two warm
mix technologies, a waxy hydrocarbon produced by the Fischer-Tropsch chemical process
and a forest based oily chemical additive were incorporated to a virgin binder with a PG (64-
22) and a polymer modified binder PG (70-22). Selected rheological tests were conducted at
different states of the binders: original form, rolling thin-film (RTFO) aged form mimicking
the aging effect of the mixing and placement phases during construction and (Pressure Aging
Vessel) PAV aged form simulating the in-service aging conditions of the material.
Rheological tests conducted include rotational viscometer testing (RV) at 135°C and the
dynamic shear rheometer (DSR) test.
100
Page 114
8/9/2019 Characterization of Warm Mix Asphalt (WMA) Performance in Differe
http://slidepdf.com/reader/full/characterization-of-warm-mix-asphalt-wma-performance-in-differe 114/247
addition, the Viscosity-Temperature relationship of all binders tested was studied to check
whether there are any discrepancies in the rheological response of the binders over the
temperature range of the frequency sweeps. Moreover, master curves of the complex
modulus, G* are constructed versus reduced frequency to illustrate the impact of variables
investigated in this study, WMA additives and polymer modification, on the performance of
asphalt binders.
5.3. Experimental Program
A virgin PG (64-22) binder was procured for investigating the effect of two warm
mix additives on the performance characteristics of the binder. Moreover, the binder was
modified through the addition of a 3% Styrene-Butadiene-Styrene (SBS) polymer and the
effect of incorporating WMA additives to the polymer modified binder of a PG (70-22) was
also studied. Two commercially available warm mix additives were used: a long chained
aliphatic hydrocarbon that is generated during the Fischer-Tropsch process which will be
referred to as (F-T) wax and a chemical additive which includes surfactants that enhance
101
Page 115
8/9/2019 Characterization of Warm Mix Asphalt (WMA) Performance in Differe
http://slidepdf.com/reader/full/characterization-of-warm-mix-asphalt-wma-performance-in-differe 115/247
Additional testing procedures were conducted using the DSR comprised of frequency
sweeps, viscosity curves and creep tests. The output of this testing was used to construct
master curves of the tested binders. Viscosity and creep curves were tested at 60°C, a
temperature critical for the rutting resistance performance of the tested binders using 25 mm
parallel plates with a 1mm gap. The frequency sweep procedure was carried out at different
temperatures 13,21,29,37,46,58,70 and 76°C at frequencies ranging between 0.1 to 25 Hz.
Sweeps at temperatures ranging between 13 and 37°C were performed using 8mm parallel
plates with 2 mm gap while the frequency sweeps at temperatures between 46 and 76 °C
were conducted using 25 mm parallel plates with 1 mm gap. DSR test data were used to
investigate the viscosity temperature susceptibility (VTS) of the binders. Binders with similar
values of the temperature susceptibility parameter VTS are anticipated to perform similarly
in terms of their rheological response to variations in temperatures. Typically the VTS is
computed using equation (1) below:
VTS (T1-T2) =
(1)
102
Page 116
8/9/2019 Characterization of Warm Mix Asphalt (WMA) Performance in Differe
http://slidepdf.com/reader/full/characterization-of-warm-mix-asphalt-wma-performance-in-differe 116/247
for a plot of viscosity versus temperature, the VTS value is equal to the slope of the line.
Master curves are graphical representations resulting from applying the time-temperature
superposition (TTSP) principle which assumes that time (frequencies) and temperatures have
comparable effect on a material’s rheological behavior. Thus, frequency sweep data at
different temperatures are shifted along the frequency axis with respect to a determined
reference temperature using shift factors for each temperature. Hence, a single curve
illustrating the change in the behavior of a rheological parameter, in this case, the shear
complex modulus, G* with frequency is formed. The advantage of master curves is that
exhibits the behavior of the tested material over a wider range of frequency or temperature
domains than the range allowed through experimental testing using the rheometer (Peralta et
al. 2010).
In addition, it is important to note that the applicability of the TTSP principle and the
method of shifting curves to construct master curves is dependent on the assumption that
h lt i i l th h l i l t i l d th t th li i l ti i li
103
Page 117
8/9/2019 Characterization of Warm Mix Asphalt (WMA) Performance in Differe
http://slidepdf.com/reader/full/characterization-of-warm-mix-asphalt-wma-performance-in-differe 117/247
approximately a single curve, this is an indication that the time-temperature superposition is
applicable for the test conditions and parameters and that the binder tested is thermo-
rheologically simple. In other cases, the TTSP is not applicable, usually; when the binder
tested comprise other phases such as polymers or paraffins. .
5.4. Results and Discussion
5.4.1. Viscosity
The rotational viscosity test is stipulated in the standard binder testing procedures to
assess whether the flow properties of the asphalt binder ensure proper pumpability and
handling at the mixing plant (Asphalt Institute, 2003). The Control unmodified binder
displayed higher viscosity compared to unmodified binders incorporating (F-T) wax and (F-
P) additive as shown in Figure 5.2.
The reduction in the viscosity of the F-T unmodified binder could be attributed to F-
T’s long chained arrangement of the carbon atoms (Gandhi, 2008, Hurley et al., 2006). On
the other hand according to the manufacturer of the chemical warm mix additive it
104
Page 118
8/9/2019 Characterization of Warm Mix Asphalt (WMA) Performance in Differe
http://slidepdf.com/reader/full/characterization-of-warm-mix-asphalt-wma-performance-in-differe 118/247
Experimental
Pro ram
PG (64-22)
Virgin
Binder
PG (64-22) +
(F-T) wax
PG (64-22)
+(F-P)Chem.
Additive
PG (64-22)
Virgin
Binder +
3% SBS
PG (70-22)
Virgin
Binder
PG (70-22) +
(F-T) wax
PG (70-22) +
(F-P)Chem.
Additive
RheologicalTests
RheologyProcedures
Viscosit
DSR
Frequency
Swee s
Creep
Rheological
Tests
Viscosity
DSRTemperature
Sweeps
RheologyProcedures
Frequency
Swee s
Creep
Temperature
Sweeps
105
Page 119
8/9/2019 Characterization of Warm Mix Asphalt (WMA) Performance in Differe
http://slidepdf.com/reader/full/characterization-of-warm-mix-asphalt-wma-performance-in-differe 119/247
0.0
0.2
0.4
0.6
0.8
1.0
Control F-P F-T
V i s c o s i t y ( P a . S
)
Mixture Types
Original Binder Polymer Modified Binder
The polymer modified control binder expectedly exhibited a higher viscosity at 0.8
Pa.s compared to 0.48 Pa.s for the unmodified control binder as the SBS interacts with the
asphaltenes and resin components of the asphalt binder (Kim, 2010). However, the SBS
Figure 5.2 Viscosity at 135C of original and polymer modified WMA binders
106
Page 120
8/9/2019 Characterization of Warm Mix Asphalt (WMA) Performance in Differe
http://slidepdf.com/reader/full/characterization-of-warm-mix-asphalt-wma-performance-in-differe 120/247
5.4.2 High Temperature Grade
A plot of the DSR test temperatures with the corresponding complex shear modulus
values is shown in Figure 5.3 below. For the unmodified group of binders, the binder
incorporating the F-T wax additive displayed the highest complex moduli values at test
temperatures. On the other hand, the control and the F-P binders had a very similar behavior
across all test temperatures.
Modifying the binders with SBS block copolymers expectedly led to an increase in
the complex moduli of all binders with the F-T binder again exhibiting a superior
performance. Such superiority could be attributed to the formation of a critical network
between the binder and the polymer phases resulting in an increase in the complex modulus,
G*. Moreover, an interaction possibly has taken place between F-T wax and the polymer
leading to a significant increase in the complex modulus values. Hence, the F-T polymer
modified binder is the least susceptible to rutting while the F-P binders performance were
similar to their corresponding control ones.
107
Page 121
8/9/2019 Characterization of Warm Mix Asphalt (WMA) Performance in Differe
http://slidepdf.com/reader/full/characterization-of-warm-mix-asphalt-wma-performance-in-differe 121/247
Table 5.1 Minimum temperature for fatigue cracking (°C)
Binder Modification Control F-T binder F-P binder
Unmodified 23.43 24.36 22.90
Modified 23.81 25.74 23.11
5.4.4. Low Temperature Properties
Table 5.2 shows the m-value and the stiffness parameter S at -12 °C acquired using
the bending beam rheometer which illustrates the behavior of the binders at low
temperatures. It could be observed that all binders passed the specifications criteria with the
exception of the polymer modified F-T binder who failed both the m-value and the stiffness
tests.
Table 5.2 Low temperature properties at -12 °C
Control F-T F-T F-P F-P
108
Page 122
8/9/2019 Characterization of Warm Mix Asphalt (WMA) Performance in Differe
http://slidepdf.com/reader/full/characterization-of-warm-mix-asphalt-wma-performance-in-differe 122/247
5.4.5. Flow
Asphalt materials are expected to behave as Newtonian fluids at temperatures greater
than 60 °C (Asphalt Institute, 2003). Newtonian fluids are characterized by a linear
relationship between the shear stress applied and the resulting shear strain rate. That is the
viscosity of the asphalt binder is constant with increasing shear rate. Figure 5.4 below
illustrates the viscous flow properties of RTFO and PAV aged unmodified asphalt binders at
60°C.
0.E+00
1.E+06
2.E+06
3.E+06
4.E+06
5.E+06
55 60 65 70 75 80
G * ,
P a
Control
F-P
F-T
Control-Pol
F-P-Pol
F-T-Pol
109
Page 123
8/9/2019 Characterization of Warm Mix Asphalt (WMA) Performance in Differe
http://slidepdf.com/reader/full/characterization-of-warm-mix-asphalt-wma-performance-in-differe 123/247
1.E+03
1.E+04
1.E+05
V i s c o s i t y ,
P a . S
Control-
RTFO F-T-RTFO
F-P-RTFO
Control-
PAV F-T-PAV
F-P-PAV
curve for the RTFO aged F-P binder was significantly lower than the control and F-T curves
indicating a lower resistance to rutting at 60°C and also followed a shear thinning trend.
The PAV aged unmodified binders expectedly shown greater viscosities than their
RTFO aged counterparts with the differences between the control and the warm mix binders
is significantly smaller in magnitude. Similarly, pseudo-plastic trends were observed for the
PAV aged binders curves.
110
Page 124
8/9/2019 Characterization of Warm Mix Asphalt (WMA) Performance in Differe
http://slidepdf.com/reader/full/characterization-of-warm-mix-asphalt-wma-performance-in-differe 124/247
1.E+02
1.E+03
1.E+04
1.E+05
1.00E-03 1.00E-02 1.00E-01 1.00E+00 1.00E+01
V i s c o s i t y , P a . S
Shear Rate, Sec -1
Control-RTFO
F-T-RTFO
F-P-RTFO
Control-PAV
F-T-PAV
F-P-PAV
indicating a superior resistance to permanent deformation which agrees with the high
temperature grade results discussed above. Additionally, the F-P curve for the PAV aged
binders was much lower than the F-T and control curves.
Figure 5.5 Viscous flow curves for RTFO and PAV aged polymer modified
binders
Page 125
8/9/2019 Characterization of Warm Mix Asphalt (WMA) Performance in Differe
http://slidepdf.com/reader/full/characterization-of-warm-mix-asphalt-wma-performance-in-differe 125/247
112
Page 126
8/9/2019 Characterization of Warm Mix Asphalt (WMA) Performance in Differe
http://slidepdf.com/reader/full/characterization-of-warm-mix-asphalt-wma-performance-in-differe 126/247
0
0.005
0.01
0.015
0.02
0 10 20 30 40
C o m p l i a n c e ,
1 / P a
Time, s
Control
F-T
F-P
Moreover, the phase angle curves of the F-P polymer modified binder were the highest over
the whole tested temperature range as shown in Figure 5.9 with the phase angle of the F-T
binder indicating a slightly better elastic behavior than the control binder.
Figure 5.7 Creep curves for RTFO aged polymer modified WMA binders
113
Page 127
8/9/2019 Characterization of Warm Mix Asphalt (WMA) Performance in Differe
http://slidepdf.com/reader/full/characterization-of-warm-mix-asphalt-wma-performance-in-differe 127/247
30
35
40
45
50
55
60
65
70
75
80
1.E+03
1.E+04
1.E+05
1.E+06
1.E+07
1.E+08
0 20 40 60 80
δ °
G * ,
P a
Temperature, C
control F-T F-P Control F-T F-P
5.4.8. Frequency Sweeps
Frequency sweep tests were conducted between 0.1 and 25 Hz at eight different
temperatures ranging between 13 and 76°C. The frequency dependence test was conducted
on PAV aged binders for the sweeps at temperatures 13 to 37°C because the fatigue cracking
Figure 5.9 Temperature sweeps of polymer modified WMA binders
114
Page 128
8/9/2019 Characterization of Warm Mix Asphalt (WMA) Performance in Differe
http://slidepdf.com/reader/full/characterization-of-warm-mix-asphalt-wma-performance-in-differe 128/247
Figure 5.10 below shows the frequency dependence of unmodified WMA binders at
21°C and 58°C. For PAV aged binders at 21°C, the control binder displayed a slightly stiffer
performance than F-P and F-T binders. Moreover, it can be observed that the F-T binder had
the lower phase angles especially at lower frequencies which indicate a higher elastic
performance compared to the control and F-P binders. As for the RTFO aged binders at
58°C, the F-T and control binders exhibited higher G* values compared to F-P binder
indicating their higher resistance to permanent deformation. A similar conclusion can be
drawn from the higher phase angles of the F-P binders.
The frequency sweeps carried out using polymer modified WMA binders showed a
different trend to the unmodified ones. Figure 5.11 below shows the frequency dependence
of PAV and RTFO aged binders at 21 and 58 °C, respectively. For the PAV aged binders,
the F-T polymer modified binder showed higher G* value compared to the control and F-P
modified binders especially at low frequencies. The same trend noted for phase angles as the
F-T binders had lower phase angles indicating higher elasticity. Airey (2004) reported that
Page 129
8/9/2019 Characterization of Warm Mix Asphalt (WMA) Performance in Differe
http://slidepdf.com/reader/full/characterization-of-warm-mix-asphalt-wma-performance-in-differe 129/247
Page 130
8/9/2019 Characterization of Warm Mix Asphalt (WMA) Performance in Differe
http://slidepdf.com/reader/full/characterization-of-warm-mix-asphalt-wma-performance-in-differe 130/247
30
35
40
45
50
55
1.E+05
1.E+06
1.E+07
1.E+08
0.01 0.1 1 10 100
δ ° G * , P
a
Frequency, Hz
C F-T F-P C F-T F-P
70
72
74
76
78
80
82
84
86
88
1.E+02
1.E+03
1.E+04
1.E+05
1.E+06
0.01 0.1 1 10 100
δ °
G * , P a
Frequency, Hz
C F-T F-P C F-T F-P
a) b)
Figure 5.10 Frequency dependence of unmodified WMA binders: a) PAV aged at 13 °C b) RTFO aged at 58 °C
Page 131
8/9/2019 Characterization of Warm Mix Asphalt (WMA) Performance in Differe
http://slidepdf.com/reader/full/characterization-of-warm-mix-asphalt-wma-performance-in-differe 131/247
30
32
34
36
38
40
42
44
46
48
50
1.0E+06
1.0E+07
1.0E+08
1.0E-01 1.0E+00 1.0E+01 1.0E+02
δ °
G * , P a
Frequency, Hz
C
F-T
F-P
C
F-T
F-P
65
67
69
71
73
75
77
79
81
83
1.E+02
1.E+03
1.E+04
1.E+05
1.E+06
1.0E-01 1.0E+00 1.0E+01 1.0E+02
δ °
G * , P a
Frequency, Hz
C
F-T
F-P
C
F-T
F-P
a)
b)
Figure 5.11 Frequency dependence of polymer modified WMA binders: a) PAV aged at 21 °C b) RTFO aged at 58 °C
118
Page 132
8/9/2019 Characterization of Warm Mix Asphalt (WMA) Performance in Differe
http://slidepdf.com/reader/full/characterization-of-warm-mix-asphalt-wma-performance-in-differe 132/247
5.4.9. Viscosity-Temperature Susceptibility (VTS)
The VTS curves for the binders tested in this work are shown in Figures 5.12 and
5.13 for unmodified and polymer modified WMA binders, respectively. It can be deduced
from the figures that within the same group, the binders exhibit VTS curves with similar
slopes indicating a similarity in their rheological response in this case the viscosity to
changes in test temperature.
5.4.10. Master curves
Prior to constructing the master curves, the data output from the frequency sweeps
were first checked for applicability for shifting using the time-temperature superposition
principle. This was done through constructing the black diagrams for all the binders tested.
Figures 5.13 and 5.14 show the black diagrams for the unmodified and SBS modified WMA
binders. By observing the aforementioned figures, it can be noted that graphical
representation of the G* versus the phase angle for all binders tested resemble roughly a
119
Page 133
8/9/2019 Characterization of Warm Mix Asphalt (WMA) Performance in Differe
http://slidepdf.com/reader/full/characterization-of-warm-mix-asphalt-wma-performance-in-differe 133/247
1.E+00
1.E+01
1.E+02
1.E+03
1.E+04
1.E+05
1.E+06
1.E+07
1.E+08
1.E+09
0 10 20 30 40 50 60 70 80
V i s c o
s i t y ( P o i s e )
Temperature ( C)
Control PAV aged F-T PAV F-P PAV
1.E+07
1.E+08
1.E+09
Control SBS PAV F-T mod PAV F-P mod PAV
Figure 5.12 VTS curve for unmodified WMA binders
120
Page 134
8/9/2019 Characterization of Warm Mix Asphalt (WMA) Performance in Differe
http://slidepdf.com/reader/full/characterization-of-warm-mix-asphalt-wma-performance-in-differe 134/247
1.E+07
1.E+08
1.E+09
Cont mod F-T mod F-P mod
1.E+00
1.E+01
1.E+02
1.E+031.E+04
1.E+05
1.E+06
1.E+07
1.E+08
1.E+09
15.00 25.00 35.00 45.00 55.00 65.00 75.00 85.00
G
* ( P a )
Phase Angle (delta)
Cont unmod F-T unmod F-P unmod
Figure 5.14 Black diagrams for unmodified WMA binders
121
Page 135
8/9/2019 Characterization of Warm Mix Asphalt (WMA) Performance in Differe
http://slidepdf.com/reader/full/characterization-of-warm-mix-asphalt-wma-performance-in-differe 135/247
0.0001 0.01 1 100 10000 1000000
1.E-01
1.E+00
1.E+01
1.E+02
1.E+00
1.E+01
1.E+02
1.E+03
1.E+04
1.E+05
1.E+06
1.E+07
1.E+08
1.E+09
1.E-04 1.E-02 1.E+00 1.E+02 1.E+04 1.E+06
t a n δ
G * ( P a )
Reduced Frequency (Hz)
G* Cont Unmod G* Cont mod tandelta Cont Unmod tandelta Cont mod
0.0001 0.01 1 100 10000 1000000
1.E+02
1.E+07
1.E+08
1.E+09
G* F-T Unmod G* F-Tmod tandelta F-T Unmod tandelta F-T mod
Figure 5.16 Master curves for control binders
122
Page 136
8/9/2019 Characterization of Warm Mix Asphalt (WMA) Performance in Differe
http://slidepdf.com/reader/full/characterization-of-warm-mix-asphalt-wma-performance-in-differe 136/247
0.0001 0.01 1 100 10000 1000000
1.E-01
1.E+00
1.E+01
1.E+02
1.E+00
1.E+01
1.E+02
1.E+03
1.E+04
1.E+05
1.E+06
1.E+07
1.E+08
1.E+09
1.E-04 1.E-02 1.E+00 1.E+02 1.E+04 1.E+06
t a n
δ
G * ( P a )
Reduced Frequency (Hz)
G* F-P Unmod G* F-P mod tan d F-P Unmod tan d F-P mod
Figure 5.18 Master curves for F-P binders
From the previous figures, it was noticed that master curves for all the binders
followed a similar trend as the G* decreased with the decrease in reduced frequency.
Another observation noted is that the differences in behavior between unmodified and
123
Page 137
8/9/2019 Characterization of Warm Mix Asphalt (WMA) Performance in Differe
http://slidepdf.com/reader/full/characterization-of-warm-mix-asphalt-wma-performance-in-differe 137/247
1.E+03
1.E+04
1.E+05
1.E+06
1.E+07
1.E+08
1.E+09
G * ( P a )
G* F-Tmod cont mod F-P mod Cont unmod F-T unmod F-P unmod
obvious in the low frequency/high temperature region. The control and F-T binder exhibited
a similar trend at high temperatures as their G* values were comparable. However, the F-P
binders exhibited a relatively lower G* values compared to the other two binders indicating
its resistance to permanent deformation is possibly lower. On the other hand, differences
between binders were insignificant at high frequency/ low temperatures.
124
Page 138
8/9/2019 Characterization of Warm Mix Asphalt (WMA) Performance in Differe
http://slidepdf.com/reader/full/characterization-of-warm-mix-asphalt-wma-performance-in-differe 138/247
Table 5.3 ANOVA test for RTFO and PAV aged complex modulus.
RTFO G* PAV G*
Source P-value Significant P-value Significant
WMA 0.0001 Yes 0.727 No
PolymerModification
0.0001 Yes 0.340 No
Temperature 0.0001 Yes 0.0001 Yes
Frequency 0.0001 Yes 0.0001 Yes
WMA*Polymer 0.0001 Yes 0.001 Yes
WMA*Temperature 0.0001 Yes 0.936 No
WMA*Frequency 0.39 No 1.000 No
5.4.11. Rate of Complex Modulus Aging
The rate at which the binders investigated in this work age in the high temperature
125
Page 139
8/9/2019 Characterization of Warm Mix Asphalt (WMA) Performance in Differe
http://slidepdf.com/reader/full/characterization-of-warm-mix-asphalt-wma-performance-in-differe 139/247
displayed the lowest percent change in the complex modulus value compared to the control
and F-P binders who were not statistically different with regard to each other.
Table 5.4 Multiple comparisons of binders complex modulus percent increase.
Unmodified + polymer modified
bindersUnmodified binders only Polymer modified binders only
Mean Group Mean Group Mean Group
Control 208% A Control 182% A Control 237% A
F-T 152% B F-T 119% B F-T 185% B
F-P 213% A F-P 250% C F-P 175% B
However, these observations could have been affected by the presence of
confounding variables in which two opposing trends for two variables cancel each other
affecting the final statistical observations. Hence, an analysis of variance was conducted on
the unmodified binder data only to identify which factors are affecting the variability of the
percent change in G*. The factors investigated and found significant were WMA type,
126
Page 140
8/9/2019 Characterization of Warm Mix Asphalt (WMA) Performance in Differe
http://slidepdf.com/reader/full/characterization-of-warm-mix-asphalt-wma-performance-in-differe 140/247
The same way, the polymer modified binders were analyzed separately to determine
which factors were statistically significant using ANOVA. The results showed again that
WMA type, temperature and frequency were significant factors. Pairwise comparison
showed that the control binder had the highest percent change in the value of the complex
modulus with an average of 237% while the F-T and F-P binders had percentages of 185 and
175%, respectively. These observations confirmed the presence of a confounding statistical
effect regarding the impact of polymer modification as the F-P binder exhibited the highest
percent increase in G* value when unmodified but upon the addition of the SBS polymer, it
recorded the lowest rate of increase in the complex modulus values. This observation was not
obvious in the original ANOVA analysis due to the confounding statistical impact of
polymer modification on the whole data set. An explanation for such change in the behavior
of the F-P binder could be that the polymer acted as an antioxidant while interacting with the
F-P additive.
5 5 Conclusions and Recommendations
127
Page 141
8/9/2019 Characterization of Warm Mix Asphalt (WMA) Performance in Differe
http://slidepdf.com/reader/full/characterization-of-warm-mix-asphalt-wma-performance-in-differe 141/247
The addition of WMA additives to the SBS polymer modified binders caused a sharp
reduction in viscosity indicating the possibility of mixing polymer modified binders
at lower mixing temperatures due to an interaction between the SBS network and the
WMA additives.
The high temperature binder grade of polymer modified binder increased significantly
with the addition of the wax WMA additive indicating the presence of a combining
effect between the SBS polymers and the recrystalization of the wax in the binder
causing the observed increase in the stiffness of the binder.
All binders exhibited a shear-thinning behavior at 60°C with the unmodified binder
incorporating the chemical additive looking more susceptible to rutting than other
investigated binders.
F-T unmodified binders are stiffer than the control and chemical additive binders for
the high temperature ranges indicating a superior resistance to permanent deformation
according to creep and frequency sweeps. The midrange temperatures performance of
128
Page 142
8/9/2019 Characterization of Warm Mix Asphalt (WMA) Performance in Differe
http://slidepdf.com/reader/full/characterization-of-warm-mix-asphalt-wma-performance-in-differe 142/247
The addition of the SBS polymer significantly alters the aging behavior of binders
incorporating wax and chemical WMA additives as it inhibits the antioxidant effect of
the former leading to increase in the rate of aging. It has the opposite effect on
binders with forest plant chemical additive as it critically weaken the effect of the
additive in lowering the rate of aging of the binder in the PAV as reflected by the
investigated values of the complex shear modulus.
Conducting a study that investigates the volumetric and performance characteristics
of polymer modified WMA mixtures is recommended.
To study the binder properties at significantly lower and higher temperatures using
suitable rheological equipment such as differential scanning calorimetry (DSC) to
capture the rheological behavior of the binders at a wider temperature range.
5.6. References
Airey, Gordon D., “Fundamental Binder and Practical Mixture Evaluation of
129
Page 143
8/9/2019 Characterization of Warm Mix Asphalt (WMA) Performance in Differe
http://slidepdf.com/reader/full/characterization-of-warm-mix-asphalt-wma-performance-in-differe 143/247
Gandhi, T.S. “Effects of warm asphalt additives on asphalt binder and mixture
properties”. Clemson, S.C: Clemson University, 2008
Hurley, G., and Prowell, B. "Evaluation of potential process for use in warm mix
asphalt.", Jounral of the Association of Asphalt Pavement Technologists, Vol.75, pp.41-
85, 2006
Kim, H. “Performance evaluation of SBS modified asphalt mixtures using warm mix
technologies”. Clemson, S.C: Clemson University, 2010
Kim H., Lee S., Amirkhanian S., “Effects of warm mix asphalt additives on performance
properties of polymer modified asphalt binders”, Canadian Journal of Civil Engineering,
Vol. 37, No. 1, p. 17-24,2010
Lesueur, D. and Gerard, J-F., “A structure-related model to describe asphalt linear
viscoelasticity”. Journal of Rheology, Vol. 40, pp. 813-836, 1996.
130
Page 144
8/9/2019 Characterization of Warm Mix Asphalt (WMA) Performance in Differe
http://slidepdf.com/reader/full/characterization-of-warm-mix-asphalt-wma-performance-in-differe 144/247
Peralta, J. Hilliou, L., Silva, H.M., Machado, A., Pais, J. and Olivera, J.” Rheological
Quantification of Bitumen Aging: Defination of a New Sensitive Parameter”. Journal of
Applied Rheology, Vol. 20, pp.1-11, 2010
PQ Corporation. PQ Corporation. 2010. http://www.pqcorp.com/products/adverawma.asp
(accessed February 20, 2010)
Ruhl, R., U. Musanke, R. Henseleit. “The German Bitumen Forum, An Alliance for
Occupational Safety and Health” Accessed from:
http://docserver.nrca.net/pdfs/technical/7855.pdf on 2/20/2009
Sasol Wax. Sasol Wax, Sasobit Production. Sasol Wax. November 22, 2010.
http://www.sasolwax.com/en/Applications/Bitumen+Modification/North+America/Sasobit-p-
540.html
Yildirim Y., “Polymer modified asphalt binders”, Construction and Building Materials,
Vol. 21, No. 1, p. 66-72, 2007
131
Page 145
8/9/2019 Characterization of Warm Mix Asphalt (WMA) Performance in Differe
http://slidepdf.com/reader/full/characterization-of-warm-mix-asphalt-wma-performance-in-differe 145/247
CHAPTER 6: SUMMARY, CONCLUSIONS, AND
RECOMMENDATIONS
6.1. Summary
With the prices of crude oil increasing and reserves of natural nonrenewable
resources dwindling over time, the needs for adopting greener and more sustainable
approaches in various construction activities are stronger. The asphalt production industry
has been keen during the last few decades to reduce the impact of its activities on the
environment especially regions adjacent to its operating activities and on natural resources.
Moreover, increasingly stringent governmental regulations targeting the reduction of carbon
dioxide and other greenhouse gas production have placed additional pressure on the asphalt
industry to adopt greener approaches in its production activities. Hence, the asphalt industries
in Europe, the United States and other regions in the world started to study the feasibility of
132
Page 146
8/9/2019 Characterization of Warm Mix Asphalt (WMA) Performance in Differe
http://slidepdf.com/reader/full/characterization-of-warm-mix-asphalt-wma-performance-in-differe 146/247
The major force driving the development of WMA techniques first in Europe and
later in the United States is the benefits gained through its implementation. Several
environmental benefits such as lower energy consumption needed for the heating up of the
asphalt binder and reduced emissions from the asphalt plants were reported by developers of
these technologies and some of the contractors who worked with them on trial projects. In
addition, a number of paving benefits was also reported such as lower viscosity of binder,
lower susceptibility to oxidative hardening and a higher potential for using higher content of
RAP.
After being introduced to the WMA technologies developed in Europe since the mid
1990s, governmental agencies and asphalt industry bodies in the United States focused on
establishing frameworks through which the suitability of using WMA techniques in the
United States is investigated. Hence, several research studies tried to investigate the
characteristics of WMA mixtures and its potential drawbacks such as susceptibility to
moisture and its fatigue and rutting performance.
133
Page 147
8/9/2019 Characterization of Warm Mix Asphalt (WMA) Performance in Differe
http://slidepdf.com/reader/full/characterization-of-warm-mix-asphalt-wma-performance-in-differe 147/247
cracking and permanent deformation predicted by the software. Fourthly, the basic
characteristics of a PG 64-22 binder incorporating Evotherm and Sasobit are studied by
carrying out Superpave binder testing procedure on the binders in its original form, rolling
thin film (RTFO) aged and pressure aging vessel (PAV) aged. These tests were conducted
using rotational viscometer, dynamic shear rheometer (DSR) and bending beam rheometer
(BBR) test equipment. Fifthly, the basic rheological properties of SBS polymer modified
WMA binders were measured and the effect of polymer modification on the characteristics
of the binders was analyzed. Sixthly, additional rheological procedures such as viscous flow,
creep, frequency and temperature sweeps were performed to further investigate the behavior
of WMA binders and polymer modified WMA binders. Finally, the rate of aging of the
binders in the high temperature range 46-76°C was studied by comparing the percent
increase in complex modulus values of RTFO aged binders to the values of PAV aged
binders.
6.2. Conclusions
134
Page 148
8/9/2019 Characterization of Warm Mix Asphalt (WMA) Performance in Differe
http://slidepdf.com/reader/full/characterization-of-warm-mix-asphalt-wma-performance-in-differe 148/247
with 30% RAP content so that its performance can be compared to equivalent mixtures that
do not contain any RAP.
6.2.1. Performance Tests of WMA Mixtures
Two performance tests: dynamic modulus and flow number were conducted to
characterize the stress-strain relationship and permanent deformation properties, respectively.
The properties of the WMA mixtures were compared to the characteristics of four control
HMA mixes produced and compacted at typical HMA temperatures. The dynamic modulus
test data showed that WMA mixtures had lower dynamic modulus |E*| values compared to
the values of control HMA mixes. This observation could be attributed to the lower aging of
WMA mixtures as they were exposed to lower production and compaction temperatures
compared to the HMA control mixtures. Moreover, the differences in dynamic modulus
values between control HMA mixtures and the WMA mixtures decreased as the test
temperature increased. As a result, the largest differences in |E*| values between WMA,
E th d S bit i ti l d th HMA i t b d t 4°C Th th
135
Page 149
8/9/2019 Characterization of Warm Mix Asphalt (WMA) Performance in Differe
http://slidepdf.com/reader/full/characterization-of-warm-mix-asphalt-wma-performance-in-differe 149/247
HMA mixtures with RAP recorded higher |E*| compared to their equivalent WMA mixtures.
The impact of RAP incorporation on the increase in dynamic moduli values decreased as the
test temperature increased. On the other hand, the rutting resistance of WMA mixtures is a
concern as it was significantly lower than that of HMA mixtures based on flow number test
results, possibly, due to the lower aging undergone by the WMA mixtures as they were
exposed to lower mixing and compaction temperatures. The RAP inclusion generally
improved the permanent deformation resistance of all mixtures; however, its impact was
more evident in the performance of HMA mixtures than in the WMA mixtures. Hence, the
suitability of the studied WMA technologies for use in pavements located in hot climate
regions needs to be further investigated.
6.2.2. Performance Prediction of Pavements with WMA using MEPDG
The test data acquired by conducting the dynamic modulus test on specimens of
twelve WMA mixtures and four HMA mixtures were used as input data into the MEPDG
ft Thi ft k d t ti t th f f t d i
136
Page 150
8/9/2019 Characterization of Warm Mix Asphalt (WMA) Performance in Differe
http://slidepdf.com/reader/full/characterization-of-warm-mix-asphalt-wma-performance-in-differe 150/247
acquired from lab testing were used as input characteristics of the asphalt layer. Finally, the
asphalt pavement structure designed comprised three structural layers: the asphalt cement
layer, crushed stone base layer and subgrade with only the thickness of the asphalt layer
varying with the increase in traffic volume. The MEPDG software runs generate an output
that estimates the primary distresses resulting from the accumulation of damage in the
structure of the pavement over a specific period of time. Typical distresses estimated by
MEPDG are permanent deformation, alligator (fatigue) cracking and the International
Roughness Index (IRI) which is an indicator of pavement smoothness and overall quality.
The MEPDG output predicting the performance of different mixtures through the
estimation of pavement distresses generally agreed with observations deduced from the
laboratory test results. The estimated rutting and terminal IRI values agreed with the trends
exhibited by the results of flow number and dynamic modulus tests, respectively. ANOVA
statistical analysis of MEPDG output data showed that RAP content is a significant factor
that affects alligator cracking while the incorporation of WMA additives impact on the
Page 151
8/9/2019 Characterization of Warm Mix Asphalt (WMA) Performance in Differe
http://slidepdf.com/reader/full/characterization-of-warm-mix-asphalt-wma-performance-in-differe 151/247
138
Page 152
8/9/2019 Characterization of Warm Mix Asphalt (WMA) Performance in Differe
http://slidepdf.com/reader/full/characterization-of-warm-mix-asphalt-wma-performance-in-differe 152/247
than other binders. In addition, master curves were constructed using the complex modulus
test data acquired from the frequency sweeps carried on the unmodified and polymer
modified WMA binders. The master curves of the unmodified binders show that the complex
modulus of the control binder was not significantly different from the moduli of the WMA
binders.
The incorporation of Sasobit pellets to the unmodified binder reduced the aging rate
of the binder in the PAV as the waxy WMA additive behaved as an antioxidant. On the other
hand, the addition of Evotherm had the opposite effect on the aging rate of the unmodified
binder. The addition of SBS polymer significantly altered the aging behavior of WMA
binders. For example, the introduction of the SBS polymers seemed to inhibit the antioxidant
effect of Sasobit on the aging rate of the binder in the PAV oven causing an increase in the
rate of aging. The polymer introduction to the Evotherm binder weakened the effect of the
WMA additive on the aging rate of the binder in the PAV oven as indicated by the values of
the complex shear modulus.
139
Page 153
8/9/2019 Characterization of Warm Mix Asphalt (WMA) Performance in Differe
http://slidepdf.com/reader/full/characterization-of-warm-mix-asphalt-wma-performance-in-differe 153/247
cored out at regular intervals to assess the performance of the pavements throughout
the life cycle of the pavement.
The properties of the binders utilized in this work should be studied in correlation to
the properties of the asphalt mixtures with the objective to explore the presence of
any relationship or correlation present between the binder phase properties and the
asphalt mix matrix.
Due to the high variability in the results of the flow number test, it is recommended to
evaluate the permanent deformation properties of WMA mixtures using other
experimental procedures using equipment like the asphalt pavement analyzer (APA)
or the Hamburg Wheel Tracking (HWT) machine.
Conducting a study that investigates the volumetric and performance characteristics
of polymer modified WMA mixtures is recommended. A comprehensive value
engineering study in using WMA additives with and without polymer modification is
suggested.
140
Page 154
8/9/2019 Characterization of Warm Mix Asphalt (WMA) Performance in Differe
http://slidepdf.com/reader/full/characterization-of-warm-mix-asphalt-wma-performance-in-differe 154/247
construction approaches is recommended for future work to accurately quantify the
impact of WMA usage on reducing carbon emissions.
141
Page 155
8/9/2019 Characterization of Warm Mix Asphalt (WMA) Performance in Differe
http://slidepdf.com/reader/full/characterization-of-warm-mix-asphalt-wma-performance-in-differe 155/247
REFERENCES
Airey, Gordon D., “Fundamental Binder and Practical Mixture Evaluation of
Polymer Modified Bituminous Materials”, International Journal of Pavement
Engineering, Vol. 5, No. 3, pp 137-151, September 2004.
Anderson, R. M., Baumgardner, G., May, R., and Reinke, G. "NCHRP 9-47: Interim
Report: Engineering Properties, Emissions, and Field Performance of Warm Mix Asphalt
Technologies." TRB, National Highway Research Council, Washington, D.C., 2008.
Bennert, T., Reinke, G., Mogawer, W. and Mooney, K. “Assessment of Workability and
Compactability of Warm-Mix Asphalt”, Transportation Research Record,2180, TRB,
National Highway Research Council, Washington, D.C., pp. 36-47, 2010
Biro, S., Gandhi, T. and Amirkhanian, S., “Midrange Temperature Rheological Properties
142
Page 156
8/9/2019 Characterization of Warm Mix Asphalt (WMA) Performance in Differe
http://slidepdf.com/reader/full/characterization-of-warm-mix-asphalt-wma-performance-in-differe 156/247
Brown, D., “Warm Mix: Green Is Cool”, Associated Construction Publications. Last
updated on 10/1/2008. Accessed on 3/16/2009 from:
http://www.acppubs.com/article/CA6597208.html
Button, J.W, Estakhri, C. and Wimsatt, A. “A Synthesis of Warm-Mix Asphalt”. Report
FHWA/TX-07/0-5597-1, Texas Department of Transportation, Austin, 2007.
Cervarich, M.B., "Cooling Down the Mix: NAPA Explores New "Warm Mix Asphalt"
Technologies Developed in Europe." Hot Mix Asphalt Technology (March/April 2003).
Accessed from:
http://www.warmmixasphalt.com/submissions/27_20071127_Cooling_Down_the_Mix-
Warm_Mix_Asphalt.pdf on 2/16/2009.
Copeland, A., D'Angelo,J,, Dongre,R., Belagutti,S. and Sholar, G. "Field Evaluation of a
High Reclaimed Asphalt Pavement/Warm Mix Asphalt Project in Florida: A Case
Study." In Transportation Research Board 89th Annual Meeting Compendium of Papers.
143
Page 157
8/9/2019 Characterization of Warm Mix Asphalt (WMA) Performance in Differe
http://slidepdf.com/reader/full/characterization-of-warm-mix-asphalt-wma-performance-in-differe 157/247
Crews, E., “Evotherm, Warm Mix Asphalt Technology”, Asphalt Institute Spring
Meeting, April 2006. Accessed from:
http://www.flexiblepavements.org/documents/Evotherm-Crews.pdf on 3/16/2009
D’Angelo, J., Harm, E., Bartoszek, J., Baumgardner, G., Corrigan, M., Cowsert,J.,
Harman, T., Jamshidi,M., Jones, W., Newcomb, D., Prowell, B., Sines, R., and Yeaton,
B. "Warm Mix Asphalt: European Practice." Publication FHWA-PL-08-007. FHWA,
U.S. Department of Transportation, February 2008.
Damm, K., Abraham, J., Butz, T., Hildebrand,G., and Riebesehl. “Asphalt Flow
Improvers As Intelligent Fillers for Hot Asphalts- A New Chapter in Asphalt
Technology”, Sasol Wax GmbH, Hamburg, 2004.
Davidson, J.K., "Warm Asphalt Mix Technology- The Canadian Perspective."
McAsphalt Engineering Services. 2007 Australian Asphalt Pavement Association
Industry Conference. Accessed on 2/19/2009 from:
144
G dhi S ff f h l ddi i h l bi d d i i
Page 158
8/9/2019 Characterization of Warm Mix Asphalt (WMA) Performance in Differe
http://slidepdf.com/reader/full/characterization-of-warm-mix-asphalt-wma-performance-in-differe 158/247
Gandhi, T.S. Effects of warm asphalt additives on asphalt binder and mixture properties.
Clemson, S.C: Clemson University, 2008.
Hansen, K., “Warm Mix Asphalt”, National Asphalt Pavement Association. Accessed
from:http://cobweb.ecn.purdue.edu/~spave/NCAUPG/Activities/2006/Presentations%20
HMA%20Conf.%2006/warm%20mix%20asphalt%20NCUPG%2001-06-Hansen.pdf on
2/17/2009.
Harder, G., “Low Energy Asphalt- The Cool Mix”. Accessed on 3/28/2009 from:
https://www.nysdot.gov/divisions/engineering/technical-services/trans-r-and-d-
repository/TTNSprintNewsLtr07.pdf
Hossain, Z., Bhudhala, A, Zaman,M., O'Rear,E., Cross, S., and Lewis, S., “Evaluation of
the Use of Warm Mix Asphalt as a Viable Paving Material in the United States”. Report
06-H-0044, Federal Highway Administration, McLean, 2009.
Hurley, G, and Prowell, B. "Evaluation of potential process for use in warm mix
Page 159
8/9/2019 Characterization of Warm Mix Asphalt (WMA) Performance in Differe
http://slidepdf.com/reader/full/characterization-of-warm-mix-asphalt-wma-performance-in-differe 159/247
146
L i L H jj E Y S b l P B t M K S d Li k T "P f
Page 160
8/9/2019 Characterization of Warm Mix Asphalt (WMA) Performance in Differe
http://slidepdf.com/reader/full/characterization-of-warm-mix-asphalt-wma-performance-in-differe 160/247
Loria, L., Hajj, E.Y., Sebaaly, P., Barton, M., Kass, S. and Liske, T. "Performance
Evaluation of Asphalt Mixtures with High Recycled Asphalt Pavement Content."
Transportation Research Record 2208, TRB, National Highway Research Council,
Washington, D.C., pp.72-81, 2011
Mallick, Rajib B., Bergendahl,J., and Pakula, M. "A Laboratory Study on CO2 Emission
Reductions Through the Use of Warm Mix Asphalt . In “Transportation Research Board
88th Annual Meeting Compendium of Papers”. CD-ROM. Transportation Research
Board of National Academies, Washington, D.C., 2009.
Middleton, B., Forfylow, R.W., "An Evaluation of Warm Mix Asphalt Produced With the
Double Barrel Green Process" In Transportation Research Board 88th Annual Meeting
Compendium of Papers. CD-ROM. Transportation Research Board of National
Academies, Washington, D.C., 2009.
Mogawer, W.S., Austerman, A.J. and Bahia, H. U. “Evaluating the Effect of Warm-Mix
147
P Fl ibl P t A d 3/16/2009 f
Page 161
8/9/2019 Characterization of Warm Mix Asphalt (WMA) Performance in Differe
http://slidepdf.com/reader/full/characterization-of-warm-mix-asphalt-wma-performance-in-differe 161/247
Powers, Flexible Pavements. Accessed on: 3/16/2009 from:
http://www.flexiblepavements.org/documents/PowersWMApresentation.pdf
Prowell, B. D., Hurley, G.C. “Missouri Warm Mix Demonstration Project”, National
Superpave News, Volume 1, Issue # 1. Accessed on 3/16/2009 from:
http://www.eng.auburn.edu/center/ncat/ssc/newsletters/SSC_spring2007_Ntl.pdf
Rea, M., “New Technology Could Cool off ‘Hot’ in Hot Mix Asphalt”,Texas
Construction, July 2003. Accessed
from:http://texas.construction.com/features/archive/0307.hot.asp on 3/6/2009.
Ruhl, R., Musanke, U. and Henseleit, R. “The German Bitumen Forum, An Alliance for
Occuptioanl Safety and Health” Accessed from:
http://docserver.nrca.net/pdfs/technical/7855.pdf on 2/20/2009
Saboundjian, S., Liu, J., Li, P. and Brunette,B. “Late-Season Paving of a Low-Volume
Road with Warm-Mix Asphalt: An Alaskan Experience”. Transportation Research
148
S bit T h l A li ti H b F hl b tt l A d f
Page 162
8/9/2019 Characterization of Warm Mix Asphalt (WMA) Performance in Differe
http://slidepdf.com/reader/full/characterization-of-warm-mix-asphalt-wma-performance-in-differe 162/247
Sasobit Technology Applications: Hamburg Fuhlsbuttel. Accessed from:
http://www.sasolwax.com/Hamburg_Fuhlsb%C3%BCttel__Germany.html on 3/16/2009.
Sasol Wax: The United Kingdom, Accessed from:
http://www.sasolwax.com/Sasobit_UK-highlight-sasobit.html on 3/16/2009.
Takamura, K., “Binder Characterization for Latex Polymer Modified Evotherm Warm
Mix”. Charlotte Technical Center, BASF Corporation, Charlotte, North Carolina, 2005
Transportation Research Board, “NCHRP 09-43 :Mix Design Practices for Warm Mix
Asphalt”. Accessed from: http://www.trb.org/TRBNet/ProjectDisplay.asp?ProjectID=977
on 3/1/2009.
U.S. Environmental Protection Agency. "Clean Air Interstate Rule: Iowa." Last updated
September 23, 2008. Accessed on 2-27-2009 from:
http://www.epa.gov/interstateairquality/ia.html
149
Wielinski J Hand A Rausch D M "Laboratory and Field Evaluations of Foamed
Page 163
8/9/2019 Characterization of Warm Mix Asphalt (WMA) Performance in Differe
http://slidepdf.com/reader/full/characterization-of-warm-mix-asphalt-wma-performance-in-differe 163/247
Wielinski, J., Hand, A., Rausch, D.M., "Laboratory and Field Evaluations of Foamed
Warm Mix Asphalt Projects." In Transportation Research Board 88th Annual Meeting
Compendium of Papers. CD-ROM. Transportation Research Board of National
Academies, Washington, D.C., 2009.
Xiao, F., Jordan, J. and Amirkhanian, S.N. “Laboratory Investigation of Moisture
Damage in Warm Mix Asphalt Containing Moist Aggregate”. ." In Transportation
Research Board 88th Annual Meeting Compendium of Papers. CD-ROM. Transportation
Research Board of National Academies, Washington, D.C., 2009.
Zettler, R. “Warm Mix Stands up to its Trial, February 2006, Better Roads Magazine,
Accessed from: http://obr.gcnpublishing.com/articles/feb06a.htm on 2/17/2009.
150
APPENDIX A SAMPLE JOB MIX FORMULAS OF WMA MIXTURES
Page 164
8/9/2019 Characterization of Warm Mix Asphalt (WMA) Performance in Differe
http://slidepdf.com/reader/full/characterization-of-warm-mix-asphalt-wma-performance-in-differe 164/247
APPENDIX A SAMPLE JOB MIX FORMULAS OF WMA MIXTURES
151
Page 165
8/9/2019 Characterization of Warm Mix Asphalt (WMA) Performance in Differe
http://slidepdf.com/reader/full/characterization-of-warm-mix-asphalt-wma-performance-in-differe 165/247
APPENDIX B DYNAMIC MODULUS TEST RESULTS
The results of the dynamic modulus test and phase angle for the mixtures are
presented in Tables B-1 and B-2, respectively.
Table B-1 Dynamic modulus for non-moisture conditioned mixes (Pa)
Page 166
8/9/2019 Characterization of Warm Mix Asphalt (WMA) Performance in Differe
http://slidepdf.com/reader/full/characterization-of-warm-mix-asphalt-wma-performance-in-differe 166/247
Mix Sample Temperature 25Hz 15Hz 10Hz 5Hz 3Hz 1Hz 0.5Hz 0.3Hz 0.1Hz
LM1-NMC Mean 4 1.57E+07 1.49E+07 1.41E+07 1.31E+07 1.25E+07 1.07E+07 9.82E+06 9.18E+06 7.54E+06
LM1-NMC SD 4 1.13E+06 1.01E+06 9.36E+05 8.73E+05 1.22E+06 9.31E+05 7.82E+05 8.84E+05 7.14E+05
LM1-NMC CoV 4 7.17 6.79 6.66 6.69 9.74 8.73 7.96 9.63 9.48
LM1-NMC Mean 21 6.86E+06 6.21E+06 5.77E+06 4.98E+06 4.15E+06 3.09E+06 2.61E+06 2.54E+06 1.71E+06
LM1-NMC SD 21 4.18E+05 3.49E+05 2.80E+05 2.73E+05 2.98E+05 3.14E+05 3.48E+05 2.78E+05 1.62E+05
LM1-NMC CoV 21 6.09 5.62 4.85 5.49 7.17 10.17 13.30 10.97 9.44
LM1-NMC Mean 37 2.80E+06 2.36E+06 2.12E+06 1.69E+06 1.24E+06 9.27E+05 7.73E+05 6.65E+05 4.46E+05
LM1-NMC SD 37 4.06E+05 3.53E+05 3.14E+05 2.47E+05 2.04E+05 1.22E+05 1.22E+05 1.09E+05 5.22E+04
LM1-NMC CoV 37 14.50 14.98 14.83 14.59 16.37 13.20 15.81 16.33 11.70
LM4-NMC Mean 4 1.45E+07 1.41E+07 1.33E+07 1.21E+07 1.08E+07 9.09E+06 8.61E+06 8.08E+06 6.09E+06
LM4-NMC SD 4 7.97E+05 2.02E+06 1.96E+06 1.83E+06 2.25E+06 1.72E+06 1.31E+06 1.37E+06 1.62E+06
LM4-NMC CoV 4 5.49 14.28 14.77 15.12 20.81 18.94 15.23 16.95 26.56
LM4-NMC Mean 21 6.06E+06 5.30E+06 4.79E+06 4.00E+06 3.16E+06 2.24E+06 1.87E+06 1.55E+06 9.88E+05
LM4-NMC SD 21 2.71E+05 1.71E+05 1.41E+05 1.42E+05 1.79E+05 1.64E+05 1.55E+05 1.56E+05 1.23E+05
LM4-NMC CoV 21 4.47 3.23 2.95 3.54 5.67 7.34 8.29 10.05 12.44
LM4-NMC Mean 37 1.85E+06 1.52E+06 1.32E+06 1.05E+06 7.50E+05 5.42E+05 4.36E+05 3.85E+05 2.60E+05
LM4-NMC SD 37 3.85E+05 3.25E+05 2.73E+05 1.87E+05 1.14E+05 1.09E+05 7.79E+04 6.72E+04 3.59E+04
LM4-NMC CoV 37 20.85 21.37 20.76 17.91 15.26 20.14 17.87 17.43 13.82
Table B-1 (Continued)
Page 167
8/9/2019 Characterization of Warm Mix Asphalt (WMA) Performance in Differe
http://slidepdf.com/reader/full/characterization-of-warm-mix-asphalt-wma-performance-in-differe 167/247
Mix Sample Temperature 25Hz 15Hz 10Hz 5Hz 3Hz 1Hz 0.5Hz 0.3Hz 0.1Hz
LM7-NMC Mean 4 1.26E+07 1.15E+07 1.09E+07 1.00E+07 9.19E+06 7.47E+06 6.72E+06 6.57E+06 4.90E+06
LM7-NMC SD 4 1.15E+06 9.06E+05 9.25E+05 8.11E+05 7.49E+05 5.42E+05 7.26E+05 3.92E+05 2.90E+05LM7-NMC CoV 4 9.12 7.87 8.51 8.10 8.15 7.25 10.81 5.96 5.92
LM7-NMC Mean 21 4.75E+06 4.21E+06 3.78E+06 3.08E+06 2.38E+06 1.65E+06 1.33E+06 1.08E+06 6.63E+05
LM7-NMC SD 21 4.06E+05 3.03E+05 2.56E+05 1.91E+05 1.29E+05 8.84E+04 5.79E+04 4.02E+04 1.07E+04
LM7-NMC CoV 21 8.55 7.21 6.78 6.20 5.43 5.36 4.33 3.73 1.61
LM7-NMC Mean 37 1.48E+06 1.24E+06 1.07E+06 8.58E+05 6.26E+05 4.96E+05 3.97E+05 3.66E+05 2.31E+05
LM7-NMC SD 37 1.47E+04 2.39E+04 3.73E+04 2.82E+04 1.49E+04 2.43E+04 1.59E+04 2.66E+04 2.72E+03
LM7-NMC CoV 37 0.99 1.93 3.47 3.28 2.39 4.89 4.00 7.27 1.18
LM10-NMC Mean 4 1.41E+07 1.29E+07 1.20E+07 1.10E+07 1.01E+07 8.58E+06 7.80E+06 7.27E+06 5.36E+06
LM10-NMC SD 4 1.25E+06 1.03E+06 1.03E+06 8.89E+05 8.06E+05 7.97E+05 8.74E+05 6.73E+05 4.93E+05LM10-NMC CoV 4 8.81 8.00 8.56 8.09 7.96 9.30 11.21 9.26 9.19
LM10-NMC Mean 21 5.98E+06 5.23E+06 4.70E+06 3.92E+06 3.15E+06 2.22E+06 1.84E+06 1.52E+06 9.79E+05
LM10-NMC SD 21 3.30E+05 3.01E+05 2.55E+05 2.38E+05 2.31E+05 1.55E+05 1.17E+05 1.05E+05 7.99E+04
LM10-NMC CoV 21 5.52 5.76 5.43 6.07 7.35 6.99 6.35 6.91 8.16
LM10-NMC Mean 37 1.80E+06 1.48E+06 1.29E+06 1.03E+06 7.23E+05 5.44E+05 4.39E+05 3.83E+05 3.02E+05
LM10-NMC SD 37 9.63E+04 5.17E+04 5.45E+04 5.71E+04 4.36E+04 6.46E+04 6.52E+04 6.10E+04 5.65E+04
LM10-NMC CoV 37 5.35 3.49 4.21 5.55 6.02 11.88 14.84 15.90 18.71
Table B-1 (Continued)
Page 168
8/9/2019 Characterization of Warm Mix Asphalt (WMA) Performance in Differe
http://slidepdf.com/reader/full/characterization-of-warm-mix-asphalt-wma-performance-in-differe 168/247
Mix Sample Temperature 25Hz 15Hz 10Hz 5Hz 3Hz 1Hz 0.5Hz 0.3Hz 0.1Hz
LM3-NMC Mean 4 1.81E+07 1.70E+07 1.61E+07 1.54E+07 1.45E+07 1.31E+07 1.20E+07 1.16E+07 1.00E+07
LM3-NMC SD 4 1.74E+06 1.62E+06 1.42E+06 1.40E+06 1.25E+06 1.64E+06 1.24E+06 1.01E+06 1.13E+06
LM3-NMC CoV 4 9.64 9.51 8.78 9.05 8.57 12.56 10.33 8.71 11.29
LM3-NMC Mean 21 9.50E+06 8.70E+06 8.12E+06 7.19E+06 6.32E+06 5.02E+06 4.35E+06 3.96E+06 2.98E+06
LM3-NMC SD 21 5.22E+05 4.64E+05 4.41E+05 3.62E+05 4.10E+05 2.98E+05 2.47E+05 2.05E+05 1.52E+05
LM3-NMC CoV 21 5.49 5.33 5.43 5.03 6.50 5.94 5.69 5.19 5.09
LM3-NMC Mean 37 3.78E+06 3.35E+06 3.00E+06 2.49E+06 1.91E+06 1.42E+06 1.23E+06 1.06E+06 7.64E+05
LM3-NMC SD 37 2.26E+05 1.72E+05 1.55E+05 1.12E+05 9.15E+04 7.70E+04 9.69E+04 8.22E+04 8.15E+04
LM3-NMC CoV 37 5.96 5.14 5.15 4.52 4.79 5.43 7.89 7.79 10.67
LM6-NMC Mean 4 1.88E+07 1.80E+07 1.72E+07 1.60E+07 1.51E+07 1.32E+07 1.22E+07 1.10E+07 9.42E+06
LM6-NMC SD 4 1.61E+06 1.31E+06 1.37E+06 1.23E+06 1.50E+06 8.92E+05 8.65E+05 1.33E+06 6.49E+05LM6-NMC CoV 4 8.57 7.27 7.98 7.65 9.92 6.75 7.08 12.05 6.90
LM6-NMC Mean 21 7.74E+06 6.92E+06 6.39E+06 5.52E+06 4.64E+06 3.49E+06 2.99E+06 2.62E+06 1.83E+06
LM6-NMC SD 21 3.58E+05 2.97E+05 2.90E+05 2.76E+05 2.10E+05 1.89E+05 1.22E+05 1.08E+05 8.89E+04
LM6-NMC CoV 21 4.63 4.29 4.54 5.01 4.53 5.42 4.08 4.12 4.85
LM6-NMC Mean 37 2.91E+06 2.40E+06 2.10E+06 1.66E+06 1.18E+06 7.78E+05 6.93E+05 5.67E+05 4.40E+05
LM6-NMC SD 37 2.57E+05 2.05E+05 1.81E+05 1.56E+05 1.14E+05 8.72E+04 1.38E+05 1.02E+05 1.15E+05
LM6-NMC CoV 37 8.82 8.56 8.62 9.41 9.62 11.20 19.92 18.00 26.25
Table B-1 (Continued)
Mi S l T 25H 15H 10H 5H 3H 1H 0 5H 0 3H 0 1H
Page 169
8/9/2019 Characterization of Warm Mix Asphalt (WMA) Performance in Differe
http://slidepdf.com/reader/full/characterization-of-warm-mix-asphalt-wma-performance-in-differe 169/247
Mix Sample Temperature 25Hz 15Hz 10Hz 5Hz 3Hz 1Hz 0.5Hz 0.3Hz 0.1Hz
LM9-NMC Mean 4 1.59E+07 1.50E+07 1.43E+07 1.33E+07 1.24E+07 1.05E+07 9.97E+06 9.15E+06 7.31E+06
LM9-NMC SD 4 1.64E+06 1.32E+06 1.15E+06 9.73E+05 8.91E+05 8.05E+05 9.73E+05 8.44E+05 4.52E+05
LM9-NMC CoV 4 10.31 8.82 7.98 7.32 7.20 7.65 9.76 9.23 6.19
LM9-NMC Mean 21 6.79E+06 6.08E+06 5.54E+06 4.70E+06 3.85E+06 2.80E+06 2.38E+06 2.08E+06 1.40E+06
LM9-NMC SD 21 5.04E+04 5.03E+04 2.26E+04 3.95E+04 4.55E+04 3.79E+04 5.06E+04 6.09E+04 2.35E+04
LM9-NMC CoV 21 0.74 0.83 0.41 0.84 1.18 1.35 2.13 2.93 1.68
LM9-NMC Mean 37 2.26E+06 1.87E+06 1.63E+06 1.29E+06 9.02E+05 6.28E+05 4.80E+05 4.03E+05 3.15E+05
LM9-NMC SD 37 1.10E+05 8.73E+04 6.72E+04 5.32E+04 5.50E+04 7.11E+04 5.47E+04 4.56E+04 6.19E+04
LM9-NMC CoV 37 4.87 4.67 4.12 4.11 6.10 11.32 11.40 11.33 19.65
LM12-NMC Mean 4 1.56E+07 1.44E+07 1.37E+07 1.26E+07 1.19E+07 9.91E+06 9.26E+06 8.53E+06 6.64E+06
LM12-NMC SD 4 2.00E+06 1.92E+06 1.62E+06 1.41E+06 1.54E+06 1.19E+06 1.22E+06 1.19E+06 8.45E+05LM12-NMC CoV 4 12.80 13.29 11.84 11.16 13.02 12.04 13.22 13.94 12.72
LM12-NMC Mean 21 6.83E+06 6.08E+06 5.54E+06 4.70E+06 3.83E+06 2.81E+06 2.40E+06 2.06E+06 1.35E+06
LM12-NMC SD 21 9.08E+05 7.87E+05 7.61E+05 6.79E+05 5.90E+05 4.20E+05 4.01E+05 3.32E+05 2.04E+05
LM12-NMC CoV 21 13.30 12.94 13.74 14.43 15.39 14.94 16.70 16.08 15.12
LM12-NMC Mean 37 2.20E+06 1.81E+06 1.59E+06 1.25E+06 8.61E+05 5.69E+05 4.37E+05 3.66E+05 2.65E+05
LM12-NMC SD 37 2.07E+05 1.47E+05 1.25E+05 8.79E+04 4.16E+04 2.28E+04 1.78E+04 1.40E+04 1.45E+04
LM12-NMC CoV 37 9.45 8.09 7.91 7.04 4.83 4.01 4.08 3.83 5.48
Table B-1 (Continued)
Mi S l T t 25H 15H 10H 5H 3H 1H 0 5H 0 3H 0 1H
Page 170
8/9/2019 Characterization of Warm Mix Asphalt (WMA) Performance in Differe
http://slidepdf.com/reader/full/characterization-of-warm-mix-asphalt-wma-performance-in-differe 170/247
Mix Sample Temperature 25Hz 15Hz 10Hz 5Hz 3Hz 1Hz 0.5Hz 0.3Hz 0.1Hz
LM13-NMC Mean 4 1.57E+07 1.54E+07 1.48E+07 1.35E+07 1.24E+07 1.04E+07 9.41E+06 9.08E+06 7.33E+06
LM13-NMC SD 4 1.60E+06 1.46E+06 1.50E+06 1.13E+06 1.56E+06 1.35E+06 1.09E+06 1.24E+06 9.05E+05
LM13-NMC CoV 4 10.16 9.50 10.16 8.33 12.53 13.04 11.56 13.62 12.36
LM13-NMC Mean 21 7.87E+06 7.06E+06 6.50E+06 5.58E+06 4.58E+06 3.44E+06 2.95E+06 2.57E+06 1.75E+06
LM13-NMC SD 21 5.19E+05 4.07E+05 3.56E+05 2.94E+05 2.98E+05 2.34E+05 1.79E+05 1.49E+05 7.96E+04
LM13-NMC CoV 21 6.59 5.76 5.48 5.28 6.50 6.81 6.08 5.80 4.55
LM13-NMC Mean 37 2.93E+06 2.43E+06 2.11E+06 1.69E+06 1.14E+06 7.95E+05 6.10E+05 5.21E+05 3.82E+05
LM13-NMC SD 37 2.71E+05 2.23E+05 1.81E+05 1.26E+05 1.01E+05 1.16E+05 7.41E+04 6.16E+04 6.42E+04
LM13-NMC CoV 37 9.22 9.17 8.55 7.50 8.87 14.58 12.13 11.82 16.82
LM15-NMC Mean 4 1.52E+07 1.41E+07 1.31E+07 1.25E+07 1.17E+07 9.79E+06 8.93E+06 8.48E+06 6.69E+06
LM15-NMC SD 4 2.57E+06 2.30E+06 1.00E+06 1.65E+06 1.75E+06 1.47E+06 1.11E+06 9.99E+05 6.36E+05LM15-NMC CoV 4 16.92 16.31 7.63 13.13 14.93 14.98 12.42 11.78 9.51
LM15-NMC Mean 21 6.31E+06 5.66E+06 5.13E+06 4.30E+06 3.40E+06 2.43E+06 2.07E+06 1.69E+06 1.09E+06
LM15-NMC SD 21 2.06E+05 2.41E+05 2.01E+05 2.14E+05 9.89E+04 1.36E+05 1.20E+05 1.20E+05 6.08E+04
LM15-NMC CoV 21 3.26 4.26 3.93 4.97 2.91 5.60 5.78 7.10 5.60
LM15-NMC Mean 37 1.86E+06 1.52E+06 1.32E+06 1.07E+06 7.21E+05 5.41E+05 4.48E+05 3.70E+05 2.63E+05
LM15-NMC SD 37 1.51E+05 1.20E+05 8.28E+04 7.68E+04 5.49E+04 6.20E+04 6.61E+04 1.29E+04 2.46E+04
LM15-NMC CoV 37 8.11 7.87 6.26 7.18 7.62 11.48 14.74 3.49 9.33
Table B-1 (Continued)
Mi S l T t 25H 15H 10H 5H 3H 1H 0 5H 0 3H 0 1H
Page 171
8/9/2019 Characterization of Warm Mix Asphalt (WMA) Performance in Differe
http://slidepdf.com/reader/full/characterization-of-warm-mix-asphalt-wma-performance-in-differe 171/247
Mix Sample Temperature 25Hz 15Hz 10Hz 5Hz 3Hz 1Hz 0.5Hz 0.3Hz 0.1Hz
LM17-NMC Mean 4 1.38E+07 1.25E+07 1.19E+07 1.07E+07 9.62E+06 7.78E+06 6.98E+06 6.57E+06 5.06E+06
LM17-NMC SD 4 1.25E+06 8.87E+05 9.44E+05 8.45E+05 1.00E+06 9.65E+05 8.20E+05 7.32E+05 6.31E+05
LM17-NMC CoV 4 9.02 7.11 7.95 7.90 10.43 12.40 11.75 11.15 12.48
LM17-NMC Mean 21 5.37E+06 4.77E+06 4.29E+06 3.50E+06 2.71E+06 1.94E+06 1.59E+06 1.33E+06 8.42E+05
LM17-NMC SD 21 2.43E+05 2.57E+05 2.04E+05 1.73E+05 1.79E+05 1.20E+05 1.50E+05 1.34E+05 8.34E+04
LM17-NMC CoV 21 4.52 5.39 4.74 4.94 6.59 6.20 9.47 10.12 9.90
LM17-NMC Mean 37 1.68E+06 1.37E+06 1.20E+06 9.79E+05 6.52E+05 4.60E+05 3.51E+05 3.37E+05 2.34E+05
LM17-NMC SD 37 1.86E+05 1.47E+05 1.16E+05 1.01E+05 9.05E+04 6.42E+04 2.41E+04 2.63E+04 2.03E+04
LM17-NMC CoV 37 11.04 10.73 9.72 10.35 13.88 13.95 6.88 7.79 8.67
LM20-NMC Mean 4 1.49E+07 1.38E+07 1.30E+07 1.19E+07 1.09E+07 9.05E+06 8.44E+06 7.70E+06 5.11E+06
LM20-NMC SD 4 1.76E+06 1.39E+06 1.24E+06 1.06E+06 1.23E+06 9.52E+05 8.98E+05 9.03E+05 9.54E+05
LM20-NMC CoV 4 11.86 10.05 9.56 8.87 11.24 10.51 10.64 11.73 18.68
LM20-NMC Mean 21 6.02E+06 5.29E+06 4.80E+06 4.01E+06 3.16E+06 2.32E+06 1.92E+06 1.64E+06 1.07E+06
LM20-NMC SD 21 5.64E+05 4.59E+05 3.67E+05 2.70E+05 1.70E+05 1.67E+05 1.29E+05 1.23E+05 1.24E+05
LM20-NMC CoV 21 9.36 8.68 7.64 6.72 5.38 7.18 6.75 7.49 11.61
LM20-NMC Mean 37 2.05E+06 1.70E+06 1.47E+06 1.20E+06 7.98E+05 5.76E+05 4.79E+05 4.09E+05 3.07E+05
LM20-NMC SD 37 1.72E+05 1.57E+05 1.46E+05 1.12E+05 9.34E+04 7.62E+04 9.60E+04 8.00E+04 3.22E+04
LM20-NMC CoV 37 8.42 9.24 9.89 9.31 11.70 13.24 20.03 19.58 10.48
Table B-1 (Continued)
Mix Sample Temperature 25Hz 15Hz 10Hz 5Hz 3Hz 1Hz 0 5Hz 0 3Hz 0 1Hz
Page 172
8/9/2019 Characterization of Warm Mix Asphalt (WMA) Performance in Differe
http://slidepdf.com/reader/full/characterization-of-warm-mix-asphalt-wma-performance-in-differe 172/247
Mix Sample Temperature 25Hz 15Hz 10Hz 5Hz 3Hz 1Hz 0.5Hz 0.3Hz 0.1Hz
LM14-NMC Mean 4 1.24E+07 1.41E+07 1.39E+07 1.31E+07 1.25E+07 1.08E+07 9.96E+06 9.42E+06 7.80E+06
LM14-NMC SD 4 4.23E+05 1.16E+06 1.04E+06 3.71E+05 3.59E+05 1.94E+05 2.50E+05 2.26E+05 6.20E+05
LM14-NMC CoV 4 3.42 8.24 7.47 2.82 2.86 1.80 2.51 2.40 7.96
LM14-NMC Mean 21 7.88E+06 7.15E+06 6.62E+06 5.77E+06 4.96E+06 3.79E+06 3.37E+06 3.02E+06 2.18E+06
LM14-NMC SD 21 6.66E+05 4.78E+05 4.06E+05 3.45E+05 3.28E+05 2.66E+05 2.24E+05 2.10E+05 1.70E+05
LM14-NMC CoV 21 8.45 6.68 6.14 5.98 6.61 7.01 6.63 6.97 7.78
LM14-NMC Mean 37 2.99E+06 2.57E+06 2.30E+06 1.89E+06 1.35E+06 9.62E+05 7.96E+05 6.61E+05 4.90E+05
LM14-NMC SD 37 1.61E+05 1.17E+05 1.30E+05 1.11E+05 6.90E+04 4.06E+04 3.42E+04 9.38E+03 5.92E+03
LM14-NMC CoV 37 5.40 4.55 5.64 5.90 5.13 4.22 4.29 1.42 1.21
LM16-NMC Mean 4 1.55E+07 1.45E+07 1.37E+07 1.29E+07 1.23E+07 1.03E+07 9.56E+06 8.98E+06 7.24E+06
LM16-NMC SD 4 8.32E+05 6.75E+05 4.56E+05 4.06E+05 6.68E+05 2.59E+05 1.38E+05 2.46E+05 2.75E+05
LM16-NMC CoV 4 5.36 4.66 3.32 3.14 5.45 2.52 1.44 2.74 3.80
LM16-NMC Mean 21 6.64E+06 5.94E+06 5.45E+06 4.67E+06 3.78E+06 2.83E+06 2.43E+06 2.12E+06 1.42E+06
LM16-NMC SD 21 4.07E+05 2.98E+05 2.47E+05 1.92E+05 1.78E+05 7.82E+04 5.66E+04 3.51E+04 3.23E+04
LM16-NMC CoV 21 6.13 5.01 4.53 4.11 4.72 2.76 2.33 1.66 2.27
LM16-NMC Mean 37 2.43E+06 2.03E+06 1.77E+06 1.42E+06 9.47E+05 7.27E+05 5.93E+05 4.86E+05 3.25E+05
LM16-NMC SD 37 2.58E+05 2.04E+05 1.88E+05 1.40E+05 1.03E+05 9.23E+04 8.42E+04 3.54E+04 3.34E+04
LM16-NMC CoV 37 10.62 10.04 10.58 9.87 10.83 12.69 14.20 7.29 10.30
Table B-1 (Continued)
Page 173
8/9/2019 Characterization of Warm Mix Asphalt (WMA) Performance in Differe
http://slidepdf.com/reader/full/characterization-of-warm-mix-asphalt-wma-performance-in-differe 173/247
Mix Sample Temperature 25Hz 15Hz 10Hz 5Hz 3Hz 1Hz 0.5Hz 0.3Hz 0.1Hz
LM19-NMC Mean 4 1.65E+07 1.53E+07 1.46E+07 1.33E+07 1.18E+07 1.01E+07 9.04E+06 8.43E+06 6.76E+06
LM19-NMC SD 4 1.28E+06 8.69E+05 7.21E+05 7.00E+05 8.10E+05 5.43E+05 4.28E+05 4.11E+05 4.62E+05
LM19-NMC CoV 4 7.78 5.69 4.95 5.25 6.85 5.39 4.74 4.87 6.83
LM19-NMC Mean 21 6.00E+06 5.36E+06 4.94E+06 4.16E+06 3.36E+06 2.51E+06 2.16E+06 1.88E+06 1.27E+06
LM19-NMC SD 21 8.43E+05 7.70E+05 7.15E+05 6.15E+05 5.41E+05 3.95E+05 3.52E+05 3.34E+05 2.30E+05
LM19-NMC CoV 21 14.04 14.38 14.47 14.79 16.10 15.69 16.30 17.75 18.10
LM19-NMC Mean 37 2.04E+06 1.71E+06 1.49E+06 1.20E+06 8.09E+05 5.98E+05 4.73E+05 3.97E+05 2.81E+05
LM19-NMC SD 37 2.01E+05 1.39E+05 1.31E+05 9.50E+04 3.83E+04 5.93E+04 6.44E+04 5.21E+04 4.98E+04
LM19-NMC CoV 37 9.81 8.15 8.80 7.92 4.74 9.91 13.63 13.11 17.72
LM21-NMC Mean 4 1.72E+07 1.61E+07 1.52E+07 1.42E+07 1.30E+07 1.12E+07 1.02E+07 9.82E+06 8.07E+06
LM21-NMC SD 4 1.11E+06 7.96E+05 7.64E+05 5.06E+05 6.29E+05 6.70E+05 7.18E+05 6.91E+05 6.38E+05
LM21-NMC CoV 4 6.41 4.95 5.02 3.56 4.82 5.99 7.05 7.04 7.91
LM21-NMC Mean 21 6.50E+06 5.79E+06 5.30E+06 4.55E+06 3.73E+06 2.82E+06 2.45E+06 2.17E+06 1.44E+06
LM21-NMC SD 21 5.92E+05 4.64E+05 3.92E+05 3.19E+05 3.03E+05 2.07E+05 1.64E+05 1.30E+05 8.80E+04
LM21-NMC CoV 21 9.11 8.02 7.39 7.02 8.10 7.32 6.71 6.00 6.10
LM21-NMC Mean 37 2.49E+06 2.09E+06 1.87E+06 1.51E+06 1.07E+06 8.15E+05 6.49E+05 5.50E+05 3.79E+05
LM21-NMC SD 37 3.05E+05 2.72E+05 2.50E+05 1.81E+05 1.37E+05 9.71E+04 1.04E+05 7.38E+04 7.62E+04
LM21-NMC CoV 37 12.27 13.01 13.37 11.99 12.83 11.91 16.04 13.41 20.12
Table B-2 Phase angle for non-moisture conditioned mixes (degrees)
Page 174
8/9/2019 Characterization of Warm Mix Asphalt (WMA) Performance in Differe
http://slidepdf.com/reader/full/characterization-of-warm-mix-asphalt-wma-performance-in-differe 174/247
Mix Sample Temperature 25Hz 15Hz 10Hz 5Hz 3Hz 1Hz 0.5Hz 0.3Hz 0.1Hz
LM1-NMC Mean 4 5.90 8.05 8.98 10.38 10.89 12.09 12.79 13.89 17.86
LM1-NMC SD 4 0.62 0.59 0.42 0.53 0.55 1.65 1.09 5.15 3.99
LM1-NMC CoV 4 10.43 7.32 4.72 5.09 5.08 13.65 8.54 37.04 22.33
LM1-NMC Mean 21 15.27 17.32 18.21 20.76 24.18 24.84 27.78 31.18 34.92
LM1-NMC SD 21 0.82 0.54 0.74 0.63 1.60 3.10 0.93 2.47 5.50
LM1-NMC CoV 21 5.36 3.14 4.06 3.05 6.63 12.46 3.35 7.93 15.74
LM1-NMC Mean 37 23.57 24.62 25.28 26.94 30.81 31.80 35.97 37.38 39.15
LM1-NMC SD 37 0.65 0.71 0.51 0.55 1.19 1.47 2.34 1.12 0.53
LM1-NMC CoV 37 2.75 2.88 2.03 2.04 3.87 4.62 6.51 2.99 1.34
LM4-NMC Mean 4 6.11 9.47 10.55 11.92 13.43 16.23 17.17 18.90 27.72
LM4-NMC SD 4 2.56 0.79 0.35 0.31 0.33 0.31 0.47 1.14 3.12
LM4-NMC CoV 4 41.91 8.37 3.31 2.61 2.49 1.92 2.75 6.05 11.27
LM4-NMC Mean 21 19.21 20.90 22.68 25.53 29.91 31.75 36.40 37.58 37.20
LM4-NMC SD 21 0.93 0.95 0.96 0.98 0.68 1.10 3.40 1.78 2.13
LM4-NMC CoV 21 4.84 4.54 4.23 3.85 2.26 3.47 9.33 4.75 5.72
LM4-NMC Mean 37 28.90 28.79 28.77 28.38 32.23 28.29 33.96 37.59 39.35
LM4-NMC SD 37 0.52 0.30 0.34 0.89 1.11 3.57 2.15 2.50 2.16
LM4-NMC CoV 37 1.80 1.04 1.17 3.13 3.45 12.63 6.34 6.64 5.50
Table B-2 (Continued)
Page 175
8/9/2019 Characterization of Warm Mix Asphalt (WMA) Performance in Differe
http://slidepdf.com/reader/full/characterization-of-warm-mix-asphalt-wma-performance-in-differe 175/247
Mix Sample Temperature 25Hz 15Hz 10Hz 5Hz 3Hz 1Hz 0.5Hz 0.3Hz 0.1Hz
LM7-NMC Mean 4 8.27 9.95 11.04 13.09 14.66 15.08 15.54 23.96 28.90
LM7-NMC SD 4 0.48 0.54 0.31 0.27 0.25 1.42 1.17 2.59 3.97
LM7-NMC CoV 4 5.81 5.42 2.84 2.03 1.70 9.41 7.54 10.79 13.75
LM7-NMC Mean 21 21.82 23.48 25.12 28.09 30.67 32.72 34.54 38.43 36.92
LM7-NMC SD 21 0.75 0.20 0.10 0.11 1.75 2.92 3.63 1.06 3.76
LM7-NMC CoV 21 3.43 0.85 0.42 0.39 5.70 8.94 10.51 2.76 10.18
LM7-NMC Mean 37 28.88 28.87 29.01 27.68 31.30 29.60 32.85 36.43 36.44
LM7-NMC SD 37 0.91 0.44 0.57 0.66 1.45 2.51 1.37 1.91 1.03
LM7-NMC CoV 37 3.15 1.53 1.97 2.40 4.64 8.48 4.17 5.24 2.82
LM10-NMC Mean 4 8.17 9.83 10.74 12.47 13.49 16.01 16.70 19.07 26.87
LM10-NMC SD 4 0.51 0.43 0.42 0.51 0.44 0.65 0.64 3.95 3.35
LM10-NMC CoV 4 6.28 4.42 3.95 4.08 3.26 4.06 3.83 20.68 12.47
LM10-NMC Mean 21 19.21 21.01 22.77 25.58 29.41 32.09 34.52 37.23 37.25
LM10-NMC SD 21 0.56 0.57 0.69 0.67 1.48 1.27 0.78 1.48 1.24
LM10-NMC CoV 21 2.94 2.71 3.02 2.64 5.04 3.97 2.26 3.99 3.33
LM10-NMC Mean 37 27.73 28.60 28.72 28.95 32.41 32.13 34.83 36.51 37.65
LM10-NMC SD 37 0.96 0.96 0.87 0.68 1.05 2.57 1.66 2.00 2.62
LM10-NMC CoV 37 3.48 3.36 3.03 2.36 3.25 8.01 4.77 5.48 6.97
Table B-2 (Continued)
Page 176
8/9/2019 Characterization of Warm Mix Asphalt (WMA) Performance in Differe
http://slidepdf.com/reader/full/characterization-of-warm-mix-asphalt-wma-performance-in-differe 176/247
Mix Sample Temperature 25Hz 15Hz 10Hz 5Hz 3Hz 1Hz 0.5Hz 0.3Hz 0.1Hz
LM3-NMC Mean 4 4.20 6.22 7.00 8.33 9.07 10.54 11.13 11.85 15.37
LM3-NMC SD 4 1.34 0.47 0.49 0.15 0.64 1.34 1.38 1.25 3.86
LM3-NMC CoV 4 31.88 7.59 6.99 1.75 7.02 12.70 12.44 10.51 25.11
LM3-NMC Mean 21 12.81 14.47 15.69 17.92 19.70 22.47 24.20 26.04 29.94
LM3-NMC SD 21 0.41 0.56 0.69 0.78 0.94 0.83 1.02 1.34 1.23
LM3-NMC CoV 21 3.22 3.84 4.42 4.33 4.79 3.67 4.22 5.15 4.10
LM3-NMC Mean 37 21.06 22.48 23.42 25.27 28.46 30.34 33.82 36.42 37.29
LM3-NMC SD 37 0.49 0.47 0.32 0.29 1.07 1.71 2.77 0.82 1.10
LM3-NMC CoV 37 2.33 2.11 1.35 1.15 3.76 5.62 8.19 2.25 2.95
LM6-NMC Mean 4 5.33 7.39 8.13 9.43 10.05 12.25 12.61 13.65 18.11
LM6-NMC SD 4 0.96 0.31 0.22 0.42 0.29 0.92 0.58 1.39 2.86
LM6-NMC CoV 4 18.01 4.24 2.67 4.42 2.91 7.52 4.61 10.20 15.81
LM6-NMC Mean 21 16.34 18.07 19.47 22.06 24.23 27.59 30.04 33.24 36.49
LM6-NMC SD 21 0.90 1.06 0.97 1.01 1.20 0.79 1.18 1.73 1.10
LM6-NMC CoV 21 5.51 5.88 5.00 4.56 4.97 2.88 3.94 5.19 3.01
LM6-NMC Mean 37 25.83 27.51 28.11 29.39 33.36 35.03 36.02 37.69 37.11
LM6-NMC SD 37 0.72 1.06 0.54 0.60 1.50 1.38 1.76 2.52 4.05
LM6-NMC CoV 37 2.77 3.84 1.92 2.03 4.49 3.93 4.89 6.68 10.91
Table B-2 (Continued)
Page 177
8/9/2019 Characterization of Warm Mix Asphalt (WMA) Performance in Differe
http://slidepdf.com/reader/full/characterization-of-warm-mix-asphalt-wma-performance-in-differe 177/247
Mix Sample Temperature 25Hz 15Hz 10Hz 5Hz 3Hz 1Hz 0.5Hz 0.3Hz 0.1Hz
LM9-NMC Mean 4 6.68 8.03 9.22 10.83 11.63 12.29 13.11 18.33 21.36
LM9-NMC SD 4 0.92 0.29 0.09 0.29 0.46 0.72 0.63 1.99 1.14
LM9-NMC CoV 4 13.76 3.60 0.93 2.68 3.99 5.87 4.80 10.85 5.34
LM9-NMC Mean 21 17.91 19.64 21.10 23.64 25.58 29.83 32.09 35.17 38.02
LM9-NMC SD 21 0.43 0.30 0.31 0.28 0.51 0.70 0.54 1.17 0.91
LM9-NMC CoV 21 2.40 1.52 1.48 1.20 1.98 2.35 1.69 3.32 2.40
LM9-NMC Mean 37 26.29 27.52 28.21 28.92 31.75 33.83 34.71 36.06 34.47
LM9-NMC SD 37 1.09 0.26 0.79 0.33 1.56 1.73 1.46 4.21 5.37
LM9-NMC CoV 37 4.16 0.96 2.81 1.15 4.91 5.11 4.20 11.67 15.59
LM12-NMC Mean 4 7.28 8.75 9.95 11.63 12.39 14.31 16.15 17.64 24.22
LM12-NMC SD 4 0.18 0.38 0.33 0.74 0.67 0.34 0.95 1.05 1.04
LM12-NMC CoV 4 2.54 4.35 3.33 6.32 5.45 2.40 5.90 5.93 4.31
LM12-NMC Mean 21 17.87 19.71 21.16 23.95 26.33 30.71 32.71 38.76 39.60
LM12-NMC SD 21 1.42 0.93 1.18 1.06 1.76 0.63 0.89 2.18 1.41
LM12-NMC CoV 21 7.97 4.73 5.56 4.43 6.70 2.04 2.72 5.62 3.56
LM12-NMC Mean 37 27.42 27.87 28.45 29.28 32.40 34.12 35.25 34.48 31.28
LM12-NMC SD 37 0.47 0.29 0.14 0.23 0.51 1.75 0.57 1.04 1.37
LM12-NMC CoV 37 1.72 1.05 0.51 0.78 1.57 5.13 1.61 3.02 4.39
Table B-2 (Continued)
Page 178
8/9/2019 Characterization of Warm Mix Asphalt (WMA) Performance in Differe
http://slidepdf.com/reader/full/characterization-of-warm-mix-asphalt-wma-performance-in-differe 178/247
Mix Sample Temperature 25Hz 15Hz 10Hz 5Hz 3Hz 1Hz 0.5Hz 0.3Hz 0.1Hz
LM13-NMC Mean 4 6.62 8.50 9.92 11.56 13.22 13.68 15.14 17.46 22.22
LM13-NMC SD 4 1.38 0.67 0.25 0.25 0.68 1.16 0.91 1.21 4.56
LM13-NMC CoV 4 20.84 7.91 2.48 2.20 5.11 8.47 6.01 6.93 20.51
LM13-NMC Mean 21 16.53 18.43 19.60 22.37 25.99 27.48 32.84 33.77 35.88
LM13-NMC SD 21 0.72 0.55 0.39 0.45 1.28 1.09 3.10 2.00 0.49
LM13-NMC CoV 21 4.36 2.96 1.98 2.00 4.92 3.98 9.44 5.93 1.38
LM13-NMC Mean 37 25.23 26.67 27.16 27.96 33.15 35.05 35.19 37.03 34.73
LM13-NMC SD 37 0.46 0.27 0.38 0.79 3.06 1.25 1.09 2.67 3.68
LM13-NMC CoV 37 1.83 1.03 1.38 2.82 9.22 3.57 3.10 7.21 10.58
LM15-NMC Mean 4 7.14 8.29 9.11 11.42 12.89 14.37 15.86 17.52 23.28
LM15-NMC SD 4 1.41 0.99 1.42 0.59 0.63 1.06 1.35 1.41 1.95
LM15-NMC CoV 4 19.83 11.90 15.60 5.12 4.89 7.39 8.49 8.03 8.39
LM15-NMC Mean 21 18.34 21.21 22.27 25.15 29.43 31.90 34.20 38.66 38.45
LM15-NMC SD 21 0.52 0.72 0.84 0.83 1.37 0.56 0.62 1.15 1.51
LM15-NMC CoV 21 2.81 3.40 3.79 3.31 4.65 1.75 1.83 2.98 3.92
LM15-NMC Mean 37 27.96 27.83 27.70 27.57 33.56 32.27 35.41 37.58 39.11
LM15-NMC SD 37 0.86 0.51 0.39 0.38 3.05 1.77 2.56 2.36 4.56
LM15-NMC CoV 37 3.09 1.82 1.41 1.37 9.09 5.49 7.23 6.28 11.67
Table B-2 (Continued)
Page 179
8/9/2019 Characterization of Warm Mix Asphalt (WMA) Performance in Differe
http://slidepdf.com/reader/full/characterization-of-warm-mix-asphalt-wma-performance-in-differe 179/247
Mix Sample Temperature 25Hz 15Hz 10Hz 5Hz 3Hz 1Hz 0.5Hz 0.3Hz 0.1Hz
LM17-NMC Mean 4 8.58 9.99 11.63 13.75 15.31 16.39 18.54 20.95 29.16
LM17-NMC SD 4 0.84 1.76 1.16 1.23 1.68 0.91 1.26 1.54 3.60
LM17-NMC CoV 4 9.84 17.62 9.95 8.98 11.00 5.53 6.82 7.34 12.36
LM17-NMC Mean 21 20.34 22.47 23.97 26.64 30.17 33.05 36.22 38.31 39.71
LM17-NMC SD 21 1.32 0.89 0.69 0.88 2.01 2.04 0.86 0.40 1.50
LM17-NMC CoV 21 6.47 3.95 2.87 3.31 6.67 6.16 2.38 1.04 3.79
LM17-NMC Mean 37 28.55 28.09 27.31 27.18 31.24 31.00 34.73 38.02 37.26
LM17-NMC SD 37 0.99 0.39 0.31 0.30 1.07 1.19 0.70 2.81 3.17
LM17-NMC CoV 37 3.47 1.39 1.13 1.11 3.42 3.84 2.03 7.40 8.52
LM20-NMC Mean 4 7.79 9.55 10.54 12.47 14.00 15.14 16.62 19.28 26.34
LM20-NMC SD 4 2.12 0.66 0.21 0.33 0.63 1.08 0.29 1.00 4.85
LM20-NMC CoV 4 27.18 6.92 1.97 2.68 4.47 7.14 1.72 5.20 18.43
LM20-NMC Mean 21 19.61 21.11 22.55 25.30 29.09 32.13 35.50 39.38 39.12
LM20-NMC SD 21 0.63 0.44 0.66 0.53 1.87 0.79 2.63 1.09 1.90
LM20-NMC CoV 21 3.22 2.10 2.93 2.09 6.44 2.45 7.42 2.77 4.86
LM20-NMC Mean 37 28.30 27.72 28.15 28.32 33.56 32.53 36.82 40.83 40.82
LM20-NMC SD 37 1.06 0.56 0.86 0.96 2.72 2.27 3.22 2.86 2.21
LM20-NMC CoV 37 3.75 2.01 3.04 3.41 8.11 6.99 8.75 7.00 5.42
Page 180
8/9/2019 Characterization of Warm Mix Asphalt (WMA) Performance in Differe
http://slidepdf.com/reader/full/characterization-of-warm-mix-asphalt-wma-performance-in-differe 180/247
Table B-2 (Continued)
Page 181
8/9/2019 Characterization of Warm Mix Asphalt (WMA) Performance in Differe
http://slidepdf.com/reader/full/characterization-of-warm-mix-asphalt-wma-performance-in-differe 181/247
Mix Sample Temperature 25Hz 15Hz 10Hz 5Hz 3Hz 1Hz 0.5Hz 0.3Hz 0.1Hz
LM19-NMC Mean 4 6.88 8.60 9.86 11.51 12.65 13.28 14.32 19.70 22.53
LM19-NMC SD 4 0.37 0.23 0.40 0.62 0.59 0.91 1.58 1.91 0.87
LM19-NMC CoV 4 5.45 2.70 4.10 5.36 4.70 6.83 11.03 9.71 3.86
LM19-NMC Mean 21 19.01 20.75 21.82 24.64 27.30 30.46 33.49 36.59 39.12
LM19-NMC SD 21 1.88 1.46 1.53 1.43 2.12 1.53 1.54 0.66 1.30
LM19-NMC CoV 21 9.89 7.02 7.00 5.79 7.78 5.03 4.61 1.80 3.31
LM19-NMC Mean 37 26.90 27.79 27.67 28.21 33.52 33.68 36.72 41.78 41.23
LM19-NMC SD 37 0.96 0.54 0.60 0.33 3.32 1.25 2.43 1.00 1.41
LM19-NMC CoV 37 3.59 1.94 2.17 1.16 9.91 3.70 6.61 2.40 3.43
LM21-NMC Mean 4 5.82 8.18 9.49 10.97 12.11 11.78 13.45 16.48 19.18
LM21-NMC SD 4 0.89 0.74 0.47 0.71 1.18 1.46 1.60 1.54 0.63
LM21-NMC CoV 4 15.24 9.06 4.91 6.50 9.76 12.37 11.88 9.36 3.29
LM21-NMC Mean 21 17.15 19.23 20.47 22.97 26.35 27.95 32.42 35.30 37.43
LM21-NMC SD 21 2.08 0.88 0.81 0.89 0.86 0.27 2.78 1.16 1.92
LM21-NMC CoV 21 12.14 4.58 3.96 3.88 3.26 0.97 8.58 3.29 5.12
LM21-NMC Mean 37 26.14 26.78 26.99 27.84 32.78 31.99 36.51 40.98 40.43
LM21-NMC SD 37 0.93 0.90 0.89 0.66 0.66 1.50 1.59 2.39 1.31
LM21-NMC CoV 37 3.56 3.35 3.29 2.37 2.02 4.70 4.35 5.82 3.23
168
Page 182
8/9/2019 Characterization of Warm Mix Asphalt (WMA) Performance in Differe
http://slidepdf.com/reader/full/characterization-of-warm-mix-asphalt-wma-performance-in-differe 182/247
APPENDIX C DYNAMIC MODULUS MASTER CURVES
In this section, master curves of the dynamic modulus test results are charted for each
of the sixteen mixtures investigated in this work in Figures C1 to C16. All the data was
shifted to a shift temperature of 21°C using a sigmoidal function.
Page 183
8/9/2019 Characterization of Warm Mix Asphalt (WMA) Performance in Differe
http://slidepdf.com/reader/full/characterization-of-warm-mix-asphalt-wma-performance-in-differe 183/247
1.E+04
1.E+05
1.E+06
1.E+07
1.E+08
1.E-05 1.E-03 1.E-01 1.E+01 1.E+03 1.E+05 1.E+07
E * ( P a )
Frequency (Hz)
LM 1
LM1-NMC
Figure C1 Master curve for control limestone mix with 0% RAP
LM 4
Page 184
8/9/2019 Characterization of Warm Mix Asphalt (WMA) Performance in Differe
http://slidepdf.com/reader/full/characterization-of-warm-mix-asphalt-wma-performance-in-differe 184/247
1.E+04
1.E+05
1.E+06
1.E+07
1.E+08
1.E-05 1.E-03 1.E-01 1.E+01 1.E+03 1.E+05 1.E+07
E * ( P a )
Frequency (Hz)
LM4-NMC
Figure C2 Master curve for Advera limestone mix with 0% RAP
1.E+08
LM 7
Page 185
8/9/2019 Characterization of Warm Mix Asphalt (WMA) Performance in Differe
http://slidepdf.com/reader/full/characterization-of-warm-mix-asphalt-wma-performance-in-differe 185/247
1.E+04
1.E+05
1.E+06
1.E+07
1.E-05 1.E-03 1.E-01 1.E+01 1.E+03 1.E+05 1.E+07
E * ( P a )
Frequency (Hz)
LM7-NMC
Figure C3 Master curve for Evotherm limestone mix with 0% RAP
1.E+08
LM 10
Page 186
8/9/2019 Characterization of Warm Mix Asphalt (WMA) Performance in Differe
http://slidepdf.com/reader/full/characterization-of-warm-mix-asphalt-wma-performance-in-differe 186/247
1.E+04
1.E+05
1.E+06
1.E+07
1.E-05 1.E-03 1.E-01 1.E+01 1.E+03 1.E+05 1.E+07
E * ( P a )
Frequency (Hz)
LM10-NMC
Figure C4 Master curve for Sasobit limestone mix with 0% RAP
1.E+08
LM 3
Page 187
8/9/2019 Characterization of Warm Mix Asphalt (WMA) Performance in Differe
http://slidepdf.com/reader/full/characterization-of-warm-mix-asphalt-wma-performance-in-differe 187/247
Figure C5 Master curve for control limestone mix with 30 % RAP
1.E+04
1.E+05
1.E+06
1.E+07
1.E-05 1.E-03 1.E-01 1.E+01 1.E+03 1.E+05 1.E+07
E * ( P a )
Frequency (Hz)
LM3-NMC
1.E+08
LM 6
Page 188
8/9/2019 Characterization of Warm Mix Asphalt (WMA) Performance in Differe
http://slidepdf.com/reader/full/characterization-of-warm-mix-asphalt-wma-performance-in-differe 188/247
Figure C6 Master curve for Advera limestone mix with 30 % RAP
1.E+04
1.E+05
1.E+06
1.E+07
1.E-05 1.E-03 1.E-01 1.E+01 1.E+03 1.E+05 1.E+07
E * ( P a )
Frequency (Hz)
LM6-NMC
1.E+08
LM 9
Page 189
8/9/2019 Characterization of Warm Mix Asphalt (WMA) Performance in Differe
http://slidepdf.com/reader/full/characterization-of-warm-mix-asphalt-wma-performance-in-differe 189/247
1.E+04
1.E+05
1.E+06
1.E+07
1.E-05 1.E-03 1.E-01 1.E+01 1.E+03 1.E+05 1.E+07
E * ( P a )
Frequency (Hz)
LM9-NMC
Figure C7 Master curve for Evotherm limestone mix with 30% RAP
1.E+08
LM 12
Page 190
8/9/2019 Characterization of Warm Mix Asphalt (WMA) Performance in Differe
http://slidepdf.com/reader/full/characterization-of-warm-mix-asphalt-wma-performance-in-differe 190/247
1.E+04
1.E+05
1.E+06
1.E+07
1.E-05 1.E-03 1.E-01 1.E+01 1.E+03 1.E+05 1.E+07
E * ( P a )
Frequency (Hz)
LM12-NMC
Figure C8 Master curve for Sasobit limestone mix with 30% RAP
1.E+08
LM 13
Page 191
8/9/2019 Characterization of Warm Mix Asphalt (WMA) Performance in Differe
http://slidepdf.com/reader/full/characterization-of-warm-mix-asphalt-wma-performance-in-differe 191/247
1.E+04
1.E+05
1.E+06
1.E+07
1.E-05 1.E-03 1.E-01 1.E+01 1.E+03 1.E+05 1.E+07
E * ( P a )
Frequency (Hz)
LM13-NMC
Figure C9 Master curve for control quartzite mix with 0% RAP
LM 15
Page 192
8/9/2019 Characterization of Warm Mix Asphalt (WMA) Performance in Differe
http://slidepdf.com/reader/full/characterization-of-warm-mix-asphalt-wma-performance-in-differe 192/247
1.E+04
1.E+05
1.E+06
1.E+07
1.E+08
1.E-05 1.E-03 1.E-01 1.E+01 1.E+03 1.E+05 1.E+07
E * ( P a )
Frequency (Hz)
LM15-NMC
Figure C10 Master curve for Advera quartzite mix with 0% RAP
LM 17
Page 193
8/9/2019 Characterization of Warm Mix Asphalt (WMA) Performance in Differe
http://slidepdf.com/reader/full/characterization-of-warm-mix-asphalt-wma-performance-in-differe 193/247
1.E+04
1.E+05
1.E+06
1.E+07
1.E+08
1.E-05 1.E-03 1.E-01 1.E+01 1.E+03 1.E+05 1.E+07
E * ( P a )
Frequency (Hz)
LM 17
LM17-NMC
Figure C11 Master curve for Evotherm quartzite mix with 0% RAP
1.E+08
LM 20
Page 194
8/9/2019 Characterization of Warm Mix Asphalt (WMA) Performance in Differe
http://slidepdf.com/reader/full/characterization-of-warm-mix-asphalt-wma-performance-in-differe 194/247
1.E+04
1.E+05
1.E+06
1.E+07
1.E-05 1.E-03 1.E-01 1.E+01 1.E+03 1.E+05 1.E+07
E * ( P a )
Frequency (Hz)
LM20-NMC
Figure C 12Master curve for Sasobit quartzite mix with 0% RAP
LM 14
Page 195
8/9/2019 Characterization of Warm Mix Asphalt (WMA) Performance in Differe
http://slidepdf.com/reader/full/characterization-of-warm-mix-asphalt-wma-performance-in-differe 195/247
1.E+04
1.E+05
1.E+06
1.E+07
1.E+08
1.E-05 1.E-03 1.E-01 1.E+01 1.E+03 1.E+05 1.E+07
E * ( P a )
Frequency (Hz)
LM14-NMC
Figure C 13 Master curve for control quartzite mix with 30 % RAP
LM 16
Page 196
8/9/2019 Characterization of Warm Mix Asphalt (WMA) Performance in Differe
http://slidepdf.com/reader/full/characterization-of-warm-mix-asphalt-wma-performance-in-differe 196/247
1.E+04
1.E+05
1.E+06
1.E+07
1.E+08
1.E-05 1.E-03 1.E-01 1.E+01 1.E+03 1.E+05 1.E+07
E * ( P a )
Frequency (Hz)
LM16-NMC
Figure C 14Master curve for Advera quartzite mix with 30% RAP
1.E+08
LM 19
Page 197
8/9/2019 Characterization of Warm Mix Asphalt (WMA) Performance in Differe
http://slidepdf.com/reader/full/characterization-of-warm-mix-asphalt-wma-performance-in-differe 197/247
1.E+04
1.E+05
1.E+06
1.E+07
1.E-05 1.E-03 1.E-01 1.E+01 1.E+03 1.E+05 1.E+07
E * ( P a )
Frequency (Hz)
LM19-NMC
Figure C 15Master curve for Evotherm quartzite mix with 30% RAP
1.E+08
LM 21
Page 198
8/9/2019 Characterization of Warm Mix Asphalt (WMA) Performance in Differe
http://slidepdf.com/reader/full/characterization-of-warm-mix-asphalt-wma-performance-in-differe 198/247
1.E+04
1.E+05
1.E+06
1.E+07
1.E-05 1.E-03 1.E-01 1.E+01 1.E+03 1.E+05 1.E+07
E * ( P a )
Frequency (Hz)
LM21-NMC
Figure C 16 Master curve for Sasobit quartzite mix with 30 % RAP
185
APPENDIX D FREQUENCY SWEEPS OF WMA BINDERS
Page 199
8/9/2019 Characterization of Warm Mix Asphalt (WMA) Performance in Differe
http://slidepdf.com/reader/full/characterization-of-warm-mix-asphalt-wma-performance-in-differe 199/247
The results of the frequency sweeps conducted on control, Evotherm and Sasobit
binders, both unmodified and polymer modified are presented in Tables D-1 to D-6. Tables
D-1 and D-2 lists the frequency sweeps data of the control binders, the unmodified and
modified binders, respectively. Likewise, tables D-3 and D-4 presents the sweep data for the
binders incorporating Evotherm. Moreover, tables D-5 and D-6 tabulates the data of binders
incorporating Sasobit.
Table D-1 Frequency sweeps data output for PAV-aged control unmodified binder
Frequency temperature Log(Freq) Freq*aT G' G'' Tan δ δ G*
Hz °C Pa Pa deg Pa
Page 200
8/9/2019 Characterization of Warm Mix Asphalt (WMA) Performance in Differe
http://slidepdf.com/reader/full/characterization-of-warm-mix-asphalt-wma-performance-in-differe 200/247
g
0.1 13 -1.00E+00 1.52E+03 8.05E+06 7.01E+06 8.71E-01 41.1 1.07E+07
0.158 13 -8.01E-01 2.40E+03 1.02E+07 8.48E+06 8.30E-01 39.7 1.33E+07
0.251 13 -6.00E-01 3.81E+03 1.26E+07 1.00E+07 7.95E-01 38.5 1.61E+07
0.398 13.1 -4.00E-01 6.04E+03 1.55E+07 1.18E+07 7.62E-01 37.3 1.95E+07
0.631 13.1 -2.00E-01 9.58E+03 1.90E+07 1.39E+07 7.31E-01 36.2 2.35E+07
1 13 0.00E+00 1.52E+04 2.32E+07 1.62E+07 7.01E-01 35.1 2.83E+07
1.585 13 2.00E-01 2.41E+04 2.80E+07 1.89E+07 6.74E-01 34.0 3.38E+07
2.512 13 4.00E-01 3.81E+04 3.35E+07 2.17E+07 6.48E-01 33.0 4.00E+07
3.981 13 6.00E-01 6.04E+04 4.01E+07 2.50E+07 6.23E-01 31.9 4.72E+07
6.31 13 8.00E-01 9.58E+04 4.75E+07 2.85E+07 5.99E-01 31.0 5.54E+07
10 13 1.00E+00 1.52E+05 5.60E+07 3.22E+07 5.75E-01 29.9 6.46E+07
15.849 13 1.20E+00 2.41E+05 6.57E+07 3.64E+07 5.54E-01 29.0 7.51E+07
25.121 13 1.40E+00 3.81E+05 7.68E+07 4.07E+07 5.31E-01 28.0 8.69E+07
39.809 13 1.60E+00 6.04E+05 8.94E+07 4.53E+07 5.07E-01 26.9 1.00E+08
50 13 1.70E+00 7.59E+05 9.57E+07 4.75E+07 4.96E-01 26.4 1.07E+08
Table D-1 (Continued)
Frequency temperature Log(Freq) Freq*aT G' G'' Tan δ δ G*
Hz °C Pa Pa deg Pa
Page 201
8/9/2019 Characterization of Warm Mix Asphalt (WMA) Performance in Differe
http://slidepdf.com/reader/full/characterization-of-warm-mix-asphalt-wma-performance-in-differe 201/247
0.1 21 -1.00E+00 1.57E+02 2.01E+06 2.30E+06 1.14E+00 48.9 3.05E+06
0.158 21 -8.01E-01 2.49E+02 2.61E+06 2.86E+06 1.09E+00 47.6 3.88E+06
0.251 21 -6.00E-01 3.95E+02 3.42E+06 3.57E+06 1.05E+00 46.3 4.95E+06
0.398 21 -4.00E-01 6.26E+02 4.42E+06 4.42E+06 1.00E+00 45.0 6.26E+06
0.631 21 -2.00E-01 9.93E+02 5.66E+06 5.43E+06 9.59E-01 43.8 7.84E+06
1 21 0.00E+00 1.57E+03 7.18E+06 6.61E+06 9.19E-01 42.6 9.76E+06
1.585 21 2.00E-01 2.49E+03 9.06E+06 8.00E+06 8.83E-01 41.5 1.21E+07
2.512 21 4.00E-01 3.95E+03 1.13E+07 9.62E+06 8.48E-01 40.3 1.49E+07
3.981 21 6.00E-01 6.26E+03 1.41E+07 1.15E+07 8.14E-01 39.2 1.82E+07
6.31 21 8.00E-01 9.93E+03 1.75E+07 1.37E+07 7.82E-01 38.1 2.22E+07
10 21 1.00E+00 1.57E+04 2.14E+07 1.61E+07 7.53E-01 37.0 2.68E+07
15.849 21 1.20E+00 2.49E+04 2.62E+07 1.89E+07 7.22E-01 35.9 3.23E+07
25.121 21 1.40E+00 3.95E+04 3.18E+07 2.20E+07 6.94E-01 34.8 3.87E+07
39.809 21 1.60E+00 6.26E+04 3.85E+07 2.56E+07 6.65E-01 33.6 4.62E+07
50 21 1.70E+00 7.87E+04 4.21E+07 2.74E+07 6.51E-01 33.1 5.02E+07
Table D-1 (Continued)
Frequency temperature Log(Freq) Freq*aT G' G'' Tan δ δ G*
Hz °C Pa Pa deg Pa
Page 202
8/9/2019 Characterization of Warm Mix Asphalt (WMA) Performance in Differe
http://slidepdf.com/reader/full/characterization-of-warm-mix-asphalt-wma-performance-in-differe 202/247
0.1 29 -1.00E+00 1.53E+01 4.01E+05 6.24E+05 1.56E+00 56.1 7.42E+05
0.158 29 -8.01E-01 2.42E+01 5.51E+05 8.18E+05 1.48E+00 54.9 9.86E+05
0.251 29 -6.00E-01 3.84E+01 7.49E+05 1.06E+06 1.42E+00 53.7 1.30E+06
0.398 29 -4.00E-01 6.08E+01 1.01E+06 1.37E+06 1.36E+00 52.5 1.71E+06
0.631 29 -2.00E-01 9.65E+01 1.36E+06 1.76E+06 1.30E+00 51.3 2.23E+06
1 29 0.00E+00 1.53E+02 1.81E+06 2.25E+06 1.24E+00 50.1 2.88E+06
1.585 29 2.00E-01 2.42E+02 2.39E+06 2.84E+06 1.19E+00 48.9 3.71E+06
2.512 29 4.00E-01 3.84E+02 3.13E+06 3.57E+06 1.14E+00 47.7 4.75E+06
3.981 29 6.00E-01 6.09E+02 4.08E+06 4.46E+06 1.09E+00 46.5 6.04E+06
6.31 29 8.00E-01 9.65E+02 5.27E+06 5.53E+06 1.05E+00 45.4 7.64E+06
10 29 1.00E+00 1.53E+03 6.78E+06 6.80E+06 1.00E+00 44.3 9.60E+06
15.849 29 1.20E+00 2.42E+03 8.65E+06 8.32E+06 9.62E-01 43.0 1.20E+07
25.121 29 1.40E+00 3.84E+03 1.10E+07 1.01E+07 9.22E-01 41.8 1.49E+07
39.809 29 1.60E+00 6.09E+03 1.38E+07 1.22E+07 8.85E-01 40.7 1.85E+07
50 29 1.70E+00 7.64E+03 1.55E+07 1.34E+07 8.67E-01 40.1 2.05E+07
Table D-1 (Continued)
Frequency temperature Log(Freq) Freq*aT G' G'' Tan δ δ G*
Hz °C Pa Pa deg Pa
Page 203
8/9/2019 Characterization of Warm Mix Asphalt (WMA) Performance in Differe
http://slidepdf.com/reader/full/characterization-of-warm-mix-asphalt-wma-performance-in-differe 203/247
0.1 37 -1.00E+00 1.60E+00 8.76E+04 1.66E+05 1.90E+00 62.2 1.88E+05
0.158 37 -8.01E-01 2.53E+00 1.25E+05 2.26E+05 1.81E+00 61.0 2.59E+05
0.251 37 -6.00E-01 4.02E+00 1.76E+05 3.04E+05 1.72E+00 59.9 3.51E+05
0.398 37 -4.00E-01 6.37E+00 2.46E+05 4.07E+05 1.65E+00 58.9 4.75E+05
0.631 37 -2.00E-01 1.01E+01 3.42E+05 5.43E+05 1.59E+00 57.8 6.42E+05
1 37 0.00E+00 1.60E+01 4.71E+05 7.18E+05 1.52E+00 56.8 8.59E+05
1.585 37 2.00E-01 2.54E+01 6.46E+05 9.46E+05 1.46E+00 55.7 1.15E+06
2.512 37 4.00E-01 4.02E+01 8.81E+05 1.24E+06 1.41E+00 54.6 1.52E+06
3.981 37 6.00E-01 6.37E+01 1.19E+06 1.61E+06 1.35E+00 53.5 2.00E+06
6.31 37 8.00E-01 1.01E+02 1.61E+06 2.08E+06 1.30E+00 52.4 2.63E+06
10 37 1.00E+00 1.60E+02 2.15E+06 2.67E+06 1.24E+00 51.2 3.42E+06
15.849 37 1.20E+00 2.54E+02 2.85E+06 3.40E+06 1.19E+00 50.1 4.44E+06
25.121 37 1.40E+00 4.02E+02 3.76E+06 4.30E+06 1.14E+00 48.9 5.71E+06
39.809 37 1.60E+00 6.37E+02 4.95E+06 5.43E+06 1.10E+00 47.7 7.35E+06
50 37 1.70E+00 8.00E+02 5.65E+06 6.09E+06 1.08E+00 47.2 8.31E+06
Table D-1 (Continued)
F t t L (F ) F * T G' G'' T δ δ G*
Page 204
8/9/2019 Characterization of Warm Mix Asphalt (WMA) Performance in Differe
http://slidepdf.com/reader/full/characterization-of-warm-mix-asphalt-wma-performance-in-differe 204/247
Frequency temperature Log(Freq) Freq*aT G' G'' Tan δ δ G*
Hz °C Pa Pa deg Pa
0.1 45.9-
1.00E+001.00E-01 9067.5 2.43E+04 2.68E+00 69.56
0.158 46 -8.01E-01 1.58E-01 13420 3.37E+04 2.51E+00 68.27 3.63E+04
0.251 46 -6.00E-01 2.51E-01 19590 4.64E+04 2.37E+00 67.10 5.04E+04
0.398 46 -4.00E-01 3.98E-01 28385 6.39E+04 2.25E+00 66.03 6.99E+04
0.631 46 -2.00E-01 6.31E-01 40360 8.69E+04 2.15E+00 65.09 9.58E+04
1 46 0.00E+00 1.00E+00 56630 1.17E+05 2.07E+00 64.26 1.30E+05
1.585 46 2.00E-01 1.59E+00 78950 1.58E+05 2.01E+00 63.49 1.77E+05
2.512 46 4.00E-01 2.51E+00 109700 2.13E+05 1.95E+00 62.79 2.40E+05
3.981 45.9 6.00E-01 3.98E+00 151850 2.87E+05 1.89E+00 62.12 3.25E+05
6.31 45.9 8.00E-01 6.31E+00 208600 3.84E+05 1.84E+00 61.47 4.37E+05
10 45.9 1.00E+00 1.00E+01 2.96E+05 5.22E+05 1.76E+00 60.45 6.00E+05
15.849 45.9 1.20E+00 1.58E+01 4.30E+05 7.18E+05 1.67E+00 59.10 8.37E+05
25.121 45.9 1.40E+00 2.51E+01 6.11E+05 9.69E+05 1.59E+00 57.77 1.15E+06
Table D-1 (Continued)
Frequency temperature Log(Freq) Freq*aT G' G'' Tan δ δ G*
Page 205
8/9/2019 Characterization of Warm Mix Asphalt (WMA) Performance in Differe
http://slidepdf.com/reader/full/characterization-of-warm-mix-asphalt-wma-performance-in-differe 205/247
Frequency temperature Log(Freq) Freq*aT G G Tan δ δ G*
Hz °C Pa Pa deg Pa0.1 58 -1.00E+00 1.01E-02 6.80E+02 3.33E+03 4.90E+00 7.85E+01 3.40E+03
0.158 58 -8.01E-01 1.59E-02 1.15E+03 4.95E+03 4.30E+00 7.69E+01 5.08E+03
0.251 58 -6.00E-01 2.53E-02 1.88E+03 7.21E+03 3.84E+00 7.54E+01 7.45E+03
0.398 58 -4.00E-01 4.01E-02 3.00E+03 1.04E+04 3.48E+00 7.40E+01 1.08E+04
0.631 58 -2.00E-01 6.36E-02 4.72E+03 1.50E+04 3.18E+00 7.26E+01 1.57E+04
1 58 0.00E+00 1.01E-01 7.26E+03 2.15E+04 2.95E+00 7.13E+01 2.26E+04
1.585 58 2.00E-01 1.60E-01 1.10E+04 3.04E+04 2.77E+00 7.01E+01 3.23E+04
2.512 58 4.00E-01 2.53E-01 1.64E+04 4.28E+04 2.62E+00 6.91E+01 4.58E+04
3.981 58 6.00E-01 4.01E-01 2.40E+04 5.97E+04 2.49E+00 6.81E+01 6.43E+046.31 58 8.00E-01 6.36E-01 34825 8.30E+04 2.38E+00 6.72E+01 9.00E+04
10 58 1.00E+00 1.01E+00 49935 1.15E+05 2.29E+00 6.64E+01 1.25E+05
15.849 58 1.20E+00 1.60E+00 71095 1.57E+05 2.21E+00 6.57E+01 1.73E+05
25.121 58 1.40E+00 2.53E+00 99835 2.14E+05 2.14E+00 6.50E+01 2.36E+05
Table D-1 (Continued)
Frequency temperature Log(Freq) Freq*aT G' G'' Tan δ δ G*
Page 206
8/9/2019 Characterization of Warm Mix Asphalt (WMA) Performance in Differe
http://slidepdf.com/reader/full/characterization-of-warm-mix-asphalt-wma-performance-in-differe 206/247
Frequency temperature Log(Freq) Freq*aT G G Tan δ δ G*
Hz °C Pa Pa deg Pa0.1 69.9 -1.00E+00 1.08E-03 4.47E+01 5.04E+02 1.13E+01 8.49E+01 5.06E+02
0.158 70.1 -8.01E-01 1.70E-03 8.18E+01 7.60E+02 9.30E+00 8.39E+01 7.65E+02
0.251 69.9 -6.00E-01 2.70E-03 1.53E+02 1.18E+03 7.70E+00 8.26E+01 1.19E+03
0.398 69.9 -4.00E-01 4.28E-03 2.71E+02 1.78E+03 6.56E+00 8.13E+01 1.80E+03
0.631 70 -2.00E-01 6.79E-03 4.71E+02 2.67E+03 5.68E+00 8.00E+01 2.72E+03
1 70 0.00E+00 1.08E-02 8.04E+02 4.01E+03 4.98E+00 7.87E+01 4.09E+03
1.585 70 2.00E-01 1.71E-02 1.34E+03 5.93E+03 4.44E+00 7.73E+01 6.08E+03
2.512 70 4.00E-01 2.70E-02 2.17E+03 8.71E+03 4.01E+00 7.60E+01 8.97E+03
3.981 70 6.00E-01 4.28E-02 3.45E+03 1.26E+04 3.67E+00 7.47E+01 1.31E+046.31 70 8.00E-01 6.79E-02 5.40E+03 1.83E+04 3.39E+00 7.35E+01 1.91E+04
10 70 1.00E+00 1.08E-01 8.34E+03 2.63E+04 3.16E+00 7.24E+01 2.76E+04
15.849 70.1 1.20E+00 1.71E-01 1.27E+04 3.77E+04 2.97E+00 7.14E+01 3.98E+04
25.121 70.1 1.40E+00 2.70E-01 1.91E+04 5.34E+04 2.80E+00 7.04E+01 5.67E+04
Table D-1 (Continued)
Frequency temperature Log(Freq) Freq*aT G' G'' Tan δ δ G*
Page 207
8/9/2019 Characterization of Warm Mix Asphalt (WMA) Performance in Differe
http://slidepdf.com/reader/full/characterization-of-warm-mix-asphalt-wma-performance-in-differe 207/247
Frequency temperature Log(Freq) Freq aT G G Tan δ δ G
Hz °C Pa Pa deg Pa0.1 76 -1.00E+00 4.01E-04 10.485 2.09E+02 1.99E+01 8.71E+01 2.09E+02
0.158 76 -8.01E-01 6.33E-04 21.135 3.22E+02 1.52E+01 8.62E+01 3.23E+02
0.251 75.9 -6.00E-01 1.01E-03 42.035 5.02E+02 1.20E+01 8.52E+01 5.04E+02
0.398 76.1 -4.00E-01 1.60E-03 78.74 7.69E+02 9.76E+00 8.42E+01 7.73E+02
0.631 76 -2.00E-01 2.53E-03 144.2 1.17E+03 8.14E+00 8.30E+01 1.18E+03
1 76 0.00E+00 4.01E-03 261.25 1.80E+03 6.90E+00 8.18E+01 1.82E+03
1.585 76 2.00E-01 6.35E-03 454.05 2.71E+03 5.97E+00 8.05E+01 2.75E+03
2.512 76.1 4.00E-01 1.01E-02 767.25 4.03E+03 5.25E+00 7.92E+01 4.10E+03
3.981 76.1 6.00E-01 1.60E-02 1286.5 6.01E+03 4.67E+00 7.79E+01 6.14E+036.31 76.1 8.00E-01 2.53E-02 2094.5 8.83E+03 4.22E+00 7.67E+01 9.07E+03
10 76.1 1.00E+00 4.01E-02 3377.5 1.30E+04 3.84E+00 7.54E+01 1.34E+04
15.849 76.1 1.20E+00 6.35E-02 5324 1.88E+04 3.54E+00 7.42E+01 1.96E+04
25.121 76 1.40E+00 1.01E-01 8288 2.72E+04 3.28E+00 7.30E+01 2.84E+04
Table D-2 Frequency sweeps data output for PAV-aged control SBS-modified binder
Frequency temperature Log(Freq) Freq*aT G' G'' Tan δ δ G*
Page 208
8/9/2019 Characterization of Warm Mix Asphalt (WMA) Performance in Differe
http://slidepdf.com/reader/full/characterization-of-warm-mix-asphalt-wma-performance-in-differe 208/247
q y p g( q) q
Hz °C Pa Pa deg Pa0.1 13 -1.00E+00 6.93E+02 7.61E+06 6.07E+06 7.98E-01 38.6 9.73E+06
0.158 13 -8.01E-01 1.09E+03 9.47E+06 7.23E+06 7.64E-01 37.4 1.19E+07
0.251 13 -6.00E-01 1.74E+03 1.16E+07 8.50E+06 7.34E-01 36.3 1.44E+07
0.398 13.1 -4.00E-01 2.76E+03 1.41E+07 9.94E+06 7.06E-01 35.2 1.72E+07
0.631 13.1 -2.00E-01 4.37E+03 1.70E+07 1.16E+07 6.80E-01 34.2 2.06E+07
1 13 0.00E+00 6.93E+03 2.04E+07 1.34E+07 6.55E-01 33.2 2.44E+07
1.585 13 2.00E-01 1.10E+04 2.43E+07 1.54E+07 6.32E-01 32.3 2.88E+07
2.512 13 4.00E-01 1.74E+04 2.89E+07 1.76E+07 6.09E-01 31.4 3.38E+07
3.981 13 6.00E-01 2.76E+04 3.41E+07 2.00E+07 5.87E-01 30.4 3.96E+076.31 13 8.00E-01 4.37E+04 4.01E+07 2.27E+07 5.66E-01 29.5 4.61E+07
10 13 1.00E+00 6.93E+04 4.70E+07 2.57E+07 5.46E-01 28.6 5.36E+07
15.849 13 1.20E+00 1.10E+05 5.47E+07 2.87E+07 5.25E-01 27.7 6.18E+07
25.121 13 1.40E+00 1.74E+05 6.35E+07 3.20E+07 5.03E-01 26.7 7.11E+07
39.809 13 1.60E+00 2.76E+05 7.33E+07 3.55E+07 4.84E-01 25.8 8.14E+07
50 13 1.70E+00 3.46E+05 7.84E+07 3.71E+07 4.74E-01 25.4 8.68E+07
Table D-2 (Continued)
Frequency temperature Log(Freq) Freq*aT G' G'' Tan δ δ G*
Page 209
8/9/2019 Characterization of Warm Mix Asphalt (WMA) Performance in Differe
http://slidepdf.com/reader/full/characterization-of-warm-mix-asphalt-wma-performance-in-differe 209/247
q y p g( q) q
Hz °C Pa Pa deg Pa0.1 21 -1.00E+00 6.94E+01 2.14E+06 2.17E+06 1.01E+00 45.4 3.05E+06
0.158 21 -8.01E-01 1.10E+02 2.73E+06 2.67E+06 9.79E-01 44.4 3.82E+06
0.251 21 -6.00E-01 1.74E+02 3.49E+06 3.29E+06 9.43E-01 43.3 4.79E+06
0.398 21 -4.00E-01 2.76E+02 4.43E+06 4.02E+06 9.08E-01 42.2 5.98E+06
0.631 21 -2.00E-01 4.38E+02 5.57E+06 4.87E+06 8.74E-01 41.2 7.40E+06
1 21 0.00E+00 6.94E+02 6.97E+06 5.87E+06 8.42E-01 40.1 9.11E+06
1.585 21 2.00E-01 1.10E+03 8.65E+06 7.02E+06 8.11E-01 39.1 1.11E+07
2.512 21 4.00E-01 1.74E+03 1.07E+07 8.35E+06 7.82E-01 38.0 1.35E+07
3.981 21 6.00E-01 2.76E+03 1.31E+07 9.87E+06 7.54E-01 37.0 1.64E+076.31 21 8.00E-01 4.38E+03 1.60E+07 1.16E+07 7.27E-01 36.0 1.97E+07
10 21 1.00E+00 6.94E+03 1.94E+07 1.36E+07 7.02E-01 35.1 2.37E+07
15.849 21 1.20E+00 1.10E+04 2.34E+07 1.58E+07 6.75E-01 34.0 2.82E+07
25.121 21 1.40E+00 1.74E+04 2.81E+07 1.83E+07 6.52E-01 33.1 3.35E+07
39.809 21 1.60E+00 2.76E+04 3.36E+07 2.11E+07 6.27E-01 32.1 3.97E+07
50 21 1.70E+00 3.47E+04 3.66E+07 2.25E+07 6.15E-01 31.6 4.30E+07
Table D-2 (Continued)
Frequency temperature Log(Freq) Freq*aT G' G'' Tan δ δ G*
Page 210
8/9/2019 Characterization of Warm Mix Asphalt (WMA) Performance in Differe
http://slidepdf.com/reader/full/characterization-of-warm-mix-asphalt-wma-performance-in-differe 210/247
q y p g( q) q
Hz °C Pa Pa deg Pa0.1 29 -1.00E+00 9.00E+00 5.44E+05 6.86E+05 1.26E+00 51.6 8.75E+05
0.158 29 -8.01E-01 1.42E+01 7.24E+05 8.83E+05 1.22E+00 50.6 1.14E+06
0.251 29 -6.00E-01 2.26E+01 9.55E+05 1.13E+06 1.18E+00 49.8 1.48E+06
0.398 29 -4.00E-01 3.58E+01 1.25E+06 1.43E+06 1.14E+00 48.8 1.90E+06
0.631 29 -2.00E-01 5.68E+01 1.64E+06 1.81E+06 1.10E+00 47.8 2.44E+06
1 29 0.00E+00 9.00E+01 2.13E+06 2.27E+06 1.07E+00 46.8 3.11E+06
1.585 29 2.00E-01 1.43E+02 2.75E+06 2.82E+06 1.03E+00 45.8 3.94E+06
2.512 29 4.00E-01 2.26E+02 3.53E+06 3.50E+06 9.91E-01 44.7 4.97E+06
3.981 29 6.00E-01 3.58E+02 4.51E+06 4.30E+06 9.54E-01 43.7 6.23E+066.31 29 8.00E-01 5.68E+02 5.71E+06 5.27E+06 9.22E-01 42.7 7.77E+06
10 29 1.00E+00 9.00E+02 7.20E+06 6.41E+06 8.90E-01 41.7 9.64E+06
15.849 29 1.20E+00 1.43E+03 9.03E+06 7.74E+06 8.57E-01 40.6 1.19E+07
25.121 29 1.40E+00 2.26E+03 1.13E+07 9.30E+06 8.25E-01 39.5 1.46E+07
39.809 29 1.60E+00 3.58E+03 1.40E+07 1.11E+07 7.96E-01 38.5 1.79E+07
50 29 1.70E+00 4.50E+03 1.56E+07 1.22E+07 7.81E-01 38.0 1.97E+07
Table D-2 (Continued)
Frequency temperature Log(Freq) Freq*aT G' G'' Tan δ δ G*
Page 211
8/9/2019 Characterization of Warm Mix Asphalt (WMA) Performance in Differe
http://slidepdf.com/reader/full/characterization-of-warm-mix-asphalt-wma-performance-in-differe 211/247
Hz °C Pa Pa deg Pa0.1 37 -1.00E+00 1.30E+00 1.37E+05 2.03E+05 1.48E+00 56.0 2.45E+05
0.158 37 -8.01E-01 2.05E+00 1.86E+05 2.68E+05 1.45E+00 55.3 3.26E+05
0.251 37 -6.00E-01 3.26E+00 2.50E+05 3.53E+05 1.42E+00 54.8 4.33E+05
0.398 37 -4.00E-01 5.17E+00 3.34E+05 4.62E+05 1.38E+00 54.1 5.70E+05
0.631 37 -2.00E-01 8.20E+00 4.49E+05 6.04E+05 1.34E+00 53.3 7.53E+05
1 37 0.00E+00 1.30E+01 6.04E+05 7.87E+05 1.30E+00 52.5 9.92E+05
1.585 37 2.00E-01 2.06E+01 8.05E+05 1.02E+06 1.26E+00 51.6 1.30E+06
2.512 37 4.00E-01 3.27E+01 1.07E+06 1.31E+06 1.22E+00 50.8 1.69E+06
3.981 37 6.00E-01 5.18E+01 1.40E+06 1.67E+06 1.19E+00 49.9 2.18E+066.31 37 8.00E-01 8.20E+01 1.84E+06 2.11E+06 1.15E+00 48.9 2.81E+06
10 37 1.00E+00 1.30E+02 2.42E+06 2.67E+06 1.11E+00 47.9 3.60E+06
15.849 37 1.20E+00 2.06E+02 3.13E+06 3.35E+06 1.07E+00 47.0 4.59E+06
25.121 37 1.40E+00 3.27E+02 4.06E+06 4.19E+06 1.03E+00 46.0 5.83E+06
39.809 37 1.60E+00 5.18E+02 5.22E+06 5.21E+06 9.99E-01 45.0 7.38E+06
50 37 1.70E+00 6.50E+02 5.90E+06 5.79E+06 9.82E-01 44.5 8.27E+06
Table D-2 (Continued)
Frequency temperature Log(Freq) Freq*aT G' G'' Tan δ δ G*
Page 212
8/9/2019 Characterization of Warm Mix Asphalt (WMA) Performance in Differe
http://slidepdf.com/reader/full/characterization-of-warm-mix-asphalt-wma-performance-in-differe 212/247
Hz °C Pa Pa deg Pa0.1 45.9 -1.00E+00 1.00E-01 2.38E+04 4.31E+04 1.81E+00 61.0 4.92E+04
0.158 46 -8.01E-01 1.58E-01 3.25E+04 5.71E+04 1.76E+00 60.4 6.57E+04
0.251 46 -6.00E-01 2.51E-01 4.43E+04 7.61E+04 1.72E+00 59.8 8.81E+04
0.398 46 -4.00E-01 3.98E-01 5.95E+04 1.00E+05 1.69E+00 59.4 1.17E+05
0.631 46 -2.00E-01 6.31E-01 7.87E+04 1.31E+05 1.67E+00 59.1 1.53E+05
1 46 0.00E+00 1.00E+00 1.04E+05 1.72E+05 1.65E+00 58.8 2.01E+05
1.585 46 2.00E-01 1.59E+00 1.46E+05 2.37E+05 1.63E+00 58.5 2.78E+05
2.512 46 4.00E-01 2.51E+00 1.92E+05 3.10E+05 1.61E+00 58.2 3.65E+05
3.981 45.9 6.00E-01 3.98E+00 2.51E+05 4.02E+05 1.60E+00 58.0 4.74E+056.31 45.9 8.00E-01 6.31E+00 3.46E+05 5.36E+05 1.55E+00 57.2 6.38E+05
10 45.8 1.00E+00 1.00E+01 4.85E+05 7.23E+05 1.49E+00 56.1 8.70E+05
15.849 45.9 1.20E+00 1.58E+01 6.76E+05 9.64E+05 1.43E+00 55.0 1.18E+06
25.121 45.9 1.40E+00 2.51E+01 9.24E+05 1.26E+06 1.37E+00 53.8 1.56E+06
Table D-2 (Continued)
Frequency temperature Log(Freq) Freq*aT G' G'' Tan δ δ G*
Page 213
8/9/2019 Characterization of Warm Mix Asphalt (WMA) Performance in Differe
http://slidepdf.com/reader/full/characterization-of-warm-mix-asphalt-wma-performance-in-differe 213/247
Hz °C Pa Pa deg Pa0.1 58 -1.00E+00 1.01E-02 3.03E+03 7.98E+03 2.63E+00 69.2 8.54E+03
0.158 58 -8.01E-01 1.59E-02 4.62E+03 1.12E+04 2.41E+00 67.5 1.21E+04
0.251 58 -6.00E-01 2.53E-02 6.87E+03 1.54E+04 2.25E+00 66.0 1.69E+04
0.398 58 -4.00E-01 4.01E-02 1.00E+04 2.12E+04 2.12E+00 64.7 2.34E+04
0.631 58 -2.00E-01 6.36E-02 1.43E+04 2.89E+04 2.02E+00 63.6 3.22E+04
1 58 0.00E+00 1.01E-01 2.01E+04 3.91E+04 1.94E+00 62.8 4.40E+04
1.585 58 2.00E-01 1.60E-01 2.79E+04 5.27E+04 1.89E+00 62.1 5.96E+04
2.512 58 4.00E-01 2.53E-01 3.83E+04 7.10E+04 1.85E+00 61.7 8.07E+04
3.981 58 6.00E-01 4.01E-01 5.22E+04 9.53E+04 1.83E+00 61.3 1.09E+056.31 58 8.00E-01 6.36E-01 7.08E+04 1.28E+05 1.80E+00 61.0 1.46E+05
10 58 1.00E+00 1.01E+00 9.55E+04 1.71E+05 1.78E+00 60.7 1.95E+05
15.849 58 1.20E+00 1.60E+00 1.29E+05 2.27E+05 1.77E+00 60.5 2.61E+05
25.121 58 1.40E+00 2.53E+00 1.71E+05 2.99E+05 1.75E+00 60.2 3.45E+05
Table D-2 (Continued)
Page 214
8/9/2019 Characterization of Warm Mix Asphalt (WMA) Performance in Differe
http://slidepdf.com/reader/full/characterization-of-warm-mix-asphalt-wma-performance-in-differe 214/247
Frequency temperature Log(Freq) Freq*aT G' G'' Tan δ δ G*
Hz °C Pa Pa deg Pa
0.1 69.9 -1.00E+00 1.08E-03 2.83E+02 1.45E+03 5.11E+00 78.9 1.47E+03
0.158 70.1 -8.01E-01 1.70E-03 4.90E+02 2.15E+03 4.40E+00 77.2 2.21E+03
0.251 69.9 -6.00E-01 2.70E-03 8.15E+02 3.14E+03 3.85E+00 75.5 3.24E+03
0.398 69.9 -4.00E-01 4.28E-03 1.33E+03 4.55E+03 3.42E+00 73.7 4.74E+03
0.631 70 -2.00E-01 6.79E-03 2.14E+03 6.54E+03 3.06E+00 71.9 6.88E+03
1 70 0.00E+00 1.08E-02 3.34E+03 9.29E+03 2.78E+00 70.2 9.87E+03
1.585 70 2.00E-01 1.71E-02 5.12E+03 1.31E+04 2.56E+00 68.6 1.41E+04
2.512 70 4.00E-01 2.70E-02 7.63E+03 1.82E+04 2.39E+00 67.3 1.97E+04
3.981 70 6.00E-01 4.28E-02 1.12E+04 2.52E+04 2.26E+00 66.1 2.75E+04
6.31 70 8.00E-01 6.79E-02 1.61E+04 3.47E+04 2.16E+00 65.1 3.82E+04
10 70 1.00E+00 1.08E-01 2.28E+04 4.76E+04 2.09E+00 64.4 5.28E+04
15.849 70.1 1.20E+00 1.71E-01 3.20E+04 6.51E+04 2.03E+00 63.8 7.26E+04
25.121 70.1 1.40E+00 2.70E-01 4.46E+04 8.87E+04 1.99E+00 63.3 9.93E+04
Table D-2 (Continued)
Page 215
8/9/2019 Characterization of Warm Mix Asphalt (WMA) Performance in Differe
http://slidepdf.com/reader/full/characterization-of-warm-mix-asphalt-wma-performance-in-differe 215/247
Frequency temperature Log(Freq) Freq*aT G' G'' Tan δ δ G*
Hz °C Pa Pa deg Pa
0.1 76 -1.00E+00 4.01E-04 7.37E+01 6.14E+02 8.33E+00 83.2 6.18E+02
0.158 76 -8.01E-01 6.33E-04 1.35E+02 9.31E+02 6.90E+00 81.8 9.40E+02
0.251 75.9 -6.00E-01 1.01E-03 2.43E+02 1.40E+03 5.77E+00 80.2 1.42E+03
0.398 76.1 -4.00E-01 1.60E-03 4.28E+02 2.10E+03 4.90E+00 78.5 2.14E+03
0.631 76 -2.00E-01 2.53E-03 7.28E+02 3.09E+03 4.24E+00 76.7 3.17E+03
1 76 0.00E+00 4.01E-03 1.22E+03 4.52E+03 3.71E+00 74.9 4.68E+03
1.585 76 2.00E-01 6.35E-03 1.97E+03 6.50E+03 3.30E+00 73.1 6.79E+03
2.512 76.1 4.00E-01 1.01E-02 3.13E+03 9.30E+03 2.97E+00 71.4 9.81E+03
3.981 76.1 6.00E-01 1.60E-02 4.87E+03 1.32E+04 2.71E+00 69.8 1.41E+04
6.31 76.1 8.00E-01 2.53E-02 7.34E+03 1.85E+04 2.51E+00 68.3 1.99E+04
10 76.1 1.00E+00 4.01E-02 1.09E+04 2.57E+04 2.36E+00 67.1 2.79E+04
15.849 76.1 1.20E+00 6.35E-02 1.58E+04 3.55E+04 2.25E+00 66.0 3.89E+04
25.121 76 1.40E+00 1.01E-01 2.26E+04 4.89E+04 2.16E+00 65.2 5.39E+04
Table D-3 Frequency sweeps data output for PAV-aged Evotherm (F-P) unmodified binder
Frequency temperature Log(Freq) Freq*aT G' G'' Tan δ δ G*
Page 216
8/9/2019 Characterization of Warm Mix Asphalt (WMA) Performance in Differe
http://slidepdf.com/reader/full/characterization-of-warm-mix-asphalt-wma-performance-in-differe 216/247
Hz °C Pa Pa deg Pa0.1 13 -1.00E+00 800 7.04E+06 6.28E+06 8.92E-01 41.7 9.44E+06
0.158 13 -8.01E-01 1264 9.02E+06 7.64E+06 8.47E-01 40.3 1.18E+07
0.251 13 -6.00E-01 2008 1.12E+07 9.08E+06 8.10E-01 39.0 1.44E+07
0.398 13.1 -4.00E-01 3184 1.38E+07 1.07E+07 7.76E-01 37.8 1.75E+07
0.631 13.1 -2.00E-01 5048 1.70E+07 1.26E+07 7.43E-01 36.6 2.12E+07
1 13 0.00E+00 8000 2.07E+07 1.48E+07 7.13E-01 35.5 2.55E+07
1.585 13 2.00E-01 12680 2.51E+07 1.72E+07 6.85E-01 34.4 3.04E+07
2.512 13 4.00E-01 20096 3.02E+07 1.99E+07 6.58E-01 33.4 3.61E+07
3.981 13 6.00E-01 31848 3.61E+07 2.28E+07 6.32E-01 32.3 4.27E+076.31 13 8.00E-01 50480 4.28E+07 2.61E+07 6.08E-01 31.3 5.01E+07
10 13 1.00E+00 80000 5.07E+07 2.97E+07 5.86E-01 30.4 5.88E+07
15.849 13 1.20E+00 126792 5.97E+07 3.34E+07 5.60E-01 29.3 6.84E+07
25.121 13 1.40E+00 200968 6.98E+07 3.75E+07 5.38E-01 28.3 7.93E+07
39.809 13 1.60E+00 318472 8.12E+07 4.18E+07 5.15E-01 27.2 9.13E+07
50 13 1.70E+00 400000 8.71E+07 4.38E+07 5.03E-01 26.7 9.75E+07
Table D-3 (Continued)
Frequency temperature Log(Freq) Freq*aT G' G'' Tan δ δ G*
Page 217
8/9/2019 Characterization of Warm Mix Asphalt (WMA) Performance in Differe
http://slidepdf.com/reader/full/characterization-of-warm-mix-asphalt-wma-performance-in-differe 217/247
Hz °C Pa Pa deg Pa0.1 21 -1.00E+00 8.00E+01 1.72E+06 2.02E+06 1.17E+00 49.5 2.65E+06
0.158 21 -8.01E-01 1.26E+02 2.26E+06 2.53E+06 1.12E+00 48.2 3.39E+06
0.251 21 -6.00E-01 2.01E+02 2.96E+06 3.16E+06 1.07E+00 46.9 4.33E+06
0.398 21 -4.00E-01 3.18E+02 3.83E+06 3.92E+06 1.02E+00 45.7 5.49E+06
0.631 21 -2.00E-01 5.05E+02 4.93E+06 4.83E+06 9.80E-01 44.4 6.90E+06
1 21 0.00E+00 8.00E+02 6.28E+06 5.90E+06 9.39E-01 43.2 8.62E+06
1.585 21 2.00E-01 1.27E+03 7.96E+06 7.17E+06 9.00E-01 42.0 1.07E+07
2.512 21 4.00E-01 2.01E+03 1.00E+07 8.65E+06 8.65E-01 40.8 1.32E+07
3.981 21 6.00E-01 3.18E+03 1.25E+07 1.04E+07 8.30E-01 39.7 1.62E+07
6.31 21 8.00E-01 5.05E+03 1.55E+07 1.24E+07 7.97E-01 38.6 1.98E+07
10 21 1.00E+00 8.00E+03 1.91E+07 1.47E+07 7.69E-01 37.5 2.41E+07
15.849 21 1.20E+00 1.27E+04 2.35E+07 1.72E+07 7.33E-01 36.2 2.91E+07
25.121 21 1.40E+00 2.01E+04 2.85E+07 2.01E+07 7.06E-01 35.2 3.48E+07
39.809 21 1.60E+00 3.18E+04 3.45E+07 2.34E+07 6.77E-01 34.1 4.17E+07
50 21 1.70E+00 4.00E+04 3.79E+07 2.51E+07 6.63E-01 33.5 4.55E+07
Table D-3 (Continued)
Frequency temperature Log(Freq) Freq*aT G' G'' Tan δ δ G*
H °C P P d P
Page 218
8/9/2019 Characterization of Warm Mix Asphalt (WMA) Performance in Differe
http://slidepdf.com/reader/full/characterization-of-warm-mix-asphalt-wma-performance-in-differe 218/247
Hz °C Pa Pa deg Pa
0.1 29 -1.00E+00 8.50E+00 3.59E+05 5.46E+05 1.52E+00 56.6 6.53E+05
0.158 29 -8.01E-01 1.34E+01 4.96E+05 7.20E+05 1.45E+00 55.5 8.74E+05
0.251 29 -6.00E-01 2.13E+01 6.76E+05 9.40E+05 1.39E+00 54.3 1.16E+06
0.398 29 -4.00E-01 3.38E+01 9.13E+05 1.22E+06 1.33E+00 53.1 1.52E+06
0.631 29 -2.00E-01 5.36E+01 1.23E+06 1.57E+06 1.28E+00 51.9 1.99E+06
1 29 0.00E+00 8.50E+01 1.64E+06 2.01E+06 1.22E+00 50.8 2.59E+06
1.585 29 2.00E-01 1.35E+02 2.17E+06 2.55E+06 1.17E+00 49.6 3.35E+06
2.512 29 4.00E-01 2.14E+02 2.85E+06 3.21E+06 1.13E+00 48.5 4.30E+06
3.981 29 6.00E-01 3.38E+02 3.72E+06 4.03E+06 1.08E+00 47.3 5.48E+06
6.31 29 8.00E-01 5.36E+02 4.83E+06 5.01E+06 1.04E+00 46.1 6.96E+06
10 29 1.00E+00 8.50E+02 6.22E+06 6.19E+06 9.95E-01 44.9 8.78E+06
15.849 29 1.20E+00 1.35E+03 7.96E+06 7.62E+06 9.58E-01 43.8 1.10E+07
25.121 29 1.40E+00 2.14E+03 1.01E+07 9.29E+06 9.16E-01 42.5 1.38E+07
39.809 29 1.60E+00 3.38E+03 1.28E+07 1.13E+07 8.79E-01 41.3 1.71E+07
50 29 1.70E+00 4.25E+03 1.44E+07 1.24E+07 8.62E-01 40.8 1.90E+07
Table D-3 (Continued)
Frequency temperature Log(Freq) Freq*aT G' G'' Tan δ δ G*
H °C P P d P
Page 219
8/9/2019 Characterization of Warm Mix Asphalt (WMA) Performance in Differe
http://slidepdf.com/reader/full/characterization-of-warm-mix-asphalt-wma-performance-in-differe 219/247
Hz °C Pa Pa deg Pa
0.1 37 -1.00E+00 1.20E+00 6.95E+04 1.37E+05 1.97E+00 63.1 1.54E+05
0.158 37 -8.01E-01 1.90E+00 9.92E+04 1.87E+05 1.88E+00 62.0 2.11E+05
0.251 37 -6.00E-01 3.01E+00 1.41E+05 2.54E+05 1.79E+00 60.9 2.90E+05
0.398 37 -4.00E-01 4.78E+00 1.97E+05 3.40E+05 1.72E+00 59.9 3.93E+05
0.631 37 -2.00E-01 7.57E+00 2.75E+05 4.55E+05 1.65E+00 58.9 5.32E+05
1 37 0.00E+00 1.20E+01 3.81E+05 6.06E+05 1.59E+00 57.8 7.16E+05
1.585 37 2.00E-01 1.90E+01 5.26E+05 8.02E+05 1.53E+00 56.8 9.59E+05
2.512 37 4.00E-01 3.01E+01 7.21E+05 1.06E+06 1.46E+00 55.7 1.28E+06
3.981 37 6.00E-01 4.78E+01 9.83E+05 1.38E+06 1.41E+00 54.6 1.70E+066.31 37 8.00E-01 7.57E+01 1.33E+06 1.80E+06 1.35E+00 53.4 2.23E+06
10 37 1.00E+00 1.20E+02 1.80E+06 2.31E+06 1.29E+00 52.2 2.93E+06
15.849 37 1.20E+00 1.90E+02 2.40E+06 2.97E+06 1.24E+00 51.1 3.82E+06
25.121 37 1.40E+00 3.01E+02 3.20E+06 3.79E+06 1.18E+00 49.8 4.96E+06
39.809 37 1.60E+00 4.78E+02 4.24E+06 4.81E+06 1.13E+00 48.6 6.41E+06
50 37 1.70E+00 6.00E+02 4.88E+06 5.41E+06 1.11E+00 48.0 7.28E+06
Table D-3 (Continued)
Frequency temperature Log(Freq) Freq*aT G' G'' Tan δ δ G*
H °C P P d P
Page 220
8/9/2019 Characterization of Warm Mix Asphalt (WMA) Performance in Differe
http://slidepdf.com/reader/full/characterization-of-warm-mix-asphalt-wma-performance-in-differe 220/247
Hz °C Pa Pa deg Pa
0.1 45.9 -1.00E+00 1.00E-01 8.14E+03 2.37E+04 2.91E+00 71.0
0.158 46 -8.01E-01 1.58E-01 1.23E+04 3.33E+04 2.70E+00 69.7 3.55E+04
0.251 46 -6.00E-01 2.51E-01 1.84E+04 4.66E+04 2.53E+00 68.4 5.01E+04
0.398 46 -4.00E-01 3.98E-01 2.70E+04 6.47E+04 2.39E+00 67.3 7.01E+04
0.631 46 -2.00E-01 6.31E-01 3.87E+04 8.85E+04 2.29E+00 66.4 9.66E+04
1 46 0.00E+00 1.00E+00 5.49E+04 1.21E+05 2.20E+00 65.5 1.32E+05
1.585 46 2.00E-01 1.59E+00 7.70E+04 1.63E+05 2.12E+00 64.7 1.80E+05
2.512 46 4.00E-01 2.51E+00 1.08E+05 2.22E+05 2.05E+00 64.0 2.47E+05
3.981 45.8 6.00E-01 3.98E+00 1.52E+05 3.03E+05 1.99E+00 63.3 3.39E+05
6.31 45.7 8.00E-01 6.31E+00 2.10E+05 4.06E+05 1.93E+00 62.6 4.58E+05
10 45.7 1.00E+00 1.00E+01 3.04E+05 5.59E+05 1.84E+00 61.5 6.36E+05
15.849 45.6 1.20E+00 1.58E+01 4.45E+05 7.75E+05 1.74E+00 60.1 8.93E+05
25.121 45.6 1.40E+00 2.51E+01 6.38E+05 1.05E+06 1.65E+00 58.8 1.23E+06
Table D-3 (Continued)
Frequency temperature Log(Freq) Freq*aT G' G'' Tan δ δ G*
Hz °C Pa Pa deg Pa
0.1 58 -1.00E+00 1.01E-02 5.90E+02 3.23E+03 5.48E+00 79.7 3.29E+03
Page 221
8/9/2019 Characterization of Warm Mix Asphalt (WMA) Performance in Differe
http://slidepdf.com/reader/full/characterization-of-warm-mix-asphalt-wma-performance-in-differe 221/247
0.158 58 -8.01E-01 1.59E-02 1.03E+03 4.89E+03 4.74E+00 78.1 5.00E+030.251 58 -6.00E-01 2.53E-02 1.72E+03 7.23E+03 4.20E+00 76.6 7.43E+03
0.398 58 -4.00E-01 4.01E-02 2.81E+03 1.06E+04 3.77E+00 75.1 1.10E+04
0.631 58 -2.00E-01 6.36E-02 4.43E+03 1.52E+04 3.44E+00 73.8 1.59E+04
1 58 0.00E+00 1.01E-01 6.89E+03 2.19E+04 3.17E+00 72.5 2.29E+04
1.585 58 2.00E-01 1.60E-01 1.06E+04 3.13E+04 2.96E+00 71.3 3.30E+04
2.512 58 4.00E-01 2.53E-01 1.60E+04 4.45E+04 2.78E+00 70.2 4.72E+04
3.981 58 6.00E-01 4.01E-01 2.37E+04 6.26E+04 2.64E+00 69.2 6.69E+04
6.31 58 8.00E-01 6.36E-01 3.47E+04 8.73E+04 2.51E+00 68.3 9.40E+04
10 58 1.00E+00 1.01E+00 5.02E+04 1.21E+05 2.41E+00 67.5 1.31E+0515.849 58 1.20E+00 1.60E+00 7.17E+04 1.67E+05 2.33E+00 66.7 1.82E+05
25.121 58 1.40E+00 2.53E+00 1.01E+05 2.27E+05 2.25E+00 66.0 2.48E+05
Table D-3 (Continued)
Frequency temperature Log(Freq) Freq*aT G' G'' Tan δ δ G*
Hz °C Pa Pa deg Pa
Page 222
8/9/2019 Characterization of Warm Mix Asphalt (WMA) Performance in Differe
http://slidepdf.com/reader/full/characterization-of-warm-mix-asphalt-wma-performance-in-differe 222/247
Hz C Pa Pa deg Pa
0.1 69.9 -1.00E+00 1.30E-03 3.74E+01 4.94E+02 1.32E+01 85.7 4.96E+02
0.158 70.1 -8.01E-01 2.05E-03 6.92E+01 7.45E+02 1.08E+01 84.7 7.48E+02
0.251 69.9 -6.00E-01 3.26E-03 1.34E+02 1.17E+03 8.74E+00 83.5 1.18E+03
0.398 69.9 -4.00E-01 5.17E-03 2.40E+02 1.77E+03 7.38E+00 82.3 1.79E+03
0.631 70 -2.00E-01 8.20E-03 4.22E+02 2.68E+03 6.34E+00 81.0 2.71E+03
1 70 0.00E+00 1.30E-02 7.24E+02 4.00E+03 5.52E+00 79.7 4.07E+03
1.585 70 2.00E-01 2.06E-02 1.22E+03 5.94E+03 4.89E+00 78.4 6.06E+03
2.512 70 4.00E-01 3.27E-02 2.01E+03 8.80E+03 4.38E+00 77.1 9.03E+03
3.981 70 6.00E-01 5.18E-02 3.25E+03 1.29E+04 3.97E+00 75.9 1.33E+04
6.31 70 8.00E-01 8.20E-02 5.17E+03 1.88E+04 3.65E+00 74.7 1.95E+04
10 70 1.00E+00 1.30E-01 8.05E+03 2.73E+04 3.38E+00 73.5 2.84E+04
15.849 70.1 1.20E+00 2.06E-01 1.24E+04 3.92E+04 3.16E+00 72.5 4.11E+04
25.121 70.1 1.40E+00 3.27E-01 1.88E+04 5.58E+04 2.98E+00 71.4 5.89E+04
Table D-3 (Continued)
Frequency temperature Log(Freq) Freq*aT G' G'' Tan δ δ G*
Hz °C Pa Pa deg Pa
Page 223
8/9/2019 Characterization of Warm Mix Asphalt (WMA) Performance in Differe
http://slidepdf.com/reader/full/characterization-of-warm-mix-asphalt-wma-performance-in-differe 223/247
Hz C Pa Pa deg Pa
0.1 76 -1.00E+00 4.90E-04 8.40E+00 2.03E+02 2.42E+01 87.6 2.03E+02
0.158 76 -8.01E-01 7.74E-04 1.75E+01 3.16E+02 1.81E+01 86.8 3.16E+02
0.251 75.9 -6.00E-01 1.23E-03 3.54E+01 4.93E+02 1.39E+01 85.9 4.95E+02
0.398 76.1 -4.00E-01 1.95E-03 6.74E+01 7.56E+02 1.12E+01 84.9 7.59E+02
0.631 76 -2.00E-01 3.09E-03 1.28E+02 1.18E+03 9.17E+00 83.8 1.18E+03
1 76 0.00E+00 4.90E-03 2.32E+02 1.79E+03 7.72E+00 82.6 1.81E+03
1.585 76 2.00E-01 7.77E-03 4.10E+02 2.71E+03 6.63E+00 81.4 2.74E+03
2.512 76.1 4.00E-01 1.23E-02 7.06E+02 4.08E+03 5.77E+00 80.2 4.14E+03
3.981 76.1 6.00E-01 1.95E-02 1.19E+03 6.08E+03 5.11E+00 78.9 6.20E+03
6.31 76.1 8.00E-01 3.09E-02 1.96E+03 8.99E+03 4.58E+00 77.7 9.20E+03
10 76.1 1.00E+00 4.90E-02 3.19E+03 1.32E+04 4.15E+00 76.5 1.36E+04
15.849 76.1 1.20E+00 7.77E-02 5.12E+03 1.94E+04 3.80E+00 75.2 2.01E+04
25.121 76 1.40E+00 1.23E-01 8.03E+03 2.81E+04 3.50E+00 74.1 2.93E+04
Table D-4 Frequency sweeps data output for PAV-aged Evotherm (F-P) SBS modified binder
Frequency temperature Log(Freq) Freq*aT G' G'' Tan δ δ G*
Hz °C Pa Pa deg Pa
Page 224
8/9/2019 Characterization of Warm Mix Asphalt (WMA) Performance in Differe
http://slidepdf.com/reader/full/characterization-of-warm-mix-asphalt-wma-performance-in-differe 224/247
Hz C Pa Pa deg Pa
0.1 13 -1.00E+00 8.00E+02 7.47E+06 6.34E+06 8.49E-01 40.3 9.80E+06
0.158 13 -8.01E-01 1.26E+03 9.44E+06 7.65E+06 8.10E-01 39.0 1.22E+07
0.251 13 -6.00E-01 2.01E+03 1.17E+07 9.06E+06 7.78E-01 37.9 1.48E+07
0.398 13.1 -4.00E-01 3.18E+03 1.43E+07 1.07E+07 7.47E-01 36.8 1.78E+07
0.631 13.1 -2.00E-01 5.05E+03 1.74E+07 1.25E+07 7.18E-01 35.7 2.14E+07
1 13 0.00E+00 8.00E+03 2.11E+07 1.46E+07 6.90E-01 34.6 2.56E+07
1.585 13 2.00E-01 1.27E+04 2.54E+07 1.69E+07 6.63E-01 33.6 3.05E+07
2.512 13 4.00E-01 2.01E+04 3.04E+07 1.94E+07 6.38E-01 32.5 3.61E+07
3.981 13 6.00E-01 3.18E+04 3.62E+07 2.22E+07 6.14E-01 31.6 4.25E+07
6.31 13 8.00E-01 5.05E+04 4.29E+07 2.53E+07 5.90E-01 30.6 4.99E+07
10 13 1.00E+00 8.00E+04 5.04E+07 2.87E+07 5.69E-01 29.6 5.80E+07
15.849 13 1.20E+00 1.27E+05 5.91E+07 3.23E+07 5.46E-01 28.6 6.73E+07
25.121 13 1.40E+00 2.01E+05 6.89E+07 3.60E+07 5.23E-01 27.6 7.77E+07
39.809 13 1.60E+00 3.18E+05 8.00E+07 4.01E+07 5.01E-01 26.6 8.95E+07
50 13 1.70E+00 4.00E+05 8.59E+07 4.21E+07 4.90E-01 26.1 9.56E+07
Table D-4 (Continued)
Frequency temperature Log(Freq) Freq*aT G' G'' Tan δ δ G*
Hz °C Pa Pa deg Pa
Page 225
8/9/2019 Characterization of Warm Mix Asphalt (WMA) Performance in Differe
http://slidepdf.com/reader/full/characterization-of-warm-mix-asphalt-wma-performance-in-differe 225/247
Hz C Pa Pa deg Pa
0.1 21 -1.00E+00 8.00E+01 2.02E+06 2.18E+06 1.08E+00 47.2 2.97E+06
0.158 21 -8.01E-01 1.26E+02 2.62E+06 2.72E+06 1.04E+00 46.1 3.77E+06
0.251 21 -6.00E-01 2.01E+02 3.38E+06 3.37E+06 9.96E-01 44.9 4.77E+06
0.398 21 -4.00E-01 3.18E+02 4.32E+06 4.14E+06 9.58E-01 43.8 5.98E+06
0.631 21 -2.00E-01 5.05E+02 5.50E+06 5.06E+06 9.21E-01 42.6 7.47E+06
1 21 0.00E+00 8.00E+02 6.94E+06 6.15E+06 8.85E-01 41.5 9.27E+06
1.585 21 2.00E-01 1.27E+03 8.70E+06 7.42E+06 8.53E-01 40.5 1.14E+07
2.512 21 4.00E-01 2.01E+03 1.08E+07 8.90E+06 8.21E-01 39.4 1.40E+07
3.981 21 6.00E-01 3.18E+03 1.34E+07 1.06E+07 7.92E-01 38.4 1.71E+07
6.31 21 8.00E-01 5.05E+03 1.65E+07 1.26E+07 7.62E-01 37.3 2.07E+07
10 21 1.00E+00 8.00E+03 2.01E+07 1.48E+07 7.33E-01 36.3 2.50E+07
15.849 21 1.20E+00 1.27E+04 2.45E+07 1.73E+07 7.06E-01 35.2 3.00E+07
25.121 21 1.40E+00 2.01E+04 2.97E+07 2.01E+07 6.78E-01 34.1 3.59E+07
39.809 21 1.60E+00 3.18E+04 3.57E+07 2.33E+07 6.52E-01 33.1 4.26E+07
50 21 1.70E+00 4.00E+04 3.91E+07 2.49E+07 6.38E-01 32.5 4.63E+07
Table D-4 (Continued)
Frequency temperature Log(Freq) Freq*aT G' G'' Tan δ δ G*
Hz °C Pa Pa deg Pa
Page 226
8/9/2019 Characterization of Warm Mix Asphalt (WMA) Performance in Differe
http://slidepdf.com/reader/full/characterization-of-warm-mix-asphalt-wma-performance-in-differe 226/247
Hz C Pa Pa deg Pa
0.1 29 -1.00E+00 1.00E+01 4.88E+05 6.55E+05 1.34E+00 53.3 8.16E+05
0.158 29 -8.01E-01 1.58E+01 6.56E+05 8.52E+05 1.30E+00 52.4 1.07E+06
0.251 29 -6.00E-01 2.51E+01 8.74E+05 1.10E+06 1.26E+00 51.5 1.40E+06
0.398 29 -4.00E-01 3.98E+01 1.16E+06 1.41E+06 1.21E+00 50.5 1.83E+06
0.631 29 -2.00E-01 6.31E+01 1.53E+06 1.79E+06 1.17E+00 49.5 2.36E+06
1 29 0.00E+00 1.00E+02 2.01E+06 2.27E+06 1.13E+00 48.5 3.03E+06
1.585 29 2.00E-01 1.59E+02 2.61E+06 2.85E+06 1.09E+00 47.5 3.87E+06
2.512 29 4.00E-01 2.51E+02 3.39E+06 3.56E+06 1.05E+00 46.4 4.91E+06
3.981 29 6.00E-01 3.98E+02 4.37E+06 4.42E+06 1.01E+00 45.3 6.21E+06
6.31 29 8.00E-01 6.31E+02 5.59E+06 5.45E+06 9.74E-01 44.2 7.80E+06
10 29 1.00E+00 1.00E+03 7.13E+06 6.66E+06 9.34E-01 43.0 9.76E+06
15.849 29 1.20E+00 1.58E+03 9.01E+06 8.15E+06 9.04E-01 42.1 1.21E+07
25.121 29 1.40E+00 2.51E+03 1.14E+07 9.86E+06 8.67E-01 40.9 1.51E+07
39.809 29 1.60E+00 3.98E+03 1.43E+07 1.19E+07 8.34E-01 39.8 1.86E+07
50 29 1.70E+00 5.00E+03 1.59E+07 1.30E+07 8.17E-01 39.2 2.05E+07
Table D-4 (Continued)
Frequency temperature Log(Freq) Freq*aT G' G'' Tan δ δ G*
Hz °C Pa Pa deg Pa
Page 227
8/9/2019 Characterization of Warm Mix Asphalt (WMA) Performance in Differe
http://slidepdf.com/reader/full/characterization-of-warm-mix-asphalt-wma-performance-in-differe 227/247
Hz C Pa Pa deg Pa
0.1 37 -1.00E+00 1.50E+00 1.15E+05 1.83E+05 1.59E+00 57.8 2.16E+05
0.158 37 -8.01E-01 2.37E+00 1.57E+05 2.44E+05 1.55E+00 57.2 2.90E+05
0.251 37 -6.00E-01 3.77E+00 2.14E+05 3.24E+05 1.52E+00 56.6 3.88E+05
0.398 37 -4.00E-01 5.97E+00 2.90E+05 4.28E+05 1.48E+00 55.9 5.17E+05
0.631 37 -2.00E-01 9.47E+00 3.91E+05 5.63E+05 1.44E+00 55.2 6.85E+05
1 37 0.00E+00 1.50E+01 5.28E+05 7.39E+05 1.40E+00 54.5 9.08E+05
1.585 37 2.00E-01 2.38E+01 7.09E+05 9.63E+05 1.36E+00 53.6 1.20E+06
2.512 37 4.00E-01 3.77E+01 9.51E+05 1.25E+06 1.32E+00 52.8 1.57E+06
3.981 37 6.00E-01 5.97E+01 1.27E+06 1.62E+06 1.27E+00 51.8 2.06E+06
6.31 37 8.00E-01 9.47E+01 1.69E+06 2.07E+06 1.23E+00 50.8 2.67E+06
10 37 1.00E+00 1.50E+02 2.24E+06 2.64E+06 1.18E+00 49.7 3.46E+06
15.849 37 1.20E+00 2.38E+02 2.94E+06 3.36E+06 1.14E+00 48.8 4.46E+06
25.121 37 1.40E+00 3.77E+02 3.86E+06 4.23E+06 1.10E+00 47.7 5.72E+06
39.809 37 1.60E+00 5.97E+02 5.03E+06 5.31E+06 1.06E+00 46.6 7.31E+06
50 37 1.70E+00 7.50E+02 5.72E+06 5.94E+06 1.04E+00 46.1 8.25E+06
Table D-4 (Continued)
Page 228
8/9/2019 Characterization of Warm Mix Asphalt (WMA) Performance in Differe
http://slidepdf.com/reader/full/characterization-of-warm-mix-asphalt-wma-performance-in-differe 228/247
Frequency temperature Log(Freq) Freq*aT G' G'' Tan δ δ G*Hz °C Pa Pa deg Pa
0.1 45.9 -1.00E+00 1.00E-01 1.69E+04 3.30E+04 1.95E+00 62.8 3.70E+04
0.158 46 -8.01E-01 1.58E-01 2.39E+04 4.49E+04 1.88E+00 62.0 5.08E+04
0.251 46 -6.00E-01 2.51E-01 3.26E+04 5.97E+04 1.83E+00 61.4 6.80E+04
0.398 46 -4.00E-01 3.98E-01 4.49E+04 8.06E+04 1.80E+00 60.9 9.23E+04
0.631 46 -2.00E-01 6.31E-01 6.06E+04 1.07E+05 1.77E+00 60.5 1.23E+05
1 46 0.00E+00 1.00E+00 8.11E+04 1.42E+05 1.75E+00 60.2 1.63E+05
1.585 46 2.00E-01 1.59E+00 1.09E+05 1.87E+05 1.73E+00 59.9 2.17E+05
2.512 46 4.00E-01 2.51E+00 1.48E+05 2.52E+05 1.71E+00 59.6 2.92E+053.981 45.8 6.00E-01 3.98E+00 1.99E+05 3.35E+05 1.69E+00 59.4 3.90E+05
6.31 45.8 8.00E-01 6.31E+00 2.69E+05 4.46E+05 1.66E+00 58.9 5.21E+05
10 45.8 1.00E+00 1.00E+01 3.83E+05 6.09E+05 1.59E+00 57.9 7.19E+05
15.849 45.8 1.20E+00 1.58E+01 5.41E+05 8.24E+05 1.52E+00 56.7 9.86E+05
25.121 45.9 1.40E+00 2.51E+01 7.52E+05 1.09E+06 1.46E+00 55.5 1.33E+06
Table D-4 (Continued)
Page 229
8/9/2019 Characterization of Warm Mix Asphalt (WMA) Performance in Differe
http://slidepdf.com/reader/full/characterization-of-warm-mix-asphalt-wma-performance-in-differe 229/247
Frequency temperature Log(Freq) Freq*aT G' G'' Tan δ δ G*Hz °C Pa Pa deg Pa
0.1 58 -1.00E+00 9.00E-03 1.95E+03 5.71E+03 2.93E+00 71.1 6.04E+03
0.158 58 -8.01E-01 1.42E-02 3.04E+03 8.10E+03 2.67E+00 69.5 8.65E+03
0.251 58 -6.00E-01 2.26E-02 4.62E+03 1.14E+04 2.47E+00 67.9 1.23E+04
0.398 58 -4.00E-01 3.58E-02 6.77E+03 1.57E+04 2.32E+00 66.7 1.71E+04
0.631 58 -2.00E-01 5.68E-02 9.91E+03 2.18E+04 2.20E+00 65.5 2.39E+04
1 58 0.00E+00 9.00E-02 1.41E+04 2.98E+04 2.11E+00 64.6 3.29E+04
1.585 58 2.00E-01 1.43E-01 2.00E+04 4.09E+04 2.04E+00 63.9 4.55E+04
2.512 58 4.00E-01 2.26E-01 2.80E+04 5.57E+04 1.99E+00 63.3 6.23E+043.981 58 6.00E-01 3.58E-01 3.86E+04 7.54E+04 1.95E+00 62.9 8.47E+04
6.31 58 8.00E-01 5.68E-01 5.32E+04 1.02E+05 1.92E+00 62.6 1.15E+05
10 58 1.00E+00 9.00E-01 7.25E+04 1.38E+05 1.90E+00 62.3 1.56E+05
15.849 58 1.20E+00 1.43E+00 9.91E+04 1.86E+05 1.88E+00 62.0 2.11E+05
25.121 58 1.40E+00 2.26E+00 1.34E+05 2.49E+05 1.86E+00 61.7 2.83E+05
Table D-4 (Continued)
Page 230
8/9/2019 Characterization of Warm Mix Asphalt (WMA) Performance in Differe
http://slidepdf.com/reader/full/characterization-of-warm-mix-asphalt-wma-performance-in-differe 230/247
Frequency temperature Log(Freq) Freq*aT G' G'' Tan δ δ G*
Hz °C Pa Pa deg Pa
0.1 69.9 -1.00E+00 1.00E-03 1.61E+02 9.79E+02 6.10E+00 80.7 9.92E+02
0.158 70.1 -8.01E-01 1.58E-03 2.85E+02 1.47E+03 5.17E+00 79.1 1.50E+03
0.251 69.9 -6.00E-01 2.51E-03 4.82E+02 2.16E+03 4.49E+00 77.4 2.22E+03
0.398 69.9 -4.00E-01 3.98E-03 8.13E+02 3.19E+03 3.93E+00 75.7 3.29E+03
0.631 70 -2.00E-01 6.31E-03 1.32E+03 4.62E+03 3.50E+00 74.0 4.81E+03
1 70 0.00E+00 1.00E-02 2.11E+03 6.66E+03 3.15E+00 72.4 6.98E+03
1.585 70 2.00E-01 1.59E-02 3.30E+03 9.47E+03 2.87E+00 70.8 1.00E+04
2.512 70 4.00E-01 2.51E-02 5.00E+03 1.33E+04 2.66E+00 69.4 1.42E+04
3.981 70 6.00E-01 3.98E-02 7.46E+03 1.86E+04 2.50E+00 68.2 2.01E+04
6.31 70 8.00E-01 6.31E-02 1.09E+04 2.60E+04 2.37E+00 67.1 2.82E+04
10 70 1.00E+00 1.00E-01 1.58E+04 3.60E+04 2.28E+00 66.3 3.94E+04
15.849 70.1 1.20E+00 1.58E-01 2.26E+04 5.00E+04 2.21E+00 65.6 5.49E+04
25.121 70.1 1.40E+00 2.51E-01 3.21E+04 6.91E+04 2.15E+00 65.1 7.62E+04
Page 231
8/9/2019 Characterization of Warm Mix Asphalt (WMA) Performance in Differe
http://slidepdf.com/reader/full/characterization-of-warm-mix-asphalt-wma-performance-in-differe 231/247
Page 232
8/9/2019 Characterization of Warm Mix Asphalt (WMA) Performance in Differe
http://slidepdf.com/reader/full/characterization-of-warm-mix-asphalt-wma-performance-in-differe 232/247
Table D-5 (Continued)
Frequency temperature Log(Freq) Freq*aT G' G'' Tan δ δ G*
Page 233
8/9/2019 Characterization of Warm Mix Asphalt (WMA) Performance in Differe
http://slidepdf.com/reader/full/characterization-of-warm-mix-asphalt-wma-performance-in-differe 233/247
Hz °C Pa Pa deg Pa0.1 21 -1.00E+00 1.20E+02 1.95E+06 2.23E+06 1.14 48.7 2.96E+06
0.158 21 -8.01E-01 1.90E+02 2.58E+06 2.81E+06 1.09 47.4 3.82E+06
0.251 21 -6.00E-01 3.01E+02 3.35E+06 3.50E+06 1.04 46.2 4.84E+06
0.398 21 -4.00E-01 4.78E+02 4.33E+06 4.32E+06 1.00 45.0 6.11E+06
0.631 21 -2.00E-01 7.57E+02 5.54E+06 5.30E+06 0.96 43.8 7.66E+06
1 21 0.00E+00 1.20E+03 7.04E+06 6.47E+06 0.92 42.6 9.56E+06
1.585 21 2.00E-01 1.90E+03 8.89E+06 7.83E+06 0.88 41.4 1.18E+07
2.512 21 4.00E-01 3.01E+03 1.11E+07 9.43E+06 0.85 40.3 1.46E+07
3.981 21 6.00E-01 4.78E+03 1.39E+07 1.13E+07 0.81 39.1 1.79E+076.31 21 8.00E-01 7.57E+03 1.71E+07 1.34E+07 0.78 38.0 2.17E+07
10 21 1.00E+00 1.20E+04 2.10E+07 1.58E+07 0.75 37.0 2.63E+07
15.849 21 1.20E+00 1.90E+04 2.57E+07 1.85E+07 0.72 35.9 3.17E+07
25.121 21 1.40E+00 3.01E+04 3.12E+07 2.16E+07 0.69 34.7 3.79E+07
39.809 21 1.60E+00 4.78E+04 3.76E+07 2.50E+07 0.67 33.6 4.52E+07
50 21 1.70E+00 6.00E+04 4.12E+07 2.69E+07 0.65 33.1 4.92E+07
Table D-5 (Continued)
Frequency temperature Log(Freq) Freq*aT G' G'' Tan δ δ G*
Hz °C Pa Pa deg Pa
Page 234
8/9/2019 Characterization of Warm Mix Asphalt (WMA) Performance in Differe
http://slidepdf.com/reader/full/characterization-of-warm-mix-asphalt-wma-performance-in-differe 234/247
0.1 29 -1.00E+00 1.53E+01 4.27E+05 6.24E+05 1.46 55.6 7.56E+05
0.158 29 -8.01E-01 2.42E+01 5.85E+05 8.20E+05 1.40 54.5 1.01E+06
0.251 29 -6.00E-01 3.84E+01 7.92E+05 1.07E+06 1.35 53.4 1.33E+06
0.398 29 -4.00E-01 6.08E+01 1.06E+06 1.38E+06 1.29 52.3 1.74E+06
0.631 29 -2.00E-01 9.65E+01 1.42E+06 1.77E+06 1.24 51.2 2.27E+06
1 29 0.00E+00 1.53E+02 1.89E+06 2.26E+06 1.19 50.1 2.94E+06
1.585 29 2.00E-01 2.42E+02 2.49E+06 2.85E+06 1.15 48.9 3.79E+06
2.512 29 4.00E-01 3.84E+02 3.26E+06 3.59E+06 1.10 47.7 4.85E+06
3.981 29 6.00E-01 6.09E+02 4.24E+06 4.49E+06 1.06 46.6 6.18E+06
6.31 29 8.00E-01 9.65E+02 5.48E+06 5.57E+06 1.02 45.5 7.82E+06
10 29 1.00E+00 1.53E+03 7.05E+06 6.87E+06 0.97 44.3 9.85E+06
15.849 29 1.20E+00 2.42E+03 8.99E+06 8.40E+06 0.94 43.1 1.23E+07
25.121 29 1.40E+00 3.84E+03 1.14E+07 1.02E+07 0.90 41.9 1.53E+07
39.809 29 1.60E+00 6.09E+03 1.43E+07 1.24E+07 0.86 40.8 1.89E+07
50 29 1.70E+00 7.64E+03 1.60E+07 1.35E+07 0.85 40.2 2.10E+07
Table D-5 (Continued)
Frequency temperature Log(Freq) Freq*aT G' G'' Tan δ δ G*
Hz °C Pa Pa deg Pa
0.1 37 -1.00E+00 1.80E+00 8.95E+04 1.66E+05 1.85 61.6 1.88E+05
Page 235
8/9/2019 Characterization of Warm Mix Asphalt (WMA) Performance in Differe
http://slidepdf.com/reader/full/characterization-of-warm-mix-asphalt-wma-performance-in-differe 235/247
0.158 37 -8.01E-01 2.84E+00 1.27E+05 2.25E+05 1.77 60.6 2.59E+050.251 37 -6.00E-01 4.52E+00 1.77E+05 3.01E+05 1.70 59.6 3.49E+05
0.398 37 -4.00E-01 7.16E+00 2.46E+05 4.02E+05 1.64 58.6 4.71E+05
0.631 37 -2.00E-01 1.14E+01 3.41E+05 5.37E+05 1.58 57.6 6.36E+05
1 37 0.00E+00 1.80E+01 4.68E+05 7.10E+05 1.52 56.6 8.51E+05
1.585 37 2.00E-01 2.85E+01 6.40E+05 9.35E+05 1.46 55.6 1.13E+06
2.512 37 4.00E-01 4.52E+01 8.70E+05 1.22E+06 1.41 54.6 1.50E+06
3.981 37 6.00E-01 7.17E+01 1.18E+06 1.60E+06 1.35 53.5 1.98E+06
6.31 37 8.00E-01 1.14E+02 1.59E+06 2.07E+06 1.30 52.5 2.61E+06
10 37 1.00E+00 1.80E+02 2.12E+06 2.65E+06 1.25 51.4 3.39E+0615.849 37 1.20E+00 2.85E+02 2.82E+06 3.38E+06 1.20 50.2 4.40E+06
25.121 37 1.40E+00 4.52E+02 3.73E+06 4.29E+06 1.15 49.0 5.68E+06
39.809 37 1.60E+00 7.17E+02 4.90E+06 5.41E+06 1.10 47.8 7.30E+06
50 37 1.70E+00 9.00E+02 5.60E+06 6.06E+06 1.08 47.3 8.25E+06
Table D-5 (Continued)
( ) * *
Page 236
8/9/2019 Characterization of Warm Mix Asphalt (WMA) Performance in Differe
http://slidepdf.com/reader/full/characterization-of-warm-mix-asphalt-wma-performance-in-differe 236/247
Frequency temperature Log(Freq) Freq*aT G' G'' Tanδ δ G*
Hz °C Pa Pa deg Pa
0.1 45.9 -1.00E+00 1.00E-01 8.42E+03 2.43E+04 2.89 70.9 2.58E+04
0.158 46 -8.01E-01 1.58E-01 1.27E+04 3.41E+04 2.69 69.6 3.64E+04
0.251 46 -6.00E-01 2.51E-01 1.89E+04 4.77E+04 2.53 68.4 5.13E+04
0.398 46 -4.00E-01 3.98E-01 2.74E+04 6.57E+04 2.40 67.4 7.12E+04
0.631 46 -2.00E-01 6.31E-01 3.92E+04 9.00E+04 2.29 66.4 9.81E+04
1 46 0.00E+00 1.00E+00 5.53E+04 1.22E+05 2.21 65.6 1.34E+05
1.585 46 2.00E-01 1.59E+00 7.70E+04 1.64E+05 2.14 64.9 1.82E+05
2.512 46 4.00E-01 2.51E+00 1.07E+05 2.22E+05 2.07 64.2 2.47E+05
3.981 45.8 6.00E-01 3.98E+00 1.50E+05 3.02E+05 2.01 63.6 3.37E+05
6.31 45.9 8.00E-01 6.31E+00 2.08E+05 4.07E+05 1.96 63.0 4.57E+05
10 45.9 1.00E+00 1.00E+01 3.00E+05 5.60E+05 1.87 61.9 6.35E+05
15.849 46 1.20E+00 1.58E+01 4.40E+05 7.77E+05 1.77 60.5 8.93E+05
25.121 46 1.40E+00 2.51E+01 6.32E+05 1.06E+06 1.67 59.1 1.23E+06
Table D-5 (Continued)
F t t L (F ) F * T G' G'' T δ δ G*
Page 237
8/9/2019 Characterization of Warm Mix Asphalt (WMA) Performance in Differe
http://slidepdf.com/reader/full/characterization-of-warm-mix-asphalt-wma-performance-in-differe 237/247
Frequency temperature Log(Freq) Freq*aT G' G'' Tan δ δ G*Hz °C Pa Pa deg Pa
0.1 58 -1.00E+00 9.00E-03 5.75E+02 3.15E+03 5.47 79.6 3.20E+03
0.158 58 -8.01E-01 1.42E-02 9.86E+02 4.70E+03 4.76 78.1 4.80E+03
0.251 58 -6.00E-01 2.26E-02 1.64E+03 6.92E+03 4.22 76.7 7.11E+03
0.398 58 -4.00E-01 3.58E-02 2.65E+03 1.01E+04 3.80 75.3 1.04E+04
0.631 58 -2.00E-01 5.68E-02 4.22E+03 1.46E+04 3.46 73.9 1.52E+04
1 58 0.00E+00 9.00E-02 6.54E+03 2.09E+04 3.20 72.6 2.19E+04
1.585 58 2.00E-01 1.43E-01 1.00E+04 2.99E+04 2.98 71.5 3.15E+04
2.512 58 4.00E-01 2.26E-01 1.52E+04 4.26E+04 2.80 70.4 4.52E+043.981 58 6.00E-01 3.58E-01 2.24E+04 5.97E+04 2.66 69.4 6.38E+04
6.31 58 8.00E-01 5.68E-01 3.28E+04 8.34E+04 2.54 68.5 8.96E+04
10 58 1.00E+00 9.00E-01 4.72E+04 1.15E+05 2.44 67.7 1.25E+05
15.849 58 1.20E+00 1.43E+00 6.77E+04 1.59E+05 2.35 67.0 1.73E+05
25.121 58 1.40E+00 2.26E+00 9.58E+04 2.18E+05 2.28 66.3 2.38E+05
Table D-5 (Continued)
Frequency temperature Log(Freq) Freq*aT G' G'' Tan δ δ G*
Hz °C Pa Pa deg Pa
Page 238
8/9/2019 Characterization of Warm Mix Asphalt (WMA) Performance in Differe
http://slidepdf.com/reader/full/characterization-of-warm-mix-asphalt-wma-performance-in-differe 238/247
0.1 69.9 -1.00E+00 1.01E-03 3.21E+01 4.38E+02 13.62 85.8 4.39E+02
0.158 70.1 -8.01E-01 1.60E-03 6.20E+01 6.79E+02 10.95 84.8 6.81E+02
0.251 69.9 -6.00E-01 2.54E-03 1.15E+02 1.04E+03 9.04 83.7 1.05E+03
0.398 69.9 -4.00E-01 4.02E-03 2.10E+02 1.60E+03 7.60 82.5 1.61E+03
0.631 70 -2.00E-01 6.37E-03 3.71E+02 2.42E+03 6.52 81.3 2.44E+03
1 70 0.00E+00 1.01E-02 6.39E+02 3.63E+03 5.67 80.0 3.68E+03
1.585 70 2.00E-01 1.60E-02 1.08E+03 5.40E+03 5.01 78.7 5.50E+03
2.512 70 4.00E-01 2.54E-02 1.78E+03 7.98E+03 4.49 77.4 8.17E+03
3.981 70 6.00E-01 4.02E-02 2.87E+03 1.17E+04 4.07 76.2 1.20E+04
6.31 70 8.00E-01 6.37E-02 4.56E+03 1.70E+04 3.74 75.0 1.76E+04
10 70 1.00E+00 1.01E-01 7.12E+03 2.46E+04 3.46 73.9 2.57E+04
15.849 70.1 1.20E+00 1.60E-01 1.10E+04 3.54E+04 3.23 72.8 3.71E+04
25.121 70.1 1.40E+00 2.54E-01 1.66E+04 5.06E+04 3.04 71.8 5.33E+04
Table D-5 (Continued)
Frequency temperature Log(Freq) Freq*aT G' G'' Tan δ δ G*
Hz °C Pa Pa deg Pa
0.1 76 -1.00E+00 4.01E-04 7.48E+00 1.82E+02 24.30 87.6 1.82E+02
0 158 76 8 01E 01 6 33E 04 1 53E+01 2 82E+02 18 45 86 9 2 83E+02
Page 239
8/9/2019 Characterization of Warm Mix Asphalt (WMA) Performance in Differe
http://slidepdf.com/reader/full/characterization-of-warm-mix-asphalt-wma-performance-in-differe 239/247
0.158 76 -8.01E-01 6.33E-04 1.53E+01 2.82E+02 18.45 86.9 2.83E+020.251 75.9 -6.00E-01 1.01E-03 3.07E+01 4.40E+02 14.36 86.0 4.41E+02
0.398 76.1 -4.00E-01 1.60E-03 5.91E+01 6.81E+02 11.53 85.0 6.84E+02
0.631 76 -2.00E-01 2.53E-03 1.10E+02 1.05E+03 9.49 84.0 1.05E+03
1 76 0.00E+00 4.01E-03 1.99E+02 1.59E+03 7.99 82.9 1.61E+03
1.585 76 2.00E-01 6.35E-03 3.56E+02 2.43E+03 6.83 81.7 2.46E+03
2.512 76.1 4.00E-01 1.01E-02 6.17E+02 3.67E+03 5.94 80.4 3.72E+03
3.981 76.1 6.00E-01 1.60E-02 1.04E+03 5.48E+03 5.25 79.2 5.57E+03
6.31 76.1 8.00E-01 2.53E-02 1.73E+03 8.12E+03 4.69 78.0 8.30E+03
10 76.1 1.00E+00 4.01E-02 2.81E+03 1.19E+04 4.25 76.8 1.23E+0415.849 76.1 1.20E+00 6.35E-02 4.49E+03 1.74E+04 3.88 75.6 1.80E+04
25.121 76 1.40E+00 1.01E-01 7.05E+03 2.53E+04 3.58 74.4 2.62E+04
Table D-6 Frequency sweeps data output for PAV-aged Sasobit (F-T) SBS modified binder
Frequency temperature Log(Freq) Freq*aT G' G'' Tan δ δ G*
Hz °C Pa Pa deg Pa
Page 240
8/9/2019 Characterization of Warm Mix Asphalt (WMA) Performance in Differe
http://slidepdf.com/reader/full/characterization-of-warm-mix-asphalt-wma-performance-in-differe 240/247
0.1 13 -1.00E+00 1.10E+03 8.91E+06 6.86E+06 7.70E-01 37.6 1.12E+07
0.158 13 -8.01E-01 1.74E+03 1.11E+07 8.18E+06 7.37E-01 36.4 1.38E+07
0.251 13 -6.00E-01 2.76E+03 1.34E+07 9.54E+06 7.10E-01 35.4 1.65E+07
0.398 13.1 -4.00E-01 4.38E+03 1.63E+07 1.11E+07 6.84E-01 34.3 1.97E+07
0.631 13.1 -2.00E-01 6.94E+03 1.96E+07 1.29E+07 6.59E-01 33.4 2.34E+07
1 13 0.00E+00 1.10E+04 2.34E+07 1.48E+07 6.35E-01 32.4 2.77E+07
1.585 13 2.00E-01 1.74E+04 2.78E+07 1.70E+07 6.13E-01 31.5 3.26E+07
2.512 13 4.00E-01 2.76E+04 3.29E+07 1.95E+07 5.92E-01 30.6 3.82E+07
3.981 13 6.00E-01 4.38E+04 3.87E+07 2.21E+07 5.71E-01 29.7 4.46E+07
6.31 13 8.00E-01 6.94E+04 4.53E+07 2.50E+07 5.53E-01 28.9 5.17E+07
10 13 1.00E+00 1.10E+05 5.28E+07 2.82E+07 5.35E-01 28.1 5.99E+07
15.849 13 1.20E+00 1.74E+05 6.15E+07 3.15E+07 5.12E-01 27.1 6.90E+07
25.121 13 1.40E+00 2.76E+05 7.09E+07 3.52E+07 4.96E-01 26.4 7.92E+07
39.809 13 1.60E+00 4.38E+05 8.17E+07 3.89E+07 4.77E-01 25.5 9.05E+07
50 13 1.70E+00 5.50E+05 8.72E+07 4.06E+07 4.66E-01 25.0 9.62E+07
Table D-6 (Continued)
Frequency temperature Log(Freq) Freq*aT G' G'' Tan δ δ G*
Hz °C Pa Pa deg Pa
Page 241
8/9/2019 Characterization of Warm Mix Asphalt (WMA) Performance in Differe
http://slidepdf.com/reader/full/characterization-of-warm-mix-asphalt-wma-performance-in-differe 241/247
0.1 21 -1.00E+00 1.10E+02 2.61E+06 2.54E+06 9.72E-01 44.2 3.64E+06
0.158 21 -8.01E-01 1.74E+02 3.34E+06 3.14E+06 9.38E-01 43.2 4.58E+06
0.251 21 -6.00E-01 2.76E+02 4.23E+06 3.83E+06 9.06E-01 42.2 5.71E+06
0.398 21 -4.00E-01 4.38E+02 5.32E+06 4.65E+06 8.75E-01 41.2 7.07E+06
0.631 21 -2.00E-01 6.94E+02 6.64E+06 5.61E+06 8.46E-01 40.2 8.69E+06
1 21 0.00E+00 1.10E+03 8.24E+06 6.73E+06 8.17E-01 39.2 1.06E+07
1.585 21 2.00E-01 1.74E+03 1.02E+07 8.02E+06 7.90E-01 38.3 1.29E+07
2.512 21 4.00E-01 2.76E+03 1.25E+07 9.50E+06 7.62E-01 37.3 1.57E+07
3.981 21 6.00E-01 4.38E+03 1.52E+07 1.12E+07 7.35E-01 36.3 1.89E+07
6.31 21 8.00E-01 6.94E+03 1.86E+07 1.32E+07 7.08E-01 35.3 2.28E+07
10 21 1.00E+00 1.10E+04 2.24E+07 1.54E+07 6.86E-01 34.4 2.72E+07
15.849 21 1.20E+00 1.74E+04 2.70E+07 1.78E+07 6.59E-01 33.4 3.23E+07
25.121 21 1.40E+00 2.76E+04 3.23E+07 2.05E+07 6.36E-01 32.4 3.82E+07
39.809 21 1.60E+00 4.38E+04 3.84E+07 2.36E+07 6.13E-01 31.5 4.51E+07
50 21 1.70E+00 5.50E+04 4.18E+07 2.52E+07 6.03E-01 31.1 4.88E+07
Table D-6 (Continued)
Frequency temperature Log(Freq) Freq*aT G' G'' Tan δ δ G*
Hz °C Pa Pa deg Pa
0 1 29 1 00E 00 1 53E 01 7 24E 05 8 69E 05 1 20E 00 50 2 1 13E 06
Page 242
8/9/2019 Characterization of Warm Mix Asphalt (WMA) Performance in Differe
http://slidepdf.com/reader/full/characterization-of-warm-mix-asphalt-wma-performance-in-differe 242/247
0.1 29 -1.00E+00 1.53E+01 7.24E+05 8.69E+05 1.20E+00 50.2 1.13E+06
0.158 29 -8.01E-01 2.42E+01 9.56E+05 1.11E+06 1.17E+00 49.4 1.47E+06
0.251 29 -6.00E-01 3.84E+01 1.25E+06 1.42E+06 1.13E+00 48.6 1.89E+06
0.398 29 -4.00E-01 6.08E+01 1.63E+06 1.79E+06 1.10E+00 47.7 2.42E+06
0.631 29 -2.00E-01 9.65E+01 2.11E+06 2.25E+06 1.07E+00 46.8 3.08E+06
1 29 0.00E+00 1.53E+02 2.72E+06 2.81E+06 1.03E+00 45.9 3.91E+06
1.585 29 2.00E-01 2.42E+02 3.50E+06 3.48E+06 9.96E-01 44.9 4.93E+06
2.512 29 4.00E-01 3.84E+02 4.46E+06 4.30E+06 9.62E-01 43.9 6.20E+06
3.981 29 6.00E-01 6.09E+02 5.68E+06 5.27E+06 9.28E-01 42.8 7.75E+06
6.31 29 8.00E-01 9.65E+02 7.18E+06 6.44E+06 8.97E-01 41.9 9.64E+06
10 29 1.00E+00 1.53E+03 9.00E+06 7.77E+06 8.64E-01 40.8 1.19E+07
15.849 29 1.20E+00 2.42E+03 1.12E+07 9.36E+06 8.33E-01 39.8 1.46E+07
25.121 29 1.40E+00 3.84E+03 1.39E+07 1.12E+07 8.03E-01 38.7 1.79E+07
39.809 29 1.60E+00 6.09E+03 1.72E+07 1.34E+07 7.74E-01 37.7 2.18E+07
50 29 1.70E+00 7.64E+03 1.91E+07 1.45E+07 7.59E-01 37.2 2.40E+07
Table D-6 (Continued)
Frequency temperature Log(Freq) Freq*aT G' G'' Tan δ δ G*
Hz °C Pa Pa deg Pa
0.1 37 -1.00E+00 2.00E+00 1.95E+05 2.78E+05 1.42E+00 54.9 3.40E+05
0 158 37 8 01E 01 3 16E+00 2 65E+05 3 67E+05 1 38E+00 54 2 4 53E+05
Page 243
8/9/2019 Characterization of Warm Mix Asphalt (WMA) Performance in Differe
http://slidepdf.com/reader/full/characterization-of-warm-mix-asphalt-wma-performance-in-differe 243/247
0.158 37 -8.01E-01 3.16E+00 2.65E+05 3.67E+05 1.38E+00 54.2 4.53E+050.251 37 -6.00E-01 5.02E+00 3.56E+05 4.81E+05 1.35E+00 53.5 5.98E+05
0.398 37 -4.00E-01 7.96E+00 4.74E+05 6.25E+05 1.32E+00 52.9 7.85E+05
0.631 37 -2.00E-01 1.26E+01 6.28E+05 8.08E+05 1.29E+00 52.2 1.02E+06
1 37 0.00E+00 2.00E+01 8.33E+05 1.04E+06 1.25E+00 51.4 1.34E+06
1.585 37 2.00E-01 3.17E+01 1.10E+06 1.34E+06 1.22E+00 50.6 1.73E+06
2.512 37 4.00E-01 5.02E+01 1.45E+06 1.71E+06 1.18E+00 49.7 2.25E+06
3.981 37 6.00E-01 7.96E+01 1.90E+06 2.17E+06 1.14E+00 48.9 2.89E+06
6.31 37 8.00E-01 1.26E+02 2.48E+06 2.75E+06 1.11E+00 47.9 3.70E+06
10 37 1.00E+00 2.00E+02 3.22E+06 3.45E+06 1.07E+00 47.0 4.72E+0615.849 37 1.20E+00 3.17E+02 4.15E+06 4.30E+06 1.04E+00 46.0 5.98E+06
25.121 37 1.40E+00 5.02E+02 5.35E+06 5.34E+06 9.98E-01 44.9 7.56E+06
39.809 37 1.60E+00 7.96E+02 6.86E+06 6.60E+06 9.63E-01 43.9 9.52E+06
50 37 1.70E+00 1.00E+03 7.74E+06 7.34E+06 9.48E-01 43.5 1.07E+07
Table D-6 (Continued)
Frequency temperature Log(Freq) Freq*aT G' G'' Tan δ δ G*
Page 244
8/9/2019 Characterization of Warm Mix Asphalt (WMA) Performance in Differe
http://slidepdf.com/reader/full/characterization-of-warm-mix-asphalt-wma-performance-in-differe 244/247
Frequency temperature Log(Freq) Freq aT G G Tan δ δ GHz °C Pa Pa deg Pa
0.1 45.9 -1.00E+00 1.00E-01 2.69E+04 4.81E+04 1.79E+00 60.8 5.51E+04
0.158 46 -8.01E-01 1.58E-01 3.67E+04 6.36E+04 1.73E+00 60.0 7.34E+04
0.251 46 -6.00E-01 2.51E-01 4.96E+04 8.37E+04 1.69E+00 59.4 9.73E+04
0.398 46 -4.00E-01 3.98E-01 6.61E+04 1.10E+05 1.66E+00 58.9 1.28E+05
0.631 46 -2.00E-01 6.31E-01 8.75E+04 1.43E+05 1.63E+00 58.5 1.68E+05
1 46 0.00E+00 1.00E+00 1.15E+05 1.85E+05 1.61E+00 58.2 2.18E+05
1.585 46 2.00E-01 1.59E+00 1.58E+05 2.52E+05 1.59E+00 57.9 2.98E+05
2.512 46 4.00E-01 2.51E+00 2.06E+05 3.26E+05 1.58E+00 57.7 3.86E+053.981 45.8 6.00E-01 3.98E+00 2.71E+05 4.22E+05 1.56E+00 57.3 5.01E+05
6.31 45.9 8.00E-01 6.31E+00 3.75E+05 5.65E+05 1.51E+00 56.4 6.78E+05
10 45.9 1.00E+00 1.00E+01 5.21E+05 7.56E+05 1.45E+00 55.4 9.18E+05
15.849 46 1.20E+00 1.58E+01 7.21E+05 1.00E+06 1.39E+00 54.3 1.24E+06
25.121 45.9 1.40E+00 2.51E+01 9.82E+05 1.31E+06 1.34E+00 53.2 1.64E+06
Table D-6 (Continued)
Frequency temperature Log(Freq) Freq*aT G' G'' Tan δ δ G*
Page 245
8/9/2019 Characterization of Warm Mix Asphalt (WMA) Performance in Differe
http://slidepdf.com/reader/full/characterization-of-warm-mix-asphalt-wma-performance-in-differe 245/247
Frequency temperature Log(Freq) Freq aT G G Tan δ δ GHz °C Pa Pa deg Pa
0.1 58 -1.00E+00 9.00E-03 3.30E+03 8.55E+03 2.59E+00 68.9 9.17E+03
0.158 58 -8.01E-01 1.42E-02 5.03E+03 1.20E+04 2.38E+00 67.2 1.30E+04
0.251 58 -6.00E-01 2.26E-02 7.46E+03 1.66E+04 2.22E+00 65.8 1.82E+04
0.398 58 -4.00E-01 3.58E-02 1.08E+04 2.26E+04 2.10E+00 64.5 2.50E+04
0.631 58 -2.00E-01 5.68E-02 1.54E+04 3.07E+04 2.00E+00 63.4 3.43E+04
1 58 0.00E+00 9.00E-02 2.16E+04 4.15E+04 1.92E+00 62.5 4.68E+04
1.585 58 2.00E-01 1.43E-01 3.00E+04 5.60E+04 1.87E+00 61.8 6.35E+04
2.512 58 4.00E-01 2.26E-01 4.10E+04 7.48E+04 1.83E+00 61.3 8.53E+043.981 58 6.00E-01 3.58E-01 5.56E+04 9.99E+04 1.79E+00 60.9 1.14E+05
6.31 58 8.00E-01 5.68E-01 7.50E+04 1.33E+05 1.77E+00 60.6 1.53E+05
10 58 1.00E+00 9.00E-01 1.01E+05 1.76E+05 1.75E+00 60.3 2.03E+05
15.849 58 1.20E+00 1.43E+00 1.35E+05 2.33E+05 1.73E+00 60.0 2.69E+05
25.121 58 1.40E+00 2.26E+00 1.79E+05 3.07E+05 1.71E+00 59.7 3.55E+05
Table D-6 (Continued)
Page 246
8/9/2019 Characterization of Warm Mix Asphalt (WMA) Performance in Differe
http://slidepdf.com/reader/full/characterization-of-warm-mix-asphalt-wma-performance-in-differe 246/247
Frequency temperature Log(Freq) Freq*aT G' G'' Tan δ δ G*
Hz °C Pa Pa deg Pa
0.1 69.9 -1.00E+00 9.00E-04 2.20E+02 1.16E+03 5.26E+00 79.2 1.18E+03
0.158 70.1 -8.01E-01 1.42E-03 3.98E+02 1.81E+03 4.55E+00 77.6 1.85E+03
0.251 69.9 -6.00E-01 2.26E-03 6.80E+02 2.72E+03 3.99E+00 75.9 2.80E+03
0.398 69.9 -4.00E-01 3.58E-03 1.12E+03 3.97E+03 3.54E+00 74.2 4.13E+03
0.631 70 -2.00E-01 5.68E-03 1.81E+03 5.73E+03 3.17E+00 72.5 6.01E+03
1 70 0.00E+00 9.00E-03 2.82E+03 8.12E+03 2.88E+00 70.9 8.59E+03
1.585 70 2.00E-01 1.43E-02 4.32E+03 1.14E+04 2.64E+00 69.3 1.22E+04
2.512 70 4.00E-01 2.26E-02 6.47E+03 1.59E+04 2.46E+00 67.9 1.72E+04
3.981 70 6.00E-01 3.58E-02 9.48E+03 2.20E+04 2.32E+00 66.7 2.39E+04
6.31 70 8.00E-01 5.68E-02 1.37E+04 3.02E+04 2.21E+00 65.6 3.32E+04
10 70 1.00E+00 9.00E-02 1.95E+04 4.14E+04 2.13E+00 64.8 4.58E+04
15.849 70.1 1.20E+00 1.43E-01 2.73E+04 5.65E+04 2.07E+00 64.2 6.28E+04
25.121 70.1 1.40E+00 2.26E-01 3.79E+04 7.68E+04 2.03E+00 63.7 8.56E+04
Table D-6 (Continued)
Frequency temperature Log(Freq) Freq*aT G' G'' Tan δ δ G*
Page 247
8/9/2019 Characterization of Warm Mix Asphalt (WMA) Performance in Differe
http://slidepdf.com/reader/full/characterization-of-warm-mix-asphalt-wma-performance-in-differe 247/247
Frequency temperature Log(Freq) Freq aT G G Tan δ δ GHz °C Pa Pa deg Pa
0.1 76 -1.00E+00 3.50E-04 6.18E+01 5.39E+02 8.72E+00 83.5 5.43E+02
0.158 76 -8.01E-01 5.53E-04 1.15E+02 8.29E+02 7.24E+00 82.1 8.37E+02
0.251 75.9 -6.00E-01 8.79E-04 2.04E+02 1.24E+03 6.09E+00 80.7 1.26E+03
0.398 76.1 -4.00E-01 1.39E-03 3.60E+02 1.86E+03 5.17E+00 79.1 1.90E+03
0.631 76 -2.00E-01 2.21E-03 6.16E+02 2.75E+03 4.46E+00 77.4 2.82E+03
1 76 0.00E+00 3.50E-03 1.05E+03 4.06E+03 3.88E+00 75.5 4.20E+03
1.585 76 2.00E-01 5.55E-03 1.69E+03 5.82E+03 3.45E+00 73.8 6.06E+03
2.512 76.1 4.00E-01 8.79E-03 2.67E+03 8.28E+03 3.10E+00 72.1 8.70E+033.981 76.1 6.00E-01 1.39E-02 4.15E+03 1.17E+04 2.82E+00 70.5 1.24E+04
6.31 76.1 8.00E-01 2.21E-02 6.31E+03 1.64E+04 2.60E+00 68.9 1.76E+04
10 76.1 1.00E+00 3.50E-02 9.36E+03 2.28E+04 2.43E+00 67.6 2.46E+04
15.849 76.1 1.20E+00 5.55E-02 1.37E+04 3.15E+04 2.30E+00 66.5 3.44E+04
25.121 76 1.40E+00 8.79E-02 1.96E+04 4.33E+04 2.20E+00 65.6 4.76E+04