40
Characterizing Audience and Traffic Flow at Pier 39 and the Ferry Building Front End Evaluation Lisa Sindorf and Toni Dancu August 11, 2011

Characterizing Audience and Traffic Flow at Pier 39 and the Ferry Building
Front End Evaluation Lisa Sindorf and Toni Dancu
August 11, 2011

Characterizing Audience and Traffic Flow at Pier 39 and the Ferry Building
Exploratorium Visitor Research and Evaluation -2- www.exploratorium.edu
Table of Contents
Overall Background and Goals ...................................................................................................... 3 Executive Summary: .......................................................................................................................... 5
PIER 39 STUDY ................................................................................................................................ 7 Background for Pier 39 .................................................................................................................... 7 Methods for Pier 39 traffic flow study ......................................................................................... 9 Findings for Pier 39 traffic flow study ....................................................................................... 11 Methods for Pier 39 Crowds and Activities study ................................................................. 17 Findings for Pier 39 crowds and activities study: ................................................................. 18
FERRY BUILDING STUDY ............................................................................................................... 23 Background for Ferry Building .................................................................................................... 23 Methods for Ferry Building traffic flow study ........................................................................ 24 Findings for Ferry Building traffic flow study ........................................................................ 26 Methods for Ferry Building crowds and activities study: ................................................... 30 Findings for Ferry Building crowds and activities study: ................................................... 31
PIER 7 STUDY ............................................................................................................................... 34 Background for Pier 7 ..................................................................................................................... 34 Methods for Pier 7 ............................................................................................................................ 34 Findings for Pier 7 traffic flow study ......................................................................................... 35
OTHER REFLECTIONS ON TRAFFIC AT THE PIERS ........................................................................ 38 Limitations: ........................................................................................................................................ 40 Appendix ............................................................................................................................................. 40

Characterizing Audience and Traffic Flow at Pier 39 and the Ferry Building
Exploratorium Visitor Research and Evaluation -3- www.exploratorium.edu
Characterizing Audience and Traffic Flow
at Pier 39 and the Ferry Building
Overall Background and Goals
The Exploratorium will soon be moving to a new location at Pier 17. In the coming months, the Outdoor gallery will be developing new exhibits for the exterior of the new building, and determining their placement along our Bay View Walk and Civic Plaza. To inform our choices, we will need an idea of the audience and traffic flow that is typical of the new location. Although Pier 17 is currently under construction and therefore inaccessible for research, we determined that Pier 39 and the Ferry Building were good substitutes. We also include results from a similar study conducted by the Observatory at Pier 7. Map of the area
The future location of the Exploratorium (Pier 15 and 17), with Pier 39 to the northwest and Pier 7 and the Ferry Building to the southeast.
Pier 39
Pier 15 and 17
Ferry Building
Pier 7
Characterizing Audience and Traffic Flow at Pier 39 and the Ferry Building
Exploratorium Visitor Research and Evaluation -4- www.exploratorium.edu
This investigation will look at:
• How many people are in the area, either stationary or moving? • Where are people concentrated? What areas are empty? How do these
crowded/empty areas relate to environmental features? • What direction are people traveling? • What are people doing in the area (eating, walking, jogging,
wayfinding…?) • What are the demographics?
o Age o Gender o Group size
To answer these questions for each location, we conducted two studies. The first study looked at traffic flow at the pier entrances, while the second looked at crowd distribution and activities along the piers. The Observatory’s study at Pier 7 also looked at traffic flow at the pier entrance. While these data will help us understand the traffic flow that we are likely to see at the new building, there will be differences based on the layout and visitor makeup that we cannot capture at these placeholder/substitute locations. We have used these data to extrapolate to potential implications for our sites, based on best guesses and informed hunches. Each location and study will be discussed separately below.

Characterizing Audience and Traffic Flow at Pier 39 and the Ferry Building
Exploratorium Visitor Research and Evaluation -5- www.exploratorium.edu
Executive Summary:
Summary for Pier 39
Pier 39 is a proxy for our Bay View Walk.
• The number of males and females was roughly equal. • Adults strongly outnumbered children. • Groups at Pier 39 tended to be fairly small, with an average of 2.9
people per group. Occasionally we observed large tour groups. • Most of the traffic flowed along the Embarcadero. • Sidewalk traffic was fairly constant throughout the day, with a peak at
lunchtime and another peak in early evening. • The direction of traffic flow did not change much throughout the day. • On the weekend, there was slightly more traffic; groups were slightly
larger; and a few more children were present. • Almost all passers-by along Embarcadero were walking, with a small
minority engaged in other activities. Very few (<1%) were biking or jogging.
• The largest crowds along Pier 39 were standing in the northwest corner, watching the sea lions. The crowds in that corner averaged 111 people per hour.
• The bay views along the back of the pier were not as popular as the sea lions—possibly because of the strong wind and cold temperatures.
• Few people read the informational signs or used the binocular stations.
Summary for Ferry Building
The Ferry Building is a proxy for our Civic Plaza.
• The number of males and females was roughly equal. • Adults strongly outnumbered children. • Groups at the Ferry Building tended to be small, just 1-2 people. • Traffic flowed in a balanced mix of directions. • Traffic peaked in the morning and slowed near the farmer’s market
closing time. • The direction of traffic flow did not change much throughout the day. • Crowds were dense, but evenly distributed along the pier. • Slightly more people gathered in areas with more food carts and street
performers (the entrance and far end) than in emptier areas (the middle section).
• Food is the main attraction here. Aside from walking, the main activities were standing in line (to buy food) or sitting (to eat food).

Characterizing Audience and Traffic Flow at Pier 39 and the Ferry Building
Exploratorium Visitor Research and Evaluation -6- www.exploratorium.edu
• The most crowded area, the back end of the pier, had an average of 214 people per hour.
• Few people (<2%) were biking or jogging, probably due to the dense crowds.
• Despite the bay views, few people (<1%) took photos.
Summary for Pier 7
Pier 7 is a proxy for our Civic Plaza.
• Males slightly outnumbered females. • Adults strongly outnumbered children. • The most common activity was walking; A few people were jogging
(11%) or biking (7%). • Most of the traffic flowed along the Embarcadero. • Sidewalk traffic was fairly constant throughout the day, with a peak at
lunchtime and another peak in early evening. • The direction of traffic flow did not change much throughout the day.

Characterizing Audience and Traffic Flow at Pier 39 and the Ferry Building
Exploratorium Visitor Research and Evaluation -7- www.exploratorium.edu
Pier 39 Study
Background for Pier 39
Pier 39 acted as our proxy for our Bay View walk. We chose the narrow walkway down the side of this pier (rather than the main drag) because it too is at the outer edge of an attractor pier. It offers a view of the water and leads to a popular attraction—the sea lions that rest on a dock near the end of the pier. There is also a sweeping view of the bay and the Golden Gate Bridge at the end of the pier. People visiting this area will comprise part of our future audience as well.
Pier 39 Photo from Flickr user YoNoSoyTu
Characterizing Audience and Traffic Flow at Pier 39 and the Ferry Building
Exploratorium Visitor Research and Evaluation -8- www.exploratorium.edu
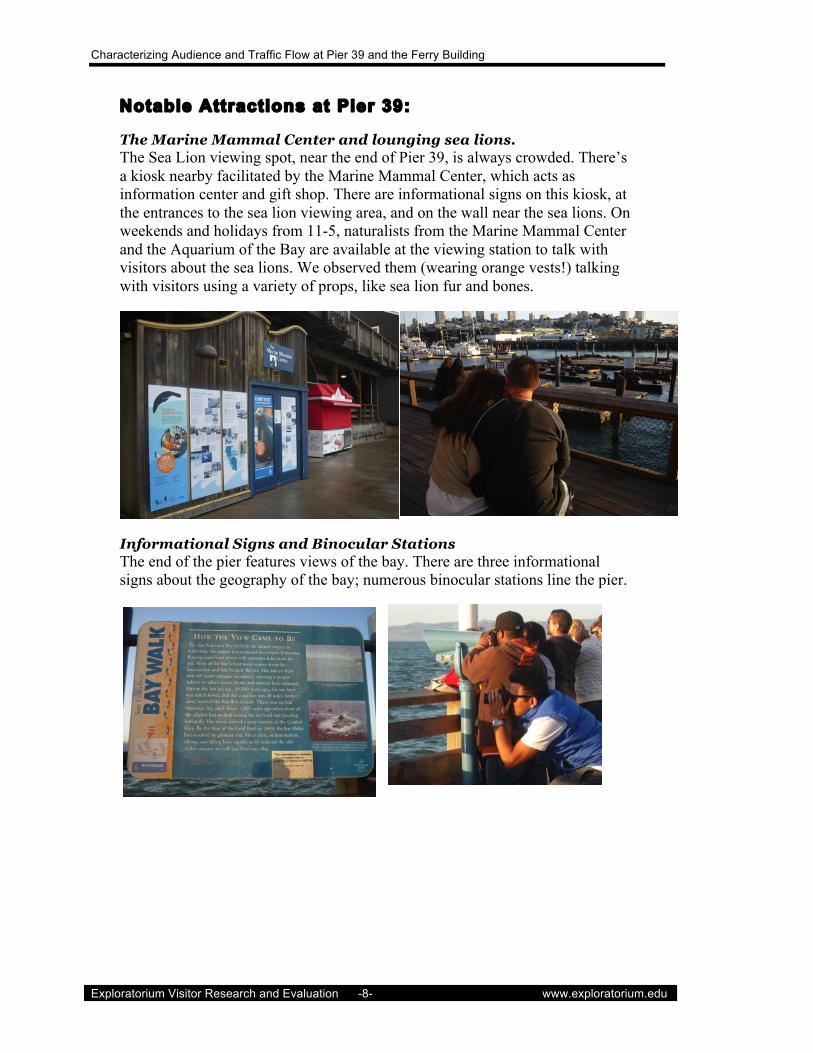
Notable Attractions at Pier 39:
The Marine Mammal Center and lounging sea lions. The Sea Lion viewing spot, near the end of Pier 39, is always crowded. There’s a kiosk nearby facilitated by the Marine Mammal Center, which acts as information center and gift shop. There are informational signs on this kiosk, at the entrances to the sea lion viewing area, and on the wall near the sea lions. On weekends and holidays from 11-5, naturalists from the Marine Mammal Center and the Aquarium of the Bay are available at the viewing station to talk with visitors about the sea lions. We observed them (wearing orange vests!) talking with visitors using a variety of props, like sea lion fur and bones.
Informational Signs and Binocular Stations The end of the pier features views of the bay. There are three informational signs about the geography of the bay; numerous binocular stations line the pier.

Characterizing Audience and Traffic Flow at Pier 39 and the Ferry Building
Exploratorium Visitor Research and Evaluation -9- www.exploratorium.edu
Food Carts There are two food carts on this part of Pier 39, which stock mainly snack items. They are sparsely attended.
Methods for Pier 39 traffic flow study
Observations were carried out at Pier 39 on two weekdays, Friday April 8 and Tuesday April 12, from 9:30 am to 5 pm; two weekend days, Sunday April 10 and Sunday April 17, from 9:30 am to 5 pm; and two evenings, Friday April 15 and Saturday April 30, from 6:30 pm to 8:30 pm.
Weather during the observations was typically clear, but cold and windy, with temperatures in the mid 50s to low 60s.
For the traffic flow part of this study, data collectors stood at the entrance to the pier. Each data collector observed a subset of the possible entrances to the pier and randomly selected every seventh person who crossed an imaginary line to enter the plaza. The person’s direction of travel was recorded, along with their age (adult or child), gender, group size, and activity (walking, jogging, etc).
The diagram below shows the data collection area (dashed white line), the area where data collectors stood (orange circle), and the imaginary (yellow and blue) lines across the pier’s entrances and exits. The blue line represents the entrances/exits watched by one data collector; the yellow lines represent entrances/exits watched by the other data collector.

Characterizing Audience and Traffic Flow at Pier 39 and the Ferry Building
Exploratorium Visitor Research and Evaluation -10- www.exploratorium.edu

Characterizing Audience and Traffic Flow at Pier 39 and the Ferry Building
Exploratorium Visitor Research and Evaluation -11- www.exploratorium.edu
Findings for Pier 39 traffic flow study
Demographics at Pier 39
• A total of 3692 passers-by were selected. • A total of 11, 814 people (selected passers-by and accompanying group
members) were observed.
It should be noted here that due to large volumes of traffic, this number should be considered a minimum, not a maximum estimate.
Gender Percent (total number)
M 49% (1797)
F 51% (1890)
*To be certain these numbers were not significantly different, we conducted a χ2 test of fit, which was not significant. χ2 = 2.35, p = .13.
According to the marketing department’s recent report, Profile of Non-Group Visitors: FY09 and FY10, the current visitor population of the Exploratorium is identical: 49% male and 51% female.
Age Group Percent (total number)
Adult 82% (3020)
Child (<18 years old) 18% (672)
According to the marketing department’s recent report, Profile of Non-Group Visitors: FY09 and FY10, the current visitor population of the Exploratorium is very different: 40% adults only and 60% adults with children.
The number of males and females was roughly equal.
Although Pier 39 might be considered a family attraction, many more of the visitors were
adults without kids.
OE conjecture: It's a good idea to keep creating all-‐ages exhibits, rather than exhibits just for kids, even in the family-‐friendly space.
OE conjecture: OE is charged with creating a family-‐friendly space;
perhaps this should go in the paid space.

Characterizing Audience and Traffic Flow at Pier 39 and the Ferry Building
Exploratorium Visitor Research and Evaluation -12- www.exploratorium.edu
*For group size data, we removed outliers >8, because there were few of these groups, and they skewed the results. To give a sense of the upper end of the range, we observed 28 groups of 11-15, and 45 groups >15. The largest single group, a tour group, had 64 people.
Group Size Number
Total number of people in all groups
11,730
Total number of groups 3,604
Average group size 2.93*
Most common group size 2
*With outliers included, the average group size was 3.2.
**According to Mike Brown, admissions manager, at the Exploratorium, the average general admission party has 3.3 people; for field trip groups, the average is 59 people (adults and children); and for pre-reserved groups it's 36 visitors. The most common group size at the Exploratorium is 2 people.
Groups were fairly small, on average; but these sizes are comparable to the groups we currently see at the museum.**

Characterizing Audience and Traffic Flow at Pier 39 and the Ferry Building
Exploratorium Visitor Research and Evaluation -13- www.exploratorium.edu
Behavior Percent (total number)
Walking 96% (3550)
Biking 2% (67)
Jogging <1% (17)
Wayfinding (looking at map) <1% (6)
Other (skateboarding, rollerblading, riding in stroller, carried)
1% (52)
Almost all passers-‐by along Embarcadero were walking, with a small minority engaged
in other activities.
It may be too crowded for more vigorous activities.
OE conjecture: Counter to our
expectations, it may be unlikely that we'll see a large number of active
visitors.

Characterizing Audience and Traffic Flow at Pier 39 and the Ferry Building
Exploratorium Visitor Research and Evaluation -14- www.exploratorium.edu
Direction of Traffic Flow at Pier 39
*Note: totals for this chart are smaller than for the others—some people stopped and rested within the selection area for so long that their exit direction was not recorded.
Few people entered the pier
from the southwest.
It's likely that many people moving this
direction entered the pier via the main plaza to the south, instead.
OE conjecture: It's unlikely people will start at our Bay Walk, if they pass the entrance to the
Exploratorium Pirst. We might consider a big attractor at the Bay Walk entrance, such as architecture, performance, or mediated
activity.
Most of the trafPic Plowed along the main sidewalk, with a small fraction of people entering or exiting
the pier.
The attractions of sea lions and bay views may not be enough to pull a
large number of people off of the main sidewalk.
OE conjecture: We can expect lots of trafPic in Civic Plaza.
38% (1405)
36% (1338)
9% (314)
11% (397)
3% (117)
2% (86)
OE conjecture: Explainers may want to consider and experiment with this trafPic Plow in regard to Explainer Cart location.

Characterizing Audience and Traffic Flow at Pier 39 and the Ferry Building
Exploratorium Visitor Research and Evaluation -15- www.exploratorium.edu
Time of day, day of the week, and traffic flow at Pier 39
Overall Numbers:
• An average of 109 people were selected every 35 minutes.
*Note: no data were collected between 5:00 PM and 6:40 PM
Weekday vs Weekend:
• Weekday and weekend traffic patterns were the same, with more people on weekends.
• Weekday traffic had 26% fewer people than weekend day traffic.
• On a weekday evening, the traffic had 17% fewer people than weekend evening traffic.
• Group size on weekdays was also slightly smaller (3.05 people on average) than on weekends (3.30 people on average).
• We observed 4% fewer children on weekdays than on weekends.
Weekday and weekend trafPic patterns were the same, with more people on weekends.
OE conjecture: OE may expect similar trafPic patterns, with a few more people on the weekends, but
not much Pluctuation.
Characterizing Audience and Traffic Flow at Pier 39 and the Ferry Building
Exploratorium Visitor Research and Evaluation -16- www.exploratorium.edu
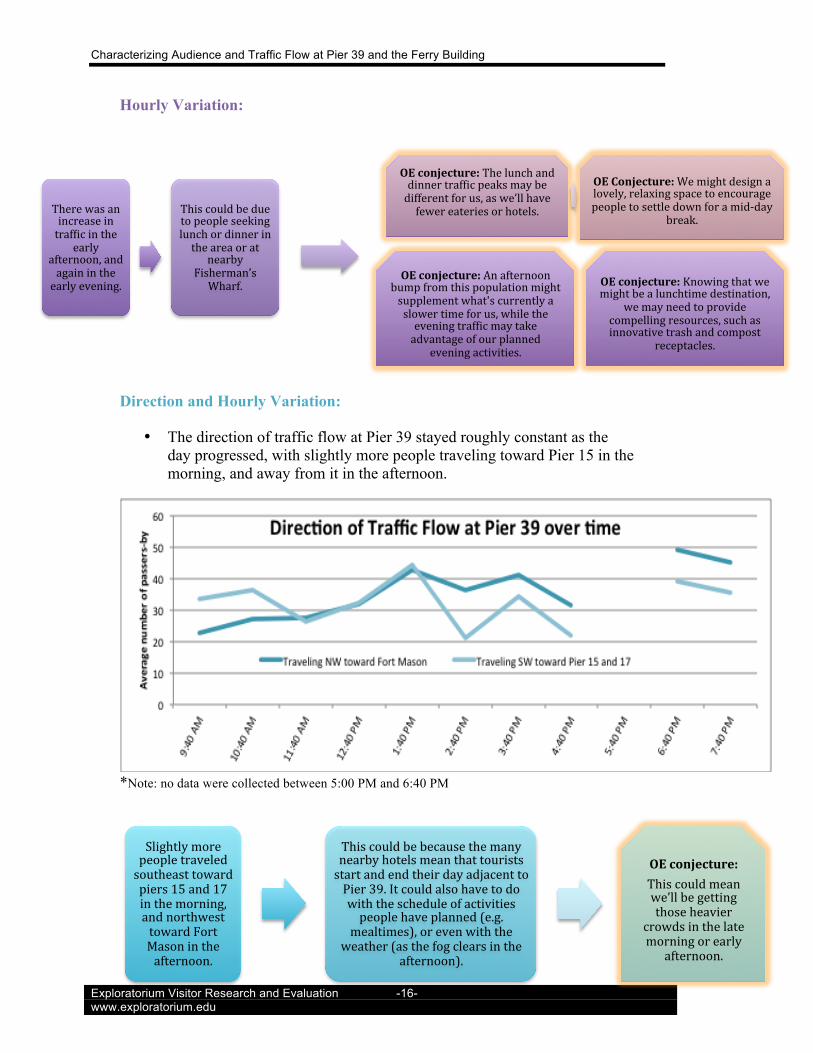
Hourly Variation:
Direction and Hourly Variation:
• The direction of traffic flow at Pier 39 stayed roughly constant as the day progressed, with slightly more people traveling toward Pier 15 in the morning, and away from it in the afternoon.
*Note: no data were collected between 5:00 PM and 6:40 PM
There was an increase in trafPic in the
early afternoon, and again in the early evening.
This could be due to people seeking lunch or dinner in the area or at
nearby Fisherman’s Wharf.
OE conjecture: The lunch and dinner trafPic peaks may be different for us, as we’ll have fewer eateries or hotels.
OE Conjecture: We might design a lovely, relaxing space to encourage people to settle down for a mid-‐day
break.
Slightly more people traveled southeast toward piers 15 and 17 in the morning, and northwest toward Fort Mason in the afternoon.
This could be because the many nearby hotels mean that tourists start and end their day adjacent to Pier 39. It could also have to do with the schedule of activities people have planned (e.g.
mealtimes), or even with the weather (as the fog clears in the
afternoon).
OE conjecture: This could mean we’ll be getting those heavier
crowds in the late morning or early
afternoon.
OE conjecture: An afternoon bump from this population might supplement what's currently a slower time for us, while the evening trafPic may take advantage of our planned
evening activities.
OE conjecture: Knowing that we might be a lunchtime destination,
we may need to provide compelling resources, such as innovative trash and compost
receptacles.

Characterizing Audience and Traffic Flow at Pier 39 and the Ferry Building
Exploratorium Visitor Research and Evaluation -17- www.exploratorium.edu
Methods for Pier 39 crowds and activities study
For this part of the study, both data collectors walked a circuit around the pier once per hour, and recorded the following for each person in the area:
o location (with special attention to people reading signs, sitting on benches, eating at food carts, watching sea lions, or using binocular stations)
o activity (stationary, seated, walking, jogging, biking, wayfinding, taking a photo, other)
Data collectors walked down the center of the pier to the end; one data collector recorded people to the right; the other recorded people to the left. See the diagram below for the path of travel.

Characterizing Audience and Traffic Flow at Pier 39 and the Ferry Building
Exploratorium Visitor Research and Evaluation -18- www.exploratorium.edu
Findings for Pier 39 crowds and activities study:

Characterizing Audience and Traffic Flow at Pier 39 and the Ferry Building
Exploratorium Visitor Research and Evaluation -19- www.exploratorium.edu
Number and location of crowds at Pier 39:
• We observed an average of 260 people per hour. • The largest crowds (44% of all people observed)
were observed at the northwest corner at the sea lion viewing area, with an average of 111 people in the area per observation.
• The maximum size of the crowd in the sea lion viewing area was 281 people (on a Sunday, mid-afternoon). The minimum size was 13 people (on a Friday, late evening).
• The western edge—the approach to the sea lion area—had 32% of the crowd, with an average of 81 people per observation
• The north edge—with views of the bay—had the remaining 25%, with 64 people per observation.
• In all three sections of the pier, there were more people along the railing (near the view of the water) than near the buildings.
Crowd density ranges widely, but can be very high.
OE conjecture: OE might want to consider exhibits along the Bay View Walk that can
support a large range of crowd sizes.
Crowds were smallest at the end of the pier.
OE conjecture: OE might want to consider that the number of people who walk down the Bay View may be larger than the number who round the corner to the end of the pier. We might
place crowd-‐sized attractors at the beginning and end of the pier, or let people know at the beginning that there's something else further
down.
Crowds were smallest in the evening.
OE conjecture: OE may want to consider creating spaces at the end of the pier that are comfortable and safe in the
evening.

Characterizing Audience and Traffic Flow at Pier 39 and the Ferry Building
Exploratorium Visitor Research and Evaluation -20- www.exploratorium.edu
Activities by location at Pier 39:
A closer look at subsections of the pier reveals differences in use in different areas.
On the western edge of the pier, along the approach to the sea lions:
• Almost all the people observed (83%) were walking—presumably toward the attractions further down the pier.
At the northwest corner of the pier, where the sea lion viewing area is:
• The most common activity (53%) was standing—to look at the sea lions.
• More people (12%) were seated here than anywhere else, again, while looking at sea lions.
There were many more people along the railings.
OE conjecture: The railing is an attractor, which could inform exhibit placement. We might consider establishing a rhythm of alternating experiences, such as rest (eg a
bench) with activity (eg an exhibit).
The majority of people watching sea lions were
standing, even though tiered seating was available.
OE conjecture:
Even with seating as an option, might more people stand? We might consider eliminating seating in areas designed for a crowd, or ensuring that everyone is seated, so the seating does not go unused. If the latter, it would be nice to create a
multi-‐use space that provides seating but can easily convert
to exhibit space.

Characterizing Audience and Traffic Flow at Pier 39 and the Ferry Building
Exploratorium Visitor Research and Evaluation -21- www.exploratorium.edu
o The infrastructure of the area supported the seated viewing, with tiered benches in place to allow seated people to see over the heads of the crowds nearer the railing.
• This area also had the most people (2%, 85 total) reading informational signs, in this case about the sea lions.
• Some people (5%, 162 total) took photos of the sea lions as well.
• Very few people (<1%, 11 total) used the binocular stations to look at the sea lions or out at the bay.
o The sea lions were too close to be within the best range of the binoculars; and further, they could easily be seen with the naked eye. The sea lions were also most likely more interesting than the distant landscape for people in this location.
At the north of the pier, which features beautiful views of the bay:
• The most common activities were walking (45%) and standing (32%), typically facing out to sea.
• This area had more people taking photos (16%, 323 total) than any other area.
o The photos were often of their group, posed in front of the Golden Gate Bridge or Alcatraz. The iconic views here were likely perfect for preserving memories of their visit.
• A few people sat on the benches that lined the edge of the pier (3%, 56 total).
o The number of people seated was lower than might be expected; one explanation is that cold and windy conditions may have discouraged people from lingering.
• A few people used the binocular stations (2%, 50 total). o The binocular stations were coin-operated, which
might have dissuaded people from using them. • Though informational signs about the geography of the bay
were present in this area, few people (<1%, 11 total) were observed reading them.
o The signs looked old and were densely packed with text; perhaps they were uninviting, or perhaps the topic was not interesting.
Available offerings-‐-‐binocular stations and signs-‐-‐were rarely used, though binoculars were more often used than
signs.
People were not motivated to learn about the bay via signage. The binoculars may have received
slightly more use because they are more personal and give people
control. However, they still weren't compelling enough to attract many
people.
OE conjecture: OE will have to ensure that the
exhibits and signage have hooks that attract and interest people.
This area had the most people reading informational signs-‐-‐about the sea lions.
It seems more people are willing to read about sea lions than about the bay.
OE conjecture: OE will need a strong hook to get
people interested in the bay.

Characterizing Audience and Traffic Flow at Pier 39 and the Ferry Building
Exploratorium Visitor Research and Evaluation -22- www.exploratorium.edu
One of three informational signs along the north end of the pier
Along the entire pier:
• Few people (1% or less) were observed biking or jogging.
o The intense crowds of this area meant that fast-moving bikers and joggers might have had difficulty getting through.
• Few people (<1%) were observed buying food. o The abundant restaurants and cafes just
seconds away on Pier 39’s main drag were probably more attractive than the limited snacks (churros, cotton candy, soda) offered by the food carts.
Very few people attended the food carts here.
OE conjecture: The low quality food
doesn't seem to attract people. We might
consider food quality when establishing our
own vendors.

Characterizing Audience and Traffic Flow at Pier 39 and the Ferry Building
Exploratorium Visitor Research and Evaluation -23- www.exploratorium.edu
Ferry Building Study
Background for Ferry Building
The Ferry Building farmer’s market is our proxy for our Civic plaza. We chose this location because it’s open, busy and has a strong attractor—the many food vendors. It too offers a view of the bay and the Bay Bridge. Audiences here are also likely a part of our future audience.
Notable attractions at the Ferry Building
Food Carts and Street Performers Food carts are one of the main attractions at the Ferry Building Farmer’s Market. Lines can be more than 20 people long. At least three locations along the pier featured street performers, including a band, a juggler, and a hula-hooper; they drew crowds wherever there was space.
Ferry Building

Characterizing Audience and Traffic Flow at Pier 39 and the Ferry Building
Exploratorium Visitor Research and Evaluation -24- www.exploratorium.edu
Eating and Relaxing Once visitors get their food, they often sit and eat at provided tables, benches, or even on the railroad ties that line the road. Some people also bring their dogs.
Methods for Ferry Building traffic flow study
Observations were carried out at the Ferry Building during the Farmer’s Market on two weekend days, Saturday April 23 and Saturday April 30, from 9:30 am to 2:00 pm (when the Farmer’s Market closed).
Weather during the observations was typically clear, but cool and windy, with temperatures in the high 50s to mid 60s.
For this part of the study, data collectors stood at the entrance to the pier. Each data collector observed a subset of the possible entrances to the pier and randomly selected every seventh person who crossed an imaginary line to enter the plaza. The person’s direction of travel was recorded, along with their age (adult or child), gender, group size, and activity (walking, jogging, etc).

Characterizing Audience and Traffic Flow at Pier 39 and the Ferry Building
Exploratorium Visitor Research and Evaluation -25- www.exploratorium.edu
The diagram below shows the data collection area (dashed white line), the area where data collectors stood (orange circle), and the imaginary (yellow and blue) lines across the pier’s entrances and exits. The blue lines represent the two entrances/exits watched by one data collector; the yellow line represents the entrance/exit watched by the other data collector.
Characterizing Audience and Traffic Flow at Pier 39 and the Ferry Building
Exploratorium Visitor Research and Evaluation -26- www.exploratorium.edu
Findings for Ferry Building traffic flow study
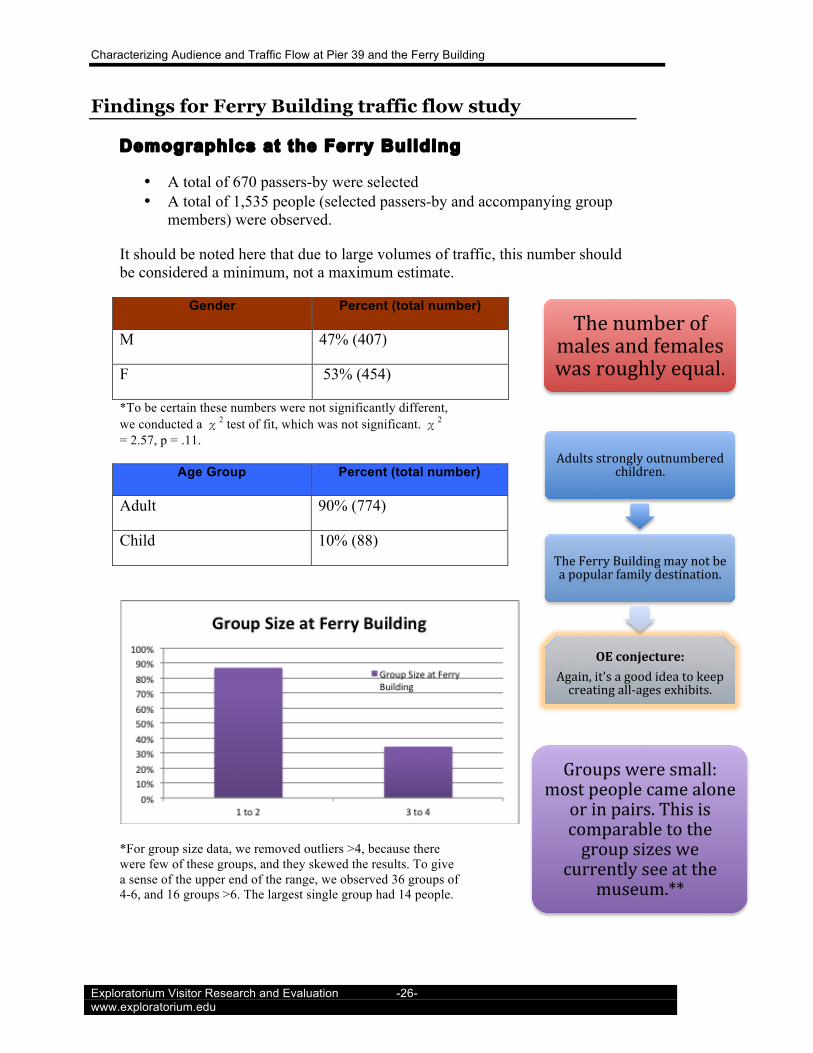
Demographics at the Ferry Building
• A total of 670 passers-by were selected • A total of 1,535 people (selected passers-by and accompanying group
members) were observed.
It should be noted here that due to large volumes of traffic, this number should be considered a minimum, not a maximum estimate.
Gender Percent (total number)
M 47% (407)
F 53% (454)
*To be certain these numbers were not significantly different, we conducted a χ2 test of fit, which was not significant. χ2
= 2.57, p = .11.
Age Group Percent (total number)
Adult 90% (774)
Child 10% (88)
*For group size data, we removed outliers >4, because there were few of these groups, and they skewed the results. To give a sense of the upper end of the range, we observed 36 groups of 4-6, and 16 groups >6. The largest single group had 14 people.
The number of males and females was roughly equal.
Adults strongly outnumbered children.
The Ferry Building may not be a popular family destination.
OE conjecture: Again, it's a good idea to keep creating all-‐ages exhibits.
Groups were small: most people came alone
or in pairs. This is comparable to the group sizes we
currently see at the museum.**
Characterizing Audience and Traffic Flow at Pier 39 and the Ferry Building
Exploratorium Visitor Research and Evaluation -27- www.exploratorium.edu
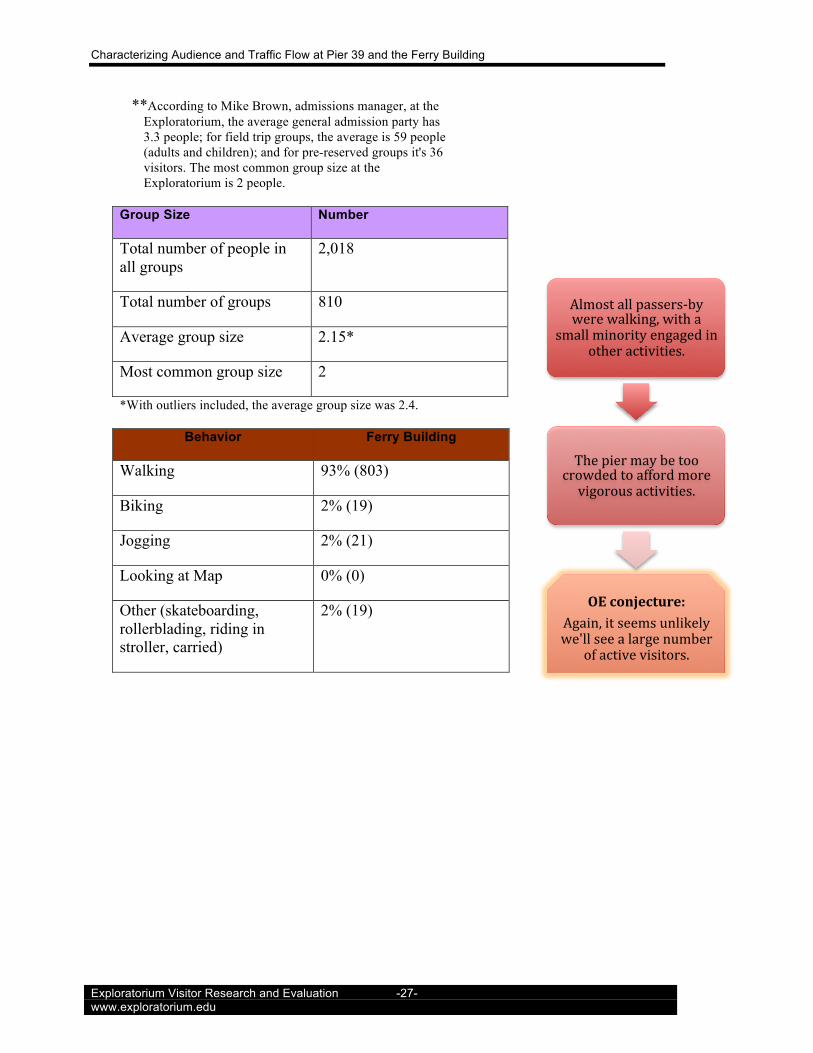
**According to Mike Brown, admissions manager, at the Exploratorium, the average general admission party has 3.3 people; for field trip groups, the average is 59 people (adults and children); and for pre-reserved groups it's 36 visitors. The most common group size at the Exploratorium is 2 people.
Group Size Number
Total number of people in all groups
2,018
Total number of groups 810
Average group size 2.15*
Most common group size 2
*With outliers included, the average group size was 2.4.
Behavior Ferry Building
Walking 93% (803)
Biking 2% (19)
Jogging 2% (21)
Looking at Map 0% (0)
Other (skateboarding, rollerblading, riding in stroller, carried)
2% (19)
Almost all passers-‐by were walking, with a
small minority engaged in other activities.
The pier may be too crowded to afford more vigorous activities.
OE conjecture: Again, it seems unlikely we'll see a large number
of active visitors.

Characterizing Audience and Traffic Flow at Pier 39 and the Ferry Building
Exploratorium Visitor Research and Evaluation -28- www.exploratorium.edu
Direction of Traffic Flow at the Ferry Building
*Note: totals for this chart are smaller than for the others—some people stopped and rested within the selection area for so long that their exit direction was not recorded.
Time of day, day of the week, and traffic flow at the Ferry Building
Overall Numbers:
• Sidewalk traffic around the Ferry Building was heavy throughout the times observed.
• An average of 134 people were selected every 35 minutes.
Weekday vs Weekend:
• No data were collected at the Ferry Building Farmer’s Market on weekdays, so no weekday-weekend comparison is possible.
At the Ferry Building, trafPic Plowed in a fairly
balanced mix of directions, though few
attendees went southeast after leaving the pier.
The food carts and market stalls seem to be strong attractors, leading to a
balanced Plow.
OE conjecture: If the exhibits
distributed along the Civic Plaza are strong attractors, we'll likely be able to draw people
in and through.
20% (171)
17% (140)
27% (224)
16% (135)
14% (118)
4% (34)

Characterizing Audience and Traffic Flow at Pier 39 and the Ferry Building
Exploratorium Visitor Research and Evaluation -29- www.exploratorium.edu
Traffic flow and hourly variation:
• At the Ferry Building, traffic slowed toward 2pm, when the farmer’s market closed.
Direction and Hourly Variation
• The direction of traffic flow at the Ferry building was roughly constant throughout the day, aside from the overall decrease in traffic near the farmer’s market closing time.
Comparison of Ferry Building and Farmer’s Market hourly traffic:
0
20
40
60
80
100
120
9:40 AM 10:40 AM 11:40 AM 12:40 PM 1:40 PM
Average number of passers-‐by
Average Hourly Weekend Traf[ic at the Ferry Building
0
50
100
150
200
Average number of people
Average hourly traf[ic [low at Pier 39 and Ferry Building
Average Weekday TrafPic at Pier 39
Average Weekend TrafPic at Pier 39
Average Weekend TrafPic at Ferry Building
TrafPic slowed once the farmer's market closed.
OE conjecture: While the future
Exploratorium may draw some weekend morning trafPic from the Ferry
Building, this population is ephemeral and disperses in
the afternoon.
The number of people at both locations is roughly equal at 9:40 AM, but the Ferry Building trafPic
slows once the farmer’s market closes.
OE conjecture: The Exploratorium will probably draw some crowds from both areas, but we can expect fewer people from the Ferry Building on
weekend afternoons.

Characterizing Audience and Traffic Flow at Pier 39 and the Ferry Building
Exploratorium Visitor Research and Evaluation -30- www.exploratorium.edu
Methods for Ferry Building crowds and activities study:
Once per hour, both data collectors walked a circuit around the pier and recorded the following for each person in the area:
o location (with special attention to people sitting on benches or eating at food carts)
o activity (stationary, seated, walking, jogging, biking, wayfinding, taking a photo, other)
Data collectors walked down the center of the pier to the end; one data collector recorded people to the right; the other recorded people to the left. See the diagram below for the path of travel.

Characterizing Audience and Traffic Flow at Pier 39 and the Ferry Building
Exploratorium Visitor Research and Evaluation -31- www.exploratorium.edu
Findings for Ferry Building crowds and activities study:
Location of Crowds:
• Along the pier at the Ferry building, we observed an average of 563 people per hour.
• Crowds were fairly evenly distributed: o 36% of people were near the entrance to the
southwest (average 200 people per hour) o 26% were in the middle of the pier (average 146
people per hour), o 38 % at the back end of the pier to the northeast end
of the pier (average 214 people per hour).
Crowds were evenly distributed.
OE conjecture: Having big attractors early on at both the Civic Plaza and the Bay View Walk may be a
strategy to get people moving all the way through.

Characterizing Audience and Traffic Flow at Pier 39 and the Ferry Building
Exploratorium Visitor Research and Evaluation -32- www.exploratorium.edu
o The range was between 100 and 290 people in any one of the three areas.
o Over most of the pier, the crowd was fairly evenly split between the railings with a view of the water, and the buildings/food stands. Near the entrance, there were more people near the buildings, probably because this area had the most food stands on that side.
Activities and Location at the Ferry Building
• The top three activities were: o walking (35%) o sitting (31%) (usually while eating) o standing (22%) typically waiting in line at a food
cart • These activities didn’t vary much over the length of the
pier. o The slight drop in people in the middle may be
explained by the fact that this area featured fewer
Crowds and attractors are evenly distributed.
OE conjecture: We might consider evenly distributing exhibits at the
plaza, or be cognizant of where we want crowds and gaps.
Crowds gathered near the buildings as well as near the
railings.
While Pier 39 showed the railings as an attractor, the Ferry
Building results suggest that big attractors (like food stands) can pull
people toward buildings.
OE conjecture: The railing may be a natural attractor, but
exhibits might also be placed along the building to distribute
crowds and offer shelter (keeping egress restrictions in
mind).

Characterizing Audience and Traffic Flow at Pier 39 and the Ferry Building
Exploratorium Visitor Research and Evaluation -33- www.exploratorium.edu
food carts and street performers, so there were fewer reasons to stand and wait in the area.
• A few people (<1%) took photos, typically of the view of the Bay Bridge from the back half of the pier.
• Few people (<1%) were biking or jogging, probably because the dense crowds would have made fast movement difficult.
We observed few joggers or bikers. It may be too crowded for
them.
OE conjecture: This will likely be the case within Civic Plaza, but not so along the Embarcadero. We might look to this distribution of attractors as a model for how
to slow trafPic.

Characterizing Audience and Traffic Flow at Pier 39 and the Ferry Building
Exploratorium Visitor Research and Evaluation -34- www.exploratorium.edu
Pier 7 Study
Background for Pier 7
Though it was not designed for the same purpose, the Observatory Gallery conducted an earlier, similar study at Pier 7, which we will also briefly mention here, as it may help to inform our work. Pier 7 is located a few blocks southeast of our future home at Piers 15 and 17. It is a narrow, wooden pier, lined with benches; it does not feature any buildings or attractions.
Methods for Pier 7
• Observations were carried out on two days: Thursday, December 2, 2010 from 9:00 AM to 12:20 PM and Friday January 7, 2011 from 12:40 PM to 6:00 PM. The totals have been grouped together in the findings below, to approximate one typical full day.
• Weather during the observations was overcast and cold, with temperatures in the high 40s and low 50s.
• Selection of passers-by was the same as for the two studies described above.
Pier 7

Characterizing Audience and Traffic Flow at Pier 39 and the Ferry Building
Exploratorium Visitor Research and Evaluation -35- www.exploratorium.edu
Findings for Pier 7 traffic flow study
Demographics at Pier 7
Age Group Number
Adult 97% (653)
Child (<18) 3% (18)
Gender Number
M 56% (375)
F 43% (287)
Behavior Number
Walking 79% (531)
Jogging 11% (71)
Biking 7% (50)
Other (skateboarding, riding in pedicab or stroller)
3% (19)
Adults strongly outnumbered children.
OE conjecture: Though children were uncommon at all locations, this location had the fewest, perhaps because there
are few attractions nearby.
Males slightly outnumbered females.
The most common activity was walking. The percentage of people jogging and biking here is slightly higher than at our
other locations.
OE conjecture: The long stretch of the Embarcadero in front of Pier 7 is most similar to the stretch in front of Pier 15 and 17, and it's close by, so we'll likely see these joggers and bikers at our new
home.
Characterizing Audience and Traffic Flow at Pier 39 and the Ferry Building
Exploratorium Visitor Research and Evaluation -36- www.exploratorium.edu
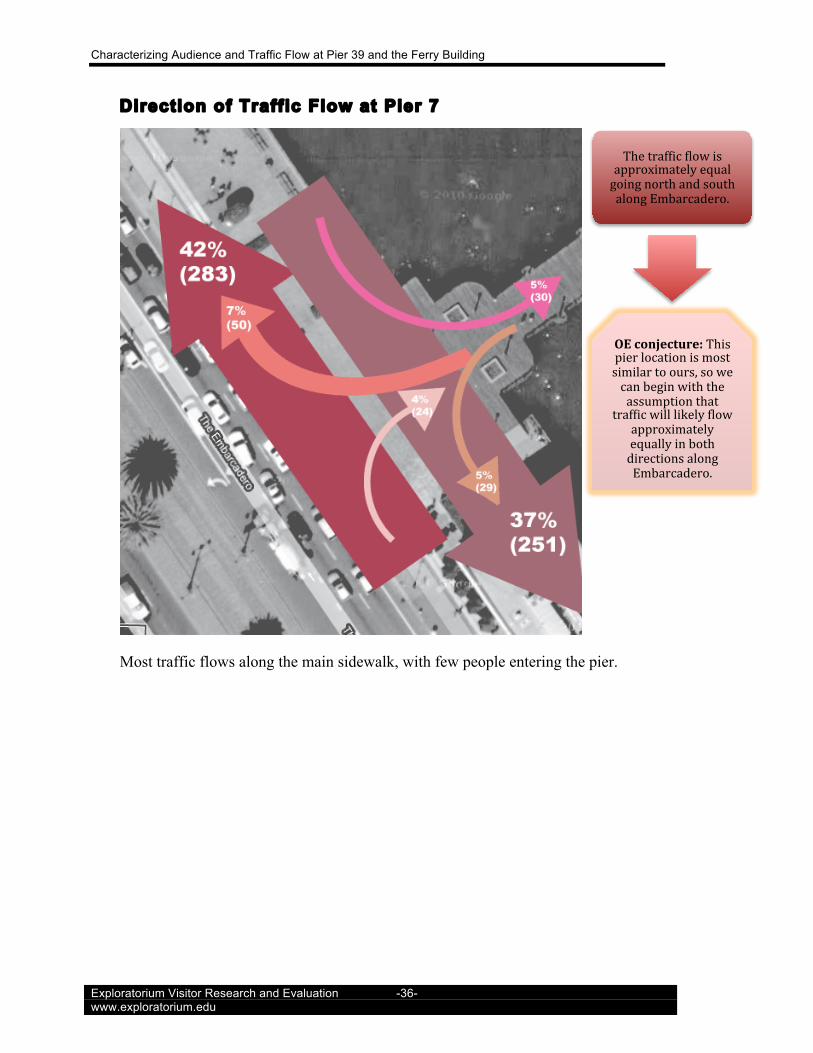
Direction of Traffic Flow at Pier 7
Most traffic flows along the main sidewalk, with few people entering the pier.
The trafPic Plow is approximately equal going north and south along Embarcadero.
OE conjecture: This pier location is most similar to ours, so we can begin with the assumption that
trafPic will likely Plow approximately equally in both directions along Embarcadero.

Characterizing Audience and Traffic Flow at Pier 39 and the Ferry Building
Exploratorium Visitor Research and Evaluation -37- www.exploratorium.edu
Time of day and traffic flow at Pier 7
*Number of people was not averaged, since there was only 1 day of data collection
0
20
40
60
80
100
120
10:30 11:30 12:30 1:30 2:30 3:30 4:30 5:30
Num
ber of People
Hourly traf[ic [low at Pier 7
Total weekday trafPic at Pier 7
0
10
20
30
40
50
60
10:30 11:30 12:30 1:30 2:30 3:30 4:30 5:30
Num
ber of People
Direction of Traf[ic Flow at Pier 7 over time
NE toward Pier 15 and 17
SW away from Pier 15 and 17
TrafPic peaked in the early afternoon, and again in early
evening.
This pattern is similar to the Plow at Pier 39, though there are fewer attractions in this area.
OE Conjecture: We can likely expect evening crowds at the new location, which supports plans for more evening programs.
The direction of trafPic Plow stayed roughly constant, with slightly more people travelling toward Pier 15
and 17.
OE conjecture: We will likely see trafPic coming from the direction of the Ferry Building, even on weekdays, when the Farmer's Market is not
open.

Characterizing Audience and Traffic Flow at Pier 39 and the Ferry Building
Exploratorium Visitor Research and Evaluation -38- www.exploratorium.edu
Other Reflections on Traffic at the Piers
Weather: It’s often windy and cold. Pier 39 has some benches at the end of the pier protected by clear windscreens, that allow some (not great) protection from the elements, but we didn’t observe many people taking advantage of them--most were standing out at the railing. Perhaps they just took a quick look at the view, then retreated out of the cold. It was somewhat warmer at the Ferry Building, where we observed more people sitting and relaxing.
Personalities: Both piers attract street performers—from bands to jugglers—as well as “characters” such as a man who hides behind a branch and jumps out to startle passers-by.
People with Disabilities: During our observations, we noted a small number of people with visual disabilities, and a small number in wheelchairs.
Other demographics: Informally, Pier 39 seemed to have more tourists. We saw more people taking photographs, more people unprepared for the weather, and more large tour-bus groups and school groups.
Pier 39 seemed to have many tourists.
OE conjecture: Tour buses and school groups may use our Civic
Plaza as a staging area. Cold tourists may seek shelter in our space.
We observed some people with disabilities.
OE conjecture: Accessibility to visitors with disabilities is a factor to
think about.
Both piers attracted "personalities."
OE conjecture: We might anticipate that some street performers and colorful individuals will be attracted to the
Exploratorium’s new site as well.
It's windy and cold out there.
OE conjecture: Visitor comfort with respect to the weather is a factor to consider, especially if we want people to linger. The Wind study can help inform us about local conditions around
the building.

Characterizing Audience and Traffic Flow at Pier 39 and the Ferry Building
Exploratorium Visitor Research and Evaluation -39- www.exploratorium.edu
The Ferry Building seemed to have more locals—people interested in shopping or getting lunch. The market seemed to be part of a weekend routine for some people. More people asked us what we were doing at the Ferry Building, (noticing us as something out of the ordinary) and knew of the Exploratorium. Locals seem very attracted by the food stands at the Ferry Building, and may visit often.
Food: The types of food served may play a role in attracting visitors, especially locals.
The Ferry Building seemed to have more
locals.
OE conjecture: Could the Exploratorium become a routine
destination for locals, based on food, shopping, or some other attractor?
The food carts at Pier 39 feature snack and junk food such as cotton candy and
churros, and they are sparsely attended. On the other hand, food carts at the Ferry Building feature gourmet snacks and meals, and they are always
busy.
OE Conjecture: Might the quality of the food we offer affect use? One possibility under consideration is the idea of building out the gangway to support food
vendors.

Characterizing Audience and Traffic Flow at Pier 39 and the Ferry Building
Exploratorium Visitor Research and Evaluation -40- www.exploratorium.edu
Limitations
These observations provide more of a snapshot than a longitudinal sample. Some of the limitations of this type of observation are described below:
• The side of Pier 39 is being used as a proxy to the Outdoor Bay View Walk at Pier 15, and the side of the Ferry Building is being used as a proxy to the Civic Plaza at Pier 15. While these two will help us understand the traffic flow and activities that we are likely to see at the new building, there will be differences based on the layout and visitor makeup that we cannot capture at these placeholder/substitute locations.
• We did not observe all hours of the day. While we split the observations up into what we thought were likely to be unique periods (morning, afternoon, and evening), we may have missed changes in traffic that occurred at other times.
• We observed only a few days in a single month. Special events, weather, seasonal changes in tourism, or other factors might affect traffic flow and composition at the piers in ways that we did not observe during this study.
• High traffic volumes and mobile subjects made accurate counts difficult. During the observation of people along the entire pier, it is possible that some of them were counted multiple times, or not at all. During the observation of traffic across our invisible lines, the overwhelming number of passers-by made it impossible to accurately count every person. It is possible that we were biased toward selecting people who were easier for us to observe (e.g. not blocked from our view by other people).
• Both locations had multiple entrance/exit points down the length of the pier. We could not watch all possible entrances and exits to the Pier; therefore, these data do not provide a complete picture of the traffic flow.
Acknowledgements
The authors would like to thank Emily Leighton for enduring the cold, wind, and sun while collecting the data for this study. Additional thanks to Joyce Ma for assistance in developing the methods for collecting and analyzing the data; special thanks to Edith Ackerman for her excellent feedback and contributions to the conjectures.


