E NERGY T ECHNOLOGIES A REA E NERGY A NALYSIS AND E NVIRONMENTAL I MPACTS D IVISION Characterizing Formaldehyde Emissions from Home Central Heating and Air Conditioning Filters Hugo Destaillats , Marion L. Russell, William J. Fisk Lawrence Berkeley National Laboratory Indoor Environment Group 1 CARB Contract 14-303
Transcript
ENERGY TECHNOLOGIES AREA ENERGY ANALYSIS AND ENVIRONMENTAL IMPACTS D IV ISION
Characterizing Formaldehyde
Emissions from Home Central
Heating and Air Conditioning Filters
Hugo Destaillats, Marion L. Russell, William J. Fisk
Lawrence Berkeley National Laboratory
Indoor Environment Group
1
CARB Contract 14-303
E NE R G Y T E C HNO L O GIE S A R E A E NE R G Y ANAL Y S I S AND E NV I R O NME NT AL I M P ACT S D I V I S I O N
Acknowledgement
Qunfang (Zoe) Zhang and Peggy Jenkins (CARB)
Toshifumi Hotchi, Brett Singer (LBNL)
Technical Advisors: Wenhao Chen, Thomas Justice, Thomas Kuehn, Drew Williams and Harinder Singh
The statements and conclusions in this report are those of the Contractor (LBNL) and not necessarily those of
the California Air Resources Board.
The mention of commercial products, their source, or their use in connection with material reported herein is not to be construed
as actual or implied endorsement of such products.
2
ENERGY TECHNOLOGIES AREA ENERGY ANALYSIS AND ENVIRONMENTAL IMPACTS D IV ISION
INTRODUCTION
E NE R G Y T E C HNO L O GIE S A R E A E NE R G Y ANAL Y S I S AND E NV I R O NME NT AL I M P ACT S D I V I S I O N
We spend >90% time indoors
Indoor air: different chemical mixture than outdoor air
Higher indoor VOC concentrations (~10 to 1000 times)
Close proximity with sources in enclosed environment, leading to a higher intake than in outdoor air
Multiple pollutant sources
Indoor pollutant sources and concentrations
4
Occupant activities (smoking, cooking, cleaning)
Occupants (bioeffluents, personal care products)
Outdoor air
Building materials and furnishings
E NE R G Y T E C HNO L O GIE S A R E A E NE R G Y ANAL Y S I S AND E NV I R O NME NT AL I M P ACT S D I V I S I O N
Formaldehyde is a key indoor contaminant
Carcinogen (WHO-IARC, US-EPA, CA-Proposition 65)
Irritation of eyes, respiratory system
Ubiquitous in buildings (residential > commercial)
Levels often exceed reference exposure levels (RELs)
Easy to measure – large amount of data available
Difficult to remove with most air cleaning technologies
E NE R G Y T E C HNO L O GIE S A R E A E NE R G Y ANAL Y S I S AND E NV I R O NME NT AL I M P ACT S D I V I S I O N
What are the main indoor formaldehyde sources?
Multiple indoor sources
High emitters: materials containing urea-formaldehyde polymers
(wood products) fiberglass insulation and ceiling tiles
California regulation (ATCM 93120, 2008) established emission standards for composite wood products: hardwood plywood (HWPW), particleboard (PB), and medium density fiberboard (MDF)
France (2012): mandatory labeling of building products, based on pollutant emissions
Fiberglass HVAC filters also contain urea-formaldehyde binders
6
E NE R G Y T E C HNO L O GIE S A R E A E NE R G Y ANAL Y S I S AND E NV I R O NME NT AL I M P ACT S D I V I S I O N
Hydrolytic depolymerization of urea-formaldehyde resin
7
O
N H
N
O
NH O
N H
N
HO
R1
O
HN
H
R2
H2O
O
N H
N
O
NH O
N H
N
HO
R1 HO
HN
H
R2 OH
O
N H
NH
HO
R1
+ CH2O
O
NH O
N H
N
H2N
H
R2
+ CH2O
60 oC96% RH3 months
Brown, 1990 Polymer Degradation & Stability
Degradation of UF foam insulation
E NE R G Y T E C HNO L O GIE S A R E A E NE R G Y ANAL Y S I S AND E NV I R O NME NT AL I M P ACT S D I V I S I O N
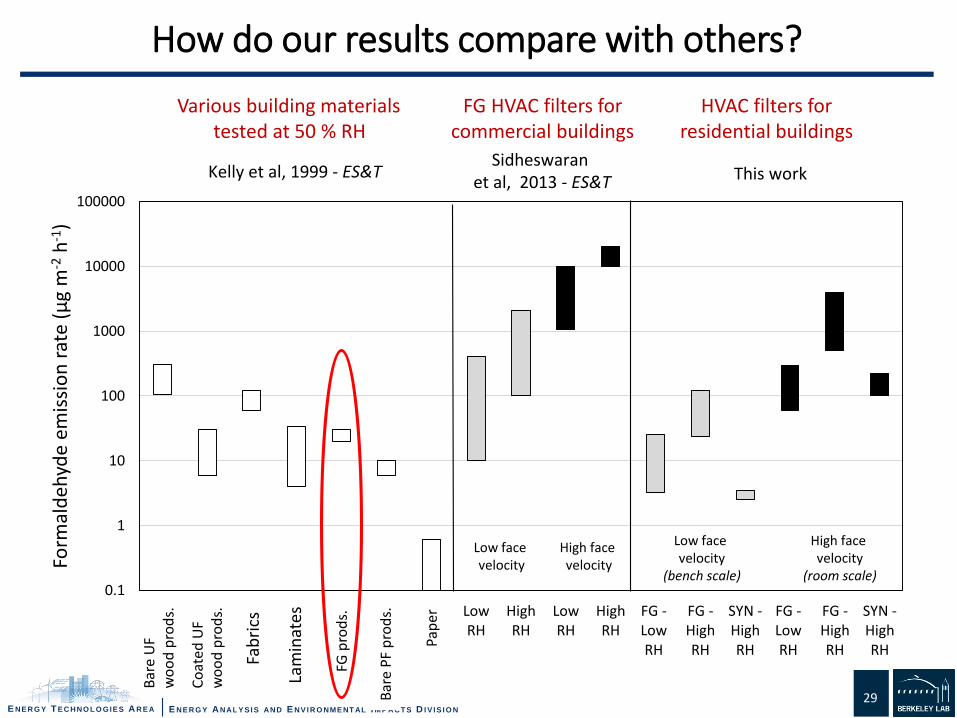
Recent evidence: filters used in commercial buildings
Two unoccupied offices (Zones 1 and 2), serviced by identical HVAC units
Alternating synthetic and fiberglass filters
RH: 50% or 80% (humidifier)
Formaldehyde concentrations were higher when fiberglass filters were used, and at high relative humidity
Are fiberglass residential filtersa substantial source of formaldehyde?
8
Sidheswaran et al, 2013 Environ. Sci. Technol.
HVAC #1
Supply
Zone 2Zone 1
HVAC #2
ReturnReturn
■ Synthetic filter■ Fiberglass filter
ENERGY TECHNOLOGIES AREA ENERGY ANALYSIS AND ENVIRONMENTAL IMPACTS D IV ISION
MATERIALS AND METHODS
E NE R G Y T E C HNO L O GIE S A R E A E NE R G Y ANAL Y S I S AND E NV I R O NME NT AL I M P ACT S D I V I S I O N
Selection of filters used in this study
Five experts from industry, academia and government joined Project Advisory Committee (PAC)
Input from PAC: In general, low cost MERV 7 or lower filters are resin-bonded, and use urea-
formaldehyde (UF) resin.
Formaldehyde emissions can be affected by the curing conditions of the UF resin
Unlikely formaldehyde sources: HEPA filters; cardboard/chipboard frame and glues; tackifier used as coating to increase particle arrestance
Criteria for filter selection: Inclusion of at least one fiberglass filter from each of the three North American
manufacturers.
Inclusion of synthetic filters from at least two manufacturers with a significant presence in the US market
Inclusion of additional fiberglass filter samples, retrieved directly from the production line of several manufacturers.
10
E NE R G Y T E C HNO L O GIE S A R E A E NE R G Y ANAL Y S I S AND E NV I R O NME NT AL I M P ACT S D I V I S I O N
Filters purchased from online retailers
11
No. Manufacturer MediaMERV Rating
Description of filtration media
1 A FG na fiberglass media with light adhesive2 A FG MERV 4 fiberglass media with adhesive3 A FG MERV 4 fiberglass media with adhesive
4 B FG MERV 4fiberglass and polyester fibers
with gel adhesive5 B SYN MERV 11 synthetic filter media, pleated6 B SYN MERV 4 polyester fibers7 B SYN MERV 8 synthetic pleated filter media
8 C FG MERV 4fiberglass media,
continuous filament spun glass
9 C FG nafiberglass media,
continuous filament spun glass
10 D SYN nasynthetic media, electrostatic,
allergen reduction filter, pleated
11 D SYN MERV 8synthetic media, electrostatic,
allergen reduction filter, pleated
FG: Fiberglass SYN: synthetic
E NE R G Y T E C HNO L O GIE S A R E A E NE R G Y ANAL Y S I S AND E NV I R O NME NT AL I M P ACT S D I V I S I O N
Fiberglass filters retrieved from production line
12
SampleManufacturer of
Commentsfilter media
a A AThicker fiberglass media than those typically
used for residential buildings.
b A AThicker fiberglass media than those typically
used for residential buildings.c C X Relatively recent productiond C X Relatively recent productione A A Sample is at least 5 years oldf C Z Relatively recent productiong C Z Relatively recent productionh C Z Relatively recent production
i Unknown Unknown Imported from China
E NE R G Y T E C HNO L O GIE S A R E A E NE R G Y ANAL Y S I S AND E NV I R O NME NT AL I M P ACT S D I V I S I O N
Experimental setup used in bench-scale tests
13
Tested filters
Upstream sampling port
Downstream sampling port
Vent
Logging system
Heating plate
Upstream air internal inlet
Teflon tubingDownstream air internal outlet
MFC
MFC
House air
HEPA filter
Activated carbon filter
Water bubbler
T, RH sensors
200–L chamber
E NE R G Y T E C HNO L O GIE S A R E A E NE R G Y ANAL Y S I S AND E NV I R O NME NT AL I M P ACT S D I V I S I O N
Bench-scale test chamber
14
Air flows from
bottom to top
Air outlet Air inletSampling
ports
E NE R G Y T E C HNO L O GIE S A R E A E NE R G Y ANAL Y S I S AND E NV I R O NME NT AL I M P ACT S D I V I S I O N
Experimental setup used in room-sized chamber tests
15
Humidifier #3
Upstream sampling port
Chamber exhaust
Logging system
Outdoor air
Activated carbon + chemisorbent bed
T, RH, CO2
sensors
20–m3 chamber
Custom-made filter
holder
Downstream sampling port
Humidifier #1
Humidifier #2
RH controller
Fan
Recirculation loop
Variable speed fan
Iris damper
Flexible ductwork (ending opposite side of chamber)
E NE R G Y T E C HNO L O GIE S A R E A E NE R G Y ANAL Y S I S AND E NV I R O NME NT AL I M P ACT S D I V I S I O N
Exterior view of room-sized chamber
16
20-m3 chamber
upstream
Sampling ports
Variable-speed fan
Custom-built filter holder
Iris damper
downstream
E NE R G Y T E C HNO L O GIE S A R E A E NE R G Y ANAL Y S I S AND E NV I R O NME NT AL I M P ACT S D I V I S I O N
Interior view of room-sized chamber
17
From external loop
Three home humidifiers
Fan
To external loop
Humidity Controller
door
From external loop
Three home humidifiers
Fan
To external loop
Humidity Controller
door
E NE R G Y T E C HNO L O GIE S A R E A E NE R G Y ANAL Y S I S AND E NV I R O NME NT AL I M P ACT S D I V I S I O N
Formaldehyde sampling and analysis
Method EPA TO-11A (1999)
Sampling
collection using dinitrophenyl hydrazine (DNPH)-coated silica samplers (Waters)
simultaneous upstream/downstream sampling
flow: 1 L min-1 ± 1% over 1 hour for V = 6 L
Analysis
Samplers were extracted with 2 mL acetonitrile
Analyzed by HPLC with UV detection at 360 nm
Calibration curve using authentic standards of the corresponding DNPH hydrazone derivative
Limit of detection < 0.1 μg m-3
18
[H+] - H2O
+
ENERGY TECHNOLOGIES AREA ENERGY ANALYSIS AND ENVIRONMENTAL IMPACTS D IV ISION
RESULTS
E NE R G Y T E C HNO L O GIE S A R E A E NE R G Y ANAL Y S I S AND E NV I R O NME NT AL I M P ACT S D I V I S I O N
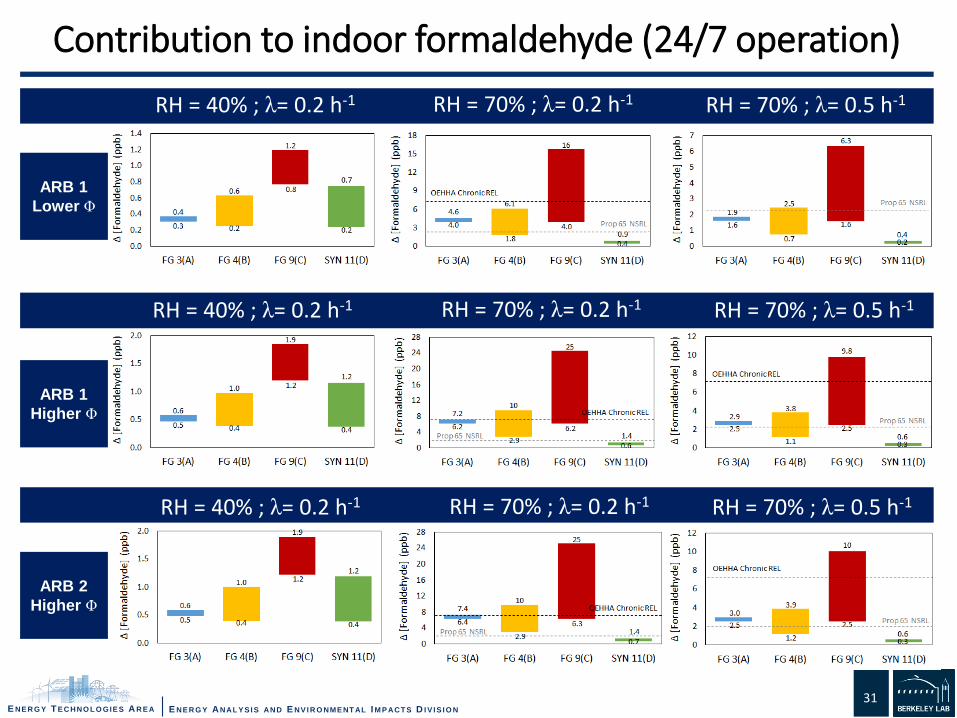
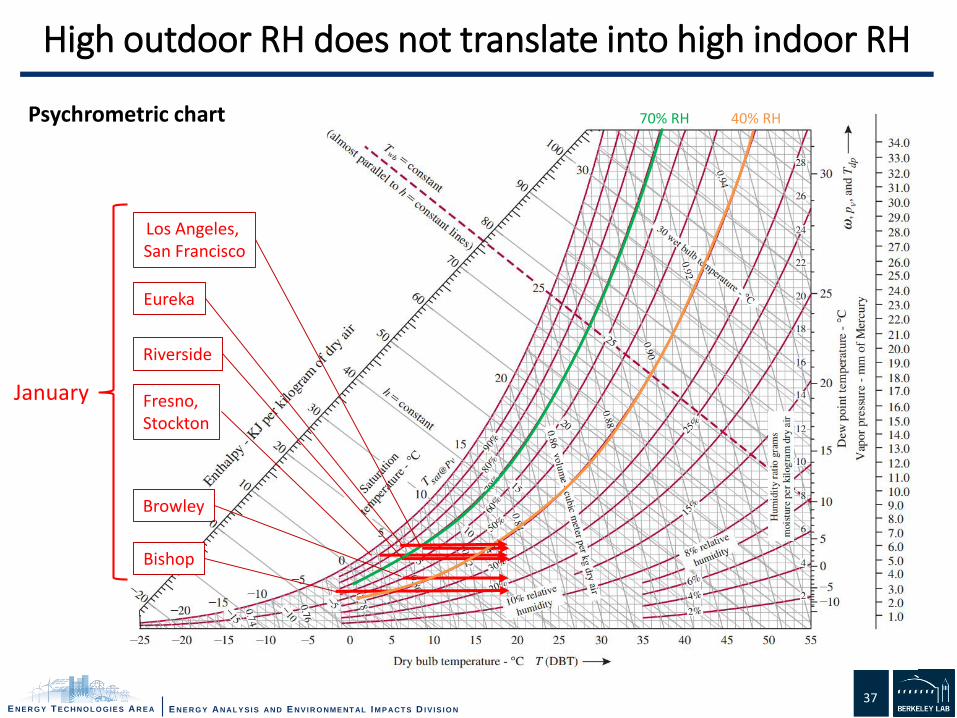
Duty cycle corresponding to January in each climate zone
Considering only indoor moisture sources, no sinks
Values correspond to emission rates from all tested FG filters
Typical scenario
ENERGY TECHNOLOGIES AREA ENERGY ANALYSIS AND ENVIRONMENTAL IMPACTS D IV ISION
CONCLUSIONS
AND PERSPECTIVES
E NE R G Y T E C HNO L O GIE S A R E A E NE R G Y ANAL Y S I S AND E NV I R O NME NT AL I M P ACT S D I V I S I O N
Residential FG filters emit formaldehyde in contact with humidified air (>> synthetic filters) Consistent w/ previous results in commercial buildings
Emissions were observed from media AND frame
In most cases, FG filters can increase indoor formaldehyde concentrations by only a few ppb
Emissions can impact IAQ more severely in a subset of conditions (high occupancy, low air exchange rate, smaller spaces, extreme weather, varying by location) Exceeding OEHHA Chronic REL in three areas simulated
Source-control strategies may include: Replacing urea-formaldehyde polymers used as binders for FG
Replacing FG filters by other low-emitting filters
Both solutions may be limited by cost barriers
Summary of findings
41
E NE R G Y T E C HNO L O GIE S A R E A E NE R G Y ANAL Y S I S AND E NV I R O NME NT AL I M P ACT S D I V I S I O N
A limited set of experimental conditions was evaluated (number and types of filters, face velocity, etc)
Only two indoor RH settings were considered: moderate (35 -45%) and high (62 -72%).
Eight climate zones were considered, comprising most of the State’s population. Effects could be more severe in other parts of the USA with more extreme climates.
Tests were carried out over short periods of time (initial conditions) using clean laboratory air. What about longer exposure periods?
Study was carried out using only unexposed filters… what about used filters? What is the effect of “filter cake”?
Limitations of the study
42
E NE R G Y T E C HNO L O GIE S A R E A E NE R G Y ANAL Y S I S AND E NV I R O NME NT AL I M P ACT S D I V I S I O N
Hints from a previous study…
“Filter cake” can contribute to additional formaldehyde emissions, by:
Serving as a moisture reservoir in direct contact with the fiberglass media, and/or
Becoming another formaldehyde source
43
Formaldehyde concentration measured downstream of FG filter @ 50% RH.
• LBNL: 3 month of use in an LBNL building (outdoor particles mostly influenced by vegetation)
• POAK: 3 months of use at the Port of Oakland (outdoor particle mostly diesel emissions, freeway traffic).
Destaillats et al, 2011 – Atmos. Environ.
E NE R G Y T E C HNO L O GIE S A R E A E NE R G Y ANAL Y S I S AND E NV I R O NME NT AL I M P ACT S D I V I S I O N
Literature citedDestaillats, H., W. Chen, M. G. Apte, N. Li, M. Spears, J. Almosni, G. Brunner, J. Zhang and W. J. Fisk. 2011. "Secondary pollutants from ozone reactions with ventilation filters and degradation of filter media additives." Atmos. Environ. 45: 3561-3568.
Kelly, T. J., D. L. Smith and J. Satola. 1999. "Emission rates of formaldehyde from materials and consumer products found in California homes." Environ. Sci. Technol. 33: 81-88.
Logue, J.M., W.J.N. Turner, I.S. Walker, B.C. Singer. 2012. "Evaluation of an incremental ventilation energy model for estimating impacts of air sealing and mechanical ventilation". LBNL Report 5796E. https://indoor.lbl.gov/publications/evaluation-incremental-ventilation
Offermann, F. J. 2009. "Ventilation and Indoor Air Quality in New Homes. ." California Air Resources Board and California Energy Commission, PIER Energy‐Related Environmental Research Program. Collaborative Report. CEC‐500‐2009‐085. http://www.arb.ca.gov/research/apr/past/04-310.pdf.
Sidheswaran, M., W. Chen, A. Chang, R. Miller, S. Cohn, D. Sullivan, W. J. Fisk, K. Kumagai and H. Destaillats. 2013. "Formaldehyde emissions from ventilation filters under different relative humidity conditions." Environ. Sci. Technol. 47: 5336-5343.
Trechsel, H.R., Editor. 1994. "Moisture Control in Buildings". ASTM Manual Series: MNL 18, American Society for Testing and Materials, Philadelphia, PA
US EPA. 1999. "Compendium Method TO-11ADetermination of Formaldehyde in Ambient Air Using Adsorbent Cartridge Followed by HPLC [Active Sampling Methodology]". Office of Research and Development, U.S. Environmental Protection Agency (U.S. EPA): Cincinnati, OH, 1999.