Introduction Electronic waste (e-waste) is currently the fastest growing hazardous waste stream that continues to be a challenging concern for the global environment and public health. The average useful life of electronic products has continued to decline, and obsolete products are being stored or discarded with increasing frequency. E-waste is hazardous, complex and expensive to treat in an environmentally sound manner. As a result, new challenges related to the management of e-waste have become apparent. Most electronic products contain a combination of hazardous materials, toxic materials, and valuable elements such as precious metals and rare earth elements. There are risks to human health associated with the disposal of E-waste in landfills, or treatment by incineration. Americans discard 400+ million electronic items per year recycling less than 20 percent in safe and sustainable manner. E-waste is exported from developed countries and processed informally using unsafe conditions in many regions of developing countries. A mixture of pollutants is released from these informal rudimentary operations. Exposure to e-waste recycling includes the dismantling of used electronics and the use of hydrometallurgical and pyrometallurgical processes, which emit toxic chemicals, to retrieve valuable components. Thermal analysis integrated with chromatographic and spectroscopic techniques are used to determine dangerous chemicals emitted during the burning of e-waste. The information is used to assess the risk of exposure of workers at these semi-formal recycling centers. Characterizing of Emissions from Open Burning of Electronic Waste using TG-GC-MS System APPLICATION NOTE Authors: Endalkachew Sahle-Demessie Teri Richardson Changseok Han Office of Research and Development NRMRL, US Environmental Protection Agency Cincinnati, OH Joshua Dietrich Department of Biomedical, Chemical, and Environmental Engineering, University of Cincinnati Cincinnati, OH Jun Wang PerkinElmer, Inc. San Jose, CA Hyphenated Technology
Transcript
Introduction Electronic waste (e-waste) is currently the fastest growing hazardous waste stream that continues to be a challenging
concern for the global environment and public health. The average useful life of electronic products has continued to decline, and obsolete products are being stored or discarded with increasing frequency. E-waste is hazardous, complex and expensive to treat in an environmentally sound manner. As a result, new challenges related to the management of e-waste have become apparent. Most electronic products contain a combination of hazardous materials, toxic materials, and valuable elements such as precious metals and rare earth elements. There are risks to human health associated with the disposal of E-waste in landfills, or treatment by incineration. Americans discard 400+ million electronic items per year recycling less than 20 percent in safe and sustainable manner. E-waste is exported from developed countries and processed informally using unsafe conditions in many regions of developing countries. A mixture of pollutants is released from these informal rudimentary operations. Exposure to e-waste recycling includes the dismantling of used electronics and the use of hydrometallurgical and pyrometallurgical processes, which emit toxic chemicals, to retrieve valuable components. Thermal analysis integrated with chromatographic and spectroscopic techniques are used to determine dangerous chemicals emitted during the burning of e-waste. The information is used to assess the risk of exposure of workers at these semi-formalrecycling centers.
Characterizing of Emissions from Open Burning of Electronic Waste using TG-GC-MS System
A P P L I C A T I O N N O T E
Authors:
Endalkachew Sahle-DemessieTeri RichardsonChangseok Han
Office of Research and Development NRMRL, US Environmental Protection Agency Cincinnati, OH
Joshua Dietrich
Department of Biomedical, Chemical, and Environmental Engineering, University of Cincinnati Cincinnati, OH
Jun Wang
PerkinElmer, Inc. San Jose, CA
Hyphenated Technology
2
Developing countries are accumulating large amounts of e-waste that is received from developed countries in addition to the volume that is generated from their internal consumers. Currently, an estimated 70 percent of e-waste handled in India has its origin from other nations. The United Nation Environmental Program UNEP estimates that between 2007 and 2020, domestic television e-waste will double, computer e-waste will increase five times, and cell phones 18 times1. Therefore, the rate at which electronics are being discarded has increased significantly, while the infrastructure for sustainable management of the waste has not caught up with it. This electronic waste, or e-waste, is being exported to developing countries where crude ‘recycling’ techniques expose both the workers and the environment to dangerous chemicals. Globally, e-waste generation is growing by 40 million tons per year2. Although there are many recycling facilities that are state of the art, there is still a large volume e-waste is being shipped from developed countries through legal and banned routes to developing countries, to be processed in less than safe techniques. Valuable metals such as gold and copper can be extracted from electronics, but this recovery process is often done in the cheapest and most unsafe way.
Plastics, which contain heavy metals and flame retardants, are burned in open piles and release deadly toxic emissions. Workers wearing minimum personal protection equipment break cathode ray tubes (CRTs) with hammers to remove copper, a process that also releases toxic phosphor dust. Circuit boards are cooked over open flames or in shallow pans, exposing workers to lead fumes. Acid baths are used to extract gold from circuit board chips, spewing even more toxic gases into the air3. These processes release a wide variety of heavy metals including lead, cadmium, and mercury into the air, soil, and water4. Thermogravimetric analysis (TG) has been used to characterize and compare composition, and thermal behavior of a wide range of samples5. Non-isothermal thermogravimetric analysis provides fast and simple comprehensive information on mass changes, characteristic temperature ranges for reactivity and combustion on a larger scale of solid fuels6. Although, there are some studies on the use of TG for coal and biomass combustion7-16, there are no published studies wherein those on e-waste.
The objective of this study is to demonstrate the application of an analytical technique that integrates thermal analysis with gas chromatography and mass spectroscopy to identify and quantify toxic compounds emitted during the burning of electronics waste at different oxidizing conditions. The goal of this study is laboratory simulation of open burning practices that often accompany undeveloped e-waste recycling operations, and to provide information about exposure risks to these emissions. The data will be used to understand better what exposures and releases occur in e-waste processing and how can they be mitigated. The study will provide the effectiveness, efficiency, environmental protection and worker safety of various e-waste collection, consolidation, transport and processing systems.
Material and Method
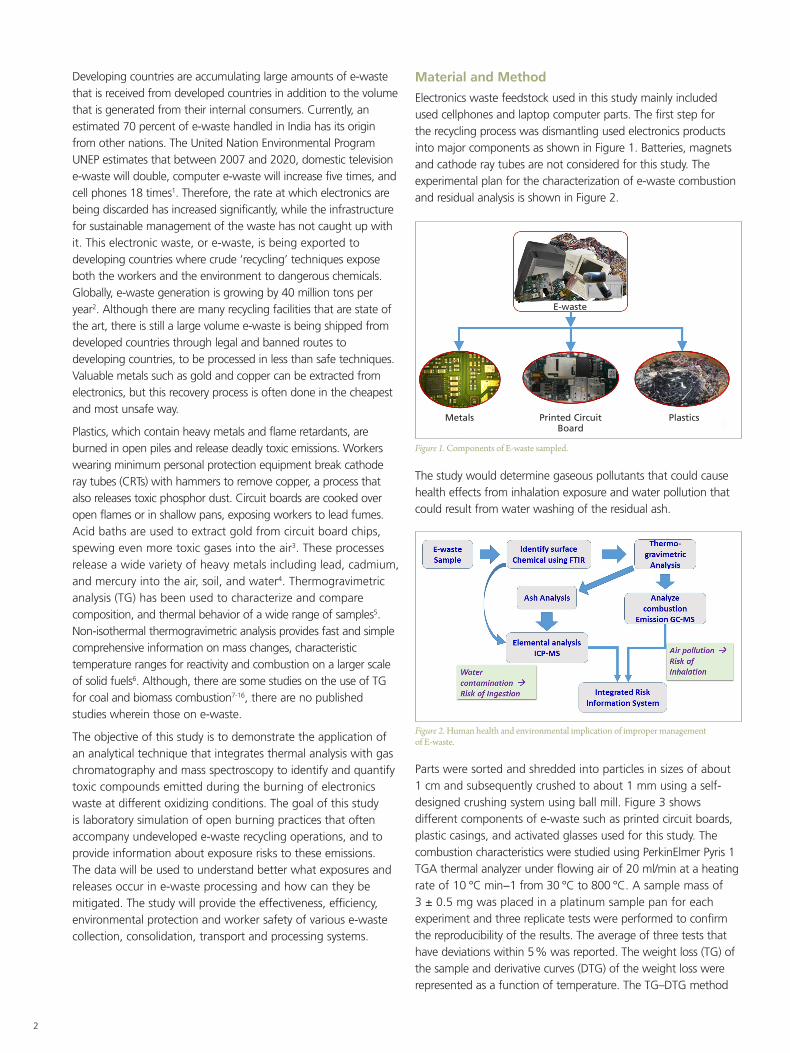
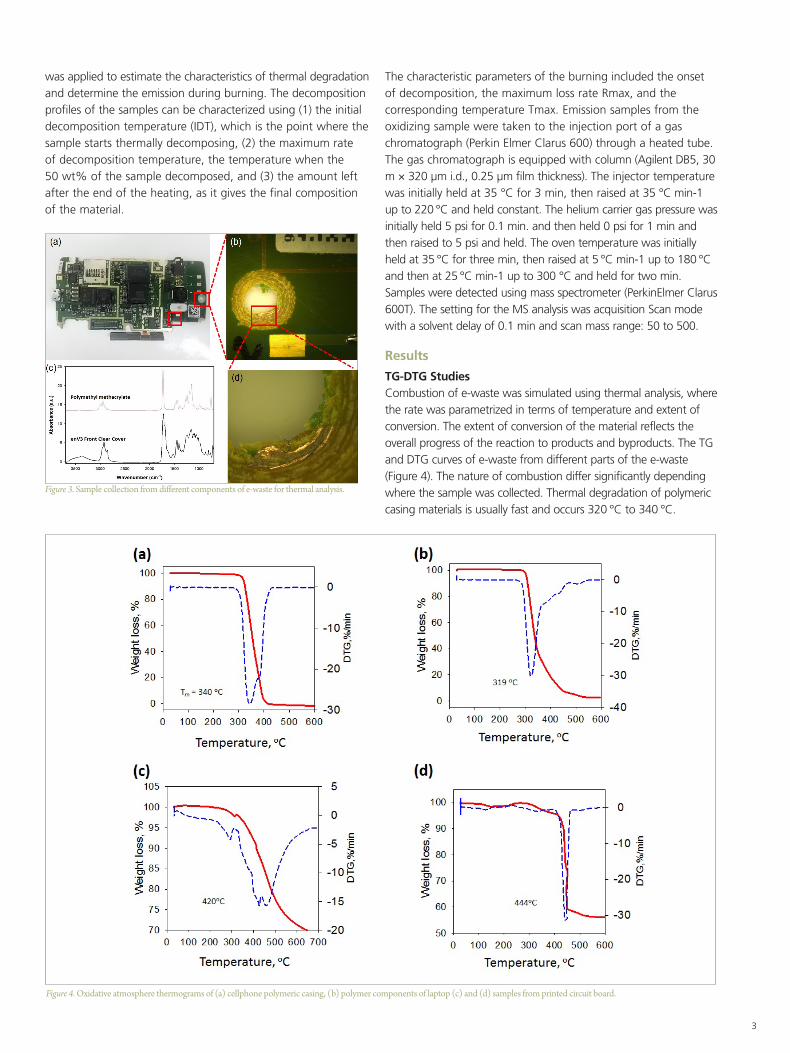
Electronics waste feedstock used in this study mainly included used cellphones and laptop computer parts. The first step for the recycling process was dismantling used electronics products into major components as shown in Figure 1. Batteries, magnets and cathode ray tubes are not considered for this study. The experimental plan for the characterization of e-waste combustion and residual analysis is shown in Figure 2.
The study would determine gaseous pollutants that could cause health effects from inhalation exposure and water pollution that could result from water washing of the residual ash.
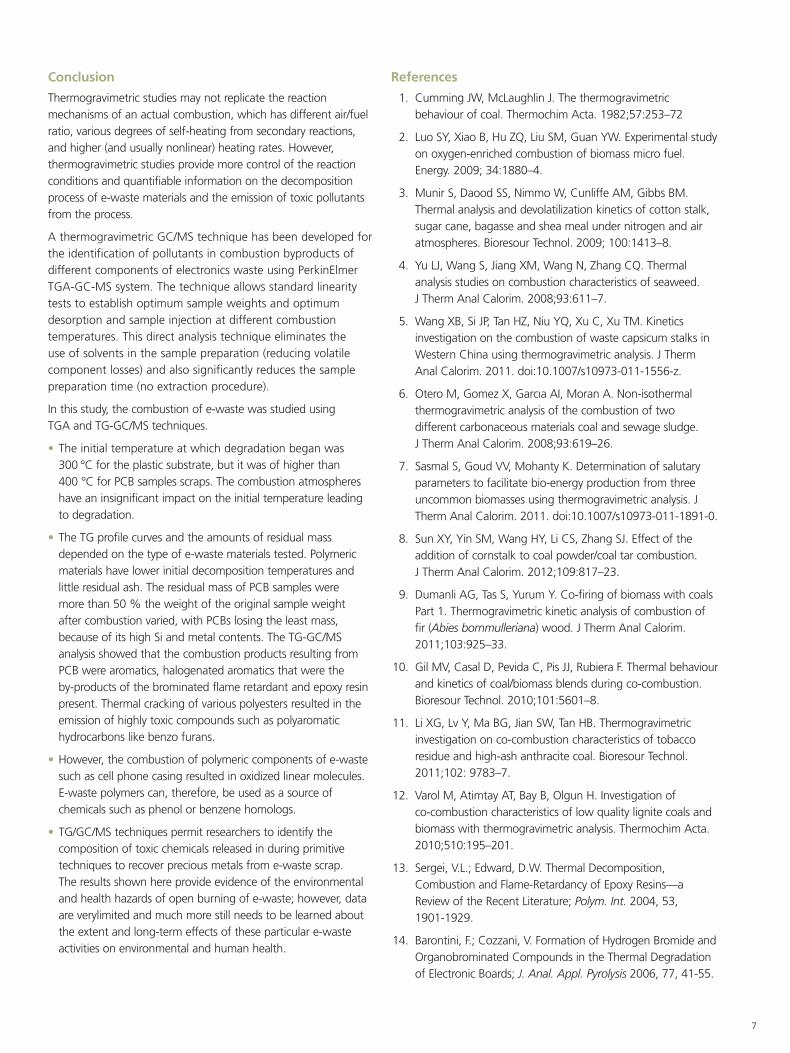
Parts were sorted and shredded into particles in sizes of about 1 cm and subsequently crushed to about 1 mm using a self-designed crushing system using ball mill. Figure 3 shows different components of e-waste such as printed circuit boards, plastic casings, and activated glasses used for this study. The combustion characteristics were studied using PerkinElmer Pyris 1 TGA thermal analyzer under flowing air of 20 ml/min at a heating rate of 10 °C min−1 from 30 °C to 800 °C. A sample mass of 3 ± 0.5 mg was placed in a platinum sample pan for each experiment and three replicate tests were performed to confirm the reproducibility of the results. The average of three tests that have deviations within 5 % was reported. The weight loss (TG) of the sample and derivative curves (DTG) of the weight loss were represented as a function of temperature. The TG–DTG method
Figure 1. Components of E-waste sampled.
E-waste
Printed Circuit Board
Metals Plastics
Figure 2. Human health and environmental implication of improper management of E-waste.
3
was applied to estimate the characteristics of thermal degradation and determine the emission during burning. The decomposition profiles of the samples can be characterized using (1) the initial decomposition temperature (IDT), which is the point where the sample starts thermally decomposing, (2) the maximum rate of decomposition temperature, the temperature when the 50 wt% of the sample decomposed, and (3) the amount left after the end of the heating, as it gives the final composition of the material.
The characteristic parameters of the burning included the onset of decomposition, the maximum loss rate Rmax, and the corresponding temperature Tmax. Emission samples from the oxidizing sample were taken to the injection port of a gas chromatograph (Perkin Elmer Clarus 600) through a heated tube. The gas chromatograph is equipped with column (Agilent DB5, 30 m × 320 μm i.d., 0.25 μm film thickness). The injector temperature was initially held at 35 °C for 3 min, then raised at 35 °C min-1 up to 220 °C and held constant. The helium carrier gas pressure was initially held 5 psi for 0.1 min. and then held 0 psi for 1 min and then raised to 5 psi and held. The oven temperature was initially held at 35 °C for three min, then raised at 5 °C min-1 up to 180 °C and then at 25 °C min-1 up to 300 °C and held for two min. Samples were detected using mass spectrometer (PerkinElmer Clarus 600T). The setting for the MS analysis was acquisition Scan mode with a solvent delay of 0.1 min and scan mass range: 50 to 500.
Results
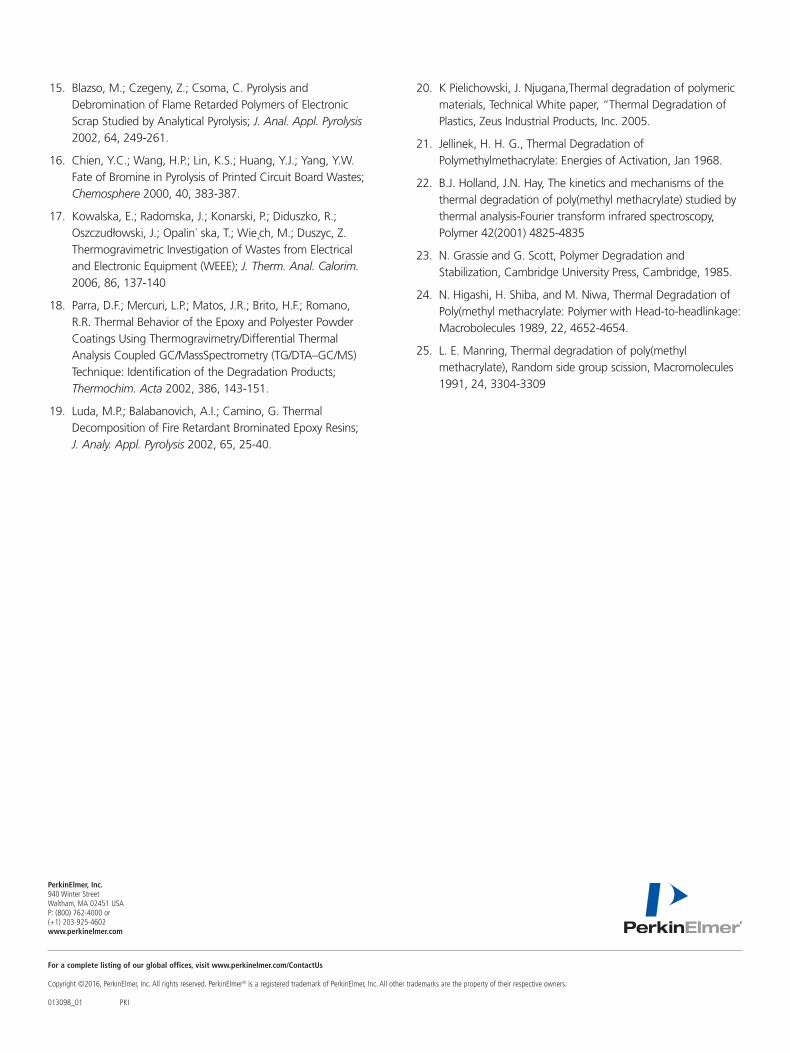
TG-DTG StudiesCombustion of e-waste was simulated using thermal analysis, where the rate was parametrized in terms of temperature and extent of conversion. The extent of conversion of the material reflects the overall progress of the reaction to products and byproducts. The TG and DTG curves of e-waste from different parts of the e-waste (Figure 4). The nature of combustion differ significantly depending where the sample was collected. Thermal degradation of polymeric casing materials is usually fast and occurs 320 °C to 340 °C.
Figure 3. Sample collection from different components of e-waste for thermal analysis.
Figure 4. Oxidative atmosphere thermograms of (a) cellphone polymeric casing, (b) polymer components of laptop (c) and (d) samples from printed circuit board.
4
The TG plots for polymer casing samples were smooth with single DTG curves. The TG curve shows close to 100 % weight loss at 600 °C indicating that combustion of polymeric components leaves no residual ash (Figure 4a, 4b). Summary of the thermograph of the four samples is given in Table 1. The onset of the weight loss for the TG curves also reflects the stability of the samples. Samples from polymer cases had initial decomposition temperature 317 °C and 298 °C (Figure 4a and 4b), whereas printed circuit board samples start to decompose at higher temperatures of 362 °C and 413 °C, respectively. Combustion of samples from printed circuit board developed in multiple stages that may include volatilization and char combustion at 444 °C (Figure 4c and 4d). After a rapid loss of weight and release of combustion emission, 50+wt% residual mass remained. The combustion profile for the various components of e-waste was different. The DTG curve shows the heterogeneity of printed circuit board samples.
Integrated TG-GC-MS Analysis for Emission AnalysisE-waste contains high levels of halogens, such as circuit boards containing brominated flame retardants, while the wires are
covered with polyvinylchloride (PVC) plastic. Combustion of e-waste not only has the potential of vaporizing large quantities of semivolatile toxic elements but also has the potential to produce toxic halogenated organic pollutants, including polychlorinated and polybrominated dibenzo-p-dioxins and furans.These organic compounds are persistent, bio-accumulate in the environment, and have toxic effects on reproductive, developmental, and immunological functions.
Combustion of Printed Circuit BoardThe qualitative analysis of pyrolysis products released during the combustion of printed circuit board (PCB) samples was carried out using TGA/GC/MS, and the results are presented in Figure 5. The mass spectrum of the most dominant peaks is shown in Figure 6. The combustion products derived from PCB substrate scrap consisted mainly of C4 (oxazole), C6 (phenol), aniline (C6H5NH2), C7 (Bromo toluene), and C6–C10 components such as 1-methoxy-2-methyl benzene (C8H10O). The primary components were acetone, phenol, Bromo toluene, and C9 (3-methyl-2,3-dihydro-1-benzofuran). From the characteristic peaks of the spectra (Figure 6 the qualitative components are listed in Table 1. The combustion products of PCB waste were composed of a mixture of aromatic and aromatic amines organic compounds of C6–C16. The presence of compounds such as aromatic and phenolic compounds gives evidence of the occurrence of the bisphenol-A used in the epoxy formulation10-15. Combustion products of unbrominated epoxy resin used for printed circuit boards are substituted phenols and aromatics, indicating a favored splitting of the O–CH2 and C(phenyl)–C bonds16-18.
Table 1. Summary of Thermogravimetric characteristics of electronic waste samples.
Sample Initial
Decomposition Temperature, °C
Temperature at Maximum Weight change (50%), °C
% Residual
massCellphone Casing 319 340 0
Polymeric materials 298.5 319 3.72
PCB1* 313 420 56.8
PCB2 419 444 67.7
* Printed circuit board
Figure 5. Integrated TG-GC-MS system for thermal analysis and emitted gas characterization.
5
Figure 6. Chromatograph of emitted gas analysis from combustion of PCB sample.
Figure 7. Mass spectrum of selected characteristic peaks separated from chromatograms during the analysis of (a-c) PCB combustion samples, and (d-f) plastic casing combustion sample.
Combustion of Plastic Casing The identification of pyrolysis products released from the thermal degradation of plastic samples from cellphone and laptop cases was carried out using TG-GC/MS. The results are presented in Figure 7. The products derived from plastic components of e-waste consisted of butylesters, methoxy 2—butyne, 2-propenoic acid, 2-butenoic acid, iso-butyltiaglate, Some of the compounds produced by the combustion of plastic e-waste materials in these tests are identified and listed in Table 1.
6
Table 2. List of combustion products from plastic components of E-waste.
Table 3. List of combustion products from printed circuit board of E-waste.
Peak Retention Time (min) Compound Formula CAS # Molecular Weight
The relative abundance of emitted combustion products are compared. Compared with the combustion characteristics of PCB substrate and plastic components of e-waste scrap, 2-methyl methyl ester 2 propenioc acid was the main product rather than aromatic compounds. Moreover, the relative amounts of some products (e.g., C4 [1,3-butadiene and 2-methoxy-1-propene]) were significantly higher. The cellphone casing was identified as polymethyl methacrylate. The volatile thermal degradatation product of polymethyl methacrylate at approximately
340 °C is the chain radical forming methyl methacrylate. Initiation of PMMA depolymerization proceeds via disruption of the link with the formation of free radicals at a first-order rate. At temperatures between 340 and 360 °C the thermal degradation of PMMA was initiated by a mixture of chain end and chain scission processes, followed by depropagation25. These results confirmed previous studies done using conventional techniques [19-25]. However, the hyphenated technique afforded a much faster analysis with little need for sample preparations.
Figure 8. Methyl methacrylate is generated from the thermal degradation of polymethyl methacrylate.
7
Conclusion
Thermogravimetric studies may not replicate the reaction mechanisms of an actual combustion, which has different air/fuel ratio, various degrees of self-heating from secondary reactions, and higher (and usually nonlinear) heating rates. However, thermogravimetric studies provide more control of the reaction conditions and quantifiable information on the decomposition process of e-waste materials and the emission of toxic pollutants from the process.
A thermogravimetric GC/MS technique has been developed for the identification of pollutants in combustion byproducts of different components of electronics waste using PerkinElmer TGA-GC-MS system. The technique allows standard linearity tests to establish optimum sample weights and optimum desorption and sample injection at different combustion temperatures. This direct analysis technique eliminates the use of solvents in the sample preparation (reducing volatile component losses) and also significantly reduces the sample preparation time (no extraction procedure).
In this study, the combustion of e-waste was studied using TGA and TG-GC/MS techniques.
• The initial temperature at which degradation began was 300 °C for the plastic substrate, but it was of higher than 400 °C for PCB samples scraps. The combustion atmospheres have an insignificant impact on the initial temperature leading to degradation.
• The TG profile curves and the amounts of residual mass depended on the type of e-waste materials tested. Polymeric materials have lower initial decomposition temperatures and little residual ash. The residual mass of PCB samples were more than 50 % the weight of the original sample weight after combustion varied, with PCBs losing the least mass, because of its high Si and metal contents. The TG-GC/MS analysis showed that the combustion products resulting from PCB were aromatics, halogenated aromatics that were the by-products of the brominated flame retardant and epoxy resin present. Thermal cracking of various polyesters resulted in the emission of highly toxic compounds such as polyaromatic hydrocarbons like benzo furans.
• However, the combustion of polymeric components of e-waste such as cell phone casing resulted in oxidized linear molecules. E-waste polymers can, therefore, be used as a source of chemicals such as phenol or benzene homologs.
• TG/GC/MS techniques permit researchers to identify the composition of toxic chemicals released in during primitive techniques to recover precious metals from e-waste scrap. The results shown here provide evidence of the environmental and health hazards of open burning of e-waste; however, data are verylimited and much more still needs to be learned about the extent and long-term effects of these particular e-waste activities on environmental and human health.
References
1. Cumming JW, McLaughlin J. The thermogravimetric behaviour of coal. Thermochim Acta. 1982;57:253–72
2. Luo SY, Xiao B, Hu ZQ, Liu SM, Guan YW. Experimental study on oxygen-enriched combustion of biomass micro fuel. Energy. 2009; 34:1880–4.
3. Munir S, Daood SS, Nimmo W, Cunliffe AM, Gibbs BM. Thermal analysis and devolatilization kinetics of cotton stalk, sugar cane, bagasse and shea meal under nitrogen and air atmospheres. Bioresour Technol. 2009; 100:1413–8.
4. Yu LJ, Wang S, Jiang XM, Wang N, Zhang CQ. Thermal analysis studies on combustion characteristics of seaweed. J Therm Anal Calorim. 2008;93:611–7.
5. Wang XB, Si JP, Tan HZ, Niu YQ, Xu C, Xu TM. Kinetics investigation on the combustion of waste capsicum stalks in Western China using thermogravimetric analysis. J Therm Anal Calorim. 2011. doi:10.1007/s10973-011-1556-z.
6. Otero M, Gomez X, Garcıa AI, Moran A. Non-isothermal thermogravimetric analysis of the combustion of two different carbonaceous materials coal and sewage sludge. J Therm Anal Calorim. 2008;93:619–26.
7. Sasmal S, Goud VV, Mohanty K. Determination of salutary parameters to facilitate bio-energy production from three uncommon biomasses using thermogravimetric analysis. J Therm Anal Calorim. 2011. doi:10.1007/s10973-011-1891-0.
8. Sun XY, Yin SM, Wang HY, Li CS, Zhang SJ. Effect of the addition of cornstalk to coal powder/coal tar combustion. J Therm Anal Calorim. 2012;109:817–23.
9. Dumanli AG, Tas S, Yurum Y. Co-firing of biomass with coals Part 1. Thermogravimetric kinetic analysis of combustion of fir (Abies bornmulleriana) wood. J Therm Anal Calorim. 2011;103:925–33.
10. Gil MV, Casal D, Pevida C, Pis JJ, Rubiera F. Thermal behaviour and kinetics of coal/biomass blends during co-combustion. Bioresour Technol. 2010;101:5601–8.
11. Li XG, Lv Y, Ma BG, Jian SW, Tan HB. Thermogravimetric investigation on co-combustion characteristics of tobacco residue and high-ash anthracite coal. Bioresour Technol. 2011;102: 9783–7.
12. Varol M, Atimtay AT, Bay B, Olgun H. Investigation of co-combustion characteristics of low quality lignite coals and biomass with thermogravimetric analysis. Thermochim Acta. 2010;510:195–201.
13. Sergei, V.L.; Edward, D.W. Thermal Decomposition, Combustion and Flame-Retardancy of Epoxy Resins—a Review of the Recent Literature; Polym. Int. 2004, 53, 1901-1929.
14. Barontini, F.; Cozzani, V. Formation of Hydrogen Bromide and Organobrominated Compounds in the Thermal Degradation of Electronic Boards; J. Anal. Appl. Pyrolysis 2006, 77, 41-55.
For a complete listing of our global offices, visit www.perkinelmer.com/ContactUs
PerkinElmer, Inc. 940 Winter Street Waltham, MA 02451 USA P: (800) 762-4000 or (+1) 203-925-4602www.perkinelmer.com
15. Blazso, M.; Czegeny, Z.; Csoma, C. Pyrolysis and Debromination of Flame Retarded Polymers of Electronic Scrap Studied by Analytical Pyrolysis; J. Anal. Appl. Pyrolysis 2002, 64, 249-261.
16. Chien, Y.C.; Wang, H.P.; Lin, K.S.; Huang, Y.J.; Yang, Y.W. Fate of Bromine in Pyrolysis of Printed Circuit Board Wastes; Chemosphere 2000, 40, 383-387.
17. Kowalska, E.; Radomska, J.; Konarski, P.; Diduszko, R.; Oszczudłowski, J.; Opalin´ ska, T.; Wie˛ch, M.; Duszyc, Z. Thermogravimetric Investigation of Wastes from Electrical and Electronic Equipment (WEEE); J. Therm. Anal. Calorim. 2006, 86, 137-140
18. Parra, D.F.; Mercuri, L.P.; Matos, J.R.; Brito, H.F.; Romano, R.R. Thermal Behavior of the Epoxy and Polyester Powder Coatings Using Thermogravimetry/Differential Thermal Analysis Coupled GC/MassSpectrometry (TG/DTA–GC/MS) Technique: Identification of the Degradation Products; Thermochim. Acta 2002, 386, 143-151.
19. Luda, M.P.; Balabanovich, A.I.; Camino, G. Thermal Decomposition of Fire Retardant Brominated Epoxy Resins; J. Analy. Appl. Pyrolysis 2002, 65, 25-40.
20. K Pielichowski, J. Njugana,Thermal degradation of polymeric materials, Technical White paper, “Thermal Degradation of Plastics, Zeus Industrial Products, Inc. 2005.
21. Jellinek, H. H. G., Thermal Degradation of Polymethylmethacrylate: Energies of Activation, Jan 1968.
22. B.J. Holland, J.N. Hay, The kinetics and mechanisms of the thermal degradation of poly(methyl methacrylate) studied by thermal analysis-Fourier transform infrared spectroscopy, Polymer 42(2001) 4825-4835
23. N. Grassie and G. Scott, Polymer Degradation and Stabilization, Cambridge University Press, Cambridge, 1985.
24. N. Higashi, H. Shiba, and M. Niwa, Thermal Degradation of Poly(methyl methacrylate: Polymer with Head-to-headlinkage: Macrobolecules 1989, 22, 4652-4654.
25. L. E. Manring, Thermal degradation of poly(methyl methacrylate), Random side group scission, Macromolecules 1991, 24, 3304-3309