29
Characterizing organics to mitigate UF fouling 2017 NYS AWWA Spring Meeting Amanda Scott, Product Manager, GE Analytical Instruments

Characterizing organics to mitigate UF fouling
2017 NYS AWWA Spring Meeting Amanda Scott, Product Manager, GE Analytical Instruments
Agenda
• Outline and Goals of the Study
• Value and Definition of Organics Monitoring
• Introduction to Organics Characterization
• Data Results and Analysis from Sample Sites
• Conclusions and Next Steps
Goals 1. Use enhanced analytical tools to investigate correlations between feed water quality, UF pretreatment, and UF performance 2. Apply data to optimize systems and reduce risk 3. Harness learnings to predict future performance and create better membrane systems
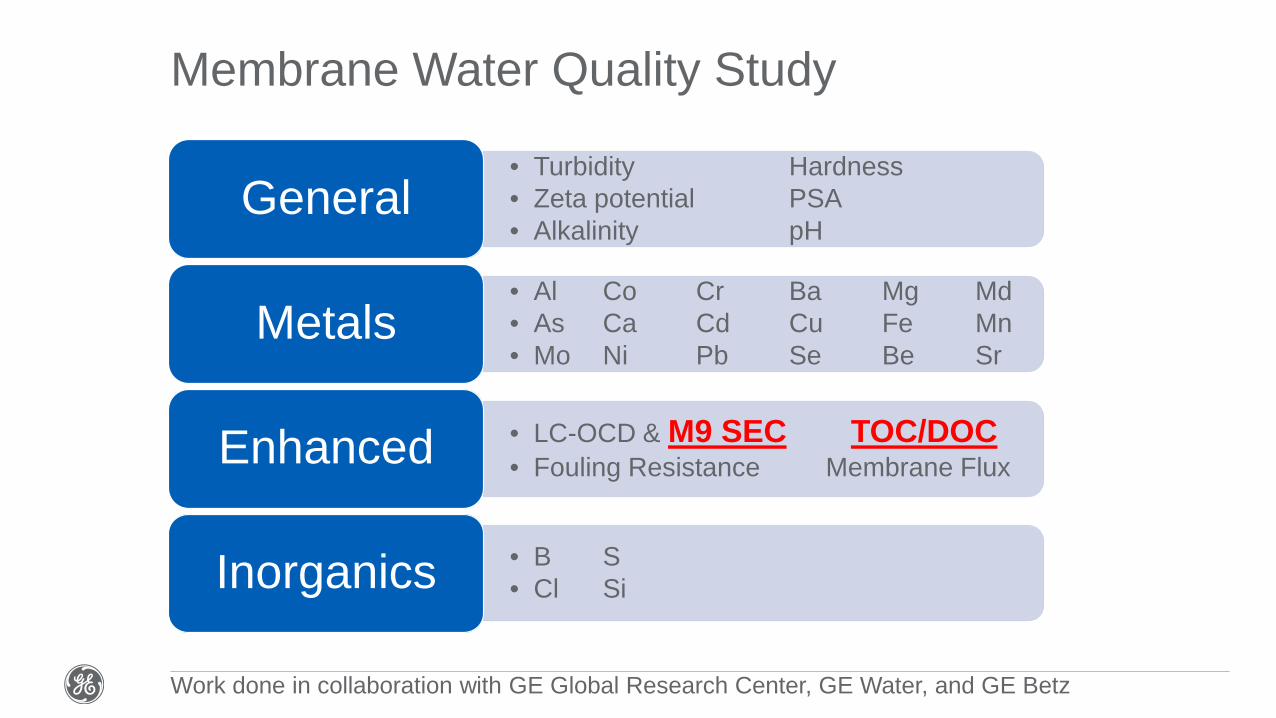
Membrane Water Quality Study
• Turbidity Hardness • Zeta potential PSA • Alkalinity pH
General
• Al Co Cr Ba Mg Md • As Ca Cd Cu Fe Mn • Mo Ni Pb Se Be Sr
Metals
• LC-OCD & M9 SEC TOC/DOC • Fouling Resistance Membrane Flux Enhanced
• B S • Cl Si Inorganics
Work done in collaboration with GE Global Research Center, GE Water, and GE Betz

Value of Organics Monitoring
TOC, as defined in EPA Method 415.3, “Is the gross amount of organic matter found in natural water. Suspended particulate, colloidal, and dissolved organic matter are part of the TOC measurement.”

What contributes to TOC?
• Taste and Odor • Microbes and bacteria
• Reclaim, Waste • Industry (Oil, Gas, Pharmaceutical)
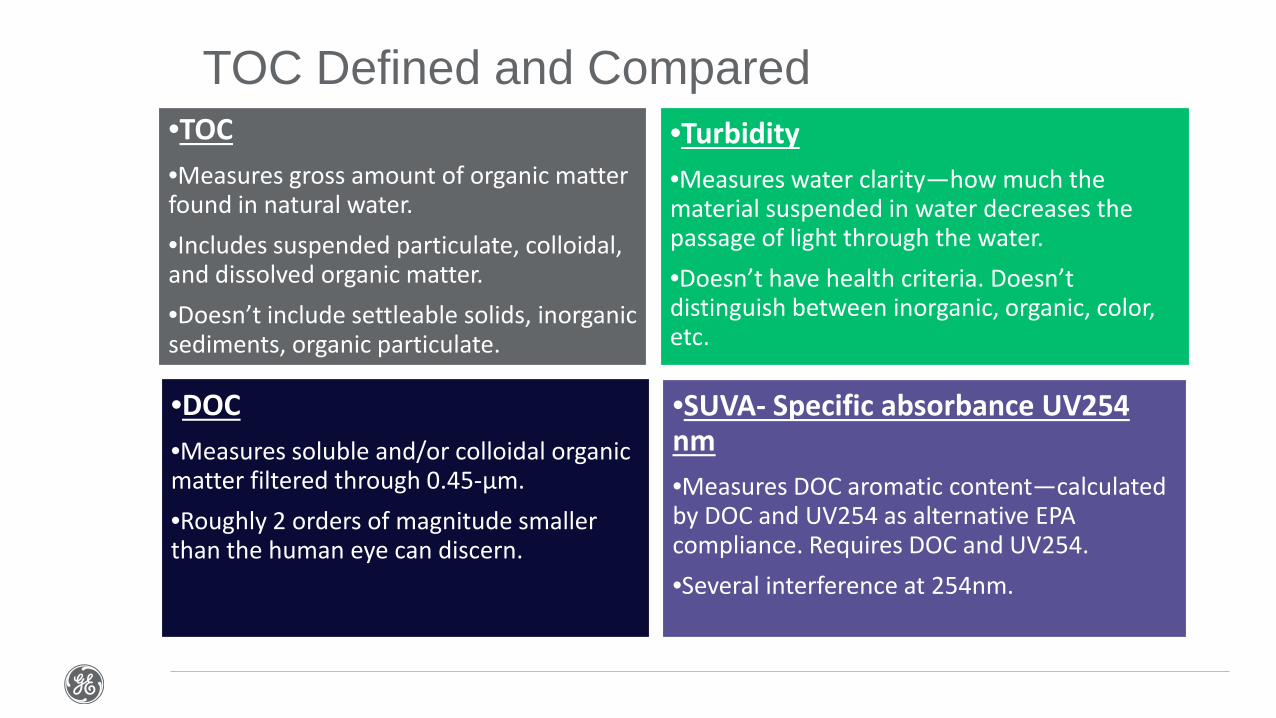
TOC Defined and Compared •TOC •Measures gross amount of organic matter found in natural water. •Includes suspended particulate, colloidal, and dissolved organic matter. •Doesn’t include settleable solids, inorganic sediments, organic particulate.
•Turbidity •Measures water clarity—how much the material suspended in water decreases the passage of light through the water. •Doesn’t have health criteria. Doesn’t distinguish between inorganic, organic, color, etc.
•DOC •Measures soluble and/or colloidal organic matter filtered through 0.45-μm. •Roughly 2 orders of magnitude smaller than the human eye can discern.
•SUVA- Specific absorbance UV254 nm •Measures DOC aromatic content—calculated by DOC and UV254 as alternative EPA compliance. Requires DOC and UV254. •Several interference at 254nm.

TOC Defined and Compared TOC • Gross amount of organic matter found in natural water. • Includes suspended particulate, colloidal, & dissolved organic matter. • Not settleable solids, inorganic sediments, organic particulate. • Takes <10min. Good precision & accuracy. More stable baseline.
BOD Biochemical Oxygen Demand • Measures biologically active
organic matter indicating amount of O2 needed for biological degradation.
• Every organic compound has a different BOD.
• Takes 5 days. Poor precision.
COD Chemical Oxygen Demand • Measures chemical oxidative
activity using digestion method.
• Every organic compound has a different COD.
• Takes 2h. Requires hazardous chemicals. Poor precision.
Used to measure degree of pollution in wastewaters.

• TOC is useful for detecting the presence of many organic compounds.
• Most organic contaminants should trigger a change in TOC at concentrations well below the lethal concentration.
TOC as an Indicator for Contamination Interim Guidance on Planning for Contamination Warning System Deployment
Control Treatment and Minimize Contamination
• Organics in source water change based on season, location, and events (weather, spill, pollution, security threat). When water quality changes, it requires treatment processes to change.
• High levels of organics can foul or blind membrane systems. Adequate pre-treatment is required to prevent membrane fouling. Understanding contaminant removal efficiencies can be used to determine washing, regeneration, and back-flushing regimes.

TOC for Membrane Optimization
MF/UF
NF/RO
• Prove the Pilot: • Optimize pretreatment for TOC removal • Minimize chemical costs for coagulation
Protect Membranes from Fouling: • Prevent organic fouling and corrosive organics formation • Prevent inorganic fouling by controlling pretreatment •Increase Lifetime of Membranes:
• Optimize backflush routines • Test membrane integrity • Monitor removal efficiencies over time
“Predominant [membrane] fouling causes were NOM and some combination of iron and NOM” AWWA Opflow Feb 2017

Organics Characterization Using Size Exclusion Chromatography Coupled with Organic Carbon Detection
Characterization of Organics
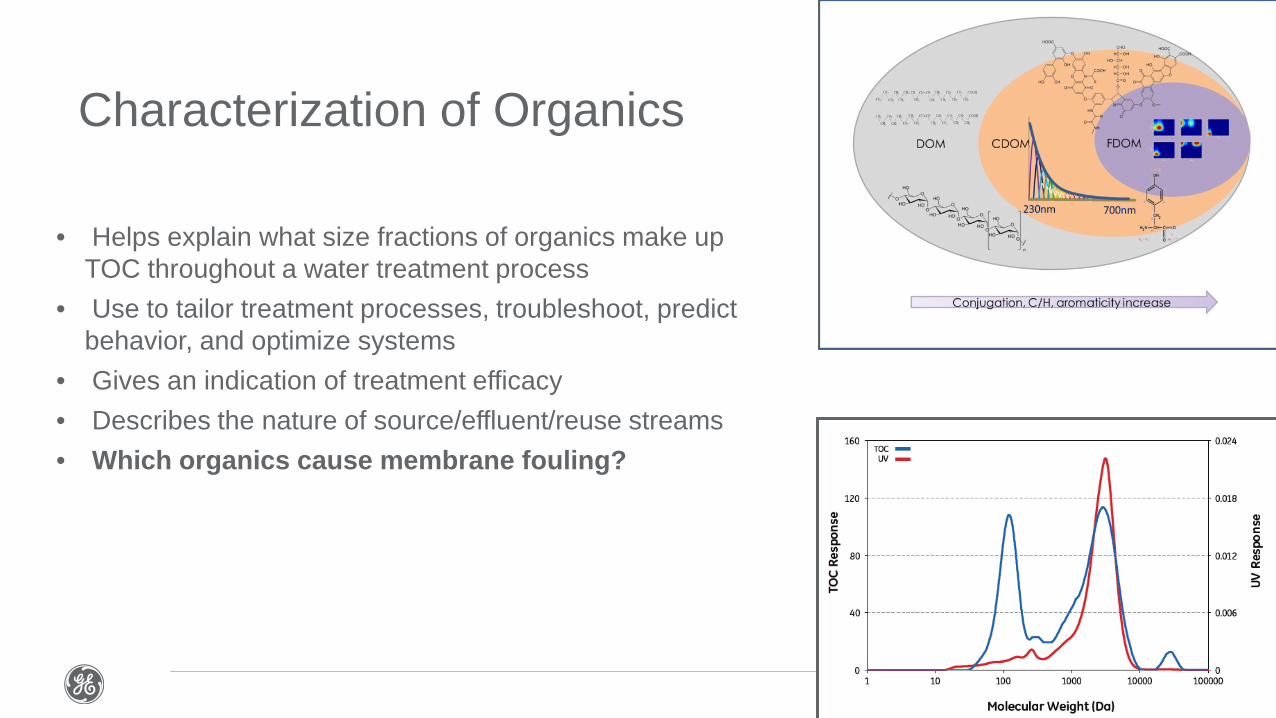
• Helps explain what size fractions of organics make up TOC throughout a water treatment process
• Use to tailor treatment processes, troubleshoot, predict behavior, and optimize systems
• Gives an indication of treatment efficacy • Describes the nature of source/effluent/reuse streams • Which organics cause membrane fouling?
Characterization of Organics
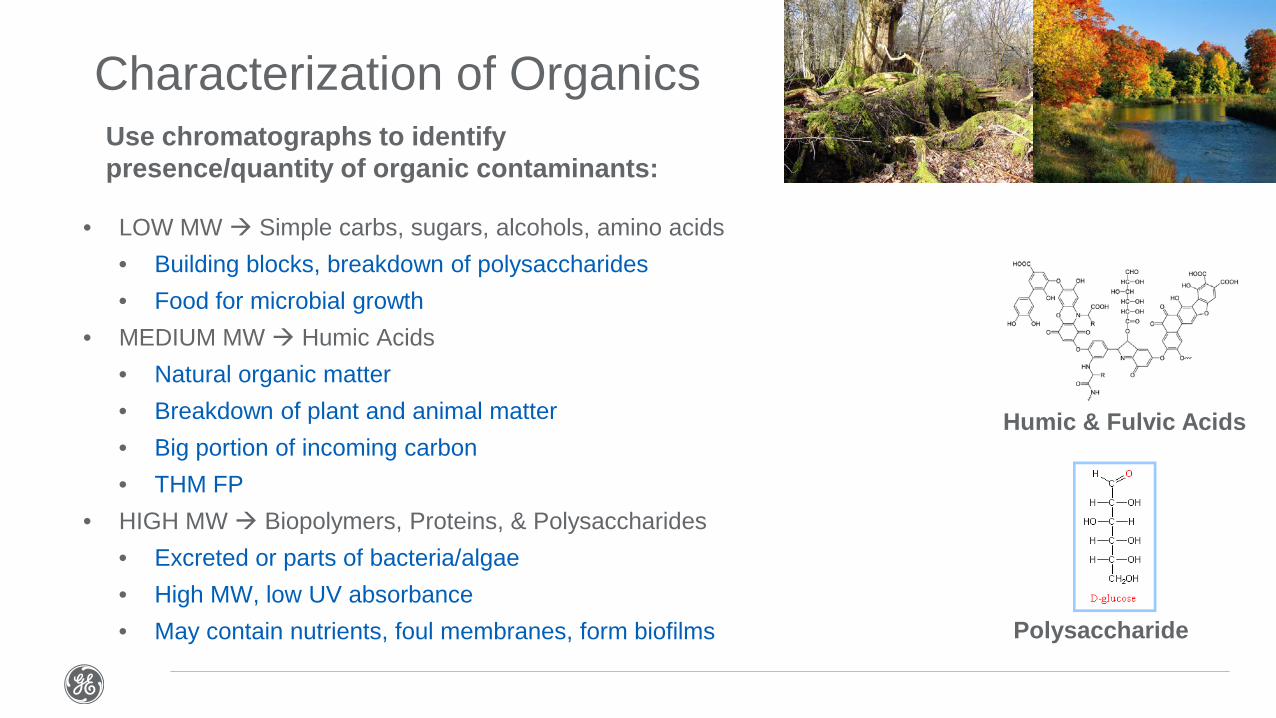
• LOW MW Simple carbs, sugars, alcohols, amino acids
• Building blocks, breakdown of polysaccharides • Food for microbial growth
• MEDIUM MW Humic Acids • Natural organic matter • Breakdown of plant and animal matter • Big portion of incoming carbon • THM FP
• HIGH MW Biopolymers, Proteins, & Polysaccharides • Excreted or parts of bacteria/algae • High MW, low UV absorbance • May contain nutrients, foul membranes, form biofilms
Polysaccharide
Humic & Fulvic Acids
Use chromatographs to identify presence/quantity of organic contaminants:
Overview of M9 SEC System
M9 SEC Detector
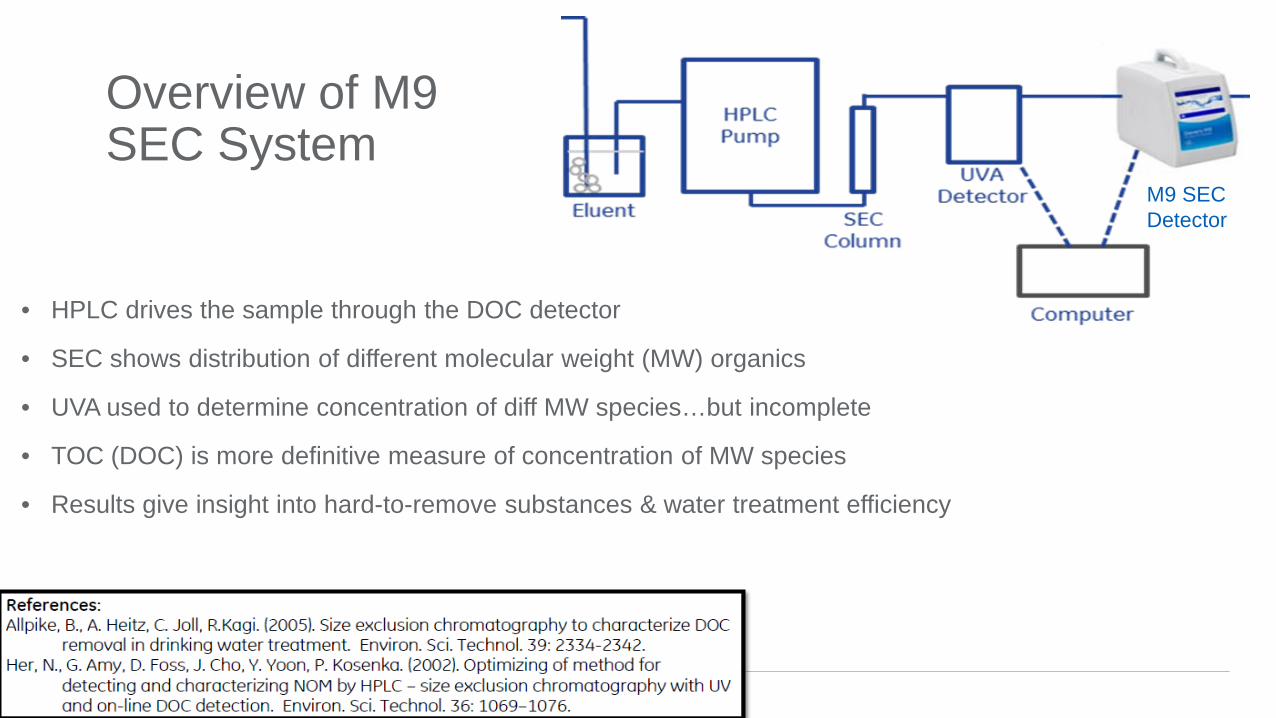
• HPLC drives the sample through the DOC detector
• SEC shows distribution of different molecular weight (MW) organics
• UVA used to determine concentration of diff MW species…but incomplete
• TOC (DOC) is more definitive measure of concentration of MW species
• Results give insight into hard-to-remove substances & water treatment efficiency

Multiple Wavelength Detector (MWD)
Manual injector
Column
Isocratic Pump
M9 SEC
M9 SEC Instrument Set Up at GE Analytical Instruments in Applications Lab
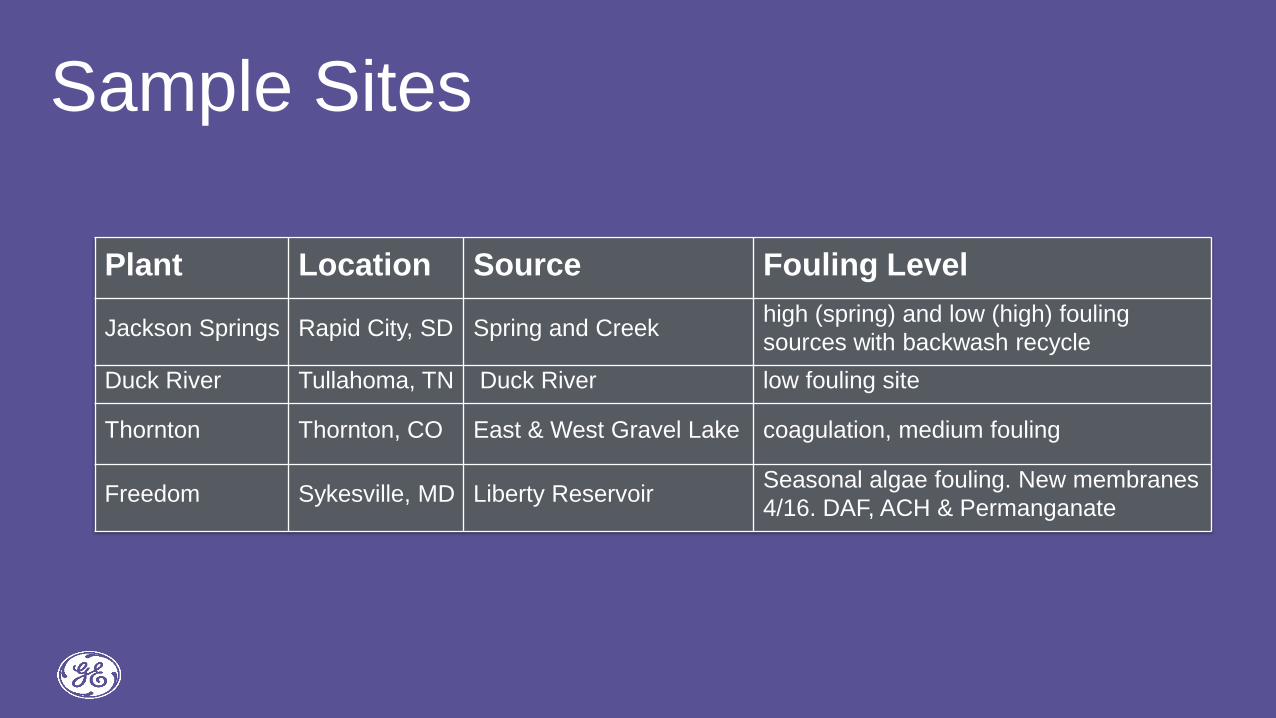
Sample Sites
Plant Location Source Fouling Level
Jackson Springs Rapid City, SD Spring and Creek high (spring) and low (high) fouling sources with backwash recycle
Duck River Tullahoma, TN Duck River low fouling site
Thornton Thornton, CO East & West Gravel Lake coagulation, medium fouling
Freedom Sykesville, MD Liberty Reservoir Seasonal algae fouling. New membranes 4/16. DAF, ACH & Permanganate
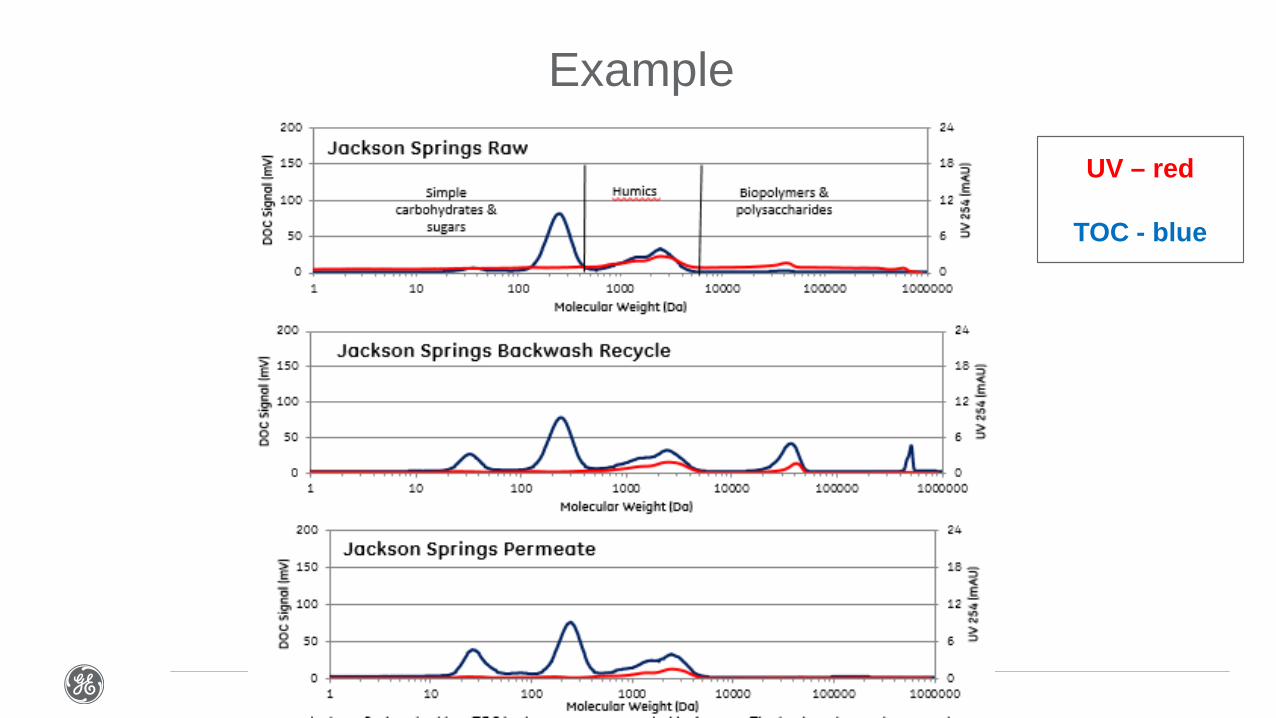
Example
UV – red
TOC - blue
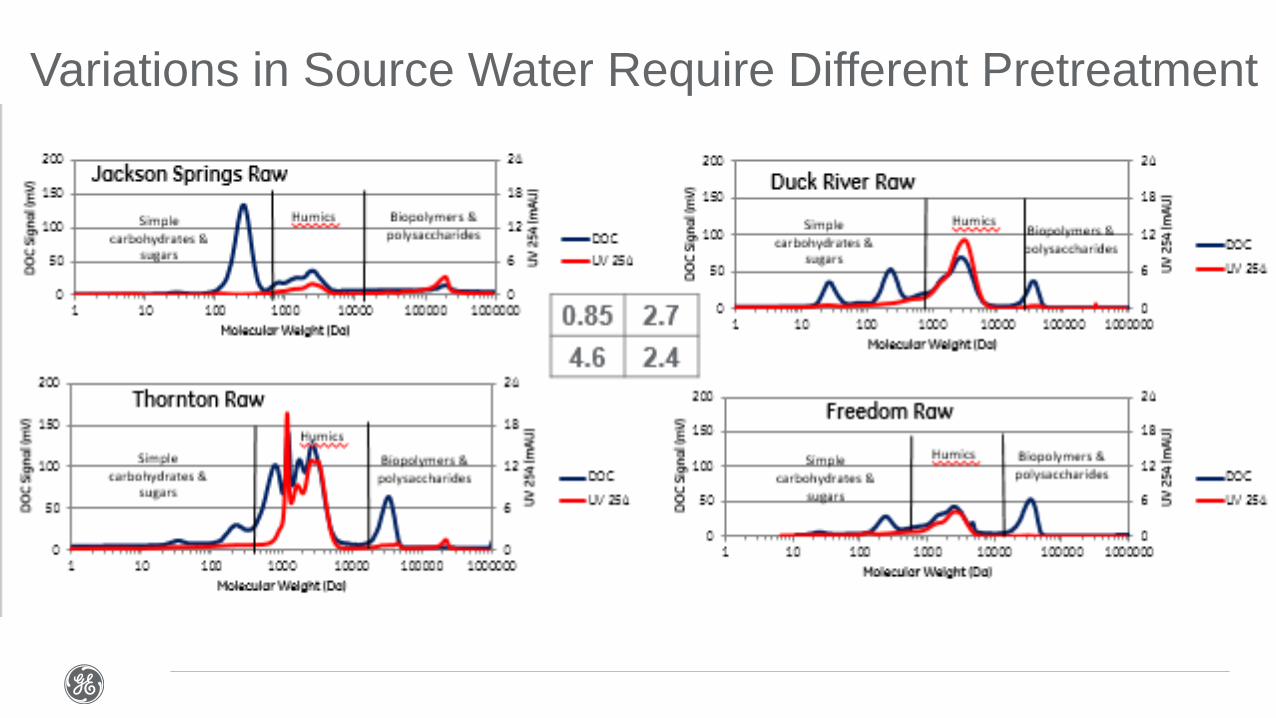
Variations in Source Water Require Different Pretreatment

Jackson Springs
• Rapid City, South Dakota 8 MGD
• Water Source: Spring – low fouling Creek water – high fouling
• High and low fouling water sources with backwash recycle to maximize water recovery
• Relatively low raw TOC which decreases from August to September
mg/L C Raw Backwash Recycle Permeate
August TOC 0.9 1.5 0.95
September TOC 0.85 1.1 0.85
October TOC 0.85 1.0 0.84
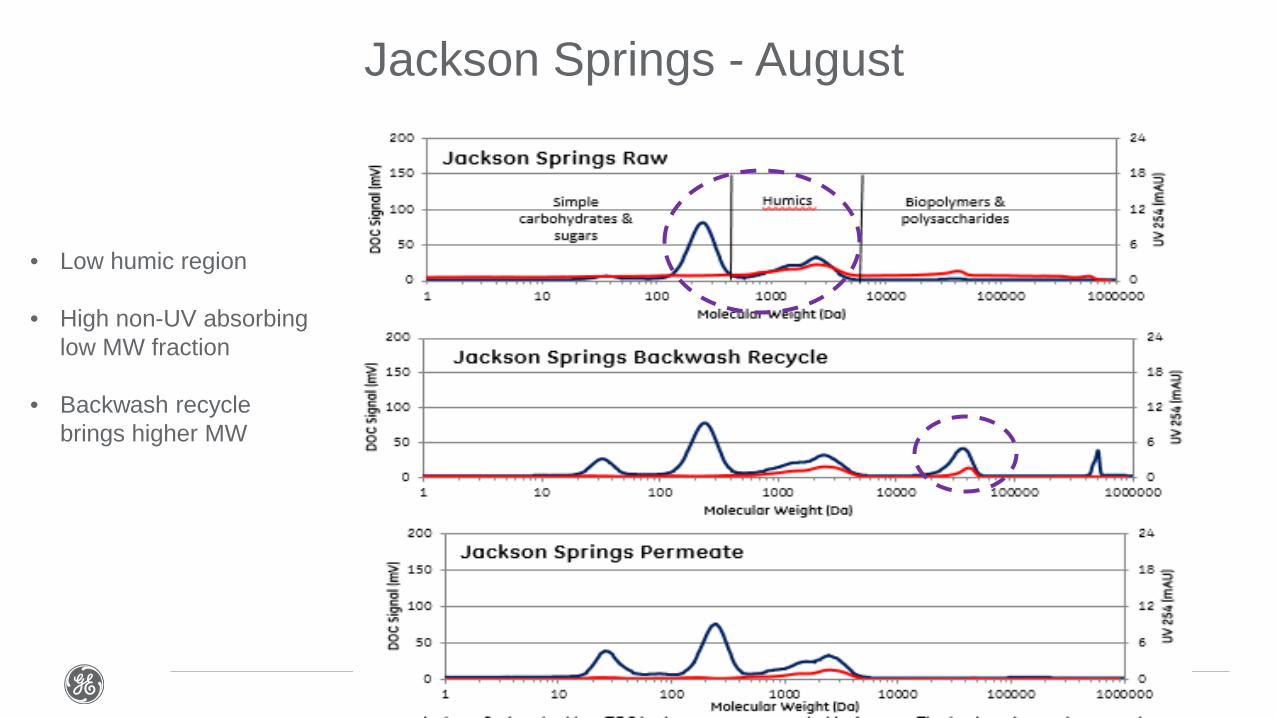
Jackson Springs - August
• Low humic region
• High non-UV absorbing low MW fraction
• Backwash recycle brings higher MW
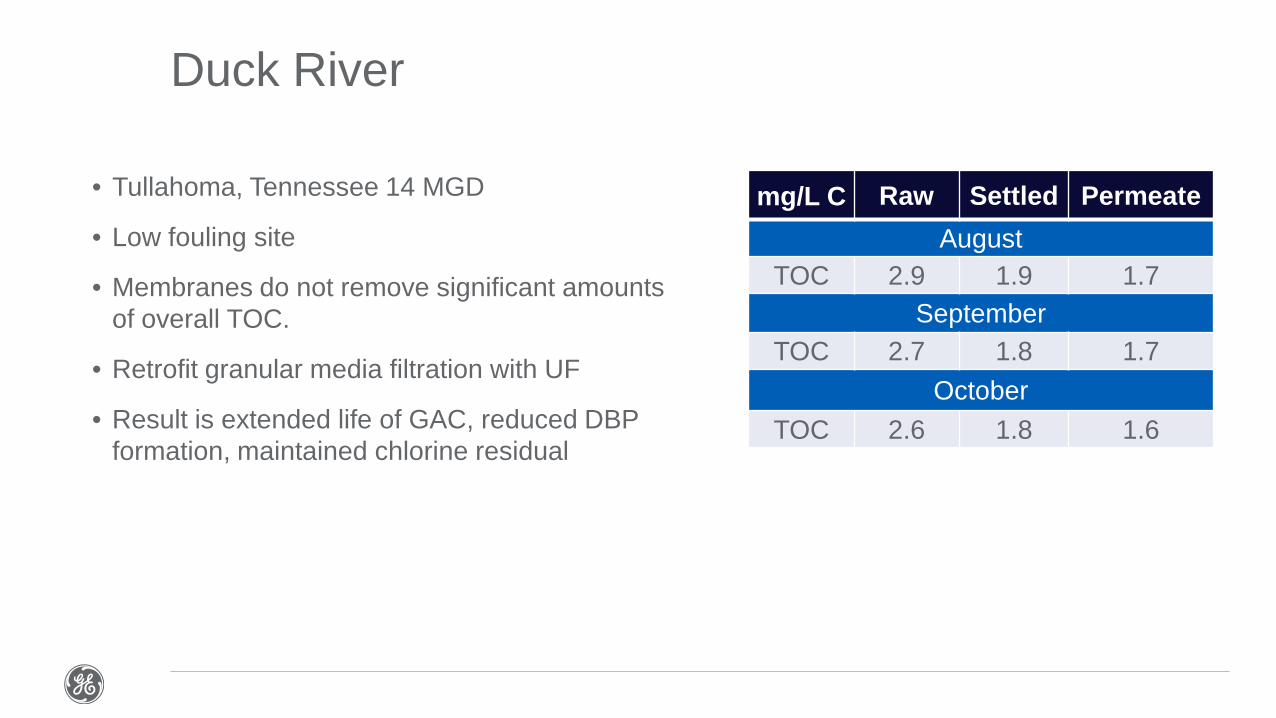
Duck River
• Tullahoma, Tennessee 14 MGD
• Low fouling site
• Membranes do not remove significant amounts of overall TOC.
• Retrofit granular media filtration with UF
• Result is extended life of GAC, reduced DBP formation, maintained chlorine residual
mg/L C Raw Settled Permeate August
TOC 2.9 1.9 1.7 September
TOC 2.7 1.8 1.7 October
TOC 2.6 1.8 1.6
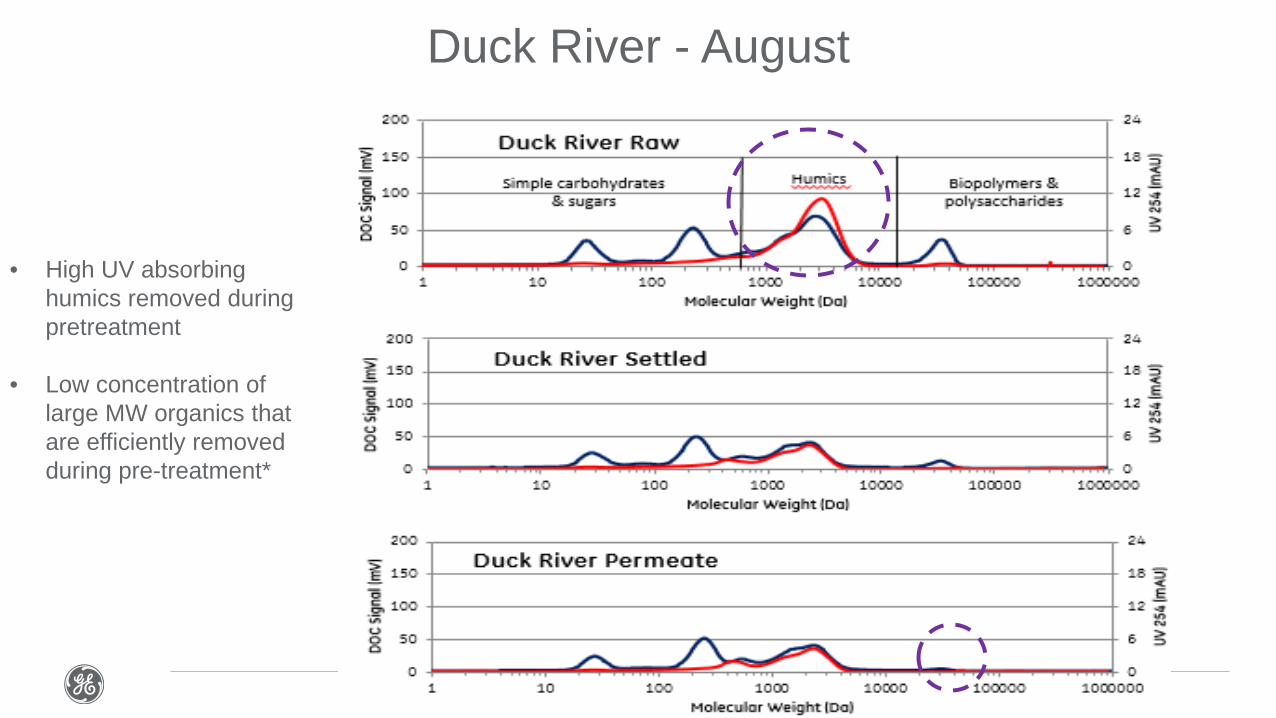
Duck River - August
• High UV absorbing humics removed during pretreatment
• Low concentration of large MW organics that are efficiently removed during pre-treatment*

Thornton
• Columbine, CO 50 MGD
• Water Source: East & West Gravel Lake
• Coagulation Pre-treatment
• Medium Fouling
• Pretreatment removes about ½ of overall TOC
• Plant is downstream of 10-15 wastewater treatment plants bringing hardness, nitrates, and TDS
• Retrofit existing granular media filtration to UF to increase capacity and address water quality concerns
mg/L C Raw Settled Permeate
August TOC 4.4 2.5 2.2
September TOC 4.6 3.3 2.9
October TOC 4.7 3.5 3.2

Thornton – September
• Humics break down to smaller organics in settled water
• Sizeable non-UV absorbing high MW fraction that is only partially removed during pre-treatment
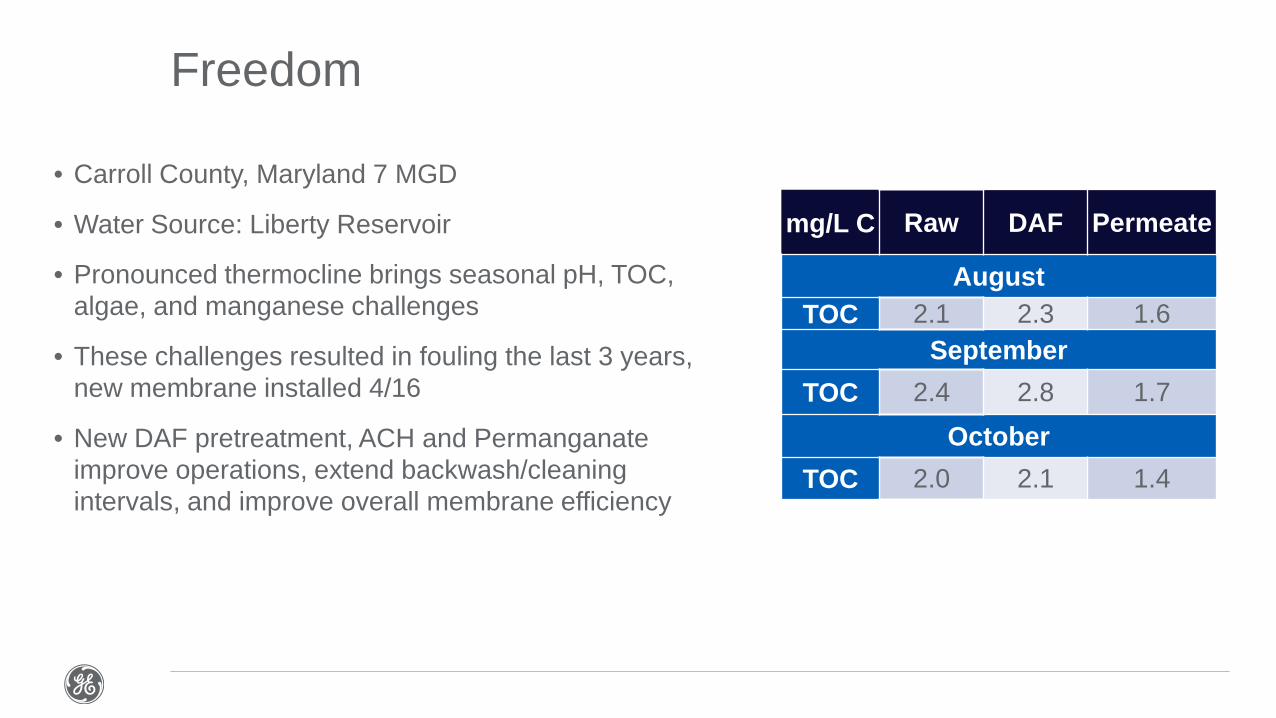
Freedom
• Carroll County, Maryland 7 MGD
• Water Source: Liberty Reservoir
• Pronounced thermocline brings seasonal pH, TOC, algae, and manganese challenges
• These challenges resulted in fouling the last 3 years, new membrane installed 4/16
• New DAF pretreatment, ACH and Permanganate improve operations, extend backwash/cleaning intervals, and improve overall membrane efficiency
mg/L C Raw DAF Permeate
August TOC 2.1 2.3 1.6
September TOC 2.4 2.8 1.7
October TOC 2.0 2.1 1.4

Freedom – September
• High MW organics present in raw water not removed by DAF but removed by membranes
• Little change in medium-low MW organics throughout treatment
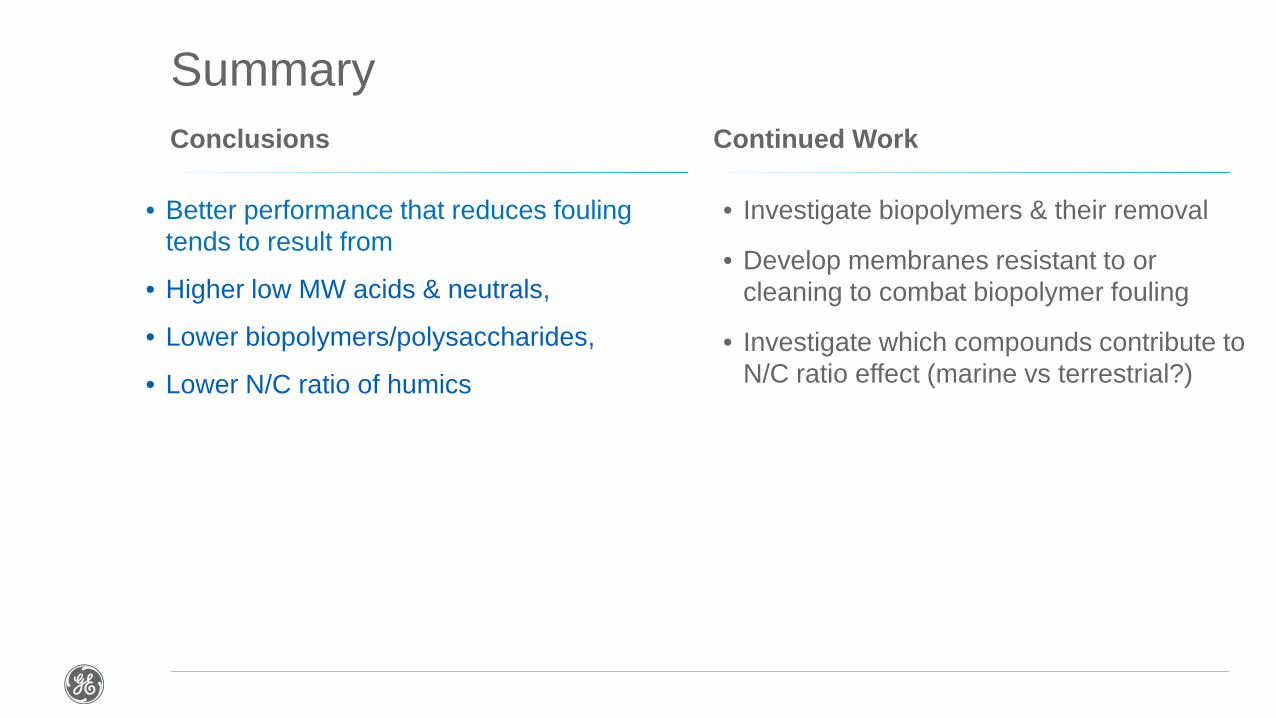
Summary Conclusions Continued Work
• Better performance that reduces fouling tends to result from
• Higher low MW acids & neutrals,
• Lower biopolymers/polysaccharides,
• Lower N/C ratio of humics
• Investigate biopolymers & their removal
• Develop membranes resistant to or cleaning to combat biopolymer fouling
• Investigate which compounds contribute to N/C ratio effect (marine vs terrestrial?)