Abstract The objective of this article is to propose an experimental method to comparethe gas permeability of all the different materials used as gas barrier, such as compacted clayliners or geomembranes. This method is based on the falling pressure experiment, allowingthe determination of a single coefficient whatever the material tested. This coefficient is thetime constant τ , which is obtained by analytical solutions of the simplified equations describ-ing the transport of gas through the material. The domain of validity is specified for porousmedia, thanks to a numerical solution of the complete equations system. Two applicationsare presented, showing the applicability of the method on compacted clay liners and on highdensity polyethylene geomembranes.
Gas movement in soils is of particular interest in many fields, including agriculture, petroleumengineering, and environmental protection (Springer et al. 1998). For example, in the caseof municipal solid waste facilities, to avoid gas emission from landfill into the atmosphereand to recover this gas for energy production purposes, waste is covered over by a varietyof materials. Such materials, used as barrier to rainwater seeping and biogas emission, areas diverse as compacted clay liners (CCL), geosynthetic clay liners (GCL: manufactured
C. Barral · L. Oxarango · P. Pierson (B)LTHE (UMR 5564 CNRS/INPG/IRD/UJF), University Joseph Fourier, BP 53, 38041 Grenoble Cedex 9,Francee-mail: [email protected]
sandwiched clay between two geotextiles), bituminous, or synthetic geomembranes (Didieret al. 2000).
In such applications, where engineers and designers must select one or several materials,it is very difficult to compare their permeability characteristics, since they may correspondto different kinds of flow, mainly convective or diffusive flow, corresponding to differentphysical laws. Lots of permeability tests, described in Sect. 2, allow the determination ofdifferent coefficients characterizing the gas permeability, but do not allow the comparison ofall the materials used as gas barriers.
The objective of this study is to propose a method to determine a single quantity to char-acterize the gas permeability of any liner, whatever its porosity, under specific experimentalconditions, in the laboratory.
A brief review of the phenomenological background concerning gas migration throughdifferent types of materials and of the corresponding tests is first presented (Sect. 2), wherethe “falling pressure experiment” appears to be adapted to all the materials tested. A solutionof the equations describing gas transport during the “falling pressure experiment” is thenproposed in two cases:
(1) The case of pure convective gas flow described by Darcy’s law (Sect. 3): A simplifiedsolution is here proposed, the conditions of acceptance of which are given in Sect. 4,thanks to a numerical study.
(2) The case of pure diffusive flow described by Fick’s law (Sect. 5): The method is thenapplied to an experimental study conducted on compacted clay and to an HDPE (highdensity polyethylene) geomembrane (Sect. 6).
2 Gas Permeability Measurement Background
2.1 Phenomenological Aspect
The main driving force which is the cause of gas migration can be the total pressure gradientor the concentration gradient, depending on the porous structure of the material: pore size,connectivity, and tortuosity, . . . (Rowe et al. 1995; Vangpaisal and Bouazza 2004):
(1) In porous media such as unsaturated soils, in the absence of possible transport byadvection with flowing water, the gradient of the total gas pressure p in the voids of thematerial is generally the main driving force (Bouazza and Vangpaisal 2003). The one-dimensional flow of gas (convective flow), considered here as ideal gas, in isothermalconditions and when gravitational effects are neglected, can be described by the extendedDarcy’s law (1). Therefore, the application of the model is limited to the cases whereinertia is negligible compared to the viscous effects. It corresponds to a Reynolds num-ber of less than 6 (Yu 1985). For instance, it is confirmed for landfill gas migration ifthe characteristic grain sizes of the porous medium are smaller than 2 mm (McBean et al.1995):
q(z, t) = −k
µ
dp(z, t)
dz(1)
where q(z, t) is the gas volumetric flux (Darcy velocity: m/s), µ is the dynamic viscosity (Pi),dp(z, t)/dz is the gas pressure gradient (Pa/m) in the material along the one-dimensional gasflow (z), and k is the effective gas permeability coefficient (m2).
Here, k potentially depends on the medium water saturation (through relative perme-ability effect for instance, Dullien 1979). It may also include slip flow effect, the so-called
123
Characterizing the Gas Permeability of Natural and Synthetic Materials
Klinkenberg effect, even if it is generally neglected in landfill application (Brusseau 1991;Vangpaisal and Bouazza 2004). Thus, k characterizes the gas permeability of a material at agiven water content and in a given gas pressure condition.
(2) In media such as highly saturated fine-grained soils (Aubertin et al. 2000) or syntheticgeomembranes, the main driving force is the concentration gradient of each constituent iof the gas in the material. It means that each constituent of the gas flows differently in thematerial, while the Darcy velocity is negligible (diffusive flow). The one-dimensional massflow qmi (z, t) (kg/(m2 · s) of the constituent of interest i can here be described by Fick’s law(or the law of diffusion):
qmi (z, t) = −Didcmi (z, t)
dz, (2)
where Di is the diffusion coefficient (m2/s) and cmi is the concentration of the permeant iin the material (kg/m3).
Since the permeant concentration cmi (z, t) in the material m is much more difficult tomeasure than the permeant concentration c f i (t) in adjacent fluids f , Eq. 2 is also oftenapproached by considering the quantity of permeant qmi (t) which migrates from one side ofthe material to the other side, as a function of the difference in the concentration �c f i (t) ofthe permeant in the adjacent fluids (Sangam and Rowe 2001; Pierson and Barroso 2002):
qmi (t) = −Pi�c f i (t)
L, (3)
where L is the material thickness (m) and Pi is a permeability coefficient (m2/s). Pi is a func-tion of the diffusion coefficient Di and takes also into account the absorption and desorptionphenomena of the permeant into and from the material, respectively. In the simplest casewhere the material is in contact with adjacent fluids for sufficient time at a constant tempera-ture and where the permeant does not interact with the material (which is the case for HDPEgeomembranes for example), Pi and Di are related by the Eq. 4 (Sangam and Rowe 2001),corresponding to a linear isopleth (cmi = Sm f i · c f i ):
Pi = Sm f i Di , (4)
where Sm f i is the partitioning coefficient, which is supposed to be a constant at the upstreamand downstream surfaces of the specimen tested, for the couple (material–permeant). This isvalid in the case of a similar fluid on both sides and if the concentration difference �c f i (t)remains small (Aminabhavi and Naik 1998).
Equation 3 may also be written according to the difference �pi (t) of the permeant partialpressure in the adjacent fluids (Pa) (Rogers 1985):
qmi (t) = −P ′i�pi (t)
L, (5)
where P ′i is the permeability coefficient of permeant i in the material, expressed in s.
Comparing the gas permeability of such different materials is a difficult goal, since thetransport mechanism is different from one material to another one, with generally, a combi-nation of both mechanisms.
(3) Two transfer mechanisms have been pointed out. The convective mechanism, describedby the Darcy law, is associated with the momentum balance (Whitaker 1999). On the otherhand, the diffusive mechanism, described by the Fick law, is associated with the speciesmass balance of a given gas component. The transported quantities are obviously not of thesame type even if both regimes lead to a transfer of the gas through the porous medium. In
123
C. Barral et al.
order to evaluate the transition between the two regimes (i.e., a regime including both trans-fer mechanisms), the advective/diffusive transport of the studied chemical species has to beconsidered. This means that the transport of the chemical species by the flow average velocityis not negligible. The relative weight of this advective mechanism is usually compared to thediffusive mechanism with the macroscopic Peclet number:
Pe = uL/(D0i ε), (6)
where u is a characteristic velocity at the macroscale, L is a representative length of the spec-imen (for instance its thickness), ε is the material porosity, and D0
i is the diffusion coefficientin air.
This Peclet number evaluates the average advection within the pores using an averagedpore velocity u/ε. The velocity u can be estimated from the total gas volume passing throughthe specimen during a characteristic time of the experiment. The diffusion intensity is esti-mated as the diffusion of the considered gas in the air that fills the pores. This assumptiontends to overestimate the diffusion, since it does not take into account the effect of tortuositythat can be very sensitive in low-porosity materials. The diffusive regime occurs for Pe � 1,while the advective regime corresponds to Pe � 1. In the transition region around Pe = 1,both mechanisms are of the same order of magnitude. In the framework of this article, theattention is focused on the low Peclet number regime that is described by a purely diffusivemodel and the high Peclet number regime. In this last case, the effects of molecular mixingare not considered anymore and the overall gas flow is only studied with the Darcy law.For intermediate Peclet number, the effective permeability and the effective diffusion coef-ficient have to be determined together. Moreover, dispersion effects are likely to introducea potentially non-linear dependance between these coefficients. As far as the experimen-tal characterization of transfer in porous media is concerned in this article, changing theoperating conditions appears to be preferable if the experiment appears to be realized in thetransition regime. Indeed, the determination of two coupled parameters generally increasesdrastically the experimental errors and requires a heavier experimental process.
2.2 Experimental Aspect and Different Tests
(1) There are many methods and tests used to characterize natural soils, based on the extendedDarcy’s law (1) and determining the effective gas permeability k:
Tests are generally conducted in a steady state on unsaturated soils (Eischens and Swanson1996; Samingam et al. 2003), rocks (Cosse 1996), geosynthetic clay liners (Didier et al.2000; Shan and Yao 2000; Bouazza and Vangpaisal 2003; Vangpaisal and Bouazza 2004),or cement-based materials (Gallé and Daian 2000; Loosveldt et al. 2002). Results show thatwhen the water content increases, corresponding to a lower volume available in the mate-rial for gas migration, measurement becomes more and more difficult, leading to relativeuncertainties of up to 100% when the water content is over 100% in geosynthetic clay lin-ers (Shan and Yao 2000; Bouazza and Vangpaisal 2003). Gallé and Daian (2000) obtain animportant dispersion of permeability values (four orders of magnitude) at 90% of saturationin cement-based materials.
Therefore, low permeabilities in porous media must be determined in an unsteady state(Selvadurai and Carnaffan 1997). Figg (1973) proposes an unsteady-state method to deter-mine the air permeability of the concrete: the initial pressure in the chamber in contactwith the specimen tested is lowered by a vacuum pump. The time necessary to obtain agiven pressure increase in the chamber characterizes the air permeability of this specimen.Calogovic (1995), Yssorche et al. (1995), and Claisse et al. (2003) propose to determine an
123
Characterizing the Gas Permeability of Natural and Synthetic Materials
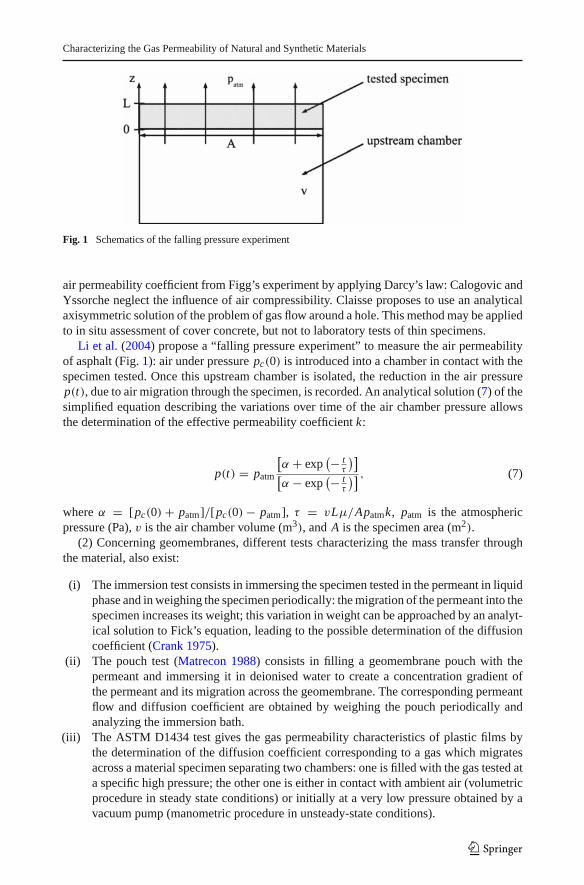
Fig. 1 Schematics of the falling pressure experiment
air permeability coefficient from Figg’s experiment by applying Darcy’s law: Calogovic andYssorche neglect the influence of air compressibility. Claisse proposes to use an analyticalaxisymmetric solution of the problem of gas flow around a hole. This method may be appliedto in situ assessment of cover concrete, but not to laboratory tests of thin specimens.
Li et al. (2004) propose a “falling pressure experiment” to measure the air permeabilityof asphalt (Fig. 1): air under pressure pc(0) is introduced into a chamber in contact with thespecimen tested. Once this upstream chamber is isolated, the reduction in the air pressurep(t), due to air migration through the specimen, is recorded. An analytical solution (7) of thesimplified equation describing the variations over time of the air chamber pressure allowsthe determination of the effective permeability coefficient k:
p(t) = patm
[α + exp
(− tτ
)]
[α − exp
(− tτ
)] , (7)
where α = [pc(0) + patm]/[pc(0) − patm], τ = vLµ/Apatmk, patm is the atmosphericpressure (Pa), v is the air chamber volume (m3), and A is the specimen area (m2).
(2) Concerning geomembranes, different tests characterizing the mass transfer throughthe material, also exist:
(i) The immersion test consists in immersing the specimen tested in the permeant in liquidphase and in weighing the specimen periodically: the migration of the permeant into thespecimen increases its weight; this variation in weight can be approached by an analyt-ical solution to Fick’s equation, leading to the possible determination of the diffusioncoefficient (Crank 1975).
(ii) The pouch test (Matrecon 1988) consists in filling a geomembrane pouch with thepermeant and immersing it in deionised water to create a concentration gradient ofthe permeant and its migration across the geomembrane. The corresponding permeantflow and diffusion coefficient are obtained by weighing the pouch periodically andanalyzing the immersion bath.
(iii) The ASTM D1434 test gives the gas permeability characteristics of plastic films bythe determination of the diffusion coefficient corresponding to a gas which migratesacross a material specimen separating two chambers: one is filled with the gas tested ata specific high pressure; the other one is either in contact with ambient air (volumetricprocedure in steady state conditions) or initially at a very low pressure obtained by avacuum pump (manometric procedure in unsteady-state conditions).
123
C. Barral et al.
(iv) The ASTM E96 test is dedicated to water vapor migration: the corresponding watervapor transmission rate and diffusion coefficient are measured on a specimen, sealedinto the mouth of a test dish with distilled water in it. The relative humidity differencebetween both sides of the specimen is controlled and is here the driving force for watervapor migration across the specimen, resulting in a weight loss of the dish assembly.
(v) The gas permeation pouch test (Pierson and Barroso 2002) consists in recording thedecrease in the gas pressure inside a geomembrane pouch. It is observed that thisdecrease in pressure can be approached by a simple exponential law, characterized byone time constant (Barroso et al. 2006), suggesting that a simplified solution of theEq. 3 is possible in the experimental conditions of this test, as Li et al. (2004) obtainedthe simplified solution (7) for asphalt porous media.
The goal of the next sections is to present such simplified solutions adapted to all media.
3 Modeling the Falling Pressure Experiment in the Case of Pure Convective Flow
In the case of pure convective gas flow across the material, the differential equation (8) gov-erning the transient variation of the gas pressure p in the material tested can be obtainedfrom extended Darcy’s law (1), combined with the equation of continuity and the ideal gaslaw (Baehr and Hult 1991; Li et al. 2004):
dp(z, t)
dt= k
2µε
d2 p2(z, t)
dz2 , (8)
where ε is the material porosity.A numerical solution of this non-linear problem is proposed in Sect. 4.Considering the experimental conditions of the falling pressure method, the gas trans-
ported across the specimen tested is the mass flow rate of gas dm(t) / dt (kg/s) freed by theupstream chamber (Fig. 1):
dm(t)
dt= v
dρc(t)
dt, (9)
where v is the upstream chamber volume and ρc(t) is the gas density in the chamber. Equation9 is the ideal gas law in isothermal conditions:
pc(t)
ρc(t)= pc(0)
ρc(0), (10)
where pc(t) is the gas pressure in the upstream chamber.Combining Eqs. 9 and 10:
dm(t)
dt= v
ρc(0)
pc(0)
dpc(t)
dt. (11)
Equation 12 can be obtained from Eq. 1 written at z = 0, combined with Eqs. 10 and 11:
dpc(t)
dt= Ak
2vµ
dp2(z, t)
dz|z=0, (12)
where A is the specimen area and where pc(t) = p(0, t).Equation 12 corresponds to a flux upstream boundary condition for Eq. 8. The down-
stream boundary condition is a uniform pressure at z = L (generally atmospheric pressure)as expressed in Eq. 13:
123
Characterizing the Gas Permeability of Natural and Synthetic Materials
p(L , t) = patm. (13)
Li et al. (2004) proposes the analytical solution (7) of the approximated Eq. 14 derivedfrom (12), if the function p2(z) is approached by a linear function, which is acceptable for asmall specimen thickness L and a great chamber volume (the numerical study in Sect. 4 willspecify this):
dpc(t)
dt= Ak
2vµL
(p2
atm − p2c (t)
). (14)
If during the test, pc(t) is closed to patm, the approximation (15) can be considered:
p2atm − p2
c (t) ≈ 2patm (patm − pc(t)). (15)
It leads to the simple analytical solution (16)–(17) of the Eq. 14:
pc(t) = patm + (pc(0) − patm) exp
(− t
τ
), (16)
where τ is the time constant:
τ = vµL
Akpatm. (17)
4 Numerical Solution of the Non-linear Problem
In this section, a numerical study of the differential problem (8) describing the compressibleDarcy flow within a porous material is presented. The pressure falling experiment (Fig. 1)is modeled using the boundary conditions (12) and (13). The initial condition is a uni-form pressure pc(0) in the medium. The one-dimensional problem is discretized with finitevolumes using a second-order implicit scheme in space and a second order Crank–Nich-olson scheme in time. The non-linearity of the pressure dependency is handled with theNewton–Raphson iterative method. The numerical study presented in this section is used toestimate the accuracy of the approximate solution (16)–(17). Thus, a fitting method is usedto evaluate the permeability through a linear regression on the logarithm of Eqs. 16–17.
The physical dimensions used to simulate the falling pressure experiment are those of theexperimental set up presented in Sect. 6.1. They are summarized in Table 1 and correspond toan unsaturated clay liner. The dependency of the gas permeability on the water saturation isnot considered in the framework of this study. This means that the permeability k in equation(8) is the effective gas permeability for a given saturation state. We assume that the waterphase remains steady (no flow or evaporation) during the experiment. This is relevant as faras the experiment timescale is short. Further studies are currently in progress to evaluate thedependency of the gas permeability of the clay on its water content.
As depicted in the Sect. 3, two assumptions are required to obtain the exponential modelfor the upstream chamber depletion. The evolution of the pressure along the porous domain
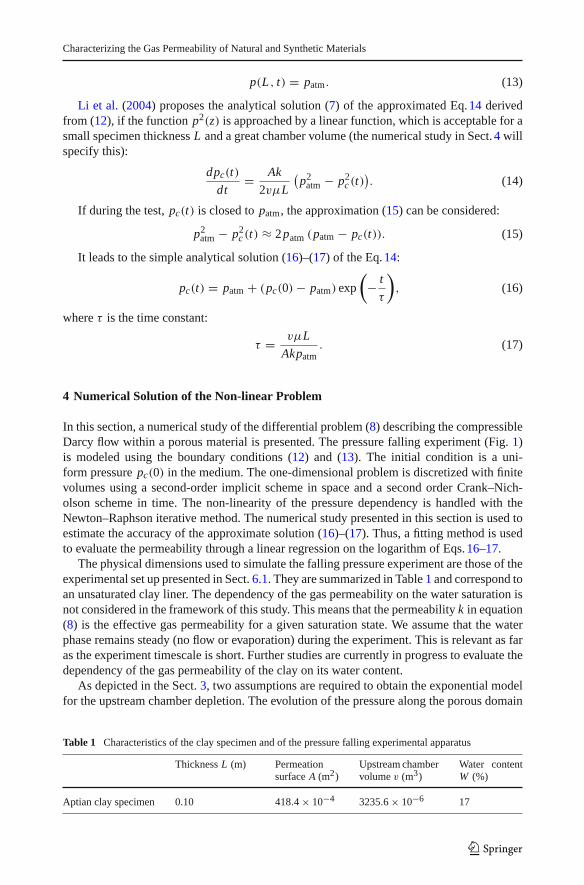
Table 1 Characteristics of the clay specimen and of the pressure falling experimental apparatus
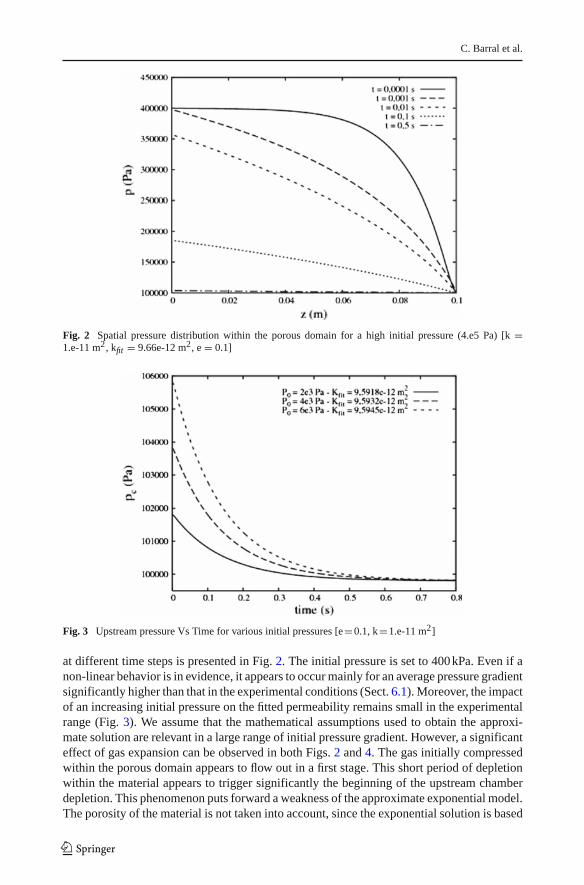
Fig. 2 Spatial pressure distribution within the porous domain for a high initial pressure (4.e5 Pa) [k =1.e-11 m2, kfit = 9.66e-12 m2, e = 0.1]
Fig. 3 Upstream pressure Vs Time for various initial pressures [e=0.1, k=1.e-11 m2]
at different time steps is presented in Fig. 2. The initial pressure is set to 400 kPa. Even if anon-linear behavior is in evidence, it appears to occur mainly for an average pressure gradientsignificantly higher than that in the experimental conditions (Sect. 6.1). Moreover, the impactof an increasing initial pressure on the fitted permeability remains small in the experimentalrange (Fig. 3). We assume that the mathematical assumptions used to obtain the approxi-mate solution are relevant in a large range of initial pressure gradient. However, a significanteffect of gas expansion can be observed in both Figs. 2 and 4. The gas initially compressedwithin the porous domain appears to flow out in a first stage. This short period of depletionwithin the material appears to trigger significantly the beginning of the upstream chamberdepletion. This phenomenon puts forward a weakness of the approximate exponential model.The porosity of the material is not taken into account, since the exponential solution is based
123
Characterizing the Gas Permeability of Natural and Synthetic Materials
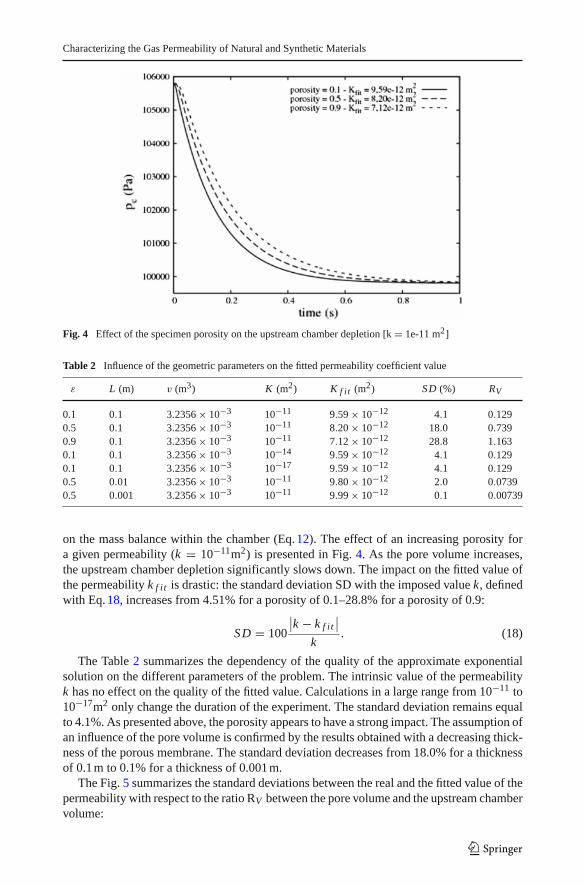
Fig. 4 Effect of the specimen porosity on the upstream chamber depletion [k = 1e-11 m2]
Table 2 Influence of the geometric parameters on the fitted permeability coefficient value
on the mass balance within the chamber (Eq. 12). The effect of an increasing porosity fora given permeability (k = 10−11m2) is presented in Fig. 4. As the pore volume increases,the upstream chamber depletion significantly slows down. The impact on the fitted value ofthe permeability k f i t is drastic: the standard deviation SD with the imposed value k, definedwith Eq. 18, increases from 4.51% for a porosity of 0.1–28.8% for a porosity of 0.9:
SD = 100
∣∣k − k f i t∣∣
k. (18)
The Table 2 summarizes the dependency of the quality of the approximate exponentialsolution on the different parameters of the problem. The intrinsic value of the permeabilityk has no effect on the quality of the fitted value. Calculations in a large range from 10−11 to10−17m2 only change the duration of the experiment. The standard deviation remains equalto 4.1%. As presented above, the porosity appears to have a strong impact. The assumption ofan influence of the pore volume is confirmed by the results obtained with a decreasing thick-ness of the porous membrane. The standard deviation decreases from 18.0% for a thicknessof 0.1 m to 0.1% for a thickness of 0.001 m.
The Fig. 5 summarizes the standard deviations between the real and the fitted value of thepermeability with respect to the ratio RV between the pore volume and the upstream chambervolume:
123
C. Barral et al.
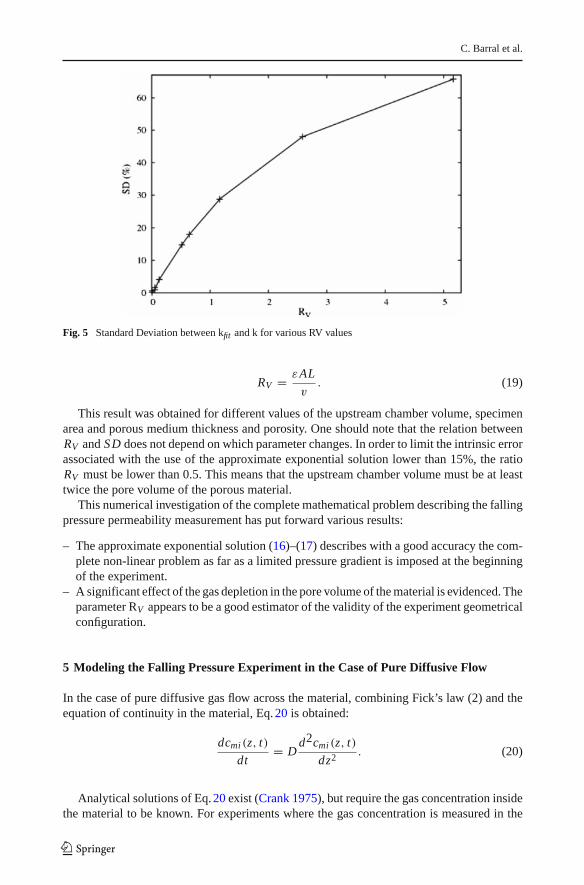
Fig. 5 Standard Deviation between kfit and k for various RV values
RV = εAL
v. (19)
This result was obtained for different values of the upstream chamber volume, specimenarea and porous medium thickness and porosity. One should note that the relation betweenRV and SD does not depend on which parameter changes. In order to limit the intrinsic errorassociated with the use of the approximate exponential solution lower than 15%, the ratioRV must be lower than 0.5. This means that the upstream chamber volume must be at leasttwice the pore volume of the porous material.
This numerical investigation of the complete mathematical problem describing the fallingpressure permeability measurement has put forward various results:
– The approximate exponential solution (16)–(17) describes with a good accuracy the com-plete non-linear problem as far as a limited pressure gradient is imposed at the beginningof the experiment.
– A significant effect of the gas depletion in the pore volume of the material is evidenced. Theparameter RV appears to be a good estimator of the validity of the experiment geometricalconfiguration.
5 Modeling the Falling Pressure Experiment in the Case of Pure Diffusive Flow
In the case of pure diffusive gas flow across the material, combining Fick’s law (2) and theequation of continuity in the material, Eq. 20 is obtained:
dcmi (z, t)
dt= D
d2cmi (z, t)
dz2 . (20)
Analytical solutions of Eq. 20 exist (Crank 1975), but require the gas concentration insidethe material to be known. For experiments where the gas concentration is measured in the
123
Characterizing the Gas Permeability of Natural and Synthetic Materials
adjacent fluids, Eq. 5 presented in Sect. 2 may be considered in the case where the gas doesnot interact with the material.
In order to obtain a simplified solution similar to Eq. 16 obtained for porous media, Eq. 5is combined with Eqs. 9 and 10 under the form (21) where pG is the partial pressure of thegas considered (i.e., nitrogen as considered in the experiment of Sect. 6.2) in the ambient air,with a negligible variation over time, and pc(t) is the chamber pressure (which is supposedto be filled with the gas being tested):
dpc(t)
dt= Apc(0)P ′
vρc(0)L(pG − pc(t)) . (21)
Considering the ideal gas law in isothermal condition (20),
pc(0)
ρc(0)= RTc
M, (22)
where R is the universal gas constant, Tc is the constant gas temperature in the upstreamchamber (K), and M is the molar mass of the gas (kg/mol), the analytical solution of Eq. 21is
pc(t) = pG + (pc(0) − pG) exp
(− t
τ
), (23)
where τ is the time constant:
τ = vL M
AP ′ RTc. (24)
Therefore, as far as the experimental results show a function pc(t) which can be reason-ably approached by Eq. 23 (which is the same as Eq. 16 obtained in Sect. 3), it is possibleto compare all the materials used as a gas barrier by the time constant τ . This result doesnot depend on the driving force: total pressure gradient for convective flow, concentrationgradient for diffusive flow, or a combination of both of them. τ will be even smaller if thematerial is a poorer gas barrier. Furthermore, once τ is determined, Eqs. 17 and 24 give thequantities k and P ′, respectively, the effective permeability coefficient of a medium wherethe gas flow occurs by pure convective flow and the permeability coefficient of a mediumwhere the gas flow occurs by pure diffusive flow.
6 Experimental Study
Two quite different applications of the falling pressure method are presented here:
– The first one concerns a porous material consisting of a compacted clay specimen testedin a similar cell as represented in Fig. 1.
– The second one concerns a very low permeability material: a HDPE geomembrane seam,which is tested with the gas permeability pouch test, better adapted to this kind of material.
The objective of this experimental study here is not to compare different materials (furthertests are being conducted), but to show two possible applications of the method proposedhere.
123
C. Barral et al.
6.1 Test on a Clay Sample
The “falling pressure” method is applied to clay used in landfill.In order to create parallel epipedicaptian clay samples (0.4 m long, 0.1 m wide, 0.1 m
high), the clay is screened and then hydrated until a chosen moisture content. After thehomogeneization, this clay is statically compacted with an energy of compaction of 100% ina special mold which allows compacting twice the sample on top and on bottom. The finalclay samples have an uniform porosity equal to 30% and are carefully packed and stored topreserve their moisture content until the gas experiment.
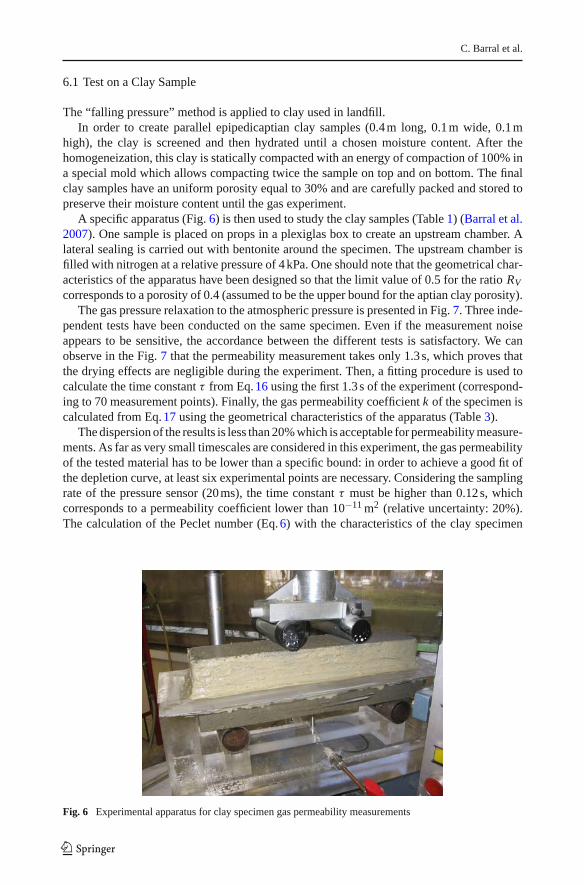
A specific apparatus (Fig. 6) is then used to study the clay samples (Table 1) (Barral et al.2007). One sample is placed on props in a plexiglas box to create an upstream chamber. Alateral sealing is carried out with bentonite around the specimen. The upstream chamber isfilled with nitrogen at a relative pressure of 4 kPa. One should note that the geometrical char-acteristics of the apparatus have been designed so that the limit value of 0.5 for the ratio RV
corresponds to a porosity of 0.4 (assumed to be the upper bound for the aptian clay porosity).The gas pressure relaxation to the atmospheric pressure is presented in Fig. 7. Three inde-
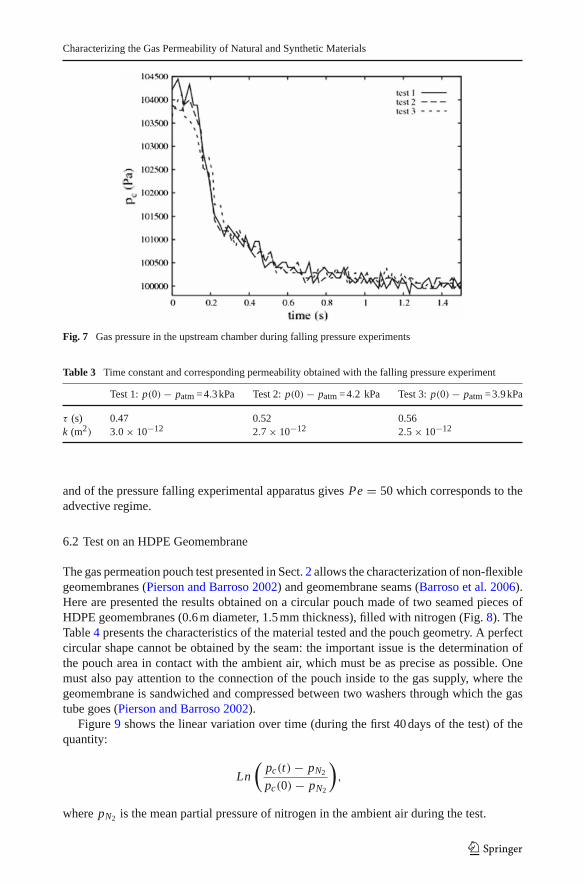
pendent tests have been conducted on the same specimen. Even if the measurement noiseappears to be sensitive, the accordance between the different tests is satisfactory. We canobserve in the Fig. 7 that the permeability measurement takes only 1.3 s, which proves thatthe drying effects are negligible during the experiment. Then, a fitting procedure is used tocalculate the time constant τ from Eq. 16 using the first 1.3 s of the experiment (correspond-ing to 70 measurement points). Finally, the gas permeability coefficient k of the specimen iscalculated from Eq. 17 using the geometrical characteristics of the apparatus (Table 3).
The dispersion of the results is less than 20% which is acceptable for permeability measure-ments. As far as very small timescales are considered in this experiment, the gas permeabilityof the tested material has to be lower than a specific bound: in order to achieve a good fit ofthe depletion curve, at least six experimental points are necessary. Considering the samplingrate of the pressure sensor (20 ms), the time constant τ must be higher than 0.12 s, whichcorresponds to a permeability coefficient lower than 10−11 m2 (relative uncertainty: 20%).The calculation of the Peclet number (Eq. 6) with the characteristics of the clay specimen
Fig. 6 Experimental apparatus for clay specimen gas permeability measurements
123
Characterizing the Gas Permeability of Natural and Synthetic Materials
Fig. 7 Gas pressure in the upstream chamber during falling pressure experiments
Table 3 Time constant and corresponding permeability obtained with the falling pressure experiment
Test 1: p(0) − patm = 4.3 kPa Test 2: p(0) − patm = 4.2 kPa Test 3: p(0) − patm = 3.9 kPa
and of the pressure falling experimental apparatus gives Pe = 50 which corresponds to theadvective regime.
6.2 Test on an HDPE Geomembrane
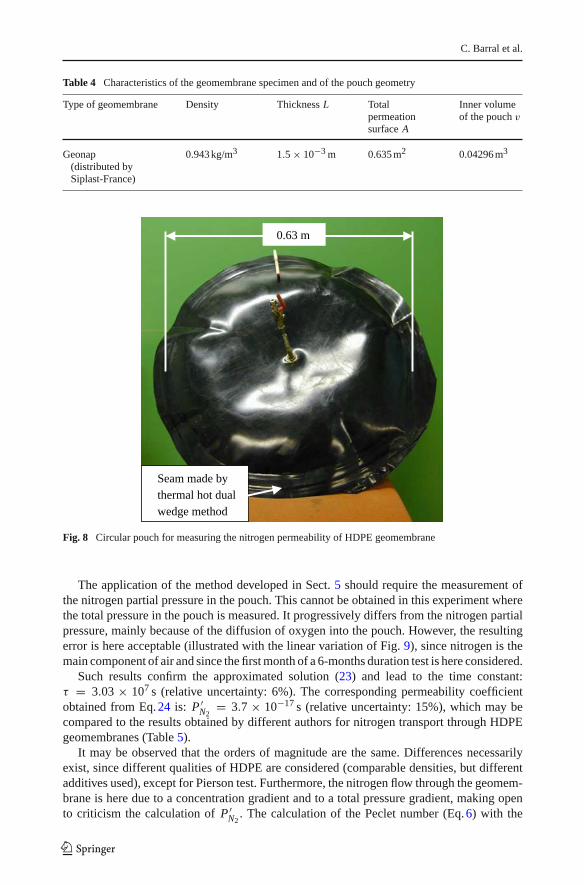
The gas permeation pouch test presented in Sect. 2 allows the characterization of non-flexiblegeomembranes (Pierson and Barroso 2002) and geomembrane seams (Barroso et al. 2006).Here are presented the results obtained on a circular pouch made of two seamed pieces ofHDPE geomembranes (0.6 m diameter, 1.5 mm thickness), filled with nitrogen (Fig. 8). TheTable 4 presents the characteristics of the material tested and the pouch geometry. A perfectcircular shape cannot be obtained by the seam: the important issue is the determination ofthe pouch area in contact with the ambient air, which must be as precise as possible. Onemust also pay attention to the connection of the pouch inside to the gas supply, where thegeomembrane is sandwiched and compressed between two washers through which the gastube goes (Pierson and Barroso 2002).
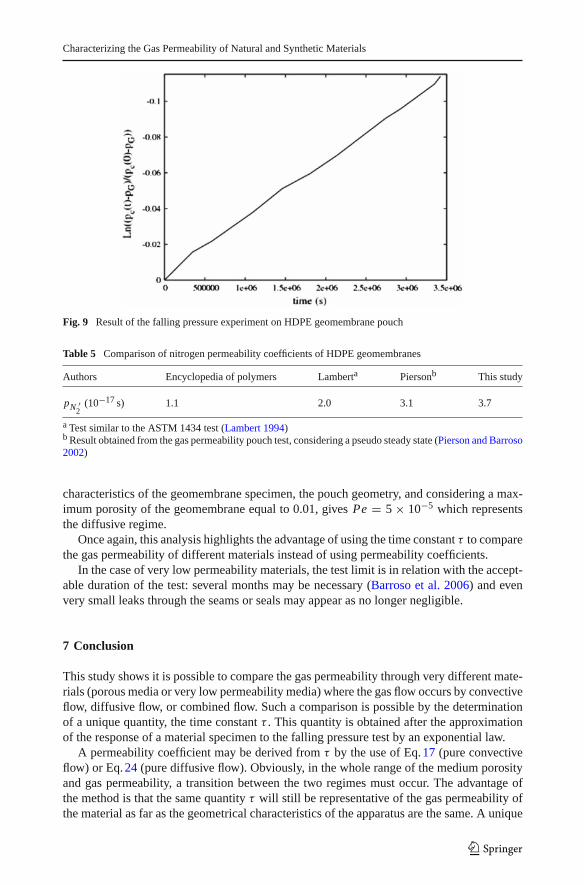
Figure 9 shows the linear variation over time (during the first 40 days of the test) of thequantity:
Ln
(pc(t) − pN2
pc(0) − pN2
),
where pN2 is the mean partial pressure of nitrogen in the ambient air during the test.
123
C. Barral et al.
Table 4 Characteristics of the geomembrane specimen and of the pouch geometry
Type of geomembrane Density Thickness L Totalpermeationsurface A
Inner volumeof the pouch v
Geonap(distributed bySiplast-France)
0.943 kg/m3 1.5 × 10⁻³ m 0.635 m2 0.04296 m3
0.63 m
Seam made by thermal hot dual wedge method
Fig. 8 Circular pouch for measuring the nitrogen permeability of HDPE geomembrane
The application of the method developed in Sect. 5 should require the measurement ofthe nitrogen partial pressure in the pouch. This cannot be obtained in this experiment wherethe total pressure in the pouch is measured. It progressively differs from the nitrogen partialpressure, mainly because of the diffusion of oxygen into the pouch. However, the resultingerror is here acceptable (illustrated with the linear variation of Fig. 9), since nitrogen is themain component of air and since the first month of a 6-months duration test is here considered.
Such results confirm the approximated solution (23) and lead to the time constant:τ = 3.03 × 10⁷ s (relative uncertainty: 6%). The corresponding permeability coefficientobtained from Eq. 24 is: P ′
N2= 3.7 × 10⁻¹⁷ s (relative uncertainty: 15%), which may be
compared to the results obtained by different authors for nitrogen transport through HDPEgeomembranes (Table 5).
It may be observed that the orders of magnitude are the same. Differences necessarilyexist, since different qualities of HDPE are considered (comparable densities, but differentadditives used), except for Pierson test. Furthermore, the nitrogen flow through the geomem-brane is here due to a concentration gradient and to a total pressure gradient, making opento criticism the calculation of P ′
N2. The calculation of the Peclet number (Eq. 6) with the
123
Characterizing the Gas Permeability of Natural and Synthetic Materials
Fig. 9 Result of the falling pressure experiment on HDPE geomembrane pouch
Table 5 Comparison of nitrogen permeability coefficients of HDPE geomembranes
Authors Encyclopedia of polymers Lamberta Piersonb This study
pN ′2
(10−17 s) 1.1 2.0 3.1 3.7
a Test similar to the ASTM 1434 test (Lambert 1994)b Result obtained from the gas permeability pouch test, considering a pseudo steady state (Pierson and Barroso2002)
characteristics of the geomembrane specimen, the pouch geometry, and considering a max-imum porosity of the geomembrane equal to 0.01, gives Pe = 5 × 10⁻⁵ which representsthe diffusive regime.
Once again, this analysis highlights the advantage of using the time constant τ to comparethe gas permeability of different materials instead of using permeability coefficients.
In the case of very low permeability materials, the test limit is in relation with the accept-able duration of the test: several months may be necessary (Barroso et al. 2006) and evenvery small leaks through the seams or seals may appear as no longer negligible.
7 Conclusion
This study shows it is possible to compare the gas permeability through very different mate-rials (porous media or very low permeability media) where the gas flow occurs by convectiveflow, diffusive flow, or combined flow. Such a comparison is possible by the determinationof a unique quantity, the time constant τ . This quantity is obtained after the approximationof the response of a material specimen to the falling pressure test by an exponential law.
A permeability coefficient may be derived from τ by the use of Eq. 17 (pure convectiveflow) or Eq. 24 (pure diffusive flow). Obviously, in the whole range of the medium porosityand gas permeability, a transition between the two regimes must occur. The advantage ofthe method is that the same quantity τ will still be representative of the gas permeability ofthe material as far as the geometrical characteristics of the apparatus are the same. A unique
123
C. Barral et al.
apparatus which may be used to test clay liners as well as synthetic liners has just beendesigned: results will be soon available.
It should be observed that the method is still valid at high water content, contrary tomany steady-state methods generally used to measure the gas permeability of porous media,because of the very small gas pressure gradient applied: Steady-state methods require highpressure gradients to make the gas flow measurement possible, which generate uncontrolledwater movements inside the material, with a possible drying effect.
The limit of the method proposed here when applied to porous materials may be definedby the quantity Rv (Eq. 19), in relation to the geometry of the measurement cell: studyingmaterial with high porosity should require a higher volume of the upstream chamber (leadingto a huge apparatus) or a small specimen area (increasing the relative influence of edge effectand of the corresponding leaks). A limit of the pressure gradient should also be respectedto avoid problems of leakage as well as uncontrolled water movement inside the specimen.Finally, the sampling rate of the pressure sensor has to be carefully taken into account to getan accurate measurement of the upstream chamber depletion.
Concerning very low permeability materials, the acceptable test duration is the limit: themeasurement of the gas permeability of HDPE geomembranes is possible, but may requirea timescale of several months.
The method is now applied to compare the biogas permeability of the different materi-als used in landfill cover applications, considering their possible deformation due to wastesettlement.
References
Aminabhavi, T.M., Naik, H.G.: Chemical compatibility testing of geomembranes. Sorption/desorption,diffusion, permeation and swelling phenomena. Geotext. Geomembr. 16, 333–354 (1998). doi:10.1016/S0266-1144(98)00017-X
ASTM D1434: Standard Test Method for Determining Gas Permeability Characteristics of Plastic Film andSheeting. Pennsylvania, USA (1998, reapproved 2003)
ASTM E96: Standard Test Method for Water Vapor Transmission of Materials. Pennsylvania, USAAubertin, M., Aachib, M., Authier, K.: Evaluation of diffusive gas flux through covers with a GCL. Geotext.
Geomembr. 18(2–4), 215–233 (2000). doi:10.1016/S0266-1144(99)00028-XBaehr, A.L., Hult, M.F.: Evaluation of unsaturated sone air permeability through pneumatic tests. Water Resour.
Res. 27(10), 2605–2617 (1991). doi:10.1029/91WR01655Barral, C., Oxarango, L., Pierson, P., Djeran-Maigre, I., Didier, G.: Measurement of gas leakage through
landfill cap covers. In: Geo-Environmental Engineering 2007, Grenoble, France (2007)Barroso, M., Pierson, P., Lopes, L.G.: A non destructive method for testing non flexible dual geomembrane
seams using gas permeation. Geosynth. Int. 13(1), 15–22 (2006). doi:10.1680/gein.2006.13.1.15Bouazza, A., Vangpaisal, T.: An apparatus to measure gas permeability of geosynthetic clay liners. Geotext.
Geomembr. 21, 85–101 (2003). doi:10.1016/S0266-1144(02)00058-4Brusseau, M.L.: Transport of organic chemicals by gas advection in structured or heterogeneous porous media:
development of a model and application to column experiments. Water Resour. Res. 27(2), 3189–3199(1991). doi:10.1029/91WR02195
Calogovic, V.: Gas permeability measurement of porous materials (concrete) by time-variable pressuredifference method. Cem. Concr. Res. 25(5), 1054–1062 (1995). doi:10.1016/0008-8846(95)00100-Q
Claisse, P.A., Ganjian, E., Adham, T.A.: A vacuum-air permeability test for in situ assessment of cover concrete.Cem. Concr. Res. 33, 47–53 (2003). doi:10.1016/S0008-8846(02)00912-2
Cosse, R.: Basics of Reservoir Engineering: Oil and Gas Field Development Techniques, pp. 44–46. InstitutFrançais du Pétrole Publications, Edition Technip (1996)
Crank, J.: The Mathematics of Diffusion, 2edn. Clarendon, Oxford (1975)Didier, G., Bouazza, A., Cazaux, D.: Gas permeability of geosynthetic clay liners. Geotext. Geomembr. 18,
235–250 (2000). doi:10.1016/S0266-1144(99)00029-1Dullien, F.A.L.: Porous Media—Fluid Transport and Pore Structure. Academic Press, New York (1979)
Characterizing the Gas Permeability of Natural and Synthetic Materials
Eischens, G., Swanson, A.: Proposed standard test method for measurement of pneumatic permeability ofpartially saturated porous materials by flowing air. Geotech. Test. J. 16(2), 232–238 (1996)
Encyclopedia of Polymer Science and Technology: Plastics, Resins, Rubbers, Fibbers. Interscience Publishers,New York, USA (1964)
Figg, J.W.: Methods of measuring the air and water permeability of concrete. Mag. Concr. Res. 25(85), 213–219(1973)
Gallé, C., Daian, J.F.: Gas permeability of unsaturated cement-based materials: application of a multi-scalenetwork model. Mag. Concr. Res. 52(4), 251–263 (2000)
Lambert, S.: Etude de la perméabilité aux gaz des géomembranes. Master of Sciences Thesis, Lirigm-UniversitéJoseph Fourier, Grenoble-France (1994)
Li, H., Jiao, J.J., Luk, M.: A falling-pressure method for measuring air permeability of asphalt in laboratory.J. Hydrol. (Amst.) 286, 69–77 (2004). doi:10.1016/j.jhydrol.2003.09.013
Loosveldt, H., Lafhaj, Z., Skoczylas, F.: Experimental study of gas and liquid permeability of a mortar. Cem.Concr. Res. 32, 1357–1363 (2002). doi:10.1016/S0008-8846(02)00793-7
Matrecon, Inc.: Lining of Waste Containment and Other Impoundment Facilities, 190 pp, USEPA, ReportEPA/600/2-88/052, Cincinnati, Ohio, USA (1988)
Pierson, P., Barroso, M.C.P.: A pouch test for characterizing gas permeability of geomembranes. Geosynth.Int. 6(4), 345–372 (2002)
Rogers, C.E.: Permeation of gases and vapours in polymers. Chapter 2. In: Comyn, J. (ed.). Polymer Perme-ability, pp. 11–73. Elsevier applied science publisher, London (1985)
Rowe, R.K., Quigley, R.M., Booker, J.R.: Clayey Barrier Systems for Waste Disposal Facilities. E and FNSpon, Chapman et Hall, London (1995)
Samingam, A.S., Leong, E.C., Rahardjo, H.: A flexible wall permeameter for measurements of water and aircoefficients of permeability of residual soils. Can. Geotech. J. 40, 559–574 (2003). doi:10.1139/t03-015
Sangam, H.P., Rowe, R.K.: Migration of dilute aqueous organic pollutants through HDPE geomembranes.Geotext. Geomembr. 19, 329–357 (2001). doi:10.1016/S0266-1144(01)00013-9
Selvadurai, A.P.S., Carnaffan, P.: A transient pressure pulse method for the measurement of the permeabilityof a cement grout. Can. J. Civ. Eng. 24, 489–502 (1997). doi:10.1139/cjce-24-3-489
Shan, H.Y., Yao, J.T.: Measurement of air permeability of geosynthetic clay liners. Geotext. Geomembr. 18,251–261 (2000). doi:10.1016/S0266-1144(99)00030-8
Springer, D.S., Loaiciga, H.A., Cullen, S.J., Everett, L.G.: Air permeability of porous materials under controlledlaboratory conditions. Ground Water 36(4), 558–565 (1998). doi:10.1111/j.1745-6584.1998.tb02829.x
Vangpaisal, T., Bouazza, A.: Gas permeability of partially hydrated geosynthetic clay liners. J. Geotech.Geoenviron. Eng., ASCE, 130(5), 93–102 (2004)
Whitaker, S.: The Method of Volume Averaging. Kluwer Academic Press, Dordrecht (1999)Yssorche, M.P., Bigas, J.P., Ollivier, J.P.: Mesure de la perméabilité à l’air des bétons au moyen d’un per-
méamètre à charge variable. Mater. Struct. 28, 401–405 (1995). doi:10.1007/BF02473075Yu, L.L.: Study of air flow through porous media, 114 pp. MS Thesis, Department of civil Engineering Uni-