66
LICENTIATE THESIS Charge Dynamics in Tumbling Mills Simulation and Measurements with an In-Mill Sensor Johanna Alatalo

LICENTIATE T H E S I S
Department of Civil, Environmental and Natural Resources EngineeringDivision of Sustainable Process Engineering
Charge Dynamics in Tumbling MillsSimulation and Measurements with an In-Mill Sensor
Johanna Alatalo
ISSN: 1402-1757 ISBN 978-91-7439-258-6
Luleå University of Technology 2011
ISSN: 1402-1757 ISBN 978-91-7439-XXX-X Se i listan och fyll i siffror där kryssen är

Charge Dynamics in Tumbling MillsSimulation and Measurements with an In-Mill Sensor
Johanna Alatalo
Luleå University of TechnologyDepartment of Civil, Environmental and Natural Resources Engineering
Mineral Processing

Printed by Universitetstryckeriet, Luleå 2011
ISSN: 1402-1757 ISBN 978-91-7439-258-6
Luleå 2011
www.ltu.se
1
Abstract Grinding is a process of reducing the particle size distribution of an extracted ore commonly performed in tumbling mills. The process is complex with many factors affecting the result, predominately the ores physical and chemical properties. The ore feed to a concentrator varies and optimisation is important, since grinding has high energy consumption and therefore is an expensive process. In an attempt to increase the knowledge of pebble mill grinding, experiments were performed with a pilot-scale mill at the LKAB R&D facilities at Malmberget. The purposes of the experiments were to investigate how the mill reacts to changes in the system and to find out how the grinding ability is affected by the changes. The first set of experiments concentrated on different operational settings, varying the filling degree, the volume-% solids and the percentage of critical speed of the mill. In the second set of experiments, different pebbles mixtures with varying magnetite content and different size fractions were tested. An interesting response variable (result) is the product size for the different operational conditions, since higher amount of fine material < 45 μm can be seen as a probable increase of production rate. The environment inside a mill is too harsh for direct measurements and there is a lack of knowledge of the events occurring inside the mill. Information on the events in the charge can be achieved by the use of different sensors. In the experiments, a Continuous Charge Measurement (CCM) system by Metso Minerals has been used to learn more about the charge dynamics. This system consists of a strain gauge detector embedded in one rubber lifter and measures the deflection as the lifter passes through the charge in the mill. The information received from the deflection curve is used in the evaluation of the experiments. The data from the experiments have been analysed with the aid of a statistical program. The analyses show that there will be an increased production of fines at low critical speed especially when the mill has high filling degree. This setting will also increase the power consumption but it improves the grindability of the ore even more. A higher degree of filling also give a smaller toe angle and a higher shoulder angle as expected. In addition, there is an advantage to keep the magnetite pebbles fraction as high as possible. This will increase the power consumption and maximum deflection of lifters, but at the same time increase the amount < 45 μm, the grindability and the pebbles consumption. A pebble size fraction of 10-35 mm will improve the grindability and amount < 45 μm. To further increase the understanding of charge dynamics, simulations are used to possibly illustrate the events inside the mill. However, for simulations to be reliable it demands that they are verified against process data. Previously, a series of experiments with a steel media charge were performed with the CCM system installed and this provides an opportunity to validate simulation results. The measured lifter deflection signal is used to compare with signals from two- and three-dimensional DEM simulations of the pilot-scale mill. The resulting deflection signals from simulation show that the three-dimensional case displays a better profile and the difference of toe and shoulder angles are less than in the two-dimensional case. This means that the simulations are more reliable when they are run in three dimensions and they may be used to increase the understanding of the mill and its charge.


3
Preface/Acknowledgements Firstly, I would like to express my gratitude to my supervisors Docent Bertil Pålsson, LTU, and Dr. Kent Tano, LKAB, for the opportunity to pursue these studies and for the valuable guidance, advices and assistance during this work. I would like to thank my colleagues at LKAB for their friendship and help, and my gratitude goes especially to those involved with the experimental work in Malmberget – you made this work possible. I would also like to thank my friends and colleagues, former and present, at the Division of Sustainable Process Engineering and friends in the coffee room of the Department of Civil, Environmental & Natural Resources Engineering. I gratefully acknowledge LKAB for the financial support and Metso Minerals for the use of the CCM system. Finally, I would like to thank my family and friends for all support during this time.


5
List of appended papers This thesis is based on work reported in the following papers. Paper A Alatalo J., Pålsson B. and Tano K., 2011. Influence of pebble mill operating conditions on measurements with an in-mill sensor. Submitted to: Minerals & Metallurgical Processing Paper B Alatalo J., Pålsson B. and Tano K., 2011. Influence of charge type on measurements with an in-mill sensor. Submitted to: Minerals Engineering Paper C Alatalo J., Pålsson B. and Tano K., 2010. Comparing Experimental Measurements of Mill Lifter Deflections with 2D and 3D DEM Predictions. In: Discrete Element Methods, Simulations of Discontinua: Theory and Applications. Queen Mary, University of London, pp. 194-198. ISBN: 978-0-9551179-8-5


7
Contents 1 INTRODUCTION ....................................................................................................................................... 9
1.1 GENERAL .............................................................................................................................................. 9 1.2 SCOPE OF WORK.................................................................................................................................. 10 1.3 OUTLINE OF THESIS............................................................................................................................. 10
2 EXPERIMENTAL SETUP AND METHOD.......................................................................................... 11 2.1 EXPERIMENTAL CONDITIONS .............................................................................................................. 12
2.1.1 Experiment 1, operational changes............................................................................................... 13 2.1.2 Experiment 2, pebbles types .......................................................................................................... 13
3 EXPERIMENTAL RESULTS ................................................................................................................. 15 3.1 EXPERIMENT 1, OPERATIONAL CHANGES ............................................................................................ 15 3.2 EXPERIMENT 2, CHARGE TYPES........................................................................................................... 16 3.3 CCM CURVES ..................................................................................................................................... 17
4 DEM SIMULATIONS .............................................................................................................................. 19 5 CONCLUSIONS........................................................................................................................................ 23 6 FUTURE WORK....................................................................................................................................... 25 7 REFERENCES .......................................................................................................................................... 27


9
1 Introduction
1.1 General Grinding in tumbling mills is a process to reduce the particle size distribution of an extracted ore and commonly used in concentrating plants. It is a complex process with many factors affecting the result. Firstly, the size distribution of the feed strongly affects the grinding result (Fahlström, 1962). Secondly, the mineralogical properties affect the process and they are not constant over time, since the ore from a mine varies. This means also that the optimal settings for a mill will vary over time. The most common types of tumbling mills are the rod-, ball- and autogenous mills. Depending on the type of ore, there are different charge media to be used. In rod and ball mills, the different charge media are usually made of steel and added to the mill. In autogenous mills, the ore itself is used as charge medium. Generally, a pebble mill is used as a secondary stage in autogenous grinding and then the pebbles are taken from the first process step, the autogenous mill. Alternatively, the pebbles may consist of screened out lumps of gangue if there is a lack of pebbles. Grinding is also an expensive process due to the high power consumption. Less than 10 % of the energy is used for grinding in the grinding process (Tano, 2005) and it has been estimated that 3 % of all electricity generated worldwide is used in comminution processes (Morrison and Cleary, 2008). Grinding finer than justified economically should not be done (Wills, 1997) and especially since half of the ball milling energy is used just to grind from 500 μm to final product (Loveday, 2004). Therefore, it is important to enhance the understanding on how mills behave under different process conditions and settings to be able to optimise the process parameters and the grinding product. The lack of knowledge of events inside a mill stems from the harsh environment in mills that unable direct measurements and a different approach is necessary - indirect measurements. In the experiments analysed here, the Metso Minerals Continuous Charge Measurement (CCM) system has been used. This system measures the deflection of one lifter as it passes through the charge in the mill. Other systems available is an inductive proximity sensor, the Sensomag by Magoutteaux (Keshav et al., 2011), an inductive sensor (Kiangi and Moys, 2008) and sensors placed on the shell of the mill that measures vibrations (Campbell et al., 2001). Acoustic methods have also been developed to get information (Pax, 2001). Another system analyses ripples present in the power draw of the mill (Järvinen et al., 2006). Larger mills are difficult to control and more noise is introduced in the data, but to get reliable data large mills are better since there are less scale effects. Most experiments have been done with lab-scale equipment most likely because small mills are more easily controlled and handled. A prominent experiment with a small lab-scale mill investigated by X-ray filming has been performed (Powell et al., 2003) and the results have been used to validate discrete element method (DEM) simulations (McBride et al., 2004). A slightly larger mill (90x15 cm) has also been used (Rajamani et al., 2003). However, larger mills take longer to reach steady-state and generally require more financial and personal resources.
10
1.2 Scope of work There is a demand on every concentrator to maintain a high production rate with a steady quality, since the following step in production is dependent on this. To be able to achieve a good product it is very important to understand the grinding process and how the grinding is affected by changes in the system. Loussavaara Kiirunavaara AB, LKAB, mines iron in the north of Sweden and produces upgraded iron ore products for the steel industry. At LKAB, the concentrating plant should provide the pellet plant with a product that has very high iron content (mainly magnetite) and a specified amount of fine material < 45 μm to allow for the best condition in the next process step. The concentrator should always strive to meet these criteria and therefore, changes in the operating procedure that lead to an increase of fines < 45 μm can be seen as a probable increase of production rate. The objective of this research has been to increase the understanding of events occurring in tumbling mills with the aid of sensors inside the mill and by doing simulations of the mill. That is, to see how the mill will react to controlled changes in operating conditions, different pebble types and also to investigate if three dimensional simulations can be used to enhance the understanding of the mill behaviour. A primary goal is to increase the production from the mill without an increase of cost for the mill and this can be achieved by optimising the operational settings of the mill. The first set of experiments were a full factorial test to investigate how the mill react to changes in volume-% solids, mill filling level and the rotational speed of the mill. The second set of experiments were also a factorial design and intended to find out how the mill reacts to different mixtures of magnetite pebbles and to different size fractions of pebbles. Lastly, to find out if three dimensional discrete element modelling, DEM, simulations can be used as a tool to increase the understanding of the charge dynamics and to validate the simulations against data from real experiments.
1.3 Outline of thesis The first chapter gives a brief introduction to grinding and describes the scope of this work. The second chapter cover the experiments and the included manuscripts and then follows a chapter on DEM simulations and the conference paper and finally, conclusions.

11
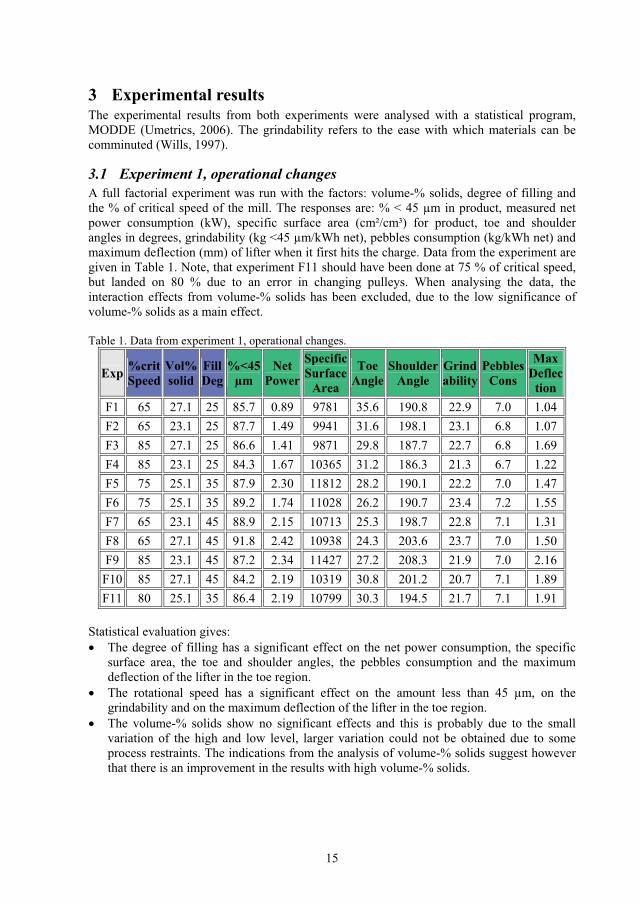
2 Experimental setup and method LKAB has in Malmberget, Sweden, a pilot scale mill at their R&D facility that was used to obtain necessary experimental data. The mill has a diameter of 1.414 m and is 1.57 m long. The grate-discharge mill has a rubber lining and has 12 rubber lifters, which are 10x10 cm with a face angle of 45 degrees. One of the lifters has a strain gauge detector embedded. The mill, the feed, the pebble feed and the water addition is controlled from a process room. To change the speed of the mill, it requires a change of pulleys. During the experiments process data were collected and in an attempt to observe changes inside the mill, the Metso Minerals Continuous Charge measurement (CCM) system was used. This system has been shown to be very sensitive to changes in operating conditions, to have a good reliability and to have a fast response time (Tano, 2005). The CCM system consists of the strain gauge detector embedded in one of the rubber lifter, see Figure 1. As the lifter hits the charge, the lifter bends backwards and the strain gauge mounted on the leaf spring converts the deflection to an electric signal. The signal is then amplified, filtered and transmitted to a computer (Dupont and Vien, 2001).
Figure 1. A cross section of the rubber lifter with at strain gauge detector embedded and a view inside the mill with the lifters. The deflection signal contains much information of the performance of the mill and is of great value, especially when running experiments. The information from the CCM system; the deflection signal, the mill speed, the charge level and the toe-, shoulder- and charge angles are continuously updated in the CCM monitoring program. More information can be obtained from the deflection signal by calculations. Figure 2 show a typical deflection profile from the CCM system.

12
Figure 2. A simplified view of a typical deflection signal of one revolution from the CCM system and a schematic view of the mill. One revolution of a mill can be described with a few positions in a typical deflection profile. The starting point, 0 degrees, is when the lifter with the embedded sensor is at horizontal level and moving down towards the toe region. The lifter is then unaffected by the charge, position 1. The lifter then comes into the toe region, position 2, which usually displays some turbulence. In addition, slurry-pooling phenomena might be detected here. As the lifter hits the charge, the lifter bends backwards and a sharp increase of deflection can be seen. Usually the maximal deflection is when the lifter is at the lowest point, position 3, or it might occur later, in position 4, as the lifter starts to move the lifter upwards, around 120 degrees. In position 4, it is possible to see the other lifters impact into the charge as the lifter impacts send shockwaves through the charge. The shoulder area, position 5, is when the lifter is leaving the charge with a decreasing deflection. Finally, the lifter returns to its normal position as it is again unaffected by the charge, position 6.
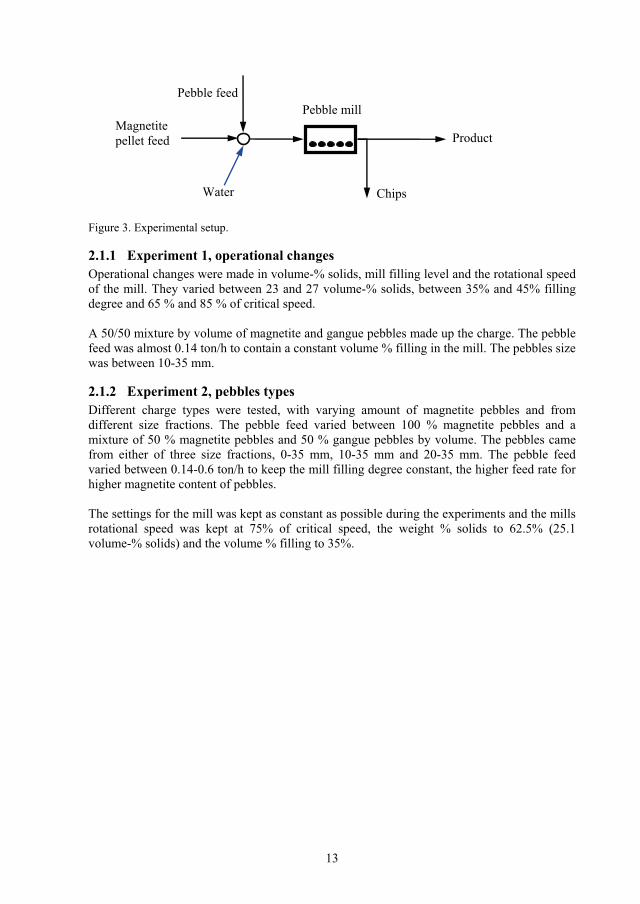
2.1 Experimental conditions The feed to the pilot mill had a size distribution similar to the full-scale pebble mills at LKAB, Kiruna, Sweden. The magnetite pellet feed was kept constant at 0.85 ton/h, giving a d50 of approximately 35μm and a density of 4.8 ton/m3. The setup is shown in Figure 3.
Deflection
Angle (increase in rotational direction) (degrees)
1 2
3
4 5 6
90
0
Rotational direction
180
270
Toe Angle
Shoulder Angle
Mill charge
0
13
Figure 3. Experimental setup.
2.1.1 Experiment 1, operational changes Operational changes were made in volume-% solids, mill filling level and the rotational speed of the mill. They varied between 23 and 27 volume-% solids, between 35% and 45% filling degree and 65 % and 85 % of critical speed. A 50/50 mixture by volume of magnetite and gangue pebbles made up the charge. The pebble feed was almost 0.14 ton/h to contain a constant volume % filling in the mill. The pebbles size was between 10-35 mm.
2.1.2 Experiment 2, pebbles types Different charge types were tested, with varying amount of magnetite pebbles and from different size fractions. The pebble feed varied between 100 % magnetite pebbles and a mixture of 50 % magnetite pebbles and 50 % gangue pebbles by volume. The pebbles came from either of three size fractions, 0-35 mm, 10-35 mm and 20-35 mm. The pebble feed varied between 0.14-0.6 ton/h to keep the mill filling degree constant, the higher feed rate for higher magnetite content of pebbles. The settings for the mill was kept as constant as possible during the experiments and the mills rotational speed was kept at 75% of critical speed, the weight % solids to 62.5% (25.1 volume-% solids) and the volume % filling to 35%.
Magnetite pellet feed
Water
Pebble feed
Chips
Product
Pebble mill

15
3 Experimental results The experimental results from both experiments were analysed with a statistical program, MODDE (Umetrics, 2006). The grindability refers to the ease with which materials can be comminuted (Wills, 1997).
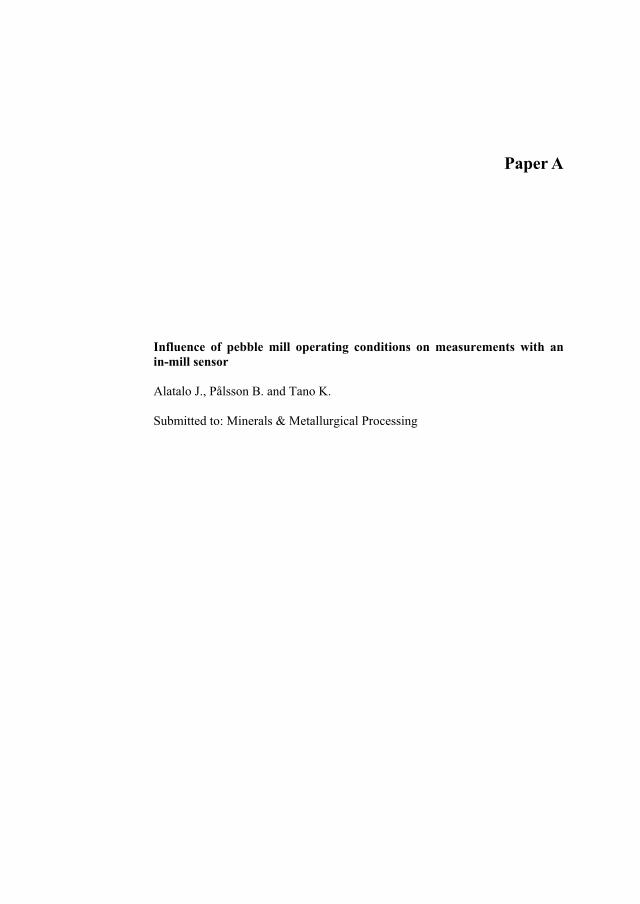
3.1 Experiment 1, operational changes A full factorial experiment was run with the factors: volume-% solids, degree of filling and the % of critical speed of the mill. The responses are: % < 45 μm in product, measured net power consumption (kW), specific surface area (cm²/cm³) for product, toe and shoulder angles in degrees, grindability (kg <45 μm/kWh net), pebbles consumption (kg/kWh net) and maximum deflection (mm) of lifter when it first hits the charge. Data from the experiment are given in Table 1. Note, that experiment F11 should have been done at 75 % of critical speed, but landed on 80 % due to an error in changing pulleys. When analysing the data, the interaction effects from volume-% solids has been excluded, due to the low significance of volume-% solids as a main effect. Table 1. Data from experiment 1, operational changes.
Exp %crit Speed
Vol% solid
Fill Deg
%<45 μm
Net Power
SpecificSurface
Area
Toe Angle
ShoulderAngle
Grind ability
Pebbles Cons
Max Deflection
F1 65 27.1 25 85.7 0.89 9781 35.6 190.8 22.9 7.0 1.04 F2 65 23.1 25 87.7 1.49 9941 31.6 198.1 23.1 6.8 1.07 F3 85 27.1 25 86.6 1.41 9871 29.8 187.7 22.7 6.8 1.69 F4 85 23.1 25 84.3 1.67 10365 31.2 186.3 21.3 6.7 1.22 F5 75 25.1 35 87.9 2.30 11812 28.2 190.1 22.2 7.0 1.47 F6 75 25.1 35 89.2 1.74 11028 26.2 190.7 23.4 7.2 1.55 F7 65 23.1 45 88.9 2.15 10713 25.3 198.7 22.8 7.1 1.31 F8 65 27.1 45 91.8 2.42 10938 24.3 203.6 23.7 7.0 1.50 F9 85 23.1 45 87.2 2.34 11427 27.2 208.3 21.9 7.0 2.16
F10 85 27.1 45 84.2 2.19 10319 30.8 201.2 20.7 7.1 1.89 F11 80 25.1 35 86.4 2.19 10799 30.3 194.5 21.7 7.1 1.91
Statistical evaluation gives: � The degree of filling has a significant effect on the net power consumption, the specific
surface area, the toe and shoulder angles, the pebbles consumption and the maximum deflection of the lifter in the toe region.
� The rotational speed has a significant effect on the amount less than 45 μm, on the grindability and on the maximum deflection of the lifter in the toe region.
� The volume-% solids show no significant effects and this is probably due to the small variation of the high and low level, larger variation could not be obtained due to some process restraints. The indications from the analysis of volume-% solids suggest however that there is an improvement in the results with high volume-% solids.
16
The analysis of data shows that there is an increase of amount < 45 μm and the grindability when the mill rotates at lower percentage of critical speed and at the same time, there will be a decrease of maximum deflection in the toe region. With a high filling degree, the net power consumption, the specific surface area, the pebbles consumption and the maximum deflection will increase compared to a low filling. The toe angle will be less and at the same time, the shoulder angle will increase. The best setting to produce more fines should be the lower rotational speed, 65 % of critical speed together with 45 % filling degree and a high volume-% solid.
3.2 Experiment 2, charge types The factors are the pebble magnetite content, 50 % or 100 %, and the pebble size fraction, 0-35 mm, 10-35 mm or 20-35 mm. The responses are; amount < 45 μm in product (%), measured net power consumption of the mill (kW), toe and shoulder angles from the CCM system (degrees), grindability (kg < 45 μm/kWh net), pebbles consumption (kg/kWh net) and the maximal deflection of the lifter when it first hits the charge (mm). The data can be seen in Table 2. Table 2. Data from experiment 2, charge types.
Exp Size Fraction
Amount of Magnetite
pebbles %<45μm Net
PowerToe
Angle Shoulder
Angle Grind ability
Pebbles Cons
Max Deflection
F5 10-35 50 87.9 2.3 28.2 190.1 22.2 7.0 1.47 F6 10-35 50 89.2 1.74 26.2 190.7 23.4 7.2 1.55 F12 20-35 100 86.1 2.59 27.0 192.1 21.1 29.7 2.24 F13 10-35 100 92.4 2.93 29.1 193.3 23.4 9.8 2.03 F14 0-35 100 93.9 2.31 27.8 194.5 24.8 25.1 1.76 F15 0-35 50 88.1 2.25 32.7 196.3 22.3 13.9 1.76 F16 20-35 50 83.5 2.17 30.1 189.8 20.5 15.2 1.99 F17 10-35 100 92.7 2.97 28.4 192.0 23.5 9.7 1.99 F18 10-35 100 94.0 3.22 31.9 193.0 23.7 9.6 1.97 F19 10-35 100 95.0 3.55 26.3 199.9 23.7 9.5 2.08 Statistical evaluation gives: � The amount of magnetite pebbles have a significant effect on amount < 45 μm, the net
power consumption, the grindability, the pebbles consumption and the maximum deflection in the toe region.
� The pebbles size fraction have a significant effect on amount < 45 μm, the grindability, the pebbles consumption and the maximum deflection in the toe region.
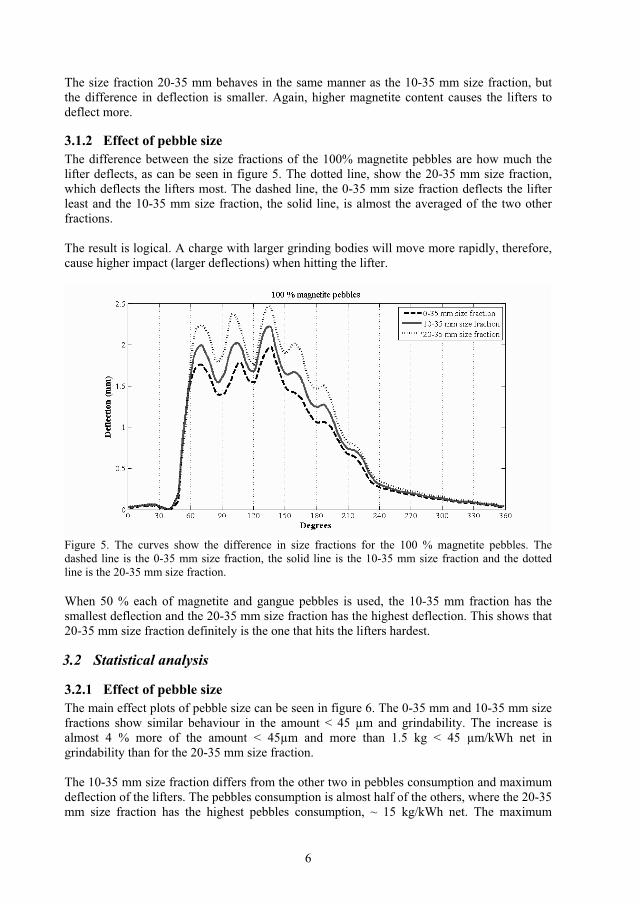
The experimental results show similar behaviour for both the 0-35 mm and 10-35 mm size fractions with an increase in amount < 45 μm and grindability. However, the 10-35 mm has lower pebbles consumption and maximum deflection, indicating a slightly better size fraction from an operational point of view. The 20-35 mm size fraction is not recommended, due to a smaller production of fines, a worsened grindability, high pebbles consumption and high maximum deflection of the lifter.

17
A high magnetite content in the pebbles will increase the amount < 45 μm and the grindability, but at the same time increase the net power consumption, the pebbles consumption and maximum deflection compared to pebbles with a magnetite and gangue mixture. The best setting to produce more fines should be pebbles with a high magnetic content and a size fraction of 10-35 mm.
3.3 CCM curves The CCM system will give deflection curves for each experiment and it can be seen that the lifter is clearly influenced by the different operating parameters. Figure 4 shows the deflection curves for the best settings from both experiments. The solid black curve has 100 % magnetite pebbles in size fraction 10-35 mm, rotates at 75 % of critical speed and has a degree of filling of 35 %. The dotted black curve has 50 % magnetite pebbles in size fraction 10-35 mm, rotates at 65 % of critical speed and a 45 % degree of filling. The CCM deflection curves show that there is a difference of the charge position between the different operating conditions.
0 30 60 90 120 150 180 210 240 270 300 330 3603600
0.5
1
1.5
2
Rotational angle (degrees)
Def
lect
ion
(mm
)
50 % magnetite pebbles, 65 % critical speed,45 % filling degree100 % magnetite pebbles, 75 % critical speed,35 % filling degree
Figure 4. The solid black curve show the deflection when 100 % magnetite pebbles in size fraction 10-35 mm, rotates at 75 % of critical speed and has a degree of filling of 35 %. The dotted black curve has 50 % magnetite pebbles in size fraction 10-35 mm, rotates at 65 % of critical speed and a 45 % degree of filling.


19
4 DEM simulations DEM, discrete element modelling, is a numerical method (pioneered by Cundall, 1971, Cundall and Strack, 1979) used for simulating particles, such as discs and spheres, and their interactions. All information about each particle is known at every point in the simulation. DEM is therefore suitable for simulating ball mill problems (Mishra and Rajamani, 1992) and it appears that DEM can be used to study the effect of various design and operating parameters on the impact spectrum of tumbling mills (Rajamani et al., 2000). Newton's laws of motions is utilised in DEM simulations and here, the mechanical model used is Hertz-Mindlin (a spring-dashpot model). DEM might be very helpful to illustrate events occurring in the charge, but can only be considered reliable if the simulations are validated against real process data. The largest limitations are that the slurry and the transport of slurry through the mill are not simulated. The slurry is possible to simulate, however the number of particles to create the slurry is enormous (due to the small size of the slurry particles and the volume it needs to fill) and the need of a much smaller timestep (in order to catch the movement and interaction of the slurry particles), would lead to impractical simulation times. To avoid this, small fractions are in some cases just simply removed (Forrest, 2007) and their mass assigned to the next coarser size fraction (Djordjevic, 2005). The breakage of particles is normally not simulated either. Tano (2005) used the same pilot mill to investigate different mill settings with a steel ball charge, but at that time the mill was shortened and therefore only 1.2 m in length. The steel balls were 10-30 mm; the filling degree varied between 25 and 35 %, the mills rotational speed was either 73 % or 78 %. To get stable grinding conditions, a hematite pellet feed with a density of 5.2 ton/m3, a d50 of 35 μm and a feed rate of 1.5 ton/h was chosen to get stable grinding conditions. The CCM system was in operation during these experiments. Therefore, these experiments have been used to validate simulations in two and three dimensions. The two-dimensional simulations done by Tano (2005) were performed in PFC2D developed by Itasca (2002). The lifter deflection was realised in the simulation by the use of a bendable lifter. The lifter was constructed by connecting (gluing) tiny balls together and it was calibrated against the real lifter's bench deflection test. There was a difference in the simulated and measured toe- and shoulder angles. One explanation for this discrepancy could be that the simulation was done in just two dimensions (Cleary et al., 2003). To get better results and to improve the simulations, three-dimensional simulations are here performed in EDEM developed by DEM Solutions Ltd (2010). A 10 cm slice of the pilot mill is simulated together with periodic boundaries. Here, the deflection is given from the experienced force acting on one lifter. A typical simulation can be seen in Figure 5, where the particles are coloured by the speed. The same material data has been used for both simulations and the signals are low pass filtered. The simulation contained 6700 balls with a randomised size distribution of 10-30 mm in diameters.

20
Figure 5. A view of a three-dimensional simulation, particles are coloured by speed. To be able to compare the results the simulated deflections have been normalised. Figure 6 gives the deflection curves; the solid black line is the deflection curve from the two-dimension simulation, the solid grey curve is the deflection curve from the three-dimension simulation and the dotted black curve is the measured deflection curve from the experiments. The result is shown for the simulations and the experiment with 73 % of critical speed and 25 % degree of filling.

21
Figure 6. The deflection curves, black solid line is the simulated curve in two dimensions, the grey solid line is the simulated deflection in three dimensions and the dotted black curve is the measured deflection. There is still a difference of degrees in toe angle between the three dimension simulated signal (smaller toe angle) and the measured signal (larger toe angle), but the discrepancy is smaller than in the two-dimensional case. The width of the deflection profile and the descending part of the three-dimensional simulation corresponds better to the experimental curve than the two-dimensional simulation. DEM simulation in three dimensions can be used to increase the understanding of the events inside the mill and it gives a better representative value then simulations in two dimensions. The simulations can be validated against deflection curves. The simulated charge dynamics seems to behave similar to the real dynamics in mills. The absence of slurry in the simulation is of course a limitation. The simulated mill will not necessarily be used to predict product results yet. Ongoing research is to couple DEM-FEM to get a structural response from the mill as well (Jonsén et al. 2009) and it is likely that the pulp liquid will be simulated in the near future.


23
5 Conclusions For production purposes an increase of the amount less than 45 μm can be regarded as a probable increase of production rate. From the experiments it can be seen that the amount < 45 μm and grindability will increase when the mill rotates at a low speed, when the mill filling is high, when only magnetite pebbles are used and when the pebbles size fraction is 10-35 mm. At low speed, there will be an increase of net power consumption and a decrease of maximum deflection in the toe region. At high degree of filling, there will be an increase of net power consumption, specific surface area, pebbles consumption, shoulder angle and maximum deflection in the toe region and a decrease in the toe angle. The amount < 45 μm and grindability will increase most at low speed when the degree of filling is high. Calculated as a possible improvement in energy utilisation, this increase indicates 3-4 % better energy efficiency in the studied grinding system. When only magnetite pebbles is used there will be an increase in amount < 45 μm, the net power consumption, the grindability, the pebbles consumption and the maximum deflection in the toe region. When the size fraction 10-35 mm is used there will be an increase in amount < 45 μm and the grindability and a decrease in pebbles consumption and maximum deflection in the toe region. When size fraction is 10-35 mm together with 100 % magnetite pebbles, the amount < 45 μm and net power consumption will increase more, the grindability and pebbles consumption will increase slightly and the net power consumption and maximum deflection will increase a lot compared to size fraction 10-35 mm with 50 % magnetite pebbles. A possible consequence of a larger lifter deflection might be an increased wear rate of lifters. Since pebbles mills are already today run at 100 % magnetite pebbles, and approximately 10-35 mm pebble fractions, the scope for better energy efficiency in this way is limited. This finding is supported by Fahlström (1962), who observed that a high speed would increase the loss of finer pebbles, produce a coarser product, and at the same time increase the media consumption and also the wear of shell and liners. This is also a good indicator that the rotational speed of the mill should be kept low. The comparison is interesting, since Fahlström did the experiments in cascade type of mills, while we have done the experiments in a mill that has a L/D � 1. Since an efficient grinding of fine material is essential in pellet feed production, the test strongly suggests that these experimental findings of low rotational speed and high filling degree should be verified in a full-scale mill. It would be especially of interest to perform the experiments with only magnetite pebbles in size fraction 10-35 mm. Most likely, the 20-35 mm is too coarse and the 0-35 mm probably does not contain enough large particles to grind efficiently. The CCM system provides a good deflection curve that the three-dimensional DEM simulations can be validated against. It still shows a discrepancy in the toe angle, but not as large as in the two-dimensional case and the absence of slurry is of course still a limitation. The simulations in three dimensions show a deflection profile more similar to the real signal from the CCM system. The movement of the charge also seem to be as the real charge dynamics. Simulations in three dimensions should be used to increase the understanding of events occurring inside the mill.

25
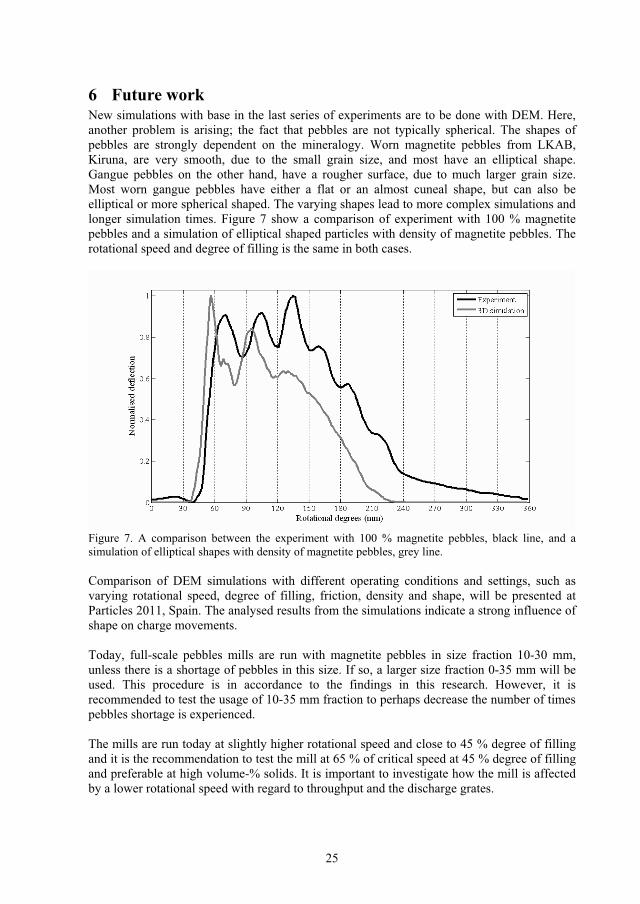
6 Future work New simulations with base in the last series of experiments are to be done with DEM. Here, another problem is arising; the fact that pebbles are not typically spherical. The shapes of pebbles are strongly dependent on the mineralogy. Worn magnetite pebbles from LKAB, Kiruna, are very smooth, due to the small grain size, and most have an elliptical shape. Gangue pebbles on the other hand, have a rougher surface, due to much larger grain size. Most worn gangue pebbles have either a flat or an almost cuneal shape, but can also be elliptical or more spherical shaped. The varying shapes lead to more complex simulations and longer simulation times. Figure 7 show a comparison of experiment with 100 % magnetite pebbles and a simulation of elliptical shaped particles with density of magnetite pebbles. The rotational speed and degree of filling is the same in both cases.
Figure 7. A comparison between the experiment with 100 % magnetite pebbles, black line, and a simulation of elliptical shapes with density of magnetite pebbles, grey line. Comparison of DEM simulations with different operating conditions and settings, such as varying rotational speed, degree of filling, friction, density and shape, will be presented at Particles 2011, Spain. The analysed results from the simulations indicate a strong influence of shape on charge movements. Today, full-scale pebbles mills are run with magnetite pebbles in size fraction 10-30 mm, unless there is a shortage of pebbles in this size. If so, a larger size fraction 0-35 mm will be used. This procedure is in accordance to the findings in this research. However, it is recommended to test the usage of 10-35 mm fraction to perhaps decrease the number of times pebbles shortage is experienced. The mills are run today at slightly higher rotational speed and close to 45 % degree of filling and it is the recommendation to test the mill at 65 % of critical speed at 45 % degree of filling and preferable at high volume-% solids. It is important to investigate how the mill is affected by a lower rotational speed with regard to throughput and the discharge grates.


27
7 References Campbell J., Spencer S., Sutherland D., Rowlands T., Weller K., Cleary P. and Hinde A., 2001. SAG mill monitoring using surface vibrations. In: proceedings SAG 2011, Vancouver, B.C., Canada, Vol. II, pp. 373-385. Cleary P.W., Morrison R. and Morrell S., 2003. Comparison of DEM and experiment for a scale model SAG mill, International Journal of Mineral Processing, Vol. 68, Issues 1-4, pp. 129-165. Clermont B. and de Haas B., 2008. Optimize mill performance by using on-line ball and pulp measurements. In: Comminution 08 Conference, Falmouth, UK, June 17-20, 2008. 17 p. Cundall P.A., 1971. A computer model for simulating progressive large scale movements in blocky rock systems. In: Proceedings of the symposium of the international society for rock mechanics, Nancy, France. Vol. 1, paper no. II-8. Cundall P.A. and Strack O.D.L., 1979. Discrete numerical model for granular assemblies, Geotechnique, Vol. 29, Issue 1, pp. 47-65. DEM Solutions Ltd, 20. EDEM, version 2.3.0. www.dem-solutions.com Djordjevic N., 2005. Influence of charge size distribution on net-power draw of tumbling mill based on DEM modelling. Minerals Engineering, Vol. 18, issue 1, pp. 375-378. Dupont J.F. and Vien A., 2001. Continuous SAG Volumetric Charge Measurement. In: Proc. 33rd Ann. Can. Min. Proc. AGM, CIM, Ottawa, pp.51 - 67. Fahlström P.H., 1962. Autogenous grinding at Vassbo. World Mining, Vol 15, No. 10, Sept. 1962 , pp. 28-32 and Vol. 15, No 11, Oct. 1962, pp. 46-71. Forrest M., 2007. Virtual Milling, Materials World, 15.4; ProQuest Science Journals, pp. 31. Itasca, 2002. PFC User Manual, 2 ed., Itasca Consulting Group Inc., Minneapolis, USA. Jonsén P., Alatalo J., Pålsson B.I. and Tano K., 2009. Prediction of contact forces between a grinding charge and mill lifters, In:12th European Symposium on Comminution and Classification ESCC 2009, September 15-18, 2009. 9 p. Järvinen J., Laurila H., Karesvuori J. and Blanz P., 2006. Experiences in charge volume measurement and the potential of modelling. In: proceedings SAG 2006, Vancouver, B.C., Canada, Vol. III, pp. 253-265. Kiangi K.K. and Moys M.H., 2008. Particle filling and size effects on the ball load behaviour and power in a dry pilot mill: Experimental study. Powder Technology, Vol.187, Issue 1, pp.79-87. Loveday B.K., 2007. The use of fag and sag batch tests for measurement of abrasion rates of full-size rocks. Minerals Engineering, Vol. 17, Issue 11-12, pp. 1093-1098.
28
Loveday B., 2010. The small pebble process for reducing ball and power consumption in secondary grinding, In: Proceedings International Mineral Processing Congress (IMPC) XXV, Brisbane, Australia, pp. 981-989. McBride A., Govender I., Powell M. and Cloete T., 2004. Contributions to the experimental validation of the discrete element method applied to tumbling mills. Engineering Computations, Vol. 21, Issue 2/3/4, pp.119 – 136. Mishra B.K. and Rajamani R.K., 1992. The discrete element method for the simulation of ball mills. Appl. Math. Modelling, Vol. 16, Issue 11, pp. 598-604 Morrison R.D. and Cleary P.W., 2008. Towards a virtual comminution machine. Minerals Engineering, Vol. 21, Issue 11, pp. 770 – 781. Pax R.A., 2001. Non-contact acoustic measurement of in-mill variables of SAG mills. In: proceedings SAG 2001, Vancouver, B.C., Canada, Vol. II, pp. 386-393. Powell M.S., McBride A.T. and Govender I., 2003. Application of DEM outputs to refining applied SAG mill models. In: Proceedings International Mineral Processing Congress (IMPC) XXII, Cape Town, South Africa, Vol. I, pp. 307-316. Keshav P., de Haas B., Clermont B., Mainza A. and Moys M., 2011. Optimisation of the secondary ball mill using an on-line ball and pulp load sensor – the Sensomag. Minerals Engineering, Vol. 24, Issues 3-4, pp. 325-334. Rajamani R.K., Mishra B.K., Venugopal R. and Datta A., 2000. Discrete element analysis of tumbling mills. Powder Technology, Vol. 109, Issues 1-3, pp.105-112. Rajamani R.K., Songfack P. and Mishra, B.K., 2000. Impact energy spectra of tumbling mills. Powder Technology, Vol. 108, Issues 2-3, pp. 116-121. Tano K., 2005. Continuous Monitoring of Mineral Processes with Special Focus on Tumbling Mills – A Multivariate Approach. Doctoral Thesis, 2005:05, Luleå University of Technology, Sweden. Umetrics AB, 2006. MODDE, version 8.0.0.0, May 31 2006. www.umetrics.com/modde. Wills B.A., 1997. Mineral processing technology: an introduction to the practical aspects of ore treatment and mineral recovery. 6th edition, Oxford, Butterworth-Heinemann, pp. 113.
Paper A
Influence of pebble mill operating conditions on measurements with an in-mill sensor Alatalo J., Pålsson B. and Tano K. Submitted to: Minerals & Metallurgical Processing


1
Influence of pebble mill operating conditions on measurements with an in-mill sensor
Johanna Alatalo*1, Bertil Pålsson1 and Kent Tano2 1 Div. of Sustainable Process Engineering, Luleå University of Technology, SE-971 87 Luleå, Sweden
2 Research and Development, LKAB, SE-983 81 Malmberget, Sweden * Corresponding author: Tel.: +46 920 491 841; fax: +46 920 973 64
E-mail address: [email protected]
Abstract Autogenous grinding is a process of reducing the particle size distribution of an extracted ore by using the ore itself as grinding media. It is a process that is difficult to control and there is a lack of knowledge of the events occurring inside the mill. To find out more how the mill behaves under different process conditions a full factorial test were performed with an iron ore in a pilot-scale pebble mill at the LKAB R&D facility in Malmberget. As a complement, a strain gauge detector was embedded in one of the mills rubber lifters, the Metso Minerals CCM system, and it is used to get more information about the charge dynamics. The data from the experiments has been analysed with the aid of a statistical program. For production purposes, an increase of the amount less than 45 μm can be regarded as a probable increase of production rate. The analysis shows that there will be an increase of fines at 65 % of critical speed especially when the mill has a 45 % filling degree. This setting will also increase the power consumption but improves the grindability of the ore even more. The deflection of the lifters is smaller for lower critical speeds. A higher degree of filling also give a smaller toe angle and a higher shoulder angle as expected. Keywords: Comminution; Grinding; Pebble milling; Operating conditions; Statistical analysis
1 Introduction Autogenous grinding is a process letting the ore itself reduce the particle size distribution of an extracted ore. This is a complex process. It is complex due to the many factors that affect the process. Firstly, the result is very strongly dependent on the size distribution of the ore fed to the mill (Fahlström, 1962). Also, the mineralogical properties of the ore influence the process and the feed rate regulates the mill properties. Finally, most settings need to be finely tuned for an optimal grinding process. The mills have high power consumption and most energy will not be used to ground the material, less than 10% is used for grinding (Tano, 2005). There are large economical benefits to be made with improved and optimised grinding settings. However, since the ore to a concentrator varies; the grindability of an ore is not constant over time. The mineralogy and the physical properties may vary and result in varying optimal operating conditions for the mill settings. This means that autogenous grinding is a process that is difficult to control and there is also a lack of knowledge of what happens inside a mill. Since the environment inside the mill is too harsh for direct measurement, and to get a better understanding of a mill's performance alternative measurement systems are necessary. This can be by done for example by measuring vibrations with sensors placed on a mill shell (Campbell et al., 2001), by the use of inductive sensors placed inside the mill (Kiangi and Moys, 2008) or by using an acoustic method (Pax, 2001) to get information of events inside a mill. Different sensors have been

2
made, Magoutteaux has developed a mill sensor SensoMag (Clermont and de Haas, 2008) and the CCM (Continuous Charge Measurements system) by Metso Minerals has been shown to have features as good reproducibility, reliability and a fast response time for varied process conditions (Tano 2005). The CCM system is used here in an attempt to learn more about the charge dynamics in the experiments discussed in this article. Most controlled experiments are performed with lab-scale mills. At the University of Cape Town, a lab-scale mill was investigated by X-ray filming (Powell et al., 2003) and it gave very detailed information about the movements in that mill. A slightly larger mill with a diameter of 90 cm and a length of 15 cm has also been used (Rajamani et al., 2000). The use of the smaller mills is of course a limitation, but larger mills are more difficult to control and more noise is introduced in the data. Despite this, the pilot scale mill that is used in the experiments presented in this article is approximately 1.4x1.6 m.
1.1 Scope of works Loussavaara Kiirunavaara AB, LKAB, mines iron ore, mainly magnetite in the north of Sweden to produce upgraded iron ore products to the steel industry. There is a demand on the concentrators to maintain a high production rate with a steady quality to the pellet plants and an understanding of the process is very important to be able to achieve this. It is of interest to increase the production from grinding mills, and one way of doing this is to optimise the mill settings. However, it is important to first understand the responses of how the mill behaves for different process conditions. To investigate this, a full factorial test was performed. The different factors were volume-% solids, mill filling level and the rotational speed of the mill. They were varied between 23 to 27 volume-% solids, between 35% and 45% filling by volume and 65 % and 85 % of critical speed. The charge medium consisted of 50 % magnetite pebbles and 50 % gangue pebbles by volume.
2 The experimental setup LKAB has at their R&D facility in Malmberget, Sweden, a pilot mill, which is used to obtain the necessary experimental data. The grate-discharge mill is approximately 1.4 m in diameter and 1.57 m in length and has 12 rubber lifters installed. The lifters are 10x10 cm and have a face angle of 45 degrees. Lifters and mantle pieces are made of rubber. The mill is controlled from a process control room, from where it is possible to control the feed to the mill, the pebble- and the water addition. The speed of the mill requires a change of pulleys. This mill has been used previously when different settings with a steel ball charge were investigated (Tano, 2005). In one rubber lifter a strain gauge detector is embedded, cf. Figure 1. This detector is a part of the Continuous Charge Measuring (CCM) system from Metso Minerals. As the lifter bends backwards, the strain gauge mounted on the leaf spring converts the deflection to an electric signal. The signal is amplified, filtered and transmitted to a computer (Dupont and Vien, 2001). When the CCM is operating, the speed, charge level, toe-, shoulder- and charge angles and a deflection signal are continuously updated in the CCM monitoring program. The sensor is very sensitive to changes in operating conditions and has also shown good reliability and fast response time (Tano, 2005). All this information is of great value when performing experiments.

3
Deflection
Angle (increase in rotational direction) (degrees)
1 2
3
4 5 6
90
0
Rotational direction
180
270
Toe Angle
Shoulder Angle
Mill charge
Figure 1. A cross section of the rubber lifter with at strain gauge detector embedded and a view inside the mill with the lifters. The signal from the CCM system contains much information about the performance of the mill. A typical deflection profile can be seen in Figure 2. It is also possible to perform calculations on the signal to get even more data, such as mill volume occupied by charge.
Figure 2. A simplified view of a typical deflection signal of one revolution from the CCM system and a schematic view of the mill. A typical signal of one revolution can be described with a few positions with start at 0 degrees. First the lifter is in the air and unaffected, position 1.Then it will reach the toe area, position 2. The toe area commonly shows some turbulence and here it is possible to detect slurry pooling. When the lifter hits the charge, the deflection increases rapidly and normally reaches the maximal deflection at the bottom of the mill, position 3. As the lifter continues to move through the charge, the shockwaves from other lifter impacts can be detected, position 4. The deflection decreases as the mill leaves the charge, which is referred to as the shoulder
Deflection
Angle (increase in rotational direction) (degrees)
1 2
3
4 5 6
0

4
area, position 5. Finally, the lifter retracts from the charge and returns to its normal position, i.e. position 6.
2.1 Experimental conditions The feed to the mill was a magnetite pellet feed with at d50 of approximately 35μm and a density of 4.8 ton/m3. The feed rate was kept constant at 0.85 ton/h to get a size distribution similar to the full scale pebble mills at LKAB:s facilities at Kiruna, Sweden. The charge consisted of a mixture of magnetite and gangue pebbles, each 50% by volume. The pebble feed rate was set to approximately 0.14 ton/h to maintain a constant volume-% filling in the mill. The pebbles were between 10-35 mm in size. The setup is shown in Figure 3. Operational changes were made in volume-% solids, mill filling level and the rotational speed of the mill. They were varied between 23 and 27 volume-% solids, between 35% and 45% filling degree and 65 % and 85 % of critical speed.
Figure 3. The experimental setup.
3 Results and discussion The full factorial test, with centre points is analysed with the aid of a statistical program, MODDE (Umetrics, 2006). The factors are the degree of filling, the % of critical speed and the volume-% solids. Data from the experiments are given in Table 1. The responses are: %<45 μm in Product, measured NetPower (kW), specific surface area (cm²/cm³) for Product, Toe and Shoulder angles in degrees, Grindability (kg <45 μm/kWh net), Pebbles Consumption (kg/kWh net) and Maximum deflection (mm) of lifter when it first hits the charge. The grindability refers to the ease with which materials can be comminuted (Wills, 1997). Note, that experiment F11 should have been done at 75 % of critical speed, but landed on 80 % due to an error in changing pulleys. When analysing the data, the interaction effects from volume-% solids has been excluded, due to the low significance of volume-% solids as a main effect.
Magnetite pellet feed
Water
Pebble feed
Chips
Product
Pebble mill
5
Table 1. Data from experiments.
Exp %crit Speed
Vol% solid
Fill Deg
%<45 μm
Net Power
SpecificSurface
Area
Toe Angle
ShoulderAngle
Grind ability
Pebbles Cons
Max Deflection
F1 65 27.1 25 85.7 0.89 9781 35.6 190.8 22.9 7.0 1.04 F2 65 23.1 25 87.7 1.49 9941 31.6 198.1 23.1 6.8 1.07 F3 85 27.1 25 86.6 1.41 9871 29.8 187.7 22.7 6.8 1.69 F4 85 23.1 25 84.3 1.67 10365 31.2 186.3 21.3 6.7 1.22 F5 75 25.1 35 87.9 2.30 11812 28.2 190.1 22.2 7.0 1.47 F6 75 25.1 35 89.2 1.74 11028 26.2 190.7 23.4 7.2 1.55 F7 65 23.1 45 88.9 2.15 10713 25.3 198.7 22.8 7.1 1.31 F8 65 27.1 45 91.8 2.42 10938 24.3 203.6 23.7 7.0 1.50 F9 85 23.1 45 87.2 2.34 11427 27.2 208.3 21.9 7.0 2.16
F10 85 27.1 45 84.2 2.19 10319 30.8 201.2 20.7 7.1 1.89 F11 80 25.1 35 86.4 2.19 10799 30.3 194.5 21.7 7.1 1.91
In short, the results show that the responses in most cases depend on the critical speed or on the degree of mill filling. The critical speed has a significant effect on the amount less than 45 μm, on the grindability and on the maximum deflection of the lifter in the toe region. The degree of filling has a significant effect on the net power consumption, the specific surface area, the toe and shoulder angles, the pebbles consumption and the maximum deflection of the lifter in the toe region. In the following sections, the results are reported and discussed more in detail.
3.1 Critical speed The effect of changing the rotational speed of the mill influences the amount of fine material produced, the grindability of the ore and the maximum deflection. It can be seen in Figure 4 that for a lower percentage of critical speed, the amount less 45 μm and the grindability increases compared to those at a higher percentage of critical speed. The amount of < 45 μm increases with almost 3 % and the grindability increases with almost 1.5 kg < 45 μm/ kWh net when the speed is at 65 % of critical speed instead of 85 % of the critical speed. When the rotational speed is lower the maximum deflection decreases with almost 0.5 mm (corresponding to ~27 % of maximum deflection). This indicates that a better production results will be the case when a low percentage of critical speed is used, i.e. the lower rotational speed gives better grinding condition. It will also introduce less stress on the lifters, and by that give (hopefully) a longer lining life.

6
85
86
87
88
89
90
64 66 68 70 72 74 76 78 80 82 84 86
%<4
5μm
%critspeed
%<45μm
N=11 R2=0,639 R2 Adj.=0,399DF=6 Q2=-0,756 RSD=1,724 Conf. lev.=0,90
21
22
23
24
64 66 68 70 72 74 76 78 80 82 84 86
Grin
dabi
lity
%critspeed
Grindability
N=11 R2=0,631 R2 Adj.=0,385DF=6 Q2=-0,517 RSD=0,7255 Conf. lev.=0,90
1.1
1.2
1.3
1.4
1.5
1.6
1.7
1.8
1.9
64 66 68 70 72 74 76 78 80 82 84 86
Max
Def
lect
ion
%critspeed
Max Deflection
N=11 R2=0,826 R2 Adj.=0,710DF=6 Q2=0,257 RSD=0,1936 Conf. lev.=0,90
Main Effect for % of Critical Speed, resp.
Figure 4. The main effect plots for critical speed on amount < 45 μm, the grindability and the maximum deflection.
3.2 Volume-% solids For the volume-% solids, it is difficult to interpret the results since there are no significant effects. This is most likely due to the too small difference between the high and low values used for this factor; the variation in the volume-% solids was not large enough. The original plan called for a larger variation, but due to process restraints the variation became too small. However, there is an indication that a higher volume-% solids will increase the grindability and that the charge will climb higher in the mill. The result from Tano's experiments showed that the charge would have a lower toe angle and a higher shoulder angle at higher volume-% solids (Tano, 2005).
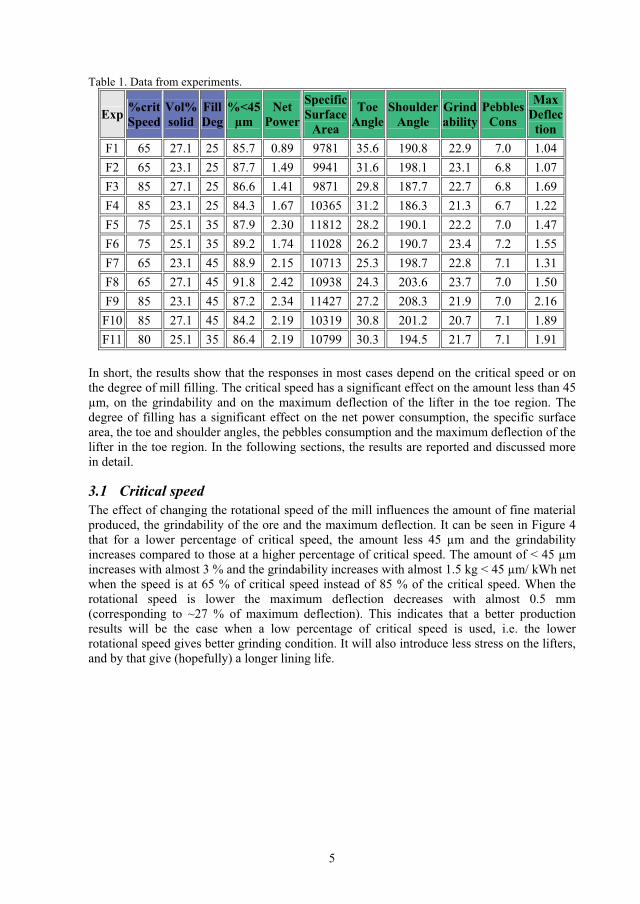
3.3 Degree of filling The main effect of lower or higher degree of filling in the mill can be seen in Figure 5. When the degree of filling of the mill is high, the net power consumption will increase with approximately 0.8 kW. An increase is the expected result, since more material has to be rotated by the mill, i.e. more power is necessary. With the high degree of filling, the specific surface area increases with ~ 500 cm2/cm3 and pebbles consumption will increase with just 0.2 kg/kWh net. The high filling degree of the mill will deflect the lifter almost 0.4 mm more. The extra material in the mill also causes a change in toe and shoulder angles, which can be seen in the statistical data. Logically, the toe angle will be approximately 5 degrees lower and the shoulder angle will be more than 10 degrees higher with a higher degree of filling.
7
1.5
2.0
2.5
24 26 28 30 32 34 36 38 40 42 44 46
Net
Pow
er
Filling Degree
NetPower
N=11 R2=0,793 R2 Adj.=0,656DF=6 Q2=0,270 RSD=0,2851 Conf. lev.=0,90
10000
10500
11000
11500
24 26 28 30 32 34 36 38 40 42 44 46
Surfa
ce
Filling Degree
Specific Surface Area
N=11 R2=0,435 R2 Adj.=0,059DF=6 Q2=-0,603 RSD=633,2 Conf. lev.=0,90
6.8
6.9
7.0
7.1
7.2
24 26 28 30 32 34 36 38 40 42 44 46
Pebb
lesU
se
Filling Degree
PebblesConsumption
N=11 R2=0,553 R2 Adj.=0,256DF=6 Q2=-0,380 RSD=0,1326 Conf. lev.=0,90
26
28
30
32
24 26 28 30 32 34 36 38 40 42 44 46
ToeA
ngle
Filling Degree
ToeAngle
N=11 R2=0,778 R2 Adj.=0,629DF=6 Q2=0,139 RSD=2,001 Conf. lev.=0,90
185
190
195
200
205
24 26 28 30 32 34 36 38 40 42 44 46
Shou
lder
Ang
le
Filling Degree
ShoulderAngle
N=11 R2=0,753 R2 Adj.=0,588DF=6 Q2=0,024 RSD=4,535 Conf. lev.=0,90
1.2
1.4
1.6
1.8
24 26 28 30 32 34 36 38 40 42 44 46
Max
Def
lect
ion
Filling Degree
Maximum Deflection
N=11 R2=0,826 R2 Adj.=0,710DF=6 Q2=0,257 RSD=0,1936 Conf. lev.=0,90
Main Effect for Filling Degree, resp.
Figure 5. The main effect plots for filling degree of the mill on the net power consumption, the specific surface area, the pebbles consumption and the toe and shoulder angle.
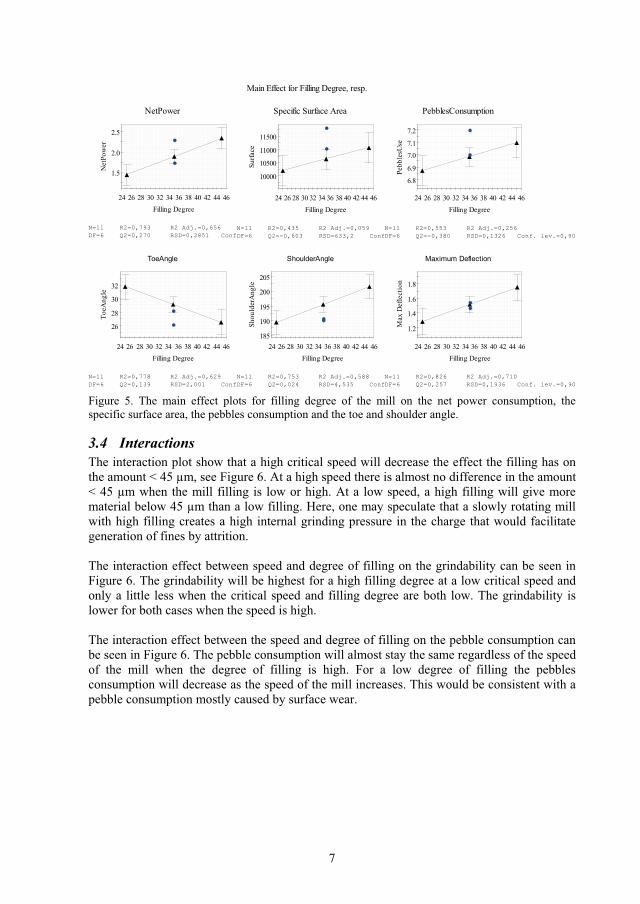
3.4 Interactions The interaction plot show that a high critical speed will decrease the effect the filling has on the amount < 45 μm, see Figure 6. At a high speed there is almost no difference in the amount < 45 μm when the mill filling is low or high. At a low speed, a high filling will give more material below 45 μm than a low filling. Here, one may speculate that a slowly rotating mill with high filling creates a high internal grinding pressure in the charge that would facilitate generation of fines by attrition. The interaction effect between speed and degree of filling on the grindability can be seen in Figure 6. The grindability will be highest for a high filling degree at a low critical speed and only a little less when the critical speed and filling degree are both low. The grindability is lower for both cases when the speed is high. The interaction effect between the speed and degree of filling on the pebble consumption can be seen in Figure 6. The pebble consumption will almost stay the same regardless of the speed of the mill when the degree of filling is high. For a low degree of filling the pebbles consumption will decrease as the speed of the mill increases. This would be consistent with a pebble consumption mostly caused by surface wear.
8
86
87
88
89
90
64 66 68 70 72 74 76 78 80 82 84 86
%<4
5μm
%critspeed
%<45μm
N=11 R2=0,639 R2 Adj.=0,399DF=6 Q2=-0,756 RSD=1,724
Fill (low ) Fill (high)
Fill (low )
Fill (low )
Fill (high)
Fill (high) 21.4
21.6
21.8
22.0
22.2
22.4
22.6
22.8
23.0
23.2
23.4
64 66 68 70 72 74 76 78 80 82 84 86
Grin
dabi
lity
%critspeed
Grindability
N=11 R2=0,631 R2 Adj.=0,385DF=6 Q2=-0,517 RSD=0,7255
Fill (low ) Fill (high)
Fill (low )
Fill (low )
Fill (high)
Fill (high) 6.8
6.9
7.0
7.1
64 66 68 70 72 74 76 78 80 82 84 86
Pebb
lesC
onsu
mpt
ion
%critspeed
PebblesConsumption
N=11 R2=0,553 R2 Adj.=0,256DF=6 Q2=-0,380 RSD=0,1326
Fill (low ) Fill (high)
Fill (low )
Fill (low )
Fill (high)Fill (high)
Interaction Plot for % Critical Speed*Filling Degree, resp.
Figure 6. Seen here are the interaction plots between the percentage of critical speed and the degree of filling in the mill. The graphs show, from left to right, the effect on amount < 45 μm, the effect on the grindability and the effect on the pebble consumption. The method for specific surface area measurement is an uncertain method and therefore it is not unexpected that there are no significant effects for this response.
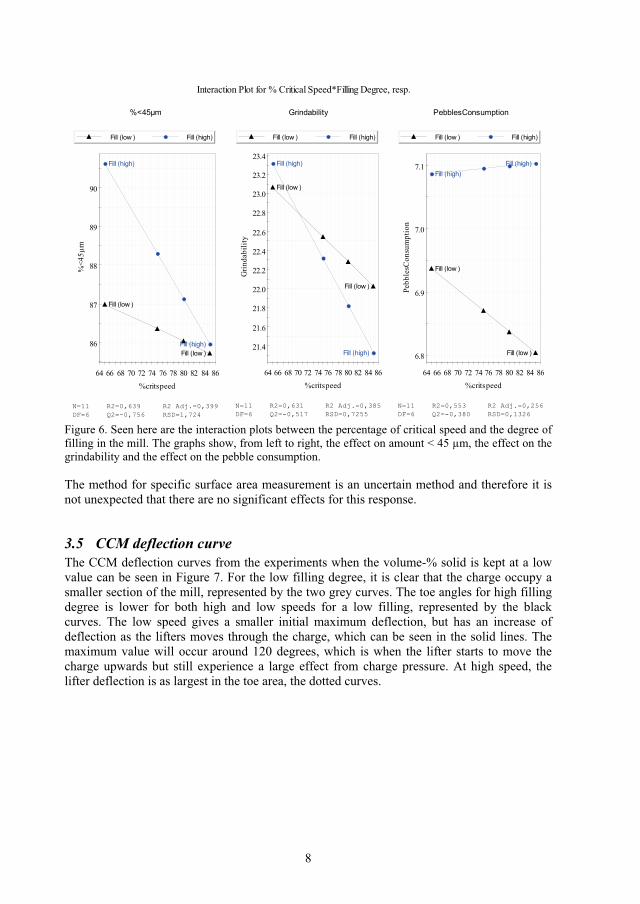
3.5 CCM deflection curve The CCM deflection curves from the experiments when the volume-% solid is kept at a low value can be seen in Figure 7. For the low filling degree, it is clear that the charge occupy a smaller section of the mill, represented by the two grey curves. The toe angles for high filling degree is lower for both high and low speeds for a low filling, represented by the black curves. The low speed gives a smaller initial maximum deflection, but has an increase of deflection as the lifters moves through the charge, which can be seen in the solid lines. The maximum value will occur around 120 degrees, which is when the lifter starts to move the charge upwards but still experience a large effect from charge pressure. At high speed, the lifter deflection is as largest in the toe area, the dotted curves.

9
Figure 7. All signals come from experiments with low volume-% solids. Experiments with high filling degree are shown in black and low filling degree is shown in grey. Experiments with low critical speed are shown with solid lines and the experiments with a high critical speed are shown with dotted lines.
4 Conclusions For production purposes, an increase of the amount less than 45 μm can be regarded as a probable increase of production rate. The analysis of the data shows that there will be an increase of fines at low speed especially together with a high filling level in the mill. The net power consumption will increase, primarily due to the higher filling level and at the same time, the grindability will improve, but even more. Higher degree of filling will of course as expected give a smaller toe angle and a larger shoulder angle, simply because a higher filling degree takes more space inside the mill. Calculating on this increase, as a possible improvement in energy utilisation indicates 3-4 % better energy efficiency. The initial maximum deflection of the lifter is less at lower speed but increases for a higher filling degree; however, it will still be lower than the maximum deflection at high speeds. The maximum deflection occurs around 120 degrees for low speed and in the toe region for high speed. A possible consequence of a larger lifter deflection might be an increased wear rate of lifters. This finding is supported by Fahlström (1962), who observed that a high speed will increase the loss of finer pebbles and produce a coarser product and at the same time increase the media consumption and also the wear of shell and liners. This is also a good indicator that the rotational speed of the mill should be kept to a lower value. The comparison is interesting, since Fahlström did the experiments in cascade type of mills, while we have done the experiments in a mill that has a L/D � 1. Today, the full-scale pebble mills are run at slightly higher rotational speed and almost 45 % degree if filling. Since an efficient grinding of fine material is essential in pellet feed production, it is strongly recommended that these experimental findings should be verified in a full-scale mill. In addition, it is important to investigate how the throughput and the grate
10
discharge are affected by a lower rotational speed. Also, that it probably is a great advantage to have variable speed control of full-scale pebble mills to be able to continuously adjust for varying ore properties.
5 Acknowledgments The authors would like to thank LKAB for financial support, and Metso Minerals for the use of the CCM system.
6 References Campbell J., Spencer S., Sutherland D., Rowlands T., Weller K., Cleary P. and Hinde A., 2001. SAG mill monitoring using surface vibrations. In: Proceedings SAG 2011, Vancouver, B.C., Canada, Vol. II, pp. 373-385. Clermont B. and de Haas B., 2008. Optimize mill performance by using on-line ball and pulp measurements. In: Comminution 08 Conference, Falmouth, UK, June 17-20, 17 p. Dupont J.F. and Vien A., 2001. Continuous SAG Volumetric Charge Measurement. In: Proc. 33rd Ann. Can. Min. Proc. AGM, CIM, Ottawa, pp.51 - 67. Fahlström P.H., 1962. Autogenous grinding at Vassbo. World Mining, Vol 15, No. 10, Sept. 1962 , pp. 28-32 and Vol. 15, No 11, Oct. 1962, pp. 46-71. Kiangi K.K. and Moys M.H., 2008. Particle filling and size effects on the ball load behaviour and power in a dry pilot mill: Experimental study. Powder Technology 187, pp.79-87. Pax R.A., 2001. Non-contact acoustic measurement of in-mill variables of SAG mills. In: Proceedings SAG 2001, Vancouver, B.C., Canada, Vol. II, pp. 386-393. Powell M.S., McBride A.T. and Govender I., 2003. Application of DEM outputs to refining applied SAG mill models. In: Proceedings International Mineral Processing Congress (IMPC) XXII, Cape Town, South Africa, Vol. I, pp. 307-316. Rajamani R.K., Mishra B.K., Venugopal R. and Datta A., 2000. Discrete element analysis of tumbling mills. Powder Technology 109, pp.105-112. Tano K., 2005. Continuous Monitoring of Mineral Processes with Special Focus on Tumbling Mills – A Multivariate Approach. Doctoral Thesis, 2005:05, Luleå University of Technology, Sweden. Umetrics AB, 2006. MODDE, version 8.0.0.0, May 31 2006. www.umetrics.com/modde. Wills B.A., 1997. Mineral processing technology: an introduction to the practical aspects of ore treatment and mineral recovery. 6th edition, Oxford, Butterworth-Heinemann, pp. 113.

�
�
�������������������
�� ������������������������� ����������������������������Alatalo J., Pålsson B. and Tano K.
Submitted to: Minerals Engineering

1
Influence of charge type on measurements with an in-mill sensor Johanna Alatalo*1, Bertil Pålsson1 and Kent Tano2
1 Div. of Sustainable Process Engineering, Luleå University of Technology, SE-971 87 Luleå, Sweden 2 Research and Development, LKAB, SE-983 81 Malmberget, Sweden * Corresponding author: Tel.: +46 920 491 841; fax: +46 920 973 64
E-mail address: [email protected]
Abstract Grinding is a process of reducing the particle size distribution of an extracted ore. The process is complex with many factors affecting the result. The ore feed to a concentrator varies and optimisation is important, since grinding has high energy consumption and therefore is an expensive process. The environment inside a mill is too harsh for direct measurements and in the performed experiments a sensor embedded in one of the lifter is used to increase the knowledge of events occurring in the mill. The purpose of experiments was to investigate how different mixtures of magnetite pebbles affect the grinding ability of the mill and to find out how different size fractions of the pebbles affect the product size. The evaluations of experiments show that there is an advantage to keep the magnetite pebbles fraction as high as possible. This will increase the power consumption and maximum deflection of lifters, but at the same time increase the amount < 45 μm, the grindability and the pebbles consumption. A pebble size fraction of 10-35 mm will improve the grindability most and the amount < 45 μm. It is strongly suggested that the 10-35 mm and 100 % magnetite pebbles fraction should be tested in a larger scale pebble mill to confirm the data from these experiments. Keywords: Keywords: Comminution; Grinding; Pebble milling; Experiments; Charge type; Statistical analysis
1 Introduction Grinding is a process of reducing the particle size distribution of an extracted ore, commonly used in concentrating plants. The process of grinding is complex; many factors affect the process. Most important is the ores mineralogical and physical properties. The composition of the ore to a concentrator may vary; the grindability of an ore is not constant over time. The variations in mineralogy and the physical properties result in varying optimal operating conditions for the mill settings. According to Fahlström (1962) the size distribution of the ore feed strongly affect the grinding result. Other factors such as the amount of material to be ground control the mill properties and most settings need to be finely tuned before the process works in an optimal way. Optimisation is important, since grinding has high energy consumption and therefore is an expensive process. According to Wills (1997) grinding finer than justified economically should not be done, since it is the greatest single operating cost and Loveday (2010) states that grinding from 500 μm to final product requires about half of ball milling energy. An increase of amount < 45 μm can therefore be seen as a probable increase of production rate. Since the environment inside a mill is too harsh for direct measurements, there is a lack of knowledge of events occurring in a mill. Different methods to measure the dynamics are used to increase the understanding. Campbell et al. (2001) measures vibrations with sensors placed on the shell of the mill. Kiangi and Moys (2008) use an inductive sensor inside the mill to get

2
information. Pax (2001) use an acoustic method to get data. Clermont and de Haas (2008) presents SensoMag, a sensor from Magoutteaux. In an attempt to increase the understanding of charge dynamics in the experiments discussed in this article a sensor has been used. The chosen sensor is the Continuous Charge Measurement (CCM) system developed by Metso Minerals. It has been shown by Tano (2005) that it has a fast response time for varying process conditions, and that it is reliable and has good reproducibility. In reported experiments, the common size of mill has been labscale mill since small mills are more easily controlled. A prominent investigation by X-ray filming of a labscale mill has been performed by Powell et al. (2003). Rajamani et al. (2000) used a slightly larger labscale mill, diameter of 90 cm and a length of 15 cm. Another way to decrease the uncertainties in experiments is to perform batch tests, as has been done by Loveday (2004). Larger mills will produce data which is comparable to data from full scale mills, but it also increases the noise ratio in the produced data. Larger mills are also more difficult to control and will take longer time to reach steady state. It usually also require more financial and personnel resources.
1.1 Scope of work In the north of Sweden, Loussavaara Kiirunavaara AB (LKAB) mines iron ore, mainly magnetite, to provide the steel industry with upgraded iron ore products. The pellet plants demand a high production rate with a steady quality from the concentrating plants. An understanding of the how changes in charge types influence the behaviour of the mill is important. There is a varying composition of the pebbles to LKAB:s full scale pebble mills and it depends on the excess of pebbles from the autogenous mills in the previous process step. If there is a lack of magnetite pebbles from the primary mill, either extra gangue pebbles will be added to the pebble mill or a larger size fraction of magnetite pebbles will be used. Therefore, it is of interest to find out how the different pebble mixtures affect the grindability of the mill. It is also of interest to find out how the different size fractions of the pebbles affect the product size. In an attempt to learn more about the milling process, a series of statistically planned experiments were performed and process data collected. To observe the changes inside the mill, the Metso Minerals CCM system was used. The test setup was a factorial design where the two factors are tested at 2 resp. 3 different levels. Two different levels of magnetite pebbles content were investigated, 50% and 100%. Also 3 different size distributions were tested, 0-35 mm, 10-35 mm and 20-35 mm.
2 The experimental setup The necessary experimental data were obtained from a pilot mill at the R&D facility of LKAB in Malmberget, Sweden. The mill has a diameter of 1.4 m and is 1.57 m in length. It has a rubber lining and 12 rubber lifters installed. The lifters are 10x10 cm with a face angle of 45 degrees. The mill is a grate-discharge mill. It is controlled from a process control room, where the feed to the mill, the pebble- and the water addition can be changed. The CCM system from Metso Minerals consist of a strain gauge detector embedded in one the rubber lifters, see figure 1. When the lifter comes in contact with the charge it bends backwards, the strain gauge mounted on the leaf spring converts the deflection to an electric signal. The signal is then amplified, filtered and transmitted to a computer (Dupont and Vien,

3
2001). The speed, charge level, toe-, shoulder- and charge angles and a deflection curve are continuously updated in the CCM program while the CCM is operating.
Figure 1. A cross section of the rubber lifter with at strain gauge detector embedded and a view inside the mill with the lifters. The signal from the CCM system holds a large amount of information about the mill and it is of great value when conducting and evaluating experiments. Seen in figure 2 is a typical deflection profile. More information can be obtained from the curve, such as mill volume occupied by charge by performing calculations.
Figure 2. A simplified view of a typical deflection signal of one revolution from the CCM system The deflection curve starts at 0 degrees when the lifter still is in the air, its normal position, section 1. Here 0 degrees is when the lifter is horizontal with only a velocity in the downward vertical direction. When it reaches the charge in the toe area there is rapid increase of deflection, section 2. Turbulence in the toe area can be seen as a small bump in the beginning of the toe area, but might also be a slurry pooling phenomena. The maximal deflection occurs
Deflection
Angle (increase in rotational direction) (degrees)
1 2
3
4 5 6
90
0
Rotational direction
180
270
Toe Angle
Shoulder Angle
Mill charge
0

4
often around the bottom of the mill, section 3. Shockwaves from the other lifter impacts can be seen as the lifter moves through the charge, section 4. As the lifter continues and reaches the shoulder area, the deflection decreases, section 5. In section 6, the lifter has cleared the charge again.
2.1 Experimental conditions The feed to the mill was a magnetite pellet feed with a d50 of approximately 35 μm and a density of 4.8 ton/m3. The feed rate was kept constant at 0.85 ton/h to get a size distribution similar to the feed to the full scale pebble mills at LKAB Kiruna, Sweden. The pebble feed was either of three size fractions: 0-35 mm, 10-35 mm and 20-35 mm and the pebbles were either 100 % magnetite pebbles or a mix of 50 % by volume magnetite and gangue pebbles. The pebble feed rate was varied to keep the mill filling degree constant to produce a stable grinding fineness. The pebble feed varied between 0.14 – 0.6 ton/h, a lower feed rate for the gangue pebbles. The settings for the mill was kept as constant as possible during the experiments and the mills rotational speed was kept at 75% of critical speed, the weight % solids to 62.5% and the volume-% filling to 35%. The experimental setup can be seen in figure 3.
Figure 3. Experimental setup.
3 Results and Discussion The experiments has been analysed with the aid of a statistical program, MODDE (Umetrics, 2006). The factors are the pebbles magnetite content, 50 % or 100 %, and the pebbles size fraction, 0-35 mm, 10-35 mm or 20-35 mm. The responses are; amount < 45 μm in product (%), measured net power consumption of the mill (kW), toe and shoulder angles from the CCM system (degrees), grindability (kg < 45 μm/kWh net), pebbles consumption (kg/kWh net) and the maximal deflection of the lifter when it first hits the charge (mm). The grindability refers to the ease with which materials can be comminuted (Wills, 1997). Data from experiments can be seen in Table 1.
Magnetite pellet feed
Water
Pebble feed
Chips
Product
Pebble mill

5
Table 1. Data from experiment.
Exp Size Fraction
Amount of Magnetite
pebbles %<45μm Net
PowerToe
Angle Shoulder
Angle Grind ability
Pebbles Cons
Max Deflection
F5 10-35 50 87.9 2.30 28.2 190.1 22.2 7.0 1.47 F6 10-35 50 89.2 1.74 26.2 190.7 23.4 7.2 1.55 F12 20-35 100 86.1 2.59 27.0 192.1 21.1 29.7 2.24 F13 10-35 100 92.4 2.93 29.1 193.3 23.4 9.8 2.03 F14 0-35 100 93.9 2.31 27.8 194.5 24.8 25.1 1.76 F15 0-35 50 88.1 2.25 32.7 196.3 22.3 13.9 1.76 F16 20-35 50 83.5 2.17 30.1 189.8 20.5 15.2 1.99 F17 10-35 100 92.7 2.97 28.4 192.0 23.5 9.7 1.99 F18 10-35 100 94.0 3.22 31.9 193.0 23.7 9.6 1.97 F19 10-35 100 95.0 3.55 26.3 199.9 23.7 9.5 2.08 The CCM sensor system gives a signal for each rotation, and this signal is averaged over a period to minimise nuisance factors that may affect the signal. The deflection curves of the lifter are clearly influenced by the different size fractions and different amount of magnetite pebbles.
3.1 The in-mill sensor
3.1.1 Effect of magnetite pebbles In the size fraction 0-35 mm there is almost no difference in the deflection signal from the CCM measurement system between the different pebbles magnetite content. For the size fraction 10-35 mm, there is a clear difference in the signal from the 100% magnetite pebbles fraction and the 50 % magnetite and gangue pebbles fraction as can be seen in figure 4. The 100% magnetite pebbles clearly deflect the lifter more.
Figure 4. The pebble size fraction 10-35 mm show that there is clearly a difference between the pebbles with 100 % magnetite pebbles and the 50 % magnetite pebbles.
6
The size fraction 20-35 mm behaves in the same manner as the 10-35 mm size fraction, but the difference in deflection is smaller. Again, higher magnetite content causes the lifters to deflect more.
3.1.2 Effect of pebble size The difference between the size fractions of the 100% magnetite pebbles are how much the lifter deflects, as can be seen in figure 5. The dotted line, show the 20-35 mm size fraction, which deflects the lifters most. The dashed line, the 0-35 mm size fraction deflects the lifter least and the 10-35 mm size fraction, the solid line, is almost the averaged of the two other fractions. The result is logical. A charge with larger grinding bodies will move more rapidly, therefore, cause higher impact (larger deflections) when hitting the lifter.
Figure 5. The curves show the difference in size fractions for the 100 % magnetite pebbles. The dashed line is the 0-35 mm size fraction, the solid line is the 10-35 mm size fraction and the dotted line is the 20-35 mm size fraction. When 50 % each of magnetite and gangue pebbles is used, the 10-35 mm fraction has the smallest deflection and the 20-35 mm size fraction has the highest deflection. This shows that 20-35 mm size fraction definitely is the one that hits the lifters hardest.
3.2 Statistical analysis
3.2.1 Effect of pebble size The main effect plots of pebble size can be seen in figure 6. The 0-35 mm and 10-35 mm size fractions show similar behaviour in the amount < 45 μm and grindability. The increase is almost 4 % more of the amount < 45μm and more than 1.5 kg < 45 μm/kWh net in grindability than for the 20-35 mm size fraction. The 10-35 mm size fraction differs from the other two in pebbles consumption and maximum deflection of the lifters. The pebbles consumption is almost half of the others, where the 20-35 mm size fraction has the highest pebbles consumption, ~ 15 kg/kWh net. The maximum

7
deflection is around 2.0 mm at highest for the 20-35 mm pebbles, about 0.2 mm less for the 0-35 mm pebbles and around 1.5 mm deflection of the lifter for the 10-35 mm pebbles fraction. The toe angle will be lowest for the 10-35 mm fraction and highest for the 0-35 mm fraction. The shoulder angle will be highest for the 0-35 mm fraction and almost the same for both 10-35 and 20-35 mm fractions. This implies that 0-35 fraction will climb higher in the mill (a larger charge angle). It appears that the 10-35 mm pebbles product gives the best operational results, closely followed by the 0-35 mm fraction.
82
84
86
88
90
0-35 10-35 20-35
%<4
5μm
SizeDistr
%<45μm
N=10 R2=0,961 R2 Adj.=0,913DF=4 Q2=0,917 RSD=1,139 Conf. lev.=0,90
20
21
22
23
0-35 10-35 20-35
Grin
dabi
lity
SizeDistr
Grindability
N=10 R2=0,949 R2 Adj.=0,885DF=4 Q2=0,807 RSD=0,4472 Conf. lev.=0,90
8
10
12
14
0-35 10-35 20-35
Pebb
lesC
onsu
mpt
ion
SizeDistr
PebblesConsumption
N=10 R2=1,000 R2 Adj.=1,000DF=4 Q2=1,000 RSD=0,1454 Conf. lev.=0,90
1.4
1.6
1.8
2.0
0-35 10-35 20-35
Max
Def
lect
ion
SizeDistr
Max Deflection
N=10 R2=0,982 R2 Adj.=0,958DF=4 Q2=0,953 RSD=0,04966 Conf. lev.=0,90
Main Effect for Size Distr, resp.
Figure 6. Main effect plots for size fractions on amount < 45 μm, the grindability, the pebbles consumption and the maximum deflection.
3.2.2 Effect of magnetite pebbles The main effect plots can be seen in Figure 7. By using 100% magnetite pebbles content, the % < 45 μm will increase with almost 4 %, and the grindability improves with almost 1 kg < 45 μm/kWh net. There is also an increase in the maximum deflection with 0.25 mm. The net power consumption increases with 0.5 kWh net and the pebbles consumption will increase with approximately 10 kg/ kWh net. The toe angle will be lower and at the same time the shoulder angle will be higher, indicating a charge that is stretched out more in the mill.

8
86
88
90
92
50 60 70 80 90 100
%<4
5μm
MagnetitePebblesContent
Main Effect for MalmpebblesAndel, resp. %<45μm
N=10 R2=0,961 R2 Adj.=0,913DF=4 Q2=0,917 RSD=1,139 Conf. lev.=0,90
2.0
2.5
3.0
50 60 70 80 90 100
Net
Pow
er
MagnetitePebblesContent
NetPower Consumption
N=10 R2=0,854 R2 Adj.=0,672DF=4 Q2=0,614 RSD=0,3167 Conf. lev.=0,90
21.5
22.0
22.5
23.0
23.5
50 60 70 80 90 100
Grin
dabi
lity
MagnetitePebblesContent
Grindability
N=10 R2=0,949 R2 Adj.=0,885DF=4 Q2=0,807 RSD=0,4472 Conf. lev.=0,90
12
14
16
18
20
22
50 60 70 80 90 100
Pebb
lesC
onsu
mpt
ion
MagnetitePebblesContent
Pebbles Consumption
N=10 R2=1,000 R2 Adj.=1,000DF=4 Q2=1,000 RSD=0,1454 Conf. lev.=0,90
1.7
1.8
1.9
2.0
50 60 70 80 90 100
Max
Def
lect
ion
MagnetitePebblesContent
Max Deflection
N=10 R2=0,982 R2 Adj.=0,958DF=4 Q2=0,953 RSD=0,04966 Conf. lev.=0,90
Main Effect for Magnetite pebbles content, resp.
Figure 7. Main effect plots for amount magnetite pebbles on amount < 45 μm, the net power consumption, the grindability, the pebbles consumption and the maximum deflection.
3.2.3 Interaction effects The interaction effects which can be seen in figure 8 show that there is a slightly larger increase of the amount < 45μm for pebbles in the size fraction 0-35 mm and 10-35 mm than for 20-35 mm when the 100 % magnetite pebbles is used. The net power consumption is highest for the 10-35 mm and 100 % magnetite pebbles fraction. For 20-35 mm there is a small increase in net power consumption when changing from 50 % to 100 % magnetite content. The power consumption for the 0-35 mm pebbles is the same regardless of magnetite content. The grindability is independent on amount of magnetite pebbles for size fractions 10-35 mm and 20 -35 mm, but for the 0-35 mm pebbles there is an improvement when magnetite content is 100 %. The pebbles consumption increased mostly for the 20-35 mm and 0-35 mm size fraction when changing from 50 to 100 % magnetite pebbles. The maximum deflection is the same irrespectively of magnetite pebbles content for the 0-35 mm size fraction. The deflection for 20-35 mm size fraction increases with 10 % (from approximately 2.0 to 2.2 mm) when changing form 50 % to 100% magnetite pebbles. For the 10-35 mm size fraction there is a 33 % (from approximately 1.5 to 2.0) increase in maximum deflection when 100 % magnetite pebbles is used. A larger deflection of the lifter could be indicating a higher wear on the lifters. The reason for the 0-35 mm fraction showing the same deflection irrespective of magnetite content might be that the proportion of larger stones is less in this fraction, and that the fines part has cushioning effect.

9
85
90
0-35 10-35 20-35
%<4
5μm
SizeDistr
%<45μm
N=10 R2=0,961 R2 Adj.=0,913DF=4 Q2=0,917 RSD=1,139
Mag (50) Mag (100)
Mal (50)
Mal (50)
Mal (100)
Mal (100)
2.0
2.5
3.0
0-35 10-35 20-35
Net
Pow
er
SizeDistr
NetPower Consumption
N=10 R2=0,854 R2 Adj.=0,672DF=4 Q2=0,614 RSD=0,3167
Mag (50) Mag (100)
Mal (50) Mal (50)Mal (100)
Mal (100)22
24
0-35 10-35 20-35
Grin
dabi
lity
SizeDistr
Grindability
N=10 R2=0,949 R2 Adj.=0,885DF=4 Q2=0,807 RSD=0,4472
Mag (50) Mag (100)
Mal (50)
Mal (50)
Mal (100)
Mal (100)
10
20
30
0-35 10-35 20-35
Pebb
lesC
onsu
mpt
ion
SizeDistr
Pebbles Consumption
N=10 R2=1,000 R2 Adj.=1,000DF=4 Q2=1,000 RSD=0,1454
Mag (50) Mag (100)
Mal (50) Mal (50)
Mal (100)Mal (100)
1.6
1.8
2.0
2.2
0-35 10-35 20-35
Max
Def
lect
ion
SizeDistr
Max Deflection
N=10 R2=0,982 R2 Adj.=0,958DF=4 Q2=0,953 RSD=0,04966
Mag (50) Mag (100)
Mal (50)
Mal (50)
Mal (100)
Mal (100)
Interaction Plot for SizeDistr*MagnetiteContent, resp.
Figure 8. Interaction effect plots for amount magnetite pebbles on amount < 45 μm, the net power consumption, the grindability, the pebbles consumption and the maximum deflection.
4 Conclusions The analysis of data shows that there is an advantage to keep the magnetite pebbles fraction as high as possible. There are a few things to consider, higher magnetite content will increase the net power consumption, the pebbles consumption and will deflect the lifters more. The increase of net power consumption is due to the high density of magnetite; the total rotating weight increases and that demands more energy input. The higher pebbles consumption will be contributing to the increase of fines in the final product. The lifters that deflect more might be subjected to higher wear and this should be investigated further. Also, the amount < 45 μm and the grindability increases when only magnetite pebbles is used. The increase of < 45 μm can be seen as a probable increase in production rate since higher feed rate can be selected to get a coarser final product. The 10-35 mm size fraction has the highest amount < 45 μm, the best grindability and the lowest pebbles consumption and should be the best to use for this type of grinding. Most likely, the 20-35 mm is too coarse and the 0-35 mm probably does not contain enough large particles to grind efficiently. Today, the full-scale pebble mills are run with 10-30 mm magnetite pebbles and in accordance to the findings in this research, when there is a shortage of pebbles the 0-35 mm magnetite pebbles will be used. However, it is suggested that the 10-35 mm fraction should be used to decrease the number of times there is a pebbles shortage.

10
5 Acknowledgements Thanks to LKAB for the financial support of the experiments and to Metso Minerals for the use of the CCM system.
6 References Campbell J., Spencer S., Sutherland D., Rowlands T., Weller K., Cleary P. and Hinde A., 2001. SAG mill monitoring using surface vibrations. In: Proceedings SAG 2011, Vancouver, B.C., Canada, Vol. II, pp. 373-385. Clermont B. and de Haas B., 2008. Optimize mill performance by using on-line ball and pulp measurements. In: Comminution 08 Conference, Falmouth, UK, June 17-20, 2008. 17 p. Dupont J.F. and Vien A., 2001. Continuous SAG Volumetric Charge Measurement. In: Proc. 33rd Ann. Can. Min. Proc. AGM, CIM, Ottawa, pp.51 - 67. Fahlström P.H., 1962. Autogenous grinding at Vassbo. World Mining, Vol 15, No. 10, Sept. 1962 , pp. 28-32 and Vol. 15, No 11, Oct. 1962, pp. 46-71. Kiangi K.K. and Moys M.H., 2008. Particle filling and size effects on the ball load behaviour and power in a dry pilot mill: Experimental study. Powder Technology, Vol.187, Issue 1, pp.79-87. Loveday B.K., 2007. The use of fag and sag batch tests for measurement of abrasion rates of full-size rocks. Minerals Engineering, Vol. 17, Issue 11-12, pp. 1093-1098. Loveday B., 2010. The small pebble process for reducing ball and power consumption in secondary grinding, In: Proceedings International Mineral Processing Congress (IMPC) XXV, Brisbane, Australia, pp. 981-989. Pax R.A., 2001. Non-contact acoustic measurement of in-mill variables of SAG mills. In: proceedings SAG 2001, Vancouver, B.C., Canada, Vol. II, pp. 386-393. Powell M.S., McBride A.T. and Govender I., 2003. Application of DEM outputs to refining applied SAG mill models. In: Proceedings International Mineral Processing Congress (IMPC) XXII, Cape Town, South Africa, Vol. I, pp. 307-316. Rajamani R.K., Mishra B.K., Venugopal R. and Datta A., 2000. Discrete element analysis of tumbling mills. Powder Technology, Vol. 109, Issues 1-3, pp.105-112. Tano K., 2005. Continuous Monitoring of Mineral Processes with Special Focus on Tumbling Mills – A Multivariate Approach. Doctoral Thesis, 2005:05, Luleå University of Technology, Sweden. Umetrics AB, 2006. MODDE, version 8.0.0.0, May 31 2006. www.umetrics.com/modde. Wills B.A., 1997. Mineral processing technology: an introduction to the practical aspects of ore treatment and mineral recovery. 6th edition, Oxford, Butterworth-Heinemann, pp. 113.
Paper C
Comparing Experimental Measurements of Mill Lifter Deflections with 2D and 3D DEM Predictions Alatalo J., Pålsson B. and Tano K. Published as: Alatalo J., Pålsson B. and Tano K., 2010. Comparing Experimental Measurements of Mill Lifter Deflections with 2D and 3D DEM Predictions. In: Discrete Element Methods, Simulations of Discontinua: Theory and Applications. Queen Mary, University of London, pp. 194-198. ISBN: 978-0-9551179-8-5,


DISCRETE ELEMENT METHODS
��������� !� �� �"�#�� �$%� � �"$��&��##�#&" ��' &# �"��$�(")�*'���'�+'�
' ���� '�"��$��
,������������-.��������/��0����-.�1���"��*��
1Division of Mineral Processing, Luleå University of Technology, SE-97187 Luleå, Sweden 2Technology and Business Development, LKAB, SE-98381 Malmberget Sweden
The grinding process has high power consumption and as a result, it is also costly. It is a difficult process to monitor since there are many variables that affect the end product. Information of the events occurring in the charge can be achieved by measuring the lifter deflection and with simulation it is possible to illustrate what take place in the charge. However, for simulations to be reliable it demands that they are verified against process data. At LKAB R&D facility there is a pilot mill with a lifter deflection measuring system mounted inside one of the rubber lifters. A series of experiments with a steel media charge were performed and this provides an opportunity to validate simulation results. The measured lifter deflection signal is used to compare with signals from 2 and 3 dimensional DEM simulations of the pilot mill. The resulting signals show that the 3-dimensional case displays a better profile and the difference of toe and shoulder angles are less than in the 2-dimensional case. This means that the simulations are more reliable when they are performed in three dimensions and that the DEM simulations can be used to increased the knowledge of the events inside a mill and its charge.
Simulations of Discontinua – Theory and Applications 194

DISCRETE ELEMENT METHODS
�"��'%�"���Milling is the process of reducing the particle size distribution of the extracted
ore. It demands much energy and it is a very expensive part of the process. Therefore, it needs to be optimised as much as possible. However, there is a lack of knowledge of what happens inside the charge of a tumbling mill. In principle it is impossible to use direct measurements in the charge since the environment is too harsh, but it is possible to use indirect methods of measuring, for example, deflection of lifters, variation in energy consumption or surface vibration on the mill.
The total process of grinding is relatively difficult to monitor, since there are a large number of variables to consider, for example the flow rates, percentage of solids or filling, and of course, the ore itself. These variables will strongly affect the end product. This also means that there is a possibility to improve the process and to adapt�it to the feed product stream.
To increase the understanding of the grinding process, DEM simulation might be very helpful to illustrate the events occurring in the charge. Note, the simulations can only be considered reliable, if they are validated with real process data.
!� �� �"�#�LKAB mines iron ore in the north of Sweden and has at Malmberget a R&D-
facility from where process data were obtained.
The pilot mill measures, 1.414 m in diameter and is 1.22 m in length. It has 12 rubber lifters and a strain gauge detector is embedded in one of them. It is a grate-discharge mill.
Simulations of Discontinua – Theory and Applications 195

DISCRETE ELEMENT METHODS
Fig 1. Inside the pilot mill, here seen with a pebble charge
In a series of experiments with a steel media charge, consisting of balls with a radius between 5 – 15 mm, the pilot mill filling was varied between 25 and 35 %. Its rotational speed was either 73 or 78 % of critical speed. To get stable grinding conditions, the chosen feed material was a hematite pellet feed, with a d50 of 35 μm and 5200 kg/m3, and feed rate was kept constant at 1.5 ton/h.
The strain gauge detector, a Continuous Charge Measuring system (CCM) comes from Metso Minerals. The detector measures the deflection of the lifter as it passes through the charge and from the signal, the toe and shoulder angles as well as degree of filling can be calculated.
$�%#�"���The 2-dimensional simulations were performed in Pfc2D at LKAB [1] and
show a difference between the simulated and measured toe and shoulder angles. One explanation is the fact that the simulation were done in 2D [2]. Noticeable is that the lifter deflection was simulated directly in the simulation, using a “bendable” lifter.
Here, the 3-dimensional simulations are performed in EDEM. A 10 cm slice of the pilot mill is simulated. To get a more reliable simulation, the sides of the mill are set as periodic boundaries. The deflection is calculated from the
Simulations of Discontinua – Theory and Applications 196

DISCRETE ELEMENT METHODS
experienced force on the lifter. The same material data and parameters have been used for both simulations.
� $%#"$�The resulting deflections from the experiments and the simulations can be
seen in figure 2. In this case, the mill filling is 35 % by volume and the rotational speed is 73 % of critical speed. The signals from the simulations are low pass filtered.
0
0,2
0,4
0,6
0,8
1
0 30 60 90 120 150 180 210 240 270 300 330 360
Rotation angle (degrees)
Nor
mal
ised
def
lect
ion
Fig 2. Graph of the lifter deflection signals for the measured (blue), 2D simulation (green) and 3D simulation (red) signals.
The difference of degrees in that occurred in the 2-dimensional events is not as large for the 3-dimensional event, which means that the 3D simulations are more reliable. The simulated signal in the 3D case shows a better profile than the 2D case.
Simulations of Discontinua – Theory and Applications 197
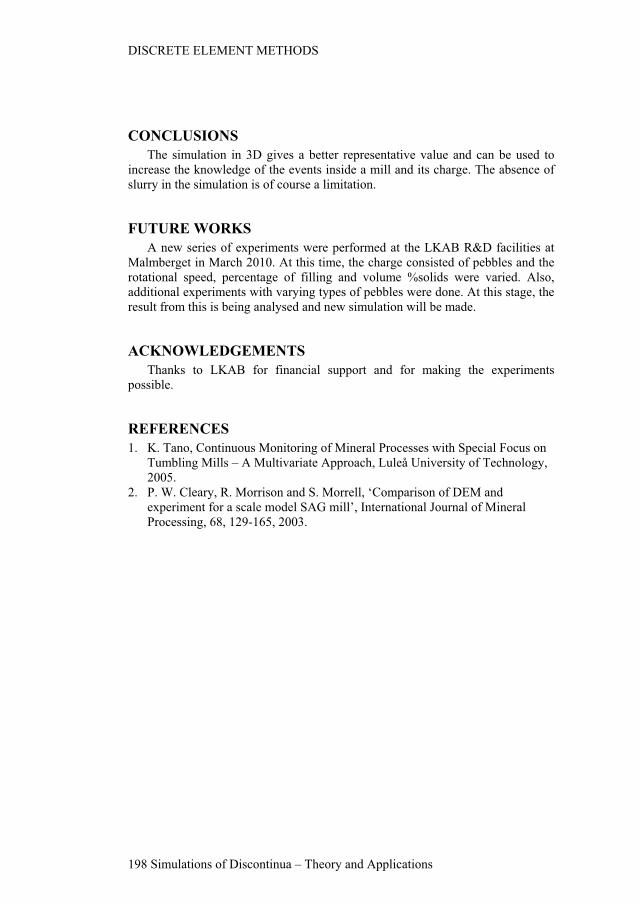
DISCRETE ELEMENT METHODS
Simulations of Discontinua – Theory and Applications 198
����#%$��$�The simulation in 3D gives a better representative value and can be used to
increase the knowledge of the events inside a mill and its charge. The absence of slurry in the simulation is of course a limitation.
&%"%� �(��1$�A new series of experiments were performed at the LKAB R&D facilities at
Malmberget in March 2010. At this time, the charge consisted of pebbles and the rotational speed, percentage of filling and volume %solids were varied. Also, additional experiments with varying types of pebbles were done. At this stage, the result from this is being analysed and new simulation will be made.
��1��(# '� � �"$�Thanks to LKAB for financial support and for making the experiments
possible.
� & � �� $�1. K. Tano, Continuous Monitoring of Mineral Processes with Special Focus on
Tumbling Mills – A Multivariate Approach, Luleå University of Technology, 2005.
2. P. W. Cleary, R. Morrison and S. Morrell, ‘Comparison of DEM and experiment for a scale model SAG mill’, International Journal of Mineral Processing, 68, 129-165, 2003.


