1 Charge evaporation from nanometer polystyrene aerosols M. Attoui 1 , J. Fernandez-Garcia 2 , J. Cuevas 3 , G. Vidal 3 and J. Fernandez de la Mora 2* 1 University Paris Est Creteil, University Paris-Diderot, LISA, UMR CNRS 7583, France 2 Department of Mechanical Engineering, Yale University, New Haven, CT 06520-8286, USA 3 SEADM, Parque Tecnológico de Boecillo, 205; 47151 Boecillo, Valladolid, Spain. * Corresponding author: PO Box 208286; [email protected]ABSTRACT The charge distribution of polystyrene nanoparticles electrosprayed from l-methyl-2- pyrrolidone (NMP) dimethylammonium formate (10/1 vol.) is studied by a continuous tandem differential mobility analyzer (TDMA) technique. Two DMAs operated in series as narrow band mobility filters are scanned in a quasi-continuous fashion providing highly informative two-dimensional (2D) spectra. The first DMA selects naturally charged particles, which are then partially neutralized by a radioactive source and subsequently analyzed in the second DMA. The mobility pairs found in both DMAs finally yield the charge and size distribution. A 1 mM solution of relatively monodisperse polystyrene with average mass of 34.5 kDa forms polymer aggregates including from 1 to 4 single molecules, leading to discrete particle sizes of 4.7 , 5.95, 6.80 and 7.5 nm in diameter. Observed charge states are unusually low relative to previously studied water-soluble polymers such as polyethylene glycol. Large particles are originally charged in such a fashion as to give an almost constant mobility (in air) of 0.23 cm 2 /V/s, implying a critical electric field for ion evaporation from a polystyrene sphere of some 0.7 V/nm. This is the first measurement of this critical field for nonpolar nanoparticles, and results in a value some three times smaller than those previously measured for polar materials. Keywords: tandem, Differential Mobility Analyzer, nanoparticle, ion evaporation, charge distribution, polymer size distribution 1. INTRODUCTION Nanoparticle studies based on a differential mobility analyzer followed by a mass spectrometer (DMA-MS) produce informative two-dimensional (2D) maps which have revealed unusual transitions. These include: shape changes at critical sizes and charges (Larriba et al. 2012); single molecule evaporation activated by the Kelvin effect, even on presumably involatile materials (Hogan and Fernandez de la Mora 2010); charge loss transitions of apparently stable clusters (Rus et al, 2010), etc. However, these transformations are difficult to study quantitatively by DMA-MS due to uncontrolled heating of the particles by confining radiofrequency fields present in most modern atmospheric pressure ionization mass spectrometers (API-MS). In order to investigate these phenomena with known temperature and residence time during the transit between the two analyzers, we have assembled a tandem DMA (DMA 2 ) system (Rader and McMurry 1986) where (i) the voltages V 1 , V 2 of both DMAs are scanned in an effectively continuous fashion, and (ii) the resolving power is adequate to distinguish between 1 nm clusters whose mobilities differ only by a few percent. This results in 2D maps similarly informative as those previously found in DMA-MS studies, which we hope to exploit in the future in a variety of kinetic studies of nanoparticles. In particular, the direct measurement of the evaporation rate of pre-nucleation clusters versus size
Transcript
1
Charge evaporation from nanometer polystyrene aerosols
M. Attoui1, J. Fernandez-Garcia2, J. Cuevas3, G. Vidal3 and J. Fernandez de la Mora2*
1University Paris Est Creteil, University Paris-Diderot, LISA, UMR CNRS 7583, France 2Department of Mechanical Engineering, Yale University, New Haven, CT 06520-8286, USA
3SEADM, Parque Tecnológico de Boecillo, 205; 47151 Boecillo, Valladolid, Spain. *Corresponding author: PO Box 208286; [email protected]
ABSTRACT
The charge distribution of polystyrene nanoparticles electrosprayed from l-methyl-2-pyrrolidone (NMP) dimethylammonium formate (10/1 vol.) is studied by a continuous tandem differential mobility analyzer (TDMA) technique. Two DMAs operated in series as narrow band mobility filters are scanned in a quasi-continuous fashion providing highly informative two-dimensional (2D) spectra. The first DMA selects naturally charged particles, which are then partially neutralized by a radioactive source and subsequently analyzed in the second DMA. The mobility pairs found in both DMAs finally yield the charge and size distribution. A 1 mM solution of relatively monodisperse polystyrene with average mass of 34.5 kDa forms polymer aggregates including from 1 to 4 single molecules, leading to discrete particle sizes of 4.7 , 5.95, 6.80 and 7.5 nm in diameter. Observed charge states are unusually low relative to previously studied water-soluble polymers such as polyethylene glycol. Large particles are originally charged in such a fashion as to give an almost constant mobility (in air) of 0.23 cm2/V/s, implying a critical electric field for ion evaporation from a polystyrene sphere of some 0.7 V/nm. This is the first measurement of this critical field for nonpolar nanoparticles, and results in a value some three times smaller than those previously measured for polar materials. Keywords: tandem, Differential Mobility Analyzer, nanoparticle, ion evaporation, charge distribution, polymer size distribution
1. INTRODUCTION Nanoparticle studies based on a differential mobility analyzer followed by a mass spectrometer (DMA-MS) produce informative two-dimensional (2D) maps which have revealed unusual transitions. These include: shape changes at critical sizes and charges (Larriba et al. 2012); single molecule evaporation activated by the Kelvin effect, even on presumably involatile materials (Hogan and Fernandez de la Mora 2010); charge loss transitions of apparently stable clusters (Rus et al, 2010), etc. However, these transformations are difficult to study quantitatively by DMA-MS due to uncontrolled heating of the particles by confining radiofrequency fields present in most modern atmospheric pressure ionization mass spectrometers (API-MS). In order to investigate these phenomena with known temperature and residence time during the transit between the two analyzers, we have assembled a tandem DMA (DMA2) system (Rader and McMurry 1986) where (i) the voltages V1, V2 of both DMAs are scanned in an effectively continuous fashion, and (ii) the resolving power is adequate to distinguish between 1 nm clusters whose mobilities differ only by a few percent. This results in 2D maps similarly informative as those previously found in DMA-MS studies, which we hope to exploit in the future in a variety of kinetic studies of nanoparticles. In particular, the direct measurement of the evaporation rate of pre-nucleation clusters versus size
2
would be of great interest in nucleation. In the present first article of that planned series, we introduce the method, and explore its limitations by applying it to the determination of charge distributions of monodisperse polymer nanoparticles formed by electrospray. Earlier tandem DMA studies of aerosol charge distributions are available among others from Wild et al. (2012) and Kim et al. (2005). Our choice of polystyrene as a prototypical example of nonpolar polymer yields surprisingly low charge levels, which appear to be associated to the lack of specific bonding sites on the neutral polymer chain where free ions in the electrospray solvent could be tied. Highly monodisperse aerosols of polystyrene nanoparticles have been previously produced by electrospraying solutions (rather than suspensions) of commercially available polystyrene molecules with relatively narrow mass distributions (Ku et al. 2004; Ude et al. 2006). These studies relied on the GEMMA technique introduced by Kaufman and colleagues, where the original spray was charge-reduced to produce primarily singly charged particles (Kaufman et al. 1996). Therefore, the original charge state of these particles was not known. More recently, we have seen indications that the original charge state of electrosprayed polystyrene chains is much smaller than typically found in other industrial and biological polymers similarly sprayed from solutions of more polar solvents (water, methanol). For instance, polyethylene glycol chains acquire mass over charge ratios typically as small as 500 Da (Wong et al. 1988; Nohmi and Fenn, 1992), while polystyrene particles with mass m= 9,000 Da typically obtain only one charge (Fernandez de la Mora, 2011a). This vast difference in charging level is puzzling and deserves a more detailed scrutiny. On the practical side, multiple charging complicates the interpretation of mobility or m/z measurements in terms of particle mass or size. If the mass m (or mobility Z) were narrowly distributed, the multiple peaks would all be in a readily interpretable m/z sequence, as is the case with electrosprayed proteins (Fenn et al. 1989). However, multiple charging combined with multiple masses (as in the case of complex protein mixtures or simple polydisperse industrial polymers) leads to spectral congestion, the eventual inability to recognize individual ion peaks, and therefore the impossibility to identify m/z sequences corresponding to one m and various z. Finally, a charging level above a critical value (related to the Rayleigh limit of a charged drop) leads to loss of globular shape, which complicates drastically the task of relating a measured mobility to a particle radius or mass. This multifaceted multiple charging difficulty may be overcome via Kaufman’s GEMMA approach (Kaufman et al. 1996), but charge-reduction introduces complications of its own, as well as loses most information on the initial charge. At any rate, knowledge of the charge level of a polymer ion as a function of its mass is essential to assess the spectral complexity, the ion shape, and whether or not charge reduction is necessary. From the basic point of view, the study of the charging level of various materials, polar and nonpolar, provides valuable information both on the particular material as well as about nanoparticles in general. The ability of a short chain to hold substantial charge is simply related to the presence of polarizable groups on the chain able to bind to an anion or a cation. As the chain becomes larger and able to form globular particles, another possible charging mechanism not dependent on the existence of polarizable groups is to trap one or several free anions or cations in its interior or its surface. As this globule grows in size, a bulk behavior must eventually be reached where one would expect its ability to hold charge to depend only on the electric field on the particle surface. The critical value E* of this field for ion evaporation has been measured for a variety of polar materials, and is of the order of 2 V/nm for water and organic liquids (Iribarne and Thomson, 1976, Loscertales and Fernandez de la Mora, 1995). No comparable measurements are available for nonpolar substances because they are hard to electrospray. The reasons for this difficulty are of a general but not completely fixed nature, which therefore admits exceptions. The point is that a good electrospray able to atomize a solute into very small pieces (even single molecules) must produce very small initial drops. This in turn demands using relatively conducting solvents able to dissolve volatile salts, whence such solvents need to be relatively polar. A first difficulty then lies in identifying polar solvents that are at the same time capable of dissolving nonpolar materials, and therefore form charged particles of low dielectric constant. A second difficulty is to identify a volatile salt able to impart a high conductivity to the moderately polar solvent, which at the same time will not lead to precipitation of the nonpolar solute. We have in the past identified one such
3
combination in the moderately polar solvent l-methyl-2-pyrrolidone (NMP), the volatile salt dimethylammonium formate (DMAF), and the nonpolar polymer polystyrene (Psty). Here we exploit this system to study electrospray charging of non-polar particles of nanometer dimensions. 2. EXPERIMENTAL A considerable improvement of the present work with respect to Ude et al. (2006) has resulted from the commercial availability of l-methyl-2-pyrrolidone (NMP) with relatively high purity (HPLC grade, Alfa Aesar, 38986). Dimethylammonium formate was a special order from Bioniqs (UK). It can alternatively be synthesized by neutralizing dimethylamine with formic acid (Warning: the reaction is violent and requires special precautions). The polystyrene sample used, denoted Psty-34.5 k, is the same of Ude et al. (2006), which was kindly provided by Dr. Daniel Saucy, then at Rohm and Haas. Its mean molecular weight is 34,500 Da. Analysis of this sample by a method identical to that reported by Ude et al. (2006) showed that its original narrow mass distribution had not degraded.
Figure 1: Schematic of the experimental setup for the tandem DMA with charge reduction between both DMAs and electrical detection. The classified particles exit through the DMA axis. A schematic of the experimental apparatus is given in Figure 1. The two nano-DMAs involved were of the Half-Mini type (Fernandez de la Mora 2011b, Fernandez de la Mora 2012). The analyzing region of both DMAs is an annulus with inner and outer radii of 4 mm and 6 mm, respectively. Its length is 4 mm in the first DMA (DMA1). It is increased to 20 mm on the second DMA (DMA2) in order to enable analysis of charge-reduced particles having relatively small electrical mobilities. Charge reduction was achieved by inserting a Ni tube internally coated with Ni63 (10 mCi) in the tube going from the sample outlet line of DMA1 to the sample inlet line of DMA2. The radioactive source was a gift from Prof. M. Gamero of UCI and the company NanoEngineering, and was originally manufactured by Eckert & Ziegler. The bipolar plasma created by the beta radiation from the Ni63 then reduces the charge state of the particles passing through it. In this arrangement the first DMA analyzes the particles in their natural charge state, as electrosprayed, and the second DMA analyzes them again after charge reduction. DMAF/NMP (1/10 vol.) was electrosprayed from the sharpened tip of a 20 µm ID silica capillary at a liquid flow rate close to the minimal value at which a steady Taylor cone-jet could be stabilized. The salt concentration used is ten times higher than that of Ude et al. (2006). This produces sprays of much smaller initial drop sizes than in the 2006 study, yet reduces only moderately the solubility of the polymer with respect to its value in pure NMP. The high voltage required for electrospraying was applied into an electrode immersed in the solution reservoir. High Psty concentrations between 0.1 mM and 1mM were used to promote the formation of aggregates of several Psty 34.5 kDa chains, so as to provide particles of more than one size.
HEPA Filter
Blower
Cooler
FCE
Ni-63
Hepa Filter
Blower
Throttle valve
Electrospray source DMA1
DMA2
Throttle valve
4
The computer control program used was developed at SEADM by J. Cuevas and G. Vidal. It is a variant of another program they have previously used to control a pair of remarkable instruments achieving steady mobility separation by means of time dependent electric fields (Vidal-de-Miguel 2010). The software scans the voltages V1, V2 applied to the two DMAs over a 2-dimensional (2D) rectangular grid and measures the corresponding nanoparticle current I exiting the second DMA. The Faraday cage electrometer used is commercialized by SEADM. It converts current into voltage with two amplifiers, the first with a trans-impedance of 1011 Ohm. The second magnifies the voltage by one hundredfold. Its overall response time is of the order of 1 s. The resulting 3D data set (V1, V2, I) is stored as a single file and can be represented via 2D graphics. Stability in the parameters of the DMA is important for our relatively long (~1 hour) experiments. For single DMA work we have in the past varied the sheath gas flow without active control by powering the pump through a variable voltage transformer connected directly to a 110 Vac wall electrical power outlet. Unfortunately, the voltage output at Yale’s Mason Laboratory is not sufficiently stable for the current application. The pump driving the sheath gas flow of DMA2 in closed loop was therefore controlled by an active stabilization circuit based on keeping the rotation speed close to an externally set value. This circuit is identical to the one used in our DMA-MS facility (http://www.eng.yale.edu/DMAMSfacility/), and was kindly provided by its commercial manufacturer SEADM. Having only one such variable speed controller available, the pump driving DMA1 in open circuit was based on a universal motor driven by the fixed DC current output of a stabilized power supply. Because the rotation speed of this first pump was fixed, the sheath gas flow rate of DMA1 was varied with a throttle valve interposed between the sheath flow outlet and the atmosphere. In order to permit classification of the relatively large (up to 8 nm) particles analyzed, the present experiments used sheath gas flow rates unusually low for our DMAs. In order to attain such low flow rates in DMA2, the closed circuit included also a throttle valve.
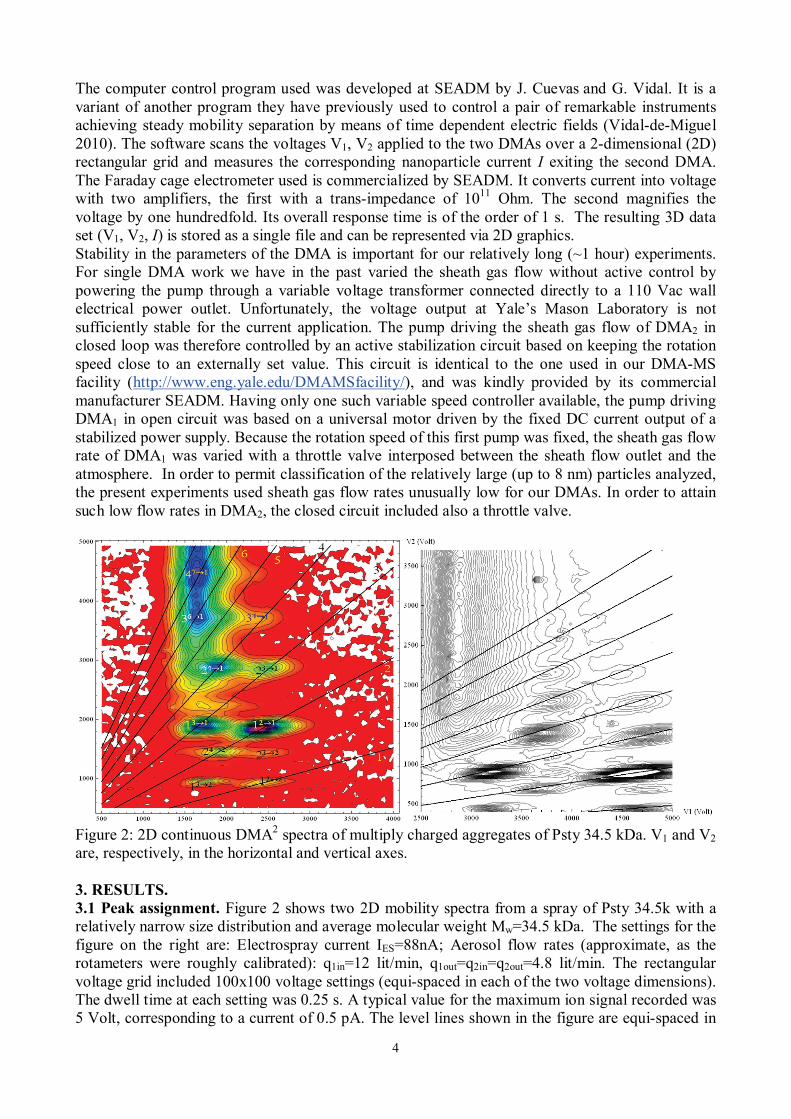
Figure 2: 2D continuous DMA2 spectra of multiply charged aggregates of Psty 34.5 kDa. V1 and V2 are, respectively, in the horizontal and vertical axes. 3. RESULTS. 3.1 Peak assignment. Figure 2 shows two 2D mobility spectra from a spray of Psty 34.5k with a relatively narrow size distribution and average molecular weight Mw=34.5 kDa. The settings for the figure on the right are: Electrospray current IES=88nA; Aerosol flow rates (approximate, as the rotameters were roughly calibrated): q1in=12 lit/min, q1out=q2in=q2out=4.8 lit/min. The rectangular voltage grid included 100x100 voltage settings (equi-spaced in each of the two voltage dimensions). The dwell time at each setting was 0.25 s. A typical value for the maximum ion signal recorded was 5 Volt, corresponding to a current of 0.5 pA. The level lines shown in the figure are equi-spaced in
5
the detector current. The line labelled 1 in the left figure corresponds to particles having the same mobility (same charge state) on both DMAs. Its slope will be denoted by k. Lines labelled 2, 3, .. have slopes 2k, 3k,... The determination of k should ideally have been based on absolute mobility calibrations giving the pair of constant products ZV1=C1, ZV2=C2. (1) Then, for a fixed mobility Z (i.e., for a particle unstransformed between both DMAs),
kCC
VV
==1
2
1
2 . (2)
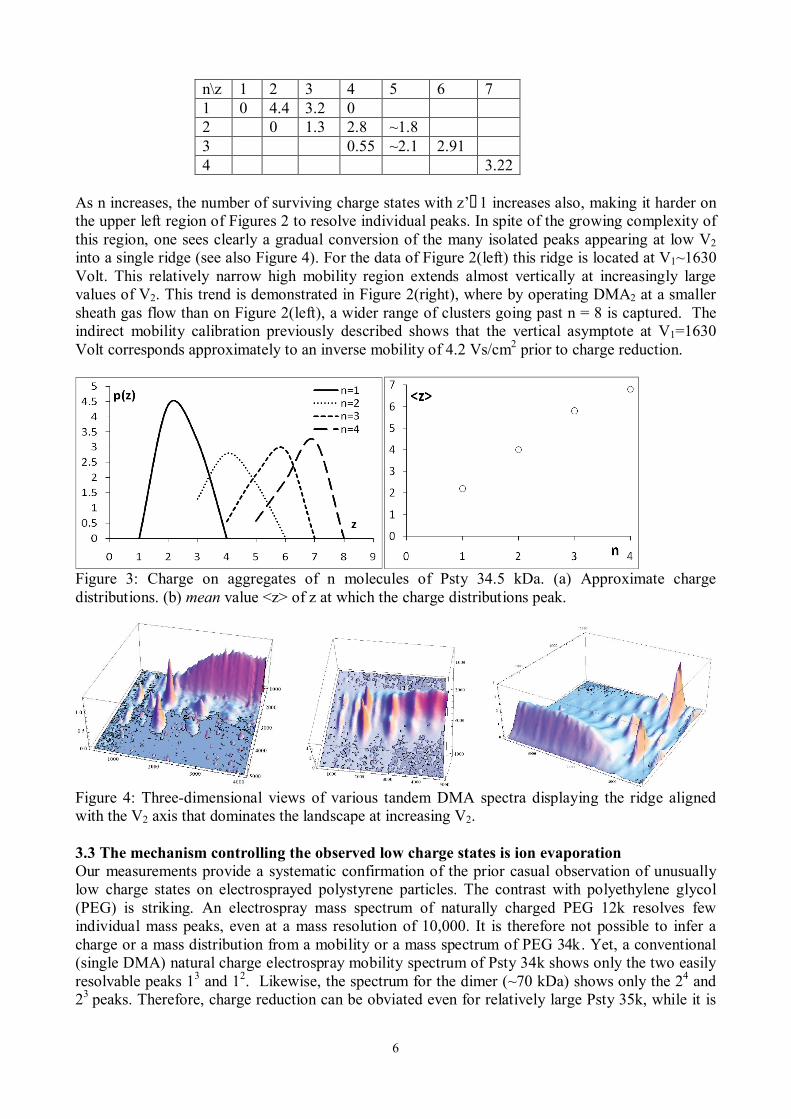
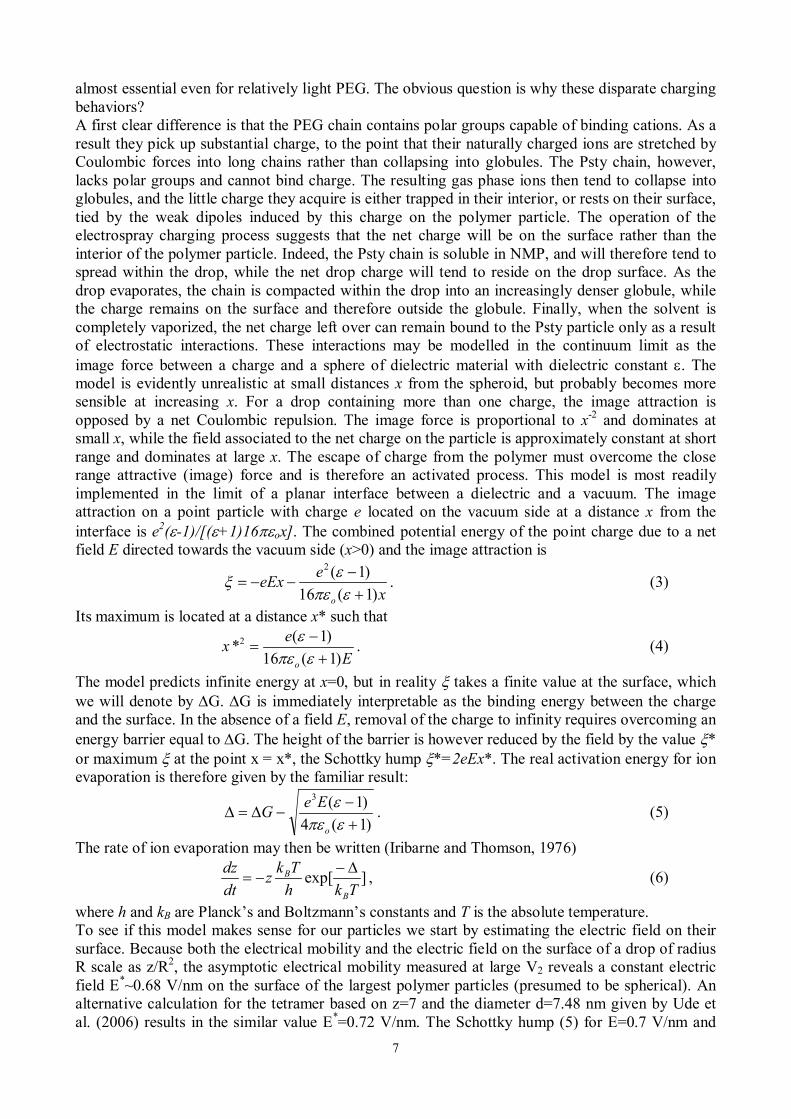
Evidently, the calibration constants Ci and their ratio k vary with the flow rate of sheath gas passed through either DMA, which we change from one experiment to the other to achieve a desired range of mobilities. In the present study we have used the mobilities at the maxima of the various peaks observed as mobility standards, based on the mobilities previously reported by Ude et al. (2006). This procedure requires an unambiguous assignment of the various peaks seen in Figure 2. For brevity, an aggregate of n chains (n-mer) of Psty 34.5 kDa having passed with z and z’ charges through DMA1 and DMA2, respectively, is labelled nz→z’. Assuming that an n-mer with z charges has a mobility z times that of the singly charged particle, the various peaks should lie over lines of slope k(z/z’). Also, because the charge reduction process is relatively efficient, the most abundant peaks correspond to z’=1, so that peaks nz→1 of given n ought to fall on horizontal lines whose ordinate gives the (known) mobility of the singly charged n-mer. The value of k was indirectly inferred from Figures 2 such that the lines of slope k(z/z’) go as accurately as possible through the maximum of all the peaks. The fact that essentially all these maxima are aligned both along horizontal lines and along lines of slope k(z/z’) provides strong confidence on the peak assignment given in Figure 2(left). There is however an anomaly worthy of note. The distribution of masses of our Psty sample is narrow, but has a finite spread. Looking at the peak labelled 12→2 in Figure 2(left), one can indeed see that it is considerably wider in one direction than in the other. Ideally, given a pair of DMAs of very high resolving power, one would expect to see a finite number of separate peaks ordered along the line V2=k(z/z’)V1. The relative change in mass between two neighboring oligomers is however too small (~100/34500~0.3%) to be resolvable by our DMAs, so one would rather expect a single peak oriented along a line of slope zk/z’, with a relatively long extension along that line (given by the finite mass distribution of the sample), and an additional width in both the horizontal and the vertical directions given by the finite resolution of both DMAs. The data of figure 2 show indeed the expected elongated peak structure with a finite positive slope. The experimental slope, however, is clearly smaller than the expected k(z/z’). We attribute most of the anomaly to the artificial loss of resolution in DMA1 resulting from the slow response of the electrometer and the insufficient time devoted to collect current at each voltage setting. This problem affects only the horizontal axis because V2 varies only at the end of the scan of V1, and remains fixed during each scan of V1. Figure 2(right) corresponds to an experiments carried out at higher resolving power with the same Psty sample, where the long axes of the approximately ellipsoidal peaks approach more closely (though still imperfectly) the expected k(z/z’) slopes. Possible remedies for this non-ideality will be discussed in section 4. 3.2 Charge distribution. The peak assignment just described enables a preliminary determination of the charge distribution for the various n-mers of Psty 34.5k. The monomer, dimer, trimer and tetramer carry primarily 2, 4, 6 and 7 charges, respectively. Approximate abundances are quantified in Table 1 and Figure 3(left) through the height of the peaks (see Wild et al., 2012, and Kim et al., 2005, for a more accurate quantification). Some of these peaks are not fully resolved, as indicated by a ~ sign in the Table. The figures are therefore intended only to give a rather cursory idea of the width of the distributions. The mean value <z> at which the charge distributions peak is nonetheless well defined, and is shown in Figure 3(right). Table 1: Approximate heights of the various peaks of Figure 2
As n increases, the number of surviving charge states with z’�1 increases also, making it harder on the upper left region of Figures 2 to resolve individual peaks. In spite of the growing complexity of this region, one sees clearly a gradual conversion of the many isolated peaks appearing at low V2 into a single ridge (see also Figure 4). For the data of Figure 2(left) this ridge is located at V1~1630 Volt. This relatively narrow high mobility region extends almost vertically at increasingly large values of V2. This trend is demonstrated in Figure 2(right), where by operating DMA2 at a smaller sheath gas flow than on Figure 2(left), a wider range of clusters going past n = 8 is captured. The indirect mobility calibration previously described shows that the vertical asymptote at V1=1630 Volt corresponds approximately to an inverse mobility of 4.2 Vs/cm2 prior to charge reduction.
Figure 3: Charge on aggregates of n molecules of Psty 34.5 kDa. (a) Approximate charge distributions. (b) mean value <z> of z at which the charge distributions peak.
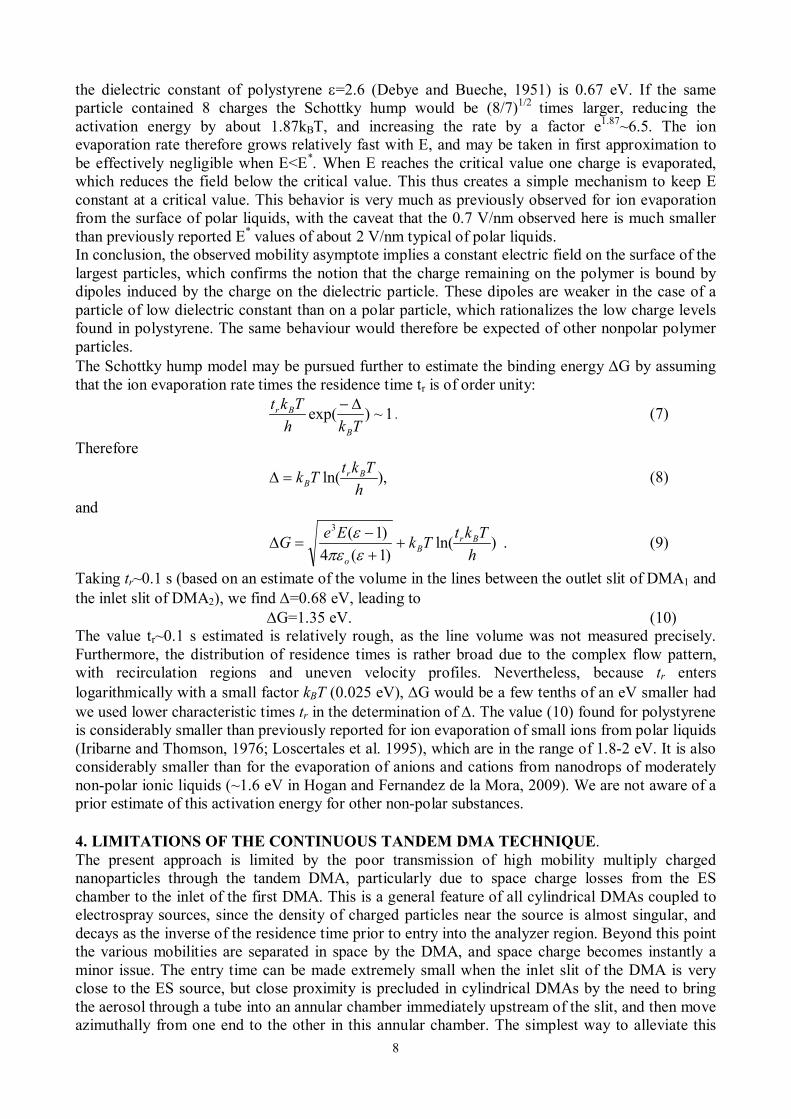
Figure 4: Three-dimensional views of various tandem DMA spectra displaying the ridge aligned with the V2 axis that dominates the landscape at increasing V2. 3.3 The mechanism controlling the observed low charge states is ion evaporation Our measurements provide a systematic confirmation of the prior casual observation of unusually low charge states on electrosprayed polystyrene particles. The contrast with polyethylene glycol (PEG) is striking. An electrospray mass spectrum of naturally charged PEG 12k resolves few individual mass peaks, even at a mass resolution of 10,000. It is therefore not possible to infer a charge or a mass distribution from a mobility or a mass spectrum of PEG 34k. Yet, a conventional (single DMA) natural charge electrospray mobility spectrum of Psty 34k shows only the two easily resolvable peaks 13 and 12. Likewise, the spectrum for the dimer (~70 kDa) shows only the 24 and 23 peaks. Therefore, charge reduction can be obviated even for relatively large Psty 35k, while it is
7
almost essential even for relatively light PEG. The obvious question is why these disparate charging behaviors? A first clear difference is that the PEG chain contains polar groups capable of binding cations. As a result they pick up substantial charge, to the point that their naturally charged ions are stretched by Coulombic forces into long chains rather than collapsing into globules. The Psty chain, however, lacks polar groups and cannot bind charge. The resulting gas phase ions then tend to collapse into globules, and the little charge they acquire is either trapped in their interior, or rests on their surface, tied by the weak dipoles induced by this charge on the polymer particle. The operation of the electrospray charging process suggests that the net charge will be on the surface rather than the interior of the polymer particle. Indeed, the Psty chain is soluble in NMP, and will therefore tend to spread within the drop, while the net drop charge will tend to reside on the drop surface. As the drop evaporates, the chain is compacted within the drop into an increasingly denser globule, while the charge remains on the surface and therefore outside the globule. Finally, when the solvent is completely vaporized, the net charge left over can remain bound to the Psty particle only as a result of electrostatic interactions. These interactions may be modelled in the continuum limit as the image force between a charge and a sphere of dielectric material with dielectric constant ε. The model is evidently unrealistic at small distances x from the spheroid, but probably becomes more sensible at increasing x. For a drop containing more than one charge, the image attraction is opposed by a net Coulombic repulsion. The image force is proportional to x-2 and dominates at small x, while the field associated to the net charge on the particle is approximately constant at short range and dominates at large x. The escape of charge from the polymer must overcome the close range attractive (image) force and is therefore an activated process. This model is most readily implemented in the limit of a planar interface between a dielectric and a vacuum. The image attraction on a point particle with charge e located on the vacuum side at a distance x from the interface is e2(ε-1)/[(ε+1)16πεox]. The combined potential energy of the point charge due to a net field E directed towards the vacuum side (x>0) and the image attraction is
x
eeExo )1(16
)1(2
+−
−−=επε
εξ . (3)
Its maximum is located at a distance x* such that
E
exo )1(16
)1(*2
+−
=επε
ε . (4)
The model predicts infinite energy at x=0, but in reality ξ takes a finite value at the surface, which we will denote by ∆G. ∆G is immediately interpretable as the binding energy between the charge and the surface. In the absence of a field E, removal of the charge to infinity requires overcoming an energy barrier equal to ∆G. The height of the barrier is however reduced by the field by the value ξ* or maximum ξ at the point x = x*, the Schottky hump ξ*=2eEx*. The real activation energy for ion evaporation is therefore given by the familiar result:
)1(4
)1(3
+−
−∆=∆επεε
o
EeG . (5)
The rate of ion evaporation may then be written (Iribarne and Thomson, 1976)
]exp[Tkh
Tkzdtdz
B
B ∆−−= , (6)
where h and kB are Planck’s and Boltzmann’s constants and T is the absolute temperature. To see if this model makes sense for our particles we start by estimating the electric field on their surface. Because both the electrical mobility and the electric field on the surface of a drop of radius R scale as z/R2, the asymptotic electrical mobility measured at large V2 reveals a constant electric field E*~0.68 V/nm on the surface of the largest polymer particles (presumed to be spherical). An alternative calculation for the tetramer based on z=7 and the diameter d=7.48 nm given by Ude et al. (2006) results in the similar value E*=0.72 V/nm. The Schottky hump (5) for E=0.7 V/nm and
8
the dielectric constant of polystyrene ε=2.6 (Debye and Bueche, 1951) is 0.67 eV. If the same particle contained 8 charges the Schottky hump would be (8/7)1/2 times larger, reducing the activation energy by about 1.87kBT, and increasing the rate by a factor e1.87~6.5. The ion evaporation rate therefore grows relatively fast with E, and may be taken in first approximation to be effectively negligible when E<E*. When E reaches the critical value one charge is evaporated, which reduces the field below the critical value. This thus creates a simple mechanism to keep E constant at a critical value. This behavior is very much as previously observed for ion evaporation from the surface of polar liquids, with the caveat that the 0.7 V/nm observed here is much smaller than previously reported E* values of about 2 V/nm typical of polar liquids. In conclusion, the observed mobility asymptote implies a constant electric field on the surface of the largest particles, which confirms the notion that the charge remaining on the polymer is bound by dipoles induced by the charge on the dielectric particle. These dipoles are weaker in the case of a particle of low dielectric constant than on a polar particle, which rationalizes the low charge levels found in polystyrene. The same behaviour would therefore be expected of other nonpolar polymer particles. The Schottky hump model may be pursued further to estimate the binding energy ∆G by assuming that the ion evaporation rate times the residence time tr is of order unity:
1~)exp(Tkh
TktB
Br ∆−. (7)
Therefore
),ln(h
TktTk BrB=∆ (8)
and
)ln()1(4)1(3
hTktTkEeG Br
Bo
++−
=∆επεε . (9)
Taking tr~0.1 s (based on an estimate of the volume in the lines between the outlet slit of DMA1 and the inlet slit of DMA2), we find ∆=0.68 eV, leading to ∆G=1.35 eV. (10) The value tr~0.1 s estimated is relatively rough, as the line volume was not measured precisely. Furthermore, the distribution of residence times is rather broad due to the complex flow pattern, with recirculation regions and uneven velocity profiles. Nevertheless, because tr enters logarithmically with a small factor kBT (0.025 eV), ∆G would be a few tenths of an eV smaller had we used lower characteristic times tr in the determination of ∆. The value (10) found for polystyrene is considerably smaller than previously reported for ion evaporation of small ions from polar liquids (Iribarne and Thomson, 1976; Loscertales et al. 1995), which are in the range of 1.8-2 eV. It is also considerably smaller than for the evaporation of anions and cations from nanodrops of moderately non-polar ionic liquids (~1.6 eV in Hogan and Fernandez de la Mora, 2009). We are not aware of a prior estimate of this activation energy for other non-polar substances. 4. LIMITATIONS OF THE CONTINUOUS TANDEM DMA TECHNIQUE. The present approach is limited by the poor transmission of high mobility multiply charged nanoparticles through the tandem DMA, particularly due to space charge losses from the ES chamber to the inlet of the first DMA. This is a general feature of all cylindrical DMAs coupled to electrospray sources, since the density of charged particles near the source is almost singular, and decays as the inverse of the residence time prior to entry into the analyzer region. Beyond this point the various mobilities are separated in space by the DMA, and space charge becomes instantly a minor issue. The entry time can be made extremely small when the inlet slit of the DMA is very close to the ES source, but close proximity is precluded in cylindrical DMAs by the need to bring the aerosol through a tube into an annular chamber immediately upstream of the slit, and then move azimuthally from one end to the other in this annular chamber. The simplest way to alleviate this
9
problem, and the one used in this work, is by increasing the sample flow rate qi1 into DMA1. We have therefore used relatively large qi1 values of several lit/min. Even so, the transmission is relatively small, whence the flow rate qo1 of monodisperse aerosol leaving the first DMA needs also to be relatively large. But the charge reduction effectiveness of the Ni63 source begins to suffer at flows qo1 in excess of 1 lit/min, so this approach results in the incomplete elimination of doubly charged particles from DMA2. The survival of multiply charged particles is clear in the two lowest pairs of ions in Figure 2(left). Its role in clouding the interpretation of the data is particularly important for the larger aggregates, which require more time for adequate charge reduction (Fernandez de la Mora et al. 2006), and whose many surviving multiply charged peaks crowd together more closely at increasing n and z’. The large sample flow rates used also limit either the size range or the resolving power of the DMAs. Another serious limitation associated to a quasi-continuous two dimensional scan is the long period required to acquire a spectrum, containing typically 104 points. In view of the small transmission of particles through both DMAs, we need not only relatively high flow rates, but also a relatively high amplification on the electrometer, which leads to a ~1s response time. The limited transmission has therefore negative impact on almost every important aspect of the measurement, including DMA resolution, quality of charge reduction and acquisition time. One obvious remedy to overcome these limitations is to greatly increase the transmission of ES ions into the inlet slit of the first DMA. This is very much the same problem we have previously encountered in DMA-MS work (Fernandez de la Mora et al, 2005), which had no satisfactory solution until the relatively recent development of planar DMAs (Rus et al, 2010). Hopefully, use of a planar DMA as the first instrument in the tandem system will alleviate these difficulties sufficiently to enable faster measurements as well as better charge reduction and higher resolving power. 5. CONCLUSIONS We have assembled in tandem a pair of DMAs having relatively large resolving powers with ~1 nm particles. By scanning the two DMA voltages over a closely spaced two dimensional grid (V1i, V2j) and measuring the matrix Iij of transmitted current, the system provides highly informative quasi-continuous two-dimensional mobility spectra. The arrangement is tested with monodisperse polystyrene particles formed by electrospraying a concentrated solution of Psty-34.5k. This results in approximately spherical multiply charged (z=1-7) Psty particles formed by n (=1-4) Psty-34.5k molecules. The charging levels found reveal that the electric field E on the surface of the particles is limited by field evaporation at a critical value E*, very much as in the case previously studied of more polar particles. However, the critical field of 0.7 V/nm found for dimethylammonium ions from polystyrene is much lower than those previously measured. The inferred activation energy ∆G~1.35 Volt for ion evaporation from a polystyrene surface is also unusually small. A number of fairly restrictive limitations associated to the technique result from the poor transmission of charged particles from the electrospray source to the entrance slit of the first DMA. Acknowledgments: We are grateful to Prof. M. Gamero of U.C. Irvine and to Mr. Jerome J. Schmitt of NanoEngineering for the gift of the Ni63 source used for charge reduction. Also to Gonzalo Fernandez de la Mora of SEAM for the gift of the electrometer and the pump stabilization circuit for the closed circuit of DMA2.
References Debye, P. and Bueche, F. (1951); The dielectric constant of polystyrene solutions, J. Phys. Chem.,
55 (2), pp 235–238 Fenn, J.B., Mann, M., Meng, C.K., Wong, S.F., Whitehouse, C.M. (1989) Electrospray ionization
for mass spectrometry of large biomolecules, Science, 246(4926), 64-71
10
Fernandez de la Mora, J., Thomson, B. and Gamero-Castaño, M. (2005) Tandem mobility mass spectrometry study of electrosprayed Heptyl4N+Br- clusters, J. Am. Soc. Mass Spectrom., 16 (5): 717-732
Fernandez de la Mora, J. (2011a) The differential mobility analyzer (DMA): Adding a true mobility dimension to a preexisting API-MS, in Ion Mobility Spectrometry - Mass Spectrometry: Theory and Applications, C. Wilkins and S. Trimpin editors, CRC Press.
Fernandez de la Mora, J. (2011b) pp. 697-721 in Aerosol Measurement; P. Kulkarni, P.A. Baron, K. Willeke editors, John Wiley & Sons, Inc.
Fernandez de la Mora, J., Kozlowski, J. (2012) A hand-held differential mobility analyzer of high resolution for 1-30 nm particles, submitted to J. Aerosol Sci, 14/Aug/2012
Fernández de la Mora, J., Ude, S., Thomson, B. A., The potential of Differential Mobility Analysis coupled to mass spectrometry for the study of very large singly and multiply charged proteins and protein complexes in the gas phase, Biotechnology Journal, 2006, 1, 988–997
Hogan, C.J. Jr. & Fernández de la Mora, J.: (2009) Tandem Ion Mobility-Mass Spectrometry (IMS-MS) Study of Ion Evaporation from Ionic Liquid-Acetonitrile Nanodrops; Phys. Chem. Chem. Phys., 11, 8079-8090.
Hogan, C. J., Fernández de la Mora, J. (2010): Ion-Pair Evaporation from Ionic Liquid clusters, J. Am. Soc. Mass Spectrom. 21, 1382-1386
Iribarne, J.V. and B. Thomson, B.A.: (1976) On the evaporation of small ions from charged droplets, J. Chem. Phys. 64, 2287.
Kaufman, S.L., Skogen, J.W., Dorman F.D., Zarrin, F. and Lewis, L.C.: (1996), Macromolecule analysis based on electrophoretic mobility in air: Globular proteins, Anal. Chem., 68, 1895-1904; corrections in Anal. Chem. 68 3703-3703
Kim, S.H., Woo, K.S., Liu, B.Y.H., Zachariah, M.R. (2005), Method of measuring charge distribution of nanosized aerosols, Journal of Colloid and Interface Science 282, 46–5
Ku, B-K, J. Fernandez de la Mora, J., Saucy, D.A. and Alexander, J.N. IV, (2004): Mass distribution measurement of water-insoluble polymers by charge-reduced electrospray mobility analysis, Analytical Chemistry, 76, 814-822, 2004
Larriba-Andaluz, C., and Fernandez de la Mora, J. (2012): Gas Phase Structure of Coulombically Stretched Polyethylene Glycol Ions., J. Phys. Chem. B, 116, 593-598.
Loscertales, I.G. and Fernández de la Mora, J. (1995): Experiments on the kinetics of field-evaporation of small ions from droplets; J. Chem. Phys., 103, 5041-5060.
Nohmi, T. and Fenn, J.B. (1992): Electrospray Mass Spectrometry of Poly(ethy1ene glycols) with Molecular Weights up to Five Million, J. Am. Chem. Soc. , 114, 3241-3246
Rader, D.J., McMurry P.H. (1986), Application of the tandem differential mobility analyzer to studies of droplet growth or evaporation, J. Aerosol Sci. 17(5) 771-787 Rus, J., Moro, D., Sillero, J., Royuela, J., Casado, A., Fernández de la Mora, J. (2010): IMS-MS
studies based on coupling a Differential Mobility Analyzer (DMA) to commercial API-MS systems, Int. J. Mass Spectrom, 298, 30-40
Ude, S., Fernandez de la Mora, J., Alexander IV, J.N., Saucy, D.A. (2006): Aerosol size standards in the nanometer size range: II, Narrow size distributions of polystyrene 3-11 nm in diameter, J. Colloid and Interface Sci., 293, 384–393.
Vidal-de-Miguel, G. (2010), Method and apparatus to produce steady beams of mobility selected ions via time-dependent electric fields, US patent application publication 20100243883.
Wild, M., Meyer, J., Kasper, G. (2012), A fast and accurate method of using electrical mobility scans for the direct measurement of aerosol charge distributions, J. Aerosol Sci. 52, 69-79
Wong, S.F., Meng, C.K. and Fenn, J.B. (1988): Multiple Charging in Electrospray Ionization of Poly(ethylene glycols), J. Phys. Chem. , 92, 546-550