160
Chariho Regional School District Mathematics Curriculum Grades K-12 November 10, 2009
Chariho Regional School District
Mathematics CurriculumGrades K-12
November 10, 2009
Chariho Regional School DistrictMathematics Curriculum
Grades K-12

Table of Contents
Section One PageTask Force Membership 2Epistemological Foundations 3Introduction 4District Vision, Mission, and Beliefs 5
Section TwoReport on Knowledge Base for Mathematics 6Hallmarks of Excellence for Mathematics 7Statement of Educational Goals for Mathematics 8Content/Process Standards for Mathematics 9
Section ThreeMathematics Content Standards by Grade (K-8) 15Mathematics Content Standards by Course (9-12) 61
Section FourEducator to Educator: Annual Plan for K-8 Mathematics Instruction
92
Educator to Educator: Sequence of Material Using Appropriate Text for High School Courses
97
Section FiveReferences 151
Mathematics Task ForceMembership
Susan Allen1
Christine AustinDavid Caplette
Christina CrowleyPamela Hawkins
Shawn MartinRobert Mayne
Kristina SparfvenElizabeth Simone
Jacqueline VetrovecDeborah Zonfrilli
2
Epistemological Foundations
The Chariho Regional School District believes that students learn best when they are actively engaged in and personally responsible for the learning process. Students need a safe and positive environment in which to talk purposefully about learning, to experience learning, and to observe learning. Learning is enhanced when students have an interest in and choice about what they learn. Students should be engaged in meaningful learning experiences that match their developmental status. New learning builds on previous knowledge through a process that is challenging and rigorous. That process must encourage students to problem-solve and to think originally, critically, and creatively. Thinking and problem-solving are closely linked to a demanding core of content knowledge. Learning is most quickly assimilated when connected to student goals, when students evaluate their own work and learning habits, and when instruction appeals to a variety of learning modalities and talents. In an environment of high expectations, sustained and directed student effort and expert teaching practices determine the extent of learning. Our schools and district will organize to encourage and support both.
4
Introduction
The Chariho K-12 Mathematics Curriculum is being developed so that instruction offered is aligned with national mathematics standards. The new curriculum will provide students with the highest quality and most comprehensive mathematical understandings possible so that they will be afforded a wide variety of career and educational options. The curriculum will also provide an overview for new and veteran teachers.
5
District MissionThe Chariho Regional School District ensures that all students meet high academic standards and are prepared for lifelong learning and productive global citizenship.
District VisionWith a commitment to continuous improvement, the District’s highly-qualified staff engages with students in state-of-the-art facilities to master challenging content, to promote creativity, and to foster critical thinking. The District is recognized by the community as its greatest asset.
District BeliefsWe believe that high academic standards and research informed decision making are critical…
All students can learn and meet or exceed rigorous standards. All students at every level must be engaged in rigorous and challenging academic experiences. Rigorous academic standards are the foundation of this school district. Instructional and program decisions must be data-informed and research-based. Learning is a continuous lifelong process. Schools must prepare students to be creative and critical thinkers, problem solvers, and effective
communicators. The physical, social, and emotional wellness of every child is necessary for optimum learning.
We believe that the larger community must be fully engaged in the learning process…
Education is a shared responsibility of students, parents, staff, and the community. Students thrive when supported, nurtured, and engaged by the community. In an environment that emphasizes school safety, everyone must be treated with kindness, dignity, and
respect. Schools must prepare students to be team members and leaders, community contributors, and productive
citizens in a global society.
6
Report on Knowledge Basefor
Mathematics Education
Mathematics education at all levels must be rigorous and balanced among an emphasis on basic skills, concepts, and problem solving. A variety of student approaches and strategies must be encouraged and developed. Mathematics classrooms should be student centered; students should complete relevant hands-on projects both individually and in collaboration with others. At the same time, teachers should provide direct instruction and demonstrate problem-solving techniques. Students of mathematics need to work hard, persevere, and be responsible. Students must be well versed in the use of technology to solve complex mathematical tasks. In classroom discourse, attention must be paid to the oral and written language of mathematics.
Hallmarks of Excellencefor
7

Mathematics
Desirable Features of the Curriculum
MORE LESS Self-directed and hands-on learning Multiple application of skills Connection to career and educational goals Use of the language of mathematics Connection of topics within math Depth of understanding of process Use of multiple assessment techniques Use of inquiry strategies Use of technology to enhance mathematical
understanding Explanation of mathematical thinking Collaborative learning
Dependency on teacher direction Singular application of skills Isolation of concepts Incorrect mathematical language Isolation of topics Dependency on calculator for basic skills Tests with one dimensional format
8

Statement of Educational Goalsfor
Mathematics
Graduates of Chariho High School will be proficient in mathematical skills and, using a logically ordered thought process, will be able to apply those skills to complex problem-solving situations. Our graduates will be able to effectively communicate using the language of mathematics. They will utilize technology in appropriate ways to communicate and problem-solve.
9

Content/Process Standards for Mathematics
CONTENT STANDARDS
The Number and Operations StandardStudents will understand numbers, ways of representing numbers, relationships among numbers, and number systems.
(Algebra I, Algebra II, Pre-calculus, Statistics and Probability)Students will understand meanings of operations and how they relate to one another.
(Algebra I, Algebra II, Pre-calculus, Statistics and Probabilit)Students will compute fluently and make reasonable estimates.
(Algebra I, Algebra II, Pre-calculus, Statistics and Probability)Students will carry out counting procedures.
(Statistics and Probability)
The Algebra StandardStudents will understand patterns, relations, and functions.
(Algebra I, Algebra II, Geometry, Pre-calculus, Statistics and Probability, Calculus)Students will represent and analyze mathematical situations and structures using algebraic symbols.
(Algebra I, Algebra II, Pre-calculus, Statistics and Probability, Calculus)Students will use mathematical models to represent and understand quantitative relationships.
(Algebra I, Algebra II, Pre-calculus, Statistics and Probability, Calculus)Students will analyze change in various contexts.
(Algebra I, Algebra II, Pre-calculus, Statistics and Probability, Calculus)Students will explore algebra using technology.
(Algebra I, Algebra II, Geometry, Pre-calculus, Statistics and Probability, Calculus)
The Geometry StandardStudents will analyze characteristics and properties of two- and three- dimensional geometric shapes and develop mathematical
arguments about geometric shapes.(Algebra II, Geometry, Pre-calculus, Calculus)
Students will specify locations and describe spatial relationships using coordinate geometry and other representational systems.(Algebra I, Algebra II, Geometry, Pre-calculus, Calculus)
Students will apply transformations and use symmetry to analyze mathematical situations.( Algebra II, Geometry, Pre-calculus, Calculus)
Students will use visualization, spatial reasoning, and geometric modeling to solve problems.
10

(Algebra II, Geometry, Pre-calculus, Calculus)Students will explore geometry using technology.
( Algebra II, Geometry, Pre-calculus, Statistics and Probability, Calculus)
The Measurement StandardStudents will understand measurable attributes of objects and the units, systems, and processes of measurement.
(Algebra I, Algebra II, Geometry, Pre-calculus, Statistics and Probability, Calculus)Students will apply appropriate techniques, tools, and formulas to determine measurements.
(Algebra I, Algebra II, Geometry, Pre-calculus, Statistics and Probability, Calculus)
The Data Analysis and Probability StandardStudents will formulate questions that can be addressed with data and collect, organize, and display relevant data to answer
them.(Algebra I, Algebra II, Statistics and Probability, Pre-calculus)
Students will select and use appropriate statistical methods to analyze data.(Algebra II)
Students will develop and evaluate inferences and predictions that are based on data.(Algebra II, Statistics and Probability)
Students understand and apply basic concepts of probability.(Statistics and Probability)
11

PROCESS STANDARDS
The Problem Solving StandardStudents build new mathematical knowledge through problem solving.
Students solve problems that arise in mathematics and in other contexts.Students apply and adapt a variety of appropriate strategies to solve problems.Students monitor and reflect on the process of mathematical problem solving.
The Reasoning and Proof StandardStudents recognize reasoning and proof as fundamental aspects of mathematics.
Students make and investigate mathematical conjectures.Students develop and evaluate mathematical arguments and proofs.
Students select and use various types of reasoning and methods of proof.
The Communications StandardStudents organize and consolidate their mathematical thinking through communication.
Students communicate their mathematical thinking coherently and clearly to peers, teachers, and others.Students analyze and evaluate the mathematical thinking and strategies of others.
Students use the language of mathematics to express mathematical ideas precisely.
The Connections StandardStudents recognize and use connections among mathematical ideas.
Students understand how mathematical ideas interconnect and build on one another to produce a coherent whole.Students recognize and apply mathematics in contexts outside of mathematics.
The Representation StandardStudents create and use representations to organize, record, and communicate mathematical ideas.
Students select, apply, and translate among mathematical representations to solve problems.Students use representations to model and interpret physical, social, and mathematical phenomena.
12
Statement on the Process StandardsProblem Solving
“Teaching is itself a problem-solving activity.”
Problem-solving is an integral part of all mathematics learning and should involve all of the Content Standards. It should not be an isolated part of the curriculum. Problem-solving means taking on a dilemma for which there is no apparent solution. Students at all levels need to develop a problem-solving disposition that includes the confidence, willingness, and perseverance to take on new and challenging tasks.
Each year, students’ repertoires of problem-solving strategies should continue to expand. They should be resourceful, seeking out new information and trying new strategies when necessary. Students should also make use of and apply known strategies and be willing to try multiple and varied approaches when previous attempts at problem-solving fail. Good problem-solvers plan, but also self-monitor and make adjustments when things are not going well.
Problem-solving plays a critical role throughout the mathematics curriculum. Teachers should strategically choose problems that require the thoughtful application of content. Also, teachers should use problems to engage students in the study of important mathematical concepts. At the same time, a major goal of the mathematics curriculum is to equip students with the knowledge and tools needed to tackle rigorous problems.
Effective teachers of problem-solving provide both content-connected and spontaneous opportunities for students to solve challenging problems. These opportunities should be presented often with the goal of selecting problems that will give students the opportunity of learning important content through their exploration of these problems.
Reasoning and Proof“Reasoning and proof are not special activities reserved for special times in the curriculum.”
Reasoning and proof should be a consistent part of students’ mathematical experience in pre-kindergarten through grade 12. Reasoning mathematically is a habit of mind, and like all habits, it must be developed through consistent use in many contexts. Students should develop an appreciation of mathematical justification in the study of all mathematical content. Regardless of the topic, students should expect to have to justify and explain their conclusions. Responding to “why?” should be the norm. At the high school level, stringent standards should govern the acceptance of student explanations. Students should continuously develop their reasoning skills and ability to think analytically. They should be able to make direct arguments to establish the validity of a conjecture. Students should understand that having many examples supporting a conjecture may suggest that a conjecture is true but does not prove it, whereas one counterexample demonstrates that a conjecture is false. At the high school level, students should see the power of deductive proofs in establishing results. They should have many experiences presenting logical arguments in a formal manner. Students should also have some experiences
13
with indirect proofs as not all situations lend themselves to direct means of verification. Students should develop expanded and sophisticated proof techniques.
The mathematics classroom must convey the importance of knowing the reasons for mathematical patterns and truths. Students should be expected to seek, formulate, and critique the explanations of others. High standards should be developed for these explanations.
Communication“ALL students must be able to exchange mathematical ideas effectively with others.”
To be prepared for their future, ALL students must be able to convey mathematical ideas clearly, both orally and in writing. Communication is a fundamental element of mathematical learning and applies to all content components.
During the K-12 years, there should be continuous growth in students’ abilities to organize logical chains of thought, express themselves clearly, listen to the ideas of others, and consider their audience when they communicate. Written and oral mathematical communication in grades K – 12 should be held to an appropriately high level of sophistication. High school students should be good critics and self-critics. All students should be able to generate explanations, formulate questions, and write arguments that mathematicians would consider logically correct and coherent. Students should use mathematical language and symbols correctly and appropriately. Teachers should help students to become more precise in written mathematics and help them to comprehend increasingly technical text.
Students of mathematics should also learn how to work well with a group. Students should be provided with varied opportunities to practice and refine teamwork and collaboration skills.
Connections“Mathematics is an integrated field of study.”
Even though this curriculum is partitioned into separate topics and courses, mathematics remains an integrated field of study. Students at all levels should experience the rich interaction between mathematics topics, between mathematics and other disciplines, and between mathematics and their own personal experiences.
Teachers should build on students’ prior knowledge to help them understand, extend, and make connections to new ideas. They should place an emphasis on mathematical connections to help students recognize how ideas in different areas are related. Viewing mathematics as a whole helps students to learn that mathematics is not a set of isolated and arbitrary skills.
Representation“Models allow a view of a real-world phenomenon.”
14

Students should understand that representations of mathematical ideas are an essential part of learning and doing mathematics. How mathematical ideas are represented is fundamental to how people can understand and use those ideas. Beginning with the primary level, students should be encouraged to represent their ideas in various ways, moving toward conventional forms of representation. All students should be able to create and use representations to understand, organize, record, communicate, and support their mathematical ideas.
15

Mathematics Content Standards by GradeK-8
Grade level indicators have been “mapped” to district-adapted materials. Supplemental materials will need to be used when indicators are marked with “***”. Some indicators can be achieved with the thoughtful and purposeful application of classroom routines; others are embedded throughout the mathematics curriculum.
Number and OperationsStandard: Understand numbers, ways of representing numbers, relationships among numbers, and number systems.Students will demonstrate the ability to:Kindergarten (N&O) K-1; K-2 (T4,T5,T6)Whole numbers 0 – 20 count and use whole numbers use models to show quantity use one-to-one correspondence in counting objects use mathematical language to begin to compare quantities associate a quantity with names and symbols for numbers Compare whole numbers to each others and to benchmark numbers 5,10Grade OneWhole numbers 0-100 (N&O) 1-1; 1-2; 1-5; 1-8 (T1,T2; T12; T13;) count and use whole numbers use models to represent place value to the tens place order and compare numbers (ordinal and cardinal) compare whole numbers to landmark numbers (e.g.,10, 25, 50, 75, 100) show the relationship between whole numbers (e.g., 1 more/less, 10 more/less) compose and decompose (e.g.,14=7+7; 14=10+4) apply properties of numbers (odd, even) connect number words and numerals to the quantities they represent
16
Fractional numbers identify common fractions, such as one half, one third, and one fourth identify a fraction as part of a whole (i.e., fraction of a set, fraction of an area)Decimal numbers identify penny, nickel, dime, quarter, and their monetary value represent the coin equivalent up to $1.00 using single coins and combinations of coins represent monetary values using dollar notationGrade Two Whole numbers 0-199 M(N&O)–2–1; 2-2 (T4;T6;T7) count and use whole numbers use models and expanded notation to represent place value to the hundreds place order and compare numbers (ordinal and cardinal) to each other or to benchmark whole numbers (10,
25, 50, 75, 100, 150) compare whole numbers to landmark (benchmark) numbers (e.g., 25, 50, 100, 500) show the relationship between whole numbers (e.g., 1 more/less, 10 more/less) apply the concepts of equivalency when composing or decomposing numbers (e.g.,34 = 17+17; 34 = 29+5; 34 = 30+4) Fractional numbers M(N&)2-1 (T-12) represent common fractions, such as halves, thirds, and fourths represent a fraction as part of a whole (i.e., fraction of a set, fraction of an area)Decimal numbers M(N&)2-5 (T-5) add coins (to 1.99) to demonstrate understanding of monetary value represent monetary value using dollar notation make change from $1.00 or less show equivalent coin combinations of the same value ( to $1.99)Grade Three M(N&O) 3-1; 3-2 (T1)Whole numbers 0-999 find equivalent representations for the same number use models, explanations, or other representations to represent place value to the thousands place (1-
1; 1-2) order and compare numbers (ordinal and cardinal) (1-5; 1-6) compare whole numbers to landmark (benchmark) numbers (e.g., 100, 250, 500, 1,000) (1-5) show the relationship between whole numbers
17
apply the concept of equivalency when composing and decomposing numbers (e.g., 34 = 17+17; 34 = 29+5; 34 = 30+4)
connect number words and numerals to the quantities they represent (1-4)Fractional numbers M(N&O) 3-1; 3-2 (T12) represent common fractions, such as halves, thirds, fourths, sixths, and eighths (12-1; 12-2; 12-3; 12-
4) represent a fraction as part of a whole (i.e., fraction of a set, fraction of an area) (12-1) compare or identify equivalent positive fractional numbers (e.g., a/2, a/3, a/4) where a is a whole
number greater than 0 and less than or equal to the denominator) (L12-5) use models, number lines, or explanations (L12-6; 12-7; 12-8; 12-9)Decimal numbers represent decimals as part of 100 (within the context of moneyGrade FourWhole numbers 0-99,999 (N+O) 4-1; 4-2 (T1) find equivalent representations for the same number generate whole numbers by decomposing and composing numbers (e.g., 786=7x100 plus 8x10 plus
6x1) use models to represent place value through the ten thousands place (1-1; 1-2) order or compare whole numbers (1-3)Fractional numbers (t10;T11) recognize common fractions such as half, thirds, fourths, fifths, sixths, eighths, and
tenths recognize fractions as parts of a collection or of a whole recognize locations on number lines recognize division of whole numbers use linear models where the number of parts in the whole are equal to, and a multiple or factor of the
denominator use models, benchmarks and equivalent forms to judge the size of fractions (e.g., a/2, a/3, a/4, a/5,
a/6, a/8/, a/10) recognize and generate equivalent forms of commonly used fractions order, compare, or identify equivalent proper positive fractional numbersDecimals (T1;T12;T13) order and compare decimals (12-2)
18
relate decimals within the context of money as part of 100 (1-5) convert percents as part of 100*** compute decimals within the context of metric measurement as part of 10th (e.g., 2.3 cm.) *** apply place value structure of decimals (12-1) recognize and generate equivalent forms of commonly used decimals and percents ***Grade Five GLE M(N+O)5-1,5-2,5-3,5-4Place Value formulate rational numbers from 0 to 9,999,999 through equivalency, composition, decomposition or
place value using models, explanations, or other representations [Topic 1] recognize the place value structure of the base ten number system (Mathematical Thinking, Inv. 2, 3, 4;
or other resource) [Topic 1]Multiplication/Division solve problems involving the use of properties of factors, multiples, prime, or composite numbers [Topic
3] determine that the number of parts in the whole is equal to 100, a multiple of 100, or a factor of 100
[Topic 3]Algebra investigate integers in context using models or number lines [Topic 4,17] explore numbers less than 0 by extending the number line [Topic 17]Fractions recognize the relative magnitude of numbers by ordering, comparing, or identifying equivalent positive
fractional numbers within number formats (i.e., fractions to fractions, decimals to decimals, or percents to percents) [Topic 9 ]
represent fractions as halves, fourths, eighths, thirds, sixths, twelfths, fifths or powers of ten (e.g., 10, 100, 1000) [Topic 9 ]
use positive fractional numbers (i.e., proper, mixed numbers, and improper) with unlike denominators [Topic 10 ]
Decimals recognize the relative magnitude of numbers by ordering, comparing, or identifying equivalent positive
decimals within number formats (i.e., fractions to fractions, decimals to decimals, or percents to percents) [Topic 1,9 ]
determine that the number of parts in the whole is equal to the denominator of the fractional equivalent of the decimal, or a factor of the denominator of the fractional equivalent of the decimal [Topic 9 ]
19
compare whole numbers and decimals [Topic 1 ] use decimals to the hundredths and thousandths (including powers of ten) ) in problem solving, or
models, or other representations [Topic 9 ]Percents recognize the relative magnitude of numbers by ordering, comparing, or identifying equivalent positive
benchmark percents (10%, 25%, 50%, 75%, 100%) within number formats (i.e., fractions to fractions, decimals to decimals, or percents to percents) [Topic 16 ]
recognize benchmark percents (e.g., 10%, 25%, 50%, 75%, or 100%) as parts to a whole using models, explanations, or other representations[Topic 16]
Grade Six (GLE N&O 6-1, 6-2) define ratios and write ratios in three forms (Ch. 7-1) compare and contrast ratios and fractions (Ch. 7-1) represent part to whole relationships (Ch. 7-2) represent decimal numbers on a 10 by 10 grid relate fraction benchmarks to decimal benchmarks use division to change a fraction to a decimal (Ch. 4-9) find equivalent forms of fractions (using common denominators) use hundredths grids to develop an understanding of percent as meaning out of 100 show equivalence among fractions, decimals, and percents (Ch. 7-6) express sets of data containing items other than 100 as a percent (Ch. 7-6, 7-7) use concrete models to compare fractions and find equivalent fractions label points on the number line between whole numbers write, compare (using equality & inequality symbols), and order decimals with place values to the ten
thousandths (Ch. 1-5, 1-6, 12-2) use factors, multiples, prime factorization, and relatively prime numbers to solve problems (Ch. 4-3, 4-
4, 4-7) use a number line to develop meaning and represent integers (Ch. 11-7) calculate exponents and define the base and power numbers (Ch. 4-2)Grade Seven (GLE N&O 7-1, 7-2) demonstrate equivalency among representations of fractions, decimals, and percents (Ch. 2-6, 6-2) represent and compare quantities with integers compare and order rational numbers (fractions, decimals, whole numbers, whole numbers with
20
exponents, integers, absolute values, numbers written in scientific notation) using the number line or inequality symbols (1-6, 2-4 Teachers must make sure to include all types of numbers in the comparisons as new ideas are learned.)
calculate and compare unit rates (5-2) use proportional reasoning to find the missing value in a proportion (5-4 Teachers must make sure
students understand proportionality and have a variety of strategies to show understanding.) use percent to represent multiples of a number (6-4) find values for percents of solve problems with numbers greater than 100% and less than 1% (6-3) use ratios, proportion, and percents to compare two sets of data (5-1, 5-2, 5-3, 5-4, 6-4, 6-5, 6-6, 6-7) write large numbers in scientific notation and vice versa (2-8) use calculators to work with large numbers and scientific notation (2-8) represent and compare quantities with integers (1-6)Grade Eight (GLE N&O 8-1, 8-2) calculate percent increase and percent decrease, relative to the original amount(5-5, 5-6) use percent to describe change(5-5, 5-6) use absolute value to solve problems(1-2) use models to represent perfect square and cube roots(Teachers should use this modeling in 3-1) compare and order rational numbers using the number line or inequality symbols(2-3, 2-7, 2-8 Teachers
must make sure to include all types of numbers in the comparisons as new ideas are learned.)
Standard: Understand meanings of operations and how they relate to one another.Students will demonstrate the ability to:Kindergarten (N+O) K-2, K-3 K-6 (T10;T11) use words such as more than, less than, and add/subtract to express some number concepts use numbers to represent real life story problemsGrade One (N&O) 1-2; 1-3; 1-6 (T3;T4;T5;T6;T7; T17) use addition and subtraction of whole numbers in a variety of situations describe the relationship between addition and subtraction describe the effects of adding and subtracting whole numbersGrade Two M(N&O) 2-3; 2-6 (T1-T2;T3;T10;T12;T19, T20) describe various meanings of addition and subtraction of whole numbers and the relationship between
the two operations
21

describe the effects of adding and subtracting whole numbers describe situations that entail multiplication and division, such as equal groupings of objects and
sharing equallyGrade Three M(N&O) 3-3; 3-4 (T2-T5;T7;T8;T12;T13) use addition or subtraction of positive fractional numbers with like denominators (12-8; 12-9) use addition or and subtraction of decimals (13-3) describe or illustrate the inverse relationship between addition and subtraction or multiplication and
division (3-1; 3-3; 8-1) describe the relationship between repeated addition and multiplication using models, number lines, or
explanations (5-1) accurately solves problems involving addition and subtraction using algorithm as one method with
regrouping (T-2; T-3; T-4) accurately solves problems involving the concept of multiplication and addition or subtraction of
decimals in the context of money (T-6; T-7; T-8)Grade Four (N+O) 4-3; 4-4; 4-8 (T2-T4;T13;T18) apply the conventions of order of operations where the left to right computations are modified only by
the use of parenthesis accurately solve problems involving multiple operations on whole numbers or the use of the properties
of factors and multiples (multiplication limited to 2 digits by 2 digits and division to 1 digit divisors) (T-3; T-4; T-5; T-13T-18)
describe or illustrate the relationship between repeated subtraction and division (no remainders) (L4-1) convert the inverse relationship between division and multiplication of whole numbers (e.g., 5 x 2; 2 x
5)(T-3; T-4) determine the effects of multiplying and dividing whole numbers (T-3; T-4; T-5; T-7; T-8) use properties of operationsGrade Five GLE M(N+O)5-3,5-4Fractions
solve problems using addition or subtraction of fractions (proper) [Topic10]Multiplication/Division explain the effects of multiplying and dividing whole numbers [Topic 3,4 ] identify and use relationships between operations, such as the divisor as the inverse of multiplication to
22

solve problems [Topic 4] use properties of operations (i.e., the distributive property of multiplication and addition)(e.g.,7x23 can
be 7x10 plus 7x3) [Topic 1,3,6 ] use mathematical operations to describe or illustrate the meaning of a remainder with respect to
division to whole numbers using models, explanations or solving problems (i.e., division of whole numbers by up to a 2 digit divisor) [Topic 4,5-4,5-5,5-6 ]
solve problems involving multiple operations with whole numbers by applying the conventions of order of operations with and without parenthesis [Topic 3,6 ]
apply properties of numbers (odd, even, divisibility) and field properties(associative, identity, commutative, distributive) to solve problems and computation [Topic 3 ]
Decimals solve problems involving adding and subtracting decimals [Topic 4 ] solve problems involving decimals to the hundredths place [Topic 4]Grade Six (GLE N&O 6-3, 6-4, 6-8) add, subtract, multiply & divide fractions and decimals (Ch. 5, 6, 1-7, 1-8, 1-9) represent fractions larger than a whole using mixed numbers and improper fractions (Ch. 4-6) add and subtract integers (Ch. 11-3, 11-4) represent fractions with denominators of 10 and powers of 10 as decimal numbers use percent in estimating, tax, tip, and discounts (Ch. 7-9) describe or illustrate the meaning of power and how it relates to the base and exponent of a number in
exponential form (Ch. 4-2) describe or illustrate the effect that multiplying or dividing a whole number, decimal, or fraction has on
a whole number (Ch. 1, 5, 6) solve problems involving single or multiple operations on fractions (proper, improper, and mixed) or
decimals by correctly applying the Order of Operations with and without parentheses (Ch. 4-6) solve problems involving single or multiple operations by adding or subtracting integers or percent of a
whole (Ch. 7-7, 11-7) solve problems involving greatest common factor or least common multiple (Ch. 4-4, 4-7) classify whole numbers greater than one as prime or composite (Ch. 4-3) classify numbers as odd or even (Ch. 4-1) apply divisibility rules for 2, 3, 5, 9, and 10 (Ch. 4-1) determine the prime factorization of a number using a factor tree (Ch. 4-3) apply commutative, associative, distributive, additive identity, multiplicative property of one and
23
additive inverse properties Ch. 1-3, 3-4, 3-8)Grade Seven (GLE N&O 7-3, 7-4, 7-8) add, subtract, multiply and divide integers (1-7 Teachers must make sure students have a strong
understanding of how integer values are combined and the difference between them.) solve problems using proportional reasoning (5-2, 5-3, 5-4, 5-5, 5-6) solve problems involving discounts, tax, tip, rates (6-7) apply order of operations including parentheses, brackets, and exponents (1-9, 2-1 Teachers must
make sure to provide problems using a combination of all forms.) find values of numbers with whole number exponents (6-8) determine the square root of a number (8-6) use the inverse relationships of addition and subtraction; multiplication and division; and squaring and
finding square roots to simplify computations and solve problems (4-3, 4-4, 8-6 Teachers must incorporate this thinking into problem solving in all areas of mathematics.)
apply commutative, associative, distributive, identity and inverse properties (1-2, 1-3, 1-9 Teachers must incorporate these properties when solving problems in all areas of mathematics.)
Grade Eight (GLE N&O 8-4, 8-8) use practical problems to review and strengthen understanding of the order of operations (1-1) add, subtract, multiply and divide rational numbers (2-4, 2-5) use models and diagrams to represent operations with integers and whole number exponents generalize and use the distributive and commutative properties to solve problems (1-5) solve problems requiring inverse operations (Chapter 6 Teachers must imbed this thinking throughout
all areas of mathematics problem solving.) relate the area of a square to the length of its side (Teachers should use this modeling with students in
3-1) use the associative and commutative properties of addition and multiplication and the distributive
property to simplify computations with integers, fractions, and decimals (2-4, 2-5) use multiplication and division of integers, square roots, cube roots, squaring and cubing to solve
problems involving percent increase and decrease, interest rates, and proportional relationships (4-3, 4-4, 5-3, 5-4, 5-5, 5-6, 5-8, 5-9)
use the additive inverse (any number added to its opposite is equal to zero), multiplicative inverse (any number multiplied by its reciprocal is equal to one), identity element for multiplication (any number multiplied by one remains unchanged), identity element for addition (any number added to zero
24

remains unchanged) to solve problems (chapter 6) recognize that any number raised to the power of zero is equal to one (2-7)
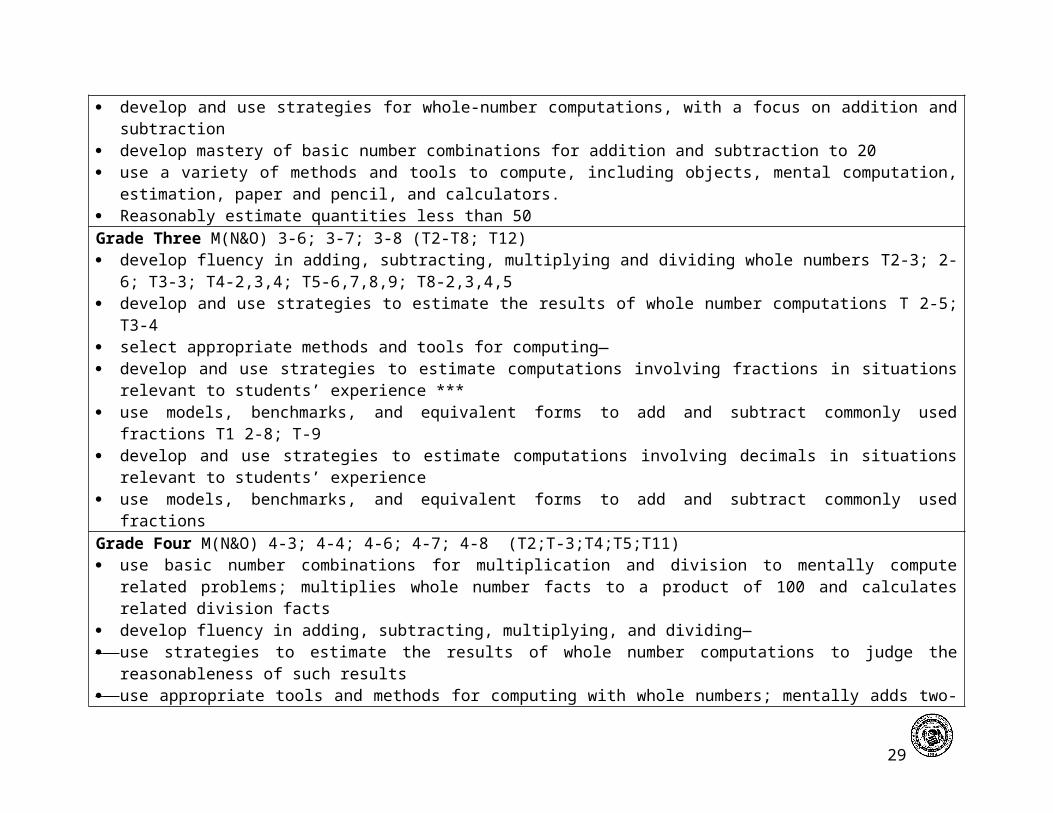
Standard: Compute fluently and make reasonable estimatesStudents will demonstrate the ability to:Kindergarten (N+O) K-7 (T10;T11) reasonably estimate quantities less than 20Grade One (N&O)1-6; 1-7 (T3;T4;T5;T6;T7; T16. T17. T19) develop and use strategies for whole-number computations, with a focus on addition and subtraction develop fluency with basic number combinations for addition and subtraction to 20 (same units) use a variety of methods and tools to compute, including objects, mental computation, estimation,
paper and pencilGrade Two M(N&) 2-3;2-6 (T1-T3; T6-T9) develop and use strategies for whole-number computations, with a focus on addition and subtraction develop mastery of basic number combinations for addition and subtraction to 20 use a variety of methods and tools to compute, including objects, mental computation, estimation,
paper and pencil, and calculators. Reasonably estimate quantities less than 50Grade Three M(N&O) 3-6; 3-7; 3-8 (T2-T8; T12) develop fluency in adding, subtracting, multiplying and dividing whole numbers T2-3; 2-6; T3-3; T4-
2,3,4; T5-6,7,8,9; T8-2,3,4,5 develop and use strategies to estimate the results of whole number computations T 2-5; T3-4 select appropriate methods and tools for computing develop and use strategies to estimate computations involving fractions in situations relevant to
students’ experience *** use models, benchmarks, and equivalent forms to add and subtract commonly used fractions T1 2-8; T-
9 develop and use strategies to estimate computations involving decimals in situations relevant to
students’ experience use models, benchmarks, and equivalent forms to add and subtract commonly used fractions Grade Four M(N&O) 4-3; 4-4; 4-6; 4-7; 4-8 (T2;T-3;T4;T5;T11) use basic number combinations for multiplication and division to mentally compute related problems;
25
multiplies whole number facts to a product of 100 and calculates related division facts develop fluency in adding, subtracting, multiplying, and dividing use strategies to estimate the results of whole number computations to judge the reasonableness of
such results use appropriate tools and methods for computing with whole numbers; mentally adds two-digit whole
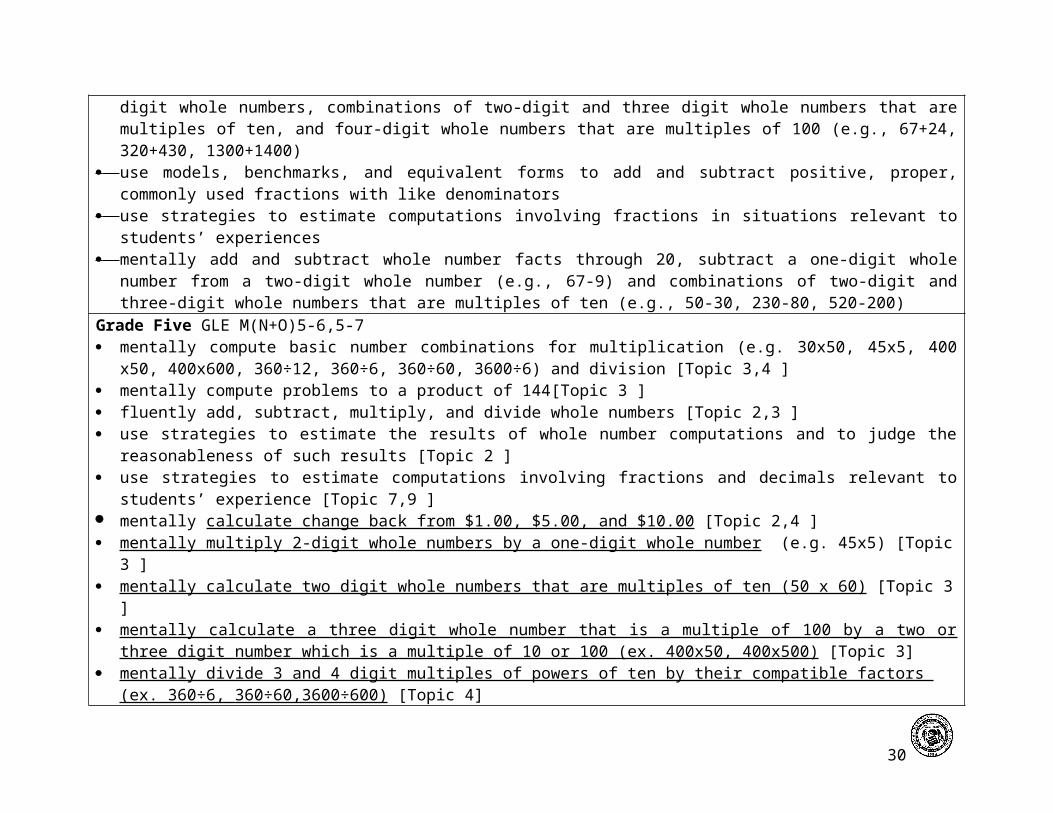
numbers, combinations of two-digit and three digit whole numbers that are multiples of ten, and four-digit whole numbers that are multiples of 100 (e.g., 67+24, 320+430, 1300+1400)
use models, benchmarks, and equivalent forms to add and subtract positive, proper, commonly used fractions with like denominators
use strategies to estimate computations involving fractions in situations relevant to students’ experiences
mentally add and subtract whole number facts through 20, subtract a one-digit whole number from a two-digit whole number (e.g., 67-9) and combinations of two-digit and three-digit whole numbers that are multiples of ten (e.g., 50-30, 230-80, 520-200)
Grade Five GLE M(N+O)5-6,5-7 mentally compute basic number combinations for multiplication (e.g. 30x50, 45x5, 400 x50, 400x600,
360÷12, 360÷6, 360÷60, 3600÷6) and division [Topic 3,4 ] mentally compute problems to a product of 144[Topic 3 ] fluently add, subtract, multiply, and divide whole numbers [Topic 2,3 ] use strategies to estimate the results of whole number computations and to judge the reasonableness
of such results [Topic 2 ] use strategies to estimate computations involving fractions and decimals relevant to students’
experience [Topic 7,9 ] mentally calculate change back from $1.00, $5.00, and $10.00 [Topic 2,4 ] mentally multiply 2-digit whole numbers by a one-digit whole number (e.g. 45x5) [Topic 3 ] mentally calculate two digit whole numbers that are multiples of ten (50 x 60) [Topic 3 ] mentally calculate a three digit whole number that is a multiple of 100 by a two or three digit number
which is a multiple of 10 or 100 (ex. 400x50, 400x500) [Topic 3] mentally divide 3 and 4 digit multiples of powers of ten by their compatible factors (ex. 360÷6,
360÷60,3600÷600) [Topic 4]Grade Six (GLE N&O 6-6, 6-7) (The teacher must embed mental computation and estimation strategies in all areas of mathematics through problem solving.)
26

develop strategies for estimating sums of fractions and decimals use benchmark fractions to estimate sums (e.g., ¼, ½, 1 ½) generalize patterns to develop algorithms for adding, subtracting, multiplying, and dividing fractions generalize patterns to develop algorithms for adding, subtracting, multiplying, and dividing decimals generalize patterns to develop algorithms for adding and subtracting integers develop and use strategies to estimate the results of a solution select when mental computation, estimation, calculators, or pencil and paper strategies would be most
appropriate use percent in estimating tax, tip, and discounts mentally calculate change back from $20.00, $50.00, and $100.00 mentally multiply a two-digit number by a one-digit number mentally multiply two-digit numbers that are multiples of ten mentally multiply a three-digit number that is a multiple of 100 by a two- or three-digit number that is a
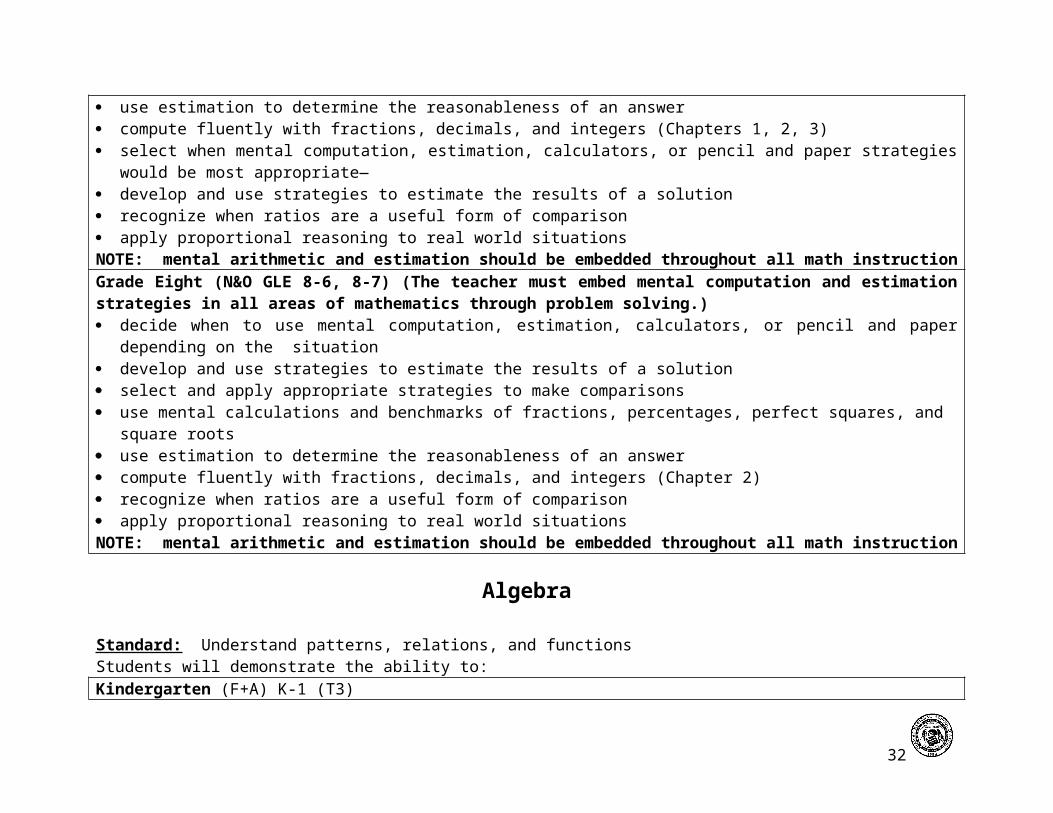
multiple of 10 or 100 mentally divide three- and four-digit multiples of powers of ten by their factors mentally determine parts of a whole number using the benchmarks 1%, 10%, 25%, 50%, and 75%NOTE: mental arithmetic and estimation should be embedded throughout all math instruction.Grade Seven (GLE N&O 7-6, 7-7) (The teacher must embed mental computation and estimation strategies in all areas of mathematics through problem solving.) develop and use strategies to estimate the results of a solution use mental calculations and benchmarks of fractions, percentages, perfect squares, and square roots use estimation to determine the reasonableness of an answer compute fluently with fractions, decimals, and integers (Chapters 1, 2, 3) select when mental computation, estimation, calculators, or pencil and paper strategies would be most
appropriate develop and use strategies to estimate the results of a solution recognize when ratios are a useful form of comparison apply proportional reasoning to real world situations NOTE: mental arithmetic and estimation should be embedded throughout all math instructionGrade Eight (N&O GLE 8-6, 8-7) (The teacher must embed mental computation and estimation strategies in all areas of mathematics through problem solving.) decide when to use mental computation, estimation, calculators, or pencil and paper depending on the
27
situation develop and use strategies to estimate the results of a solution select and apply appropriate strategies to make comparisons use mental calculations and benchmarks of fractions, percentages, perfect squares, and square roots use estimation to determine the reasonableness of an answer compute fluently with fractions, decimals, and integers (Chapter 2) recognize when ratios are a useful form of comparison apply proportional reasoning to real world situationsNOTE: mental arithmetic and estimation should be embedded throughout all math instruction
Algebra
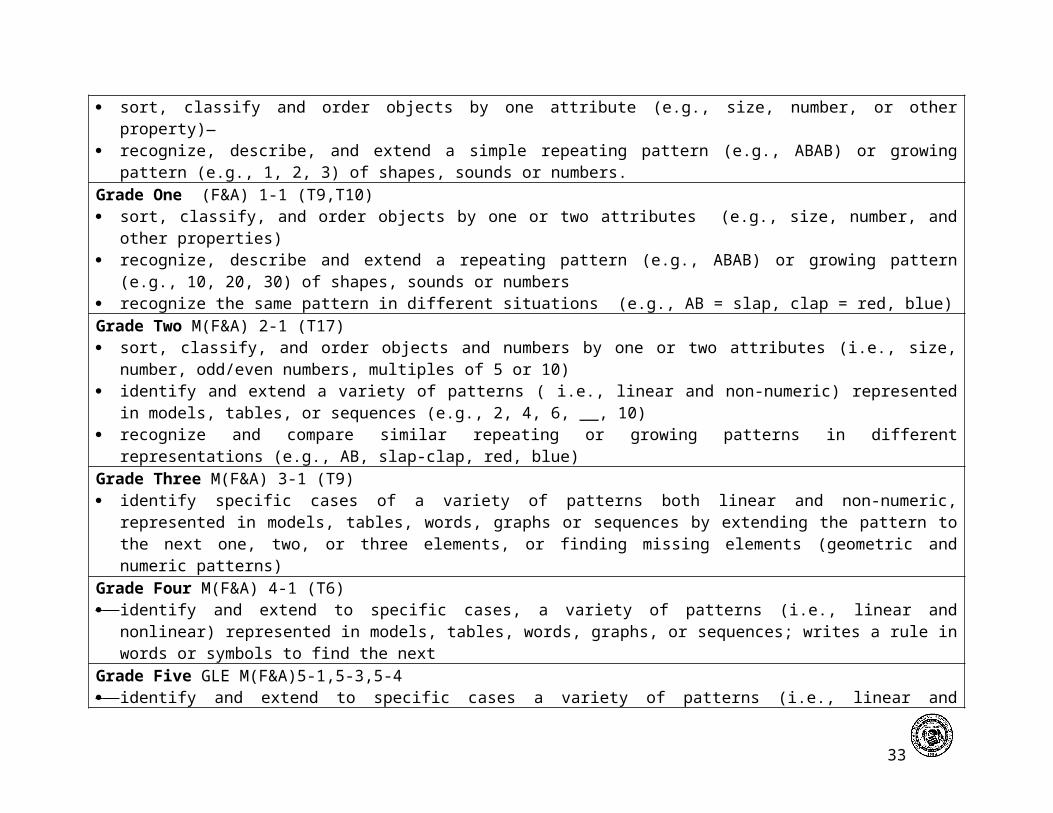
Standard: Understand patterns, relations, and functionsStudents will demonstrate the ability to:Kindergarten (F+A) K-1 (T3) sort, classify and order objects by one attribute (e.g., size, number, or other property) recognize, describe, and extend a simple repeating pattern (e.g., ABAB) or growing pattern (e.g., 1, 2,
3) of shapes, sounds or numbers.Grade One (F&A) 1-1 (T9,T10) sort, classify, and order objects by one or two attributes (e.g., size, number, and other properties) recognize, describe and extend a repeating pattern (e.g., ABAB) or growing pattern (e.g., 10, 20, 30) of
shapes, sounds or numbers recognize the same pattern in different situations (e.g., AB = slap, clap = red, blue)Grade Two M(F&A) 2-1 (T17) sort, classify, and order objects and numbers by one or two attributes (i.e., size, number, odd/even
numbers, multiples of 5 or 10) identify and extend a variety of patterns ( i.e., linear and non-numeric) represented in models, tables,
or sequences (e.g., 2, 4, 6, __, 10) recognize and compare similar repeating or growing patterns in different representations (e.g., AB,
slap-clap, red, blue)Grade Three M(F&A) 3-1 (T9) identify specific cases of a variety of patterns both linear and non-numeric, represented in models,
28
tables, words, graphs or sequences by extending the pattern to the next one, two, or three elements, or finding missing elements (geometric and numeric patterns)
Grade Four M(F&A) 4-1 (T6) identify and extend to specific cases, a variety of patterns (i.e., linear and nonlinear) represented in
models, tables, words, graphs, or sequences; writes a rule in words or symbols to find the nextGrade Five GLE M(F&A)5-1,5-3,5-4 identify and extend to specific cases a variety of patterns (i.e., linear and nonlinear) represented in
models, tables, words, graphs, sequences or in problem situation [Topic 6 ] write a rule in words or symbols for finding specific patterns in cases of a linear relationship [Topic 6 ]Grade Six (GLE F&A 6-1) analyze data using coordinate graphs to explore relationships among variables (Ch. 11-10) explain the difference between a numerical expression and an algebraic equation (Ch. 3-2) identify a variety of linear or nonlinear patterns represented in models, tables, sequences, graphs, and
problem situations (Ch. 3-1, 3-3) write an expression or equation using words or symbols to express a generalized linear relationship (Ch.
3-1, 3-2, 3-3)Grade Seven (GLE F&A 7-1) (This GLE is covered in Chapter 9 sections 1-5 and Chapter 10 sections 2,3. the teacher must help students to make the connection between the different representations of a linear relationship.) interpret information given in a table or graph search for patterns of predictable change extend a pattern when represented in the form of a table, graph, sequence, model, or problem situation write a general, explicit rule for a linear or nonlinear sequence when represented in table, graph, model,
or problem situation find a specific case of a linear relationship recognize a function as linear or nonlinear when represented in table, graph or equation form use a graphing calculator to generate a table or graph given a rule or situation Grade Eight (GLE F&A 8-1) The teacher must help students to make connections between the different representations of a linear relationships. recognize linear situations in written descriptions, tables, graphs, and symbols (11-3, 11-4, 11-5, 11-6) recognize how the y-intercept appears in tables, graphs, and equations (11-3, 11-4, 11-5, 11-6) recognize how the rate of change (slope) appears in tables and equations and affects the graph of a line
29
(11-3, 11-4, 11-5, 11-6) use data from tables, graphs and equations interchangeably (11-3, 11-4, 11-5, 11-6) identify functions as linear or nonlinear and contrast their properties from tables, graphs, or equations
(11-7) distinguish between linear and nonlinear relationships write a formula, using symbols, for a linear sequence presented in model, table, graph or problem
solving situation (11-1) generalize a rule using a formula or words for a nonlinear sequence presented in model, table, graph or
problem solving situation (Chapter 11)
Standard: Represent and analyze mathematical situations and structures using algebraic symbolsStudents will demonstrate the ability to: KindergartenN/AGrade One M(F&A) 1-1 M(N&O) 1-8 (T3;T10) investigate general properties of addition and subtraction (i.e., commutative, zero property) using
arithmetic notation along with objects and picturesGrade Two M(F&A)–2–4 M(N&O) 2-8 (T1;T2) illustrate general principles and properties of addition and subtraction (i.e., commutative property, zero
properties, associative properties) using specific numbers show a conceptual understanding of equality in addition and subtraction expressions by finding a value
that makes an open sentence true (e.g.3+ _ = 6) (limited to one operation and limited to use addition or subtraction)
use concrete, pictorial, and verbal representation for invented and conventional arithmetic notationsGrade Three M(F&A) 3-4 M(N&O) 3-8(T2-T6) show the equality between two expressions using models or different representations of the
expressions or by finding the value that will make an open sentence true (e.g., 2 + _ = 7) using one operation with addition, subtraction or multiplication
solve mathematical problems to show relationships with equationsGrade Four M(F&A) 4-4 M(N&O) 4-8 (T18) use algebraic expressions by using letters or symbols to represent unknown quantities to write simple
linear algebraic expressions involving any one of the four operations
30

evaluate simple linear algebraic expressions using whole numbers identify commutative, associative, and distributive properties to compute with whole numbers solve mathematical relationships using equations Grade Five GLE M(F&A)5-3,5-4 develop algebraic expressions by using letters or a symbol to represent unknown quantities to write
linear algebraic expressions involving any two of the four operations; or by evaluating linear algebraic expressions using whole numbers [Topic 6 ]
identify commutative, associative, and distributive properties and use them to compute with whole numbers [Topic 6 ]
Grade Six (GLE F&A 6-1, 6-2, 6-3, 6-4) substitute a variable in situations where a rule can be applied such as C=2r ( Ch. 9) recognize and generate equivalent forms for a simple algebraic expression and solve linear equations
(e.g., P=2l + 2w or P=2(l+w)) ( Ch. 9) use letters to represent unknown quantities to write simple algebraic expressions using four basic
operations and following the Order of Operations ( Ch. 3-3) evaluate algebraic expressions with more than one variable ( Ch. 3-2) evaluate an algebraic expression within an equation ( Ch. 3-5,3-6,3-7) accurately constructs/interprets coordinate graphs ( Ch. 11-8) plot points, identify origin and four quadrants and read coordinates from graph ( Ch. 11-8) describe the meaning of slope and intercept in concrete situations ( Ch. 11-10) describe how change in the value of one variable relates to the change in the value of a second variable
in problem situations with constant rates of change ( Ch. 11-10)Grade Seven (GLE F&A 7-1, 7-2, 7-3, 7-4) (The teacher must help students to make the connection between the different representations of a linear relationship.) examine the relationships between tables, graphs, and equations (10-2) describe the meaning of slope given a concrete situation (10-3) solve problems using slope and rate of change (10-3) determine slope from a table or graph (9-2) describe how the change in one variable relates to the change in a second variable (in linear
relationships) use letters to represent unknown quantities when writing algebraic expressions and equations
(including using whole number exponents or more than one variable) (4-1)
31
solve linear equations in the form of y= mx + b (4-5, 4-6) evaluate expressions or equations through substitution (4-1)Grade Eight (GLE F&A 8-2, 8-3, 8-4) (The teacher must help students to make the connection between the different representations of a linear relationship.) recognize that a change in rate will change the steepness of a line and the coefficient of x (11-4) represent linear relationships in tables, graphs, formulas translate among representations of linear relationships find the slope and intercepts of the graph of a linear relationship and identify their meaning in a
problem situation describe how one quantity varies in relationship to another quantity when there is a constant (linear) or
varying (nonlinear) rate of change solve an equation of the form y=mx + b (6-1, 6-3) simplify algebraic expressions (6-2) evaluate expressions within an equation (6-2, 6-3) solve linear equations through substitution (1-1, 1-4, as a check when solving equations in chapter 6) recognize and generate equivalent expressions (example: re-express formulas such as d=rt in terms of
t as t=d/r) (2-6) show equivalence or nonequivalence of 2 or more expressions by applying commutative, associative,
distributive properties, order of operations, or substitution (6-2, 6-3, 6-4) show equivalence between two expressions using models or other representations solve multi-step linear equations with integer coefficients (6-3, 6-4) solve problems informally involving systems of linear equations in context
Standard: Use mathematical models to represent and understand quantitative relationshipsStudents will demonstrate the ability to: Kindergarten M(N&O)K-3 (T10; T11) use objects and pictures to model real life situations involving joining actions (i.e., addition) and
separating actions (i.e., subtraction) Grade One M(N&O)1-2 M(F&A) 1-4 (T3-T7;T10) use objects, pictures and symbols to model situations involving joining actions and separating actions of
two to four numbers using one operation write an equation that models a problem situation
32
Find the value that will make an open sentence true)e.g. 2+__=7) using models, verbal explanations, or written equations
Grade Two M(F&A) 2-4 M(N&O)2-3(T10) use objects, pictures, and symbols to model situations involving joining actions and separating actions
of whole numbers; both operations may be used in a single equation use more than one model to demonstrate an addition or subtraction problem use tables or equations to model a problem situation find the value that will make an open sentence true)e.g. 2=__7) using models, verbal explanations, or
written equations Grade Three M(F&A)3-4 M(N&O)3-3(T2 - T8) model problem situations with objects and use graphs, tables, equations to draw find the value that will make an open sentence true)e.g. 2=__7) using models, verbal explanations, or
written equationsGrade Four M(F&A)4-3; 4-4 M(N&O)4-3 (T2-T6; T18) show the concept of equality between two expressions using models or different representations of the
expressions such as with objects, graphs, tables, and equations to draw conclusions show equivalence by simplifying numerical expressions where left to right computations may be
modified only by the use of parenthesis [e.g., 14-(2x5)] (expressions consistent with simple linear algebraic expressions involving any of the four operations or using whole numbers) (***)
solve one-step linear equations of the form ax = c x≠ to b = c, where a, b, and c are whole numbers with a ≠ to o
Grade Five GLE M(F&A)5-4 show equivalence between two expressions using models or different representations of the
expressions (using letters to represent unknown quantities to write linear algebraic expressions involving any two of the four operations or using whole numbers)by solving one step linear equations (of the forms ax=c, x≠b=c, or x/a=c, where a, b, and c are whole numbers with a≠0)[Topic 6 ]
show equivalence by determining which values of a replacement set make the equation (multi-step of the form ax + b = c where a, b, and c are whole numbers with a 0) a true statement (e.g., 2x+3 = 11, x:x=2, 3, 4, 5})
[Topic 15 ] model problems with objects, graphs, tables, or equationsGrade Six (GLE F&A 6-2, 6-4)
33
model problems with graphs, tables, or equations show equivalence between two expressions using models or different representations (e.g., using
letters to represent unknown quantities to write linear algebraic expressions involving any of the four operations and consistent with order of operations) ( Ch. 12-1)
solve multi-step linear equations using inverse operations ( Ch. 3-5, 3-6, 3-7)Grade Seven (GLE F&A 7-2, 7-4) translate a problem solving situation into an equation (4-1, 4-3, 4-4, 4-5, 4-6) show equivalence between two expressions (using models or other representations) (4-3) collect data from an experiment, then represent the data using a table and graph (Chapter 9) create a table, make a graph, and determine a rule for a given situation (Chapter 9) collect data and use patterns in tables and graphs to make predictions (Chapter 9)Grade Eight (GLE F&A 8-2, 8-4) model problems (linear and nonlinear) using tables, graphs, equations, and words (Chapter 11) show equivalence between two expressions using models or other representations (Chapter 11) create a table, make a graph, and determine a rule, based on a constant or varying rate of change, for
a given situation (Chapter 11) solve contextualized problems (linear and nonlinear) represented with graphs, tables, equations and
words (Chapter 11)
Standard: Analyze change in various contextsStudents will demonstrate the ability to: Kindergarten (not in gle) (T16) describe how things change over time using real world models (e.g., we grow taller, the weather gets
colder)Grade One (not in gle) (T9) associate numbers with change (e.g., The plant is growing two more inches each week)Grade Two M(DSP)2-2; 2-3; 2-4; 2-6 (T15) describe and predict both qualitative and quantitative changes in the real world Grade Three M(DSP) 3-3;3-6 (T20) introduce how a change in one variable relates to a change in a second variable identify, describe, and/or compare situations that represent constant rates of changeGrade Four M(F+A) 4-2 M(DSP) 4-3; 4-6 (T17)
34

investigate how a change in one variable relates to a change in a second variable identify and describe situations with constant or varying rates of change and compare themGrade Five GLE M(F&A)5-2 Compare and describe situations that represent constant or varying rates of change (e.g. tell a story
given a line graph about a trip) in a linear relationship (y=kx) as a constant rate of change [Topic 18]Grade Six (GLE F&A 6-2) write a rule in words or symbols for linear or nonlinear relationships ( Ch. 3-1) construct and interpret graphs of real-life occurrences ( Ch. 11-10) describe the slope of a line for linear relationships (e.g., faster, slower, greater, or smaller) ( Ch. 11-10)Grade Seven (GLE F&A 7-2) use graphs to analyze the nature of changes in quantities of linear relationships (9-5) determine the slope of a line from a table or graph (10-3)Grade Eight (GLE F&A 8-2) recognize rate of change in linear relationships from tables, graphs, and equations (Chapter 11) find slope and intercepts of the graph of a linear relationship and identify their meaning in a problem
situation (Chapter 11) describe how one quantity varies in relationship to another quantity when there is a constant (linear) or
varying (nonlinear) rate of change (Chapter 11) relate the slope and y-intercept to the equation of the line (Chapter 11) use knowledge about linear relationships to solve problems (Chapter 11)
Geometry
Standard: Analyze characteristics and properties of two- and three-dimensional geometric shapes and develop mathematical arguments about geometric relationships.Students will demonstrate the ability to:Kindergarten (G+M) K-1, K-7 (T7) name basic two-dimensional and three-dimensional shapes and describe some of their attributes (e.g.,
square, triangle, circle, rectangle, side, top, corner) make simple comparisons between shapes (e.g., bigger, taller, longer, wider, etc.) and group shapes
that go together create a design using manipulatives (e.g., pattern blocks)
35
classify, sort, and compare shapes using one attribute build polygons and circlesGrade One (G&M) 1-1; 1-3 (T8;T14) name and describe attributes and parts of two-dimensional and three-dimensional shapes (e.g.,
trapezoid, hexagon, rhombus, size, number of sides and corners) compare shapes by at least 1 attribute (e.g., size, number of sides, number of corners, etc.) compose (combine) and decompose shapes using manipulatives (e.g., Pattern block puzzles) distinguish between simple geometric shapes and non-examples (i.e., Which are triangles and which
are not triangles?) ***Grade Two M(G&M)2-1; 2-4 (T-11) identify and describe two-dimensional and three-dimensional shapes using mathematical terms (e.g.,
sides, faces, angles, etc.) sort and classify two-dimensional and three-dimensional shapes by two or more attributes (e.g., sides,
shapes, angles, etc.) predict results of putting together (composing) and taking apart (decomposing) shapes distinguish between geometric shapes and non-examples (i.e., Which are rectangles and which are not
rectangles?)Grade Three M(G&M) 3-1; 3-4; 3-5 (T10;T11) identify, compare, and analyze attributes or properties of angles (i.e., number of angles) or sides (i.e.,
number of sides or length of sides) of two and three-dimensional shapes develop vocabulary to describe attributes and define classes of shapes such as triangles and pyramids use composition or decomposition of shapes to identify, describe, or distinguish among triangles,
squares, rectangles, rhombi, trapezoids, hexagons, or circles demonstrate congruence and similarity of shapesGrade Four (G+M) 4-1; 4-3; 4-4; 4-5; 4-10 (T9;T14;T15;T19) identify, compare, and analyze attributes of angles (i.e., number of angles) or sides (i.e., number of
sides, length of sides, parallelism or perpendicularity) identify, describe or distinguish among triangles, squares, rectangles, rhombi, trapezoids, hexagons, or
octagons classify angles relative to 90 degrees as more than, less than, or equal to identify, compare, or describe three-dimensional shapes (e.g., rectangular prisms, triangular prisms,
cylinders, or spheres)
36
demonstrate congruence of geometric shapes using reflections, translations, or rotations such as flips, slides, turns
make and test conjectures about geometric properties describe similarity (i.e., apply scales on maps, apply characteristics of same shape but different
proportional size, to identify similar figures) compose or decompose shapes using models or explanationsGrade Five GLE M(G&M)5-1,5-3,5-5 identify, compare, and analyze attributes of angles (right, acute, or obtuse) or sides (number of
congruent sides, parallelism, or perpendicularity) to identify, describe, classify, or distinguish among different types of triangles (right, acute, obtuse, equiangular, or equilateral) or quadrilaterals (rectangles, squares, rhombi, trapezoids, or parallelograms) [Topic 8]
use properties (numbers of bases, shape of bases, number of lateral faces) to identify, compare, describe, or build models of three-dimensional shapes (rectangular prisms, triangular prisms, cylinders, spheres, pyramids, or cones)[Topic 13]
describe the proportional effect on the linear dimensions of triangles and rectangles when scaling up or down while preserving angle measures, or by solving related problems (including applying scales on maps) using models or explanations. [Topic 8/Social Studies Curriculum]
Grade Six (GLE G&M 6-1, 6-5) use properties of sides and angles in isosceles and equilateral triangles and parallelograms to solve
problems identify, describe, or classify triangles by lengths of sides (equilateral, isosceles, or scalene) or by
measures of angles (right, acute, obtuse, or equiangular) identify, describe, or classify quadrilaterals (rectangles, squares, rhombi, trapezoids, or parallelograms)
by lengths of sides, measures of angles, number of congruent sides, parallelism, or perpendicularity identify, compare, or describe three-dimensional shapes (rectangular prisms, triangular prisms,
cylinders, spheres, pyramids, or cones) using three-dimensional models and two-dimensional representations
identify bases, shape of bases, number of lateral faces, number of bases, number of edges, and number of vertices in the above-mentioned three-dimensional shapes
recognize the relationships among similar figures by drawing similar and non-similar figures (e.g., angles, side lengths, perimeter)
recognize corresponding angles
37
identify, describe, or classify angles by their measure (right, acute, or obtuse) draw similar and non-similar figures on a coordinate gridGrade Seven (GLE G&M 7-1, 7-2, 7-5) show that any two similar figures are related by a scale factor (5-5, 5-6) recognize the areas of similar figures grow by the square of the scale factor (While studying scaling, the
teacher must be sure to pose problems that help students make this connection.) use the concept of similar figures to solve problems in the real world (e.g., shadow method, mirror
method, congruent triangles) (5-5) recognize similar figures and be able to tell why they are similar (5-5) apply properties of similar figures by describing the impact scaling up or down has on angle measures,
linear dimensions and areas of polygons and circles (5-5) use properties of angle relationships (adjacent angles, vertical angles, straight angles) when two or
three lines intersect to solve problems (7-2) use properties of two parallel lines cut by a transversal to solve problems apply the triangle inequality theorem (sum of the lengths of any two sides of a triangle is greater than
the length of the third side) (7-3) calculate the sum of the interior angles of a regular polygon (for a polygon with n sides, (n-2)180 is the
sum of the interior angles of a polygon (page xxxv)Grade Eight (GLE G&M 8-1, 8-2, 8-5, 8-6) identify and apply the Pythagorean Theorem to find missing lengths on right triangles (3-2, 3-3) solve problems using properties of angle relationships (adjacent, straight, vertical angles) when two or
three lines intersect or two parallel lines are cut by a transversal (7-1, 7-2) determine the impact on surface area and volume when scaling an object (8-4, 8-9 The teacher must
carefully assign problems to help students make this connection.) recognize that volumes of similar objects grow by the cube of the scale factor (8-9 The teacher must
carefully assign problems to help students make this connection.)
Standard: Specify locations and describe the spatial relationships using coordinate geometry and representational systems.Students will demonstrate the ability to:Kindergarten (G+M) K-9 (T7) describe the arrangement, order, and position of objects (e.g., on top of, underneath, beside, between,
38
etc.) follow simple navigation directions (e.g., forward, backward, near, next to) find and describe the location of objects in a picture (i.e., scene)Grade One (G&M) 1-9 (T8) name and interpret relative positions in two-dimensional and three-dimensional space (e.g., in front,
behind, above, etc.) follow and give navigational directions or right, left, forward, and backward to get a person to a location find and describe location of objects on a simple map (e.g., neighborhood)Grade Two M(G&M) 2-9 (T-16) use appropriate language to describe relative positions (e.g., right, left, diagonal, etc.) navigate in space by giving directions from one place to another (e.g., number of steps, turns) find and compare(e.g., near, far) locations on a simple coordinate system or map (e.g., north, south,
east, west) Grade Three M(G&M) 3-9; (T20) apply coordinate systems to specify locations and to describe paths find location on a coordinate grid using positional words or compass directions interpret and give directions from one location to another using positional words Grade Four (G+M) 4-9 (T17) make and use coordinate systems to specify locations and to describe paths find the distance between points along horizontal and vertical lines of a coordinate system give directions between locations on a map or coordinate grid (first quadrant) plot points in the first quadrant in context (e.g., games, maps) find the horizontal and vertical distances between points on a coordinate grid in the first quadrantGrade Five GLE M(G&M)5-9 make and use coordinate systems to specify locations [Topic 17] find the distance between points along horizontal and vertical lines of a coordinate system [Topic 17] interpret and give directions between locations on a map or coordinate grid (all four quadrants) [Topic
17] plot points in four quadrants in context (e.g., games, mapping, identifying the vertices of polygons as
they are reflected, rotated, and translated) [Topic 17/Social Studies/Science Curriculum] determine horizontal and vertical distances between points on a coordinate grid in the first quadrant
[Topic 17/Social Studies Curriculum]
39

Grade SixN/AGrade Seven compare slopes of parallel lines when examining figures (such as parallelograms) on a coordinate plane
(10-1 The teacher must carefully assign problems to help students see this relationship.) use coordinate geometry to examine shapes with pairs of parallel or perpendicular sides (10-1 The
teacher must carefully assign problems to help students see this relationship.)Grade Eight use relationships between slopes of parallel lines and perpendicular lines to solve problems (11-4) compare slopes of parallel and perpendicular lines when examining figures (such as parallelograms) on
a coordinate plane (11-4)
Standard: Apply transformations and use symmetry to analyze mathematical situations.Students will demonstrate the ability to:Kindergarten M(G&M) (T7)N/AGrade One (G&M) 1-1 (T8) recognize and match basic two-dimensional shapes in transformations (e.g., slides, flips, and turns) recognize line symmetry in simple two-dimensional shapesGrade Two M(G&M)2-4 (T11) recognize and create shapes that are transformations (e.g., slides, flips, and turns) recognize and create shapes that have line (i.e., mirror) symmetry using manipulatives (e.g., pattern
blocks, tiles) use line symmetry to demonstrate congruent parts within a shape Grade Three M(G&M) 3-4 (T19) predict and describe the results of sliding, flipping, and turning two-dimensional shapes determine if two-plane figures are congruent by matching identify line (mirror) symmetry in two-dimensional modelsGrade Four (G+M) 4-4(T19) describe a motion or series of motions that will show that two shapes are congruent identify line and rotational symmetry in two-dimensional modelsGrade Five GLE M(G&M)5-10
40

match congruent figures using reflections, translations, or rotations (e.g., flips, slides, or turns) or by composing or decomposing shapes [Topic 19]
identify line and rotational symmetry in two- and three-dimensional models [Topic 19]Grade Six (GLE G&M 6-4, 6-5) recognize and describe flips and turns with respect to triangles and parallelograms describe and produce a transformation predict and describe reflections, translations, and rotations to show congruence (including degree of
rotation) predict and describe the transformational steps that result from composing and decomposing two- and
three-dimensional shapes using models or explanations recognize and apply line and rotational symmetry to demonstrate congruent parts within a shape use line symmetry in three-dimensional models to solve problemsGrade Seven (GLE G&M 7-4, 7-5) describe and produce a transformation (10-5, 10-6, 10-7) identify corresponding parts of similar figures once the figures have been transformed (slide, flip,, turn,
scaling) (10-5, 10-6, 10-7) apply concepts of congruency using the coordinate plane when solving problems; recognize that any
shape translated or rotated placed exactly on top of another are congruent figures (10-5, 10-6, 10-7) use transformations to examine congruence and similarity (10-5, 10-6, 10-7)Grade EightN/A
Standard: Use visualizations, spatial reasoning, and geometric modeling to solve problems.Students will demonstrate the ability to:Kindergarten M(G&M) K-1 (T8) recognize a shape or pattern of dots using spatial (visual) memory describe different sides of a three-dimensional object recognize basic two-dimensional shapes in the natural environmentGrade One (G&M) 1-1; 1-3 (T8) reproduce images of basic designs of dots and shapes using spatial (visual) memory recognize shapes from different perspectives (e.g., match front, back, and sides to an object) recognize geometric shapes (two-dimensional and three-dimensional) in the natural environment
41

Grade Two M(G&M) 2 -1; 2-2 (T-11) reproduce images of geometric designs based on spatial (visual) memory recognize and represent shapes from different perspectives (i.e., draw faces of a 3D wooden block) recognize geometric shapes and structures in the environment and specify their locationGrade Three M(G&M) 3 -1; 3-4 (T-11) build, compare, copy, and draw geometric objects such as triangles, squares, rectangles, rhombi,
trapezoids, hexagons, and circles describe and create mental images of objects, patterns, and paths identify and build models of rectangular prisms from three-dimensional representations use geometric models to solve problems in other areas or disciplines identify, build, and draw a two-dimensional representation of a three-dimensional objectGrade Four M(G&M) 4 -1; 4-4; 4-10 (T-11) copy, compare, build, and draw models of triangles, squares, rhombi, trapezoids, hexagons, octagons,
and circles create and describe mental images of objects, patterns and paths identify and build a three-dimensional object from a two-dimensional representation of that identify and draw a two-dimensional representation of a three-dimensional object use geometric models to solve problemsGrade Five GLE M(G&M)5-10 build and draw various geometric objects[Topic 8] build models of rectangle and triangle prisms, cones, cylinders, and pyramids from two-dimensional or
three-dimensional representations [Topic 13] identify and draw a two-dimensional representation of a three-dimensional object [Topic 13] use geometric models to solve problems in other areas of mathematics and other disciplines as well as
to solve problems in everyday life [Topic 13]Grade Six (GLE G&M 6-1) sketch angles using benchmarks find precise angle measures using a protractor use two-dimensional objects to build a three-dimensional representation (visa versa) use angles and angle measures in real life applications Grade Seven (GLE G&M 7-10) sketch three dimensional solids (8-8)
42
draw nets (flat patterns) of rectangular prisms, triangular prisms, cylinders, pyramids and use these nets as a tool for finding surface area (8-9)
identify the concept of surface area as wrapping an object (8-9) solve problems to determine volume when given a two-dimensional drawing of a rectangular prism,
triangular prism, cylinder, or pyramid; express measurements using appropriate units (8-10) find the area of a circle when given one of the following measurements: diameter, radius, or
circumference (8-5) find the area and perimeter of composite figures (8-1, 8-3, 8-4) find the surface area of rectangular prisms, triangular prisms, cylinders, and pyramids; express
measurements using appropriate units (8-9) find the volume of rectangular prisms, triangular prisms, and cylinders; express measurements using
appropriate units (8-10) recognize and apply geometric ideas in relationships in art, science, and everyday life Teachers will
incorporate these types of problems.Grade Eight (GLE G&M 8-2, 8-6) represent the Pythagorean Theorem using models and algebraic symbols (3-3 and Pythagorean Puzzle
lesson) determine the length of a missing side of a right triangle, through modeling (3-3 and Pythagorean
Puzzle lesson) find unknown heights through similarity (4-7) solve problems to determine surface area and volume when given a two-dimensional drawing of a
rectangular or triangular prism, cylinder, pyramid, or cone; express measurements with appropriate units (8-4, 8-5, 8-6, 8-7)
Measurement
Standard: Understand measurable attributes of objects and the units, systems, and processes of measurementStudents will demonstrate the ability to:Kindergarten (G+M) K-7, K-8 (T9, T14) begin to order, compare, or describe objects according to size, length, height, and weight ,
temperature, and capacity (more/less)
43

describe that some events take place in the past, present or future determine elapsed time relating to calendar patterns (days of the week, yesterday, today, tomorrow) sequence the events in a day identify a clock and a calendar as measurement toolsGrade One (G&M) 1-6; 1-7; 1-8 (T8.T14.T15) use standard and nonstandard systems of measurement for length, weight, area, volume, and time and
temperature compare and order objects according to these attributes (i.e., longer than, heavier/lighter than) select the appropriate unit and tool for the attribute being measured use the unit of one minute and one hour use calendar time – days of the week, months of the year use the unit of one inch and one foot ***Grade Two M(G&M)2-6;2-7 (T13; T15) recognize measurement attributes: length (to the whole inch and foot and whole centimeter and
meter), volume, weight, perimeter, area, and time (to the hour by 15 min. intervals) compare and order objects according to these attributes; length, volume, weight, perimeter area and
time (using numerical values) understand how to measure using nonstandard and standard units (e.g., straight line, end to end) select an appropriate unit and tool for the attribute being measured. *** use equivalencies of 12 inches equals one foot; 100 centimeters equals one meter, and 60 minutes
equals one hour when solving problems. ***Grade Three M(F&A) 3-6; 3-7 (T16) compute perimeter of polygons draw the area of rectangles on grids using a variety of models express all measures using appropriate units measure length, weight, and volume and select an appropriate type of unit for measuring measure with standard units in the customary system carry out simple unit conversions when solving problems across content strands use units of measures appropriately and consistentlyGrade Four (G+M) 4-6; 4-7; 4-10 App. B (T14, T16) recognize perimeter of polygons on grids find the area of rectangles, polygons, or irregular shapes on grids using a variety of models,
44
manipulatives or formulas apply all measures using appropriate units (benchmarks: hour to 5 minute interval; day; year; 24 hours
in 1 day; 7 days in 1 week; 365 days in 1 year; 60 seconds in 1 minute; 60 minutes in 1 hour; C degrees and F degrees to 1 degree; quart to whole quart; kilogram to whole kilogram; gram to whole gram; pound to whole pound)
measure quantities such as length, area, weight, volume and size of angle measure with standard units in the customary and metric systems recognize that measurements are approximations and how differences in units affect precision apply what happens to measurements of a 2-dimensional shape such as its perimeter and area when
the shape is changedGrade Five GLE M(G&M)5-6,5-7 calculate the perimeter of polygons using models, manipulatives, or formulas [Topic 12] calculate the area of rectangles or right triangles through models, manipulatives or formulas [Topic 12] calculate the area of polygons or irregular figures on grids [Topic 12] convert the volume of rectangular prisms (cubes) using models, formulas or manipulatives [Topic 12] apply all measures using appropriate units (benchmarks: inch to 1/8 inch; foot; centimeter to 0.5
centimeter; meter to 0.5 centimeter; yard; mile (use in scale questions); kilometer (use in scale questions); 12 inches in 1 foot; 100 centimeters in 1 meter; 3 feet in 1 yard; 36 inches in 1 yard; 10 millimeters in 1 centimeter; hour to 1 minute; day; year; 24 hours in 1 day; 7 days in 1 week; 365 days in 1 year; 60 seconds in 1 minute; 60 minutes in 1 hour; C degrees and F degrees to 1 degree; quart to 1 ounce; gallon; pint; 32 ounces in 1 quart; 4 quarts in 1 gallon; 2 pints in 1 quart; kilogram; gram to whole gram; pound to 1 ounce; 16 ounces in 1 pound; angle degrees to 2 degrees [Topic 14]
use units of measures appropriately and make conversions within systems when solving problems across the content strands[Topic 14]
use standard units in the customary and metric systems [Topic 14/Science Curriculum] carry out simple unit conversions [Topic 14] determine what happens to measurements of two-dimensional shapes such as its perimeter and area
when the shape is changed [Topic 12]Grade Six (Teachers must make sure they embed these concepts throughout the year.) use both metric and customary systems of measurement convert from one unit to another within the same system solve problems using metric or customary measures
45
find precise and estimated angle measures Grade Seven (Teachers must make sure they embed these concepts throughout the year.) use both metric and customary systems of measurement convert from one unit to another within the same system (1-5, 3-6) select and use units of appropriate size and type to measure angles, perimeter, area, surface area and
volume Grade Eight (Teachers must make sure they embed these concepts throughout the year.) use both metric and customary systems of measurement convert from one unit to another within the same system (4-2) select and use units of appropriate size and type to measure angles, perimeter, area, surface area and
volume
Standard: Apply appropriate techniques, tools, and formulas to determine measurementsStudents will demonstrate the ability to:Kindergarten M(G&M) K-7 T4 use non-standard tools to compare length and weightGrade One M(G&M)1-6; 1-7 (T-14, T15) measure with non-standard and standard tools use appropriate tools to make comparisons and estimatesGrade Two M(G&M) 2-7 (T13. T14, T15) measure with multiple copies of the same size, (e.g., paper clips laid end to end) use repetition of a single unit to measure something larger that the unit, (e.g., measuring the length of
a room with a single meter stick) use appropriate tools to measure length, weight, volume, area, and time develop common referents for measures to make comparisons and estimates (body benchmarks)Grade Three M(G&M) 3 -6; 3-7 (T14, T16) estimate perimeters, area, and volumes of irregular shapes (benchmarks: quart to whole quart;
kilogram to whole kilogram; gram to whole gram; pound to whole pound) apply appropriate standard units and tools to measure length, area, volume, time, and temperature
(benchmarks: hour to 5 minute interval; day; year; 24 hours in 1 day 7 days in 1 week; 365 days in 1 year; C degrees and F degrees to 1 degree)
use benchmarks to estimate measurements (benchmarks: inch to ½ inch; foot to whole inch;
46
centimeter to whole centimeter; meter to whole centimeter) use formulas to find the area of a rectangle analyze the parts of rectangular solidsGrade Four M(G&M) 4 -6; 4-7 (T14, T15, T16 estimate perimeter, area and volume of irregular shapes apply standard units and tools to measure length, area, volume, weight, time, temperature and the size
of angles use benchmarks to estimate measurements use formulas to find area of rectangles and related triangles and parallelograms develop strategies to determine the surface areas and volumes of rectangular solids Grade Five GLE M(G&M)5-6,5-7 develop strategies for estimating perimeter, area, and volume of irregular shapes [Topic 12,14] select appropriate units and tools to measure length, area, volume, weight, time, temperature, and the
size of angles [Topic 12,14] use the benchmarks to estimate measurements use formulas to find the area of rectangles and related triangles and parallelograms [Topic 12] determine the surface area and volume of rectangular solids [Topic 12] Grade Six GLE G&M 6-6, 6-7 use different techniques for estimating areas and perimeters of non geometric figures determine area of triangles and quadrilaterals using models or formulas identify the area of an object as the number of unit squares needed to cover it determine perimeter of polygons using models or formulas (incorporating variables) identify the perimeter of an object as the number of units of length needed to surround it develop and use formulas to determine the circumference of circles and the area of triangles,
parallelograms, trapezoids and circles and develop strategies to find the area of more complex shapes determine volume of rectangular prisms using models or formulas solve problems involving perimeter, area, and volume using models or formulas describe the relationship of radius to diameter and diameter to circumference solve problems involving circle measures express all measures using appropriate units (linear, square, or cubic) measure and use units of measure (length, time, temperature, capacity, mass, weight, angles &
rotation) appropriately and consistently
47

Grade Seven (GLE G&M 7-5, 7-6) select and apply techniques and tools to accurately find surface area and volume (8-9, 8-10) construct nets (flat patterns) of rectangular and triangular prisms, cylinders, and pyramids to explore
the relationship between surface area of a box and the area of its faces (8-9) recognize the number of cubes in the bottom layer of a box prism is equal to the area of the base (8-10) develop strategies to determine the surface area and of selected prisms (rectangular and triangular),
pyramids, and cylinders (8-9, 8-10) develop strategies to determine the volume of selected prisms (rectangular and triangular), pyramids,
and cylinders (8-9, 8-10) solve problems involving scale factors, using ratio and proportion (5-2, 5-3, 5-4, 5-5, 5-6) solve simple problems involving rates and derived measurements for such attributes as velocity and
densityGrade Eight (GLE G&M 8-5, 8-6) (Teachers must embed these thinking strategies throughout instruction and problem solving.) use common benchmarks to select appropriate methods for estimating measurements solve simple problems involving growth and rates select and apply techniques to accurately measure the surface area and volume of rectangular prisms,
triangular prisms, cylinders, pyramids, or cones (8-3, 8-4, 8-5, 8-6, 8-7) apply concepts of similarity to determine the length of sides of similar triangles (4-4)
Data Analysis and Probability
Standard: Formulate questions that can be addressed with data and collect, organize and display relevant data to answer them.Students will demonstrate the ability to:Kindergarten M(DSP) K-1 (T1) collect data about themselves – answer questions asked about themselves sort items into groups use picture graphs or objects to represent items in the groupsGrade One M(DSP) 1-1 (T15) develop simple questions to collect data about themselves sort the information and organize it into groups
48

use tally marks, objects, pictographs, bar graphs and pictures to represent dataGrade Two M(DSP)2-1 (T16) pose questions and gather data about themselves and their surroundings sort and classify objects according to their attributes and organize data about the objects represent data using objects, pictures and graphsGrade Three M(DSP) 3-1 (T20) interpret a given representation such as line plots, tally charts, tables, line graphs, or bar graphs to
answer questions related to the data collect data using observations, surveys and experiments recognize the differences in representing categorical and numerical data formulate a question and develop a plan to collect information to address the question answer questions related to the data Grade Four M(DSP) 4-1; 4-6 (T17) interpret a given representation using line plots, tables, bar graphs, pictographs, or circle graphs to
answer questions related to the data, to analyze the data, to formulate or justify conclusions, to make predictions, or to solve problems
recognize the differences in representing categorical and numerical data design investigations to address a question and consider how data-collection methods affect the nature
of the data setGrade Five GLE M(DSP)5-1 interpret a given representation using tables, bar graphs, circle graphs, or line graphs to answer
questions related to the data, to analyze the data to formulate or justify conclusions, to make predictions, or to solve problems [Topic 18/Science Curriculum]
collect data using observations, surveys, and experiments [Topic 18/Science Curriculum] recognize the differences in representing categorical and numerical data [Topic 18/Science Curriculum] Grade Six (GLE DSP 6-1, 6-3) formulate questions, design studies, and collect data about a characteristic shared by two populations
or different characteristics within one population and show findings in an appropriate display use bar graphs, tables, line graphs, and stem-and-leaf plots to display dataGrade Seven (GLE DSP 7-1, 7-3) create and interpret circle graphs, scatter plots, and histograms (11-1, 11-2) analyze data to formulate and justify conclusions
49
make predictions and solve problems based on a set of data use tables, line graphs, scatter plots, circle graphs, and stem and leaf plots to organize and display data
(11-1, 11-2, 11-3) distinguish between discrete and continuous data ( Teachers must provide examples that will help
students recognize the significance of these different representations.) interpret and analyze linear relationships represented on a graph (9-6) formulate questions and design a study that can be answered through the collection of data (11-7) identify or describe the best representation to display data or a situation (11-3, 11-4)Grade Eight (GLE DSP 8-3) identify the representation that best displays a given set of data or situation (9-9) formulate questions, design studies, and collect data about a characteristic shared by two populations
or different characteristics within one population (While studying graphic representations the teacher should have students use their knowledge to conduct and experiment or study.)
create and use histograms, box-and-whisker plots, line graphs, and scatter plots (9-2, 9-5, 9-6, 9-7)
Standard: Select and use appropriate statistical methods to analyze dataStudents will demonstrate the ability to:Kindergarten M(DSP) K-2 (T3) begin to make observations and comparisons between sets on a representation (i.e., picture graph, bar
graph, objects) Grade One M(DSP) 1-1 (T18) use mathematical language to interpret data from various representations (i.e., picture graph, bar
graph, table, chart) compare data (greater than, less than, same amount) within the same representation (i.e., picture
graph, bar graph, table or chart) Grade Two M(DSP) 2-1; 2-2; 2-6 (T16) use mathematical language to describe parts of the data and the set of data as a whole to determine
what the data showGrade Three M(DSP) 3-2; 3-3 (T20) analyze patterns, trends or distributions in data in a variety of contexts by determining or using most
frequent (mode), least frequent, largest, or smallest identify or describe representations or elements of representations that best display a given set of data
50

or situation using line plots, tally charts, tables or bar graphs compare different representations of the same data and evaluate how well each representation shows
important aspects of the data Grade Four M(DSP) 4-2; 4-3 4-4; 4-6 (T17) analyze patterns, trends, or distributions in data in a variety of contexts by determining or using
measures of central tendency (median or mode), or range describe the shape and important features of a set of data and compare related data sets with an
emphasis on how the data are distributed use counting techniques to solve problems involving combinations or simple permutations (i.e., given a
map—determine the number of paths from point A to point B) using a variety of strategies (i.e., organized lists, tables, tree diagrams, or others)
design investigations to address a question and consider how data-collection methods affect the nature of the data set
Grade Five GLE M(DSP)5-2,5-3 analyze patterns, trends, or distributions in data in a variety of contexts by determining or using
measures of central tendency (mean, median, or mode) or range to analyze situations, or to solve problems [Topic 18/Science Curriculum]
identify or describe representations or elements of representations that best display a given set of data, or situation, consistent with the representations required in tables, bar graphs, circle graphs or line graphs Topic 18/Science Curriculum]
describe the shape and important features of a set of data and compare related data sets, with an emphasis on how the data are distributed [Topic 18/Science Curriculum]
Grade Six (GLE DSP 6-2) compare sets of data using median and range use mean, median, and mode as ways to describe what is typical about a set of data use mean, median, mode and range to analyze situations and solve problems determine the effect of range and outliers on mean, median, modeGrade Seven (GLE DSP 7-2) analyze patterns, trends, or distributions of data to determine the effect on mean, median, mode (1-10) use mean, median, mode and range to analyze situations and solve problems (1-10) determine the effect of outliers on mean, median, mode (1-10) evaluate a data sample to determine bias (11-4)
51
Grade Eight (GLE DSP 8-1, 8-2, 8-3) compare data using mean, median, range, percentiles, and data displays (Chapter 9) compare data using tables, stem-and-leaf plots, histograms, and box-and-whisker plots (Chapter 9) describe the correspondence between data sets and their graphical representations (line graphs,
scatter plots, histograms, box-and-whisker plots) (Chapter 9) analyze data using patterns and trends of central tendency (mean, median, mode, dispersion (range),
outliers, quartile values, lines of best fit) (Chapter 9) analyze data displays to formulate or justify conclusions, make predictions or solve problems (Chapter
9)
Standard - Develop and evaluate inferences and predictions that are based on dataStudents will demonstrate the ability to:KindergartenN/AGrade One M(DSP) 1-2 (T18)N/AGrade Two M(DSP) 2-2 (T16) discuss events related to students’ experiences as likely or unlikely Grade Three M(DSP) 3-2 (T20) make and justify predictions that are based on data analyze data to formulate conclusions or to make predictions Grade Four (M(DSP) 4-2; 4-6 (T17; T20) propose and justify conclusions and predictions that are based on data and design studies to further
investigate the conclusions or predictions ask new questions and makes connections to real world situations decide the most effective method (e.g., survey, observation, experimentation) to collect data
(numerical or categorical) necessary to answer questions collect, organize, display, and analyze the data to draw conclusions about the question or hypothesis
being tested, and make appropriate predictionsGrade Five GLE M(DSP)5-3 propose and justify conclusions and predictions that are based on data and design studies to further
investigate the conclusions or predictions [Topic 18/Science Curriculum]
52
organize data using tables, bar graphs, or line graphs to answer questions related to the data; or to analyze the data to formulate or justify conclusions, to make predictions, or to solve problems [Topic 18/Science Curriculum]
Grade Six (GLE DSP 6-1, 6-6) interpret representations, including circle graphs, line graphs, and stem and leaf plots to justify
conclusions, make predictions/inferences, or solve problems decide the most effective method (e.g., survey, observation, experimentation) in response to a teacher
or student generated question or hypothesis to: collect the data (numerical or categorical) necessary to answer the question collects, organizes, and appropriately displays the data analyzes the data to draw conclusions about the question or hypothesis being tested when appropriate makes predictions asks new questions makes connections to real world situations
Grade Seven (GLE DSP 7-6) (Teachers must be sure to address all the areas in this standard when instructing in chapter 11.) use observations to make conjectures based on the differences between two or more samples (Chapter
11) analyze data and justify interpretations based on the data (Chapter 11) analyze data to draw conclusions or make predictions (Chapter 11)Grade Eight (GLE DSP 8-6) (Teachers must be sure to address all the areas in this standard when instructing in Chapter 9) use information drawn from samples to make conclusions about populations (Chapter 9) make conjectures about possible relationships between two characteristics of a sample on the basis of
scatter plots of the data and approximate lines of fit (Chapter 9) use conjectures to formulate new questions and plan new studies to answer them ( Chapter 9) decide the most effective way to investigate a teacher- or student-generated question or hypotheses
then carry out the investigation (Chapter 9) analyze data, make predictions, ask new questions, and connect the analysis to real world situations
(Chapter 9)
Standard: Understand and apply basic concepts of probability.
53
Students will demonstrate the ability to:KindergartenN/AGrade One M(DSP) 1-5 (T18)N/AGrade Two M(DSP) 2-4; 2-5 (T16)N/AGrade Three M(DSP) 3-4; 3-5; 3-6 (T20) determine the likelihood of the occurrence of an event (using “more likely,” “less likely,” or “equally
likely”) gather data, predict the probability and draw simple conclusions find all possible combinations and arrangements within certain constraints involving a limited number
of variables predict the likelihood of an event using “more likely,” “less likely,” “equally likely,” certain, or
impossible and test the prediction through experiments determine if a game is fair collect, organize, and appropriately display the dataGrade Four M(DSP)4-4; 4-5; 4-6 (T20) show a probability event in which the sample space may or may not contain equal outcomes and
determine the theoretical probability of an event and express the result as part to whole (e.g., two out of five)
describe events as likely or unlikely and discuss the degree of likelihood using such words as certain, equally, likely and impossible
predict the probability of outcomes of simple experiments and test the predictionGrade Five GLE M(DSP)5-5,5-6 identify a probability event in which the sample space may or may not contain equally likely outcomes
[Topic 20] determine the experimental or theoretical probability of an event and express the result as a
fraction[ Topic 20, Topic 9] predict the likelihood of an event as a fraction and test the prediction through experiments; and
determine if a game is fair[Topic 20] describe events as likely and unlikely and discuss the degree of likelihood using words such as certain,
54
equally, likely, and impossible [Topic 20] predict the probability of outcomes of simple experiments and test the predictions [Topic 20] obtain probabilities of the likelihood of an event with the representation of a number such as from 0-1
[Topic 20] select the most effective method (e.g. survey, observation, experiment) to collect data (numerical or
categorical) necessary to answer the questions or hypothesis being tested [Topic 18] collect, organize and appropriately display data, then analyze it to draw conclusions about the question
or hypothesis [Topic 18] make predictions about a question or hypothesis and ask new questions and make connections to real
world situations [Topic 20]Grade Six (GLE DSP 6-4, 6-5) use organized lists, tables, tree diagrams, models and the Fundamental Counting Principle to compute
probabilities for simple compound events explain the difference between theoretical and experimental probability predict the theoretical probability of an event and tests the prediction through experiments/simulations
and designs fair games compute the theoretical and experimental probability of an event in a problem solving situationGrade Seven (GLE DSP 7-4, 7-5) identify the differences between finding probability and odds (12-1) compare and contrast experimental and theoretical probabilities (12-1, 12-2) determine experimental or theoretical probabilities of events in problem solving situations (12-1, 12-2) predict the theoretical probability of an event then test the prediction through experiments and
simulations use probability with proportionality to make predictions use the following counting techniques to solve problems involving combinations and permutations:
organized lists, tables, tree diagrams, area models, and the Fundamental counting Principle (12-3, 12-4) (The teacher must take time to make sure students understand how to use an area model as a counting technique.)
Grade Eight (GLE DSP 8-4, 8-5) determine experimental or theoretical probabilities of events in problem solving situations then
compare and contrast these probabilities (10-1) predict the theoretical probability of an event then test the prediction through experiments and
55

simulations (10-2) use the following counting techniques to solve problems involving combinations and permutations:
organized lists, tables, tree diagrams, area models, and the Fundamental counting Principle (12-3, 12-4) (The teacher must take time to make sure students understand how to use an area model as a counting technique.)
Mathematics Content Standards by Course9-12
Algebra I
56
Standard: Students will understand numbers, ways of representing numbers, relationships among numbers, and number systems. Students will demonstrate the ability to: Compare two numbers with and without a number line, including:
o whole numberso integerso rational numberso irrational numbers
Represent the same number in a variety of ways; including:o fractionso decimalso percents
Apply the properties of the real number system; including:o associativeo commutativeo distributiveo identities and inverses
Factor numbers using primes and composites; including:o prime factorizationo exponential representation
Standard: Students will understand meanings of operations and how they relate to one another.Students will demonstrate the ability to: Combine like terms. Apply the order of operations to simplify expressions Compute powers and roots Use basic operations to solve one variable equations and inequalities by isolating variables, including
one-step, two-step, multi-step and equations with variables on both sides Use basic operations to solve simple radical equations Graph linear equations by plotting points Recognize and use the direct variation, slope-intercept form, and standard form of a line for graphing Solve and graph linear inequalities by:
o isolating the variable
57
o knowing the difference between an equation and an inequalityo graphing an inequality on a number lineo graphing a compound inequality on a number lineo graphing an inequality in the coordinate planeo knowing that multiplying or dividing by a negative reverses the direction of the inequality
Solve systems of linear equations and inequalities by using the following methods:o graphingo substitutiono elimination
Solve equations which contain rational expressions by:o identifying rational expressionso applying operations to solve rational equationso using the Euclidean Algorithm to simply rational expressionso analyzing problem situations involving percentages
Solve quadratic equations by factoring, which includes:o recognizing quadratic equationso finding the greatest monomial factoro factoring using reverse Foil or Division methodo applying the zero product property
Use polynomials, including:o identifying, adding, and subtracting polynomials and their partso identifying and factoring using a common monomial factoro multiplying and dividing polynomialso recognizing special binomials (square binomial, perfect squares, difference of squares)
Judge the reasonableness of answers Use permutations and combinations as counting techniques
58
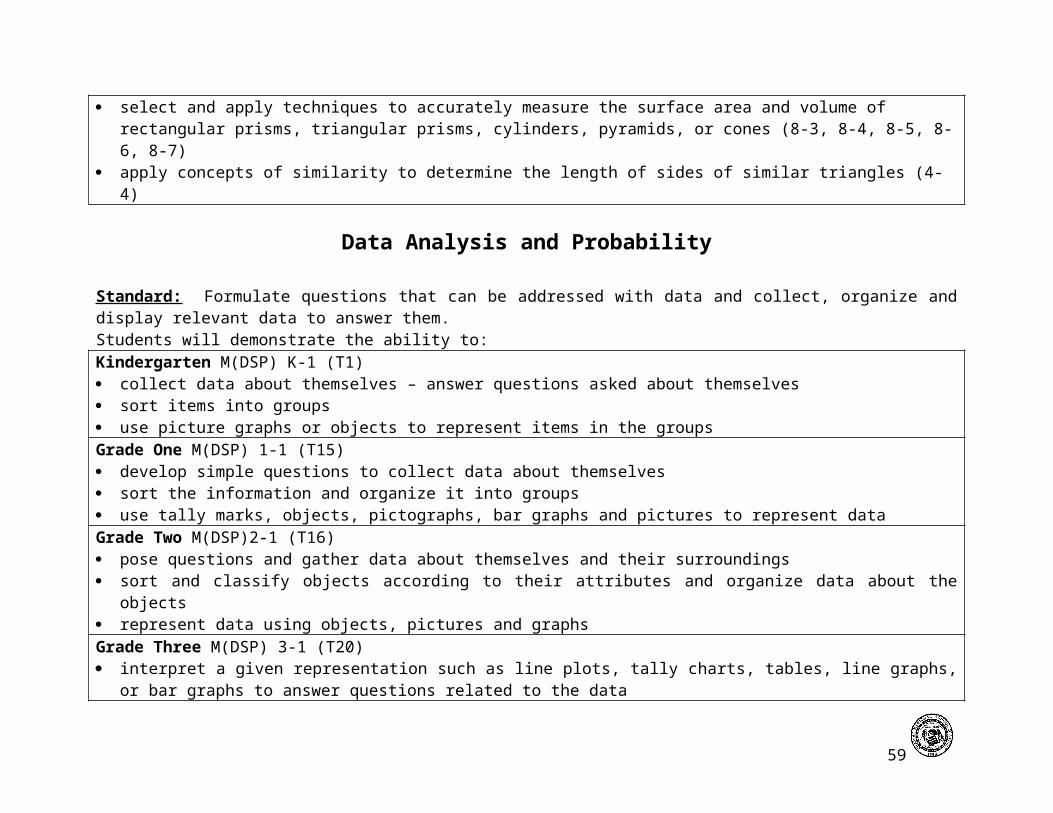
Standard: Students will compute fluently and make reasonable estimates.Students will demonstrate the ability to: Add, subtract, multiply, and divide whole numbers, integers, and rational and irrational numbers using
mental or paper-and-pencil calculations for simple cases and technology for complicated caseso Calculate benchmark perfect squares and related rootso Determine or estimate the part of a number using percents and related fractions
Judge the reasonableness of solutionsStandard: Students will understand patterns, relations, and functions.Students will demonstrate the ability to: Define, compare, and contrast the ideas of relation and function Determine the difference between the independent and dependent variables Analyze functions of two variables by investigating rates of change, intercepts, and zeros Compare the properties of classes of functions, including linear, quadratic, and exponential functionsStandard: Students will represent and analyze mathematical situations and structures using algebraic symbols.Students will demonstrate the ability to: Explain the meaning of equivalent forms of expressions, equations, inequalities, and relations, write
equivalent forms of equations, inequalities, and systems of equations and solve them with fluency—using mental or paper-and-pencil calculations for simple cases and technology for complicated cases
Translate words into algebraic symbols and equations Use symbolic algebra to represent and explain mathematical relationships Judge the reasonableness of solutionsStandard: Students will use mathematical models to represent and understand quantitative relationships.Students will demonstrate the ability to: Model and solve word problems using various representations (graphs, tables, equations) and
determine the class of functions that best models the relationship Draw reasonable conclusions about a situation being modeledStandard: Students will analyze change in various contexts.Students will demonstrate the ability to: Approximate, interpret, and calculate rates of change from graphical and numerical dataStandard: Students will explore algebra using technology.Students will demonstrate the ability to:
59

Graph linear, quadratic, and exponential functions using graphing technology Determine best fit lines for a set of data Graph scatter plots using graphing technology Use word processing and spreadsheet tools to communicate solutions to complex problems
o Analyze intercepts, domain, range, maximum and minimum valueso Analyze rates of change
Standard: Students will specify locations and describe spatial relationships using coordinate geometry and other representational systems.Students will demonstrate the ability to: Use Cartesian coordinates to analyze algebraic situationsStandard: Students will understand measurable attributes of objects and the units, systems, and processes of measurement.Students will demonstrate the ability to: Make decisions about units and scales that are appropriate for problem situations involving
measurementStandard: Students will apply appropriate techniques, tools, and formulas to determine measurements.Students will demonstrate the ability to: Solve complex problems involving ratios and proportions Use the factor label method to assist in computationStandard: Students will formulate questions that can be addressed with data and collect, organize, and display relevant data to answer them.Students will demonstrate the ability to: Understand scatter plots and use them to display data Determine measures of central tendencies for a set of data
Algebra II
60

Standard: Students will understand numbers, ways of representing numbers, relationships among numbers, and number systems. Students will demonstrate the ability to: Determine the sets of numbers to which a given number belongs Use properties of the real number system to simplify expressions Apply the real number properties to the complex number system Compare and contrast the real number properties to the matrix propertiesStandard: Students will understand meanings of operations and how they relate to one another.Students will demonstrate the ability to: Use the order of operations to evaluate expressions Solve equations using the properties of equality Solve and graph basic inequalities, compound inequalities, and absolute value inequalities Recognize and use direct variation, slope-intercept, and the standard form of lines when graphing Determine if two lines are perpendicular, parallel, or neither based on either graphs or equations Solve special types of equations such as:
o quadratic equationso certain cubic equationso absolute value equationso exponential equationso logarithmic equationso radical equationso equations with rational exponents
Solve systems of two and three variable linear equations using:o substitutiono linear combination / eliminationo Cramer’s Ruleo inverse matrices
Solve systems of two variable inequalities by graphing Find the value of second order determinants Solve problems by using matrix logic Add/subtract/multiply and find inverses of matrices Evaluate the determinant of 2x2 and 3x3 matrices both with and without technological aid
61

Add/subtract/and multiply a variety of polynomial expressions Divide polynomials using:
o polynomial long division o synthetic division
Factor polynomials Simplify radical expressions and rationalize the denominators Add/subtract/multiply/divide radical expressions Write expressions with rational exponents Solve equations containing radicals Solve quadratic equations by:
o factoringo completing the squareo using the quadratic formula
Write equations for parabolas, circles, ellipses, and hyperbolas Solve systems of equations and inequalities involving quadratics both graphically and algebraically;
including:o simplify and evaluate expressions and solve equations using the properties of logarithms
Standard: Students will compute fluently and make reasonable estimates.Students will demonstrate the ability to: Determine what two whole numbers a square root is between Add/subtract/multiply/divide whole numbers, integers, rational numbers, irrational numbers, real
numbers, and complex numbers using mental math or paper-and-pencil calculations
62

Standard: Students will understand patterns, relations, and functions.Students will demonstrate the ability to: Determine whether a relation is a function Define and use relations and functions Recognize different types of functions based on their graphs, such as:
o linear functionso quadratic functionso cubic functionso absolute value functionso greatest integer functionso exponential functionso logarithmic functionso power functions
Standard: Students will use mathematical models to represent and understand quantitative relationships.Students will demonstrate the ability to: Use logarithms to solve problems involving exponential growth and decayStandard: Students will analyze change in various contexts.Students will demonstrate the ability to: Calculate the slope of a line based on graphical or algebraic information Use direct, inverse, or joint variation to solve problemsStandard: Students will explore algebra using technology.Students will demonstrate the ability to: Graph linear, quadratic, cubic, logarithmic, absolute value, and exponential functions using graphing
technology Graph scatter plots using graphing technology Determine best fit lines for linear and quadratic sets of data Use word processing and spreadsheet tools to communicate solutions to complex problems Graph and determine the zeros of functions using a graphing calculator
63

Standard: Students will analyze characteristics and properties of two- and three- dimensional geometric shapes and develop mathematical arguments about geometric shapes.Students will demonstrate the ability to: Compare and contrast the properties and equations of circles, ellipses, parabolas, and hyperbolas Determine the placement of a point in space given an ordered tripleStandard: Students will specify locations and describe spatial relationships using coordinate geometry and other representational systems.Students will demonstrate the ability to: Graph a wide variety of functions and conic sections Determine the distance between two points Determine the midpoint of a line segment Determine the points of conic sections based on the equation Determine the focal points of parabolas, ellipses, and hyperbolas based on equationsStandard: Students will apply transformations and use symmetry to analyze mathematical situations.Students will demonstrate the ability to: Graph quadratic functions written in vertex form with different values for h and k Apply the transformations of quadratics to other functions in similar forms Determine the inverse of a function knowing they are symmetric about the equation y = xStandard: Students will use visualization, spatial reasoning, and geometric modeling to solve problems.Students will demonstrate the ability to: Determine the center and radius of a circle from a graphStandard: Students will explore geometry using technology.Students will demonstrate the ability to: Graph a wide variety of functions and conic sections using graphing technologiesStandard: Students will understand measurable attributes of objects and the units, systems, and processes of measurement.Students will demonstrate the ability to: Use the Factor Label Method to change units and systems of measurement
64

Standard: Students will apply appropriate techniques, tools, and formulas to determine measurements.Students will demonstrate the ability to: Use formulas to solve problems Use the distance formula to determine the distance between two pointsStandard: Students will formulate questions that can be addressed with data and collect, organize, and display relevant data to answer them.Students will demonstrate the ability to: Find the linear equation that best fits a set of dataStandard: Students will select and use appropriate statistical methods to analyze data.Students will demonstrate the ability to: Represent and interpret data using line and stem-and-leaf plots Find and use the median, mode, and mean of a set of data to interpret the set Represent and interpret data by using box and whisker plots Calculate the standard deviation for a set of dataStandard: Students will develop and evaluate inferences and predictions that are based on data.Students will demonstrate the ability to: Predict future events or points based on a set of data or an equation
Statistics and Probability
Standard: Students will formulate questions that can be addressed with data and collect, organize, and display relevant data to answer them.Students will demonstrate the ability to: Distinguish between a population and a sample Distinguish between a parameter and a statistic Distinguish between qualitative and quantitative data Classify data with respect to the four levels of measurements Collect data using various methods Create a sample using various methods Construct frequency, distribution, histograms, polygons, relative frequency histograms, and ogives
Graph and interpret quantitative data sets using stem-and leaf plots, dot plots, pie charts, scatter plots, and time series charts
65
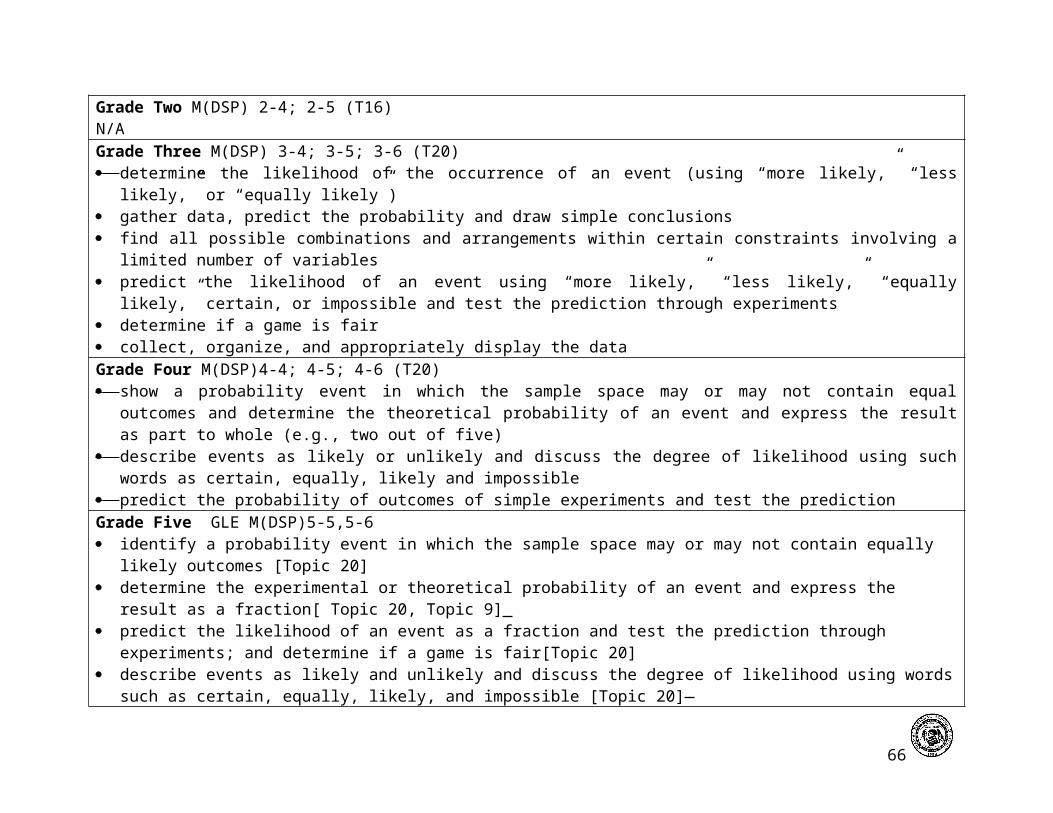
Find the mean, mean, mode, weighted mean, and mean of a frequency distribution Describe the shape of a distribution as symmetric uniform, or skewed and determine how to
compare the mean and median to each Construct discrete probability distribution and its graph Find the mean, variance, and standard deviation of a discrete probability distribution and its
expected value Find binomial probabilities using binomial probability formula, binomial probability table, and
technology Construct a binomial distribution and its graph Find the mean, variance, and standard deviation of a binomial probability distribution Find point estimate and a maximum error of estimate Construct and interpret confidence intervals for the population mean Interpret T- Distribution and use a T – Distribution table
Standard: Students will select and use appropriate stat methods to analyze the data.Students will demonstrate the ability to: Find the range of a data set Find the variance and standard deviation of a population and of sample Use the empirical rule to interpret standard deviation Approximate the sample standard deviation for grouped data Find the 1st, 2nd, and 3rd quartile of a data set Find the interquartile range of a data set Represent a data set graphically using box-and-whisker plot Find and interpret the standard score (z-score) Interpret other fractiles such as percentiles Perform a two-sample hypothesis test for large independent samples Understand, find, and use linear correlation, independent and dependent variables, and the types or
correlation Find the equation of a regression line; including:
o interpret the three types of variation about a regressive lineo find and interpret the coefficient of determinationo find and interpret the standard error of estimate for a regression lineo use technology to find a multiple regression equation, the standard error of estimate, and the
66

coefficient of determinationStandard: Students will develop inferences and predictions that are based on data.Students will demonstrate the ability to: Interpret graphs of normal probability distributions Estimate areas under a normal curve and use them to estimate probabilities for random variable with
normal distributions Find the areas under the standard deviation curve Make and interpret a decision based on the results of a statistical testStandard: Students apply basic concepts of probability.Students will demonstrate the ability to: Identify the sample space of a probability Distinguish among classical probability, empirical probability, and subjective probability Identify and use properties of probability Find probabilities of dependent and independent events and conditional probability Use the fundamental counting principles to find probabilitiesStandard: Students will carry out procedures such as those involving sets, arrangements, and their relationship with Algebraic and Boolean expressions and equations.Students will demonstrate the ability to: Determine the veracity of conjunctions, disjunctions, conditional, and biconditionals Determine the solution set of conjunctions, disjunctions, conditionals, and biconditionals Use Venn Diagrams to solve problems involving sets Prove tautologies using truth tables, direct proofs, and indirect proofs
Geometry*Plane and Spatial Applications
*Does not include theory development and proofs.Standard: Students will analyze characteristics and properties of two- and three- dimensional geometric shapes and develop mathematical arguments about geometric shapes.Students will demonstrate the ability to: Use the appropriate formulas (Theorems) to specify:
o angle, measure and congruence
67
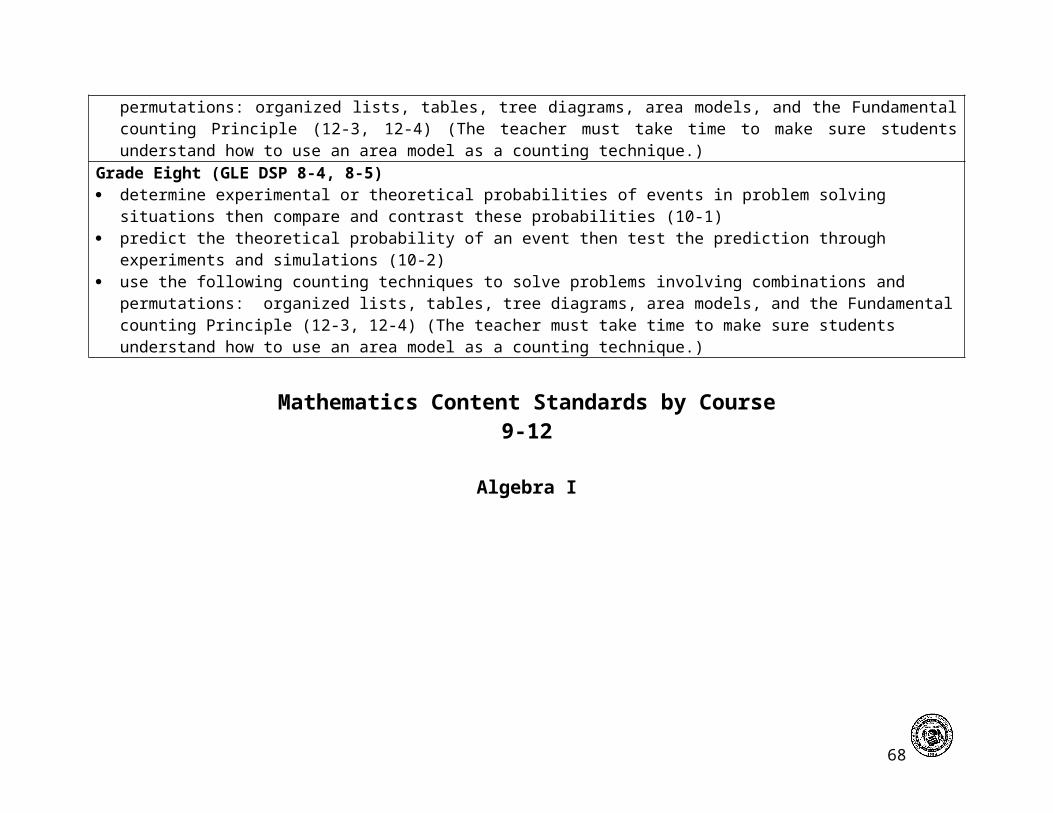
o segment length and congruenceo slope relationshipso triangle classificationso lateral areao surface areao volumeo center and radius of a circle
Apply the properties of congruence to prove theorems, particularly in the following triangle relationships:
o saso aaso ssso asa
Standard: Students will understand patterns, relations, and functions.Students will demonstrate the ability to: Identify a numerical pattern and use the appropriate technique to determine an nth term in the pattern Identify a complex geometric pattern and use an appropriate technique to determine an nth term in the
pattern Apply inductive reasoning in simple and complex problem solving Develop conjectures and use them in supporting solutions Identify and use counter-examples as a method of disproving conjectures Explain that lines, planes, and solids are one, two, and three dimensional figuresStandard: Students will analyze change in various contexts.Students will demonstrate the ability to: Use the distance formula to determine if 2 figures are an isometry Identify the transformation under which a preimage and image are occurring Apply construction proficiency for:
o angle bisectiono perpendicular bisectiono reflectionso rotations
Use the concept of orientation using prime notation
68
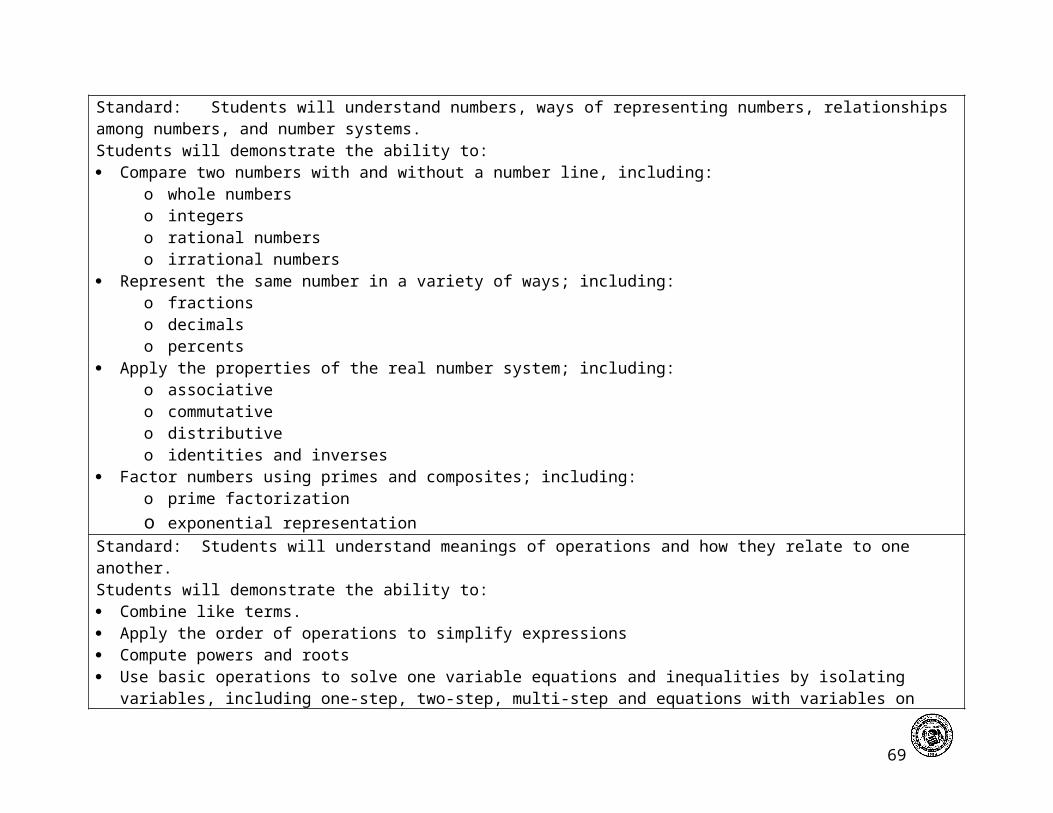
Use matrices vectors and graphs to represent translations Use the idea of isometry to understand congruenceStandard: Students will explore algebra using technology.Students will demonstrate the ability to: Graph linear functions using graphing technology Determine the bestfit line for a set of data Graph scatter plots using graphing technology Use word processing to communicate solutions to complex problemsStandard: Students will identify and show proficiency is using the appropriate formula/algorithms/theorems for finding: lengths of sides, perimeter area, angle measure and volume.Students will demonstrate the ability to: Use formulas/algorithms/theorems, such as:
o ½ apo mid pto ½ Bho distanceo (n-2)(180 ) no a²+ b²= c²o π r²o 2 π ro 30 · 60 · 90 relationshipso 45 · 45 · 90 relationshipso families of right DSo 1/3 Bho 4 π r²o 4/3 π r³ * (Proportions)
Standard: Students will specify locations and describe spatial relationships using coordinate geometry and other representational systems.Students will demonstrate the ability to: Use Cartesian coordinates to analyze algebraic situationsStandard: Students will apply transformations and use symmetry to analyze mathematical situations.
69
Students will demonstrate the ability to: Identify and use the different types of symmetry such as:
o reflectional/line symmetryo rotational symmetryo point/half turn symmetry
Use different types of symmetry in tessellations, including:o translational symmetryo glide reflectional symmetry
Use the properties of congruence to determine Isometrics Understand the idea of similarity to explain the transformations of redirection and enlargement Explain the idea of symmetry as congruence Compare and contrast similarity and congruenceStandard: Students will use visualization, spatial reasoning, and geometric modeling to solve problems.Students will demonstrate the ability to: Use two and three dimension geometric figures along with their related formulas to find areas and
volumes of complex problemsStandard: Students will explore geometry using technology.Students will demonstrate the ability to: Use technology to represent geometric figures in reports Use technology to construct two-dimensional objects, three-dimensional objects, or orthogonal views Understand the measurable attributes of objects and the units, systems, and processes of
measurement, including:o students will determine a maximum or minimum given a preset set of restrictions on the
dimensions of a variety of figures (for area and volume)o students will find and compare the area of a variety of geometric shapes with the same perimeter
and circumferenceo students will use rulers, protractors, and compasses effectively to solve problems and determine
area and volume measurements Use a transit to collect data
70
Standard: Students will understand measurable attributes of objects and the units, systems, and processes of measurement.Students will demonstrate the ability to: Use the Factor Label method to change:
o Units and systems of measurementso Quotient measureso Systems of measurements
Standard: Students will apply appropriate techniques, tools, and formulas to determine measurements.Students will demonstrate the ability to: Solve linear algebraic problems for a variety of purposes including:
o for angle measures in triangleo for angle measure in parallel lineso for angle measures in complimentary and supplementary situations
Precalculus
Standard: Students will understand numbers, ways of representing numbers, relationships among numbers, and number systems. Students will demonstrate the ability to: Convert between degrees, minutes, seconds and decimal forms for angles Find the arc length of a circle Convert from degrees to radians, radians to degrees Find the linear speed of an object traveling in circular motion Plot points using polar coordinates Convert from polar coordinates to rectangular and rectangular to polar Graph and identify polar equations by converting to rectangular equations Find products and quotients of complex numbers in polar form Use Demoivre’s Theorem Find complex roots
71
Standard: Students will understand meanings of operations and how they relate to one another.Students will demonstrate the ability to: Add and subtract vectors Add, subtract, multiply, and divide complex numbers Convert a complex number from rectangular form to polar form. Solve special types of equations, such as:
o quadratic equationso certain cubic equationso absolute value equationso exponential equationso logarithmic equationso radical equationso equations with rational exponentso trigonometric equations
Divide polynomials using:o polynomial long divisiono synthetic division
Standard: Students will compute fluently and make reasonable estimates.Students will demonstrate the ability to: Solve right triangles Solve triangles using law of sines and cosines Find area of trianglesStandard: Students will understand patterns, relations, and functions.Students will demonstrate the ability to: Find the value of trigonometric functions or acute angles Find the value of trigonometric functions utilizing fundamental identities Use the complementary angle theorem Find the exact value of the trigonometric functions for 30°, 45°, and 60° angles Find the exact value of the trigonometric functions for general angles Determine the signs of the trigonometric functions Find the reference angle given an angle
72
Find the exact value of the trigonometric functions using the unit circle Determine the domain and range of the trigonometric functions Determine the period of the trigonometric functions Use even-odd properties to find the exact value of the trigonometric functions Determine whether a relation is a function Define and use relations, functions, one-to-one functions, and onto functions Recognize different types of functions based on their graphs, such as:
o linear functionso quadratic functionso cubic functionso special nth degree polynomial functionso absolute value functionso exponential functionso logarithmic functionso power functionso trigonometric functions
Standard: Students will represent and analyze mathematical situations and structures using algebraic symbols.Students will demonstrate the ability to: Determine the amplitude and period of sinusoidal functions Find an equation of a sinusoidal function Determine the phase shift of a sinusoidal function Graph sinusoidal function Use analytic trigonometry to:
o establish trigonometric identitieso use sum and difference formulas to find exact valueso use sum and difference formulas to establish identitieso use double-angle formulas to find exact valueso use double-angle formulas to establish identitieso express products as sums and sums as productso find the exact and approximate value of an inverse trig function
Solve trigonometry equations, including:
73
o Solve equations involving a single trigonometry functiono Solve trigonometry equations that are in quadratic form
Solve trigonometry equation using identitiesStandard: Students will use mathematical models to represent and understand quantitative relationships.Students will demonstrate the ability to: Find a sinusoidal function from data Use logarithms to solve problems involving exponential growth and decayStandard: Students will analyze change in various contexts.Students will demonstrate the ability to: Use functions to determine if a set of data changes at a constant or exponential rateStandard: Students will explore algebra using technology.Students will demonstrate the ability to: Use a calculator to approximate the value of the trigonometric functions of acute angles Solve trigonometric equations using a graphing utility Find the real zeros of a function using a graphing utilityStandard: Students will analyze characteristics and properties of two- and three- dimensional geometric shapes and develop mathematical arguments about geometric shapes.Students will demonstrate the ability to: Determine the equation of special types of geometric shapesStandard: Students will specify locations and describe spatial relationships using coordinate geometry and other representational systems.Students will demonstrate the ability to: Graph vectors Find a position vector Find the angle between two vectors Find the direction angles of a vectorStandard: Students will apply transformations and use symmetry to analyze mathematical situations.Students will demonstrate the ability to: Graph transformations of the following functions:
o linear functionso quadratic functions
74

o cubic functionso special nth degree polynomial functionso absolute value functionso exponential functionso logarithmic functionso power functionso trigonometric functions
Standard: Students will use visualization, spatial reasoning, and geometric modeling to solve problems.Students will demonstrate the ability to: Solve right triangles and applied problems Use the law of sines to solve triangles and applied problems Use the law of cosines to solve triangles and applied problems Find the area of triangles using various trigonometry formulasStandard: Students will understand measurable attributes of objects and the units, systems, and processes of measurement.Students will demonstrate the ability to: Use the Factor Label Method to change units and systems of measurementStandard: Students will apply appropriate techniques, tools, and formulas to determine measurements.Students will demonstrate the ability to: Use a transit to collect data to find the area of an irregular plot of landStandard: Students will formulate questions that can be addressed with data and collect, organize, and display relevant data to answer them.Students will demonstrate the ability to: Use data to determine best fit functions to model that set of data
Calculus
75

Standard: Students will understand patterns, relations, and functions.Students will demonstrate the ability to: Define a function Define a relation Distinguish between function and relation Distinguish between 1:1 and onto functions Graph functions both with and without technologyStandard: Students will represent and analyze mathematical situations and structures using algebraic symbols.Students will demonstrate the ability to: Read and convert word problems into mathematical symbols Consider how two quantities are related and set up a related rate equation in terms of derivatives Solve differential equations Take problems dealing with work, distance, area, and volume and set up a related integral Solve problems with integralsStandard: Students will use mathematical models to represent and understand quantitative relationships.Students will demonstrate the ability to: Sketch an area or volume problem, represent it as a mathematical model, develop the appropriate
integral, and solveStandard: Students will analyze change in various contexts.Students will demonstrate the ability to: Depict related rates of change as derivatives in a differential equation and solve itStandard: Students will explore algebra using technology.Students will demonstrate the ability to: Graph a function Graph the derivative function Find a numerical derivative using NDER Find a numerical value of an integral using NINT Find the value of a limit by numerical methods and summing techniques
76
Standard: Students will analyze characteristics and properties of two- and three- dimensional geometric shapes and develop mathematical arguments about geometric shapes.Students will demonstrate the ability to: Graph and illustrate two-dimensional areas and three-dimensional volumes of solids in order to visualize
a figure prior to finding appropriate areas and volumesStandard: Students will specify locations and describe spatial relationships using coordinate geometry and other representational systems.Students will demonstrate the ability to: Graph on a Cartesian coordinate system functions representing rates of change, work, distance, and
volumeStandard: Students will apply transformations and use symmetry to analyze mathematical situations.Students will demonstrate the ability to: Use symmetry in graphing area and volume problems to simplify the integrals and the resulting
computationsStandard: Students will use visualization, spatial reasoning, and geometric modeling to solve problems.Students will demonstrate the ability to: Draw and visualize a geometric model of a solid and the slicing techniques prior to finding its volumeStandard: Students will explore geometry using technology.Students will demonstrate the ability to: Draw two-dimensional and some three-dimensional objects using technology to better visualize a figureStandard: Students will understand measurable attributes of objects and the units, systems, and processes of measurement.Students will demonstrate the ability to: Find the area of irregular shapes and non-constant functions Explain the concepts of area and volume Find the volume of curved and irregular solidsFind the length of a function between certain limitsStandard: Students will apply appropriate techniques, tools, and formulas to determine measurements.Students will demonstrate the ability to: Use appropriate integration techniques, formulas, or tables to find area, volume, work, or distance
77
Computer Programming
Computer programming is a sequence of two semester courses that teaches students critical thinking, problem solving, and teamwork skills through the application of programming methodology. The courses reflect a hands-on, project-based curriculum in which students learn the process of developing computer application programs in the language of C++.
Introduction to Computer Programming
This course introduces students to the fundamentals of computer programming, to simple control and data structures, and to basic operating system commands. Students will learn to design, code, and test their own programs. Technology standards are referenced.
Standard: Students will be familiar with and use the *Microsoft Visual C++ programming environment.Students will demonstrate the ability to:
Use the editor to enter programs Enter text and commands Delete, insert, and change text Compile, debug, and execute programs Explain the difference between syntax and run-time errors
*or most current equivalentStandard: Students will employ accepted programming methodology.Students will demonstrate the ability to:
Use good programming style Use white space properly Employ the use of case-sensitive commands for clarity Construct programs with meaningful identifiers Employ the proper steps to programming, including:
o prepare specifications for computer programso design solutions using computer programso develop the code for a program
78
o test programs for effectiveness and completenesso provide full documentation for a program
Employ proper program design process, including:o use step-wise refinement (top-down design) in programmingo employ program modularity in writing programso produce logical algorithms to solve problems with a computer program
Standard: Students will properly use language-fundamental commands and operations.Students will demonstrate the ability to: Use basic elements of the C++ programming language, including:
o declare and assign values to constants and variables in programso employ arithmetic expressions in programso Use promotion and type casting in arithmetic expressionso output text with formattingo demonstrate the ability to use input/output commands in programso input values into identifiers.o output values stored in identifiers.
Standard: Students will properly use data types.Students will demonstrate the ability to:
Use atomic data types in programs, including;o declare and use integer and long integer identifierso declare and use character identifierso declare and use floating point (double) identifierso declare and use Boolean identifierso declare and use constants
Use string data types in programs, including:o declare string identifierso input string identifierso output string identifierso compare string identifiers
79
o copy part or all of string identifiers into other stringso concatenate string identifierso locate and delete sub-string positionso insert strings into other strings
Standard: Students will properly employ control structures.Students will demonstrate the ability to: Use relational and logical operators in programs, including:
o compare values using relational operatorso form complex expressions using logical operatorso demonstrate how to use operator overloading in programs
Use decisions in programs, including:o employ simple IF structureso use IF-ELSE structureso write programs with nested IF-ELSE structureso make multiple-way selections using the CASE structure
Use loops in programs, including:o use initial, terminal, and incremental values in loopso construct both pre-test and post-test loopso demonstrate how to use counted loopso describe the use of flagged (sentinel-controlled) loopso utilize nested loopso explain how to avoid infinite loopso accumulate running totals using loops
Use recursion in programs, including:o create a recursive processo explain how to implement recursiono evaluate a recursive process
Standard: Students will properly employ functions.Students will demonstrate the ability to:
80

Use predefined functions in programs, including:o call functions in a programo use parameters to pass values to a functiono retrieve data from a function
Write user-defined functions in programs, including:o use value parameters to pass values to a functiono use default parameterso use the return statement to return a value from a functiono use reference parameters in a function.o understand the scope of identifiers in a functiono develop an overloaded functiono develop methodologies for building functions
Document functions in programs, including:o use pre-conditions and post-conditions in programso use function prototypes
Standard: Students will properly employ object-oriented programming techniques.Students will demonstrate the ability to: Design and implement classes using inheritance, including:
o use objectso use object data memberso use object member functionso understand constructorso pass an object as a parameter
Standard: Students will employ proper static data structures.Students will demonstrate the ability to: Use static arrays in program, including:
o declare arrayso initialize arrayso input data into arrays
81

o output data from arrayso perform operations on arrays
Perform simple searching and sorting routines, including:o perform sequential searches on arrayso perform a bubble sort on an arrayo perform a binary search on an array
Advanced Computer Programming
This course builds on the concepts introduced in Introduction to Computer Programming. Students will be introduced to file handling, event-driven programming using GUI techniques, and a more advanced utilization of previously introduced concepts. Technology standards are referenced.Standard: Students will properly use sequential files.Students will demonstrate the ability to:
Retrieve data from a text file, including:o understand how a stream processes characterso use the fstream libraryo read numeric and character data from a fileo test an attempt to open a file
Write data to a file, including:o use the ostream libraryo write numeric and character data to a fileo append a file.o remove and rename a file
Standard: Students will create and use a user-defined class.Students will demonstrate the ability to:
Create a user-defined class, including:o create default constructorso create private data memberso create member functions
82

Employ a user-defined class, including:o test class for error handlingo create a client program that will use the classo develop a utility library
Standard: Students will use more efficient searching and sorting algorithms.Students will demonstrate the ability to:
Search data structures in programs, including:o develop a binary searcho compare the efficiency of sequential and binary searches
Sort data structures in programs, including:o develop a selection sorto develop a merge sorto compare the efficiency of the various sorts
Standard: Students will properly employ event-driven programming techniques.Students will demonstrate the ability to:
Create a graphics program, including:o use the GUI libraryo set background coloro set draw coloro set thicknesso format texto set screen sizeo draw objects
Create “mouse click” events, including:o utilize the mouse to place an objecto determine “hit detection”o create message boxes
Standard: Students will apply appropriate programming skill as an effective member of a team.Students will demonstrate the ability to:
Apply knowledge to a programming project, including:
83

o formalize specificationso choose proper input parameterso choose appropriate data structures and processingo design appropriate outputo use appropriate test datao write clear documentation
Use teamwork and collaboration in a programming project, including:o divide a project among team memberso present work to a groupo coordinate work with others on teamo complete assigned work according to predetermined deadlineso participate in a peer performance evaluationo demonstrate professionalism in team relationships, communication and timeliness
84
Educator to EducatorAnnual Plan for K-8 Mathematics Instruction
K Timeline (Graphing & calendar daily / estimation is done monthly) COMMON FORMATIVE ASSESSMENT SeptemberGeometry, Problem Solving (spatial relationships) T2.1-2.4 SeptemberAlgebra, Geometry, Problem Solving (Sorting, Classifying, ordering objects by 1 attribute; name 2-dimensional shapes and describe their attributes) T1.1; 1.2; 1.4
October
Algebra, Problem Solving (Recognize, describe and extend a simple repeating pattern) T3.1 – 3.6
November - December
Numbers & Operations, Problem Solving, Geometry(whole numbers 0-5; recognize, name, write, represent; mentally add/subtract whole numbers) T4.1-4.9
January
Numbers & Operations, Problem Solving (Whole numbers 6-10; recognizing, naming, writing, representing) T4.1-4.9
February
Numbers & Operations, Problem Solving (Whole numbers 10-20; recognize, name, write, represent)
March
Numbers & Operations, Problem Solving (Monetary value, identify & name penny, nickel, dime)
April
Numbers & Operations, Problem Solving (Measurement; order, compare, describe objects according to size, height, weight, temperature, capacity)
May
Numbers & Operations, Problem Solving June
Grade One TimelineNumbers & Operations, Algebra, Problem Solving T1; T2 T3 SeptemberNumbers & Operations, Algebra, Problem Solving T4; T5 OctoberNumbers & Operations, Algebra, Problem Solving T6; T7 NovemberGeometry, Algebra, Problem Solving T8; T9 DecemberNumber & Operations, Algebra, Problem Solving T10; T11 JanuaryNumbers & Operation, Problem Solving T12 FebruaryNumbers & Operation, Problem Solving T13 February/MarchMeasurement, Problem Solving T14 MarchMeasurement, Problem Solving, Number & OperationsT15;T16 AprilAlgebra, Problem Solving T17; T18; T19 MayNumbers & Operation, Problem Solving T20 June
85
Grade Two Timeline ( * must supplement) Addition StrategiesT2; Understanding Addition & SubtractionT1 SeptemberSubtraction Strategies T3; Place Value Numbers to 100T4 October MID TRIMESTER COMMON FORMATIVE ASSESSMENT OctoberCounting Money T5 * NovemberEND OF TRIMESTER COMMON FORMATIVE ASSESSMENT NovemberGraphs and Probability T16; Mental Addition T6 DecemberMental Subtraction T- JanuaryMID TRIMESTER COMMON FORMATIVE ASSESSMENT JanuaryMeasurement: Length & Area T13 JanuaryMeasurement: Length & Area T13 (finish) FebruaryEND OF TRIMESTER COMMON FORMATIVE ASSESSMENT FebruarySubtracting 2-digit numbers T9 (finish) April MID TRIMESTER COMMON FORMATIVE ASSESSMENT AprilAddition and Subtraction T10 AprilGeometry T11 Fractions T12 NECAP Practice Assessment May June
Grade Three TimelineNumeration (Rational Numbers, relative magnitude) T1 SeptemberNumeration (cont) Adding whole numbers T2 OctoberMID TRIMESTER COMMON FORMATIVE ASSESSMENT OctoberSubtraction T3; T4 NovemberEND OF TRIMESTER COMMON FORMATIVE ASSESSMENT NovemberSubtraction T3; T4 (cont) Multiplication T5 DecemberMultiplication T5 (cont) Multiplication strategies T6 JanuaryMID TRIMESTER COMMON FORMATIVE ASSESSMENT JanuaryDivision Facts T8; Patterns & Relationships T9 Februarysolids 7 Shapes T10; Congruence & Symmetry T11 Fractions T12 MarchEND OF TRIMESTER COMMON FORMATIVE ASSESSMENT MarchDecimals & Money T13; Customary Measurement T14; Metric T15 AprilMID TRIMESTER COMMON FORMATIVE ASSESSMENT AprilPerimeter, Area & Volume T16; Time & Temperature T17 MayData. Graphs & ProbabilityT20 JuneEND OF TRIMESTER COMMON FORMATIVE ASSESSMENT June
86
Grade Four TimelineNumeration, Using Money, Counting Money, Making Change, Problem Solving T1 SeptemberAdding/Subtracting whole numbers w/regrouping T1; Addition Properties T2 Multiplication Meaning & Facts T3
October
MID TRIMESTER COMMON FORMATIVE ASSESSMENT OctoberDivision Meaning & Facts; Problem Solving T4 NovemberEND OF TRIMESTER COMMON FORMATIVE ASSESSMENT NovemberMultiplying by 1-digit numbers; Problem Solving T5; Patterns & ExpressionsT6; Equations & Problem Solving T18
December
T2 Multiplying by 2-digit numbers T7; Divide by 1-Digit Divisors, Problem Solving T8
January
MID TRIMESTER COMMON FORMATIVE ASSESSMENT JanuaryLines, Angles & Shapes, Problem Solving T9; Understanding Fractions, Problem Solving T9
February
Adding & Subtracting Fractions with Like DenominatorsT11; Understanding Decimals, Problem Solving T12
March
END OF TRIMESTER COMMON FORMATIVE ASSESSMENT MarchOperations with Decimals, Problem Solving T13; Area & Perimeter, Problem Solving T14
April
MID TRIMESTER COMMON FORMATIVE ASSESSMENT AprilSolids, Problem Solving T15; Measurement, Time & Temperature, Problem Solving T15
May
Data & Graphs, Problem SolvingT17; Transformations, Congruence & Symmetry, Problem Solving T19; Probability, Problem Solving T20
June
END OF TRIMESTER COMMON FORMATIVE ASSESSMENT June
Grade Five TimelinePlace Value- Topic 1, Decimals- Topic 1, Topic 2, Mental Math- Topic 2, Multiplication- Topic 2, Division- Topic 3, 4
Quarter 1
Division- Topic 5-1,5-2 only, Algebra- Topic 6, Geometry- Topic 8 Quarter 2Fractions- Topic 9, Topic 10, Measurement- Topic 12, Geometry- Topic 13 Quarter 3Algebra- Topic 15, Ratio & Percent- Topic 16, Algebra- Topic 17, Geometry & Measurement- Topic 19, Probability- Topic 20
Quarter 4
87
[Measurement- Topic 14, Graphs & Data- Topic 18 to be taught in Science]
Grade Six TimelineChapters 1, 2, & sections of Chapters 3, 7 & 12 Quarter 1Chapters 3, 4, 5 & 6 Quarter 2Chapters 7, 8, 9 & sections of Chapters 5, 6 & 11 Quarter 3Chapters 10, 11 & 12 Quarter 4
Grade Seven TimelineAccentuate the Negative SeptemberVariables and Patterns October – NovemberStretching and Shrinking November – JanuaryComparing and Scaling January – FebruaryFilling and Wrapping March – AprilWhat Do You Expect? April – MayData Around Us June
Grade Eight TimelineData Around Us SeptemberMoving Straight Ahead October – NovemberThinking With Math Models November – DecemberLooking for Pythagoras January – FebruaryGrowing, Growing, Growing February – MarchSay it With Symbols March – AprilSamples and Populations April – MayClever Counting May – June
88
Educator to EducatorSequence of Material Using Appropriate Text
Algebra 1A Algebra I – Integration, Applications, Connections
Glencoe Publishing - ISBN #0-07-825083-8
Unit 1: Expressions, Equations and Functions1.1 Variables and Expressions1.2 Order of Operations 1.3 Open Sentences1.4 Identity and Equality Properties1.5 Distributive Property1.6 Commutative and Associative Properties
Unit 2: Rational Numbers2.1 Rational numbers on the Number Line2.2 Adding and Subtracting Rational numbers2.3 Multiply Rational numbers2.4 Divide Rational numbers2.7 Square Roots and Real #s
Unit 3: Probability and Statistics2.5 Stem and leaf plots2.6 Probability and Odds13.4 Measure of variation13.5 Box and Whisker Plots
Unit 4: Equations3.1 Writing equations
89

3.2 Solving equations with addition and subtraction3.3 Solving equations with multiplication and division3.4 Solving multi-step equations3.5 Solving equations with variables on both sides3.6 Ratios and Proportions11.6 Similar Triangles3.7 Percent of change3.8 Solving equations and formulas3.9 Weighted Averages
Unit 5: Inequalities 6.1 Solving inequalities add/sub6.2 Solving inequalities mult/div6.3 Solving multi step inequalities6.4 Solving compound inequalities6.5 Solving Open Sentences Involving Absolute Value
Unit 6: Linear Equations and Coordinate Plane1.8 Graphs and Functions4.1 Coordinate Plane4.3 Relations4.4 Equations and relations4.5 Graph linear equations4.6 Functions4.8 Writing equations from patterns
Unit 7: Writing Linear Equations5.1 Slope5.2 Slope and Direct Variation5.3 Slope-intercept form5.4 Writing equations in slope-intercept form5.5 Writing equations in Point-Slope form5.6 Parallel and perpendicular lines
90
5.7 Scatter Plots and Lines of Fit6.6 Graphing linear inequalities
Unit 8: Systems of Equations7.1 Graphing systems of linear equations7.2 Substitution7.3 Elimination add/sub7.4 Elimination using multiplication7.5 Graphing systems of linear inequalities
Unit 9: Quadratic Equations10.1 Graphing quadratic equations10.2 Solving Quadratic Equations by Graphing10.4 Quadratic formula
Unit 10: Exponents and Polynomials8.1 Multiplying monomials8.2 Dividing by monomials8.3 Scientific notation8.4 Polynomials8.5 Add/sub polynomials8.6 Mult. poly by monomial8.7 Mult poly by poly8.8 Special products
Unit 11: Factoring9.1 Factors and GCF9.2 Factoring using the distributive property9.3 Factoring Trinomials no lead coefficient9.4 Factoring Trinomials with lead coefficient9.5 Factoring difference of squares9.6 Factoring perfect square trinomials
91
Unit 12: Radicals11.1 Simplifying Radical Expressions11.2 Operations with Radicals11.3 Radical Equations11.4 Pythagorean Theorem11.5 The Distance Formula11.7 Trigonometric Ratios
Unit 13: Rational Expressions12.2 Rational expressions12.3 Multiplying rational expressions12.4 Dividing rational expressions12.5 Dividing polynomials12.6 Rational expressions with like denominators12.7 Rational expressions with unlike denominators12.8 Mixed Expressions and Complex Fractions12.9 Solving Rational Equations
92
Algebra 1 B SyllabusAlgebra – Tools for a Changing World
Prentice Hall Publishing – ISBN #0-13-414384-1
Unit 1: Integers1.4 Add/Sub Integers1.5 Mult/Div integers1.8 Organize data in matrices1.3 Order of operations1.2 Modeling Relationships1.6 A review
Unit 2: Equations and Variables3.1 Modeling and solving equations3.2 Modeling and solving 2 step equations3.3 Like terms3.4 Distributive property3.5 Rational numbers and equation3.8 Percent of change3.7 Percent equations
Unit 3: Probability and Statistics1.1 Data relationships with graphs1.7 Experimental probability2.8 Probability formula3.6 Using Probability of 2 events11.6 Counting Outcomes and permutations11.7 Combinations
Unit 4: Inequality Equations4.1 Proportion4.2 Equations with variables on both sides
93

4.3 Absolute value equations4.4 Transforming formulas4.5 Solving inequalities using add/sub4.6 Solving inequalities using mult/div4.7 Solving multi step inequalities4.8 Compound inequalities and Absolute inequalities
Unit 5: Functions and Graphs2.1 Analyzing data and scatter plots2.2 Relating graphs to data2.3 Linking graphs to tables2.4 Functions2.5 Writing a function rule2.6 Three views of a function2.7 Families of functions
Unit 6: Linear Functions and Their Graphs5.1 & 5.2 Slope and Rate of Change5.4 & 5.3 Slope intercept and Direct Variation5.7 & 5.9 Standard form5.5 & 5.6 Scatter plots and writing the equation of a line5.8 Parallel and perpendicular linesUnit 7: Systems of Linear Equations6.1 Solving systems by graphing6.2 Solving systems by substitution6.3 Solving systems by elimination6.6 Graphing systems of linear inequalities6.4 Word problems involving systems
Unit 8: Quadratic Equations7.4 Square roots7.2 Exploring quadratics using tables7.1 Exploring quadratics
94

7.3 Graphing quadratics7.5 Solving quadratics7.6 Quadratic formula7.7 Using the discriminant
Unit 9: PolynomialsPacket9.1 Mult monomialsPacket9.2 Div. by monomialsPacket9.3 Scientific notationPacket9.4 PolynomialsPacket9.5 Add/sub polynomialsPacket9.6 Mult poly. X monomialPacket9.7 Mult polynomialsPacket9.8 Special products
Unit 10: FactoringPacket10.1 Factors and GCFPacket10.2 Factoring using the distributive propertyPacket10.3 Factoring TrinomialsPacket10.4 Factoring Differences of SquaresPacket10.5 Factoring perfect squaresPacket10.6 Solving equations by factoring
Unit 11: Right Triangles and Radical Expressions9.1 Pythagorean Theorem9.2 Distance Formula9.3 Trigonometric ratios9.4 Mult/Div radicals9.5 Equations with radicals
Unit 12: Rational Equations11.3 Mult/div rational expressions
95

11.4 Add/sub rational expressions11.5 Solving rational equations11.3 Simplifying rational expressions
Unit 1: Expressions, Equations1.1 Variables and Expressions1.2 Patterns and Sequences1.3 Order of Operations 1.5 Open Sentences
Unit 2: Properties and Functions1.6 Identity and Equality Properties1.7 Distributive Property1.8 Commutative and Associative Properties
Unit 3: Rational Numbers2.1 Integers and the Number Line2.3 Adding and Subtracting Integers/Multiply and Divide2.4 Rational numbers2.5 Add/Sub Rational #s
Unit 4: Rational #s and Square Roots2.6 Mult. Rational #s2.7 Div. Rational #s2.8 Square Roots and Rational #s2.9 Write equations
Unit 5: Probability and Statistics Part 11.4 Stem and leaf plots, 2.2 line plots3.7 Measure of central tendency
Unit 6: Equations
96
3.1 Solving equations with add/sub3.2 Solving equations with multi/div3.3 Multi. step equations3.4 Angles and Triangles using equations3.5 Solving equations with variables on both sides3.6 Solving equations and formulas
Unit 7: Ratio and Percent4.1 Ratios and Proportions4.2 Similar triangles4.4 Percents4.5 Percent of change
Unit 8: Inequalities7.1 Solving inequalities add/sub7.2 Solving inequalities mult/div7.3 Solving multi step inequalities7.4 Solving compound inequalities7.6 Open sentences with absolute value
Unit 9: Linear Equations and Coordinate Plane1.9 Graphs and Functions5.1 Coordinate Plane5.2 Relations5.3 Equations and relations5.4 Graph linear equations5.5 Functions5.6 Writing equations from patterns
Unit 10: Linear Equations6.1 Slope6.2 Point slope and Standard Form6.3 Scatter plot and Best fit lines
97
6.4 Slope intercept
Unit 11: Graphing Linear Equations and Inequalities6.5 Graph linear equations6.6 Parallel and perpendicular lines6.7 Mid point7.8 Graphing linear inequalities
Unit 12: Probability and Statistics Part 24.6 Probability and Odds5.7 Measure of variation7.7 Box and Whisker Plots
98
Scope and SequenceGeometry A & B – Geometry
Prentice Hall, ISBN# 0-13-050185-9
Chapter 1: Tools of GeometrySections:
1 Patterns and inductive reasoning2 Points, lines and planes3 Segments, rays, lines 4 Angles and segments 5 Good definitions6 Basic constructions7 Deductive reasoning8 The coordinate plane
Chapter 2: Investigating Geometric FiguresSections:
1 Triangles2 Polygons3 Parallel and perpendicular lines in a plane4 Classifying quadrilaterals5 Circles6 Congruent and similar figures7 Isometric and orthographic drawings
Chapter 3: Transformations Shapes in MotionSections:
1 Reflections2 Translations3 Rotations4 Compositions of reflections5 Symmetry6 Tessellations
99

7 Dilation
Chapter 4: Triangle RelationshipsSections:
1 Using Logical reasoning2 Isosceles triangle3 Preparing for proofs4 Mid segments of triangles5 Using indirect reasoning6 Triangle inequalities7 Bisectors and Locus8 Concurrent lines
Chapter 5: Measuring in the PlaneSection:
1 Perimeter and area2 Area of parallelograms and triangles3 Pythagorean Theorem and its converse4 Special right triangles5 Areas of trapezoid6 Areas of regular polygons7 Circles: circumference and arc length8 Areas of circles, sectors and segments
Chapter 6: Measuring in SpaceSection:
1 Space figures and nets2 Surface areas of prisms and cylinders3 Surface areas of pyramids and cones4 Volumes of prisms and cylinders5 Volume of pyramids and cones6 Surface areas and volumes of spheres7 Composite figures
100

8 Geometric probability
Chapter 7: Reasoning and Parallel LinesSection:
1 Parallel lines and related angles2 Proving lines parallel3 Constructing parallel and perpendicular lines4 Parallel lines and perspective drawing7-5 Skip
Chapter 8: Proving Triangles CongruentSection:
1 Proving triangles congruent: SSS and SAS2 Proving triangles congruent: ASA and AAS3 Congruent right triangles4 Using congruent triangles in proofs5 Using more than one pair of congruent triangles
Chapter 9: QuadrilateralsSection:
1 Properties of parallelograms2 Proving that a quadrilateral is a parallelogram3 Properties of special parallelograms4 Trapezoids and kites5 Organizing coordinate proofs6 Using coordinate geometry in proofs
Chapter 10: Skip*Can be covered if all other material is covered
Chapter 11: Right Triangle TrigonometrySection:
1 Tangent ratio
101

2 Sine and cosine ratios3 Angle of elevation and depression4 skip5 skip6 Trigonometry and area
Chapter 12: Chords Secants and TangentsSection:
1 Circles2 Properties of tangents3 Properties of chords and arcs4 Inscribed angles5 Angles formed by chords, secants, and tangents6 Circles and lengths of segments
102
Scope and SequenceModified Geometry – Geometry Concepts and Applications
Glencoe, ISBN# 0-07-845773-4
Chapter 1: Reasoning in Geometry1-1 Patterns and Inductive Reasoning Conjecture Counter Example Pascal’s Triangle with Integers and Polynomials
1-2 Points, Lines, Planes Vocabulary Difference Linear/Collinear Relate to Planes Difference Coplanar/Non Coplanar Relate to solids
1-3 Postulates (Definition/Examples) Compare to theorem
1-4 Conditional Statements ---- BiConditionals
1-5 Using the Compass and Protractor
Construction Segment and Angle Bisectors ------ Activity #1 – star on 92
1-6 Perimeter and Area Regular, Irregular, Composite * Problem solving -- Finding missing sides * Use Pythagorean 3 ways
Chapter 2: Segments and Coordinate Graphing2-1 A. Review Counting through irrationals B. Should do radicals (add, subtract, multiply, divide)
103

Origin and Absolute Value
2-2 Betweeness (Distance formula) Compare to counting
Properties from Real numbers
2-3 Congruence and Congruent Statements Thm 2-1, 2-2, 2-3 Mid point and mid point formula (Betweeness)
2-4 Coordinate Plane Quadrants ordered pair (Vertices of Regular Polys)
2-5 Mid Points on the # line a + b
2 on the Cartisian Coordinate Plane
x1 + x2 y1 + y2 = (x,y) 2 2
Chapter 3: Angles3-1
1) Vocabulary2) Classifications3) Interior/Exterior (w/Polygons)
3-21) Using the protractor to determine classifications2) Construct on angle
3-3 The Angle Addition Postulate1) Problem solving for X
104

2) Angle Bisector Construct again
3-4 1) Adjacent Angles2) Linear pairs
3-5 Complementary/supplementary angles1) Problem solving setting equal to 180° and 90°
3-6 Congruent Angles1) Vertical2) Transitive Property (Thm 3-4/3-5)3) Thm 3-64) Thm 3-7
3-7 Perpendicular Lines and Right Angles
Chapter 4: Parallel Lines and Planes 4-1 1) Lines } Parallel 2) Planes} Parallel
4-2 Parallel Lines and Transversals 1) Alt Exterior (Thm 4-3) 2) Alt Interior (Thm 4-1) 3) Corresponding (Postulate 4-1) 4) Consecutive (Thm 4-2) 5) Verticals
*All for Problem Solving*Parallel lines to Congruent Angles*Congruent Angles to Parallel Lines
6) Parallels and perpendicularity (Thm 4-4)
4-4 (no proofs)
105
4-5 Slope Parallel and Perpendicular 1) (Post 4-3) non verticals and slope DY
DX =M 2) Post 4-4 non verticals are perpendicular iff the have negative reciprocal slopes
product will equal (-1)
4-6 Equations of Lines1) Writing equations given m and b2) Writing equations finding m given b3) Writing Parallel or Perpendicular given above4) Converting from ax + by = c to slope Intercept form
Chapter 5: Classifying Triangles5-1 Classifying
1) The parts of a triangle3 angles3 sides
Classify by angles Classify by sides
5-2 Angles of a TriangleThm 5-1 The Triangle angle sum Theorem1) Problem solving based on 180°2) Linear problem solving/writing equations
Thm 5-2 The Acute angles in a right triangles are complementary
Thm 5-3 The measure of each angle in an equiangular triangle is 60°
5-3 Geometry in Motion1) Translations2) Reflections (and symmetry)
106

3) Rotation (Rotational and Pt Symmetry)4) Mapping and Vectors5) Isometrics
5-4 Congruent triangles1) Included Angles and sides2) SAS SSS ASA AAS3) Congruence statements (order of lettering)
Chapter 6: More about Triangles1) Medians A) Bisections B) Intersections
2) Altitudes and Perpendicular Bisectors A) Inside B) As a side C) Outside (Extended to get a 90°)A) Altitudes vs. MediansB) Perpendicular Bisector vs. AltitudeC) Perpendicular Bisector when and Altitude
3) Angle Bisectors in triangles4) Isosceles triangleThm 6-2 2 congruent sides = 2 congruent anglesThm 6-3 The median from vertex is perpendicular bisector and angle bisectorThm 6-4 Converse of Thm (6-2)
Relate to PythagoreanThm 6-6 (LL) 6-7 (HA) 6-8 (LA)Post 6-1 (HL)
6-6 Pythagorean Theorem 1) Relate to Counting
107

2) Relate to Distance formula 3) Pythagorean Triples
Chapter 7: 7-1 Skip
7-2 Exterior Angle Theorem 1) 360 = M of Exterior Angle of a Regular Polygon
n 2) The sum of the Remote interior angles is equal to the Exterior Angle 3) Thm 7-4 The exterior is greater than one or the other of the remote interior 4) Thm 7-5 In a Right Triangle the 2 remaining angles must be acute
7-3 Inequalities within a Triangle 5) Thm 7-6 Sides and angles proportionality Thm Thm 7-7 Converse of 7-6
Thm 7-8 Hypotenuse is always the longest side 6) Thm 7-9 Triangle Inequality Thm
The sum of 2 sides must be greater than the third side
Chapter 8: QuadrilateralsI. General 1) Definition 2) Convex/Concave 3) Diagonals 4) (n – 2)(80) = 360 5) Problem Solving with Interior Angles
II. Parallelograms Thm 8-2 opposite angles (Congruent) Thm 8-3 opposite sides (Congruent) Thm 8-4 Consecutive side supplementary Thm 8-5 Diagonals of Parallelogram Bisect each other
108

*Show proof of Diagonals congruent by SSS
Show symbols (mark up from angles and sides congruent)Thm 8-7 Parallelogram because 2 pair of opposite sides congruentThm 8-8 Parallelogram because 1 pair of opposite sides both parallel and congruentThm 8-9 If the diagonals bisect then quadrilateral is parallelogram
ClassifyingRectangles Rhombi, and Squares
Thm 8-10 Through 8-12
Diagonals congruent rectangle Diagonals rhombus perpendicular Diagonals of Rhombus bisect the pairs of opposite angles
(Visuals for all)
8-5 Trapezoids and Isos Traps
Vocabulary Bases ParallelsBase Angles and Congruences
Thm 8-13 Mid Points and medians Distance and mid point formulas
Chapter 9: Using Ratios and Proportions (similarly)1) Means and Extremes (Cross Products) (Thm 9-1)2) Problem Solving with proportions3) Similar Triangles and proportions4) Perimeter, Area, Volume and proportionality
9-2 Similar Polygons (Scale factor)
109
( Dilations)
9-5 Triangles and Parallel Lines (Project with Carpentry)1) Proof Rafters and Trusses2) Pitch3) Proportional Triangle
Chapter 10: Polygons1) Nets2) Naming3) Regular vs. non regular (n – 2)(180)
n4) Concave/convex5) Area of a rectangle and the change in area as the dimensions change marginally (graphing
calculator activity)
Thm 10-4 Area of a Trapezoid A = b2 + b2 · h 2
10 -5 Areas of Regular Polygons given perimeter and apothem
10-6 SymmetryPointLine ReflectionsRotationsTessellations
Chapter 11: CirclesCircumference and AreaWriting equations and solving for r (working backwards)Vocabulary
Central Angles
110
Central ArcsRadiusDiameterChordInscribed and Circumscribed
Chapter 12: SA and Volume1) Rectangular solids (prisms)2) Cylinders3) Cones4) Pyramids
111
Algebra II A Scope and SequenceGlencoe Algebra II
ISBN: 0-02-825178-4
Chapter 1: Analyzing Equations and InequalitiesSection 1 – Expressions and FormulasSection 2 – Properties of Real NumbersSection 3 – Integration: StatisticsSection 4 – Solving EquationsSection 5A – Using Tables to Estimate SolutionsSection 5 – Solving Absolute Value EquationsSection 6 – Solving InequalitiesSection 7 – Solving Absolute Value Inequalities
Chapter 2: Graphing Linear Relations and FunctionsSection 1 – Relations and FunctionsSection 2 – Linear Equations (Integrate Graphing Technology)Section 3 – SlopeSection 4 – Writing Linear EquationsSection 5 – Modeling Real World Data using Scatter PlotsSections 5B – Linear RegressionSection 6 – Special FunctionsSection 7 – Linear Inequalities
Chapter 3: Solving Systems of Linear Equations and InequalitiesSection 1A – Systems of EquationsSection 2 – Solving Systems of Equations AlgebraicallySection 3 – Cramer’s RuleSection 4 – Graphing Systems of InequalitiesSection 5 – Linear ProgrammingSection 6 – Applications of Linear Programming
112
Section 7 – Solving Systems of Equations in Three Variables
Chapter 4: Using MatricesSection 1A – MatricesSection 1 – Introduction of MatricesSection 2 – Adding and Subtracting MatricesSection 3 – Multiplying MatricesSection 4 – Matrices and DeterminantsSection 5 – Identity and Inverse MatricesSection 6 – Using Matrices to Solve Systems of EquationsSection 7 – Augmented MatricesSection 8 – Box-and-Whisker Plots
Chapter 5: Exploring Polynomials and Radical ExpressionsSection 1 – MonomialsSection 2 – PolynomialsSection 3 – Dividing PolynomialsSection 4 – FactoringSection 5 – Roots of Real NumbersSection 6 – Radical ExpressionsSection 7 – Rational ExponentsSection 8 – Solving Radical Equations and InequalitiesSection 9 – Complex NumbersSection 10 – Simplifying Expressions Containing Complex Numbers
Chapter 6: Solving Quadratic Functions and InequalitiesSection 1A – Quadratic FunctionsSection 1 – Solving Quadratic Equations by GraphingSection 2 – Solving Quadratic Equations by FactoringSection 3 – Completing the SquareSection 4 – The Quadratic Formula and the DiscriminantsSection 5 – Sum and Product of RootsSection 6 – Analyzing Graphs of Quadratic Functions
113

Section 7 – Graphing and Solving Quadratic InequalitiesSection 8 – Standard DeviationSection 9 – Normal Distribution
Chapter 7: Analyzing Conic SectionsSection 1 – Distance and Midpoint FormulasSection 2 – ParabolasSection 3 – CirclesSection 4 – EllipsesSection 5 – HyperbolasSection 6A – Graphing Conic SectionsSection 6 – Conic SectionsSection 7 – Solving Quadratic Systems
Chapter 8: Exploring Polynomial FunctionsSection 1 – Polynomial FunctionsSection 2 – Remainder and Factor TheoremsSection 3 – Graphing Polynomial Functions and Approximating ZerosSection 4 – Roots and ZerosSection 5 – Rational Zero TheoremSection 6 – Using Quadratic Techniques to Solve Polynomial EquationsSection 7 – Composition of FunctionsSection 8 – Inverse Functions and Relations
Chapter 9: Exploring Rational ExpressionsSection 1A – Rational FunctionsSection 1 – Graphing Rational FunctionsSection 2 – Direct, Inverse, and Joint VariationSection 3 – Multiplying and Dividing Rational ExpressionsSection 4 – Adding and Subtracting Rational ExpressionsSection 5 – Solving Rational Equations and Inequalities
114

Chapter 10: Exploring Exponential and Logarithmic FunctionsSection 1A – Exponential and Logarithmic FunctionsSection 1 – Real Exponents and Exponential FunctionsSection 2 – Logarithms and Logarithmic FunctionsSection 3 – Properties of LogarithmsSection 4 – Common LogarithmsSection 5 – Natural LogarithmsSection 6 – Solving Exponential EquationsSection 7 – Growth and Decay
Chapter 11: Investigating Sequences and Series (IF TIME)Section 1 – Arithmetic SequencesSection 2 – Arithmetic SeriesSection 3 – Geometric SequencesSection 4 – Geometric SeriesSection 5 – Infinite Geometric SeriesSection 6 – Recursion and Special SequencesSection 7 – FractalsSection 8 – The Binomial Theorem
115

Algebra II BAlgebra II B – Advanced Algebra
Prentice Hall – ISBN #0-13-050184-0
Chapter 1: Models, Functions, and Permutations – stress integration of technology into linear regression – “best fit” lines.
Section 1 – Collecting and Organizing DataSection 2 – Graphical ModelsSection 3 – Relations & FunctionsSection 4 – Working with FunctionsSection 5 – Moved to Chapter 10Section 6 – Omit – Counting Methods & PermutationsSection 7 – Real Numbers
Chapter 2: Linear Relationships and Functions*Section 1 – Linear Equation & Slope*Section 2 – Direct VariationSection 3 – Interpreting Linear FunctionsSection 4 – One-Variable Equations & InequalitiesSection 5 – Two-Variable Equations & InequalitiesSection 6 – Omit – Exploring Probability
*May reverse the order of these 2 sections if you wish
Chapter 3: Matrices – emphasis on use of graphic calculators especially with inverse on 3 X 3 and larger
matrices.Section 1 – Organizing Data into MatricesSection 2 – Adding & Subtracting MatricesSection 3 – Matrix MultiplicationSection 4 – Geometric Transformations with MatricesSection 5 – Networks
116

Section 6 – Identity & Inverse Matrices
Chapter 4: Linear SystemsSection 1 – Exploring & Graphing SystemsSection 2 – Solving Systems AlgebraicallySection 3 – Linear ProgrammingSection 4 – Omit – Graphs in 3-DimentionsSection 5 – Systems with 3 VariablesSection 6 – Inverse Matrices & Systems
Chapter 5: Quadratic Equations & FunctionsSection 1 – Modeling Data with Quadratic FunctionsSection 2 – Properties of ParabolasSection 3 – Comparing Vertex & Standard FormsSection 4 – Inverses & Square Root FunctionsSection 5 – Quadratic EquationsSection 6 – Complex NumbersSection 7 – Completing the squareSection 8 – The Quadratic Formula
Chapter 6: Polynomials & Polynomial FunctionsSection 1 – Power Functions & Their InversesSection 2 – Polynomials FunctionsSection 3 – Polynomials & Linear FactorsSection 4 – Solving Polynomial EquationsSection 5 – Dividing PolynomialsSection 6 – Omit – CombinationsSection 7 – Binomial Theorem – only simply pyramid expansions
Chapter 7: Exponential & Logarithmic FunctionsSection 1 – Exploring Exponential ModelsSection 2 – Exponential FunctionsSection 3 – Logarithmic Functions as Inverses
117
Section 4 – Properties of LogarithmsSection 5 – Exponential & Logarithmic EquationsSection 6 – Natural Logarithms
Chapter 10: Quadratic RelationsSection 1 – Exploring Conic SectionsSection 2 – ParabolasSection 3 – CirclesSection 4 – EllipsesSection 5 – HyperbolasInsert Section 5, Ch 1 – Vertical & Horizontal TranslationsReview Section 7, Ch 5 – Completing the SquareSection 6 – Translating Conic Sections
Chapter 8: Rational FunctionsSection 1 – Exploring Inverse VariationSection 2 – Graphing Inverse VariationSection 3 – Rational Functions & Their GraphsSection 4 – Rational ExpressionsSection 5 – Adding & Subtracting Rational ExpressionsSection 6 – Solving Rational EquationsSection 7 – Omit – Probability of Multiple Events
Chapter 12: Sequences & SeriesSection 1 – Mathematical PatternsSection 2 – Arithmetic SequencesSection 3 – Geometric SequencesSection 4 – Arithmetic SeriesSection 5 – Geometric SeriesSection 6 – Omit – Exploring Area Under a Curve
Chapter 9: Periodic Functions & Trigonometry (Complete this Chapter if there is time)Section 1 – Exploring Periodic Data
118

Section 2 – The Unit CircleSection 3 – Radian MeasureSection 4 – The Sine FunctionSection 5 – The Cosine & Tangent FunctionsSection 6 – Right Triangles & Trigonometric RatiosSection 7 – Oblique Triangles
119
Scope and SequenceStatistics and Probability Concepts
Logic Section: Chapter 2+3 – Mathematical IdeasAddison Wesley, ISBN# 0-673-99893-2
Statistics Section: Elementary Statistics-Picturing the WorldPrentice Hall, ISBN# 0-13-065595-3
I. Logic2. Sets
2.1 Basic concepts2.2 Venn diagrams and subsets2.3 Operations with sets2.4 Surveys and cardinal numbers
3. Logic3.1 Statements and Quantifiers3.2 Truth tables3.3 Conditionals3.4 More Conditionals3.6 Using truth tables to analyze arguments
II. Stats1. Intro to Stats
1.1 Overview1.2 Data classification1.3 Using technology in statistics
2. Descriptive Statistics2.1 Frequency distributions and their graphs2.2 More graphs and displays2.3 Central tendency2.4 Measures of variation2.5 Measures of position
120

3. Probability3.1 Basic concepts of probability3.2 Conditional probability3.3 Additional rule3.4 Counting procedures
4. Discrete Probability Distributions4.1 Probability distributions4.2 Binomial distributions4.3 Discrete probability distributions
5. Normal Probability Distributions5.1 Introduction to normal distributions5.2 Standard normal distribution5.3 Normal distributions: Finding probabilities5.4 Normal distributions: Finding values5.5 Central limit theorem5.6 Normal approximations to binomial distributions
6. Confidence Intervals6.1 Confidence intervals for the mean (Large samples)6.2 Confidence intervals for the mean (small samples)6.3 Confidence intervals for population proportions6.4 Confidence intervals for variance and standard deviation
7. Hypothesis Testing with One Sample7.1 Introduction to hypothesis testing
8. Hypothesis Testing with Two Samples8.1 Testing the difference between means
9. Correlation and Regression9.1 Correlation
121

9.2 Linear regression9.3 Measures of regression and prediction intervals9.4 Multiple regression
122
Scope and SequenceSAT Prep
Mathematical IdeasAddison Wesley, ISBN# 0-673-99893-2
I Review for SAT Test in Novembera) Review of all arithmeticb) Review of sets of numbersc) Review of order of operationsd) Review of rules of exponentse) Review of ratio and proportionf) Review of percentg) Review of linear equationsh) Review of quadratic equationsi) Four sample SAT tests given in class and discussed
123
PrecalculusScope and SequencePreCalculus, 5th ed
Prentice Hall, ISBN: 0-13-095402-0
1. Trigonometric Functions5.1 Angles and Their Measures5.4 Right Triangle Trigonometry 5.2 Trigonometric Functions: Unit Circle Approach5.3 Properties of Trigonometric Functions5.5 Graphs of Trigonometric Functions5.6 Sinusoidal Graphs; Sinusoidal Curve Fitting
2. Analytic Trigonometry6.1 Trigonometric Identities6.2 Sum and Difference Formulas6.3 Double-Angle and Half-Angle Formulas (Skip Half-Angle)6.4 Product-to-Sum and Sum-to-Product Formulas (Skip Sum-to-Product)6.5 The Inverse Trigonometric Functions6.6 Trigonometric Equations
3. Applications of Trigonometric Functions7.1 Solving Right Triangles7.2 The Law of Sines7.3 The Law of Cosines7.4 The Area of a Triangle
4. Polar Equations: Vectors8.1 Polar Coordinates8.2 Polar Equations and Graphs8.3 The Complex Plane; De Moivre’s Theorem8.4 Vectors8.5 The Dot Product
124
8.6 Vectors in Space
5. Equations and Graphs1.1 Topics from Algebra and Geometry1.2 Solving Equations1.3 Setting up Equations: Applications1.4 Inequalities1.5 Rectangular Coordinates; Graphs; Circles1.6 Lines1.7 Linear Curve Fitting
6. Functions and Their Graphs2.1 Functions2.2 More about Functions2.3 Graphing Techniques; Transformations2.4 Operations on Functions; Composite Functions2.5 Mathematical Models: Constructing Functions
7. Polynomial and Rational Functions3.1 Quadratic Functions; Curve Fitting3.2 Polynomial Functions3.3 Rational Functions3.4 Synthetic Division3.5 The Real Zeros of a Polynomial Function3.6 Complex Numbers; Quadratic Equations with a Negative Discriminant3.7 Complex Zeros; Fundamental Theorem of Algebra
8. Exponential and Logarithmic Functions4.1 One-to-one Functions; Inverse Functions4.2 Exponential Functions4.3 Logarithmic Functions4.4 Properties of Logarithms; Curve Fitting4.5 Logarithmic and Exponential Equations
125

4.6 Compound Interest4.7 Growth and Decay
9. Sequences; Induction; Counting; Probability (Optional)11.1 Sequences11.2 Arithmetic Sequences11.3 Geometric Sequences; Geometric Series11.4 Mathematical Induction11.5 The Binomials Theorem11.6 Sets and Counting11.7 Permutations and Combinations11.8 Probability
10. A Preview of Calculus: The Limit and the Derivative of a Function (Optional)12.1 Finding Limits Using Tables and Graphs12.2 Algebra Techniques for Finding Limits12.3 One-sided Limits; Continuous Functions12.4 The Tangent Problem; The Derivative
126

Scope & SequenceCalculus
Calculus: A Complete CoursePrentice Hall, ISBN# 0-201-44140-3
I. Review of Functionsa) Linear Functionsb) Quadratic functionsc) Cubic Functionsd) Exponential and logarithmic functionse) Trigonometric functions
II. Limits of Functionsa) Intuitive approach to limitsb) Right and left hand limitsc) Limits at infinityd) Definition of limits using epsilon, delta proofs
III. Derivatives of Functionsa) Definitionb) Derivatives of polynomial functionsc) Derivatives of products and quotientsd) Chain rule for derivativese) Second and third derivativesf) Implicit differentiation
IV. Derivatives of trigonometric Functions
V. Applications of Differentiationa) Related rate problemsb) Mean value theoremc) Rolle’s theorem
127

d) Critical pointse) Applications to curve sketchingf) Maximum and minimum problemsg) Newton’s method for approximating rootsh) Use of hl-der on TI-83 graphing calculator
VI. Integrationa) Area under a curveb) Definite integralc) Fundamental Theorem of Integral Calculusd) Differential equationse) Integration using tablesf) Numerical method of integration with Parabolic and Trapezoidal Rulesg) Finding integral values on the TI-89 calculator
VII. Applications of Integrationa) Area problemsb) Average value of a functionc) Volumes using slab methodd) Volumes using shell methode) Arc lengthf) Distance, velocity, acceleration, timeg) Work problems
VIII. Inverse Functionsa) Exponential functionsb) Logarithmic functionsc) Base ed) Bases other than ee) Applications to growth and decay problems
IX. Techniques of Integrationa) Integration by parts
128
b) Integration by partial fractions
129

CalculusCalculus – A Complete Course – Second Edition – © 2000
Course PhilosophyCalculus is a gateway to advanced training in most scientific and technical fields. It is a study of the behavior and changes of functions. Students develop an understanding of function behavior by using the unifying themes of continuity, limit, derivatives, integral, approximation, application, and modeling. Activities emphasize a multirepresentational approach with concepts, results, and problems being expressed graphically, numerically, algebraically, and verbally.
Technology is used regularly by students and teacher to reinforce the relationships among the multiple representations of functions, to confirm work, to perform investigations, and to assist in interpreting results.
Emphasis is placed on conceptual understanding, skills and techniques, and communicating ideas in both written and oral formats.
AssessmentEmphasis is placed on developing the student’s conceptual understanding through oral and written communication. Mathematical communication through written and oral presentations, class participation, completion of homework, and progress in learning the concepts and skills are valued. Assessment is done on a daily basis in order to determine where each student is in the learning process. As students respond to questions, explain solutions to problems, and participate in mathematical conversations, assessment becomes part of the natural flow of the classroom. Unit assessments are also given so students have a chance to show what they have learned. These assessments are problem-centered as well as skill-based and are written or oral presentations.
Time Frame
Unit Standard Functions, Graphs, and LimitsQuarter 1
130
Unit Standard DerivativesQuarter 2 and part of Quarter 3
Unit Standard IntegralsPart of Quarter 3 and Quarter 4
Grading Policy
Homework/Class Participation/Notebook 20%
Tests 40%
Quizzes 40%
Semester Exams 20 % of the semester averageJanuary: Functions, Graphs, Limits, and DerivativesJune: Derivatives and Integrals
131
Course Outline
Topics/Skills: Functions, Graphs, and Limits
Analysis of graphs With the aid of technology, graphs of functions are often easy to produce. The emphasis is on the
interplay between the geometric and analytic information and on the use of calculus both to predict and to explain the observed local and global behavior of a function.
Limits of functions (including one-sided limits) An intuitive understanding of the limiting process Calculating limits using algebra Estimating limits from graphs or tables of data
Asymptotic and unbounded behavior Understanding asymptotes in terms of graphical behavior Describing asymptotic behavior in terms of limits involving infinity Comparing relative magnitudes of functions and their rates of change
Continuity as a property of functions An intuitive understanding of continuity Understanding continuity in terms of limits Geometric understanding of graphs of continuous functions (Intermediate Value Theorem and
Extreme Value Theorem)
Topics/Skills: Derivatives
Concept of the derivative Derivative presented geometrically, numerically, and analytically Derivative interpreted as an instantaneous rate of change Derivative defined as the limit of the difference quotient
132

Relationship between differentiability and continuity
Derivative at a point Slope of a curve at a point Tangent line to a curve at a point and local linear approximation Instantaneous rate of change as the limit of average rate of change Approximate rate of change from graphs and tables of values
Derivative as a function Corresponding characteristics of graphs of f and f Relationship between the increasing and decreasing behavior of f and the sign of f The Mean Value Theorem and its geometric consequences Equations involving derivatives Verbal descriptions are translated into equations involving derivatives and vice versa
Second derivatives Corresponding characteristics of the graphs of f, f, and f Relationship between the concavity of f and the sign of f Points of inflection as places where the concavity changes
Applications of derivatives Analysis of curves, including the notions of monotonicity and concavity Optimization, both absolute (global) and relative (local) extrema Modeling rates of change, including related rates problems Use of implicit differentiation to find the derivative of an inverse function Interpretation of the derivative as a rate of change in varied applied contexts, including velocity,
speed, and acceleration
Computation of derivatives Knowledge of derivatives of basic functions, including power, exponential, logarithmic, trigonometric,
and inverse trigonometric functions Basic rules for the derivative of sums, products, and quotients or functions Chain rule and implicit differentiation
133

Topics/Skills: Integrals
Interpretations and properties of definite integrals Computation of Riemann sums using left, right, and midpoint evaluation points Definite integral as a limit of Riemann sums over equal subdivisions Definite integral of the rate of change of the quantity over the interval:
f (x) dx = f(b) f(a) Basic properties of definite integrals
Applications of integrals Appropriate integrals are used in a variety of applications to model physical, social, or economic
situations. The emphasis is on using the integral of a rate of change to give accumulated change or using the method of setting up an approximating Riemann sum and representing its limit as a definite integral. Specific applications include finding the area of a region, the volume of a solid with known cross sections, the average value of a function, and the distance traveled by a particle along a line.
Fundamental theorem of calculus Use of the Fundamental Theorem to evaluate definite integrals Use of the Fundamental Theorem to represent a particular antiderivative, and the analytical and
graphical analysis of functions so defined
Techniques of antidifferentiation Antiderivatives following directly from derivatives of basic functions Antiderivatives by substitution of variables
Applications of antidifferentiation Finding specific antiderivatives using initial conditions, including applications to motion along a line Solving separable differential equations and using them in modeling. In particular, studying the
equation y = ky and exponential growth
Numerical approximations to definite integrals
134
Use of Riemann and trapezoidal sums to approximate definite integrals of functions represented algebraically, geometrically, and by tables of values
135
ReferencesNavigating through Algebra in Grades 9-12. Virginia: National Council of Teachers of Mathematics, 2001.
New Standards Performance Standards Volume 3: High School. Washington, D.C.: National Center on Education and the Economy and the University of Pittsburg, 1998.
Principles and Standards for School Mathematics. Virginia: National Council of Teachers of Mathematics, 2000.
Grade Span Expectations
Grade 5: Envisions Math Series, Science Curriculum, Social Studies Curriculum
136


