42
Charles Schwab Bank CRA STRATEGIC PLAN January 1, 2016 – December 31, 2018

Charles Schwab Bank
CRA STRATEGIC PLAN
January 1, 2016 – December 31, 2018

2
Table of Contents
I. INTRODUCTION................................................................................................................................................ 3
II. DESCRIPTION OF INSTITUTION ......................................................................................................................... 3
A. OVERVIEW .................................................................................................................................................................. 3
B. FINANCIAL INFORMATION .............................................................................................................................................. 4
C. CURRENT PRODUCTS AND SERVICES ................................................................................................................................. 4
III. STRATEGIC PLAN BACKGROUND ...................................................................................................................... 4
A. ELECTION OF ALTERNATIVE CRA ASSESSMENT METHOD ...................................................................................................... 4
B. STRATEGIC PLAN EFFECTIVE DATE AND TERM .................................................................................................................... 5
C. IMPLEMENTATION ........................................................................................................................................................ 5
D. PUBLIC PARTICIPATION AND SUBMISSION PROCESS ............................................................................................................. 5
E. HISTORICAL PERFORMANCE ............................................................................................................................................ 6
IV. PERFORMANCE CONTEXT ................................................................................................................................ 6
A. OVERVIEW .................................................................................................................................................................. 6
B. CRA ASSESSMENT AREAS .............................................................................................................................................. 7
C. PERFORMANCE CONTEXT FOR THE RENO-SPARKS ASSESSMENT AREA ..................................................................................... 8
D. PERFORMANCE CONTEXT FOR THE SAN FRANCISCO BAY AREA ASSESSMENT AREA .................................................................. 14
V. COMMUNITY NEEDS ASSESSMENT ................................................................................................................ 19
A. CREDIT NEEDS OF THE RENO-SPARKS ASSESSMENT AREA: DETERMINATION AND RESPONSE ..................................................... 19
B. CREDIT NEEDS OF THE SAN FRANCISCO BAY AREA ASSESSMENT AREA: DETERMINATION AND RESPONSE .................................... 22
VI. STRATEGIC PLAN OVERVIEW .......................................................................................................................... 24
A. EXECUTION OF CRA STRATEGIC PLAN ............................................................................................................................ 25
B. CHARLES SCHWAB BANK CRA GOALS ............................................................................................................................ 26
VII. DEFINITIONS .................................................................................................................................................. 28
VIII. PLAN FRAMEWORK ........................................................................................................................................ 29
A. VOLUME GOALS ......................................................................................................................................................... 29
B. POINT MATRIX OVERVIEW ........................................................................................................................................... 30
C. LOANS AND INVESTMENTS............................................................................................................................................ 30
D. GENERAL .................................................................................................................................................................. 32
IX. POINT MATRICES FOR EACH PLAN YEAR ........................................................................................................ 33
X. APPENDIX A: NOTICE OF PROPOSED COMMUNITY REINVESTMENT ACT STRATEGIC PLAN ............................ 36
XI. APPENDIX B: MAPS AND CENSUS TRACT INFORMATION ............................................................................... 37

3
I. Introduction
Fulfilling the objectives of the federal Community Reinvestment Act (“CRA”) is of paramount importance to Charles Schwab Bank (the “Bank” or “Schwab Bank”). The Board of Directors has elected to have Schwab Bank’s performance record assessed pursuant to a CRA strategic plan, thereby leveraging the strengths of its business model to achieve meaningful impact. The Bank has generated very positive feedback from the community since adopting its 2012-2015 CRA Strategic Plan (the “2012 Plan”), including favorable recognition for its creative initiatives, flexible approach, leadership and high level of responsiveness to local needs.
The CRA Strategic Plan (“Plan”) contained herein encompasses the period from January 1, 2016 to December 31. 2018. As presented below, the Plan represents a guiding framework for Schwab Bank’s efforts to help meet the credit needs of the community, including low- and moderate-income (“LMI”) neighborhoods and individuals during the three-year Plan cycle. In preparing the Plan, we undertook an updated evaluation of community needs and market opportunities through statistical research and in-depth discussions with community stakeholders. This Plan builds on the Bank’s prior successes, while supporting new initiatives and broader partnerships that are aligned with emerging developments across the markets served by the Bank.
II. Description of Institution
A. Overview
Schwab Bank is a federal savings association headquartered in Reno, Nevada. The Bank opened its doors in April 2003, and is a wholly owned subsidiary of Charles Schwab Corporation (“CSC”), a savings and loan holding company based in San Francisco, California. CSC, through its principal subsidiary Charles Schwab & Co. (“CS&Co”), is primarily engaged in securities brokerage.
Schwab Bank has a unique business model that differs significantly from other more traditional “brick and mortar” bank models. The Bank’s products and services are marketed primarily to customers of the Bank’s affiliate in order to complement the range of financial services and products offered by CS&Co. Unique features of the Bank’s business model include:
Limited retail “bricks and mortar” presence in Reno, NV and the San Francisco Bay Area, CA;
Extensive use of internet and mobile delivery channel for client service;
Limited product set focused on CS&Co brokerage clients;
Narrow line of credit products with strong mortgage orientation; and
Nationwide customer base for products and services, with highest concentration in the state of California and several additional major metropolitan areas.
4
In 2012, Schwab Bank received approval from the Office of the Comptroller of the Currency (“OCC”), to operate under a strategic plan for purposes of assessing its CRA performance record (12 CFR §195.27) for the period October 1, 2012 – December 31, 2015. Given its non-traditional banking model, the Bank has elected to continue utilizing the strategic plan framework for its next evaluation.
B. Financial Information
At June 30, 2015 the Bank’s Call Report showed total assets of $122 billion, total liabilities of $114 billion, and total equity capital of $8 billion. The Bank’s assets were comprised of $9 billion in cash, $59 billion in mortgage backed securities (“MBS”), $40 billion in non-MBS securities, $14 billion in loans, and the remaining $505 million in other assets. The Bank’s liabilities were comprised of $113 billion in deposits and $784 million in other liabilities. The Bank’s tier one capital of $8 billion represented 17.71 percent of the Bank’s risk-weighted assets.
C. Current Products and Services
The Bank offers a narrow range of products that are primarily marketed to individual clients of CS&Co. Deposit products include interest-bearing checking accounts and savings accounts. Loan products include overdraft lines of credit, home equity lines of credit, residential mortgage loans for home purchase and refinance, and stock-secured personal loans. The Bank does not offer business lending products.
The Bank’s physical branch presence consists of thirteen branches, of which two are located in the Reno-Sparks, NV assessment area and eleven (including an employee-only branch located at CSC headquarters in San Francisco) located in the Bay Area, CA assessment area. Of the twelve public branches, only one in Reno is a stand-alone branch. The remaining eleven branches are domiciled in CS&Co brokerage branches. The Bank serves the vast majority of its customers by alternative delivery systems including the telephone, mail, a transactional internet website, mobile capabilities and other electronic means such as ATMs. Reflecting its business model, nearly all Bank clients are associated with broker-dealer relationships, and less than 1% of deposit transactions are made at Bank branches. Given its reliance on non-branch delivery systems, deposits are sourced and products are available nationally.
III. Strategic Plan Background
A. Election of Alternative CRA Assessment Method
Schwab Bank’s Board of Directors and management are committed to the goals set forth in this Plan. Pursuant to 12 CFR § 195.27(f)(4), if through unforeseen circumstances, Schwab Bank is unable to meet substantially all of the goals enumerated in this Plan to achieve a minimum “Satisfactory” rating, the Bank’s CRA performance should be assessed under the performance standards for large institutions, i.e., the Lending, Investment and Service Tests set forth in 12 CFR § 195.22-24.
5
B. Strategic Plan Effective Date and Term
The term of this Plan is 36 months, covering the period from January 1, 2016 through December 31, 2018. If there are material changes in the Bank’s product mix, geography, or volume projections that would have an impact on the goals enumerated in this document, the Bank will amend the Plan.
C. Implementation
The Bank’s CRA Committee is charged with responsibility for implementing the Bank’s CRA program. The CRA Committee is a sub-committee of the Bank’s Credit and Market Risk Oversight Committee (“CAMROC”) and is comprised of senior officers of the Bank and CSC. The Bank’s CRA Committee and CAMROC ensure that adequate resources are dedicated to the CRA program in order to implement the Bank’s Strategic Plan.
The Bank’s Board of Directors is responsible for approving the Strategic Plan, and may delegate such authority as it deems appropriate. Further, the Board is responsible for approving the Bank’s CRA assessment area(s), and for appointing the CRA Officer, who also serves as Chairperson of the CRA Committee. The CRA Officer oversees a team responsible for (i) developing, managing and coordinating CRA Plan implementation across business and support units, and (ii) providing Community Development Loans, Investments and Services, as defined below. The diverse backgrounds of other CRA Committee members help ensure that the CRA Strategic Plan is effectively administered.
D. Public Participation and Submission Process
A bank seeking approval of a CRA strategic plan is required to solicit public comment and undertake the following steps associated with the submission process. Specifically, 12 CFR § 195.27 of the Office of Comptroller of the Currency’s (“OCC”) regulation provides:
“. . . (d) Public participation in plan development. Before submitting a plan to the appropriate Federal Banking Agency for approval, a bank shall:
(1) Informally seek suggestions from members of the public in its assessment area(s) covered by the plan while developing the plan;
(2) Once the bank has developed a plan, formally solicit public comment on the plan for at least 30 days by publishing notice in at least one newspaper of general circulation in each assessment area covered by the plan; and
(3) During the period of formal public comment, make copies of the plan available for review by the public at no cost at all offices of the bank in any assessment area covered by the plan and provide copies of the plan upon request for a reasonable fee to cover copying and mailing, if applicable.
(e) Submission of plan. The bank shall submit its plan to the appropriate Federal Banking Agency at least three months prior to the proposed effective date of the plan. The bank shall also submit with its plan a description of its informal efforts to seek suggestions from members
6
of the public, any written public comment received, and, if the plan was revised in light of the comment received, the initial plan as released for public comment.”
During the first six months of 2015, the Bank conducted community outreach across its two assessment areas, including both group and one-on-one interviews with community stakeholders, community development practitioners and advocates. The input received from the community is incorporated in the Performance Context and Needs assessment sections below. Priorities discovered from our meetings and conversations with our community partners include the need for additional programmatic seed funding and nonprofit capacity building in Reno-Sparks, and additional financing for affordable housing in the assessment areas due to the lack thereof and the ever rising cost of housing.
E. Historical Performance
Schwab Bank received an Outstanding CRA Rating in its last CRA performance evaluation, covering the three year period ending December 31, 2013. Included in the evaluation was Plan Year 1 of its 2012-2015 Plan, which sets forth lending and investment goals consistent with this 2016-2018 Strategic Plan.
IV. Performance Context
A. Overview
Under the Plan, Schwab Bank plans to make CRA-qualifying loans and investments of at least $1 billion (“Lending and Investing Goal”) and provide at least 3,450 hours of community development services (“Services Goal”) over three years. This activity, to be conducted pursuant to the Plan, responds to the community needs identified by the Bank through its community Needs Assessment. Criteria for attaining Satisfactory and Outstanding ratings are set forth in the Point Matrix at the end of this document.
To best leverage the strengths of its business model, and to be most responsive to community needs, the Bank has developed strong partnerships with intermediaries and other third parties (together, “intermediaries”) to deploy capital into the community. With deep roots in the communities, these intermediaries are in a prime position to flexibly respond to the credit needs of low- to moderate-income populations across the assessment areas. While Schwab Bank has found many ways to deploy capital in its assessment areas, the Bank primarily utilizes three loan and investment programs to facilitate this intermediary strategy. The Community Needs Assessment set forth below provides strong evidence that these programs will successfully meet the credit needs of the community. All meet the core definition of Community Development:
1) Loans to Intermediaries, particularly CDFIs and structured loan funds serving a Community Development purpose.
2) Permanent loans to multi-family affordable housing.
3) Investments in Low Income Housing Tax Credits.

7
Intermediary lending is and will continue to be a priority for meeting the needs of its communities, both in the assessment areas and the Broader Statewide or Regional Area (“BSRA”). During the past five years, Schwab Bank has developed significant expertise in lending to Community Development Financial Institutions (“CDFIs”) both in its assessment areas and across the Western Region States. The Bank will emphasize its experience and contacts in CDFI lending in this Strategic Plan, and will continue to offer this type of lending to CDFIs throughout the Western Region, including its assessment areas. The Bank will not limit itself to intermediaries focused on affordable housing, but also community facilities, small business lending, microlending and other specific areas identified by our community partners as a critical need. In addition, the Bank intends to continue and expand its partnerships with CDFIs to provide more long-term permanent capital for affordable housing, which was stated as a critical need during our community outreach. Permanent loans for multi-family affordable housing allow developers to close funding gaps between what LIHTC and other subsidy provides and the true cost of the project. This will also be a continuing focus of the Bank.
As is the case with our peers, the Bank intends to be responsive to the needs of the community by investing in Low Income Housing Tax Credits (“LIHTC”). Consistent with the Bank’s intermediary strategy, it will invest through partnerships with fund sponsors and other investors.
Lending and Investing is accomplished primarily through the activity of the institution. With the exception of grants through the Charles Schwab Foundation, the Bank does not expect any other affiliate to contribute to the Lending and Investing Goal.
Services are accomplished through the activity of employees across CS&Co, though primarily through the activity of employees of Schwab Bank within the assessment areas. Services are often provided through deep and ongoing relationships with local partners to achieve sustainable outcomes by connecting partners, leveraging resources, providing thought leadership, and providing technical assistance, among other activities.
B. CRA Assessment Areas
The OCC rule implementing the CRA for federal savings associations (at 12 CFR §195.11 et seq.) requires that savings associations delineate one or more assessment areas in which the appropriate Federal banking agency shall evaluate the institution’s record of helping to meet community credit needs. A delineated assessment area is to consist generally of one or more Metropolitan Statistical Areas (MSAs) (using the MSA boundaries that were in effect as of January 1 of the calendar year in which the delineation is made) or one or more contiguous political subdivisions, such as counties, cities, or towns. In addition, the assessment area is required to include the geographies in which the bank has its main office, its branches, and its deposit-taking ATMs, as well as the surrounding geographies in which the bank has originated or purchased a substantial portion of its loans (including home mortgage loans, small business and small farm loans, and any other loans the bank chooses, such as those consumer loans on which the bank elects to have its performance assessed).
In accordance with 12 CFR § 195.27 this Plan comprises two assessment areas:

8
1. The Reno-Sparks Assessment Area includes one MSA, inclusive of the following Counties:
Reno-Sparks, NV Metropolitan Statistical Area (#39900)
Washoe County
Storey County
2. The San Francisco Bay Area Assessment Area (“Bay Area”) includes two MSAs, inclusive of the following Metropolitan Divisions and Counties:
San Francisco-Oakland-Hayward, CA Metropolitan Statistical Area #41860 (San Francisco MSA):
San Francisco – Redwood City – South San Francisco Metropolitan Division #41884
San Francisco County
San Mateo County
San Rafael Metropolitan Division #42034
Marin County
Oakland-Hayward - Berkeley, CA Metropolitan Division #36084
Alameda County
Contra Costa County
San Jose-Sunnyvale-Santa Clara, CA Metropolitan Statistical Area #41940 (San Jose MSA)
San Benito County
Santa Clara County
C. Performance Context for the Reno-Sparks Assessment Area
Schwab Bank has carried out a robust community development program in the Reno-Sparks area since it opened its doors in 2003. Since that time, in order to strengthen this region’s still-maturing community development infrastructure, the Bank has bolstered the capacity of local non-profits, brought in new lenders, and helped existing lenders broaden their reach in the market. Today, local conditions, while improved overall since the economic downturn, still signify areas of high need for LMI residents in the Reno-Sparks assessment area. The Bank will continue to carry out its high-impact initiatives to bring about positive change in this market. A key priority for the Bank has been to provide innovative grants and services that build community development infrastructure, thereby increasing the capacity of local organizations to serve local needs. The Bank has also facilitated entry into Reno-Sparks for two CDFIs and deepened existing relationships with highly responsive CDFIs already active in the assessment area. This has allowed it to become a strong participant in the limited multifamily affordable housing market and to help facilitate small business credit and community facilities

9
development. Schwab Bank has provided critical leadership and sustained presence in Reno-Sparks – supporting programs and helping to nurture the community development sector for the long-term. For example, through its Capacity Building Grants program, the Bank awarded more than 20 grants to support local nonprofits’ board development, strategic planning, earned income strategies, financial planning, and other internal projects. As the organizations gained strength, they formed a new peer learning organization, the Alliance of Nevada Nonprofits (ANN), which Schwab Bank founded and that now operates independently. Today, we focus on the community’s current needs, including bringing national programs to the state of Nevada (e.g. lending circles, fintech in schools) and policy and advocacy work around financial capability and financial wellness.
Bank Presence and Market Competition
The Bank’s branch presence in the Reno-Sparks MSA consists of its main office, two onsite deposit-taking ATMs, two remote cash dispensing ATMs and one brokerage/bank branch office (A map and list of census tracts for the assessment area are contained in Appendix A of this Plan.).
Schwab Bank retains a strong reputation in this area as a champion of local nonprofits and their wide range of community development activities. However, although the Bank’s community development activities are well-known, the Bank’s non-CRA lending in the Reno-Sparks AA is very limited. For example, in recent years well under 1% of all CSB mortgages were originated in Reno-Sparks. The Bank competes in this market with 13 insured banks and savings institutions. These competitors, with branch networks, greater brand recognition and on-the-ground loan officers tend to capture the lion’s share of the mortgage market in the Reno-Sparks MSA.

10
Demographic, Geographic, Economic, and Housing Information1
Demographic & Geographic Information. The Reno-Sparks MSA (population 443,992) is comprised of two counties, Storey County (population 3,914) and Washoe County (population 440,078). Geographically, Washoe is the seventh largest county, and Storey is the second smallest county in Nevada. Storey is located southeast of Washoe and has few community development opportunities, as much of its land area is either controlled by the Bureau of Land Management or is designated with historical landmark status. After a decline amid economic recession, the MSA population has increased by 4.4% since 2010, based on 2014 estimates. However, the FFIEC median family income declined during the past four years, from $67,350 in 2010, to $63,000 in 2014.
Economic Information. The state and local economies have expanded across all sectors since the economic downturn. Moreover, housing affordability is a growing challenge and mortgage credit remains constrained. As homebuyer prices increase sharply, household incomes have not kept pace. Many of the new jobs being created locally are entry and mid-level positions; thus, coupled with stagnant wages and higher prices for consumer goods, the rise in housing prices is straining affordability for a large segment of the population. And while personal bankruptcy and foreclosure numbers are down, there are strong indications of continuing hardship, particularly among LMI residents. According to recent data, Nevada continues to far outpace the national average for rates of asset and liquid poverty, lack of health insurance, low retirement plan participation, and low educational attainment.
1 Sources:
American Bankruptcy Institute. “Bankruptcy Filing Statistics Non-business Filings.” Web.
National Association of Realtors. “Median Sales Price of Existing Single-Family Homes for Metropolitan Areas.” Web
RealtyTrac U.S. Web.
United States Census Bureau. Web.
United States Department of Housing and Urban Development. Web.
Corporation for Enterprise Development, Assets and Opportunity Scorecard, Nevada. Web
University of Las Vegas, Lied Institute for Real Estate Studies. Web
Federal Reserve Economic Data – Federal Reserve Bank of St. Louis. Web
United States Courts Caseload Statistics Data Tables (Bankruptcy). Web
Nevada Workforce Research & Analysis Bureau. Web
U.S. Department of Commerce - Bureau of Economic Analysis. Web
CoreLogic National Foreclosure Reports. Web
CFED Assets & Opportunity Scorecard, Web

11
Overall, Nevada’s economy expanded by 1.8% (in real terms), from 2012 to 2014. While reflecting steady improvement, the State’s Gross Domestic Product (GDP) growth rate in 2014 of 1.0% trailed the national average of 2.2%, and ranked 33rd in the nation.
During this period, employment grew by 5.4%, with the largest gains seen in construction (21%), financial services (7.4%) and manufacturing (7.3%). However, job growth in Reno-Sparks trailed the statewide average slightly, so while employment grew by 5.3%, the MSA’s share of Nevada’s employment declined slightly.
The Reno-Sparks MSA has an employed non-farm work force of 195,300 as of March 31, 2015. The largest industries continue to be tourism and gaming, with casinos among the area’s top private sector employers. Overall, the largest employers are the Washoe County School District, with over 8,500 employees followed by University of Nevada-Reno, with over 4,000 employees. Nevada ranks last in the nation for small business ownership rates. Unemployment peaked in 2010 at 13.2% when it was highest in the nation, and has now decreased to 6.4%, which is higher than the national average and among the highest in the nation.
The following table illustrates Reno-Sparks employment levels and trends across the MSA’s key sectors:
Employment Sector Number Employed (2014)
% Increase (2012 to 2014)
Trade/Transportation/Utilities 44,100 5.0%
Leisure/Hospitality 33,700 20.8%
Government 28,300 1.4%
Professional/Business Services 26,200 5.6%
Education/Health Services 22,900 5.0%
Manufacturing 12,700 13.5%
Construction 11,700 46.2%
Financial activities 9,300 6.9%
In late 2014, Tesla Motors Inc. announced plans to build a new battery factory in Storey County. The factory, which is expected to open in stages and be fully operational by 2017, is expected to create up to 6,500 on-site jobs. The Nevada Governor’s Office of Economic Development forecast 16,000 indirect jobs will be created to support the factory and its employees.

12
Following are additional findings of the Bank’s assessment of needs and opportunities. While showing continued improvement, Nevada and Reno-Sparks continue to lag behind national averages in several respects:
From 2012 to March 31, 2015, Nevada gained 11.4% of its jobs, causing unemployment to recede by more than 42% (from 12.3% to 7.1%) on a seasonally-adjusted basis.
In the Reno-Sparks MSA, the seasonally-adjusted unemployment rate was 6.5% in 2014 (most recent data available at the MSA level), down from 8.3% in 2013 and 12% in 2012. By comparison, national unemployment decreased from 8.3% in 2012, to 5.7% in 2014.
Personal bankruptcy claims have decreased steadily in recent years. Between 2012 and March 31, 2015, Nevada nonbusiness filings decreased by 37.5%, from 17,199 to 10,196 claims, compared to a national average decrease of 23.4%.
Housing Information. According to 2012 estimates, the Reno-Sparks MSA had 187,136 housing units, of which 164,287 were occupied. The vacancy rate was 12.2%, up slightly from 11.58% in 2010. Of households living in rental units, 54.4% maintained a rent burden of at least 30% of household income, indicating a significant need for affordable rental housing.2 For homes with a mortgage, 42.3% maintained a cost burden of 30% or more of household income.
2 As reported by the Census Bureau, this figure is based on units for which income burden could be computed, which excludes
about 2% of occupied rental units.
13
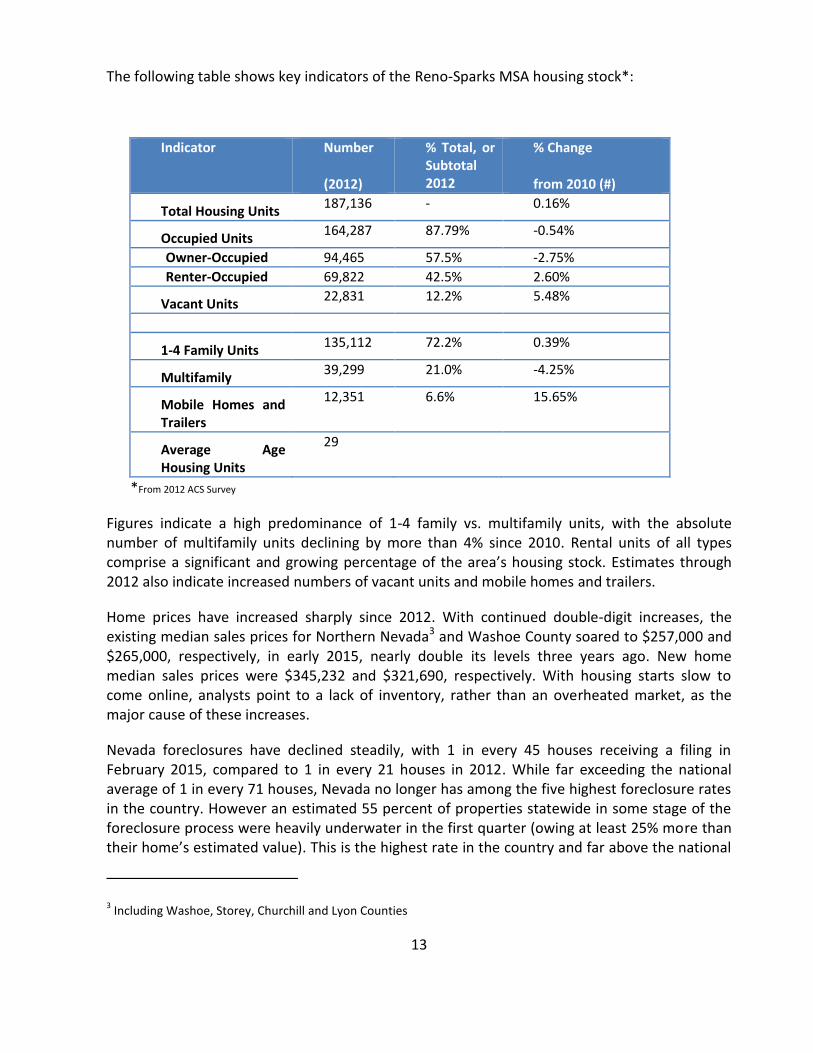
The following table shows key indicators of the Reno-Sparks MSA housing stock*:
Indicator Number
(2012)
% Total, or Subtotal 2012
% Change
from 2010 (#)
Total Housing Units 187,136 - 0.16%
Occupied Units 164,287 87.79% -0.54%
Owner-Occupied 94,465 57.5% -2.75%
Renter-Occupied 69,822 42.5% 2.60%
Vacant Units 22,831 12.2% 5.48%
1-4 Family Units 135,112 72.2% 0.39%
Multifamily 39,299 21.0% -4.25%
Mobile Homes and Trailers
12,351 6.6% 15.65%
Average Age Housing Units
29
*From 2012 ACS Survey
Figures indicate a high predominance of 1-4 family vs. multifamily units, with the absolute number of multifamily units declining by more than 4% since 2010. Rental units of all types comprise a significant and growing percentage of the area’s housing stock. Estimates through 2012 also indicate increased numbers of vacant units and mobile homes and trailers.
Home prices have increased sharply since 2012. With continued double-digit increases, the existing median sales prices for Northern Nevada3 and Washoe County soared to $257,000 and $265,000, respectively, in early 2015, nearly double its levels three years ago. New home median sales prices were $345,232 and $321,690, respectively. With housing starts slow to come online, analysts point to a lack of inventory, rather than an overheated market, as the major cause of these increases.
Nevada foreclosures have declined steadily, with 1 in every 45 houses receiving a filing in February 2015, compared to 1 in every 21 houses in 2012. While far exceeding the national average of 1 in every 71 houses, Nevada no longer has among the five highest foreclosure rates in the country. However an estimated 55 percent of properties statewide in some stage of the foreclosure process were heavily underwater in the first quarter (owing at least 25% more than their home’s estimated value). This is the highest rate in the country and far above the national
3 Including Washoe, Storey, Churchill and Lyon Counties

14
average of 35%. Nevada leads the county in heavily upside-down borrowers, at 25.5%, compared to 13.2% nationally.
Analysts predict a continued strong housing market outlook, with a growing workforce fueling a demand for units and myriad factors contributing to affordability challenges.
D. Performance Context for the San Francisco Bay Area Assessment Area
The Bay Area has experienced a robust recovery since the recent downturn, due in large part to its educated and skilled workforce and the complementary nature of its three major metropolitan areas. The Oakland area is an infrastructure and transportation hub, and has recently seen a spillover effect from San Francisco; the San Francisco area serves as a commercial, financial, and, more recently, technology hub; and the San Jose area attracts technology firms and start-ups with connections to capital investors and research institutions. Growth is increasingly limited, however, by the high cost of living and doing business in the area, and the slow pace of housing production. Affordable housing is increasingly difficult for residents to attain, especially in urban centers, and regional poverty is about 11% of the total population.
The Bay Area is one of the nation’s most competitive markets for CRA lending and investing. To compete with the 85 other Banks whose assessment areas include the Bay Area, the Bank has developed a highly-responsive program that focuses on its strength in lending to CDFIs that provide financing for small business development, microfinance, affordable housing and community facilities. Through our strong relationships with virtually all of the strongest CDFIs that operate in the Bay Area, our capital is deployed over multiple years to projects where the community needs it most. We also focus on philanthropic support for innovative program development and capacity-building initiatives for non-profits, as well as our employees’ investment of their time and expertise in additional disciplines, such as marketing, strategy, technology, and other disciplines.
Bank Presence and Market Competition
Schwab Bank’s presence in the San Francisco Bay Area consists of eleven branch offices, of which ten are domiciled within CS&Co brokerage offices and one is in a facility accessible to employees only. Two of the branches are located in low-income census tracts. Branch presence is supplemented by one publicly accessible ATM. The San Francisco Bay Area became a CRA assessment area for Schwab Bank in 2008, when the Bank opened its first public branch in San Francisco. Since that time, Schwab Bank has developed relationships with affordable housing, small business and other service providers to the LMI community, and significantly grown its CRA lending, investment, and grant and service programs throughout the Bay Area.
While the assessment area’s population, large number of nonprofit organizations, and small business environment generate extensive community development projects and initiatives, Schwab Bank competes for these opportunities with 85 community, regional and national financial institutions with CRA obligations. These competitors, with branch networks, greater

15
brand recognition and on-the-ground loan officers, and a wide range of products and services4, continue to capture the lion’s share of the region’s community development market. Of these institutions, there are at least eight major banks5 competing for CRA lending and investment opportunities with over $7.3 trillion in total assets and $308 billion in deposits originated in the Bay Area. To gain market share, Schwab Bank works with other banks, CDFIs and third parties that take the lead on financing.
As in the Reno-Sparks MSA, Schwab Bank’s business model results in a limited number of mortgages originated within the Bank’s assessment area, and mortgage lending is well-served by other lenders. These lenders take the vast majority of mortgage market share, and nonbank lenders are increasingly becoming significant participants in the single family mortgage market.
Demographic, Geographic, Economic and Housing Information6
Demographic & Geographic Information. The Bay Area, comprised of two MSAs, has a combined population of 6.5 million in 2014, up 5.8% from 2010. The two MSAs experienced similar growth rates during this period.
The San Francisco MSA consists of five counties, Alameda County (population 1.6 million), Contra Costa County (population 1.1 million), Marin County (population 260,000), San Francisco
4 Products often include traditional real estate lending products such as acquisition, construction, permanent, and rehabilitation
loans, structured finance products, small business lending and business banking, treasury management services, and corporate lending. Many pair these services with advisory work, stock underwriting, derivatives sales, etc., in an effort to capture an entire banking relationship.
5 Wells Fargo, Bank of America, Citibank, US Bank, Union Bank, JP Morgan Chase, Comerica Bank, and Bank of the West
6 Sources:
American Bankruptcy Institute. “Bankruptcy Filing Statistics Non-business Filings.” Web.
National Association of Realtors. “Median Sales Price of Existing Single-Family Homes for Metropolitan Areas.” Web
RealtyTrac U.S. Web.
United States Census Bureau. Web.
United States Department of Housing and Urban Development. Web.
Association of Bay Area Governments. Web.
Federal Reserve Economic Data – Federal Reserve Bank of St. Louis. Web
United States Courts Caseload Statistics Data Tables (Bankruptcy). Web
CoreLogic National Foreclosure Reports. Web
“Poverty in the Bay Area,” , 2013, Joint Venture Silicon Valley Institute for Regional Studies

16
County (population 852,000), and San Mateo County (population 758,000). The San Jose MSA comprises two counties, San Benito County (population 58,267) and Santa Clara County (population 1.9).
The Bay Area has an employed non-farm workforce of 3.27 million, as of March 31, 2015. The largest industries include high-tech, tourism and, increasingly, biotechnology. Additionally, San Francisco remains a financial services center of the West, and the region’s economy is closely tied to trade with Asia.
The rate of population growth has rebounded from its low levels in the previous decade, but remains well below levels reached in the 1990s. The concentration of growth has shifted from the suburban and rural counties to the more urban counties since 2010. Santa Clara, Alameda, and San Francisco counties, the three largest in the region, had the fastest rate of population growth between 2010 and 2014, with over one third of the region’s population increase occurring in the cities of San Jose, San Francisco, and Oakland.
The 2014 FFIEC median family incomes for the Bay Area assessment area indicate mixed results compared to 2010 levels: $94,800 for the San Francisco MD, up slightly from $93,987; $88,500 for the Oakland MD, up slightly from $88,024; $104,100 for the San Rafael MD, down from $112,911, and $101,900 for the San Jose MSA, up from $99,794.
While total personal income growth is strong, household incomes (adjusted for inflation) remain below their peak levels in most counties. The number of jobs in higher wage occupations is growing more quickly than low wage or middle income jobs, while many occupational categories at all levels continue to have wages below their 2010 levels. With these trends, the Bay Area is seeing rising income inequality, which, in turn fuels housing affordability and other challenges for its LMI residents.
Economic Information. Overall, the California economy is booming, expanding by 5.2% in real terms between 2012 and 2014, compared to a national average rate of 4.1%. Foreclosure rates have come down steadily, from 1 filing in every 71 houses in 2012, to 1 in 200 houses in 2014.
Economic indicators for the Bay Area show particularly strong progress, with unemployment down to 4.2% as of March 31, 2015, and personal bankruptcy claims in the Northern District of California down by 52% since 2012. Bay Area employment grew a striking 9.5%, more than twice the national average. Although growth in 2015–16 is expected to slow from the exceptional boom years of 2013 and 2014, the Bay Area economy is forecasted to continue growing faster than most regions in the country.
According to the Association of Bay Area Governments (“ABAG”), San Francisco was the first county to surpass its 2000 and 2007 employment peaks. San Francisco has taken the largest share of new professional and technical jobs, Santa Clara the largest share of new information jobs, while the bulk of health and social service, accommodation and food job growth is distributed evenly between San Francisco, the South Bay, and the East Bay. In all, much of the

17
new growth has gone to sectors and locations that already were areas of competitive advantage for the region.
The following table shows employment levels and trends in the Bay Area’s key sectors.
Employment Sector Number Employed (2014)
% Change (2012 – 2014)
Trade/Transportation/Utilities 497,000 4.6%
Leisure/Hospitality 338,000 10.5%
Government 401,000 3.1%
Professional/Business Services 668,000 13.0%
Education/Health Services 479,000 7.2%
Manufacturing 283,000 5.2%
Construction 140,000 14.5%
Financial activities 164,000 3.8%
While growth is evident across all sectors, the greatest gains are seen in Construction, Professional/Business Services, Leisure/Hospitality and Education/Health.
Housing Information. In 2012 the Bay Area had approximately 2.4 million housing units, of which 2.25 million were occupied. The following tables provide an overview of the housing stock in the two MSAs that comprise the Bank’s assessment area:
San Francisco MSA – Select Housing Statistics:*
Indicator Number (2012)
% of Total, or Subtotal (2012)
Total Housing Units 1,742,682 -
Occupied Units 1,618,952 93%
Owner-Occupied 869,372 54%
Renter-Occupied 749,575 46%
Vacant Units 123,730 7%
1-4 Family Units 1,142,982 71%
Multifamily 458,163 28%
Mobile Homes and Trailers 17,808 1%
Average Age of Housing Units 51 years *2012 American Community Survey

18
San Jose MSA – Select Housing Statistics:*
Indicator Number (2012)
% of Total, or Subtotal (2012)
Total Housing Units 652,202
Occupied Units 624,157 96%
Owner-Occupied 356,394 57%
Renter-Occupied 267,763 43%
Vacant Units 28,045 4%
1-4 Family Units 446,897 72%
Multifamily 158,546 25%
Mobile Homes and Trailers 18,725 3%
Average Age of Housing Units 43 years *2012 American Community Survey
The vacancy rate is well below the national average of 12.8%. While the majority of units are owner-occupied, rental units comprise a sizable portion of the housing stock in both MSAs. Of households living in rental units, over 51.6% in the San Francisco MSA and 47.6% in the San Jose MSA maintained a rent burden of at least 30% of household income, indicating a significant need for affordable housing. Using the state-mandated Regional Housing Need Assessment Goals as a benchmark, according to the ABAG only about one fourth of the region’s needed production goals have been met for very low, low, and moderate income housing, compared to over 80 percent for above moderate income housing. Renters have the highest levels of housing burden, higher rates of growth in housing burden, and greater levels of overcrowding, as measured with census data and using the HUD definition of more than 1.01 occupants per room. While affordability is predictably poor in San Francisco and Santa Clara counties, renter affordability is a challenge even in Alameda and Contra Costa Counties.
The San Francisco and San Jose MSAs have retained their historic status as among the least affordable housing markets in the country. The National Association of Realtors reports the median sales price of a single family home, as of December 31, 2014, at $742,900 for the San Francisco MSA and $855,000 for the San Jose MSA. Data drawn from Moody’s Analytics reports and from the Housing Price Index (HPI) of the Federal Housing Finance Agency for the Bay Area reveal similar statistics. One must make at least $150,000 per year to afford a mortgage with a 20% downpayment; this income is well above area median income levels across the Bay Area, which top out around $100,000, and even higher above LMI income levels.
Although new housing production has lagged behind population and job growth, new construction and building permits are focusing more on existing job centers in the biggest cities than in the recent past, and multifamily units are a growing proportion of new stock. While single-family units are still built predominately in the more suburban areas, multifamily

19
construction is concentrated not only in the large urban job centers of San Jose, San Francisco, and Oakland, but also in areas that were historically suburban but have added major employment hubs, such as Dublin, Sunnyvale, Fremont, and San Ramon. These trends can be expected to continue in the near future, as reflected by the high share of building permits that are for multifamily projects.
Affordable housing production is constricted by the lack of federal, state and local public investment needed to develop housing stock in this high-cost region; as much as 40-50% of the subsidy required for a typical project is not available from traditional government sources. Voter-approved state bond proceeds for affordable housing has largely been exhausted, with waning political will to seek an additional referendum on the matter. Local-level funding has been affected by the elimination of over 400 redevelopment agencies as a state budget cost cutting measure; city and county funding has largely dried up as well in the constrained budgetary environment.
As a result, there are a limited number of affordable housing projects in the Bay Area and intense competition among Banks for lending and investing opportunities. In the most recent round of LIHTC applications made by the California state allocating agency, only 10% of projects were in the Bank’s assessment area. Developers of these projects are keenly aware of this fact and competitively bid out every project. Even highly competitive bids often do not win the project for the sponsors of funds that invest in LIHTC, as the banks that offer the entire suite of financing in connection with these projects (e.g., construction, permanent, cash management, etc.) do so at highly competitive rates. Moreover, the very largest banks have the infrastructure and teams of employees that allow them to invest directly, underwrite the projects and asset-manage the projects, and therefore routinely outbid fund managers. In sum, the fund managers with which the Bank would invest can rarely win projects in the Bank’s assessment area. While this might limit the Bank’s ability to invest in projects in the assessment area, it opens up the possibility of making more loans and investments in the BSRA, where capital may be needed more and there are fewer institutions willing to deploy capital.
V. Community Needs Assessment
A. Credit Needs of the Reno-Sparks Assessment Area: Determination and Response
Schwab Bank met with over 30 community organizations and partners that serve the Reno-Sparks assessment area, from all across the spectrum of community practitioners. This included CDFIs, housing developers, and government agencies. In addition, Schwab Bank employees sit on 20 Reno-area community organization boards and committees. Input gathered from these meetings and the Bank’s ongoing participation in the community revealed consensus around three high-priority needs:
1) Multi-family affordable housing
2) Small Business Development
3) Nonprofit capacity building and support through grants, services and technical support
20
Equally clear was that the community agreed that purchasing one-to-four family mortgages in the secondary market would have a negligible impact on the availability or affordability of mortgages for LMI borrowers or in LMI areas. These findings are well supported by the Bank’s past and recent experience, as well as by field research, as well as our recent conversations with key practitioners (e.g., the Nevada Housing Division). Although Schwab Bank makes mortgages available to all members of the community at its two branches, the Bank does not originate many mortgages in the Reno-Sparks assessment area. Community input confirmed that the existence of many more traditional banks in the area, which are well suited for providing single family mortgage lending, significantly reduces the need for Schwab Bank to focus on such financing. Instead, there was widespread agreement that Schwab Bank should continue its focus on making community development loans and investments, and concentrate its resources on higher impact products and programs.
Multi-Family Affordable Housing
Annual Low Income Housing Tax Credit and Community Development Block Grant subsidy allocated for Washoe County is generally sufficient to develop only one or two housing projects per year; feasible projects without subsidy are very rare. Storey County has virtually no opportunities. Regardless, since the Bank opened its doors it has participated in the financing of every affordable housing project that has come into the Reno-Sparks MSA.
Schwab Bank’s intermediary strategy is well suited for this environment. Lending to CDFIs in the assessment area and the BSRA that benefits the assessment area permits CDFIs to provide construction financing to affordable housing in a low subsidy environment, while the Bank’s permanent loans can provide much needed long term capital and leverage additional capital from CDFIs that currently serve the assessment area and the BSRA that benefits the assessment area. The Bank will also continue to offer permanent debt on these multi-family affordable housing developments in partnership with other intermediaries. Furthermore, the Bank will continue to be the main sponsor of applications for development projects to the Federal Home Loan Bank’s Affordable Housing Program (AHP). Finally, the Bank will work to bring its nonprofit developer partners and its LIHTC fund sponsors together so that we can bring strong affordable housing developments to the assessment area.
During the past three years, a key priority has been to bring CDFIs or other intermediaries without a local presence into the Reno-Sparks market. During the 2012 Plan period, the Bank brought two well-established Western Region intermediaries to the assessment area, and continues to work with them to bring capital to the assessment area.
Small Business Development
In addition to affordable housing, the Reno-Sparks assessment area needs lending capital for small business development. Although Schwab Bank does not make small business loans, it makes loans to intermediaries that focus on small business development. By lending to CDFIs with expertise in making small business loans, Schwab Bank can lend, and therefore leverage, significant capital while supporting three critical interests – small business development, microlending initiatives, and CDFIs. To respond to small business needs, the Bank will continue

21
working with the two new partners that we brought into Nevada through seed grants and other expertise - VEDC and ACCIÓN New Mexico. The Bank will continue to develop new relationships with organizations that can serve the area.
Nonprofit Support through grants, services and technical assistance
The Reno-Sparks assessment area contains a number of smaller and newer, yet extremely dedicated nonprofit organizations that require additional technical assistance, service, and grants to realize success. The Bank is the recognized leader in northern Nevada in providing high impact grants and services that help build the capacity of local organizations to access development capital, even where we do not provide that capital directly. Noteworthy efforts include providing funding through the Bank’s annual Community Building Grant Program7 and providing loan underwriting training and assistance to public-private entities to support project funding. The Bank often plays a leadership role, seeding and advancing innovative pilots, initiating and driving collaborative solutions, and building local and regional capacity through investments of human capital. For example, the Bank founded the Alliance of Nevada Nonprofits, brought innovative programs from across the Western Region and the country (e.g. MyPath and FSG’s Lending Circle), and continues to be the critical partner and catalyst for Nevada nonprofits seeking ideas and resources. The Bank’s ongoing needs assessments helps to direct investments to where they were most needed and offers the greatest potential for impact. At times, grants and services are tools to effectuate a deeper and more holistic relationship with organizations or projects also benefiting from the Bank’s financial investments.
Local leaders clearly stated that conditions support a continued emphasis on Schwab Bank’s grant and extensive community development service program. With few other institutions maintaining an active community presence in Reno, the Bank maintains a full-time Community Affairs manager at its headquarters whose job responsibilities emphasize cultivating deep partnerships, providing seed capital, and connecting organizations to leverage shared strengths and opportunities. Based on feedback from our outreach to local organizations and practitioners, high priorities for grants and services include capacity-building support and technical assistance for nonprofit organizations and localities; programs aimed at expanding financial capability and creating asset development opportunities for LMI residents; and promoting healthy communities, growing small businesses and microenterprises, and supporting homeless housing initiatives. The Bank will continue its leadership efforts in these areas, with a continuing goal of furthering the economic health and well-being of the community and developing a market better able to support private financial investment in the years to come.
7 Prior to 2013 this was called “Capacity-Building Grant Program.”

22
Schwab Bank’s grant and service strategies are closely aligned, often working in tandem and as a complement to its lending and investment programs. The Bank’s activities typically include one or more of the following:
Grants and services needed to initiate and evaluate pilot programs or continue beyond the pilot stage to enhance and/or expand upon early stage efforts
Deep and sustained investments in high-impact nonprofits through multi-year grants and board or committee service
Collaboration with local, regional or national partners to leverage resources, deepen impact and promote sustainable outcomes
Capacity-building of local partners to pursue their overall missions and/or targeted programs or projects; in additional to providing financial support, the Bank provide technical assistance in the areas of financial analysis, transaction structuring and underwriting
Leveraging support from third-party funders, such as the FHLB
Resource convening and multi-sector collaborations to share best practices to devise meaningful solutions to complex community issues
B. Credit Needs of the San Francisco Bay Area Assessment Area: Determination and Response
Employees of the Bank and CS&Co sit on many Bay Area nonprofit boards and committees. This experience, coupled with numerous meetings with our local partners and stakeholders, and a review of available data, indicate a range of community needs that are similar to the Reno-Sparks assessment area:
1) Multi-family affordable housing
2) Small Business & Microfinance development
3) Non-Profit capacity building and support through grants, services and technical support
The Bay Area is home to a large number of nonprofits, including developers, CDFIs and other intermediaries with capacity to deploy capital for these and other projects and initiatives. The Bank will continue to work with these entities to provide capital and services to the area. Several CDFI partners stated that they wish to expand their current geographic footprints. For example, we have partnered with CDFIs that desire to expand into California, from Southern California to Northern California, and from California to other Western Region States, and there was general agreement that deploying capital throughout the Western Region would benefit the assessment area. On the other hand, several partners have told us they cannot deploy all the capital available to them because the Bank’s competitors are also providing capital and there are not enough suitable projects. As a result, the Bank will seek to also deploy capital in the BSRA.

23
Because of the high cost of housing, an often cited concern is the acquisition of residential properties for speculative investment, further threatening an already limited supply of affordable housing. The Bank will continue to lend to CDFIs endeavoring to preserve affordable housing through rehabilitation and utilization of available subsidies, including LIHTC and AHP financing structures. As with the Reno-Sparks assessment area, our partners and community stakeholders agreed that purchasing mortgages in the secondary market would have negligible impact on the availability or affordability of mortgages for LMI borrowers or in LMI areas. Community input confirmed our belief that the many traditional banks in the Bay Area adequately meet the need for single family mortgages and that Schwab Bank should focus its resources on higher impact projects and programs. Moreover, nonbank financial institutions have moved into the mortgage market. In fact, some of the largest FHA lenders today are non-banks. This more recent development also lends supports to the fact that the mortgage market for LMI individuals is being adequately served.
Multi-Family Affordable Housing
Many of our partners highlighted a need for flexible sources of capital to allow them to compete effectively in the marketplace to acquire and preserve affordable housing for the long-term. Schwab Bank will continue to lend to and invest in CDFIs that develop and preserve affordable housing, as well as seek to invest in properties receiving LIHTC, both in the assessment area and the BSRA. Through these efforts, we have participated in financing the pre-development, construction and permanent loan phases of dozens of projects across the Bay Area and the BSRA.
In connection with the preparation of the Plan, the Bank met with 18 sponsors of investment funds that invest in LIHTC in the Western Region. The sponsors with whom we met invest $3-5 billion in projects eligible to receive LIHTC. While they uniformly cited significant challenges investing in the Bay Area due to intense competition, they held out the potential for significant opportunity in the BSRA. Indeed, the Bank has found greater success in investing with fund managers that invest in the BSRA, where its capital can have a greater impact on areas that need it most, and where the banks that invest directly are less interested or have less of a presence. For example, the Bank was recently asked by a LIHTC fund manager whether it could invest in Montana, where the fund sponsor has a strong relationship with a developer. Because Montana was not a state in its 2012 Plan, the Bank could not make the investment and have it count towards its community development goal. As a result, the fund manager will not be purchasing those LIHTCs for the fund in which the Bank would otherwise desire to invest.
Moreover, the Bank will continue to serve as a project application sponsor under the AHP program, thereby leveraging additional sources of capital needed to help reduce financing gaps. Our loans to intermediaries will be able to respond to the continued industry shift to affordable housing projects that require fewer subsidies, are distressed, or are in “Year 15” of their tax credit compliance period, including acquisition/rehabilitation and mixed-income.
Schwab Bank will continue to pursue structured funds, which continue their role as vehicles to support community development finance. As the drive to be creative with limited resources persists, more innovative opportunities may emerge. For example, we have recently seen

24
national intermediaries such as The Housing Partnership Network and Enterprise Community Partners create investment vehicles that preserve affordable housing in structures other than investments in LIHTC. Schwab Bank is in a position to consider these types of investments, as it has under the 2012 Plan.
Small Business and Microfinance Development
Scaling of business finance, in partnership with CDFIs, Certified Development Companies, and SBA lenders will present additional opportunities. With a lack of conventional sources and a strong emphasis by policy makers to create jobs, small business lending is a growth sector in the field. Again, the Bank’s loans to intermediaries program is designed to meet this need.
Nonprofit capacity building and support through grants, services and technical support
Local conditions demonstrate need and opportunity for the Bank to continue its grant and extensive community development service program, specifically in the areas of asset building and financial capability for LMI populations. The Bank’s service program focuses on targeted opportunities to add value through the professional expertise and skill-sets of Schwab employees. Recent examples include sharing community development finance expertise with local organizations, and making Schwab professionals available across such diverse disciplines as strategy, marketing, branding and technology to help partners build capacity and implement programs. Based on recent conversations with local practitioners, key priorities for grants and services include capacity-building support and technical assistance for CDFIs and other nonprofit organizations, and programs aimed at expanding financial capability, creating asset development opportunities for LMI residents, financing affordable housing, promoting healthy communities, and supporting entrepreneurship. Local stakeholders also encouraged the Bank to continue to act as a convener in facilitating cross-sector dialogue and sharing best practices across the industry to craft effective solutions to complex community issues.
The Bank will seek to draw on the presence of CSC and affiliates to enhance these strategic efforts in this assessment area, as these investments of human capital continually enhance the economic health and well-being of the community.
VI. Strategic Plan Overview
This Plan and all targets contained herein reflect detailed analyses of community needs and opportunities, peer performance, and the Bank’s business objectives, capacity and constraints. The Bank’s primary goal under this Plan is to be responsive to the needs and opportunities of its communities.
Because a number of factors are expected to limit the assessment areas’ ability to absorb the amount of CRA-related lending and investment activity appropriate for an institution of Schwab Bank’s size, this Plan anticipates responding to credit needs in the BSRA. Thus, while emphasizing lending, investments and services within its assessment areas, this Plan acknowledges that the state of California has intermediaries (including CDFIs) that work across the state, and that the Western Region States have many intermediaries (including CDFIs) that
25
do work both in the assessment areas and the BSRA that directly and indirectly benefit the assessment areas.
A. Execution of CRA Strategic Plan
Under the direction of the CRA Officer, the Bank’s Community Development group supports – through loans, investments and services – initiatives designed to strengthen the social and economic fabric of the Bank’s communities and empower local residents to create better futures for themselves and their families. The Bank expects to employ a range of tools and work with an array of internal and external partners to fulfill its CRA Plan objectives. While the overarching strategy may evolve over the course of the Plan period in response to the performance context, it is expected to encompass the intermediary strategy previously discussed, emphasizing financial and intellectual capital investment with strong community partners. Areas of activity may include, but are not limited to:
Loans to and investments in CDFIs or other intermediaries that support small business development, microfinance, affordable housing and community facilities, such as charter schools, health care and child care centers
Multi-investor funds that invest in projects eligible for Low-income Housing Tax Credits
Participation construction loans for multi-family affordable housing
Permanent loans for multi-family affordable housing
Philanthropic support for innovative program development and capacity-building initiatives, including but not limited to partners focused on asset-building and financial capability, affordable housing, small business development and healthy communities
Commitment of time/expertise in area of community development finance (e.g., to help nonprofit partners structure new funds to address unmet needs or innovative transaction structures)
Investment of time/expertise in additional disciplines (e.g., marketing, strategy, technology, human resources, etc.) to help nonprofits build capacity and achieve programmatic success
Capital access from third-party sources, such as Federal Home Loan Bank Affordable Housing and AHEAD Programs
Commitment of time/expertise to advance cross-sector dialogue, strategy development and best practice approaches around community development challenges
In connection with a number of the activities noted above, the Bank will continue to strengthen its impact through ongoing collaboration with internal CSC partners, including but not limited to Schwab Community Services and the Schwab Foundation. The Bank will continue and expand

26
many such initiatives launched or developed during the 2012 Plan, such as those devoted to asset-building and financial capability innovation, capacity-building for nonprofit partners, and career exposure for under-resourced youth. As resources permit, the Bank may also pursue further involvement in entrepreneurship and workforce development efforts.
B. Charles Schwab Bank CRA Goals
The CRA regulation states that generally a bank shall address in its plan all three performance categories and, unless the bank has been designated as a wholesale or limited purpose bank, shall emphasize lending and lending-related activities. However, the regulation allows the bank to provide a different emphasis, including a focus on one or more performance categories, if it is responsive to the characteristics and credit needs of its assessment area(s), considering public comment and the bank's capacity, constraints, product offerings, and business strategy. Based on this guidance, and consistent with this Strategic Plan, Schwab Bank proposes to direct at least a minimum amount of Loans and Investments as set forth in the Point Matrix that follows, but thereafter to direct loans and investments in such amounts as are necessary to meet the needs of the community. The Plan further allows additional credit for, and thereby encourages the Bank to undertake, initiatives that are innovative or complex, not commonly available from private investors and/or highly responsive to community needs.
For this Plan the Bank has established measurable CRA Goals for the following Categories of Activity: 1) Loans, 2) Investments, and 3) Services:
Loans and Investments
The Bank will lend or invest at least $1 billion by end of the Plan, with interim annual goals set forth in the Point Matrix that follows for each of Loans and Investments. Capital will be deployed primarily through intermediaries, with emphasis on lending to CDFIs and investments in LIHTC funds.
1. Loans:
Combined volume of HMDA-Reportable Loans and Community Development Loans (loan volumes are also aggregated with investment volumes per combined transaction targets set forth in the Plan Point Matrix below)
Mortgage loans and qualified Community Development Loans and/or Lending Related Activities that benefit LMI individuals or communities, such as those targeted toward affordable housing development and preservation, small business creation and expansion, community facilities development, and community revitalization and stabilization.
Qualitative Factors (Supplemental credit – not required)
Provision of loans that are innovative and complex, demonstrate leadership or are highly responsive to community needs.

27
Extent of Innovation: Occasional, Moderate or High.
2. Investments:
Volume of qualified Community Development Investments that benefit LMI individuals or communities, which may include lawful investments, deposits, membership shares or grants (investment volumes are also aggregated with loan volumes per combined transaction targets set forth in the Plan Point Matrix below).
Qualitative Factors (Supplemental credit – not required)
Provision of investments that are innovative and complex, not routinely provided by private investors, or are highly responsive to community needs and opportunities.
Extent of Innovation: Occasional, Moderate or High.
Bay Area Assessment Area. Of the twenty-five CDFIs that operate or do business within the Bank’s Bay Area assessment area, eight are of the size that are capable of utilizing capital in a way that can have a meaningful impact on the Bank’s Plan goals. We have well-established relationships with these organizations. In addition, it is our goal to engage smaller CDFIs that are in or otherwise benefit the assessment area to deploy capital in a prudent manner.
Reno Assessment Area. Of the three CDFIs that operate or do business within the Bank’s Reno-Sparks assessment area, we have well-established relationships with all three.
Broader Statewide and Regional Area. The Bank continues to develop additional lending and investing opportunities in our assessment areas and the Bank also expects that significant capital will be deployed in the BSRA. Having developed considerable expertise in intermediary lending, specifically CDFI lending within the Western States Region, and having built relationships with organizations across the Western States Region, we believe this strategy will enable us to deploy the amount of capital set forth in our Plan considering the competition and opportunity within our assessment areas. Activities outside of the Assessment Areas are eligible for consideration only once the Bank achieves the benchmarks specified in the Point Matrix to demonstrate an adequate response to the needs of its two assessment areas. This framework enables the Bank to be more innovative and responsive to the needs of its community partners, such as by providing loan and investment capital to support projects in areas that are less well-served by financial institutions. Indeed, many of our community partners and stakeholders recognize the need for, or have encouraged, more geographic diversity into underserved markets. As a result, this Plan contains significant flexibility to lend and invest in the BSRA and expects that such activities will benefit the assessment areas both directly and indirectly, though the Bank will strive to achieve a high percentage of volume in the assessment areas.

28
Community Development Services
Over the three year Plan period, the Bank will deploy a total of at least 1200 hours of community development service hours in the Reno-Sparks assessment area and 2250 hours of community development service hours in the Bay Area assessment area. The majority of hours will be carried out by Bank staff in Reno, and through our robust network and volunteer efforts of CS&Co employees in the Bay Area. The goal consists of the following:
Number of hours committed in performance of community development services, which may include but are not limited to:
Serving on Boards or committees of organizations whose primary goal is community development.
Providing technical assistance related to the provision of financial services in order to support a community development organization, program or project.
Facilitating access to public subsidies that help nonprofits fulfill their objectives and/or enable low-to moderate-income consumers to participate in the financial mainstream.
Volunteering to teach financial education, providing financial coaching, creating financial access opportunities for low-income families, etc.
Qualitative Factors (Supplemental credit – not required)
Provision of services that are innovative and or are highly responsive to community needs and opportunities.
Extent of Innovation: Occasional, Moderate or High.
VII. Definitions
Broader Statewide or Regional Area or BSRA has the meaning set forth in the Interagency Questions and Answers Regarding Community Reinvestment.
Community Development Loan(s) exclude home mortgage, small business or small farm, or consumer loans, and include loans that support one or more of the following community development activities:
Has as its primary purpose community development as defined by 12 CFR § 195.12; and
Has not been reported or collected by the bank or an affiliate for consideration in the bank's assessment as a home mortgage, small business, small farm, or consumer loan, unless it is a multifamily dwelling loan; and
Benefits the bank's assessment area(s), or the Broader Statewide or Regional Area

29
Community Development Investment(s) or qualified investment means a lawful investment, deposit, membership share, or grant that has as its primary purpose community development.
Community Development Service(s) means a service that:
Has as its primary purpose community development;
Is related to the provision of financial services; and
Has not been considered in the evaluation of the bank's retail banking services.
HMDA-Reportable Loans consist of purchased or originated mortgages serving borrowers who earn less than 80 percent of the area median income, as calculated each year by Federal Financial Institutions Examination Council (FFIEC), or those purchased or originated in LMI geographies as identified by the Office of Management and Budget (OMB).
Lending Related Activities means efforts which facilitate or result in community development lending, mortgage lending to LMI borrowers or within LMI geographies, small business lending and small farm lending, including but not limited to qualified investments for such purposes.
Plan Years are defined as follows:
Plan Year 1 means the period from January 1, 2016 – December 31, 2016
Plan Year 2 means the period from January 1, 2017 – December 31, 2017
Plan Year 3 means the period from January 1, 2018 – December 31, 2018
Western Region States or Western Region has its generally accepted meaning for states of the United States of America that are located in the western region.
VIII. Plan Framework
A. Volume Goals
Charles Schwab Bank reviewed the recent CRA performance evaluations of seventeen nontraditional regulated large banks (which included Wholesale, Large Bank, Limited Purpose and Strategic Plan) with assets between $10 billion and $200 billion with CRA performance evaluations between 2011 and 2014. Four of these institutions had assets of approximately Schwab Bank’s size, i.e., $100 to $200 billion. Two of these institutions earned a CRA rating of “Satisfactory” and two earned a CRA rating of “Outstanding.” The average annual CRA qualifying lending and investment volume of these banks is 0.29%. Charles Schwab Bank has set a target for CRA qualifying lending and investment volume at 0.27% for a rating of

30
“Satisfactory.”8 Schwab Bank has set its Level 2 volume goal, which is the minimum required to achieve an “Outstanding” (though the achievement of Level 2 does not guarantee an Outstanding CRA Rating) at 0.37%.
B. Point Matrix Overview
Evaluation of the Bank’s performance under this Plan is based on a matrix that assigns point values to each Category of Activity and benchmark level contained in the Plan. As detailed below, component points are then aggregated to arrive at cumulative totals for each Plan year. Point totals of 41 and 62 are needed to earn the Bank ratings of Satisfactory and Outstanding for each Plan year. The OCC is expected to exercise discretion, based on the performance context, in weighting the Bank’s performance across Plan years in order to arrive at the State/Performance Test and overall ratings for the evaluation period.
In designing the matrix and apportioning the respective weights among various activities, we considered a range of factors, including but not limited to the performance context, the potential for impact, and the resources that would be necessary to implement them effectively. For example, we increased the Qualitative Points available (relative to the 2012 Plan), because we heard from community partners that they welcomed and appreciated the Bank’s responsiveness and willingness to commit time and resources to craft innovative and/or complex strategies - even if it means a relatively longer-term horizon to deploy capital.
The following tables detail how the Point Matrix works for this Plan. Point values correspond to three possible benchmark levels for each Category of Activity (Levels 1, 2 and 3). While it is necessary to achieve at least “Level 1” performance in each required Category of Activity in order to achieve a Satisfactory rating, attainment of Level 1 in each required Category of Activity, alone, is not sufficient to earn a Satisfactory rating. Additional points may be earned in a variety of ways to increase totals above the baseline level.9 This approach affords the Bank the necessary flexibility to respond to community needs and opportunities, as well as consider market conditions, internal capacity and constraints over the Plan period.
Additionally, although a number of different point combinations might earn the requisite total, the Plan framework does not allow the Bank to earn an overall Outstanding in a given Plan Year unless it achieves at least Level 2 Loans and Investments volumes for that Plan Year.
C. Loans and Investments
The Point Matrix establishes overall dollar targets for each Plan Year, corresponding to Levels 1, 2 and 3, as noted above. These targets include mandatory minimum targets for Loans, Investments, and combined Loans and Investments volume for each assessment area (Reno and Bay Area), including activities in the BSRA that directly benefit the assessment area or
8 Total Community Development Lending and Investment Volume = (Qualified Community Development Loans +
Qualified Community Development Investments) ÷ Average Asset Size ÷Years in Exam Period.
9 Points for innovative/complex activities are additive and not a required performance category under the Plan.

31
organizations or activities the purpose, mandate or function of which is to benefit the assessment area. Once the minimum assessment area Loans and Investments target levels are achieved, the framework allows the Bank to structure transactions in response to community needs (either as Loans or Investments) in the assessment areas, or the BSRA, to achieve the remainder of the volumes needed under its cumulative targets, even if activities in the BSRA do not serve and will not benefit the assessment areas. Notwithstanding the foregoing, the Bank will strive to achieve a volume of Loans and Investments in its assessment areas that exceed the minimum targets.
Note that the Bank must achieve annual Level 1 volume targets for Loans and Investments in both assessment areas in order to trigger consideration of initiatives outside of its assessment areas, subject to the exceptions set forth below. Moreover, the Bank must achieve at least the total annual cumulative volume indicated for Level 1 (e.g. $200 million in Plan Year 1) in order to achieve points for any level in the Reno-Sparks or Bay Area assessment areas.
If the Bank exceeds the Level 1 annual target within either or both assessment areas, the Bank has several options:
The additional volume may be applied toward the BSRA target. Thus, if in Plan Year 1 the Bank meets its Level 1 target for Reno-Sparks, exceeds its Bay Area target by $45MM, but misses its BSRA target by $45MM, the $200MM cumulative volume would earn the Bank full points for its Plan Year 1 Loans and Investments commitments.
If the Bank does not need the volume to offset a deficit in the BSRA, the excess volume may be applied to achieve Level 2 or Level 3 targets in the current Plan Year, and carried over to a future Plan Year to attain the cumulative target in the corresponding assessment area.
Dollar volume targets for Plan Years 2 and 3 are cumulative. Thus, the table indicates that in order to achieve Level 1 for Plan Year 2, the Bank will need Loans and Investments totaling $550 million for the two Plan Years combined, and for Plan Years 1, 2 and 3 no less than $1 billion combined.
Qualitative Points for Community Development Loans, Community Development Investments or Community Development Services are additive and may be achieved at Levels 1, 2 or 3 regardless of the corresponding volume Level achieved (e.g., the Bank may achieve Level 2 volume for Loans and Investments but the volume achieved may be highly innovative, affording the Bank the potential opportunity to achieve Level 3 Qualitative Points in the Loans and Investments Category of Activity under the Plan Point Matrix).
Eligible Community Development Activities reflected below incorporate all provisions typically applicable (as per regulation, Q&A or examiner guidance) for Banks evaluated under the Large Retail Bank test. These include but are not limited to:

32
Inclusion of prior period investments in Community Development Loans and Investments volume
Full credit for activities benefitting specially designated areas, organizations or projects, regardless of assessment area, such as:
FEMA-designated disaster areas
Minority/women-owned banks or credit unions
Neighborhood Stabilization Program (NSP) designated areas
Distressed or Underserved Nonmetropolitan Middle-Income Geographies
The Bank may elect to allocate the dollars represented by these initiatives to either or both assessment areas.
D. General
Activities undertaken by CSC and/or other Schwab Bank subsidiaries and affiliates (including without limitation a community development corporation formed for the purpose of fulfilling the Bank’s CRA obligations) may be counted toward attainment of targets in all of the above categories, provided that such activities are not claimed by any other institution.

IX. Point Matrices for Each Plan Year
Loans and Investments ($ in
thousands)
Minimum Minimum Points Minimum Points
Loans $3,000 2.0 $3,750 9.0 2.5 $5,250 11.0 3.0
Investments $3,000 2.0 $3,750 9.0 2.5 $5,250 11.0 3.0
Subtotal
Loans $30,000 2.0 $37,500 9.0 2.5 $52,500 11.0 3.0
Investments $30,000 2.0 $37,500 9.0 2.5 $52,500 11.0 3.0
Subtotal
AA or BSRALoans or
Investments$134,000 N/A $197,500 N/A N/A $234,500 N/A N/A
Total $200,000 $280,000 $350,000
Community Development
Services
Points Minimum Points Minimum Points
Reno 5.0 2.0 600 7.0 2.5 800 9.0 3.0
Bay Area 5.0 2.0 1200 7.0 2.5 1500 9.0 3.0
Performance Evaluation -
Points NeededReno Bay Area Combined
Satisfactory 20.5 20.5 41.0
Outstanding* 31.0 31.0 62.0
*Achievement of Level 2 in the category of Community Development Loans and Investments in both assessment areas is required for an Outstanding rating.
Number of service hours
Community
Development
Services
400
750
Metric Geography Component Test
Level 1
Quantitative Qualitative
Points
Qualitative
Points
$105,000
N/A
Quantitative Qualitative
PointsMinimum
Level 2 Level 3
Quantitative
Bay Area
7.0
7.0
$60,000 $75,000
$7,500 $10,500
Dollar volume of commitments
Reno
7.0
7.0
$6,000
PLAN YEAR 1 - January 1, 2016 - December 31, 2016
Metric Geography Component Test
Level 1 Level 2 Level 3
Quantitative Qualitative
Points
Quantitative Qualitative
Points
Quantitative Qualitative
PointsPoints

34
Loans and Investments ($ in
thousands)
Minimum Minimum Points Minimum Points
Loans $6,000 2.0 $7,500 9.0 2.5 $10,500 11.0 3.0
Investments $6,000 2.0 $7,500 9.0 2.5 $10,500 11.0 3.0
Subtotal
Loans $60,000 2.0 $75,000 9.0 2.5 $105,000 11.0 3.0
Investments $80,000 2.0 $100,000 9.0 2.5 $140,000 11.0 3.0
Subtotal
AA or BSRALoans or
Investments$398,000 N/A $580,000 N/A N/A $696,500 N/A N/A
Total $550,000 $770,000 $962,500
Community Development
Services
Points Minimum Points Minimum Points
Reno 5.0 2.0 600 7.0 2.5 800 9.0 3.0
Bay Area 5.0 2.0 1200 7.0 2.5 1500 9.0 3.0
Performance Evaluation -
Points NeededReno Bay Area Combined
Satisfactory 20.5 20.5 41.0
Outstanding* 31.0 31.0 62.0
*Achievement of Level 2 in the category of Community Development Loans and Investments in both assessment areas is required for an Outstanding rating.
PLAN YEAR 2 - January 1, 2017 - December 31, 2017
$21,000$15,000
Metric Geography Component Test
Level 1 Level 2 Level 3
Quantitative Qualitative
Points
Quantitative Qualitative
Points
Quantitative Qualitative
PointsPoints
Dollar volume of commitments
Reno
7.0
7.0
$12,000
Bay Area
7.0
7.0
$140,000
N/A
Qualitative
PointsMinimum
$175,000 $245,000
Number of service hours
Community
Development
Services
400
750
Metric Geography Component Test
Level 1 Level 2 Level 3
Quantitative Qualitative
Points
Quantitative Qualitative
Points
Quantitative

35
Loans and Investments ($ in
thousands)
Minimum Minimum Points Minimum Points
Loans $10,000 2.0 $12,500 9.0 2.5 $17,500 11.0 3.0
Investments $10,000 2.0 $12,500 9.0 2.5 $17,500 11.0 3.0
Subtotal
Loans $110,000 2.0 $137,500 9.0 2.5 $192,500 11.0 3.0
Investments $140,000 2.0 $175,000 9.0 2.5 $245,000 11.0 3.0
Subtotal
AA or BSRA Loans or Investments $730,000 N/A $1,062,500 N/A N/A $1,277,500 N/A N/A
Total $1,000,000 $1,400,000 $1,750,000
Community Development
Services
Points Minimum Points Minimum Points
Reno 5.0 2.0 600 7.0 2.5 800 9.0 3.0
Bay Area 5.0 2.0 1200 7.0 2.5 1500 9.0 3.0
Performance Evaluation -
Points NeededReno Bay Area Combined
Satisfactory 20.5 20.5 41.0
Outstanding* 31.0 31.0 62.0
*Achievement of Level 2 in the category of Community Development Loans and Investments in both assessment areas is required for an Outstanding rating.
PLAN YEAR 3 - January 1, 2018 - December 31, 2018
$25,000 $35,000
Qualitative
Points
Qualitative
Points
$437,500
Metric Geography Component Test
Level 1 Level 2 Level 3
Quantitative Qualitative
Points
Quantitative Quantitative
Points
Qualitative
PointsMinimum
Dollar volume of commitments
Reno
7.0
7.0
$20,000
Bay Area
7.0
7.0
$250,000
N/A
$312,500
Number of service hours
Community
Development
Services
400
750
Metric Geography Component Test
Level 1 Level 2 Level 3
Quantitative Qualitative
Points
Quantitative Qualitative
Points
Quantitative

X. Appendix A: Notice of Proposed Community Reinvestment Act Strategic Plan
This public notice was published in the following newspapers of general circulation within Charles Schwab Bank’s current and proposed assessment areas:
Reno Gazette-Journal
San Francisco Chronicle
Notice Regarding Public Inspection of Proposed CRA Strategic Plan
Charles Schwab Bank
Community Reinvestment Act Strategic Plan (the “Strategic Plan”)
The Community Reinvestment Act (“CRA”) regulations require a bank that has developed a Strategic Plan to publish notice of the Strategic Plan and solicit formal written public comment for at least a 30-day period. In conformance with this requirement, Charles Schwab Bank hereby provides notice to the public of its plan to submit a CRA Strategic Plan to the Office of the Comptroller of the Currency (“OCC”).
Written comments from the public concerning the Strategic Plan are encouraged. Individuals may review the Strategic Plan on-site at one of the Bank’s branch locations (listed at http://www.schwab.com/public/schwab/nn/branch-locator/branches_bank.html). To obtain a copy of the Bank’s Strategic Plan at no charge to the requesting party, individuals may request a copy by email, phone or mail (by contacting the Bank’s CRA Officer at [email protected], 211 Main St, San Francisco, CA 94105, or, 415-667-9123).
All written comments regarding the Strategic Plan should be directed to the Bank’s CRA Officer at the address or email listed above. Comments and suggestions will be accepted until, following which time the Strategic Plan will be submitted for approval to the OCC. The Bank will review all comments and incorporate suggestions to the Strategic Plan at its discretion. The Bank received a rating on its last Performance Evaluation under the CRA, as of. Copies of same are also available upon request.

37
XI. Appendix B: Maps and Census Tract Information
Reno-Sparks, NV Assessment Area
State: Nevada (32)
Metropolitan Division: Reno - Sparks MSA (39900)
County: Storey (029)
Census Tract
9702.00
County: Washoe (031)
Census Tracts
1.01 10.11 14.00 21.06 23.02 26.11 27.06 31.10 35.07 9802.00
1.02 10.12 15.01 21.07 24.01 26.12 27.07 32.02 35.08 9803.00
2.01 10.13 15.02 22.04 24.06 26.13 28.01 32.03 35.09 9901.00
2.02 10.14 17.01 22.05 24.07 26.14 28.02 32.04 35.10
3.00 10.15 17.02 22.06 24.08 26.15 29.01 33.05 35.11
4.00 11.01 18.01 22.07 24.09 26.16 29.02 33.06 35.12
7.00 11.03 18.02 22.08 24.10 26.17 30.00 33.07 35.13
9.00 11.04 19.01 22.09 24.11 26.18 31.01 33.08 35.14
10.05 11.05 19.02 22.10 24.12 26.19 31.05 33.09 35.15
10.08 12.01 21.03 22.11 25.00 27.03 31.06 35.01 9402.00
10.09 12.02 21.04 22.12 26.03 27.04 31.08 35.03 9800.00
10.10 13.00 21.05 23.01 26.10 27.05 31.09 35.04 9801.00
Reno-Sparks MSA
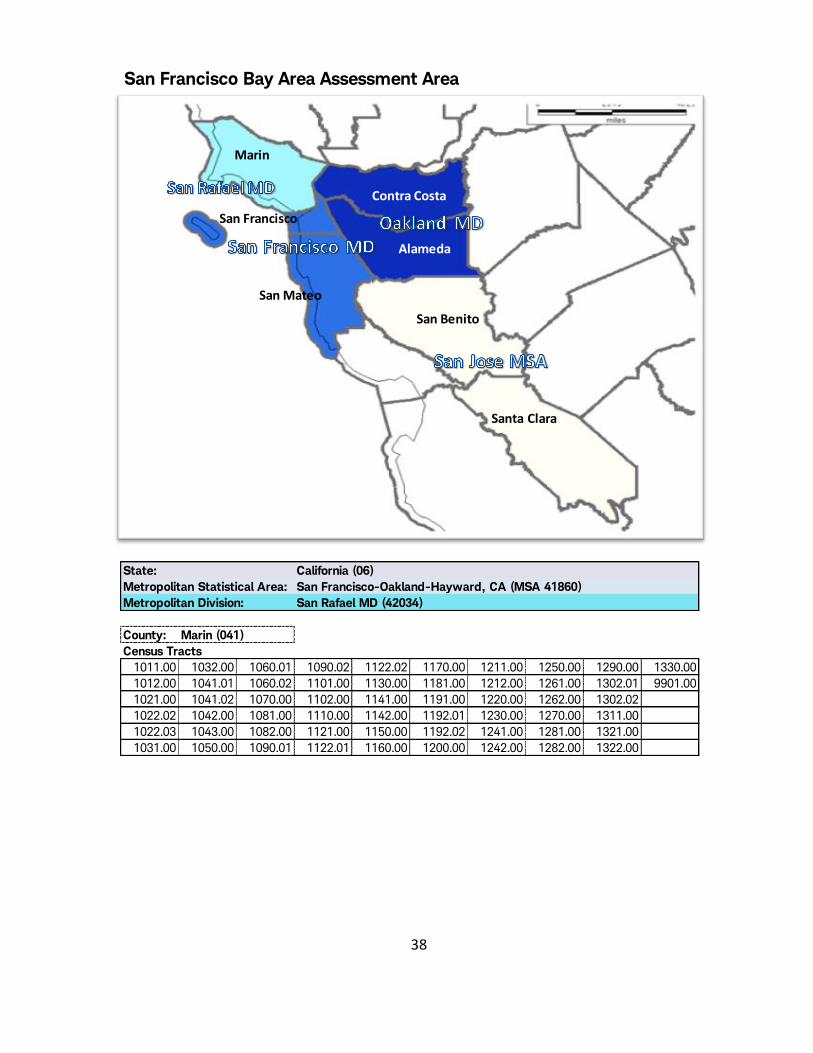
38
San Francisco Bay Area Assessment Area
State: California (06)
Metropolitan Statistical Area: San Francisco-Oakland-Hayward, CA (MSA 41860)
Metropolitan Division: San Rafael MD (42034)
County: Marin (041)
Census Tracts
1011.00 1032.00 1060.01 1090.02 1122.02 1170.00 1211.00 1250.00 1290.00 1330.00
1012.00 1041.01 1060.02 1101.00 1130.00 1181.00 1212.00 1261.00 1302.01 9901.00
1021.00 1041.02 1070.00 1102.00 1141.00 1191.00 1220.00 1262.00 1302.02
1022.02 1042.00 1081.00 1110.00 1142.00 1192.01 1230.00 1270.00 1311.00
1022.03 1043.00 1082.00 1121.00 1150.00 1192.02 1241.00 1281.00 1321.00
1031.00 1050.00 1090.01 1122.01 1160.00 1200.00 1242.00 1282.00 1322.00
Alameda
San Benito
Santa Clara
MarinContra Costa
San Francisco
San Mateo
Contra Costa
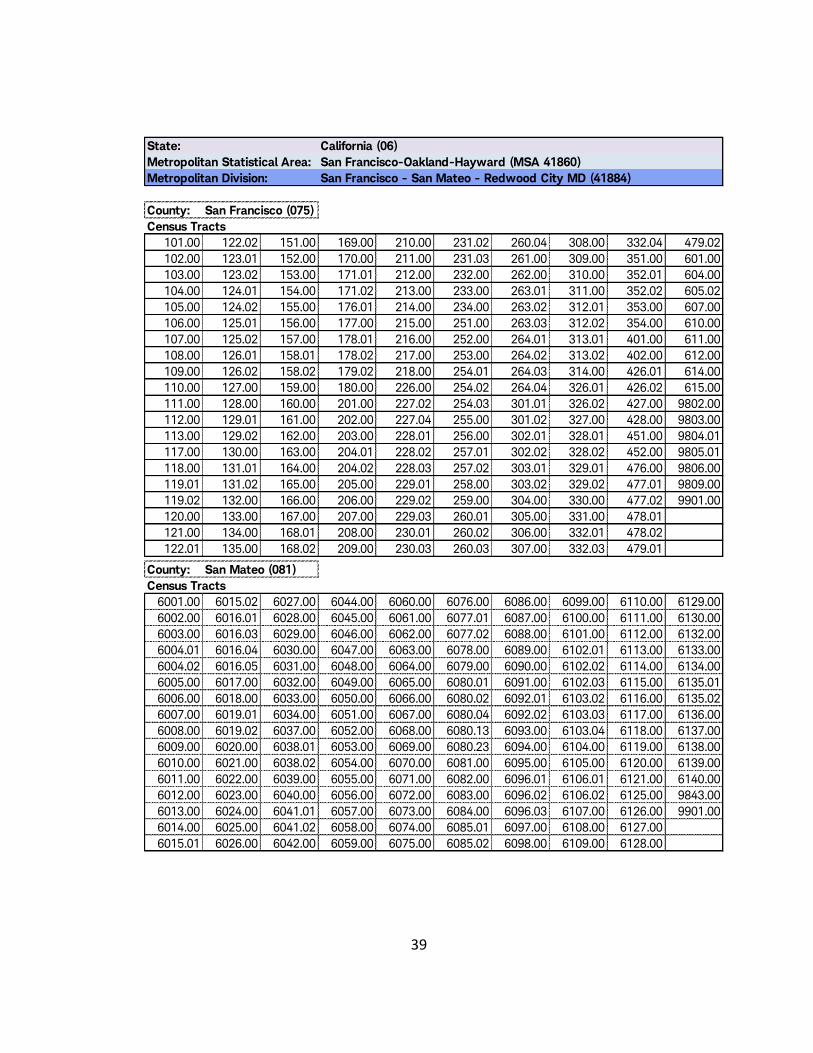
39
State: California (06)
Metropolitan Statistical Area: San Francisco-Oakland-Hayward (MSA 41860)
Metropolitan Division: San Francisco - San Mateo - Redwood City MD (41884)
County: San Francisco (075)
Census Tracts
101.00 122.02 151.00 169.00 210.00 231.02 260.04 308.00 332.04 479.02
102.00 123.01 152.00 170.00 211.00 231.03 261.00 309.00 351.00 601.00
103.00 123.02 153.00 171.01 212.00 232.00 262.00 310.00 352.01 604.00
104.00 124.01 154.00 171.02 213.00 233.00 263.01 311.00 352.02 605.02
105.00 124.02 155.00 176.01 214.00 234.00 263.02 312.01 353.00 607.00
106.00 125.01 156.00 177.00 215.00 251.00 263.03 312.02 354.00 610.00
107.00 125.02 157.00 178.01 216.00 252.00 264.01 313.01 401.00 611.00
108.00 126.01 158.01 178.02 217.00 253.00 264.02 313.02 402.00 612.00
109.00 126.02 158.02 179.02 218.00 254.01 264.03 314.00 426.01 614.00
110.00 127.00 159.00 180.00 226.00 254.02 264.04 326.01 426.02 615.00
111.00 128.00 160.00 201.00 227.02 254.03 301.01 326.02 427.00 9802.00
112.00 129.01 161.00 202.00 227.04 255.00 301.02 327.00 428.00 9803.00
113.00 129.02 162.00 203.00 228.01 256.00 302.01 328.01 451.00 9804.01
117.00 130.00 163.00 204.01 228.02 257.01 302.02 328.02 452.00 9805.01
118.00 131.01 164.00 204.02 228.03 257.02 303.01 329.01 476.00 9806.00
119.01 131.02 165.00 205.00 229.01 258.00 303.02 329.02 477.01 9809.00
119.02 132.00 166.00 206.00 229.02 259.00 304.00 330.00 477.02 9901.00
120.00 133.00 167.00 207.00 229.03 260.01 305.00 331.00 478.01
121.00 134.00 168.01 208.00 230.01 260.02 306.00 332.01 478.02
122.01 135.00 168.02 209.00 230.03 260.03 307.00 332.03 479.01
County: San Mateo (081)
Census Tracts
6001.00 6015.02 6027.00 6044.00 6060.00 6076.00 6086.00 6099.00 6110.00 6129.00
6002.00 6016.01 6028.00 6045.00 6061.00 6077.01 6087.00 6100.00 6111.00 6130.00
6003.00 6016.03 6029.00 6046.00 6062.00 6077.02 6088.00 6101.00 6112.00 6132.00
6004.01 6016.04 6030.00 6047.00 6063.00 6078.00 6089.00 6102.01 6113.00 6133.00
6004.02 6016.05 6031.00 6048.00 6064.00 6079.00 6090.00 6102.02 6114.00 6134.00
6005.00 6017.00 6032.00 6049.00 6065.00 6080.01 6091.00 6102.03 6115.00 6135.01
6006.00 6018.00 6033.00 6050.00 6066.00 6080.02 6092.01 6103.02 6116.00 6135.02
6007.00 6019.01 6034.00 6051.00 6067.00 6080.04 6092.02 6103.03 6117.00 6136.00
6008.00 6019.02 6037.00 6052.00 6068.00 6080.13 6093.00 6103.04 6118.00 6137.00
6009.00 6020.00 6038.01 6053.00 6069.00 6080.23 6094.00 6104.00 6119.00 6138.00
6010.00 6021.00 6038.02 6054.00 6070.00 6081.00 6095.00 6105.00 6120.00 6139.00
6011.00 6022.00 6039.00 6055.00 6071.00 6082.00 6096.01 6106.01 6121.00 6140.00
6012.00 6023.00 6040.00 6056.00 6072.00 6083.00 6096.02 6106.02 6125.00 9843.00
6013.00 6024.00 6041.01 6057.00 6073.00 6084.00 6096.03 6107.00 6126.00 9901.00
6014.00 6025.00 6041.02 6058.00 6074.00 6085.01 6097.00 6108.00 6127.00
6015.01 6026.00 6042.00 6059.00 6075.00 6085.02 6098.00 6109.00 6128.00

40
State: California (06)
Metropolitan Statistical Area: San Francisco-Oakland-Hayward (MSA 41860)
Metropolitan Division: Oakland-Hayward-Berkeley MD (36084)
County: Alameda (001)
Census Tracts
4001.00 4041.01 4071.01 4202.00 4240.02 4322.00 4364.01 4403.33 4429.00 4507.44
4002.00 4041.02 4071.02 4203.00 4251.01 4323.00 4364.02 4403.34 4430.01 4507.45
4003.00 4042.00 4072.00 4204.00 4251.02 4324.00 4365.00 4403.35 4430.02 4507.46
4004.00 4043.00 4073.00 4205.00 4251.03 4325.01 4366.01 4403.36 4431.02 4507.50
4005.00 4044.00 4074.00 4206.00 4251.04 4325.02 4366.02 4411.00 4431.03 4507.51
4006.00 4045.01 4075.00 4211.00 4261.00 4326.00 4367.00 4412.00 4431.04 4507.52
4007.00 4045.02 4076.00 4212.00 4262.00 4327.00 4368.00 4413.01 4431.05 4511.01
4008.00 4046.00 4077.00 4213.00 4271.00 4328.00 4369.00 4413.02 4432.00 4511.02
4009.00 4047.00 4078.00 4214.00 4272.00 4330.00 4370.00 4414.01 4433.01 4512.01
4010.00 4048.00 4079.00 4215.00 4273.00 4331.02 4371.01 4414.02 4433.21 4512.02
4011.00 4049.00 4080.00 4216.00 4276.00 4331.03 4371.02 4415.01 4433.22 4513.00
4012.00 4050.00 4081.00 4217.00 4277.00 4331.04 4372.00 4415.03 4441.00 4514.01
4013.00 4051.00 4082.00 4218.00 4278.00 4332.00 4373.00 4415.21 4442.00 4514.03
4014.00 4052.00 4083.00 4219.00 4279.00 4333.00 4374.00 4415.22 4443.01 4514.04
4015.00 4053.01 4084.00 4220.00 4280.00 4334.00 4375.00 4415.23 4443.02 4515.01
4016.00 4053.02 4085.00 4221.00 4281.00 4335.00 4376.00 4415.24 4444.00 4515.03
4017.00 4054.01 4086.00 4222.00 4282.00 4336.00 4377.01 4416.01 4445.00 4515.04
4018.00 4054.02 4087.00 4223.00 4283.01 4337.00 4377.02 4416.02 4446.01 4515.05
4022.00 4055.00 4088.00 4224.00 4283.02 4338.00 4378.00 4417.00 4446.02 4515.06
4024.00 4056.00 4089.00 4225.00 4284.00 4339.00 4379.00 4418.00 4501.01 4516.01
4025.00 4057.00 4090.00 4226.00 4285.00 4340.00 4380.00 4419.21 4501.02 4516.02
4026.00 4058.00 4091.00 4227.00 4286.00 4351.02 4381.00 4419.23 4502.00 4517.01
4027.00 4059.01 4092.00 4228.00 4287.00 4351.03 4382.01 4419.24 4503.00 4517.03
4028.00 4059.02 4093.00 4229.00 4301.01 4351.04 4382.03 4419.25 4504.00 4517.04
4029.00 4060.00 4094.00 4230.00 4301.02 4352.00 4382.04 4419.26 4505.01 9819.00
4030.00 4061.00 4095.00 4231.00 4302.00 4353.00 4383.00 4419.27 4505.02 9820.00
4031.00 4062.01 4096.00 4232.00 4303.00 4354.00 4384.00 4420.00 4506.01 9832.00
4033.00 4062.02 4097.00 4233.00 4304.00 4355.00 4401.00 4421.00 4506.02
4034.00 4063.00 4098.00 4234.00 4305.00 4356.01 4402.00 4422.00 4506.03
4035.01 4064.00 4099.00 4235.00 4306.00 4356.02 4403.01 4423.01 4506.04
4035.02 4065.00 4100.00 4236.01 4307.00 4357.00 4403.04 4423.02 4506.05
4036.00 4066.01 4101.00 4236.02 4308.00 4358.00 4403.05 4424.00 4506.06
4037.01 4066.02 4102.00 4237.00 4309.00 4359.00 4403.06 4425.00 4506.07
4037.02 4067.00 4103.00 4238.00 4310.00 4360.00 4403.07 4426.01 4507.01
4038.00 4068.00 4104.00 4239.01 4311.00 4361.00 4403.08 4426.02 4507.41
4039.00 4069.00 4105.00 4239.02 4312.00 4362.00 4403.31 4427.00 4507.42
4040.00 4070.00 4201.00 4240.01 4321.00 4363.00 4403.32 4428.00 4507.43

41
County: Contra Costa (013)
Census Tracts
3010.00 3060.03 3141.02 3260.00 3373.00 3451.11 3512.00 3553.01 3640.02 3800.00
3020.05 3060.04 3141.03 3270.00 3381.01 3451.12 3521.01 3553.02 3650.02 3810.00
3020.06 3071.01 3141.04 3280.00 3381.02 3451.13 3521.02 3553.04 3650.03 3820.00
3020.07 3071.02 3142.00 3290.00 3382.01 3451.14 3522.01 3553.06 3660.01 3830.00
3020.08 3072.01 3150.00 3300.00 3382.03 3451.15 3522.02 3560.01 3660.02 3840.00
3020.09 3072.02 3160.00 3310.00 3382.04 3451.16 3530.01 3560.02 3671.00 3851.00
3020.10 3072.04 3170.00 3320.00 3383.01 3452.02 3530.02 3570.00 3672.00 3852.00
3031.02 3072.05 3180.00 3331.01 3383.02 3452.03 3540.01 3580.00 3680.01 3860.00
3031.03 3080.01 3190.00 3331.02 3390.01 3452.04 3540.02 3591.02 3680.02 3870.00
3032.01 3080.02 3200.01 3332.00 3390.02 3461.01 3551.07 3591.03 3690.01 3880.00
3032.02 3090.00 3200.03 3340.01 3400.01 3461.02 3551.08 3591.04 3690.02 3891.00
3032.03 3100.00 3200.04 3340.04 3400.02 3462.01 3551.09 3591.05 3700.00 3892.00
3032.04 3110.00 3211.01 3340.06 3410.00 3462.03 3551.10 3592.02 3710.00 3901.00
3032.05 3120.00 3211.02 3342.00 3430.01 3462.04 3551.11 3592.03 3720.00 3902.00
3040.01 3131.01 3211.03 3350.00 3430.02 3470.00 3551.12 3592.04 3730.00 3910.00
3040.02 3131.02 3212.00 3361.01 3430.03 3480.00 3551.13 3601.01 3740.00 3920.00
3040.03 3131.03 3220.00 3361.02 3451.01 3490.00 3551.14 3601.02 3750.00 3922.00
3040.04 3132.03 3230.00 3362.01 3451.02 3500.00 3551.15 3602.00 3760.00 3923.00
3040.05 3132.04 3240.01 3362.02 3451.03 3511.01 3551.16 3610.00 3770.00
3050.00 3132.05 3240.02 3371.00 3451.05 3511.02 3551.17 3620.00 3780.00
3060.02 3132.06 3250.00 3372.00 3451.08 3511.03 3552.00 3630.00 3790.00
State: California (06)
Metropolitan Statistical Area: San Jose - Sunnyvale - Santa Clara MSA (41940)
County: San Benito (069)
Census Tracts
1.00 3.00 5.01 6.00 7.02 8.02
2.00 4.00 5.02 7.01 8.01

42
County: Santa Clara (085)
Census Tracts
5001.00 5029.01 5033.13 5038.04 5045.07 5063.02 5078.07 5092.01 5117.02 5120.42
5002.00 5029.02 5033.15 5039.02 5046.01 5063.04 5078.08 5092.02 5117.04 5120.43
5003.00 5029.03 5033.21 5039.03 5046.02 5063.05 5079.03 5093.02 5117.05 5120.45
5004.00 5029.06 5033.22 5040.01 5047.00 5064.01 5079.04 5093.03 5117.07 5120.47
5005.00 5029.07 5033.23 5040.02 5048.02 5064.02 5079.05 5093.04 5118.00 5120.52
5006.00 5029.08 5033.24 5041.01 5048.03 5065.01 5079.06 5094.01 5119.05 5120.53
5008.00 5029.09 5033.25 5041.02 5048.05 5065.02 5080.01 5094.03 5119.07 5121.00
5009.01 5029.10 5033.26 5042.01 5048.06 5065.03 5080.03 5094.04 5119.09 5122.00
5009.02 5030.01 5033.27 5042.02 5049.01 5066.01 5080.04 5095.00 5119.10 5123.05
5010.00 5030.02 5033.29 5043.07 5050.01 5066.03 5081.01 5096.00 5119.11 5123.07
5011.01 5030.03 5033.30 5043.08 5050.06 5066.04 5081.02 5097.00 5119.12 5123.08
5011.02 5031.05 5033.31 5043.11 5050.07 5066.05 5082.02 5098.01 5119.13 5123.09
5012.00 5031.08 5033.32 5043.14 5050.08 5066.06 5082.03 5098.02 5119.14 5123.10
5013.00 5031.10 5033.33 5043.15 5050.09 5067.01 5082.04 5099.01 5119.15 5123.11
5014.01 5031.11 5033.34 5043.16 5051.00 5067.02 5083.01 5099.02 5119.16 5123.12
5014.02 5031.12 5033.36 5043.17 5052.02 5067.03 5083.03 5100.01 5120.01 5123.13
5015.01 5031.13 5033.37 5043.18 5052.03 5068.01 5083.04 5100.02 5120.05 5123.14
5015.02 5031.15 5034.01 5043.19 5053.01 5068.02 5084.01 5101.00 5120.17 5124.01
5016.00 5031.16 5034.02 5043.20 5053.02 5068.03 5084.03 5102.00 5120.19 5124.02
5017.00 5031.17 5035.04 5043.21 5053.03 5068.04 5084.04 5103.00 5120.20 5125.03
5018.00 5031.18 5035.06 5043.22 5053.04 5069.00 5085.03 5104.00 5120.21 5125.05
5019.00 5031.21 5035.07 5043.23 5053.05 5070.01 5085.04 5105.00 5120.22 5125.06
5020.01 5031.22 5035.08 5044.10 5054.01 5070.02 5085.05 5106.00 5120.23 5125.08
5020.02 5031.23 5035.09 5044.11 5054.02 5071.00 5085.07 5107.00 5120.24 5125.09
5021.01 5032.04 5035.10 5044.12 5054.03 5072.03 5085.08 5108.01 5120.25 5125.10
5021.02 5032.07 5035.11 5044.13 5055.00 5072.05 5086.01 5108.02 5120.26 5126.02
5022.01 5032.08 5036.01 5044.14 5056.00 5072.06 5086.02 5108.03 5120.27 5126.03
5022.02 5032.10 5036.02 5044.15 5057.00 5073.01 5087.03 5109.00 5120.29 5126.04
5023.01 5032.11 5037.03 5044.16 5058.00 5073.02 5087.04 5110.00 5120.30 5130.00
5023.02 5032.12 5037.07 5044.17 5059.00 5074.01 5088.00 5111.00 5120.31 5135.00
5024.00 5032.13 5037.08 5044.18 5060.00 5074.02 5089.00 5112.00 5120.32
5025.00 5032.14 5037.09 5044.20 5061.01 5075.00 5090.00 5113.01 5120.33
5026.01 5032.17 5037.10 5044.21 5061.02 5076.00 5091.02 5113.02 5120.34
5026.03 5032.18 5037.11 5044.22 5061.03 5077.01 5091.05 5114.00 5120.35
5026.04 5033.04 5037.12 5044.23 5062.02 5077.02 5091.06 5115.00 5120.36
5027.01 5033.05 5037.13 5045.04 5062.03 5077.03 5091.07 5116.08 5120.37
5027.02 5033.06 5038.02 5045.05 5062.04 5078.05 5091.08 5116.09 5120.38
5028.00 5033.12 5038.03 5045.06 5063.01 5078.06 5091.09 5117.01 5120.39


