Page 1
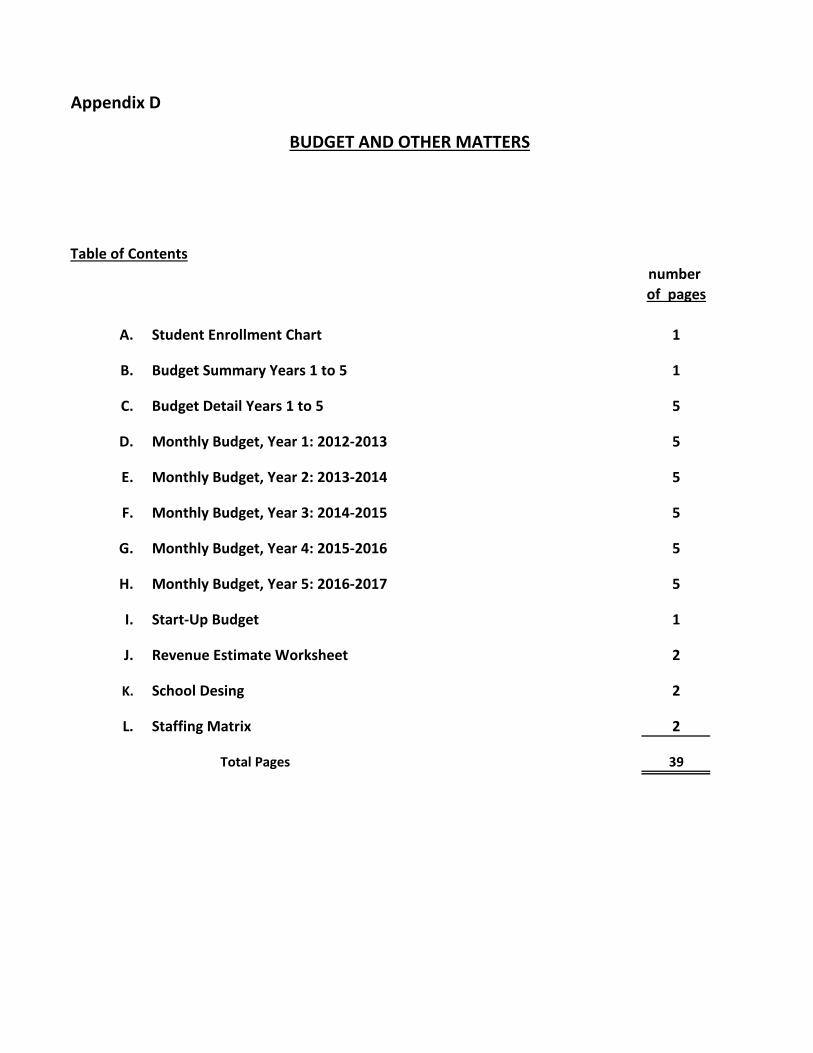
Appendix D
BUDGET AND OTHER MATTERS
Table of Contentsnumber of pages
A. Student Enrollment Chart 1
B. Budget Summary Years 1 to 5 1
C. Budget Detail Years 1 to 5 5
D. Monthly Budget, Year 1: 2012-2013 5
E. Monthly Budget, Year 2: 2013-2014 5
F. Monthly Budget, Year 3: 2014-2015 5
G. Monthly Budget, Year 4: 2015-2016 5
H. Monthly Budget, Year 5: 2016-2017 5
I. Start-Up Budget 1
J. Revenue Estimate Worksheet 2
K. School Desing 2
L. Staffing Matrix 2
Total Pages 39
Page 2
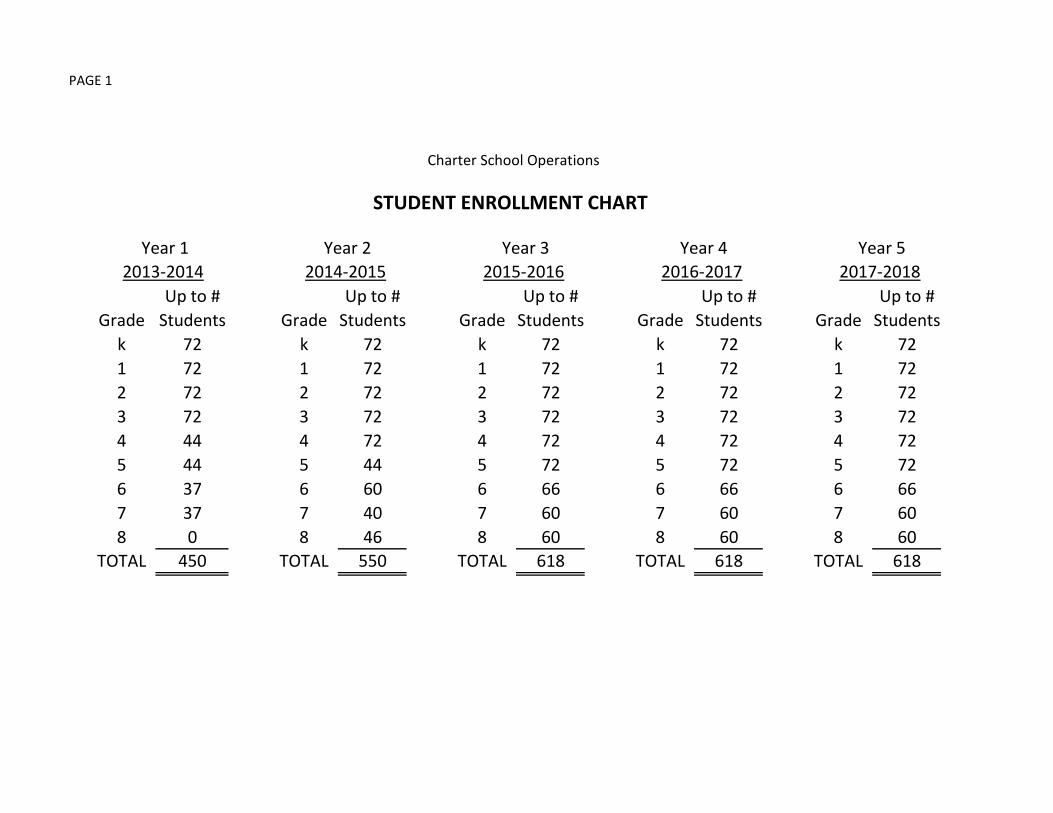
PAGE 1
Charter School Operations
STUDENT ENROLLMENT CHART
Year 1 Year 2 Year 3 Year 4 Year 5 2013-2014 2014-2015 2015-2016 2016-2017 2017-2018
Up to # Up to # Up to # Up to # Up to #Grade Students Grade Students Grade Students Grade Students Grade Students
k 72 k 72 k 72 k 72 k 721 72 1 72 1 72 1 72 1 722 72 2 72 2 72 2 72 2 723 72 3 72 3 72 3 72 3 724 44 4 72 4 72 4 72 4 725 44 5 44 5 72 5 72 5 726 37 6 60 6 66 6 66 6 667 37 7 40 7 60 7 60 7 608 0 8 46 8 60 8 60 8 60
TOTAL 450 TOTAL 550 TOTAL 618 TOTAL 618 TOTAL 618
Page 3
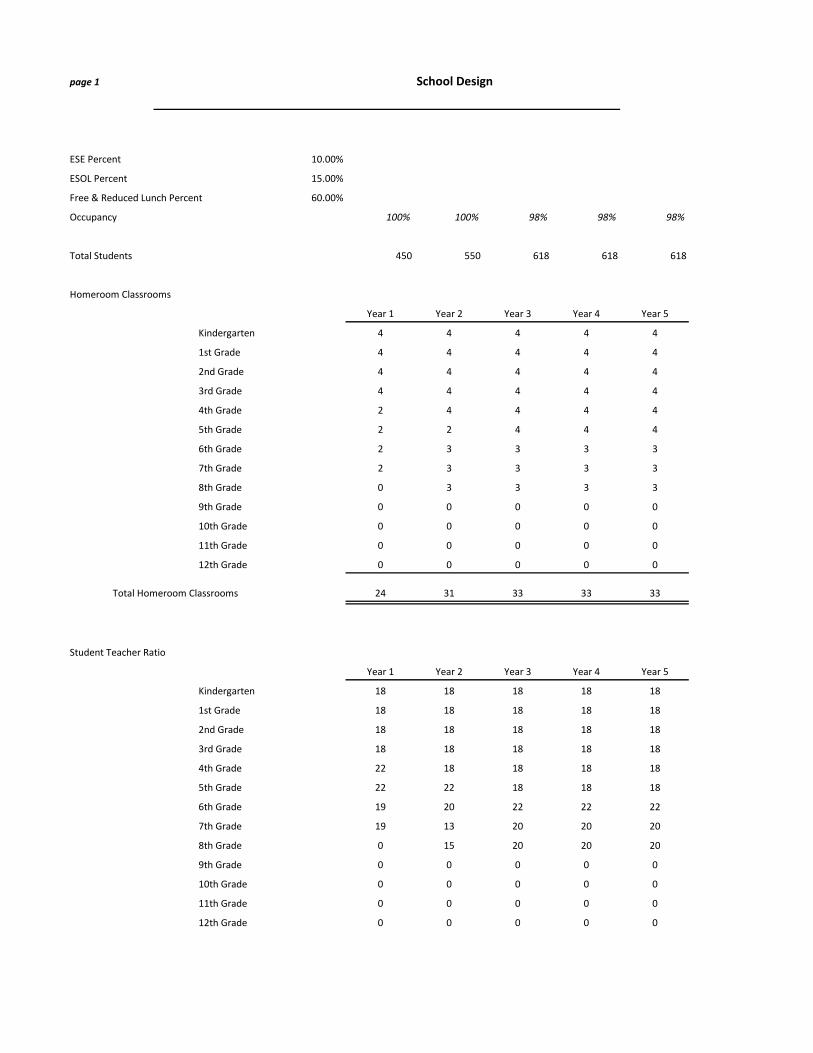
page 1 School Design
ESE Percent 10.00%
ESOL Percent 15.00%
Free & Reduced Lunch Percent 60.00%
Occupancy 100% 100% 98% 98% 98%
Total Students 450 550 618 618 618
Homeroom Classrooms
Year 1 Year 2 Year 3 Year 4 Year 5
Kindergarten 4 4 4 4 4
1st Grade 4 4 4 4 4
2nd Grade 4 4 4 4 4
3rd Grade 4 4 4 4 4
4th Grade 2 4 4 4 4
5th Grade 2 2 4 4 4
6th Grade 2 3 3 3 3
7th Grade 2 3 3 3 3
8th Grade 0 3 3 3 3
9th Grade 0 0 0 0 0
10th Grade 0 0 0 0 0
11th Grade 0 0 0 0 0
12th Grade 0 0 0 0 0
Total Homeroom Classrooms 24 31 33 33 33
Student Teacher Ratio
Year 1 Year 2 Year 3 Year 4 Year 5
Kindergarten 18 18 18 18 18
1st Grade 18 18 18 18 18
2nd Grade 18 18 18 18 18
3rd Grade 18 18 18 18 18
4th Grade 22 18 18 18 18
5th Grade 22 22 18 18 18
6th Grade 19 20 22 22 22
7th Grade 19 13 20 20 20
8th Grade 0 15 20 20 20
9th Grade 0 0 0 0 0
10th Grade 0 0 0 0 0
11th Grade 0 0 0 0 0
12th Grade 0 0 0 0 0
Page 4
page 2 School Design
Student by Grade Budgeted Enrollment
Year 1 Year 2 Year 3 Year 4 Year 5
Kindergarten 72 72 72 72 72
1st Grade 72 72 72 72 72
2nd Grade 72 72 72 72 72
3rd Grade 72 72 72 72 72
4th Grade 44 72 72 72 72
5th Grade 44 44 72 72 72
6th Grade 37 60 66 66 66
7th Grade 37 40 60 60 60
8th Grade 0 46 60 60 60
9th Grade 0 0 0 0 0
10th Grade 0 0 0 0 0
11th Grade 0 0 0 0 0
12th Grade 0 0 0 0 0
Total Student by Grade Budgeted Enrollment 450 550 618 618 618
Grade Matrix
Level Level FTE
ESE Guaranteed Allocation:
Additional Funding from the K-3 251 26.6
ESE Guaranteed Allocation K-3 252
Enter the FTE from 111, 112, K-3 253
& 113 by grade and natrix 4-8 251 18.4
level. Students who do not 4-8 252
have a matrix level should be 4-8 253
considered 251. The total 9-12 251 0
should equal all FTE from 9-12 252
programs 111, 112, &113 above. 9-12 253
Total ESE: 45
Page 5
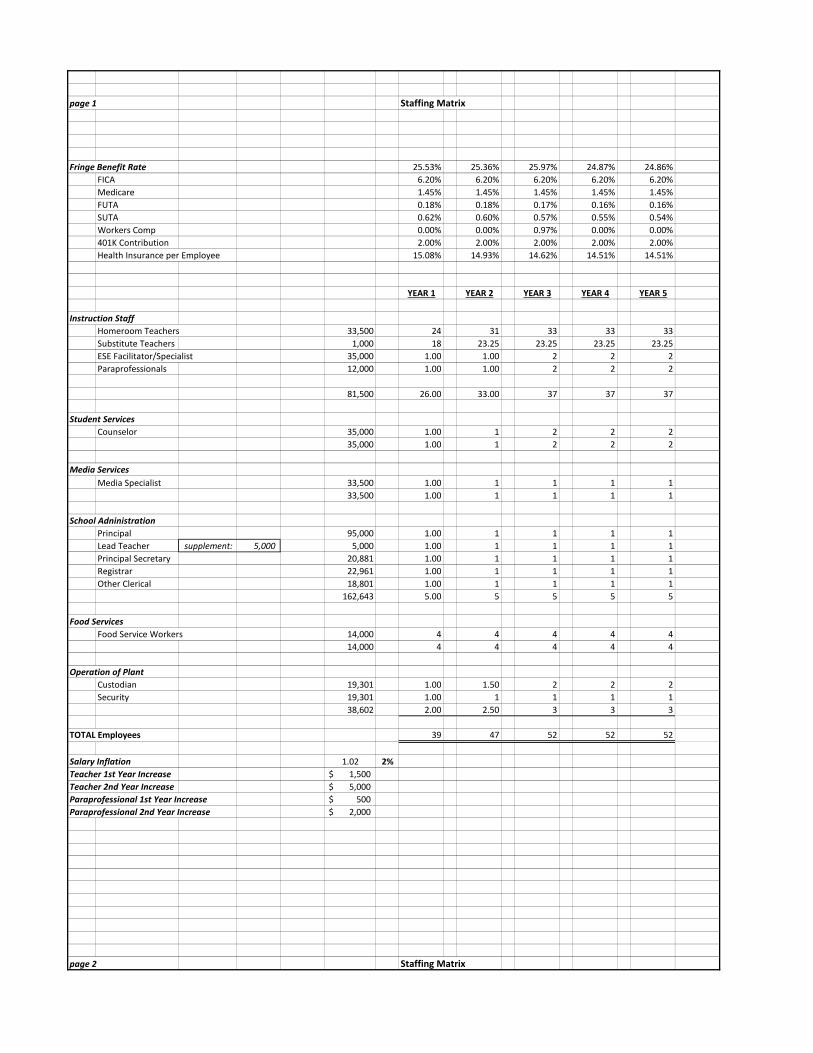
page 1 Staffing Matrix
Fringe Benefit Rate 25.53% 25.36% 25.97% 24.87% 24.86%FICA 6.20% 6.20% 6.20% 6.20% 6.20%Medicare 1.45% 1.45% 1.45% 1.45% 1.45%FUTA 0.18% 0.18% 0.17% 0.16% 0.16%SUTA 0.62% 0.60% 0.57% 0.55% 0.54%Workers Comp 0.00% 0.00% 0.97% 0.00% 0.00%401K Contribution 2.00% 2.00% 2.00% 2.00% 2.00%Health Insurance per Employee 15.08% 14.93% 14.62% 14.51% 14.51%
YEAR 1 YEAR 2 YEAR 3 YEAR 4 YEAR 5
Instruction StaffHomeroom Teachers 33,500 24 31 33 33 33Substitute Teachers 1,000 18 23.25 23.25 23.25 23.25ESE Facilitator/Specialist 35,000 1.00 1.00 2 2 2Paraprofessionals 12,000 1.00 1.00 2 2 2
81,500 26.00 33.00 37 37 37
Student ServicesCounselor 35,000 1.00 1 2 2 2
35,000 1.00 1 2 2 2
Media Services Media Specialist 33,500 1.00 1 1 1 1
33,500 1.00 1 1 1 1
School AdninistrationPrincipal 95,000 1.00 1 1 1 1Lead Teacher supplement: 5,000 5,000 1.00 1 1 1 1Principal Secretary 20,881 1.00 1 1 1 1Registrar 22,961 1.00 1 1 1 1Other Clerical 18,801 1.00 1 1 1 1
162,643 5.00 5 5 5 5
Food ServicesFood Service Workers 14,000 4 4 4 4 4
14,000 4 4 4 4 4
Operation of PlantCustodian 19,301 1.00 1.50 2 2 2Security 19,301 1.00 1 1 1 1
38,602 2.00 2.50 3 3 3
TOTAL Employees 39 47 52 52 52
Salary Inflation 1.02 2%Teacher 1st Year Increase 1,500$ Teacher 2nd Year Increase 5,000$ Paraprofessional 1st Year Increase 500$ Paraprofessional 2nd Year Increase 2,000$
page 2 Staffing Matrix
Page 6
Masters Preparatory School K-8
YEAR 1 YEAR 2 YEAR 3 YEAR 4 YEAR 5
Instruction StaffHomeroom Teachers 804,000 1,074,500 1,236,000 1,281,980 1,313,220Substitute Teachers 18,000 23,715 24,189 24,673 25,167ESE Facilitator/Specialist 35,000 36,500 75,000 77,300 81,616Paraprofessionals 12,000 12,500 26,000 26,780 28,566
Instruction Staff 869,000 1,147,215 1,361,189 1,410,733 1,448,568Benefits: 221,863 290,899 353,546 350,913 360,083
Pupil Personnel ServicesCounselor 35,000 35,000 70,000 70,700 71,414
Pupil Personnel Services 35,000 35,000 70,000 70,700 71,414Benefits: 8,936 8,875 18,181 17,586 17,752
Media ServicesMedia Specialist 33,500 35,000 38,500 39,270 40,055
Media Services 33,500 35,000 38,500 39,270 40,055Benefits: 8,553 8,875 10,000 9,768 9,957
School AdministrationPrincipal 95,000 95,000 95,000 96,900 98,838Lead Teacher 5,000 5,000 5,000 5,000 5,000Principal Secretary 20,881 20,881 20,881 21,299 21,725Registrar 22,961 22,961 22,961 23,420 23,889Other Clerical 18,801 18,801 18,801 19,177 19,561
School Administration 162,643 162,643 162,643 165,796 169,012Benefits: 41,524 41,241 42,244 41,241 42,013
Food ServicesFood Service Workers 56,000 56,000 56,000 57,120 58,262
Food Services 56,000 56,000 56,000 57,120 58,262Benefits: 14,297 14,200 14,545 14,208 14,483
Operation of PlantCustodian 19,301 19,301 19,301 19,687 20,081security 19,301 19,301 19,301 19,687 20,081
Operation of Plant 38,602 38,602 38,602 39,374 40,162Benefits: 9,855 9,788 10,026 9,794 9,983
Total Payroll & Benefits 1,499,773 1,848,339 2,175,477 2,226,504 2,281,744
1,194,745 1,474,460 1,726,934 1,782,993 1,827,473305,028
1,499,773
0.18% 0.18% 0.17% 0.16% 0.16%0.62% 0.60% 0.57% 0.55% 0.54%
Page 7
Health Insurance per Employee $4,620 $4,736 $4,854 $4,975 $5,10015.08% 14.93% 14.62% 14.51% 14.51%
Page 8
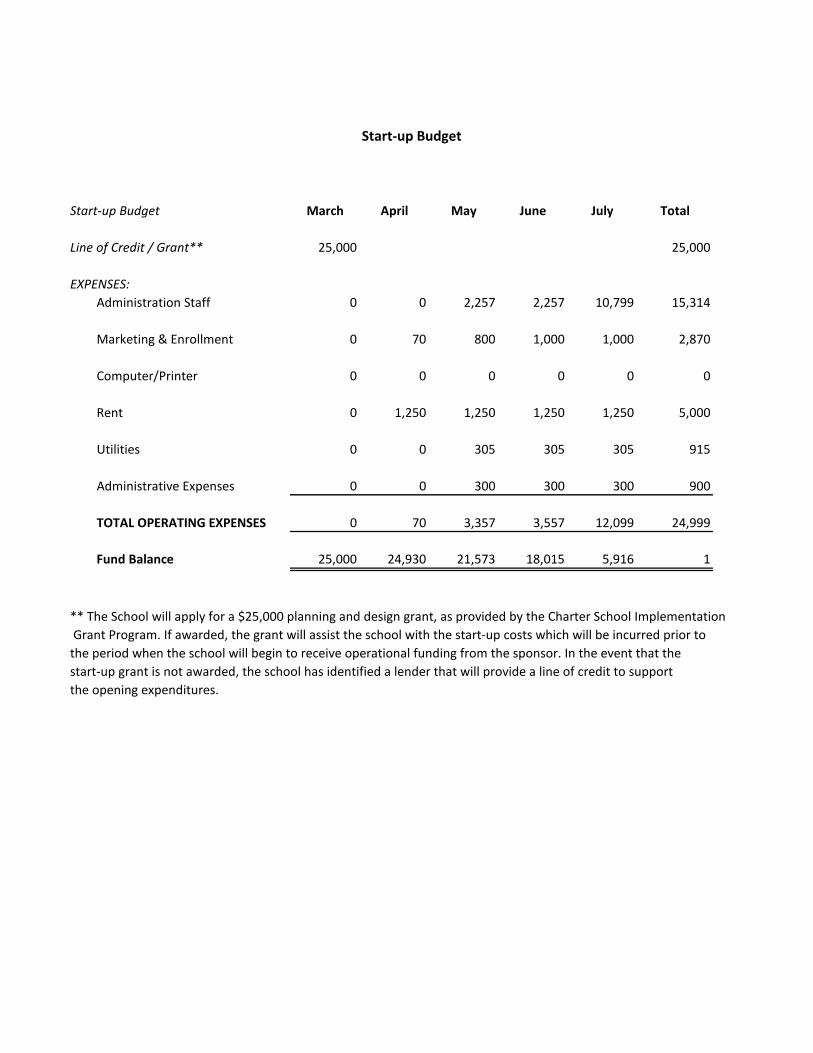
Start-up Budget
Start-up Budget March April May June July Total
Line of Credit / Grant** 25,000 25,000
EXPENSES:Administration Staff 0 0 2,257 2,257 10,799 15,314
Marketing & Enrollment 0 70 800 1,000 1,000 2,870
Computer/Printer 0 0 0 0 0 0
Rent 0 1,250 1,250 1,250 1,250 5,000
Utilities 0 0 305 305 305 915
Administrative Expenses 0 0 300 300 300 900
TOTAL OPERATING EXPENSES 0 70 3,357 3,557 12,099 24,999
Fund Balance 25,000 24,930 21,573 18,015 5,916 1
** The School will apply for a $25,000 planning and design grant, as provided by the Charter School Implementation Grant Program. If awarded, the grant will assist the school with the start-up costs which will be incurred prior tothe period when the school will begin to receive operational funding from the sponsor. In the event that the start-up grant is not awarded, the school has identified a lender that will provide a line of credit to supportthe opening expenditures.
Page 9
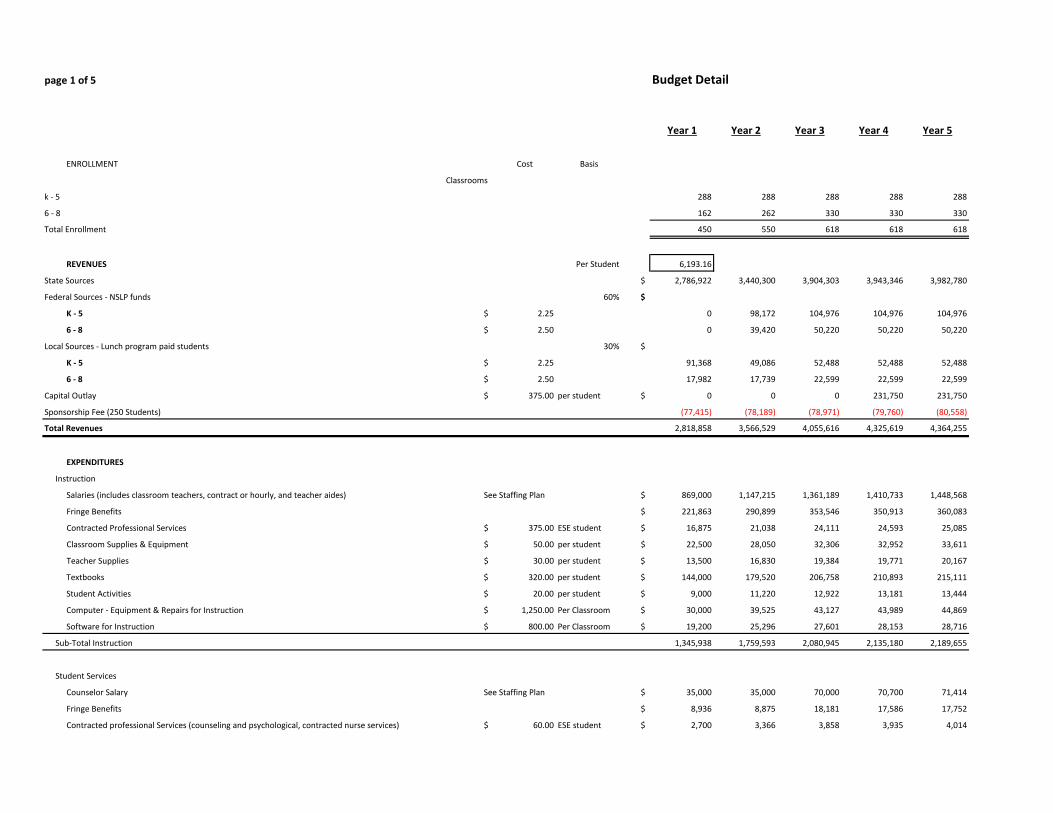
page 1 of 5 Budget Detail
Year 1 Year 2 Year 3 Year 4 Year 5
ENROLLMENT Cost Basis
Classrooms
k - 5 288 288 288 288 288
6 - 8 162 262 330 330 330
Total Enrollment 450 550 618 618 618
REVENUES Per Student 6,193.16
State Sources $ 2,786,922 3,440,300 3,904,303 3,943,346 3,982,780
Federal Sources - NSLP funds 60% $
K - 5 $ 2.25 0 98,172 104,976 104,976 104,976
6 - 8 $ 2.50 0 39,420 50,220 50,220 50,220
Local Sources - Lunch program paid students 30% $
K - 5 $ 2.25 91,368 49,086 52,488 52,488 52,488
6 - 8 $ 2.50 17,982 17,739 22,599 22,599 22,599
Capital Outlay $ 375.00 per student $ 0 0 0 231,750 231,750
Sponsorship Fee (250 Students) (77,415) (78,189) (78,971) (79,760) (80,558)
Total Revenues 2,818,858 3,566,529 4,055,616 4,325,619 4,364,255
EXPENDITURES
Instruction
Salaries (includes classroom teachers, contract or hourly, and teacher aides) See Staffing Plan $ 869,000 1,147,215 1,361,189 1,410,733 1,448,568
Fringe Benefits $ 221,863 290,899 353,546 350,913 360,083
Contracted Professional Services $ 375.00 ESE student $ 16,875 21,038 24,111 24,593 25,085
Classroom Supplies & Equipment $ 50.00 per student $ 22,500 28,050 32,306 32,952 33,611
Teacher Supplies $ 30.00 per student $ 13,500 16,830 19,384 19,771 20,167
Textbooks $ 320.00 per student $ 144,000 179,520 206,758 210,893 215,111
Student Activities $ 20.00 per student $ 9,000 11,220 12,922 13,181 13,444
Computer - Equipment & Repairs for Instruction $ 1,250.00 Per Classroom $ 30,000 39,525 43,127 43,989 44,869
Software for Instruction $ 800.00 Per Classroom $ 19,200 25,296 27,601 28,153 28,716
Sub-Total Instruction 1,345,938 1,759,593 2,080,945 2,135,180 2,189,655
Student Services
Counselor Salary See Staffing Plan $ 35,000 35,000 70,000 70,700 71,414
Fringe Benefits $ 8,936 8,875 18,181 17,586 17,752
Contracted professional Services (counseling and psychological, contracted nurse services) $ 60.00 ESE student $ 2,700 3,366 3,858 3,935 4,014
Page 10
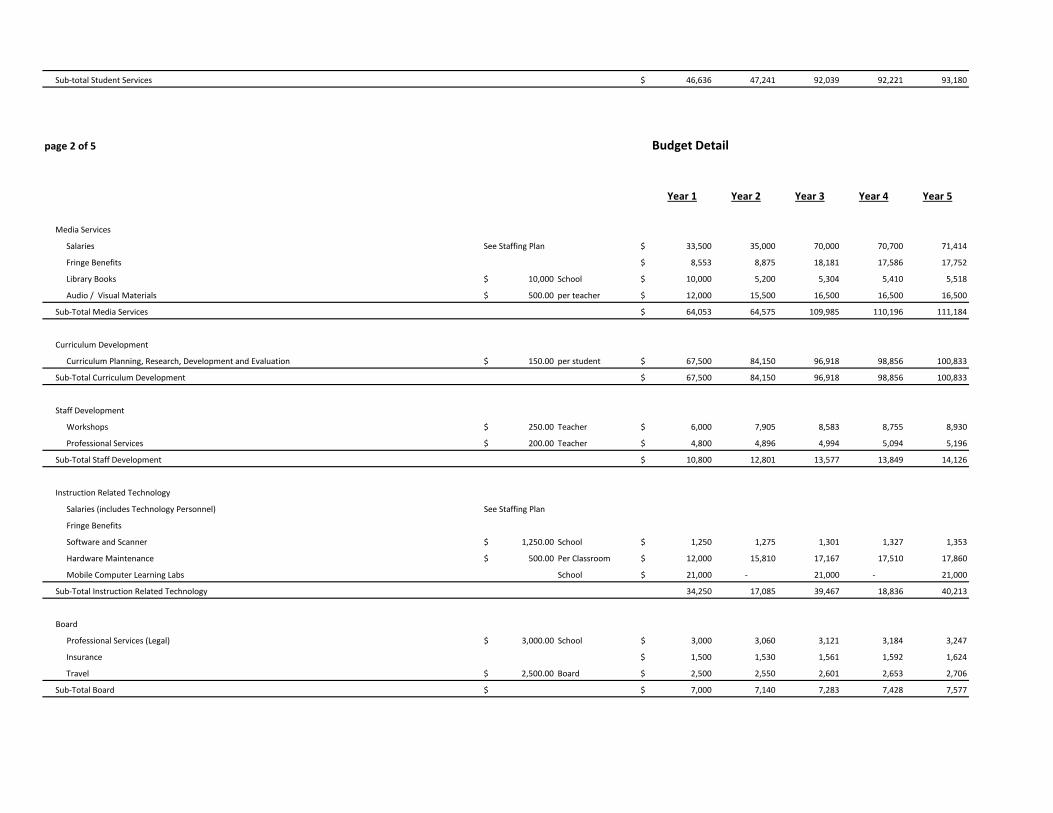
Sub-total Student Services $ 46,636 47,241 92,039 92,221 93,180
page 2 of 5 Budget Detail
Year 1 Year 2 Year 3 Year 4 Year 5
Media Services
Salaries See Staffing Plan $ 33,500 35,000 70,000 70,700 71,414
Fringe Benefits $ 8,553 8,875 18,181 17,586 17,752
Library Books $ 10,000 School $ 10,000 5,200 5,304 5,410 5,518
Audio / Visual Materials $ 500.00 per teacher $ 12,000 15,500 16,500 16,500 16,500
Sub-Total Media Services $ 64,053 64,575 109,985 110,196 111,184
Curriculum Development
Curriculum Planning, Research, Development and Evaluation $ 150.00 per student $ 67,500 84,150 96,918 98,856 100,833
Sub-Total Curriculum Development $ 67,500 84,150 96,918 98,856 100,833
Staff Development
Workshops $ 250.00 Teacher $ 6,000 7,905 8,583 8,755 8,930
Professional Services $ 200.00 Teacher $ 4,800 4,896 4,994 5,094 5,196
Sub-Total Staff Development $ 10,800 12,801 13,577 13,849 14,126
Instruction Related Technology
Salaries (includes Technology Personnel) See Staffing Plan
Fringe Benefits
Software and Scanner $ 1,250.00 School $ 1,250 1,275 1,301 1,327 1,353
Hardware Maintenance $ 500.00 Per Classroom $ 12,000 15,810 17,167 17,510 17,860
Mobile Computer Learning Labs School $ 21,000 - 21,000 - 21,000
Sub-Total Instruction Related Technology 34,250 17,085 39,467 18,836 40,213
Board
Professional Services (Legal) $ 3,000.00 School $ 3,000 3,060 3,121 3,184 3,247
Insurance $ 1,500 1,530 1,561 1,592 1,624
Travel $ 2,500.00 Board $ 2,500 2,550 2,601 2,653 2,706
Sub-Total Board $ $ 7,000 7,140 7,283 7,428 7,577
Page 11
page 3 of 5 Budget Detail
Year 1 Year 2 Year 3 Year 4 Year 5
General Administration
Business Management $ 50.00 per student $ 22,500 28,050 31,518 32,148 32,791
Sub-Total General Administration $ 22,500 28,050 31,518 32,148 32,791
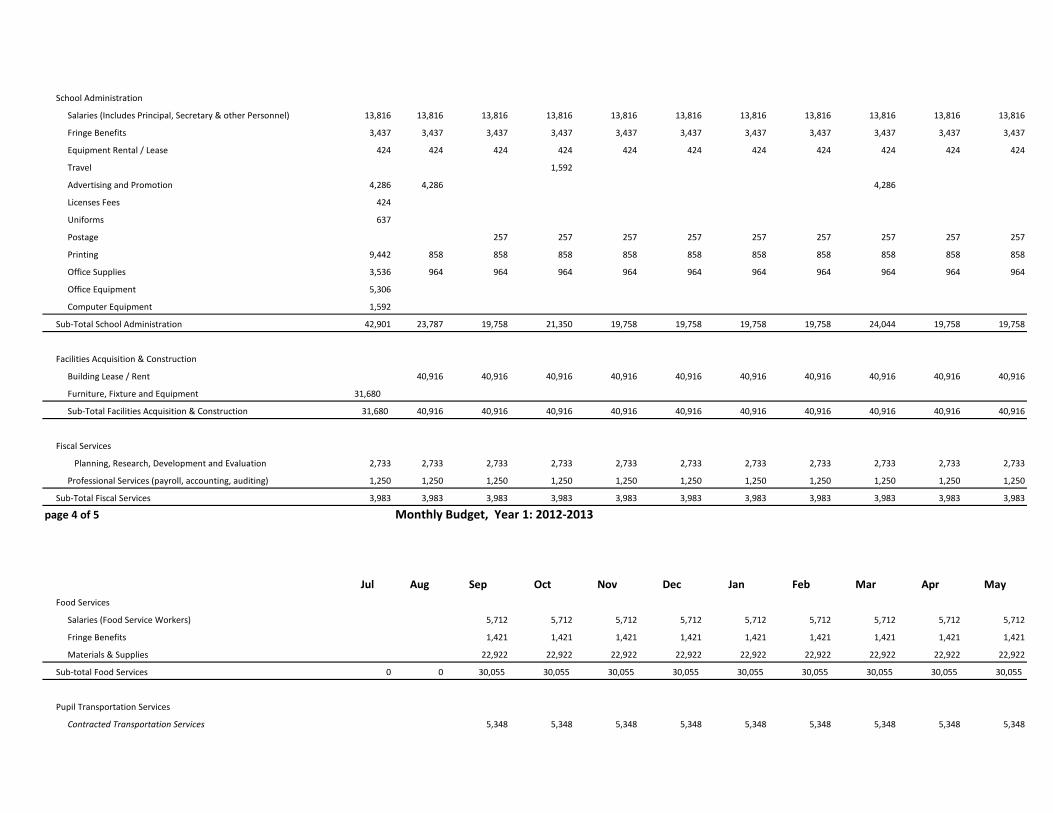
School Administration
Salaries (Includes Principal, Secretary & other Personnel) See Staffing Plan $ 162,643 162,643 162,643 165,796 169,012
Fringe Benefits $ 41,524 41,241 42,244 41,241 42,013
Equipment Rental / Lease $ 400.00 Per Month $ 4,800 4,896 4,994 5,094 5,196
Travel $ 500.00 Administrator $ 1,500 1,530 1,561 1,592 1,624
Advertising and Promotion $ 20.00 per student $ 9,000 11,220 12,607 12,859 13,117
License Fees $ 400.00 $ 400 408 416 424 433
Uniforms $ 600.00 $ 600 612 624 637 649
Postage $ 75.00 Per Classroom $ 1,800 2,372 2,525 2,575 2,626
Printing Supplies $ 550.00 Per Classroom $ 12,100 13,464 18,513 18,883 19,261
Office Supplies $ 22.00 per student $ 9,900 12,342 13,868 14,145 14,428
Office Equipment $ 5,000.00 $ 5,000 5,100 5,202 5,306 5,412
Computer Equipment $ 500.00 Administrator $ 1,500 1,530 1,561 1,592 1,624
Sub-Total School Administration $ 250,767 257,358 266,757 270,144 275,394
Facilities Acquisition & Construction
Building Lease / Rent - (See Budget Summary for Calculation) $ 315,000 392,700 441,252 450,077 459,079
Furniture, Fixtures and Equipment -20% $ 1,200.00 per Classroom $ 28,800 29,760 31,680 31,680 31,680
Sub-Toatal Facilities Acquisition & Construction $ 343,800 422,460 472,932 481,757 490,759
Fiscal Services
Planning, Research, Development and Evaluation $ 50.00 per student $ 22,500 28,050 32,148 32,791 33,447
Independent Auditing $ 15,000.00 $ 15,000 15,000 15,000 15,000 15,000
Sub-Total Fiscal Services $ 37,500 43,050 47,148 47,791 48,447
page 4 of 5 Budget Detail
Year 1 Year 2 Year 3 Year 4 Year 5
Page 12
Food Services
Salaries (Food Service Workers) See Staffing Plan $ 56,000 56,000 56,000 57,120 58,262
Fringe Benefits $ 14,297 14,200 14,545 14,208 14,483
Food Materials & Supplies $ 2.00 Per Meal per day $ 145,800 183,600 224,726 229,221 233,805
Sub-total Food Services $ 216,097 253,800 295,271 300,549 306,551
Pupil Transportation Services
Contracted Transportation Services $ 140.00 $ 50,400 51,408 52,436 53,485 54,555
Sub-Total Pupil Transportation Services $ 50,400 51,408 52,436 53,485 54,555
Operation of Plant
Salaries (Custodian, security) See Staffing Plan $ 38,602 38,602 38,602 39,374 40,162
Fringe Benefits $ 9,855 9,788 10,026 9,794 9,983
Purchased Service $ 65.00 Per Classroom $ 1,560 2,055 2,232 2,276 2,322
Lawn Maintenance $ 50.00 Per Classroom $ 1,100 1,581 1,717 1,751 1,786
Pest Control $ 50.00 Per Classroom $ 1,200 1,581 1,717 1,751 1,786
Security Services $ 90.00 Per month $ 1,080 1,102 1,124 1,146 1,169
Property Insurance $ 550.00 Per Classroom $ 13,200 17,391 18,883 19,261 19,646
Telephone Services $ 330.00 Per month $ 3,960 4,039 4,120 4,202 4,286
Water & Sewer $ 75.00 Per Classroom $ 1,800 1,836 2,575 2,626 2,679
Electricity $ 750.00 Per Classroom $ 18,000 23,715 25,750 26,265 26,790
Repairs, Maintenance, & Supplies $ 10,000.00 School $ 10,000 12,500 15,000 15,000 15,000
Sub-Total Operation of Plant $ 100,357 114,190 121,745 123,447 125,609
page 5 of 5 Budget Detail
Year 1 Year 2 Year 3 Year 4 Year 5
Systems Operation $ 425.00 Per Classroom $ 10,200 13,439 14,592 14,883 15,181
Sub-Total Administrative Technology Services $ 10,200 13,439 14,592 14,883 15,181
Debt Service
Redemption of Principal $ 25,000
Interest (Interest Only at 6%) $ 1,500
Sub-Total Debt Service $ 26,500 0 0 0 0
Page 13
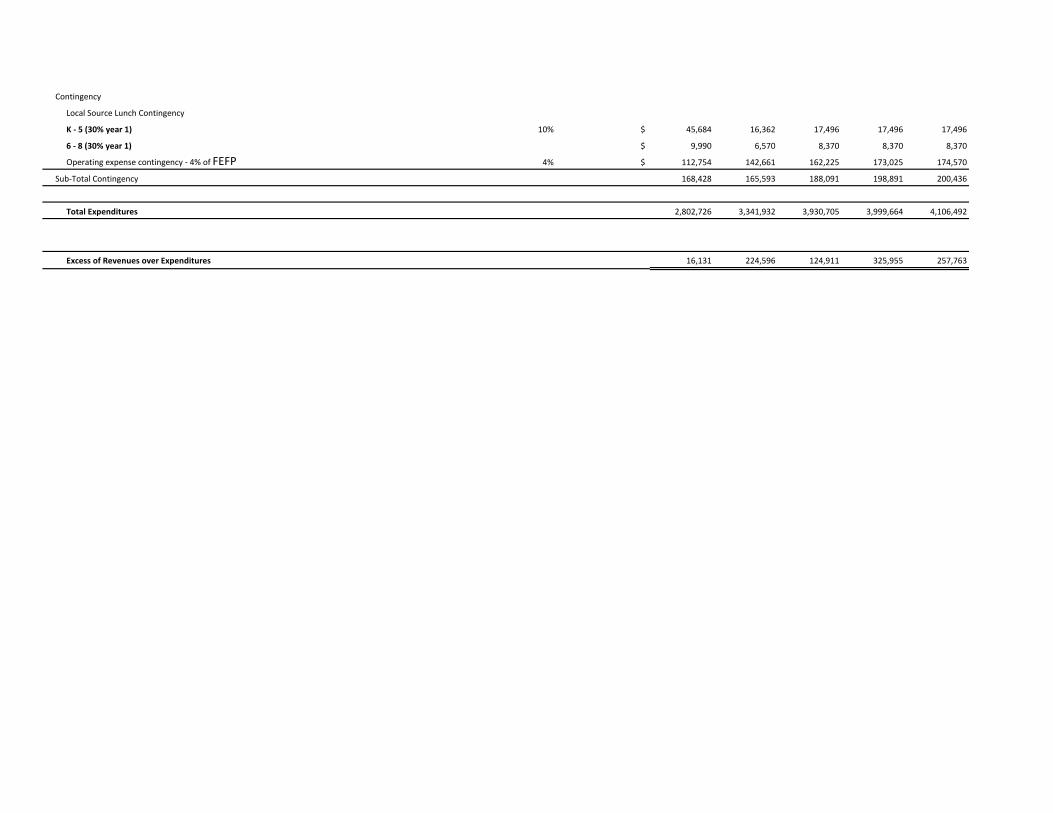
Contingency
Local Source Lunch Contingency
K - 5 (30% year 1) 10% $ 45,684 16,362 17,496 17,496 17,496
6 - 8 (30% year 1) $ 9,990 6,570 8,370 8,370 8,370
Operating expense contingency - 4% of FEFP 4% $ 112,754 142,661 162,225 173,025 174,570
Sub-Total Contingency 168,428 165,593 188,091 198,891 200,436
Total Expenditures 2,802,726 3,341,932 3,930,705 3,999,664 4,106,492
Excess of Revenues over Expenditures 16,131 224,596 124,911 325,955 257,763
Page 15
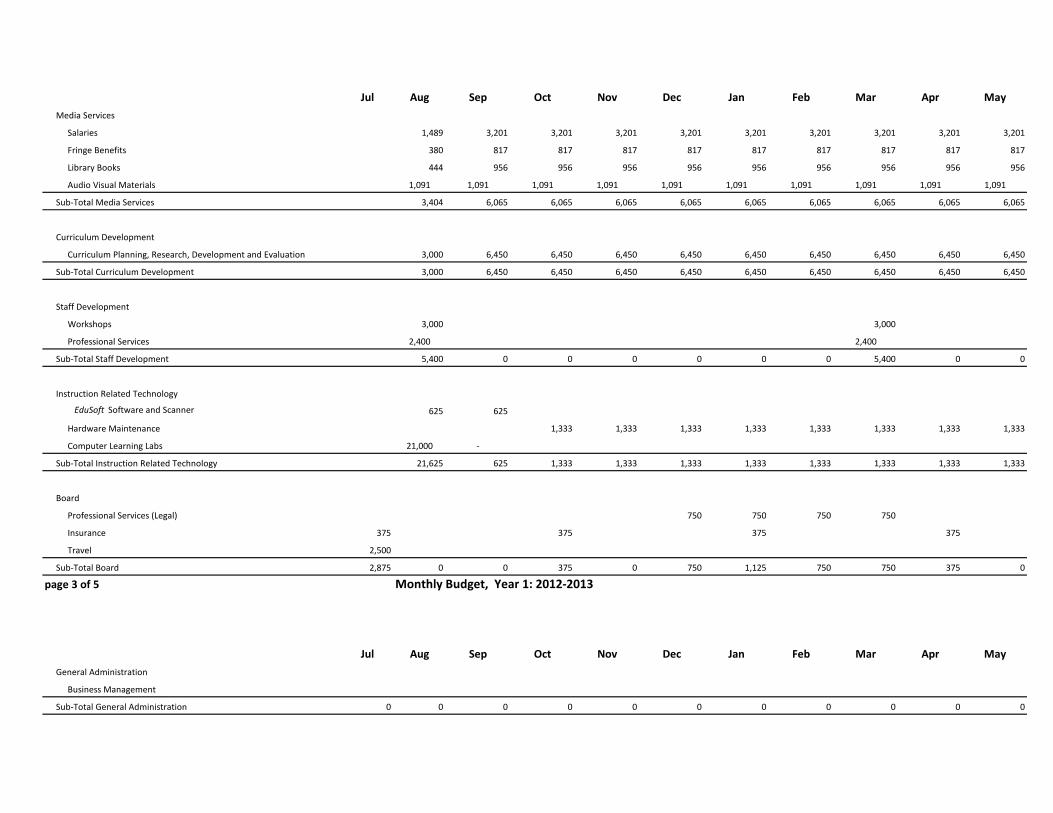
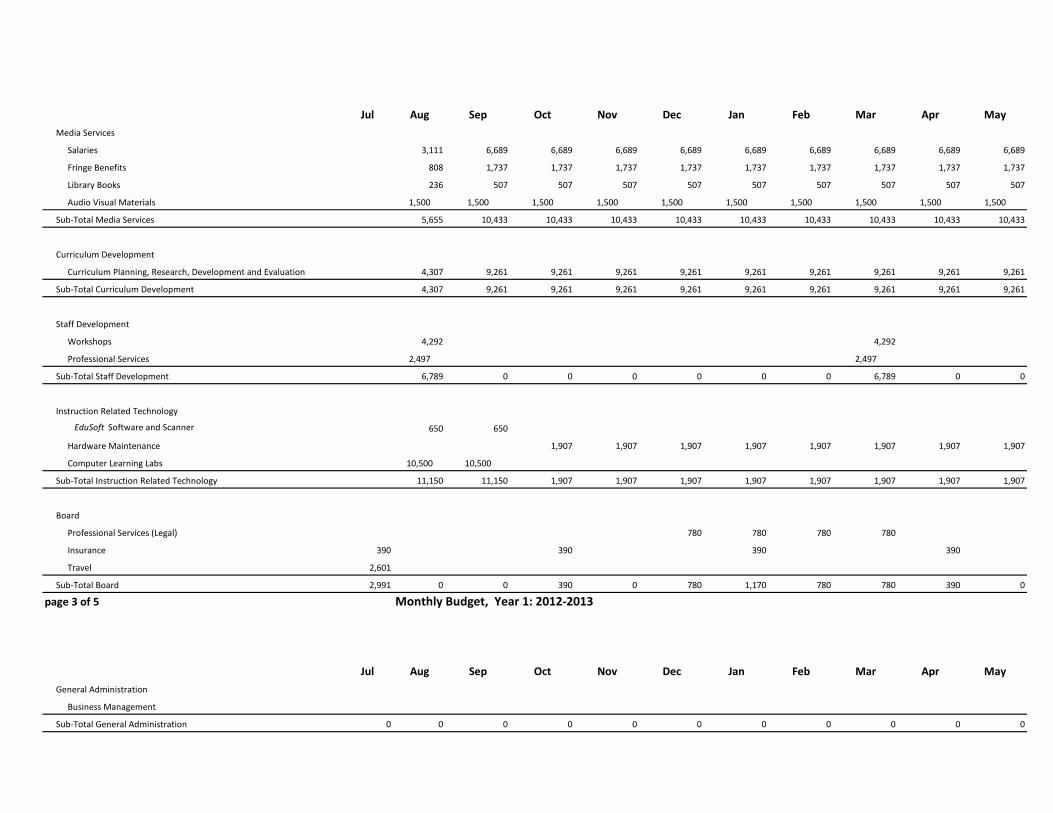
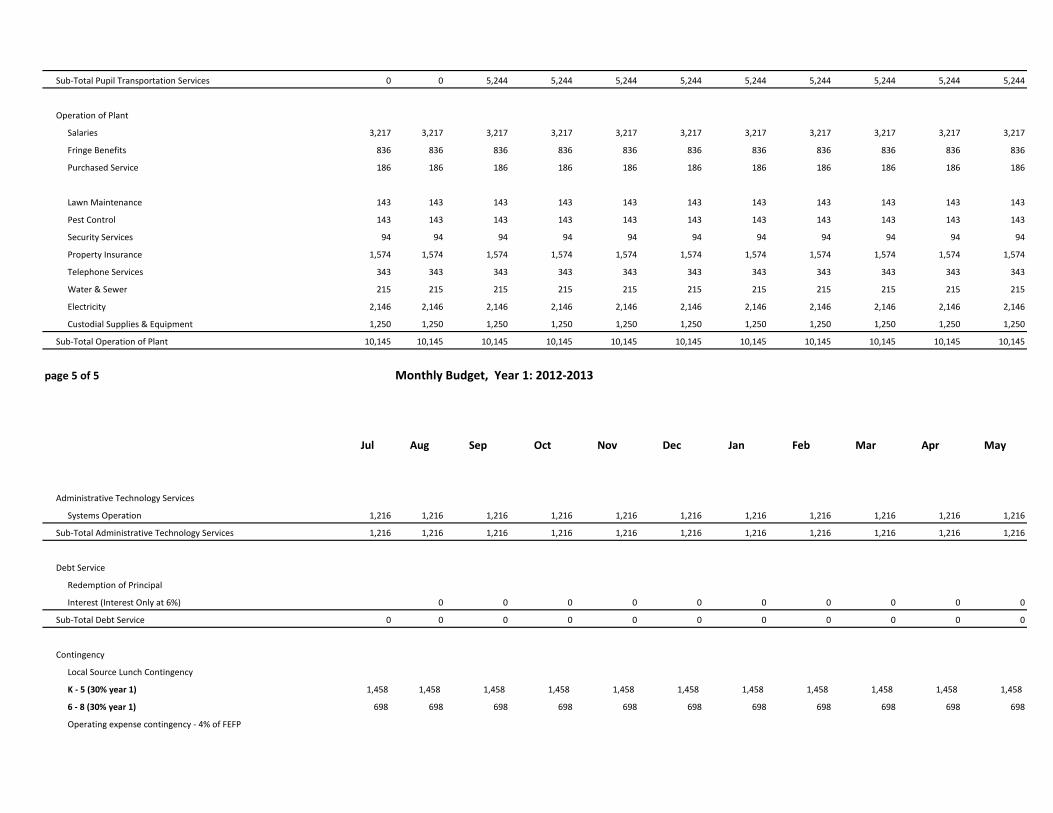
page 1 of 5 Monthly Budget, Year 1: 2012-2013
Jul Aug Sep Oct Nov Dec Jan Feb Mar Apr MayREVENUES
State Sources 232,244 232,244 232,244 232,244 232,244 232,244 232,244 232,244 232,244 232,244 232,244
Federal Sources 0 0 0 0 0 0 0 0 0 0 0
Local Sources - Lunch program paid students 10,935 10,935 10,935 10,935 10,935 10,935 10,935 10,935 10,935
Capital Outlay 0 0 0 0 0 0 0 0 0 0 0
Fee to County School Board - up to 250 students @ 5% -6,451 -6,451 -6,451 -6,451 -6,451 -6,451 -6,451 -6,451 -6,451 -6,451 -6,451
Total Revenues 225,792 225,792 236,727 236,727 236,727 236,727 236,727 236,727 236,727 236,727 236,727
EXPENDITURES
Instruction
Salaries (includes classroom teachers, 38,622 83,038 83,038 83,038 83,038 83,038 83,038 83,038 83,038 83,038
contract or hourly, and teacher aides)
Fringe Benefits 9,861 21,200 21,200 21,200 21,200 21,200 21,200 21,200 21,200 21,200
Contracted Professional Services 1,875 1,875 1,875 1,875 1,875 1,875 1,875 1,875
Classroom Supplies & Equipment 7,500 7,500 7,500
Teacher Supplies 4,500 4,500 4,500
Textbooks 48,000 48,000 48,000
Student Activities 3,000 3,000 3,000
Computer - Equipment & Repairs for Instruction 10,000 10,000 10,000
Software for Instruction 6,400 6,400 6,400
Sub-Total Instruction 59,819 128,612 128,612 128,612 128,612 128,612 128,612 128,612 128,612 128,612
Student Services
Salaries 3,500 3,500 3,500 3,500 3,500 3,500 3,500 3,500 3,500
Fringe Benefits 894 894 894 894 894 894 894 894 894
Contracted professional Services 270 270 270 270 270 270 270 270 270
Sub-total Student Services 4,664 4,664 4,664 4,664 4,664 4,664 4,664 4,664 4,664
page 2 of 5 Monthly Budget, Year 1: 2012-2013
Page 16
Jul Aug Sep Oct Nov Dec Jan Feb Mar Apr MayMedia Services
Salaries 1,489 3,201 3,201 3,201 3,201 3,201 3,201 3,201 3,201 3,201
Fringe Benefits 380 817 817 817 817 817 817 817 817 817
Library Books 444 956 956 956 956 956 956 956 956 956
Audio Visual Materials 1,091 1,091 1,091 1,091 1,091 1,091 1,091 1,091 1,091 1,091
Sub-Total Media Services 3,404 6,065 6,065 6,065 6,065 6,065 6,065 6,065 6,065 6,065
Curriculum Development
Curriculum Planning, Research, Development and Evaluation 3,000 6,450 6,450 6,450 6,450 6,450 6,450 6,450 6,450 6,450
Sub-Total Curriculum Development 3,000 6,450 6,450 6,450 6,450 6,450 6,450 6,450 6,450 6,450
Staff Development
Workshops 3,000 3,000
Professional Services 2,400 2,400
Sub-Total Staff Development 5,400 0 0 0 0 0 0 5,400 0 0
Instruction Related Technology
EduSoft Software and Scanner 625 625
Hardware Maintenance 1,333 1,333 1,333 1,333 1,333 1,333 1,333 1,333
Computer Learning Labs 21,000 -
Sub-Total Instruction Related Technology 21,625 625 1,333 1,333 1,333 1,333 1,333 1,333 1,333 1,333
Board
Professional Services (Legal) 750 750 750 750
Insurance 375 375 375 375
Travel 2,500
Sub-Total Board 2,875 0 0 375 0 750 1,125 750 750 375 0
page 3 of 5 Monthly Budget, Year 1: 2012-2013
Jul Aug Sep Oct Nov Dec Jan Feb Mar Apr MayGeneral Administration
Business Management
Sub-Total General Administration 0 0 0 0 0 0 0 0 0 0 0
Page 17
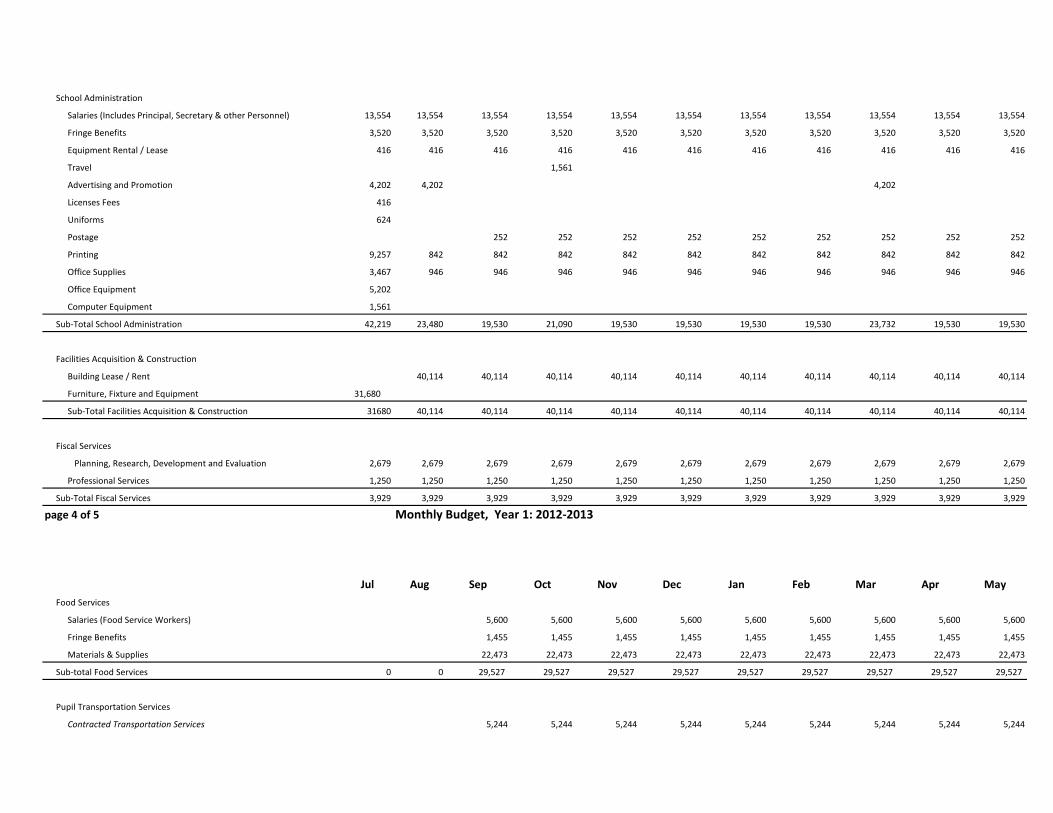
School Administration
Salaries (Includes Principal, Secretary & other Personnel) 13,554 13,554 13,554 13,554 13,554 13,554 13,554 13,554 13,554 13,554 13,554
Fringe Benefits 3,460 3,460 3,460 3,460 3,460 3,460 3,460 3,460 3,460 3,460 3,460
Equipment Rental / Lease 400 400 400 400 400 400 400 400 400 400 400
Travel 1,500
Advertising and Promotion 3,000 3,000 3,000
Licenses Fees 400
Uniforms 600
Postage 180 180 180 180 180 180 180 180 180
Printing 6,050 550 550 550 550 550 550 550 550 550 550
Office Supplies 2,475 675 675 675 675 675 675 675 675 675 675
Office Equipment 5,000
Computer Equipment 1,500
Sub-Total School Administration 36,439 21,639 18,819 20,319 18,819 18,819 18,819 18,819 21,819 18,819 18,819
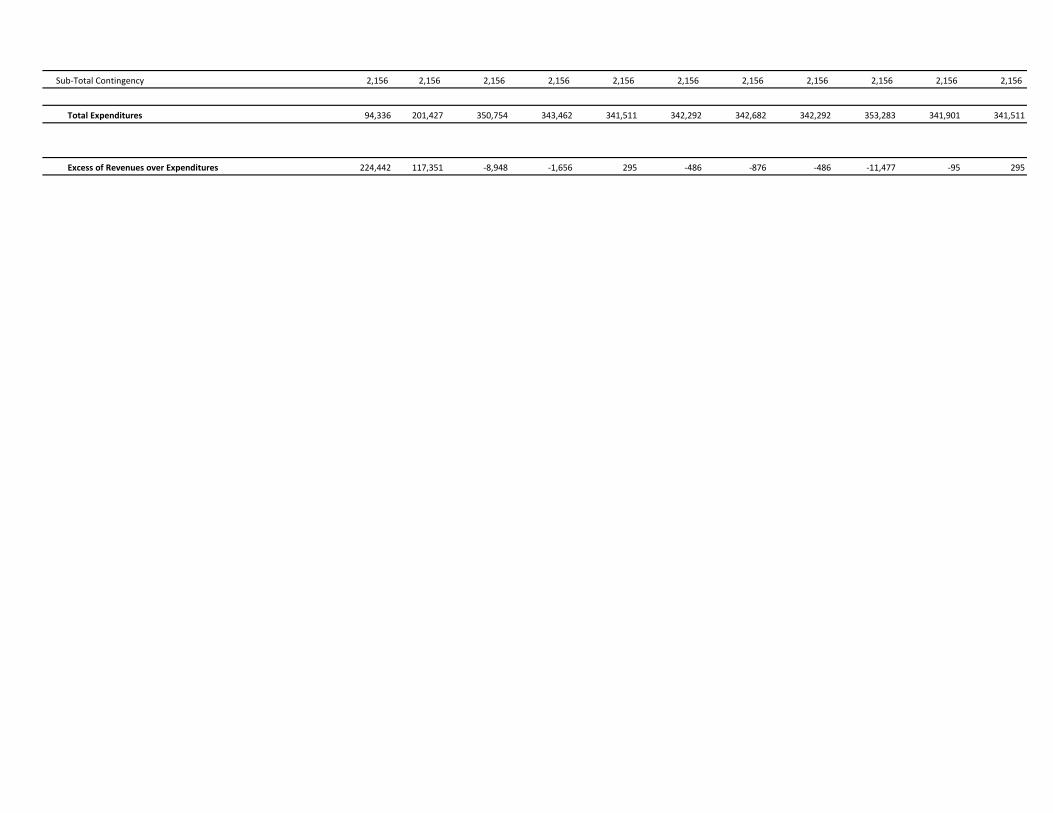
Building Lease / Rent 28,636 28,636 28,636 28,636 28,636 28,636 28,636 28,636 28,636 28,636
Furniture, Fixture and Equipment 28,800
Sub-Total Facilities Acquisition & Construction 28800 28,636 28,636 28,636 28,636 28,636 28,636 28,636 28,636 28,636 28,636
Fiscal Services
Planning, Research, Development and Evaluation 1,875 1,875 1,875 1,875 1,875 1,875 1,875 1,875 1,875 1,875 1,875
Professional Services (payroll, accounting, auditing) 1,250 1,250 1,250 1,250 1,250 1,250 1,250 1,250 1,250 1,250 1,250
Sub-Total Fiscal Services 3,125 3,125 3,125 3,125 3,125 3,125 3,125 3,125 3,125 3,125 3,125
page 4 of 5 Monthly Budget, Year 1: 2012-2013
Jul Aug Sep Oct Nov Dec Jan Feb Mar Apr MayFood Services
Salaries (Food Service Workers) 5,600 5,600 5,600 5,600 5,600 5,600 5,600 5,600 5,600
Fringe Benefits 1,430 1,430 1,430 1,430 1,430 1,430 1,430 1,430 1,430
Materials & Supplies 14,580 14,580 14,580 14,580 14,580 14,580 14,580 14,580 14,580
Sub-total Food Services 0 0 21609.7245 21609.7245 21609.7245 21609.7245 21609.7245 21609.7245 21609.7245 21609.7245 21609.7245
Pupil Transportation Services
Contracted Transportation Services 5,040 5,040 5,040 5,040 5,040 5,040 5,040 5,040 5,040
Sub-Total Pupil Transportation Services 0 0 5,040 5,040 5,040 5,040 5,040 5,040 5,040 5,040 5,040
Operation of Plant
Page 18
Salaries 3,217 3,217 3,217 3,217 3,217 3,217 3,217 3,217 3,217 3,217 3,217
Fringe Benefits 821 821 821 821 821 821 821 821 821 821 821
Purchased Service 130 130 130 130 130 130 130 130 130 130 130
Lawn Maintenance 92 92 92 92 92 92 92 92 92 92 92
Pest Control 100 100 100 100 100 100 100 100 100 100 100
Security Services 90 90 90 90 90 90 90 90 90 90 90
Property Insurance 1,100 1,100 1,100 1,100 1,100 1,100 1,100 1,100 1,100 1,100 1,100
Telephone Services 330 330 330 330 330 330 330 330 330 330 330
Water & Sewer 150 150 150 150 150 150 150 150 150 150 150
Electricity 1,500 1,500 1,500 1,500 1,500 1,500 1,500 1,500 1,500 1,500 1,500
Custodial Supplies & Equipment 833 833 833 833 833 833 833 833 833 833 833
Sub-Total Operation of Plant 8,363 8,363 8,363 8,363 8,363 8,363 8,363 8,363 8,363 8,363 8,363
page 5 of 5 Monthly Budget, Year 1: 2012-2013
Jul Aug Sep Oct Nov Dec Jan Feb Mar Apr May
Administrative Technology Services
Systens Operation 850 850 850 850 850 850 850 850 850 850 850
Sub-Total Administrative Technology Services 850 850 850 850 850 850 850 850 850 850 850
Debt Service
Redemption of Principal
Interest (Interest Only at 6%) 136 136 136 136 136 136 136 136 136 136
Sub-Total Debt Service 0 136 136 136 136 136 136 136 136 136 136
Contingency
Local Source Lunch Contingency
K - 5 (30% year 1) 3,807 3,807 3,807 3,807 3,807 3,807 3,807 3,807 3,807 3,807 3,807
6 - 8 (30% year 1) 833 833 833 833 833 833 833 833 833 833 833
Operating expense contingency - 4% of FEFP
Sub-Total Contingency 4,640 4,640 4,640 4,640 4,640 4,640 4,640 4,640 4,640 4,640 4,640
Total Expenditures 85,092 160,638 237,634 240,218 238,343 239,093 239,468 239,093 247,493 238,718 238,343
Page 19
Excess of Revenues over Expenditures 140,701 65,154 -907 -3,490 -1,615 -2,365 -2,740 -2,365 -10,765 -1,990 -1,615
Page 20
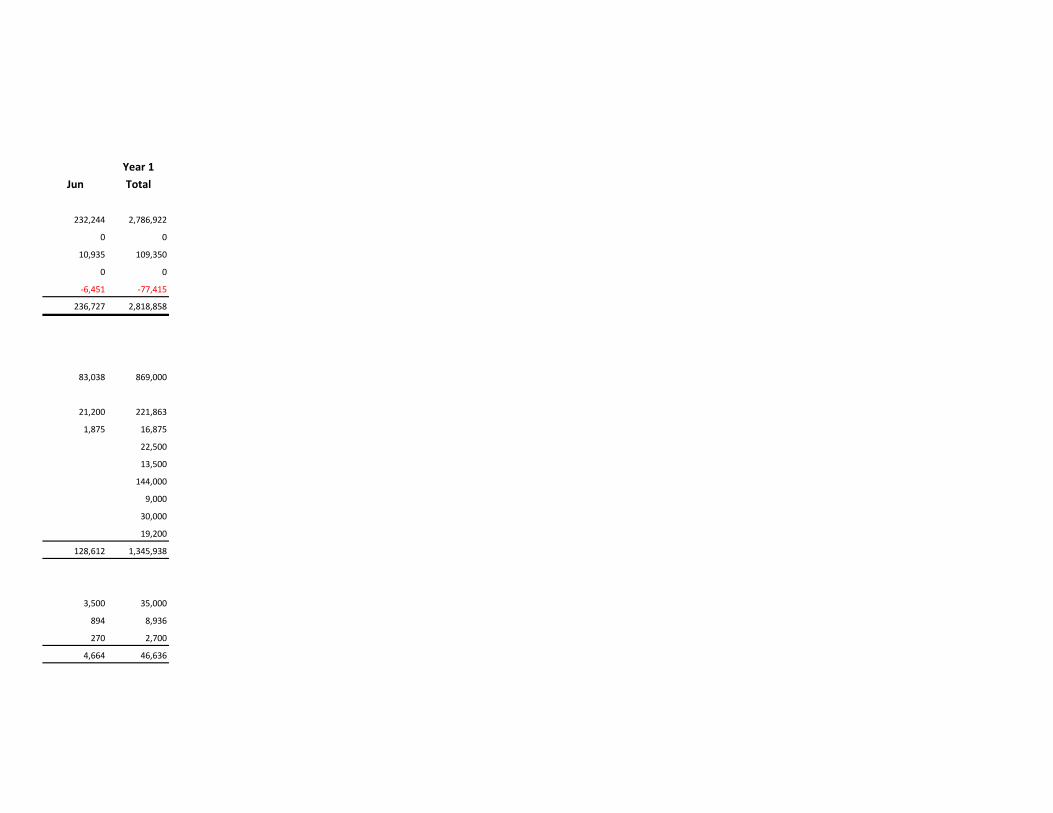
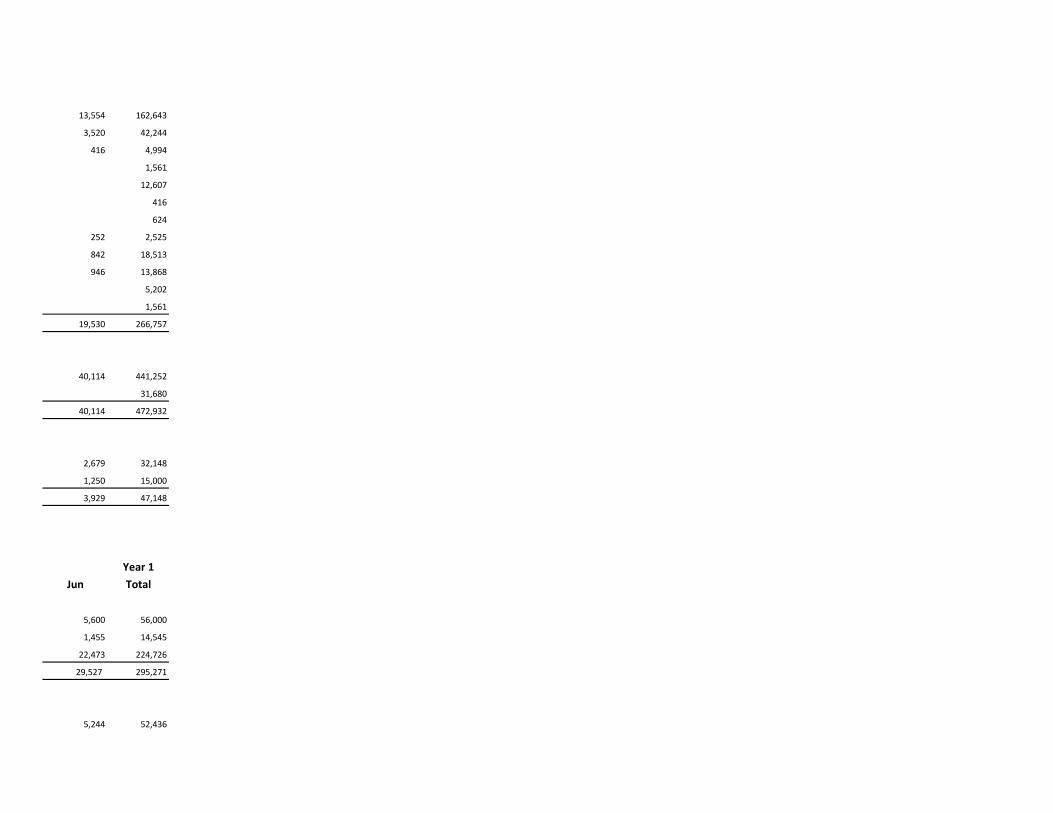
Year 1Jun Total
232,244 2,786,922
0 0
10,935 109,350
0 0
-6,451 -77,415
236,727 2,818,858
83,038 869,000
21,200 221,863
1,875 16,875
22,500
13,500
144,000
9,000
30,000
19,200
128,612 1,345,938
3,500 35,000
894 8,936
270 2,700
4,664 46,636
Page 21
Year 1Jun Total
3,201 33,500
817 8,553
956 10,000
1,091 12,000
6,065 64,053
6,450 67,500
6,450 67,500
6,000
4,800
0 10,800
1,250
1,333 12,000
21,000
1,333 34,250
3,000
1,500
2,500
0 7,000
Year 1Jun Total
22,500 22,500
22,500 22,500
Page 22
13,554 162,643
3,460 41,524
400 4,800
1,500
9,000
400
600
180 1,800
550 12,100
675 9,900
5,000
1,500
18,819 250,767
28,636 315,000
28,800
28,636 343,800
1,875 22,500
1,250 15,000
3,125 37,500
Year 1Jun Total
5,600 56,000
1,430 14,297
14,580 145,800
21609.7245 216,097
5,040 50,400
5,040 50,400
Page 23
3,217 38,602
821 9,855
130 1,560
92 1,100
100 1,200
90 1,080
1,100 13,200
330 3,960
150 1,800
1,500 18,000
833 10,000
8,363 100,357
Year 1Jun Total
850 10,200
850 10,200
25,000 25,000
136 1,500
25,136 26,500
3,807 45,684
833 9,990
112,754 112,754
117,394 168,428
398,597 2,802,726
Page 25
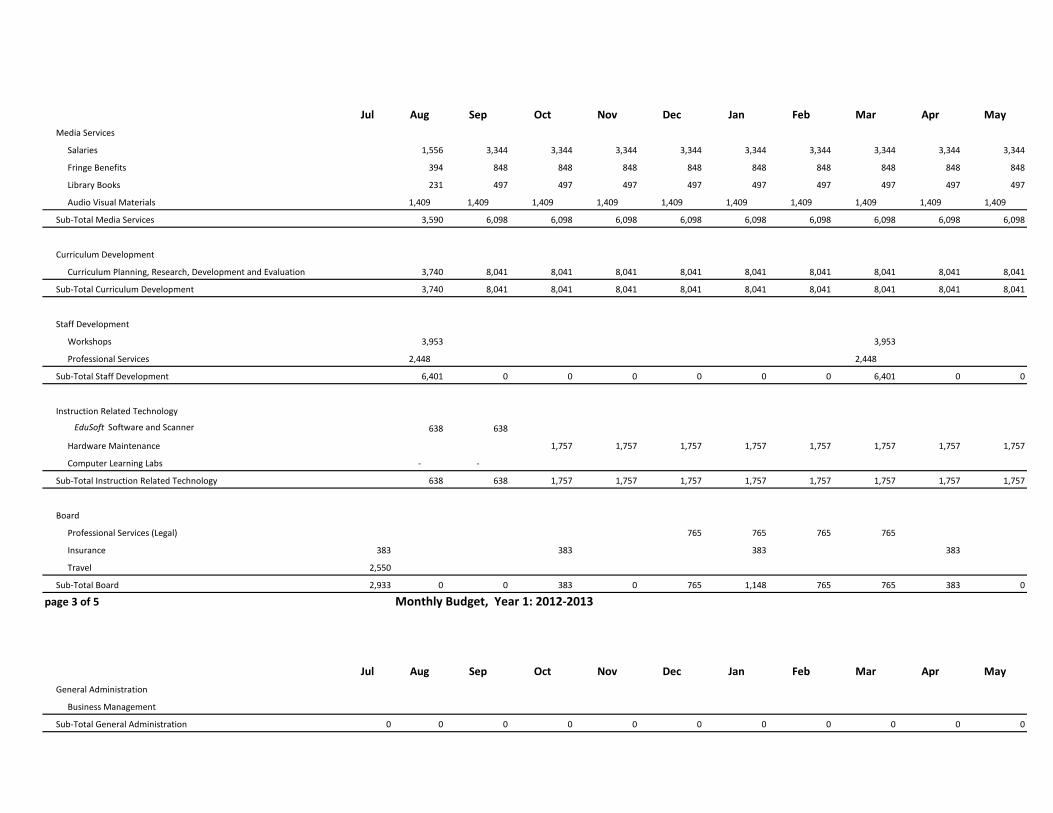
page 1 of 5 Monthly Budget, Year 1: 2012-2013
Jul Aug Sep Oct Nov Dec Jan Feb Mar Apr MayREVENUES
State Sources 286,692 286,692 286,692 286,692 286,692 286,692 286,692 286,692 286,692 286,692 286,692
Federal Sources 13,759 13,759 13,759 13,759 13,759 13,759 13,759 13,759 13,759
Local Sources - Lunch program paid students 6,683 6,683 6,683 6,683 6,683 6,683 6,683 6,683 6,683
Capital Outlay 0 0 0 0 0 0 0 0 0 0 0
Fee to County School Board - up to 250 students @ 5% -6,516 -6,516 -6,516 -6,516 -6,516 -6,516 -6,516 -6,516 -6,516 -6,516 -6,516
Total Revenues 280,176 280,176 300,618 300,618 300,618 300,618 300,618 300,618 300,618 300,618 300,618
EXPENDITURES
Instruction
Salaries (includes classroom teachers, 50,987 109,623 109,623 109,623 109,623 109,623 109,623 109,623 109,623 109,623
contract or hourly, and teacher aides)
Fringe Benefits 12,929 27,797 27,797 27,797 27,797 27,797 27,797 27,797 27,797 27,797
Contracted Professional Services 2,338 2,338 2,338 2,338 2,338 2,338 2,338 2,338
Classroom Supplies & Equipment 9,350 9,350 9,350
Teacher Supplies 5,610 5,610 5,610
Textbooks 59,840 59,840 59,840
Student Activities 3,740 3,740 3,740
Computer - Equipment & Repairs for Instruction 13,175 13,175 13,175
Software for Instruction 8,432 8,432 8,432
Sub-Total Instruction 78,204 168,139 168,139 168,139 168,139 168,139 168,139 168,139 168,139 168,139
Student Services
Salaries 3,500 3,500 3,500 3,500 3,500 3,500 3,500 3,500 3,500
Fringe Benefits 887 887 887 887 887 887 887 887 887
Contracted professional Services 337 337 337 337 337 337 337 337 337
Sub-total Student Services 4,724 4,724 4,724 4,724 4,724 4,724 4,724 4,724 4,724
page 2 of 5 Monthly Budget, Year 1: 2012-2013
Page 26
Jul Aug Sep Oct Nov Dec Jan Feb Mar Apr MayMedia Services
Salaries 1,556 3,344 3,344 3,344 3,344 3,344 3,344 3,344 3,344 3,344
Fringe Benefits 394 848 848 848 848 848 848 848 848 848
Library Books 231 497 497 497 497 497 497 497 497 497
Audio Visual Materials 1,409 1,409 1,409 1,409 1,409 1,409 1,409 1,409 1,409 1,409
Sub-Total Media Services 3,590 6,098 6,098 6,098 6,098 6,098 6,098 6,098 6,098 6,098
Curriculum Development
Curriculum Planning, Research, Development and Evaluation 3,740 8,041 8,041 8,041 8,041 8,041 8,041 8,041 8,041 8,041
Sub-Total Curriculum Development 3,740 8,041 8,041 8,041 8,041 8,041 8,041 8,041 8,041 8,041
Staff Development
Workshops 3,953 3,953
Professional Services 2,448 2,448
Sub-Total Staff Development 6,401 0 0 0 0 0 0 6,401 0 0
Instruction Related Technology
EduSoft Software and Scanner 638 638
Hardware Maintenance 1,757 1,757 1,757 1,757 1,757 1,757 1,757 1,757
Computer Learning Labs - -
Sub-Total Instruction Related Technology 638 638 1,757 1,757 1,757 1,757 1,757 1,757 1,757 1,757
Board
Professional Services (Legal) 765 765 765 765
Insurance 383 383 383 383
Travel 2,550
Sub-Total Board 2,933 0 0 383 0 765 1,148 765 765 383 0
page 3 of 5 Monthly Budget, Year 1: 2012-2013
Jul Aug Sep Oct Nov Dec Jan Feb Mar Apr MayGeneral Administration
Business Management
Sub-Total General Administration 0 0 0 0 0 0 0 0 0 0 0
Page 27
School Administration
Salaries (Includes Principal, Secretary & other Personnel) 13,554 13,554 13,554 13,554 13,554 13,554 13,554 13,554 13,554 13,554 13,554
Fringe Benefits 3,437 3,437 3,437 3,437 3,437 3,437 3,437 3,437 3,437 3,437 3,437
Equipment Rental / Lease 408 408 408 408 408 408 408 408 408 408 408
Travel 1,530
Advertising and Promotion 3,740 3,740 3,740
Licenses Fees 408
Uniforms 612
Postage 237 237 237 237 237 237 237 237 237
Printing 6,732 612 612 612 612 612 612 612 612 612 612
Office Supplies 3,086 842 842 842 842 842 842 842 842 842 842
Office Equipment 5,100
Computer Equipment 1,530
Sub-Total School Administration 38,606 22,592 19,089 20,619 19,089 19,089 19,089 19,089 22,829 19,089 19,089
Building Lease / Rent 35,700 35,700 35,700 35,700 35,700 35,700 35,700 35,700 35,700 35,700
Furniture, Fixture and Equipment 29,760
Sub-Total Facilities Acquisition & Construction 29760 35,700 35,700 35,700 35,700 35,700 35,700 35,700 35,700 35,700 35,700
Fiscal Services
Planning, Research, Development and Evaluation 2,338 2,338 2,338 2,338 2,338 2,338 2,338 2,338 2,338 2,338 2,338
Professional Services (payroll, accounting, auditing) 1,250 1,250 1,250 1,250 1,250 1,250 1,250 1,250 1,250 1,250 1,250
Sub-Total Fiscal Services 3,588 3,588 3,588 3,588 3,588 3,588 3,588 3,588 3,588 3,588 3,588
page 4 of 5 Monthly Budget, Year 1: 2012-2013
Jul Aug Sep Oct Nov Dec Jan Feb Mar Apr MayFood Services
Salaries (Food Service Workers) 5,600 5,600 5,600 5,600 5,600 5,600 5,600 5,600 5,600
Fringe Benefits 1,420 1,420 1,420 1,420 1,420 1,420 1,420 1,420 1,420
Materials & Supplies 18,360 18,360 18,360 18,360 18,360 18,360 18,360 18,360 18,360
Sub-total Food Services 0 0 25,380 25,380 25,380 25,380 25,380 25,380 25,380 25,380 25,380
Pupil Transportation Services
Contracted Transportation Services 5,141 5,141 5,141 5,141 5,141 5,141 5,141 5,141 5,141
Sub-Total Pupil Transportation Services 0 0 5,141 5,141 5,141 5,141 5,141 5,141 5,141 5,141 5,141
Page 28
Operation of Plant
Salaries 3,217 3,217 3,217 3,217 3,217 3,217 3,217 3,217 3,217 3,217 3,217
Fringe Benefits 816 816 816 816 816 816 816 816 816 816 816
Purchased Service 171 171 171 171 171 171 171 171 171 171 171
Lawn Maintenance 132 132 132 132 132 132 132 132 132 132 132
Pest Control 132 132 132 132 132 132 132 132 132 132 132
Security Services 92 92 92 92 92 92 92 92 92 92 92
Property Insurance 1,449 1,449 1,449 1,449 1,449 1,449 1,449 1,449 1,449 1,449 1,449
Telephone Services 337 337 337 337 337 337 337 337 337 337 337
Water & Sewer 153 153 153 153 153 153 153 153 153 153 153
Electricity 1,976 1,976 1,976 1,976 1,976 1,976 1,976 1,976 1,976 1,976 1,976
Custodial Supplies & Equipment 1,042 1,042 1,042 1,042 1,042 1,042 1,042 1,042 1,042 1,042 1,042
Sub-Total Operation of Plant 9,516 9,516 9,516 9,516 9,516 9,516 9,516 9,516 9,516 9,516 9,516
page 5 of 5 Monthly Budget, Year 1: 2012-2013
Jul Aug Sep Oct Nov Dec Jan Feb Mar Apr May
Administrative Technology Services
Systens Operation 1,120 1,120 1,120 1,120 1,120 1,120 1,120 1,120 1,120 1,120 1,120
Sub-Total Administrative Technology Services 1,120 1,120 1,120 1,120 1,120 1,120 1,120 1,120 1,120 1,120 1,120
Debt Service
Redemption of Principal
Interest (Interest Only at 6%) 0 0 0 0 0 0 0 0 0 0
Sub-Total Debt Service 0 0 0 0 0 0 0 0 0 0 0
Contingency
Local Source Lunch Contingency
K - 5 (30% year 1) 1,364 1,364 1,364 1,364 1,364 1,364 1,364 1,364 1,364 1,364 1,364
6 - 8 (30% year 1) 548 548 548 548 548 548 548 548 548 548 548
Operating expense contingency - 4% of FEFP
Sub-Total Contingency 1,911 1,911 1,911 1,911 1,911 1,911 1,911 1,911 1,911 1,911 1,911
Page 29
Total Expenditures 87,433 166,998 289,084 292,116 290,203 290,968 291,351 290,968 301,109 290,586 290,203
Excess of Revenues over Expenditures 192,743 113,178 11,534 8,502 10,415 9,650 9,267 9,650 -491 10,032 10,415
Page 30
Year 1Jun Total
286,692 3,440,300
13,759 137,592
6,683 66,825
0 0
-6,516 -78,189
300,618 3,566,529
109,623 1,147,215
27,797 290,899
2,338 21,038
28,050
16,830
179,520
11,220
39,525
25,296
168,139 1,759,593
3,500 35,000
887 8,875
337 3,366
4,724 47,241
Page 31
Year 1Jun Total
3,344 35,000
848 8,875
497 5,200
1,409 15,500
6,098 64,575
8,041 84,150
8,041 84,150
7,905
4,896
0 12,801
1,275
1,757 15,810
0
1,757 17,085
3,060
1,530
2,550
0 7,140
Year 1Jun Total
28,050 28,050
28,050 28,050
Page 32
13,554 162,643
3,437 41,241
408 4,896
1,530
11,220
408
612
237 2,372
612 13,464
842 12,342
5,100
1,530
19,089 257,358
35,700 392,700
29,760
35,700 422,460
2,338 28,050
1,250 15,000
3,588 43,050
Year 1Jun Total
5,600 56,000
1,420 14,200
18,360 183,600
25,380 253,800
5,141 51,408
5,141 51,408
Page 33
3,217 38,602
816 9,788
171 2,055
132 1,581
132 1,581
92 1,102
1,449 17,391
337 4,039
153 1,836
1,976 23,715
1,042 12,500
9,516 114,190
Year 1Jun Total
1,120 13,439
1,120 13,439
0 0
0 0
0 0
1,364 16,362
548 6,570
142,661 142,661
144,572 165,593
Page 34
460,914 3,341,932
-160,297 224,596
Page 35
page 1 of 5 Monthly Budget, Year 1: 2012-2013
Jul Aug Sep Oct Nov Dec Jan Feb Mar Apr MayREVENUES
State Sources 325,359 325,359 325,359 325,359 325,359 325,359 325,359 325,359 325,359 325,359 325,359
Federal Sources 15,520 15,520 15,520 15,520 15,520 15,520 15,520 15,520 15,520
Local Sources - Lunch program paid students 7,509 7,509 7,509 7,509 7,509 7,509 7,509 7,509 7,509
Capital Outlay 0 0 0 0 0 0 0 0 0 0 0
Fee to County School Board - up to 250 students @ 5% -6,581 -6,581 -6,581 -6,581 -6,581 -6,581 -6,581 -6,581 -6,581 -6,581 -6,581
Total Revenues 318,778 318,778 341,806 341,806 341,806 341,806 341,806 341,806 341,806 341,806 341,806
EXPENDITURES
Instruction
Salaries (includes classroom teachers, 60,497 130,069 130,069 130,069 130,069 130,069 130,069 130,069 130,069 130,069
contract or hourly, and teacher aides)
Fringe Benefits 15,713 33,783 33,783 33,783 33,783 33,783 33,783 33,783 33,783 33,783
Contracted Professional Services 2,679 2,679 2,679 2,679 2,679 2,679 2,679 2,679
Classroom Supplies & Equipment 10,769 10,769 10,769
Teacher Supplies 6,461 6,461 6,461
Textbooks 68,919 68,919 68,919
Student Activities 4,307 4,307 4,307
Computer - Equipment & Repairs for Instruction 14,376 14,376 14,376
Software for Instruction 9,200 9,200 9,200
Sub-Total Instruction 92,486 198,846 198,846 198,846 198,846 198,846 198,846 198,846 198,846 198,846
Student Services
Salaries 7,000 7,000 7,000 7,000 7,000 7,000 7,000 7,000 7,000
Fringe Benefits 1,818 1,818 1,818 1,818 1,818 1,818 1,818 1,818 1,818
Contracted professional Services 386 386 386 386 386 386 386 386 386
Sub-total Student Services 9,204 9,204 9,204 9,204 9,204 9,204 9,204 9,204 9,204
page 2 of 5 Monthly Budget, Year 1: 2012-2013
Page 36
Jul Aug Sep Oct Nov Dec Jan Feb Mar Apr MayMedia Services
Salaries 3,111 6,689 6,689 6,689 6,689 6,689 6,689 6,689 6,689 6,689
Fringe Benefits 808 1,737 1,737 1,737 1,737 1,737 1,737 1,737 1,737 1,737
Library Books 236 507 507 507 507 507 507 507 507 507
Audio Visual Materials 1,500 1,500 1,500 1,500 1,500 1,500 1,500 1,500 1,500 1,500
Sub-Total Media Services 5,655 10,433 10,433 10,433 10,433 10,433 10,433 10,433 10,433 10,433
Curriculum Development
Curriculum Planning, Research, Development and Evaluation 4,307 9,261 9,261 9,261 9,261 9,261 9,261 9,261 9,261 9,261
Sub-Total Curriculum Development 4,307 9,261 9,261 9,261 9,261 9,261 9,261 9,261 9,261 9,261
Staff Development
Workshops 4,292 4,292
Professional Services 2,497 2,497
Sub-Total Staff Development 6,789 0 0 0 0 0 0 6,789 0 0
Instruction Related Technology
EduSoft Software and Scanner 650 650
Hardware Maintenance 1,907 1,907 1,907 1,907 1,907 1,907 1,907 1,907
Computer Learning Labs 10,500 10,500
Sub-Total Instruction Related Technology 11,150 11,150 1,907 1,907 1,907 1,907 1,907 1,907 1,907 1,907
Board
Professional Services (Legal) 780 780 780 780
Insurance 390 390 390 390
Travel 2,601
Sub-Total Board 2,991 0 0 390 0 780 1,170 780 780 390 0
page 3 of 5 Monthly Budget, Year 1: 2012-2013
Jul Aug Sep Oct Nov Dec Jan Feb Mar Apr MayGeneral Administration
Business Management
Sub-Total General Administration 0 0 0 0 0 0 0 0 0 0 0
Page 37
School Administration
Salaries (Includes Principal, Secretary & other Personnel) 13,554 13,554 13,554 13,554 13,554 13,554 13,554 13,554 13,554 13,554 13,554
Fringe Benefits 3,520 3,520 3,520 3,520 3,520 3,520 3,520 3,520 3,520 3,520 3,520
Equipment Rental / Lease 416 416 416 416 416 416 416 416 416 416 416
Travel 1,561
Advertising and Promotion 4,202 4,202 4,202
Licenses Fees 416
Uniforms 624
Postage 252 252 252 252 252 252 252 252 252
Printing 9,257 842 842 842 842 842 842 842 842 842 842
Office Supplies 3,467 946 946 946 946 946 946 946 946 946 946
Office Equipment 5,202
Computer Equipment 1,561
Sub-Total School Administration 42,219 23,480 19,530 21,090 19,530 19,530 19,530 19,530 23,732 19,530 19,530
Facilities Acquisition & Construction
Building Lease / Rent 40,114 40,114 40,114 40,114 40,114 40,114 40,114 40,114 40,114 40,114
Furniture, Fixture and Equipment 31,680
Sub-Total Facilities Acquisition & Construction 31680 40,114 40,114 40,114 40,114 40,114 40,114 40,114 40,114 40,114 40,114
Fiscal Services
Planning, Research, Development and Evaluation 2,679 2,679 2,679 2,679 2,679 2,679 2,679 2,679 2,679 2,679 2,679
Professional Services 1,250 1,250 1,250 1,250 1,250 1,250 1,250 1,250 1,250 1,250 1,250
Sub-Total Fiscal Services 3,929 3,929 3,929 3,929 3,929 3,929 3,929 3,929 3,929 3,929 3,929
page 4 of 5 Monthly Budget, Year 1: 2012-2013
Jul Aug Sep Oct Nov Dec Jan Feb Mar Apr MayFood Services
Salaries (Food Service Workers) 5,600 5,600 5,600 5,600 5,600 5,600 5,600 5,600 5,600
Fringe Benefits 1,455 1,455 1,455 1,455 1,455 1,455 1,455 1,455 1,455
Materials & Supplies 22,473 22,473 22,473 22,473 22,473 22,473 22,473 22,473 22,473
Sub-total Food Services 0 0 29,527 29,527 29,527 29,527 29,527 29,527 29,527 29,527 29,527
Pupil Transportation Services
Contracted Transportation Services 5,244 5,244 5,244 5,244 5,244 5,244 5,244 5,244 5,244
Page 38
Sub-Total Pupil Transportation Services 0 0 5,244 5,244 5,244 5,244 5,244 5,244 5,244 5,244 5,244
Operation of Plant
Salaries 3,217 3,217 3,217 3,217 3,217 3,217 3,217 3,217 3,217 3,217 3,217
Fringe Benefits 836 836 836 836 836 836 836 836 836 836 836
Purchased Service 186 186 186 186 186 186 186 186 186 186 186
Lawn Maintenance 143 143 143 143 143 143 143 143 143 143 143
Pest Control 143 143 143 143 143 143 143 143 143 143 143
Security Services 94 94 94 94 94 94 94 94 94 94 94
Property Insurance 1,574 1,574 1,574 1,574 1,574 1,574 1,574 1,574 1,574 1,574 1,574
Telephone Services 343 343 343 343 343 343 343 343 343 343 343
Water & Sewer 215 215 215 215 215 215 215 215 215 215 215
Electricity 2,146 2,146 2,146 2,146 2,146 2,146 2,146 2,146 2,146 2,146 2,146
Custodial Supplies & Equipment 1,250 1,250 1,250 1,250 1,250 1,250 1,250 1,250 1,250 1,250 1,250
Sub-Total Operation of Plant 10,145 10,145 10,145 10,145 10,145 10,145 10,145 10,145 10,145 10,145 10,145
page 5 of 5 Monthly Budget, Year 1: 2012-2013
Jul Aug Sep Oct Nov Dec Jan Feb Mar Apr May
Administrative Technology Services
Systems Operation 1,216 1,216 1,216 1,216 1,216 1,216 1,216 1,216 1,216 1,216 1,216
Sub-Total Administrative Technology Services 1,216 1,216 1,216 1,216 1,216 1,216 1,216 1,216 1,216 1,216 1,216
Debt Service
Redemption of Principal
Interest (Interest Only at 6%) 0 0 0 0 0 0 0 0 0 0
Sub-Total Debt Service 0 0 0 0 0 0 0 0 0 0 0
Contingency
Local Source Lunch Contingency
K - 5 (30% year 1) 1,458 1,458 1,458 1,458 1,458 1,458 1,458 1,458 1,458 1,458 1,458
6 - 8 (30% year 1) 698 698 698 698 698 698 698 698 698 698 698
Operating expense contingency - 4% of FEFP
Page 39
Sub-Total Contingency 2,156 2,156 2,156 2,156 2,156 2,156 2,156 2,156 2,156 2,156 2,156
Total Expenditures 94,336 201,427 350,754 343,462 341,511 342,292 342,682 342,292 353,283 341,901 341,511
Excess of Revenues over Expenditures 224,442 117,351 -8,948 -1,656 295 -486 -876 -486 -11,477 -95 295
Page 40
Year 1Jun Total
325,359 3,904,303
15,520 155,196
7,509 75,087
0 0
-6,581 -78,971
341,806 4,055,616
130,069 1,361,189
33,783 353,546
2,679 24,111
32,306
19,384
206,758
12,922
43,127
27,601
198,846 2,080,945
7,000 70,000
1,818 18,181
386 3,858
9,204 92,039
Page 41
Year 1Jun Total
6,689 70,000
1,737 18,181
507 5,304
1,500 16,500
10,433 109,985
9,261 96,918
9,261 96,918
8,583
4,994
0 13,577
1,301
1,907 17,167
21,000
1,907 39,467
3,121
1,561
2,601
0 7,283
Year 1Jun Total
31,518 31,518
31,518 31,518
Page 42
13,554 162,643
3,520 42,244
416 4,994
1,561
12,607
416
624
252 2,525
842 18,513
946 13,868
5,202
1,561
19,530 266,757
40,114 441,252
31,680
40,114 472,932
2,679 32,148
1,250 15,000
3,929 47,148
Year 1Jun Total
5,600 56,000
1,455 14,545
22,473 224,726
29,527 295,271
5,244 52,436
Page 43
5,244 52,436
3,217 38,602
836 10,026
186 2,232
143 1,717
143 1,717
94 1,124
1,574 18,883
343 4,120
215 2,575
2,146 25,750
1,250 15,000
10,145 121,745
Year 1Jun Total
1,216 14,592
1,216 14,592
0 0
0 0
0 0
1,458 17,496
698 8,370
162,225 162,225
Page 44
164,380 188,091
535,254 3,930,705
-193,448 124,911
Page 45
page 1 of 5 Monthly Budget, Year 1: 2012-2013
Jul Aug Sep Oct Nov Dec Jan Feb Mar Apr MayREVENUES
State Sources 328,612 328,612 328,612 328,612 328,612 328,612 328,612 328,612 328,612 328,612 328,612
Federal Sources 15,520 15,520 15,520 15,520 15,520 15,520 15,520 15,520 15,520
Local Sources - Lunch program paid students 7,509 7,509 7,509 7,509 7,509 7,509 7,509 7,509 7,509
Capital Outlay 19,313 19,313 19,313 19,313 19,313 19,313 19,313 19,313 19,313 19,313 19,313
Fee to County School Board - up to 250 students @ 5% -6,647 -6,647 -6,647 -6,647 -6,647 -6,647 -6,647 -6,647 -6,647 -6,647 -6,647
Total Revenues 341,278 341,278 364,306 364,306 364,306 364,306 364,306 364,306 364,306 364,306 364,306
EXPENDITURES
Instruction
Salaries (includes classroom teachers, 62,699 134,803 134,803 134,803 134,803 134,803 134,803 134,803 134,803 134,803
contract or hourly, and teacher aides)
Fringe Benefits 15,596 33,532 33,532 33,532 33,532 33,532 33,532 33,532 33,532 33,532
Contracted Professional Services (includes Therapists 2,733 2,733 2,733 2,733 2,733 2,733 2,733 2,733
& other contracted instructional services)
Classroom Supplies & Equipment 10,984 10,984 10,984
Teacher Supplies 6,590 6,590 6,590
Textbooks 70,298 70,298 70,298
Student Activities 4,394 4,394 4,394
Computer - Equipment & Repairs for Instruction 14,663 14,663 14,663
Software for Instruction 9,384 9,384 9,384
Sub-Total Instruction 94,897 204,028 204,028 204,028 204,028 204,028 204,028 204,028 204,028 204,028
Student Services
Salaries 7,070 7,070 7,070 7,070 7,070 7,070 7,070 7,070 7,070
Fringe Benefits 1,759 1,759 1,759 1,759 1,759 1,759 1,759 1,759 1,759
Contracted professional Services 393 393 393 393 393 393 393 393 393
Sub-total Student Services 9,222 9,222 9,222 9,222 9,222 9,222 9,222 9,222 9,222
page 2 of 5 Monthly Budget, Year 1: 2012-2013
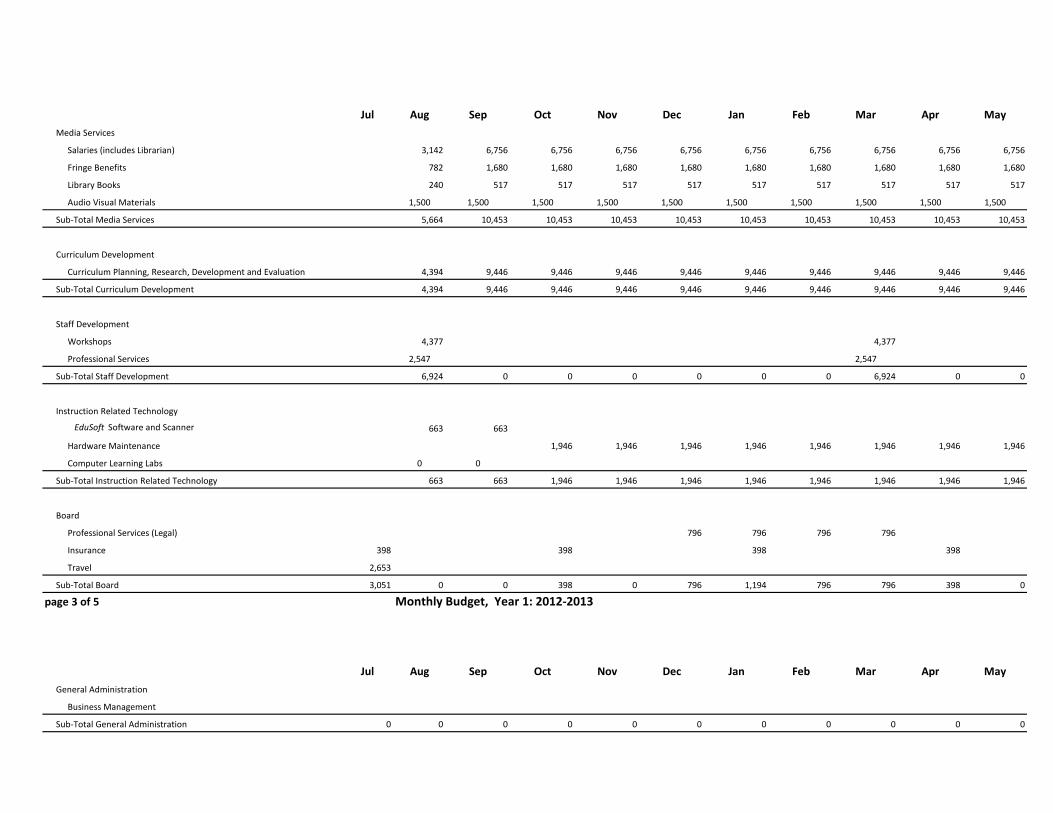
Page 46
Jul Aug Sep Oct Nov Dec Jan Feb Mar Apr MayMedia Services
Salaries (includes Librarian) 3,142 6,756 6,756 6,756 6,756 6,756 6,756 6,756 6,756 6,756
Fringe Benefits 782 1,680 1,680 1,680 1,680 1,680 1,680 1,680 1,680 1,680
Library Books 240 517 517 517 517 517 517 517 517 517
Audio Visual Materials 1,500 1,500 1,500 1,500 1,500 1,500 1,500 1,500 1,500 1,500
Sub-Total Media Services 5,664 10,453 10,453 10,453 10,453 10,453 10,453 10,453 10,453 10,453
Curriculum Development
Curriculum Planning, Research, Development and Evaluation 4,394 9,446 9,446 9,446 9,446 9,446 9,446 9,446 9,446 9,446
Sub-Total Curriculum Development 4,394 9,446 9,446 9,446 9,446 9,446 9,446 9,446 9,446 9,446
Staff Development
Workshops 4,377 4,377
Professional Services 2,547 2,547
Sub-Total Staff Development 6,924 0 0 0 0 0 0 6,924 0 0
Instruction Related Technology
EduSoft Software and Scanner 663 663
Hardware Maintenance 1,946 1,946 1,946 1,946 1,946 1,946 1,946 1,946
Computer Learning Labs 0 0
Sub-Total Instruction Related Technology 663 663 1,946 1,946 1,946 1,946 1,946 1,946 1,946 1,946
Board
Professional Services (Legal) 796 796 796 796
Insurance 398 398 398 398
Travel 2,653
Sub-Total Board 3,051 0 0 398 0 796 1,194 796 796 398 0
page 3 of 5 Monthly Budget, Year 1: 2012-2013
Jul Aug Sep Oct Nov Dec Jan Feb Mar Apr MayGeneral Administration
Business Management
Sub-Total General Administration 0 0 0 0 0 0 0 0 0 0 0
Page 47
School Administration
Salaries (Includes Principal, Secretary & other Personnel) 13,816 13,816 13,816 13,816 13,816 13,816 13,816 13,816 13,816 13,816 13,816
Fringe Benefits 3,437 3,437 3,437 3,437 3,437 3,437 3,437 3,437 3,437 3,437 3,437
Equipment Rental / Lease 424 424 424 424 424 424 424 424 424 424 424
Travel 1,592
Advertising and Promotion 4,286 4,286 4,286
Licenses Fees 424
Uniforms 637
Postage 257 257 257 257 257 257 257 257 257
Printing 9,442 858 858 858 858 858 858 858 858 858 858
Office Supplies 3,536 964 964 964 964 964 964 964 964 964 964
Office Equipment 5,306
Computer Equipment 1,592
Sub-Total School Administration 42,901 23,787 19,758 21,350 19,758 19,758 19,758 19,758 24,044 19,758 19,758
Facilities Acquisition & Construction
Building Lease / Rent 40,916 40,916 40,916 40,916 40,916 40,916 40,916 40,916 40,916 40,916
Furniture, Fixture and Equipment 31,680
Sub-Total Facilities Acquisition & Construction 31,680 40,916 40,916 40,916 40,916 40,916 40,916 40,916 40,916 40,916 40,916
Fiscal Services
Planning, Research, Development and Evaluation 2,733 2,733 2,733 2,733 2,733 2,733 2,733 2,733 2,733 2,733 2,733
Professional Services (payroll, accounting, auditing) 1,250 1,250 1,250 1,250 1,250 1,250 1,250 1,250 1,250 1,250 1,250
Sub-Total Fiscal Services 3,983 3,983 3,983 3,983 3,983 3,983 3,983 3,983 3,983 3,983 3,983
page 4 of 5 Monthly Budget, Year 1: 2012-2013
Jul Aug Sep Oct Nov Dec Jan Feb Mar Apr MayFood Services
Salaries (Food Service Workers) 5,712 5,712 5,712 5,712 5,712 5,712 5,712 5,712 5,712
Fringe Benefits 1,421 1,421 1,421 1,421 1,421 1,421 1,421 1,421 1,421
Materials & Supplies 22,922 22,922 22,922 22,922 22,922 22,922 22,922 22,922 22,922
Sub-total Food Services 0 0 30,055 30,055 30,055 30,055 30,055 30,055 30,055 30,055 30,055
Pupil Transportation Services
Contracted Transportation Services 5,348 5,348 5,348 5,348 5,348 5,348 5,348 5,348 5,348
Page 48
Sub-Total Pupil Transportation Services 0 0 5,348 5,348 5,348 5,348 5,348 5,348 5,348 5,348 5,348
Operation of Plant
Salaries 3,281 3,281 3,281 3,281 3,281 3,281 3,281 3,281 3,281 3,281 3,281
Fringe Benefits 816 816 816 816 816 816 816 816 816 816 816
Purchased Service 190 190 190 190 190 190 190 190 190 190 190
Lawn Maintenance 146 146 146 146 146 146 146 146 146 146 146
Pest Control 146 146 146 146 146 146 146 146 146 146 146
Security Services 96 96 96 96 96 96 96 96 96 96 96
Property Insurance 1,605 1,605 1,605 1,605 1,605 1,605 1,605 1,605 1,605 1,605 1,605
Telephone Services 350 350 350 350 350 350 350 350 350 350 350
Water & Sewer 219 219 219 219 219 219 219 219 219 219 219
Electricity 2,189 2,189 2,189 2,189 2,189 2,189 2,189 2,189 2,189 2,189 2,189
Custodial Supplies & Equipment 1,250 1,250 1,250 1,250 1,250 1,250 1,250 1,250 1,250 1,250 1,250
Sub-Total Operation of Plant 10,287 10,287 10,287 10,287 10,287 10,287 10,287 10,287 10,287 10,287 10,287
page 5 of 5 Monthly Budget, Year 1: 2012-2013
Jul Aug Sep Oct Nov Dec Jan Feb Mar Apr May
Administrative Technology Services
Systems Operation 1,240 1,240 1,240 1,240 1,240 1,240 1,240 1,240 1,240 1,240 1,240
Sub-Total Administrative Technology Services 1,240 1,240 1,240 1,240 1,240 1,240 1,240 1,240 1,240 1,240 1,240
Debt Service
Redemption of Principal
Interest (Interest Only at 6%) 0 0 0 0 0 0 0 0 0 0
Sub-Total Debt Service 0 0 0 0 0 0 0 0 0 0 0
Contingency
Local Source Lunch Contingency
K - 5 (30% year 1) 1,458 1,458 1,458 1,458 1,458 1,458 1,458 1,458 1,458 1,458 1,458
6 - 8 (30% year 1) 698 698 698 698 698 698 698 698 698 698 698
Operating expense contingency - 4% of FEFP
Page 49
Sub-Total Contingency 2,156 2,156 2,156 2,156 2,156 2,156 2,156 2,156 2,156 2,156 2,156
Total Expenditures 95,298 194,911 347,556 350,828 348,838 349,634 350,032 349,634 360,845 349,236 348,838
Excess of Revenues over Expenditures 245,980 146,367 16,750 13,478 15,468 14,672 14,274 14,672 3,461 15,070 15,468
Page 50
Year 1Jun Total
328,612 3,943,346
15,520 155,196
7,509 75,087
19,313 231,750
-6,647 -79,760
364,306 4,325,619
134,803 1,410,733
33,532 350,913
2,733 24,593
32,952
19,771
210,893
13,181
43,989
28,153
204,028 2,135,180
7,070 70,700
1,759 17,586
393 3,935
9,222 92,221
Page 51
Year 1Jun Total
6,756 70,700
1,680 17,586
517 5,410
1,500 16,500
10,453 110,196
9,446 98,856
9,446 98,856
8,755
5,094
0 13,849
1,327
1,946 17,510
0
1,946 18,836
3,184
1,592
2,653
0 7,428
Year 1Jun Total
32,148 32,148
32,148 32,148
Page 52
13,816 165,796
3,437 41,241
424 5,094
1,592
12,859
424
637
257 2,575
858 18,883
964 14,145
5,306
1,592
19,758 270,144
40,916 450,077
31,680
40,916 481,757
2,733 32,791
1,250 15,000
3,983 47,791
Year 1Jun Total
5,712 57,120
1,421 14,208
22,922 229,221
30,055 300,549
5,348 53,485
Page 53
5,348 53,485
3,281 39,374
816 9,794
190 2,276
146 1,751
146 1,751
96 1,146
1,605 19,261
350 4,202
219 2,626
2,189 26,265
1,250 15,000
10,287 123,447
Year 1Jun Total
1,240 14,883
1,240 14,883
0 0
0 0
0 0
1,458 17,496
698 8,370
173,025 173,025
Page 54
175,180 198,891
554,012 3,999,664
-189,705 325,955
Page 55
page 1 of 5 Monthly Budget, Year 1: 2012-2013
Jul Aug Sep Oct Nov Dec Jan Feb Mar Apr MayREVENUES
State Sources 331,898 331,898 331,898 331,898 331,898 331,898 331,898 331,898 331,898 331,898 331,898
Federal Sources 15,520 15,520 15,520 15,520 15,520 15,520 15,520 15,520 15,520
Local Sources - Lunch program paid students 7,509 7,509 7,509 7,509 7,509 7,509 7,509 7,509 7,509
Capital Outlay 19,313 19,313 19,313 19,313 19,313 19,313 19,313 19,313 19,313 19,313 19,313
Fee to County School Board - up to 250 students @ 5% -6,713 -6,713 -6,713 -6,713 -6,713 -6,713 -6,713 -6,713 -6,713 -6,713 -6,713
Total Revenues 344,498 344,498 367,526 367,526 367,526 367,526 367,526 367,526 367,526 367,526 367,526
EXPENDITURES
Instruction
Salaries (includes classroom teachers, 64,381 138,419 138,419 138,419 138,419 138,419 138,419 138,419 138,419 138,419
contract or hourly, and teacher aides)
Fringe Benefits 16,004 34,408 34,408 34,408 34,408 34,408 34,408 34,408 34,408 34,408
Contracted Professional Services 2,733 2,733 2,733 2,733 2,733 2,733 2,733 2,733
Classroom Supplies & Equipment 11,204 11,204 11,204
Teacher Supplies 6,722 6,722 6,722
Textbooks 71,704 71,704 71,704
Student Activities 4,481 4,481 4,481
Computer - Equipment & Repairs for Instruction 14,956 14,956 14,956
Software for Instruction 9,572 9,572 9,572
Sub-Total Instruction 97,318 209,234 209,234 209,234 209,234 209,234 209,234 209,234 209,234 209,234
Student Services
Salaries 7,141 7,141 7,141 7,141 7,141 7,141 7,141 7,141 7,141
Fringe Benefits 1,775 1,775 1,775 1,775 1,775 1,775 1,775 1,775 1,775
Contracted professional Services 401 401 401 401 401 401 401 401 401
Sub-total Student Services 9,318 9,318 9,318 9,318 9,318 9,318 9,318 9,318 9,318
page 2 of 5 Monthly Budget, Year 1: 2012-2013
Page 56
Jul Aug Sep Oct Nov Dec Jan Feb Mar Apr MayMedia Services
Salaries 3,174 6,824 6,824 6,824 6,824 6,824 6,824 6,824 6,824 6,824
Fringe Benefits 789 1,696 1,696 1,696 1,696 1,696 1,696 1,696 1,696 1,696
Library Books 245 527 527 527 527 527 527 527 527 527
Audio / Visual Materials 1,500 1,500 1,500 1,500 1,500 1,500 1,500 1,500 1,500 1,500
Sub-Total Media Services 5,708 10,548 10,548 10,548 10,548 10,548 10,548 10,548 10,548 10,548
Curriculum Development
Curriculum Planning, Research, Development and Evaluation 4,481 9,635 9,635 9,635 9,635 9,635 9,635 9,635 9,635 9,635
Sub-Total Curriculum Development 4,481 9,635 9,635 9,635 9,635 9,635 9,635 9,635 9,635 9,635
Staff Development
Workshops 4,465 4,465
Professional Services 2,598 2,598
Sub-Total Staff Development 7,063 0 0 0 0 0 0 7,063 0 0
Instruction Related Technology
EduSoft Software and Scanner 677 677
Hardware Maintenance 1,984 1,984 1,984 1,984 1,984 1,984 1,984 1,984
Computer Learning Labs 10,500 10,500
Sub-Total Instruction Related Technology 11,177 11,177 1,984 1,984 1,984 1,984 1,984 1,984 1,984 1,984
Board
Professional Services (Legal) 812 812 812 812
Insurance 406 406 406 406
Travel 2,706
Sub-Total Board 3,112 0 0 406 0 812 1,218 812 812 406 0
page 3 of 5 Monthly Budget, Year 1: 2012-2013
Jul Aug Sep Oct Nov Dec Jan Feb Mar Apr MayGeneral Administration
Business Management
Sub-Total General Administration 0 0 0 0 0 0 0 0 0 0 0
Page 57
School Administration
Salaries (Includes Principal, Secretary & other Personnel) 14,084 14,084 14,084 14,084 14,084 14,084 14,084 14,084 14,084 14,084 14,084
Fringe Benefits 3,501 3,501 3,501 3,501 3,501 3,501 3,501 3,501 3,501 3,501 3,501
Equipment Rental / Lease 433 433 433 433 433 433 433 433 433 433 433
Travel 1,624
Advertising and Promotion 4,372 4,372 4,372
Licenses Fees 433
Uniforms 649
Postage 263 263 263 263 263 263 263 263 263
Printing 9,630 875 875 875 875 875 875 875 875 875 875
Office Supplies 3,607 984 984 984 984 984 984 984 984 984 984
Office Equipment 5,412
Computer Equipment 1,624
Sub-Total School Administration 43,746 24,250 20,140 21,764 20,140 20,140 20,140 20,140 24,512 20,140 20,140
Facilities Acquisition & Construction
Building Lease / Rent 41,734 41,734 41,734 41,734 41,734 41,734 41,734 41,734 41,734 41,734
Furniture, Fixture and Equipment 31,680
Sub-Total Facilities Acquisition & Construction 31,680 41,734 41,734 41,734 41,734 41,734 41,734 41,734 41,734 41,734 41,734
Fiscal Services
Planning, Research, Development and Evaluation 2,787 2,787 2,787 2,787 2,787 2,787 2,787 2,787 2,787 2,787 2,787
Professional Services (payroll, accounting, auditing) 1,250 1,250 1,250 1,250 1,250 1,250 1,250 1,250 1,250 1,250 1,250
Sub-Total Fiscal Services 4,037 4,037 4,037 4,037 4,037 4,037 4,037 4,037 4,037 4,037 4,037
page 4 of 5 Monthly Budget, Year 1: 2012-2013
Masters Preparatory School K-8
Jul Aug Sep Oct Nov Dec Jan Feb Mar Apr MayFood Services
Salaries (Food Service Workers) 5,826 5,826 5,826 5,826 5,826 5,826 5,826 5,826 5,826
Fringe Benefits 1,448 1,448 1,448 1,448 1,448 1,448 1,448 1,448 1,448
Materials & Supplies 23,381 23,381 23,381 23,381 23,381 23,381 23,381 23,381 23,381
Sub-total Food Services 0 0 30,655 30,655 30,655 30,655 30,655 30,655 30,655 30,655 30,655
Pupil Transportation Services
Contracted Transportation Services 5,455 5,455 5,455 5,455 5,455 5,455 5,455 5,455 5,455
Page 58
Sub-Total Pupil Transportation Services 0 0 5,455 5,455 5,455 5,455 5,455 5,455 5,455 5,455 5,455
Operation of Plant
Salaries 3,347 3,347 3,347 3,347 3,347 3,347 3,347 3,347 3,347 3,347 3,347
Fringe Benefits 832 832 832 832 832 832 832 832 832 832 832
Purchased Service 193 193 193 193 193 193 193 193 193 193 193
Lawn Maintenance 149 149 149 149 149 149 149 149 149 149 149
Pest Control 149 149 149 149 149 149 149 149 149 149 149
Security Services 97 97 97 97 97 97 97 97 97 97 97
Property Insurance 1,637 1,637 1,637 1,637 1,637 1,637 1,637 1,637 1,637 1,637 1,637
Telephone Services 357 357 357 357 357 357 357 357 357 357 357
Water & Sewer 223 223 223 223 223 223 223 223 223 223 223
Electricity 2,233 2,233 2,233 2,233 2,233 2,233 2,233 2,233 2,233 2,233 2,233
Custodial Supplies & Equipment 1,250 1,250 1,250 1,250 1,250 1,250 1,250 1,250 1,250 1,250 1,250
Sub-Total Operation of Plant 10,467 10,467 10,467 10,467 10,467 10,467 10,467 10,467 10,467 10,467 10,467
page 5 of 5 Monthly Budget, Year 1: 2012-2013
Masters Preparatory School K-8
Jul Aug Sep Oct Nov Dec Jan Feb Mar Apr May
Administrative Technology Services
Systems Operation 1,265 1,265 1,265 1,265 1,265 1,265 1,265 1,265 1,265 1,265 1,265
Sub-Total Administrative Technology Services 1,265 1,265 1,265 1,265 1,265 1,265 1,265 1,265 1,265 1,265 1,265
Debt Service
Redemption of Principal
Interest (Interest Only at 6%) 0 0 0 0 0 0 0 0 0 0
Sub-Total Debt Service 0 0 0 0 0 0 0 0 0 0 0
Contingency
Local Source Lunch Contingency
K - 5 (30% year 1) 1,458 1,458 1,458 1,458 1,458 1,458 1,458 1,458 1,458 1,458 1,458
6 - 8 (30% year 1) 698 698 698 698 698 698 698 698 698 698 698
Operating expense contingency - 4% of FEFP
Page 59
Sub-Total Contingency 2,156 2,156 2,156 2,156 2,156 2,156 2,156 2,156 2,156 2,156 2,156
Total Expenditures 96,464 209,657 365,821 358,659 356,629 357,441 357,847 357,441 368,876 357,035 356,629
Excess of Revenues over Expenditures 248,034 134,841 1,704 8,867 10,897 10,085 9,679 10,085 -1,350 10,491 10,897
Page 60
Year 1Jun Total
331,898 3,982,780
15,520 155,196
7,509 75,087
19,313 231,750
-6,713 -80,558
367,526 4,364,255
138,419 1,448,568
34,408 360,083
2,733 24,593
33,611
20,167
215,111
13,444
44,869
28,716
209,234 2,189,655
7,141 71,414
1,775 17,752
401 4,014
9,318 93,180
Page 61
Year 1Jun Total
6,824 71,414
1,696 17,752
527 5,518
1,500 16,500
10,548 111,184
9,635 100,833
9,635 100,833
8,930
5,196
0 14,126
1,353
1,984 17,860
21,000
1,984 40,213
3,247
1,624
2,706
0 7,577
Year 1Jun Total
32,791 32,791
32,791 32,791
Page 62
14,084 169,012
3,501 42,013
433 5,196
1,624
13,117
433
649
263 2,626
875 19,261
984 14,428
5,412
1,624
20,140 275,394
41,734 459,079
31,680
41,734 490,759
2,787 33,447
1,250 15,000
4,037 48,447
Year 1Jun Total
5,826 58,262
1,448 14,483
23,381 233,805
30,655 306,551
5,455 54,555
Page 63
5,455 54,555
3,347 40,162
832 9,983
193 2,322
149 1,786
149 1,786
97 1,169
1,637 19,646
357 4,286
223 2,679
2,233 26,790
1,250 15,000
10,467 125,609
Year 1Jun Total
1,265 15,181
1,265 15,181
0 0
0 0
0 0
1,458 17,496
698 8,370
174,570 174,570
Page 64
176,726 200,436
563,991 4,106,492
-196,465 257,763
Page 65
Budget Summary
Year 1 Year 2 Year 3 Year 4 Year 5
Grades K-7 K-8 K-8 K-8 K-8Students per grade (average) 56 61 69 69 69Total # Students 450 550 618 618 618Per Student Revenue*
2.5% 2.5% 2.5% 2.5%
REVENUE Maximum Gross Revenue ($) 2,786,922 3,440,300 3,904,303 3,943,346 3,982,780 Expected Attrition (%) (139,346) (172,015) (195,215) (197,167) (199,139) Likely Gross Revenue ($) 2,647,576 3,268,285 3,709,088 3,746,179 3,783,641
EXPENDITURE Facility Budget Maximum Facility Expense 17% 444,157 506,890 562,997 573,524 584,688 Minimum Building Size (Sqft) 1% 22,500 27,500 30,900 30,900 30,900 Maximun cost per student 0.03% 700 718 735 754 773 Operating and Fixed Costs 4% 100,357 114,190 121,745 123,447 125,609 Rent 13% 343,800 392,700 441,252 450,077 459,079
Teacher Staffing Size Average Class Size 19 18 19 19 19 # of Teachers 24 31 33 33 33 Salary Benefits per Teacher 9,244 9,384 10,714 10,634 10,912


![6. [pro forma] project pro-forma james horbury](https://static.documents.pub/doc/80x56/588684481a28ab962a8b7881/6-pro-forma-project-pro-forma-james-horbury.jpg)


