1 JULY 2016 Charting the Path Forward in Palm Beach County Over the past 10 months, Education Resource Strategies (ERS) has partnered with SDPBC to conduct a detailed assessment of how people, time, and money are used across the system. We have compared existing resource use patterns within SDPBC to best practice based on ERS’ research and experience working with districts across the country. In a series of collaborative working sessions including 40 district and school leaders, we have identified and prioritized opportunities to improve student performance with the currently available resources through strategic resource reallocation. We have also kept SDPBC’s Board and Budget Advisory Committee abreast of findings and implications throughout the year. In this memo, we highlight three themes we believe are crucial to the district’s success at realizing the ambitious goals outlined in its five-year strategic plan, “Growing. Strong.” 1. Improve resource use and organization in lowest-performing schools and for lowest-performing students in all schools. 2. Implement major shifts in how resources are allocated to educate English Language Learners and special education students. 3. Clearly define what makes working in SDPBC unique, compelling, and sustainable for great teachers. Realizing the District’s Five-Year Goals SDPBC has set aggressive academic goals for the next five years, which makes sense—system transformation is grounded in setting high expectations at the student, classroom, school, and district level. However, the growth implied by SDPBC’s goals – which for some is on par with the most significant system-wide transformations we have seen in the past generation – makes it critically important for the district to invest its scarce resources in strategies that have the greatest potential for positive impact on its students.
Transcript
1
JULY 2016
Charting the Path Forward in Palm Beach County Over the past 10 months, Education Resource Strategies (ERS) has partnered with SDPBC to conduct a detailed assessment of how people, time, and money are used across the system. We have compared existing resource use patterns within SDPBC to best practice based on ERS’ research and experience working with districts across the country. In a series of collaborative working sessions including 40 district and school leaders, we have identified and prioritized opportunities to improve student performance with the currently available resources through strategic resource reallocation. We have also kept SDPBC’s Board and Budget Advisory Committee abreast of findings and implications throughout the year. In this memo, we highlight three themes we believe are crucial to the district’s success at realizing the ambitious goals outlined in its five-year strategic plan, “Growing. Strong.”
1. Improve resource use and organization in lowest-performing schools and for lowest-performing students in all schools.
2. Implement major shifts in how resources are allocated to educate English Language Learners and special education students.
3. Clearly define what makes working in SDPBC unique, compelling, and sustainable for great teachers.
Realizing the District’s Five-Year Goals
SDPBC has set aggressive academic goals for the next five years, which makes sense—system transformation is grounded in setting high expectations at the student, classroom, school, and district level. However, the growth implied by SDPBC’s goals – which for some is on par with the most significant system-wide transformations we have seen in the past generation – makes it critically important for the district to invest its scarce resources in strategies that have the greatest potential for positive impact on its students.
2
SDPBC’s challenge is heightened by the district’s scale. For example, the other districts we’ve seen achieve gains of this magnitude range in size from 20% to 40% of SDPBC’s student population. This implies SDPBC would have to improve outcomes for up to five times the number of students these districts did to achieve similar gains.
None of this calls SDPBC’s ambitious goals into question – rather, it emphasizes the need for the district to ensure it prioritizes and invests in strategies that are most likely to contribute to realizing those goals.
Initial Actions
Based on a detailed review of SDPBC practices and comparisons to national peer districts from the ERS database, we have identified and reviewed opportunities to strategically reallocate tens of millions of dollars to support student learning in the coming years. Notably, SDPBC leadership has already put in process several major shifts informed by our work together this year. These include:
• Reorganizing school support to reduce span of control for principal supervisors, make supports more cohesive, and shift $5.5M in Title I dollars from the central office to schools;
• Adding 49 dual language ESOL teachers by changing the non-instructional ESOL staff allocation for Community Language Facilitators as well as the elementary school ESOL allocation, shifting $3.5M to schools with the highest-need ELL populations;
• Adding 90 minutes of collaborative planning time for core teachers in shared course teams at all schools;
• Providing additional time for reading at struggling elementary schools with plans to expand to all elementary schools.
These are important and high-potential strategies that have helped position SDPBC to achieve true system-wide transformation. But we believe they provide a foundation for set of fundamental changes that, taken together, are crucial to enabling SDPBC to fundamentally improve outcomes for its students.
3
1. Improve Resource Use and Organization in Lowest-Performing Schools and for Lowest-Performing Students in All Schools
Strategic School Design for All SDPBC Schools
In a district where 10% of all schools are currently meeting the bar of 75% proficiency in third-grade reading, improving performance for struggling schools as well as for struggling students in all schools is crucial to transforming districtwide outcomes.
Today, about half of SDPBC third graders can read on grade level based on FSA’s measure of proficiency. Of those who cannot, two-thirds (31% of all district third graders) attend C, D or F schools. At the same time, one-third of non-proficient third-graders (18% of total district third-graders) attend A or B schools.
To address this challenge, the district must help all school leaders be as strategic as possible in how they organize available school-level resources.
In strategic schools, leaders start with a strong vision around what it will take for students and teachers to be successful and then organize resources—people, time, technology, and money—around that vision. Rather
FROM: • A one-size-fits-all model for school
design that provides little differentiation in resource use based on student need.
• District turnaround support in the form of increased instructional and coaching staff targeted to F schools only.
TO: • Strategic school designs that target struggling
students within all schools, and that require the strategic use of people, time, and money.
• Turnaround support focused on strategic school design and strong talent that is expanded to include D schools.
4
than sustaining traditional one-size-fits-all learning environments with rigid schedules, class sizes and instructional models that force teachers to work in isolation, they reimagine the fundamentals of how their school operates, with restructured schedules and dynamic grouping strategies that respond to learning needs and create new opportunities for instructional collaboration.
Our study found that, with the exception of increased time in ELA for students in certain elementary schools and for students who have fallen significantly behind, there is little structural differentiation of school-level resource use within and across SDPBC schools, including little meaningful targeting of time and attention for the highest-need students.
Therefore, we recommend that SDPBC support strategic school designs in all schools, ensuring school supervisors provide effective supports for school leaders, and increasing and improving resources (talent and money) in the schools struggling the most.
To improve performance for low-performing students in all schools, SDPBC should prioritize the development of strategic school designs that focus on the following key areas:
• Provide more instructional time in key subjects. In SDPBC, below-proficient students in secondary schools already receive additional time in ELA through the Intensive Reading course. However, this additional time for below-proficient students isn’t usually provided for math. Additionally, elementary schools should also provide this additional time for students struggling in ELA and/or math, especially in the early grades.
• Create meaningfully smaller group sizes in critical subjects. Schools can use non-classroom teacher FTEs in strategic ways to drastically reduce group size. For example, one teacher could push-
Strategic School Design in Action
In 2008, Ashley Park Elementary in Charlotte, North Carolina, was on the brink of failure. Fewer than 35 percent of students scored proficient in math and ELA. Relationships among teachers were poor—in many cases, they didn’t even know each other’s names. By 2010, Ashley Park was a school transformed. Proficiency levels had doubled in math, reaching 66%, and reading proficiency scores increased to 49%. Student behavior and teacher morale had also improved profoundly. What happened? Principal Tonya Kales introduced a family model for the school based on an entirely new approach. Groups of teachers shared responsibility for all students in a grade level. Teachers met twice a week in facilitated meetings to analyze student data, group students according to their needs, and plan instruction for each group. The master schedule was eliminated. Instead, teachers and students were grouped and regrouped throughout the day. Time allocated to a subject varied based on what students needed at any given moment. Students with special needs and special education staff were included in these “families.” Because special education services were integrated into the broader family model grouping, struggling general education students had access to more specialized support when they needed it. Principal Kales’ strategy started with a clear vision of what it would take for Ashley Park’s students and teachers to be successful, then reorganized resources—people, time, technology, and money— around that vision.
5
in to three classrooms during reading instruction for 90 minutes each, cutting group size in half for each of those three classes during the reading block. This allows for highly personalized instruction and is more effective than slightly lowering average class size by adding a reading class for a single grade level across the board. Schools could use instructional personnel already in their buildings (e.g., special education teachers, ESOL teachers, ESE coordinators) to provide this push-in support throughout the day at targeted times. Additionally, as we saw with the example of the Revere (MA) Freshman Academy, secondary schools could create significantly smaller class size for the most struggling students, while increasing class size for higher-performing students who don’t require the same level of support to maintain academic growth.
• Ensure the teachers who educate low-performing students are among the most effective in their building. In most secondary schools in the district, school leaders are already assigning their most experienced teachers to the Intensive Reading courses. Nuanced data views of teacher effectiveness—including Marzano ratings, and VAM scores—can help school leaders assign teachers strategically so that the students who need the most growth will be taught by the most effective teachers.
• Build flexibility into the schedule to ensure these resources can be deployed dynamically as student needs evolve. For targeted learning resources to be maximally effective, they also need to be dynamic to allow schools to continually adjust to the changing needs of students and reprioritize based on student growth and performance. Schools can thoughtfully design schedules and staffing to include frequent opportunities to analyze student performance and growth, and shift resources—including changing teacher and student schedules—based on data.
• Build strong collaborative structures within schools. SDPBC will be rolling out 90 minutes of collaborative planning time (CPT) districtwide in SY 16-17, which is a powerful step. To improve the success of this initiative, SDPBC should ensure that principals and teachers receive the right supports for scheduling and structuring this time. This includes:
o Supporting schools in building strategic schedules that ensure teachers who teach the same courses have weekly CPT;
o Training school-based experts to facilitate the collaborative time, as well as training school leaders in how to support and monitor the effectiveness of this time;
o Developing and sharing effective agendas and protocols to maximize the impact of CPT.
While the district’s CPT initiative requires this time to be facilitated by teacher leaders, the district has not yet determined how teacher leaders will be chosen, whether they will receive stipends or how they and their principals and instructional supervisors will be trained. Sixty-four schools will have school culture coordinators, and a small part of their role will be supporting teacher leaders for CPT; however, there is likely a limit to how much capacity these staff members will have for supporting teacher leaders.
SDPBC has taken a huge step toward improving support for all schools and for low-performing schools in particular by consolidating and restructuring school supervision offices, creating smaller portfolios of schools for instructional superintendents, and assigning the D and F schools in even smaller portfolios to regional superintendents. However, the magnitude of change that happens in schools will be a function of how deeply these supervisors are able to support principals in redesigning their schools from the ground up.
Instructional and regional superintendents can’t do this work alone. Our experience in multiple districts demonstrates that the system must provide the structure, guidance, and support to fully empower school leaders and their supervisors to create real change in their schools.
To ensure that school supervisors are equipped to provide effective supports for school leaders, SDPBC should:
• Use data to assist schools in identifying and supporting highest-need students. Principals need to have multiple data views of student performance in order to understand which students need which types of support. Additionally, principals need access to data on resource use within their buildings so they understand how people, time, and money are currently deployed. Review of this data with regional and instructional superintendents should be integrated early in the school planning process as well as periodically throughout the school year, making it possible for principals and their supervisors to align on student performance priorities and school-level resource priorities, develop annual plans to leverage resources to provide targeted supports to specific groups of students, and helping principals make informed adjustments to schedules, student assignment and teacher assignment.
7
• Support school leaders in creating strategic school designs that will direct resources based on students’ needs and performance. Instructional and regional superintendents should be leveraged to provide significant training for school leaders to enable them to develop these strategic school designs. These district leaders will also require training to ensure they can provide the most effective support to principals and their teams.
• Integrate representation from core district offices, including ELL, ESE, Talent and Budget, into school support, addressing principals’ feedback about the silo-ed nature of district support and enabling school leaders and their supervisors to develop cohesive school plans that help them make the most of all available resources to support students.
Going Deeper with Struggling Schools
While strategic school design and targeted and effective school supervision are priorities for all schools, there are some district schools that face the additional challenge of serving higher concentrations of struggling students, primarily the D and F schools. The district does provide additional support for many of these schools. For example, Turnaround schools—those which received a state grade of “F” or which received a state grade of “D” for more than one year—receive about 30% more resources than A-C schools on a per-pupil basis. This support comes primarily in the form of additional teaching and coaching staff.
However, schools that have received only one “D” rating from the state receive only marginally more than A-C schools—resources that do not generally accrue to instruction—although experience indicates that these schools have a 50/50 chance of sliding into “F” status within two years.
In addition to the focus on strategic school design and targeted and effective supervision for all schools, SDPBC should seek to increase and improve both talent and financial resources in its lowest-performing schools:
8
• Prioritize attracting and developing effective talent in high-needs schools. Given the magnitude of the challenge in turnaround schools, it’s essential to have the strongest and most effective teachers and leaders in those buildings. The district could support this by:
o Instituting staffing incentives to help recruit the most effective teachers to the highest-needs schools. While the district does provide a Glades supplement to teachers and leaders in that part of the county, the district does not provide financial incentives for teaching in other high-needs schools.
o Recruiting school leaders who can serve as “talent magnets” to attract high-performing teachers to those buildings. Often the most successful principals are promoted to other positions or move from elementary to middle to high school. The district needs to actively recruit its most effective principals to its highest-needs schools both to improve leadership in those buildings as well as to help attract effective teachers.
o Providing quality coaching and support to principals, from regional superintendents, and to teachers, from school-based leadership and coaches. The district can take advantage of the new regional superintendent structure, with its small ratio of supervisor to principal, to provide highly targeted coaching and support to principals. Additionally, principals, school leaders, and coaches should receive development to improve their own coaching skillset for the teachers in their buildings.
• Ensure additional resources are provided to single-D schools as well as Turnaround schools. While D schools will benefit from the same regional superintendent support as F schools, single-D schools currently do not receive the same level of resources as Turnaround schools. To significantly impact student achievement, the district should consider reallocating resources to provide additional resources to single-D schools in the form of additional teacher and coach FTE. Increasing spending for both instruction and professional development for single-D schools to the level of Turnaround schools would cost the district approximately $10M—totaling to $9M for elementary schools and just under $1M for middle schools.
2. Implement Major Shifts in How Resources Are Allocated to English Language Learners and Special Education Students
With 15% of students classified for Exceptional Student Education (not including “gifted” students) and 11% of students classified as English Language Learners, it’s critical for the district to ensure that it’s investing resources strategically for these student groups in ways that will lead to meaningful student growth.
FROM: Resource allocations for ELL and ESE students that are based on legacy structures and don’t consistently prioritize instructional resources based on student need or model of service.
TO: Resource allocations for ELL and ESE students that focus on instructional supports and effectively differentiate staffing ratios based on student need and model of service.
9
Improving Outcomes for English Language Learners
As we outlined early in our partnership, academic performance among ELL students in the district lags farthest behind other SDPBC students and significantly behind peers in other districts throughout the state.
SDPBC does spend $606 more per pupil for ELL students than the median of peer districts; however, that investment is skewed toward non-instructional positions, which comprise 32% of total ELL spending in the district, compared to less than 10% in most peer districts. As a result of higher ELL student-teacher ratios, SDPBC spends 20% less on ELL teaching positions compared to the peers.
10
The district currently spends a total of $14.5 million on non-instructional ELL positions, of which $8.4 million goes toward ESOL coordinator positions and another $4.8 million is spent on guidance counselors. Reducing each of these positions by half would bring the district’s total spend on non-instructional ELL positions down to $6.6 million or $355 per ELL pupil, much closer to the peer median of $172, and would allow the district to reinvest those savings in ELL instruction.
Additionally, the district currently employs generic staffing ratios for ELL students in elementary and secondary (60:1 and 40:1, respectively), regardless of students’ level of English proficiency or required ESOL instructional minutes. This results in an inequitable structure where ELL students who are most proficient in English receive the same level of resources as their ELL peers who demonstrate more basic English proficiency. Differentiating allocations by students’ ESOL instructional need, as expressed by instructional time requirements, would allow schools to provide instruction based on student need.
Improving Outcomes for Students with Special Needs
At 15%, the district’s special education population is higher than the national and state average of 13%. The district is already making strides to reduce potential over-identification by revamping and reinvesting in its approach to RTI using a multi-tiered system of supports (MTSS) model.1
While special education students in the district outperform their ESE peers in other local districts, realizing its ambitious performance goals requires that SDPBC focus on serving this population more effectively. As with ELL, the district’s current approach to special education staffing results in an inequitable structure where some students are over-resourced and others are under-resourced.
Because the district staffs special education based on student program type rather than model of service (i.e., resource/inclusion, self-contained, or consult-only) some students receive teacher allocations that exceed their need. For example, “consult-only” students – for whom support is designed to come as teacher-to-teacher guidance – are staffed at the same rate as resource/inclusion and self-contained students within the same program type. Additionally, within each program type, resource/inclusion students – who spend more than 40% of their time in a general education classroom2 – are staffed at the same rate as self-contained students even though resource/inclusion students receive significantly less time with a special education teacher.
1 http://www.boarddocs.com/fl/palmbeach/Board.nsf/files/A9FSW369036B/$file/MTSS.pdf 2 Resource students, who make up 13% of SDPBC’s ESE population (excluding gifted) spend 40-79% of their time in general education classrooms; Inclusion students, who make up 64% of SDPBC’s ESE population (excluding gifted) spend at least 80% of their time in general education classrooms.
On the other hand, other students receive fewer resources than their need suggests. For example, in the current system, the “trigger point” for adding a special education teacher is .76, meaning that if a staffing ratio is set at 18:1, a new teacher isn’t triggered until the number of students allocated to one teacher rises above 31.5. As a result, the current fill rate – defined as the average number of students in a special education class divided by the target staffing ratio for those students – for classes serving students with Varying Exceptionalities is 113%. This implies overcrowded special education classes taught by overburdened special education teachers, with less potential for these students to learn and achieve at higher rates.
For special education students, the district should focus on revising staffing ratios to ensure resources are prioritized based on student need. The district has already made moves in this area, with plans to restructure the allocations formula for speech-language pathologists for SY17 to be more in line with other districts, thereby freeing up resources to be invested in additional instructional supports for special education students. Further revising staffing ratios for other special education positions will help ensure that special education investments have the maximum impact on student achievement.
ELL/ESE Action Steps
For both ESE and ELL students, the district needs to rethink resource allocation in order to ensure all students’ instructional needs are met:
• Revise staffing ratios according to student need and model of service. For both ELL students and special education students, current staffing ratios do not effectively differentiate based on student need or model of service, resulting in inequities for some student groups. The district should implement revised staffing ratios that more accurately reflect student need in order to provide targeted and effective supports:
o Differentiate ELL staffing ratios by English proficiency and ESOL instructional time: Currently ESOL staffing ratios are differentiated by elementary versus secondary, but no distinction is made in staffing ratios based on how students are served or how much ESOL instructional time they require. The district should revise allocations by using a combination of a student’s placement (i.e., sheltered versus mainstream for secondary schools) and required
12
ESOL instructional time as determined by English proficiency level from the WIDA assessment. In this model, an ELL student requiring three hours of sheltered ESOL instruction daily would be allocated teachers at a higher rate than an ELL student requiring only one hour of push-in instruction daily. Finally, along with revising ELL staffing ratios, the district would need to provide clear guidance and requirements to ensure that ELL students and teachers are assigned in accordance with the ratios outlined.
o Differentiate special education staffing ratios by model of service rather than program type. Currently the district’s special education staffing ratios are organized by special education program category, regardless of how students are served. To ensure equity for students, the district should revise staffing special education ratios so that consult-only students are allocated teachers at a lower rate, and so that students who spend the majority of their day in a self-contained setting are allocated teachers at a higher rate than those who spend the majority of their day in inclusion.
• Ensure sufficient investment in instructional positions. For both ELL students and special education students, some programs or models of service are currently under-resourced compared to peer districts. The district could shift existing resources to fund increased staffing for these students:
o Increase the number of teachers allocated for ELL students. By shifting dollars away from non-instructional ELL positions, the district would have greater resources available for instruction. Additionally, the district could use these freed-up resources to invest in the differentiated ELL staffing ratios recommended above.
o Reduce “trigger point” for Varying Exceptionalities program. The district could reduce the trigger point to .25 to be more in line with other districts, which would mean those same students would get another teacher when their number rose above 22.5, leading to much more manageable and appropriate class sizes and student loads for teachers.
3. Clearly Define What Makes Working in SDPBC Unique,
Compelling, and Sustainable for Great Teachers
Research consistently shows that having an effective teacher is the most important driver of student achievement. Given this, it is crucial for SDPBC to make the district a destination for great teachers to come and stay.
Like many districts, SDPBC faces a shrinking hiring pool and struggles with recruiting and retaining effective teachers. The number of applicants applying to teach in the district has been decreasing, from 28 applicants
FROM: Generalized value proposition without clear career pathways for teachers, inconsistency in assignment processes for stipended leadership opportunities, and an undifferentiated teacher evaluation system.
TO: Specific vision for district’s compelling value to teachers, which could include clear career pathways for teachers with opportunities for additional compensation and leadership roles, tied to a strong and differentiated teacher evaluation system.
13
per position to 24 applicants per position over the last three years. Moreover, once they are in the building, long-term career options are traditional – teachers can stay in the classroom or move into school and ultimately district administration.
Additionally, current evaluation practices do not produce differentiated evaluation results, which can make it challenging for school leaders to objectively identify the most effective teachers and put them in positions to extend and deepen their impact on students. Today, only 30% of SDPBC principals believe that the current teacher evaluation system is accurate.
SDPBC has prioritized hiring and recruitment in its strategic plan, including Phase 1 initiatives to improve the quality and diversity of candidates, improve rigor and selection in the hiring process and develop a streamlined and more user-friendly application process. To further support these efforts, SDPBC should focus on moving the hiring timeline earlier in the year. Currently, 60% of new teachers are hired during the summer months, while less than half of principals believe that the district’s hiring timeline allows them to attract top talent to their schools – a challenge backed by research indicating systems that hire late lose many applicants, including those with higher GPAs and relevant degrees.
Getting more effective teachers in the door is a critical step. However, SDPBC must also make the district a compelling place to stay. The number of teachers leaving the district, excluding retirees, has been increased from 6.8% in SY11-12 to 8.6% in SY14-15.
Moreover, at 15.8%, SDPBC’s attrition rate for novice teachers (those with 0-2 years of experience) is higher than for any other group of teachers, and six points higher than the district average annual attrition rate of 9.8%.
14
Movement of teachers, both those leaving the district and those moving to another school within the district, disproportionately affects lower-performing schools. During the 14-15 school year, 45% of teachers in the lowest-performing schools had been in the school since at least 2012, compared to 69% of teachers in the highest-performing schools. Not only do these lower-performing schools have less stable teaching forces, but their teaching force also becomes more junior than other schools as the district fills vacant positions with new or novice teachers – who are less likely to be highly effective and who turn over faster than their more experienced peers.
District data indicate that teacher leader roles can be a powerful mechanism for effective teachers to extend
15
their reach, advance in their careers, and earn more money. SDPBC teachers with leadership roles are 30% more likely to stay in the district, but the district invests only 43% of district-controlled stipend dollars on high-impact teacher leadership roles – and 22% of these stipended leadership roles are filled by the least effective teachers, with another 23% filled by teachers in the second-lowest effectiveness quartile.
To ensure the most-effective teachers choose to come to and stay in SDPBC, the district should focus on strategies which will improve the short-term and long-term value proposition for teachers:
• Move up the hiring timeline, to bring in more teachers by May. This could be accomplished by requiring earlier notification for vacancies, adjusting teacher union transfer requirements, and/or adjusting planning and budgeting timelines.
• Expand support for novice teachers, who are among the most likely to leave the district (including the most-effective novices). To do this, SDPBC could implement a New Teacher Induction program that pairs new teachers with mentor teachers, focuses on regular feedback and observations, and reduces teacher loads for novice teachers.
• Create opportunities for the best teachers to earn more and extend their impact. SDPBC plans to reform teacher compensation during Phase 3; however, there are critical things that SDPBC could be doing now to make the career pathways and compensation system more attractive to teachers, which can also have a direct impact on early career teachers who are currently more likely to leave the district. SDPBC could invest more in high-impact teacher leadership roles, e.g. those connected to fostering collaboration and positions created to enable strategic school designs, while ensuring current dollars going to roles are maximized by providing guidance/support on what the roles should look like and who should qualify for them.
• Build strong collaborative structures within schools. As noted above, strong collaborative planning time is a critical piece of strategic school design. For SDPBC, effectively linking teacher leader roles—in this case as CPT facilitators—to the evaluation system can create a compelling career pathway for the most effective teachers that will not only extend their impact on other teachers, but also increase their retention within their schools and within the district, particularly when combined with meaningful professional learning that will set these teacher leaders up for success in this role.
• Support principals, particularly novice principals, to be strategic developers and managers of talent. SDPBC principals face a unique challenge; they are relatively novice compared with other districts and manage a more senior working force. Moreover, novice principals are disproportionately found in low-performing elementary schools. Within the context of restructured Area Offices and school support, SDPBC should ensure that principals receive the support and PD they need to be effective human capital managers. Support could focus on evaluating with fidelity, shaping career pathways and roles, identifying and leveraging top talent, and managing out bottom performers.
• Reform teacher evaluation processes. Reliable evaluation data is foundational to human capital strategies, such as providing need-based professional development, creating career pathways for highly effective teachers, and identifying and managing out the least effective. As SDPBC is already working toward reformed evaluation practices, including by renegotiating observation cut points, principals in the district should ensure the revamped process includes training and development of principals around observing with fidelity and using evaluation tool as a coaching and teacher development tool
16
Conclusion SDPBC is in an excellent position to make strategic shifts to its resource allocations that can enable new, high-potential instructional structures practices and ultimately help drive improvements in student performance. The district’s strategic plan lays out the direction for prioritized initiatives and outcomes over the next five years and is well-aligned with ERS’ resource recommendations. Additionally, the district has already begun to make resource shifts throughout departments—from reorganizing the principal supervision structure to rethinking the SLP allocation formula. The next step for the district is to move to a broader way of conceiving resource priorities and allocations to be able to most effectively address its challenges, meet the needs of students and staff, and begin to make progress on the achievement outcomes outlined in the strategic plan.
17
Summary of Recommendations
Targeted Improvement Area Recommended Actions Associated Change in
Resource Use
Improve resource use and organization in lowest-performing schools and for lowest-performing students in all schools
Support school leaders in creating strategic school designs that will direct resources based on students’ needs and performance.
Cost neutral3
Build strong collaborative planning structures within schools. Cost neutral4
Use data to assist schools in identifying and supporting highest-need students. Investment $0-$4M5
Prioritize attracting and developing effective talent in high-needs schools.
Investment $3M-$6M6
Ensure additional resources are provided to single-D schools as well as Turnaround schools.
Investment $9M-$12M7
Implement major shifts in how resources are allocated to educate English Language Learners and special education students
Reduce non-instructional ELL positions to peer district median. Savings $6-8M
Increase the number of teachers allocated for ELL students by increasing ES allocation ratio to 40:1. Investment $6-8M
Differentiate ELL staffing ratios by English proficiency and ESOL instructional time. Cost neutral8
Differentiate special education staffing ratios by model of service rather than program type. Cost neutral5
Reduce “trigger point” to .25 for Varying Exceptionalities program. Investment $5M-$8M9
3 Estimate based on utilizing time already built in for principals and instructional or Regional Superintendents; doesn’t include cost of any technical assistance required to build new school designs and support school leaders. 4 Estimate assumes use of existing teacher stipends for teacher leaders who facilitate CPT. This strategy also requires the district to reallocate existing PD time and restructure for this purpose. 5 Estimate based on ERS research and dependent on extensiveness of new data reports; the district could reduce costs by utilizing existing data systems and focusing on quality of reports and associated supports. 6 Estimate based on ERS research and dependent on specific strategies used to improve talent recruitment in high-needs schools, e.g., increasing salaries for teachers and/or leaders, increasing coaching staff, etc. 7 Range based on scope of increased funding. The district could fund only elementary single-D schools at rate of Turnaround schools, including only instructional and coaching resources, for $9M; funding all elementary and secondary single-D schools at the Turnaround rate and including all resources would cost $12M. 8 Estimate assumes investments resulting from increased staffing ratios would be balanced by savings from some decreased staffing ratios, depending on program type and/or service model. 9 Range based on student groups included. The district could reduce trigger point to for all VE students for $8M, or could exclude “consult only” students for a cost of $5M.
18
Targeted Improvement Area Recommended Actions Associated Change in
Resource Use
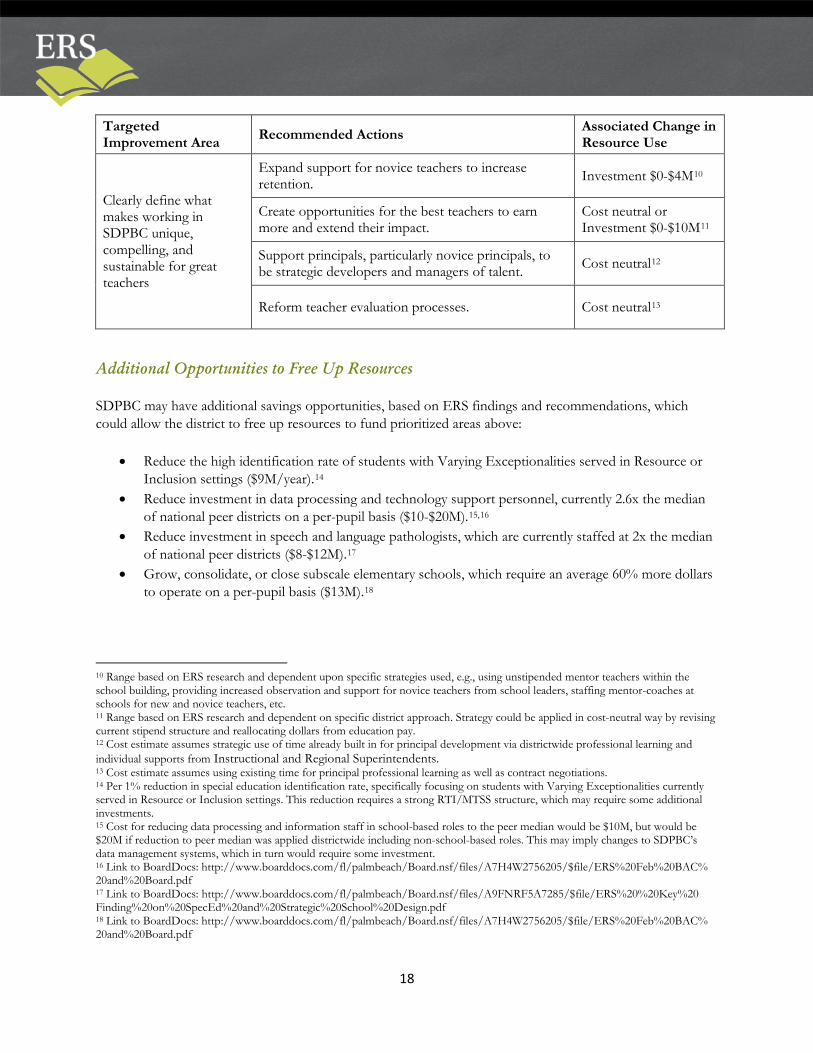
Clearly define what makes working in SDPBC unique, compelling, and sustainable for great teachers
Expand support for novice teachers to increase retention. Investment $0-$4M10
Create opportunities for the best teachers to earn more and extend their impact.
Cost neutral or Investment $0-$10M11
Support principals, particularly novice principals, to be strategic developers and managers of talent. Cost neutral12
Additional Opportunities to Free Up Resources SDPBC may have additional savings opportunities, based on ERS findings and recommendations, which could allow the district to free up resources to fund prioritized areas above:
• Reduce the high identification rate of students with Varying Exceptionalities served in Resource or Inclusion settings ($9M/year).14
• Reduce investment in data processing and technology support personnel, currently 2.6x the median of national peer districts on a per-pupil basis ($10-$20M).15,16
• Reduce investment in speech and language pathologists, which are currently staffed at 2x the median of national peer districts ($8-$12M).17
• Grow, consolidate, or close subscale elementary schools, which require an average 60% more dollars to operate on a per-pupil basis ($13M).18
10 Range based on ERS research and dependent upon specific strategies used, e.g., using unstipended mentor teachers within the school building, providing increased observation and support for novice teachers from school leaders, staffing mentor-coaches at schools for new and novice teachers, etc. 11 Range based on ERS research and dependent on specific district approach. Strategy could be applied in cost-neutral way by revising current stipend structure and reallocating dollars from education pay. 12 Cost estimate assumes strategic use of time already built in for principal development via districtwide professional learning and individual supports from Instructional and Regional Superintendents. 13 Cost estimate assumes using existing time for principal professional learning as well as contract negotiations. 14 Per 1% reduction in special education identification rate, specifically focusing on students with Varying Exceptionalities currently served in Resource or Inclusion settings. This reduction requires a strong RTI/MTSS structure, which may require some additional investments. 15 Cost for reducing data processing and information staff in school-based roles to the peer median would be $10M, but would be $20M if reduction to peer median was applied districtwide including non-school-based roles. This may imply changes to SDPBC’s data management systems, which in turn would require some investment. 16 Link to BoardDocs: http://www.boarddocs.com/fl/palmbeach/Board.nsf/files/A7H4W2756205/$file/ERS%20Feb%20BAC% 20and%20Board.pdf 17 Link to BoardDocs: http://www.boarddocs.com/fl/palmbeach/Board.nsf/files/A9FNRF5A7285/$file/ERS%20%20Key%20 Finding%20on%20SpecEd%20and%20Strategic%20School%20Design.pdf 18 Link to BoardDocs: http://www.boarddocs.com/fl/palmbeach/Board.nsf/files/A7H4W2756205/$file/ERS%20Feb%20BAC% 20and%20Board.pdf