Page 1
© 2011 SunPower Corporation
© 2012 SunPower Corporation
INTRODUCING THE PV – LCOE FRAMEWORK
Zachary Struyk Business Development Director, East Asia
June 6, 2012
CHARTING THE PROGRESS OF PV POWER PLANT ENERGY GENERATING COSTS TO UNSUBSIDIZED LEVELS
Page 2
© 2011 SunPower Corporation
SunPower 2012
2
World-leading solar conversion efficiency >2.5 GW solar PV deployed
More than 200 patents
6,000+ employees
Diversified portfolio: roofs to power plants Strategic investment by Total: #11, F500
Page 3
© 2011 SunPower Corporation 3
Question: Since 2007 how much have module prices decreased?
Page 4
© 2011 SunPower Corporation 4
Question: Since 2007 how much has PV power plant LCOE decreased?
Page 5
© 2011 SunPower Corporation 5
Question: When will PV power plants compete without subsidy?
Page 6
© 2012 SunPower Corporation
Where are we with tracking PV power plant costs today?
6
PV BOS
Page 7
© 2012 SunPower Corporation
Project scope differences make BOS comparisons and cost roadmapping challenging
7
BOS scope from 7 SunPower power plants: BOS cost difference between high and low project > 2x
Project 1 Project 2 Project 3 Project 4 Project 5 Project 6 Project 7Panel PV Panel Yes Yes Yes Yes Yes Yes Yes
Tracker Yes Yes Yes Yes Yes Yes YesDC collection system Yes Yes Yes Yes Yes Yes YesInverter station Yes Yes Yes Yes Yes Yes YesMV collection system Yes Yes Yes Yes Yes Yes YesCivil work ‐ fence, roads, drainage Yes Yes Yes Yes Yes Yes YesSubstation No Customer Yes Customer Customer Yes YesPrevailing wage Yes No No No No Yes YesHilly site No No Yes No No Yes NoO&M building Yes Customer Yes No Customer Yes YesSales tax Yes No No No Yes Yes YesEndangered species No No No No No Yes NoHigh wind conditions No Yes Yes No No No NoSnow conditions No No No Yes No No YesLandscaping for visual mitigation Customer No Yes No No Yes Yes
BOS
Basic plant
Power block
Page 8
© 2012 SunPower Corporation
Where are we with LCOE today?
8
PV BOS LCOE
Different LCOE models across industry Different underlying assumptions complicate comparisons Tax and other regional factors limit global comparability Complexity can make LCOE analysis inaccessible to non-finance
experts A standardized, simplified model is desirable to track industry progress
Page 9
© 2012 SunPower Corporation
Introducing the PV – LCOE Framework
9
PV ‐ LCOE
Capacity Factor
Annual O&M
System Life
PV Plant Cost
Cost of Capital
Annual Degradation
PV ‐ LCOE
Page 10
© 2012 SunPower Corporation
Introducing the PV – LCOE Framework
10
PV ‐ LCOE
Capacity Factor
Annual O&M
System Life
PV Plant Cost
Cost of Capital
System Configuration
Local Climate
Development Costs
PV Basic Plant Cost
Cost Adders
Balance of Basic Plant
PV Power Block
Mounting System
DC Collection
AC Station
Power Block Assembly
PV Panel
Site Civil & Electrical
Commissioning
Project Management & Indirect Costs
Project DesignPermitting
Interconnection
Land
Transaction costs
Technology risk
Weather risk
Off‐take risk
Annual Degradation
PV ‐ LCOE
Page 11
© 2012 SunPower Corporation
High-Level PV Power Plant Cost Categories
11
PV Plant Cost
PV Plant Cost
Development Costs
PV Basic Plant Cost
Cost Adders
Page 12
© 2012 SunPower Corporation
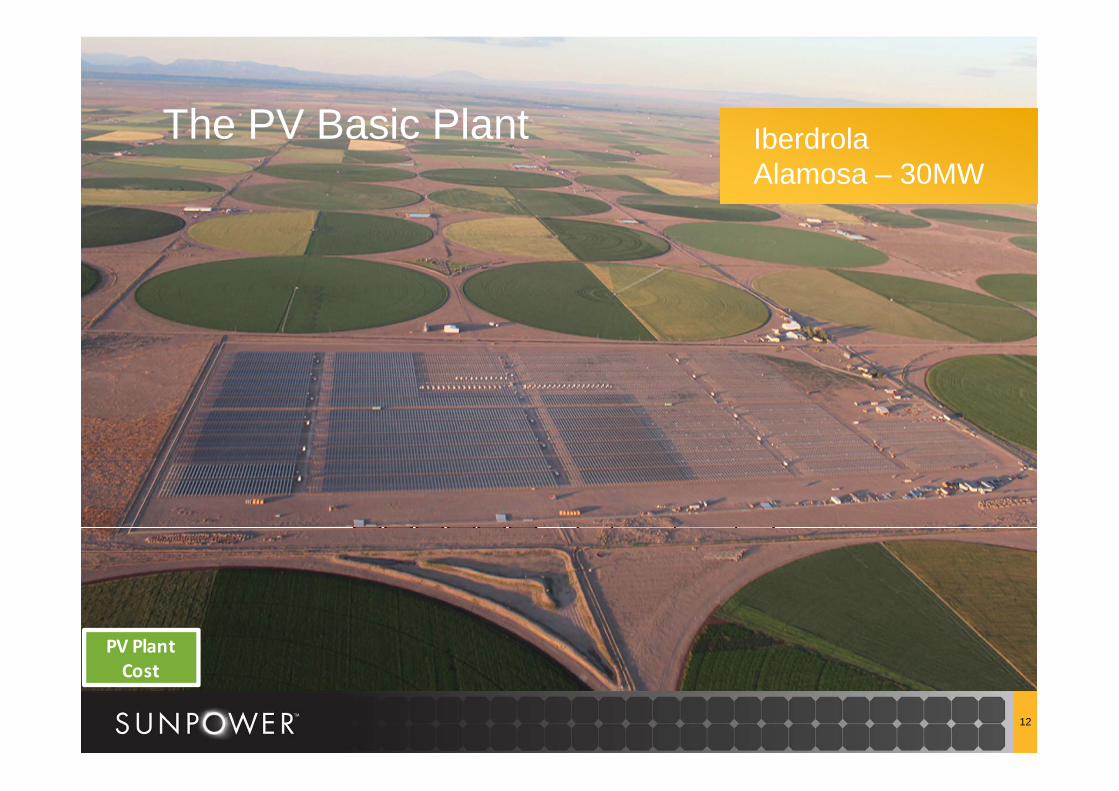
Basic PV Power Plant
12
Balance of Basic Plant
PV Basic Plant
PV Power Blocks
Iberdrola Alamosa – 30MW
The PV Basic Plant
PV Plant Cost
Page 13
© 2012 SunPower Corporation
Basic PV Power Plant
13
Balance of Basic Plant
PV Basic Plant
PV Power Blocks
Iberdrola Alamosa – 30MW
The PV Basic Plant
PV Plant Cost
PV basic plant assumptions: 1) System size of 10-100MW 2) Basic substation for connection to the transmission or distribution system 3) Medium voltage collection system for connection to a substation 4) 40 meters per second wind 5) Non-corrosive environment 6) No special landscaping 7) Flat site (+- 3 degrees) 8) Square site 9) Standard wages 10) No sales or VAT tax on components 11) Light snow conditions
Page 14
© 2012 SunPower Corporation
High-Level PV Power Plant Cost Categories
14
PV Plant Cost
Balance of Basic Plant
PV Basic Plant
PV Power Blocks
Page 15
© 2012 SunPower Corporation
SunPower Oasis 1.5MW PV Power Block
15
PV Plant Cost
Page 16
© 2012 SunPower Corporation
SunPower Oasis 1.5MW PV Power Block
16
PV Plant Cost
Page 17
© 2012 SunPower Corporation
PV Power Block – AC Station
17
SunPower Oasis 1.5MW AC Station PV Plant Cost
Page 18
© 2012 SunPower Corporation
PV Power Block – Mounting System
18
SunPower Oasis - T0 Tracking System PV Plant Cost
Page 19
© 2012 SunPower Corporation
PV Power Block Assembly
19
SunPower Oasis – Power Block Assembly
PV Plant Cost
Page 20
© 2012 SunPower Corporation
Capacity Factor Drivers
20
Major capacity factor drivers: - Panel performance - Tracker or fixed - Local climate - Plant DC / AC ratio AC capacity POI = maximum plant capacity at point of interconnection Plant DC/AC ratio = an arbitrary plant design decision
Capacity Factor
Plant Annual kWh
(Plant kWp AC POI * 8,760)Capacity Factor AC =
Page 21
© 2012 SunPower Corporation
Sample Capacity Factors
Approximate 1-axis horizontal tracker PV power plant capacity factors
21
Capacity Factor
Page 22
© 2012 SunPower Corporation
Discount Rate / Cost of Capital Drivers
22
Off‐take risk
Government FIT Credit rating of the country providing a FIT guarantee
Utility PPA Credit rating of the utility signing the PPA agreement
Merchant plant Market price volatility in a wholesale power market
Performance risk
Weather riskWeather materially differs from that modeled in the plant's performance predictions
Technology risk Technology underperforms relative to predictions
O&M riskOperations and maintenance costs exceed those forecasted in project financial model
Property risk
Damage System damaged by severe storm or seismic eventTheft Theft of system components
Cost of Capital
Page 23
© 2012 SunPower Corporation
Solar Resource Risk
PV power plants generate very
consistent returns similar to
a bond For comparison a California investor
owned utility 30-year bond ~5%
return
23
Predicted power plant output based on measured annual weather data for Southern
California power plant Cost of Capital
Page 24
© 2012 SunPower Corporation
Power Plant System Life
51% of USA generation older than 30 years
24
System Life
Page 25
© 2012 SunPower Corporation
…and 73% of coal power plants are older than 30 years, why can’t PV achieve a similar lifetime?
25
System Life
Page 26
© 2012 SunPower Corporation
The PV-LCOE Equation
26
PV ‐ LCOE
Capacity Factor
Annual O&M
System Life
PV Plant Cost
Cost of Capital
Annual Degradation
PV ‐ LCOE
Page 27
© 2012 SunPower Corporation
The PV-LCOE Equation
27
PV ‐ LCOE
Capacity Factor
Annual O&M
System Life
PV Plant Cost
Cost of Capital
Annual Degradation
30 years 7.5%
PV ‐ LCOE
Page 28
© 2012 SunPower Corporation
The PV-LCOE Equation
28
PV ‐ LCOE
Capacity Factor
Annual O&M
System Life
PV Plant Cost
Cost of Capital
Annual Degradation
30 years 7.5%
PV ‐ LCOE
8.76 * Capacity Factor AC
Capital Cost W AC + Annual O&M W AC0.085 *PV - LCOE =
* (1 - Degradation Rate * 8.4)
Page 29
© 2012 SunPower Corporation
29
PV LCOE Sample Results
DC/AC ratio 1.25 1.25 1.25 1.25 1.25 1.25 1.25 1.25Capital Cost ($/Wdc) 2.60 2.70 2.60 2.70 2.50 2.70 2.15 2.60Capital Cost ($/Wac) 3.25 3.38 3.25 3.38 3.12 3.38 2.69 3.25Yr 1 Capacity Factor 15% 17% 24% 28% 30% 31% 19% 24%O&M/Wac/yr 0.023 0.025 0.023 0.025 0.023 0.025 0.021 0.023Annual Degradation 0.75% 0.75% 0.75% 0.75% 0.75% 0.35% 0.75% 0.75%
PV‐LCOE ($/kWh) 0.226 0.207 0.141 0.126 0.109 0.110 0.148 0.144
Input Variables
Page 30
© 2012 SunPower Corporation
Conclusion
The need for a new cost and LCOE framework has been demonstrated
A new PV-LCOE framework has been presented for organizing inputs to LCOE modeling
A new cost taxonomy has been demonstrated with the concepts of basic power plant, cost adders, and power block introduced
Key performance inputs into the PV-LCOE have been reviewed An equation has been presented to perform simple PV-LCOE
computations Based on the tool, the first PV power plant markets below € 0.10 /
kWh have been demonstrated
30
Page 31
© 2012 SunPower Corporation
Acknowledgements
Based on “CHARTING THE PROGRESS OF PV POWER PLANT ENERGY GENERATING COSTS TO UNSUBSIDIZED LEVELS, INTRODUCING THE PV – LCOE FRAMEWORK” by Matthew Campbell, SunPower Corporation. (including all equations)
White paper available – conference organizers or email me at [email protected]
31
Page 32
© 2011 SunPower Corporation
Page 33
© 2012 SunPower Corporation
PV - sLCOE
33
PV ‐ LCOE
Capacity Factor
Annual O&M
System Life
PV Plant Cost
Cost of Capital
Annual Degradation
30 years 7.5% 1% of plant cost
0.75%
PV ‐ LCOE
Page 34
© 2012 SunPower Corporation
PV - sLCOE
34
PV ‐ LCOE
Capacity Factor
Annual O&M
System Life
PV Plant Cost
Cost of Capital
Annual Degradation
30 years 7.5% 1% of plant cost
0.75%
PV ‐ LCOE
Capacity FactorCapital Cost W AC0.0115 *PV – sLCOE =