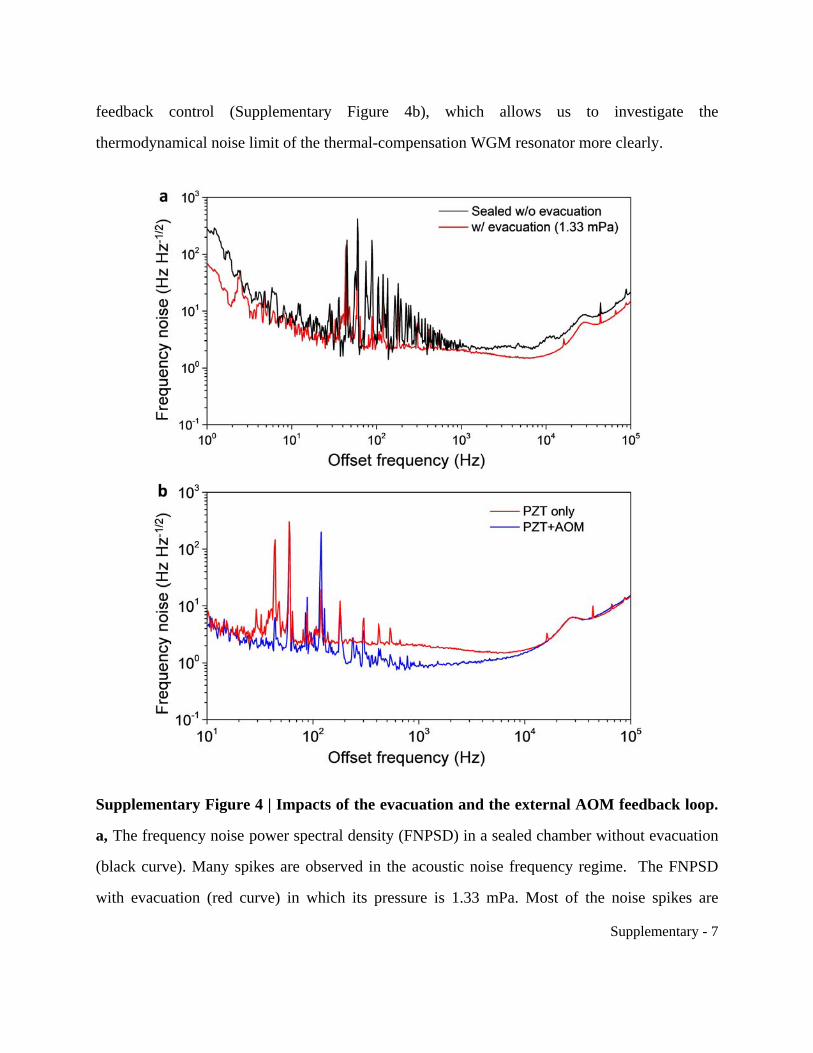
ARTICLE Chasing the thermodynamical noise limit in whispering-gallery-mode resonators for ultrastable laser frequency stabilization Jinkang Lim 1 , Anatoliy A. Savchenkov 2 , Elijah Dale 2 , Wei Liang 2 , Danny Eliyahu 2 , Vladimir Ilchenko 2 , Andrey B. Matsko 2 , Lute Maleki 2 & Chee Wei Wong 1 Ultrastable high-spectral-purity lasers have served as the cornerstone behind optical atomic clocks, quantum measurements, precision optical microwave generation, high-resolution optical spectroscopy, and sensing. Hertz-level lasers stabilized to high-finesse Fabry-Pérot cavities are typically used for these studies, which are large and fragile and remain laboratory instruments. There is a clear demand for rugged miniaturized lasers with stabilities comparable to those of bulk lasers. Over the past decade, ultrahigh-Q optical whispering- gallery-mode resonators have served as a platform for low-noise microlasers but have not yet reached the stabilities defined by their fundamental noise. Here, we show the noise characteristics of whispering-gallery-mode resonators and demonstrate a resonator- stabilized laser at this limit by compensating the intrinsic thermal expansion, allowing a sub-25 Hz linewidth and a 32 Hz Allan deviation. We also reveal the environmental sensitivities of the resonator at the thermodynamical noise limit and long-term frequency drifts governed by random-walk-noise statistics. DOI: 10.1038/s41467-017-00021-9 OPEN 1 Mesoscopic Optics and Quantum Electronics Laboratory, University of California, Los Angeles, CA 90095, USA. 2 OEwaves Inc., 465 North Halstead Street, Suite 140, Pasadena, CA 91107, USA. Correspondence and requests for materials should be addressed to J.L. (email: [email protected]) or to C.W.W. (email: [email protected]) NATURE COMMUNICATIONS | 8: 8 | DOI: 10.1038/s41467-017-00021-9 | www.nature.com/naturecommunications 1
Transcript
ARTICLE
Chasing the thermodynamical noise limit inwhispering-gallery-mode resonators for ultrastablelaser frequency stabilizationJinkang Lim1, Anatoliy A. Savchenkov2, Elijah Dale2, Wei Liang2, Danny Eliyahu2, Vladimir Ilchenko2,
Andrey B. Matsko2, Lute Maleki2 & Chee Wei Wong1
Ultrastable high-spectral-purity lasers have served as the cornerstone behind optical atomic
optical spectroscopy, and sensing. Hertz-level lasers stabilized to high-finesse Fabry-Pérot
cavities are typically used for these studies, which are large and fragile and remain laboratory
instruments. There is a clear demand for rugged miniaturized lasers with stabilities
comparable to those of bulk lasers. Over the past decade, ultrahigh-Q optical whispering-
gallery-mode resonators have served as a platform for low-noise microlasers but have not yet
reached the stabilities defined by their fundamental noise. Here, we show the noise
characteristics of whispering-gallery-mode resonators and demonstrate a resonator-
stabilized laser at this limit by compensating the intrinsic thermal expansion, allowing
a sub-25 Hz linewidth and a 32 Hz Allan deviation. We also reveal the environmental
sensitivities of the resonator at the thermodynamical noise limit and long-term frequency
drifts governed by random-walk-noise statistics.
DOI: 10.1038/s41467-017-00021-9 OPEN
1Mesoscopic Optics and Quantum Electronics Laboratory, University of California, Los Angeles, CA 90095, USA. 2OEwaves Inc., 465 North Halstead Street,Suite 140, Pasadena, CA 91107, USA. Correspondence and requests for materials should be addressed to J.L. (email: [email protected]) or toC.W.W. (email: [email protected])
H igh-precision optical frequency metrology, spectroscopy1, 2,atomic clocks3–5, optical interferometry6, ultralow phasenoise microwave generation7, and light detection and
ranging8 benefit from stable and spectrally pure laser oscillators.Such low-frequency noise oscillators can be achieved by stabi-lizing laser oscillators to a high-quality factor cavity resonance(Q= ν/Δν, where ν is the resonance frequency and Δν is the full-width at half maximum of resonance). When the signal-to-noiseratio (SNR) of the detected laser signal is high enough in themeasurement bandwidth (BW), the frequency stability can also beimproved, which is scaled by (Q × SNRBW)−1. The benchmarkultrahigh-Q resonances in nature are atomic transitions. Theprecise transitions of trapped atoms have been utilized forimproving stability and frequency noise of both microwave andoptical oscillators. For instance, the cesium hyperfine transition isthe core building block of the well-developed microwave atomicclock and the optical transitions of trapped neutral and ionicatoms are used for modern optical atomic clocks. Although alaser with frequency instability of 6 × 10⁻¹⁶ for 2–8 s integrationtime has been demonstrated in a cryostat via spectral-holeburning written in the Eu3+:Y2SiO2 absorption spectrum9,making small atomic traps is demanding such that the develop-ment of solid-state compact optical references is of immenseinterest. Laser oscillators with high-finesse optical Fabry-Pérot(FP) cavities have been demonstrated with sub-Hz linewidths andfractional frequency instabilities at the 10−15 levels in 1–10 sintegration time, which is the noise limit imposed by theunavoidable thermal motion of the cavity’s reflection multilayercoating, by either using ultra-low-expansion material in vacuumor temperature cooling to operate the cavity at the zero thermalexpansion point in a cryostat10–15. However, direct miniaturiza-tion of such FP mirror cavities to a microscale size is challengingdue to the quality of the cavity mirrors such that their applica-tions have largely remained in the laboratory environment.
Over the last decade, ultrahigh-Q whispering-gallery-mode(WGM) resonators16, 17 have been implemented for developinglow-noise microlasers and microclocks18–21, which show thebroad transparent window and ultrahigh-Q resonances withoutsophisticated dielectric mirror coatings and are tolerant tomechanical noise. Since the early studies on the fundamentalthermal fluctuations in microspheres by22, theoretical predictionsindicate that the thermodynamically bounded frequencyinstability of the WGM resonators can be better than 10−13 in 1 sintegration time23, 24 if the proper material and stabilization
technique are selected. However, in spite of the tremendousprogress, the existing WGM resonators still experience largefrequency instabilities and long-term frequency drifts25–28
hindering their use in precision metrology and timingapplications.
Here, we show the noise characteristics of a WGM resonator atthe fundamental thermodynamical noise limit. We employ athermal-compensation design for reducing the thermal sensitivityof a conventional WGM resonator and reveal the residualenvironmental sensitivities of the compensated resonator.Subsequently, we suppress the environmental perturbations usingan evacuated rigid enclosure and demonstrate that a laserstabilized to the thermal-compensation WGM resonator, workingas an optical probe, shows a spectral linewidth of <25 Hz and afractional frequency instability of 1.67 × 10⁻¹³ (5.0 × 10⁻¹²) onthe 191 THz carrier at 0.1 (1) s integration time, which is the bestamong the WGM resonators of the given size and morphologywithout a stringent ambient temperature control. Furthermore,we confirm that the centre-shifted random walk noise statistics,imposed by the correlation between the WGM resonatortemperature change and the ambient temperature or pressurevariation, triggers the long-term frequency instability andmonotonic frequency drift of the laser stabilized to the resonatorat the thermodynamical noise limit.
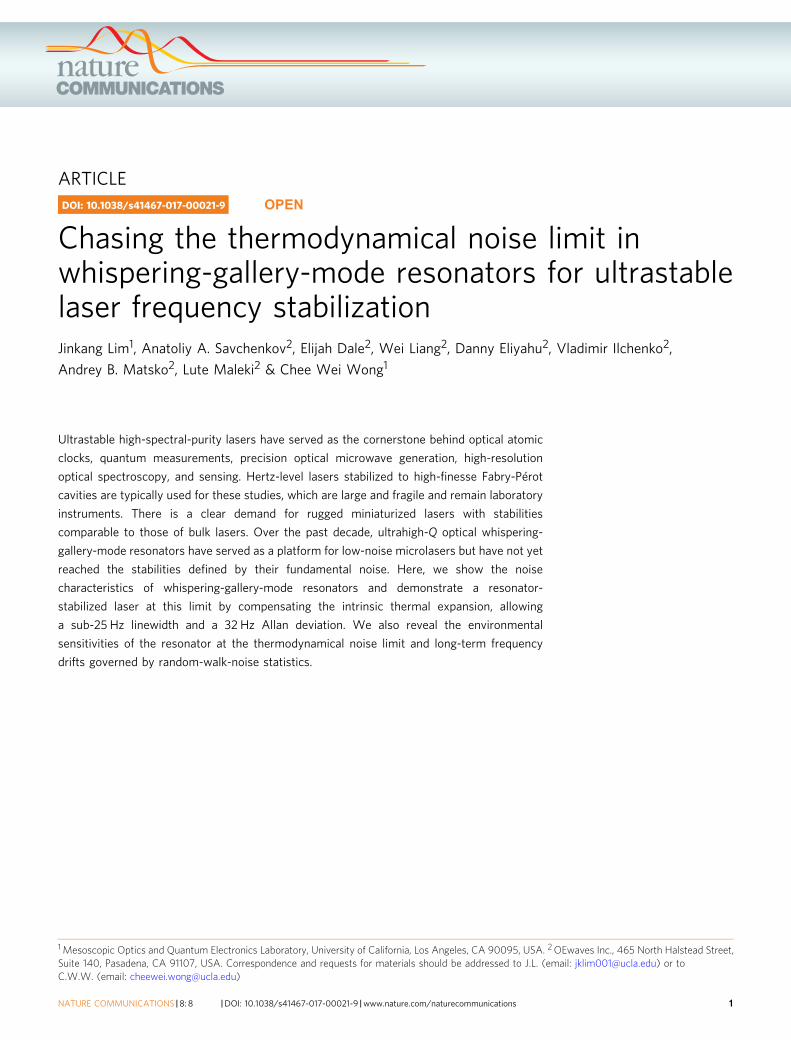
ResultsThermal-compensation ultrahigh-Q WGM resonator. Thethermal-expansion coefficient of the crystalline MgF2 is~9 ppmK−1, that is a large value compared with the conventionalreference FP cavities possessing <0.1 ppmK−1. To reduce thethermal sensitivity causing the thermo-mechanical fluctuations viaexpansion of the resonator length, we compensate the thermalsensitivity of a thin MgF2 WGM resonator. The thermalcompensation, sandwiching a WGM resonator with laminatedZerodur as illustrated in the inset of Fig. 1a, is guided by numericalsimulations and predicts the significant reduction of the thermalsensitivity (Supplementary Note 1 and Supplementary Fig. 1). Thedesign is applied to a MgF2 WGM resonator with a 6.9mm dia-meter and 100 (25) μm resonator (rim) thickness. The thickness ofthe Zerodur layer (up and down) used for the MgF2 WGM reso-nator is 500 μm. To find the degree of thermal compensation, wetake a pair of WGM resonators and mount them on the sametemperature-stabilized platform. While two low-noise continuouswave (cw) lasers are locked to the WGM resonances, respectively,
Fig. 1 Thermal-compensation MgF2 resonator. a Measurement of the frequency shifts for the conventional MgF2 WGM resonator (red) and thermal-compensation WGM resonator (blue), respectively. Inset: The MgF2 resonator (radius: 3.45 mm and thickness: 0.1 mm) sandwiched by Zerodur layers(thickness: 0.5 mm each) in the packaged unit. The MgF2 resonator (middle) is glued in between two Zerodur components (top and bottom). The thicknessof Zerodur layers is determined by the thermo-mechanical properties of the resonator. b Thermorefractive noise limit (blue) and thermal expansion noiselimit (red) of the WGM resonator. The simulations show that the thermal expansion noise of the compensated resonator (solid red line) is lower than thethermorefractive noise near the carrier frequency while the conventional one (dashed red line) is similar. Therefore, the fundamental thermorefractive noisefluctuation can be clearly reached with the compensated resonator in this experiment
the temperature of one of the WGM resonators is slowly changedand the relative frequency shift of the beatnote between the twostabilized lasers is measured. We assume that all slow changes in thebeat frequency are attributed to the thermal expansion of the WGMresonator because the thermorefractive coefficient of crystallineMgF2 is significantly smaller than the thermal expansion coefficient.The measurement in Fig. 1a shows ~7 times improvement com-pared with a conventional MgF2 WGM resonator. Although theenhancement factor is smaller than the value predicted bynumerical simulations, attributed to the residual thermal expansiondue to the imperfection in the device fabrication, the measurementconfirms the validity of our thermal-compensation design. Thecompensated WGM resonator is packaged into a small form factor(40 × 40 × 15mm3) with an integrated thermal sensor and a Peltier-type thermoelectric cooler under the WGM resonator as well as aprism coupler and a photodetector. Laser light is delivered to theprism coupler using a polarization-maintaining single mode fiberwith a firmly mounted output tip. The temperature of the WGMresonator is stabilized at 301.2 K by a proportional-integral-derivative (PID) feedback control using the thermoelectric cooler.We then measure the thermal sensitivity again by measuring thebeat frequency between a cw laser stabilized to the WGM resonatorand a cw laser referenced to the ultrastable FP cavity (Stable LaserSystems) possessing 1 Hz linewidth and 0.1 Hz s−1 drift-rate whilethe set-temperature of the PID control changes, resulting in 3 ppmK−1. From the measured thermal sensitivity, we calculate the noiselimits imposed by the thermo refractive and thermal-expansionsensitivities of the resonator (Supplementary Note 2), which are thetwo dominant thermal noise sources for WGM resonators,as illustrated in Fig. 1b. After the thermal compensation, thethermal-expansion noise limit is lower than the thermorefractivenoise limit near the carrier frequency as shown in Fig. 1b(and Supplementary Fig. 2) such that the thermorefractivenoise-limited fluctuations can be unveiled. The WGM resonator hasthe unloaded resonance BW of 26 kHz and the loaded resonator Qis characterized with 4 μs ring-down time corresponding to 2.4 ×10⁹ at 191 THz carrier (Supplementary Note 2 and SupplementaryFig. 2).
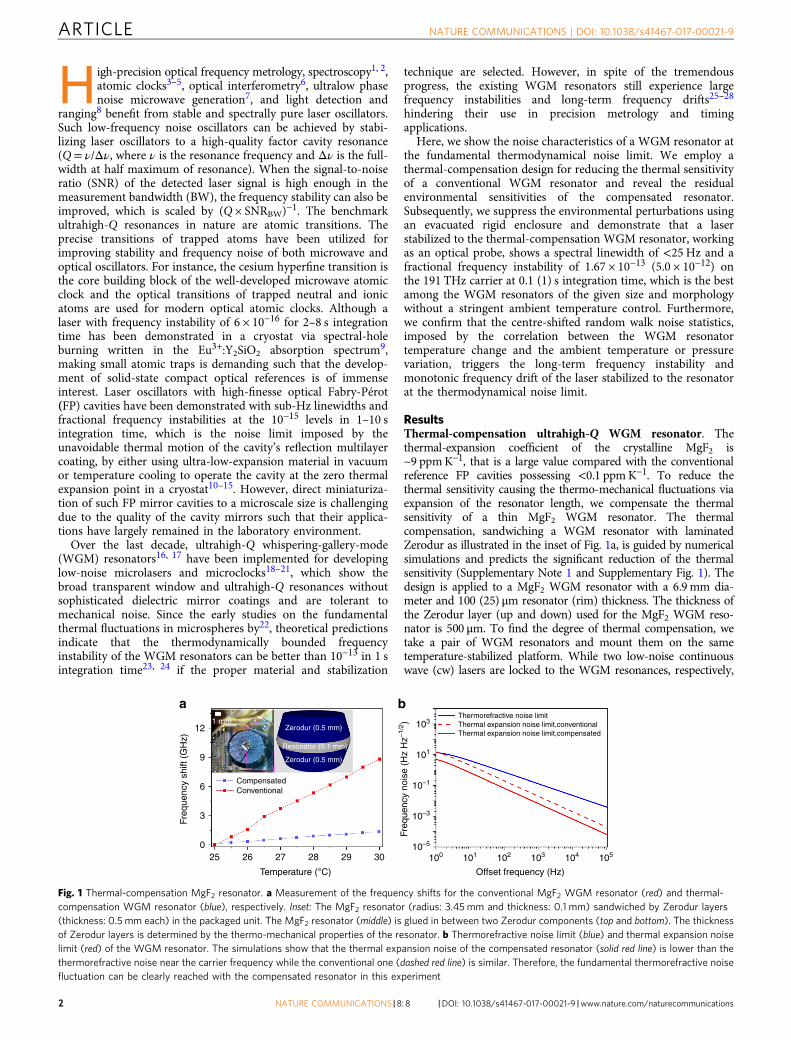
Resonant frequency shift due to ambient perturbations. Themechanism behind the resonant frequency shift of a WGMresonator by the ambient perturbation is the interaction betweenthe evanescent wave of the WGM resonator and the air refractive
index change caused by temperature and pressure variations. Thetemperature and pressure are, in principle, coupled quantitiesconnected by the ideal gas law (PV = nRT) in a rigid box, whereP is the pressure, V is the volume, n is the number of moles, R isthe ideal gas constant, and T is the absolute temperature.Therefore, the ambient temperature stability required forachieving the thermodynamical noise limited fluctuation can bederived from the pressure stability measurement. For this mea-surement we place the thermal-compensation WGM resonator ina rigid vacuum chamber on vibration isolation pads. A 3 kHzlaser operating at 191 THz is stabilized to the compensated WGMresonator using the Pound-Drever-Hall (PDH) lockingtechnique29 that provides sufficient technical noise suppressionand thus enforces the laser frequency to chase the resonance(Methods; Supplementary Note 3 and Supplementary Fig. 3).The resonant frequency shifts induced by pressure changes aremeasured by counting the beat frequency between the stabilizedlaser and the FP reference laser at every second. Figure 2a showsthe laser frequency shift when the pressure slowly increases(ΔP= 45 mPa s−1) in the vacuum chamber from P0= 17 and25 Pa, respectively. At the given pressure P0 and the change (ΔP),we measure 13 (9) kHz with P0= 17 (25) Pa for a transversemagnetic (TM) mode input. Here, we define that the TM mode ofour WGM resonator has the electric field distribution primarily inthe radial direction. We also measure the resonant frequency shiftat the different pressure increment. While the pressure in thevacuum chamber is increased from 17 Pa with ΔP= 130mPa s−1,we measure the frequency shift of 36 kHz (Fig. 2b), which showsapproximately a linear relationship between the frequency shiftand the speed of pressure change. To confirm our measurements,we quantify the impact of the refractive index change of thesurrounding air medium on the WGM resonant frequency shiftfor TM and transverse electric (TE) modes using equationsderived from the first order perturbation theory in ref. 30.
ΔνTMν0
¼ � Δnairðn2TM � 1Þ3=2
λ
2πr; ð1Þ
ΔνTEν0
¼ � Δnairðn2TE � 1Þ3=2
ð2� 1n2TE
Þ λ
2πr; ð2Þ
Δnair ¼ n0jΔP=P0j; ð3Þ
200
150
100
50
0
0 2 4 6 8 10 0 2 4 6 8 10
Time (s) Time (s)
500
400
300
200
100
0
Freq
uenc
y sh
ift (
kHz)
Freq
uenc
y sh
ift (
kHz)
P0 = 17 Pa P0 = 17 Pa, ΔP = 0.13 mPa s–1
P0 = 17 Pa, ΔP = 0.045 mPa s–1P0 = 25 Pa
a b
Fig. 2 Pressure dependence of the WGM resonance frequency shift. a The pressure in the vacuum chamber is slowly increased from 17 Pa (olive) and 25 Pa(red) with 45mPa s−1. The frequency shift is measured by counting the beat frequency at every second while the laser is stabilized to the WGM resonatorby Pound-Drever-Hall locking. To confirm the frequency shift by the pressure change, the theoretically estimated lines from Eq. (1) for TM mode (dashedline) and Eq. (2) for TE mode (dotted line) are plotted together. The measurement values agree with the theoretical model within the 10% error bars agreewith the theoretical model. For comparison, the 10% error zones of the theoretical values are added (gray). b The pressure in the vacuum chamber isincreased from 17 Pa with 45mPa s−1 (olive) and 130mPa s−1 (navy), respectively. The measurements also agree with the theory within the 10% error zoneof the theoretical values
where r is the radius of the WGM resonator, nTE and nTM are therefractive indices of the resonator host material, λ is the wave-length, Δnair is the change of the refractive index of air and n0 isthe residual refractive index of air given by the air itself, that is~ 3 × 10⁻⁴, and therefore, Δnair≈ 7.94 × 10⁻⁷ in these measure-ments. The calculated results from Eq. 1 for P0= 17 (25) Pa areΔνTM= 13.3 (9.1) kHz at ΔP= 45 mPa s−1, which agrees wellwith our measured values of 13 (9) kHz for a TM mode inputas illustrated in Fig. 2a. The theoretical frequency shift fromthermorefractive noise of our WGM resonator is estimated by<(Δωtre)2>=ω2(αnT)2 kB (CVm ρ)−1≈ (2π 46 Hz)2, where αn isthe thermorefractive coefficient, T is the cavity temperature, kB isthe Boltzmann constant, C is the specific heat capacity, Vm is themode volume, and ρ is the density of the host material. The valuesused for the theoretical estimates are given in SupplementaryNote 2. Theoretical estimations and experimental measurementsindicate that the pressure change (ΔP) has to be controlledunder 0.154 mPa to unveil the fundamental thermorefractivenoise limit of the compensated WGM resonator. Using the idealgas law, we calculate the corresponding temperature variationof 2.7 mK, in which n= 3.53 × 10⁻⁶ mole, V= 0.52 L, andR= 0.082 atm Lmol−1 K−1 are used. This measurement showsthat pressure and temperature of the surrounding air have to becontrolled better than those of open atmospheric environmentsto approach the thermodynamical noise limit of the WGMresonator.
The pressure variation not only changes the ambient airrefractive index but could also deform the resonator. Therefore,we consider the resonant frequency shift due to the change in theambient pressure at the given volume of the WGM resonatorleading to a frequency shift by
ΔνTMν0
¼ 13βTΔP; ð4Þ
Where βT= −[(1/V)(δV/δP)]T is the compressibility of theresonator host material (we assume that isothermal and adiabaticcompressibility are approximately equal). The compressibility ofMgF2 is βT= 10−11 Pa−1 and, therefore, the frequency shift due tothe pressure change (ΔP)of 45 mPa is 29 Hz, which is insignif-icant in this measurement.
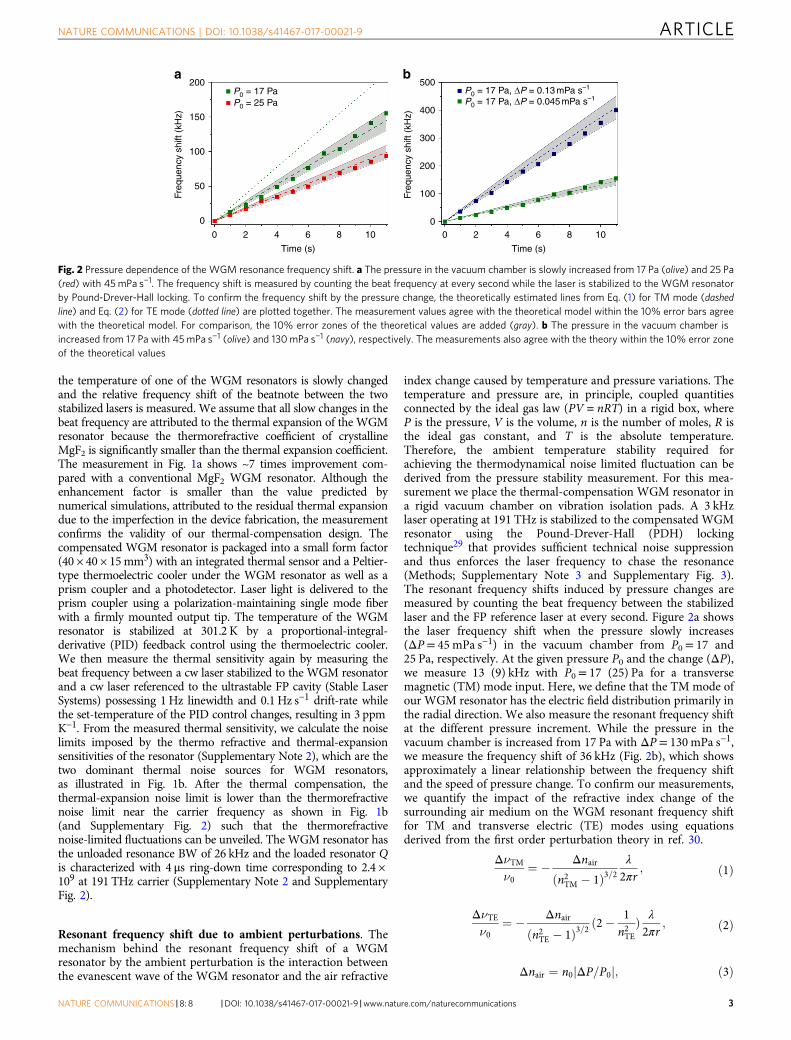
Frequency noise spectrum of the thermal-compensation WGMresonator. To minimize the impact of the technical noise fromour laboratory environment, the vacuum chamber is evacuated tothe pressure of 1.33 mPa but the chamber temperature is notcontrolled (see also Supplementary Fig. 4). Figure 3a shows thecomparative frequency noise power spectral density (FNPSD)curves of the laser stabilized to the thermal-compensation WGMresonator. For comparison, the theoretically estimated thermo-dynamical noise limit of the WGM resonator is also plotted. TheFNPSD of the free-running laser is shown by the black curve andthe noise is substantially suppressed (30 dB at 10 Hz) as shown bythe olive curve when the laser is stabilized to the WGM resonator.Below 30 Hz offset frequency, the stabilized laser FNPSD curvefalls off as f−1.5 implying the thermorefractive noise limit ofmany thermal modes of the WGM resonator predicted by Matskoet al.23 (Supplementary Note 4). From 30 to 100 Hz, the FNPSDcurve falls off with f−1 implying the impact of flicker noise causedby the residual laser noise and electronic device noise. Two strongpeaks originate from 60 Hz harmonics of the electrical power-linenoise. The rising frequency noise above 1 kHz in the olive curve isdue to the poles in the active feedback loops.
The highest spectral purity laser is achieved among the WGMresonators of the given size and morphology via the thermalcompensation. The integral linewidth is evaluated from theFNPSD and turns out to be 119 Hz but when the two 60 Hzharmonic peaks are removed, it is <25 Hz (SupplementaryNote 5). To further support our linewidth estimations, wemeasure the beat signal linewidth (Fig. 3b) in a spectrum analyzerwith a resolution BW of 47 Hz and sweep time of 40 ms over the5 kHz span. Due to the slow frequency drift, the measured lineshape shows the asymmetry in the wings but the peak center isnearly symmetric and can be fitted with a Lorentzian lineshape.The resulting full-width at half-maximum linewidth is approxi-mately 100 Hz, matched with the FNPSD measurement includingthe 60 Hz noise harmonic peaks.
Frequency stability of the thermal-compensationWGM resonator.The resonant frequency instability of the compensated WGMresonator is analyzed by its Allan deviation. We use the FNPSDmeasurements to evaluate Allan deviations below 0.1 s averagingtime because the frequency error of our counter (Agilent
104
103
102
101
100
10–1
10–2
100 101 102 103 104 105 –2,000 –1,000 0 1,000
Frequency (Hz)
Freq
uenc
y no
ise
(Hz
Hz–1
/2)
Inte
nsity
(a.
u.)
Fourier frequency (Hz)
2,000
Free-running laserStabilized laserThemorefractive noise limitThemal-expansion noise limit�-separation line
RBW = 47 Hz
Δν3dB = 100 Hz
a b
Fig. 3 Frequency noise of the thermal-compensation resonator. a The frequency noise power spectral density (FNPSD) measured by the beatfrequency between the laser and the table top Fabry-Pérot (FP) cavity reference laser. The FNPSD of free-running laser used in our experiment (black curve)and of the laser stabilized to the compensated resonator (olive). The thermodynamical FNPSD predictions from thermorefractive (blue) and thermalexpansion noise (red) are also illustrated for comparison. The thermorefractive noise shows f−1.5 frequency dependence (magenta dashed line) predicted byour theoretical model. b The measured linewidth (fullwidth at half maximum) on a spectrum analyzer with 47 Hz resolution bandwidth (RBW) and 40mssweep time over the 5 kHz span, giving a ≈ 100 Hz Lorentzian linewidth fit. The effective linewidth evaluated from the olive curve is 119± 2 Hz and thelinewidth without the 60 and 120 Hz power-line noise is determined to be 25± 0.3 Hz
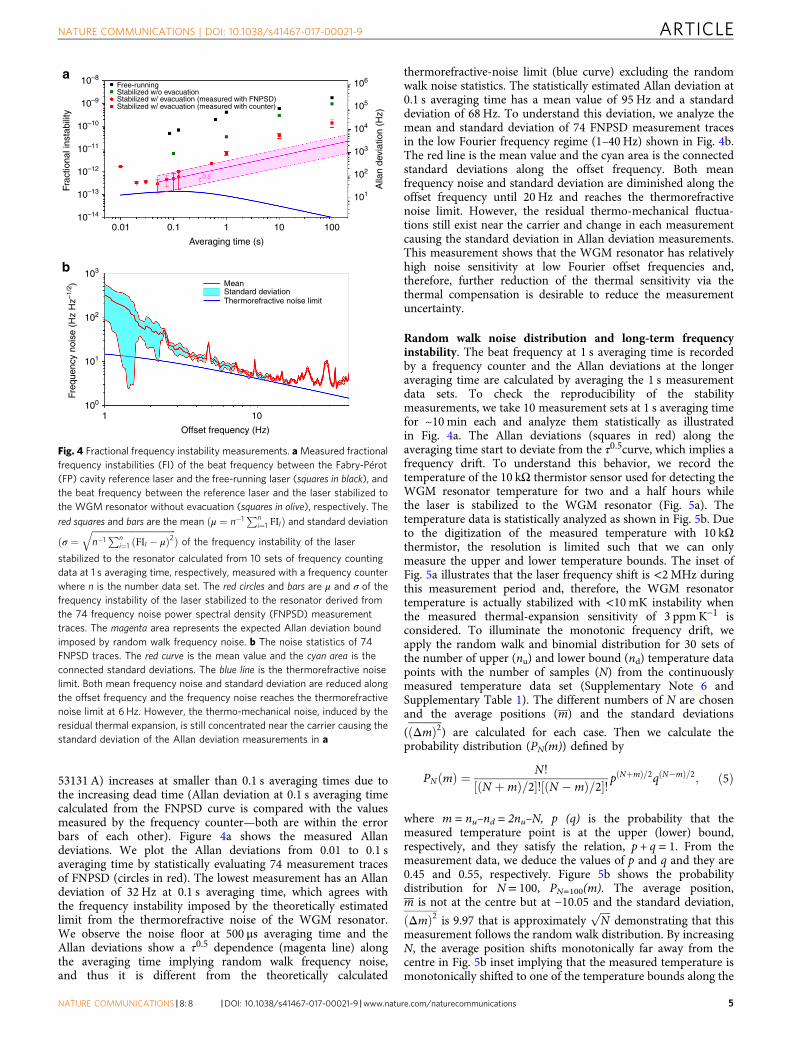
53131 A) increases at smaller than 0.1 s averaging times due tothe increasing dead time (Allan deviation at 0.1 s averaging timecalculated from the FNPSD curve is compared with the valuesmeasured by the frequency counter—both are within the errorbars of each other). Figure 4a shows the measured Allandeviations. We plot the Allan deviations from 0.01 to 0.1 saveraging time by statistically evaluating 74 measurement tracesof FNPSD (circles in red). The lowest measurement has an Allandeviation of 32 Hz at 0.1 s averaging time, which agrees withthe frequency instability imposed by the theoretically estimatedlimit from the thermorefractive noise of the WGM resonator.We observe the noise floor at 500 μs averaging time and theAllan deviations show a τ0.5 dependence (magenta line) alongthe averaging time implying random walk frequency noise,and thus it is different from the theoretically calculated
thermorefractive-noise limit (blue curve) excluding the randomwalk noise statistics. The statistically estimated Allan deviation at0.1 s averaging time has a mean value of 95 Hz and a standarddeviation of 68 Hz. To understand this deviation, we analyze themean and standard deviation of 74 FNPSD measurement tracesin the low Fourier frequency regime (1–40 Hz) shown in Fig. 4b.The red line is the mean value and the cyan area is the connectedstandard deviations along the offset frequency. Both meanfrequency noise and standard deviation are diminished along theoffset frequency until 20 Hz and reaches the thermorefractivenoise limit. However, the residual thermo-mechanical fluctua-tions still exist near the carrier and change in each measurementcausing the standard deviation in Allan deviation measurements.This measurement shows that the WGM resonator has relativelyhigh noise sensitivity at low Fourier offset frequencies and,therefore, further reduction of the thermal sensitivity via thethermal compensation is desirable to reduce the measurementuncertainty.
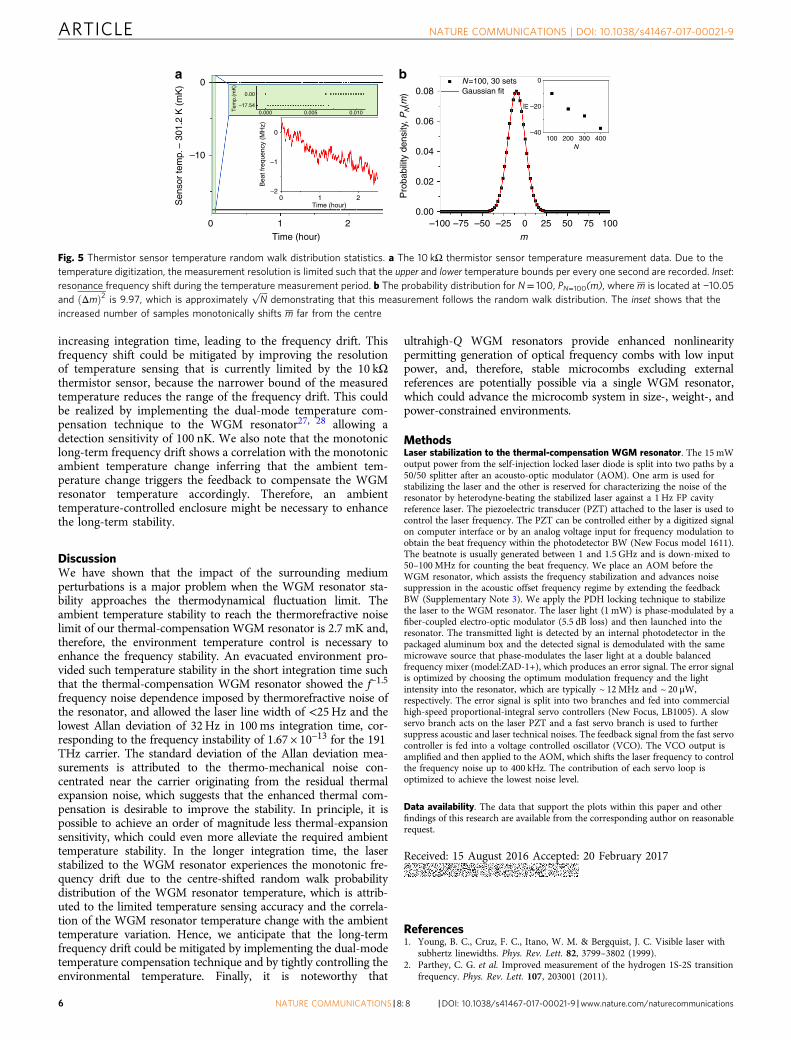
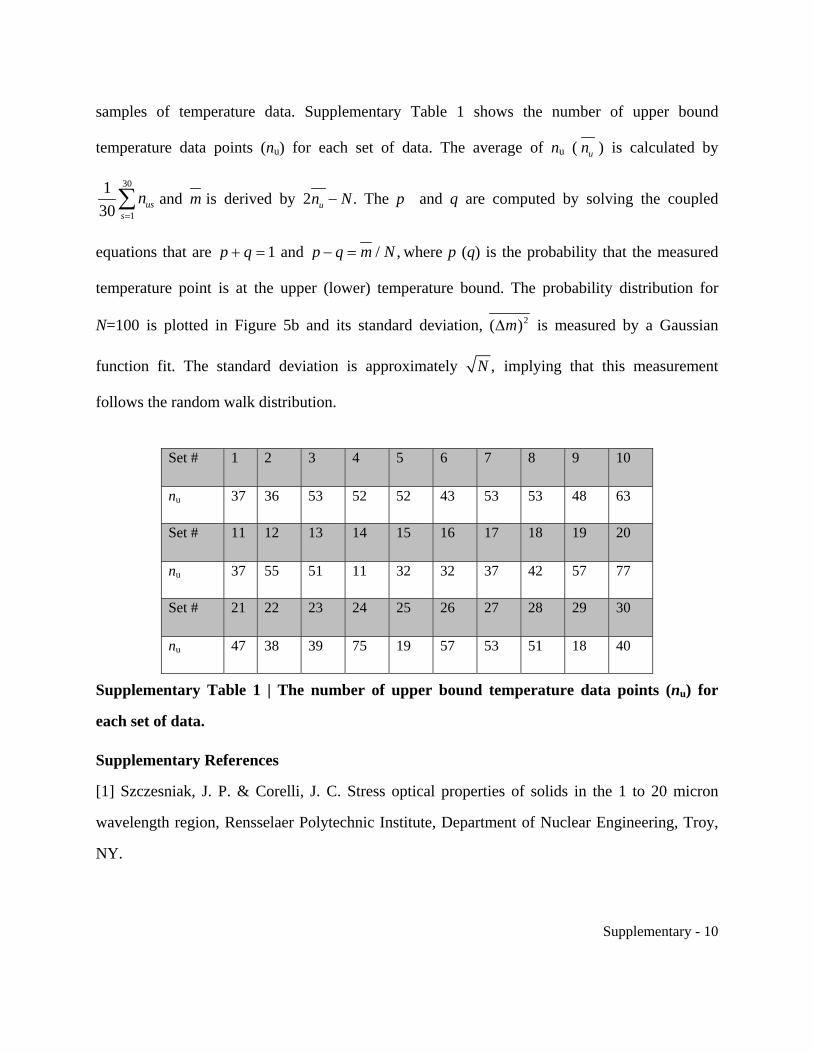
Random walk noise distribution and long-term frequencyinstability. The beat frequency at 1 s averaging time is recordedby a frequency counter and the Allan deviations at the longeraveraging time are calculated by averaging the 1 s measurementdata sets. To check the reproducibility of the stabilitymeasurements, we take 10 measurement sets at 1 s averaging timefor ~10 min each and analyze them statistically as illustratedin Fig. 4a. The Allan deviations (squares in red) along theaveraging time start to deviate from the τ0.5curve, which implies afrequency drift. To understand this behavior, we record thetemperature of the 10 kΩ thermistor sensor used for detecting theWGM resonator temperature for two and a half hours whilethe laser is stabilized to the WGM resonator (Fig. 5a). Thetemperature data is statistically analyzed as shown in Fig. 5b. Dueto the digitization of the measured temperature with 10 kΩthermistor, the resolution is limited such that we can onlymeasure the upper and lower temperature bounds. The inset ofFig. 5a illustrates that the laser frequency shift is <2MHz duringthis measurement period and, therefore, the WGM resonatortemperature is actually stabilized with <10 mK instability whenthe measured thermal-expansion sensitivity of 3 ppm K−1 isconsidered. To illuminate the monotonic frequency drift, weapply the random walk and binomial distribution for 30 sets ofthe number of upper (nu) and lower bound (nd) temperature datapoints with the number of samples (N) from the continuouslymeasured temperature data set (Supplementary Note 6 andSupplementary Table 1). The different numbers of N are chosenand the average positions (m) and the standard deviations
(ðΔmÞ2) are calculated for each case. Then we calculate theprobability distribution (PN(m)) defined by
PNðmÞ ¼ N!
½ðN þmÞ=2�!½ðN �mÞ=2�! pðNþmÞ=2qðN�mÞ=2; ð5Þ
where m= nu–nd= 2nu–N, p (q) is the probability that themeasured temperature point is at the upper (lower) bound,respectively, and they satisfy the relation, p + q= 1. From themeasurement data, we deduce the values of p and q and they are0.45 and 0.55, respectively. Figure 5b shows the probabilitydistribution for N= 100, PN=100(m). The average position,m is not at the centre but at −10.05 and the standard deviation,
ðΔmÞ2 is 9.97 that is approximatelyffiffiffiffi
Np
demonstrating that thismeasurement follows the random walk distribution. By increasingN, the average position shifts monotonically far away from thecentre in Fig. 5b inset implying that the measured temperature ismonotonically shifted to one of the temperature bounds along the
10–8Free-runningStabilized w/o evacuationStabilized w/ evacuation (measured with FNPSD)Stabilized w/ evacuation (measured with counter)10–9
Fig. 4 Fractional frequency instability measurements. aMeasured fractionalfrequency instabilities (FI) of the beat frequency between the Fabry-Pérot(FP) cavity reference laser and the free-running laser (squares in black), andthe beat frequency between the reference laser and the laser stabilized tothe WGM resonator without evacuation (squares in olive), respectively. The
stabilized to the resonator calculated from 10 sets of frequency countingdata at 1 s averaging time, respectively, measured with a frequency counterwhere n is the number data set. The red circles and bars are μ and σ of thefrequency instability of the laser stabilized to the resonator derived fromthe 74 frequency noise power spectral density (FNPSD) measurementtraces. The magenta area represents the expected Allan deviation boundimposed by random walk frequency noise. b The noise statistics of 74FNPSD traces. The red curve is the mean value and the cyan area is theconnected standard deviations. The blue line is the thermorefractive noiselimit. Both mean frequency noise and standard deviation are reduced alongthe offset frequency and the frequency noise reaches the thermorefractivenoise limit at 6 Hz. However, the thermo-mechanical noise, induced by theresidual thermal expansion, is still concentrated near the carrier causing thestandard deviation of the Allan deviation measurements in a
increasing integration time, leading to the frequency drift. Thisfrequency shift could be mitigated by improving the resolutionof temperature sensing that is currently limited by the 10 kΩthermistor sensor, because the narrower bound of the measuredtemperature reduces the range of the frequency drift. This couldbe realized by implementing the dual-mode temperature com-pensation technique to the WGM resonator27, 28 allowing adetection sensitivity of 100 nK. We also note that the monotoniclong-term frequency drift shows a correlation with the monotonicambient temperature change inferring that the ambient tem-perature change triggers the feedback to compensate the WGMresonator temperature accordingly. Therefore, an ambienttemperature-controlled enclosure might be necessary to enhancethe long-term stability.
DiscussionWe have shown that the impact of the surrounding mediumperturbations is a major problem when the WGM resonator sta-bility approaches the thermodynamical fluctuation limit. Theambient temperature stability to reach the thermorefractive noiselimit of our thermal-compensation WGM resonator is 2.7 mK and,therefore, the environment temperature control is necessary toenhance the frequency stability. An evacuated environment pro-vided such temperature stability in the short integration time suchthat the thermal-compensation WGM resonator showed the f−1.5
frequency noise dependence imposed by thermorefractive noise ofthe resonator, and allowed the laser line width of <25Hz and thelowest Allan deviation of 32Hz in 100ms integration time, cor-responding to the frequency instability of 1.67 × 10⁻¹³ for the 191THz carrier. The standard deviation of the Allan deviation mea-surements is attributed to the thermo-mechanical noise con-centrated near the carrier originating from the residual thermalexpansion noise, which suggests that the enhanced thermal com-pensation is desirable to improve the stability. In principle, it ispossible to achieve an order of magnitude less thermal-expansionsensitivity, which could even more alleviate the required ambienttemperature stability. In the longer integration time, the laserstabilized to the WGM resonator experiences the monotonic fre-quency drift due to the centre-shifted random walk probabilitydistribution of the WGM resonator temperature, which is attrib-uted to the limited temperature sensing accuracy and the correla-tion of the WGM resonator temperature change with the ambienttemperature variation. Hence, we anticipate that the long-termfrequency drift could be mitigated by implementing the dual-modetemperature compensation technique and by tightly controlling theenvironmental temperature. Finally, it is noteworthy that
ultrahigh-Q WGM resonators provide enhanced nonlinearitypermitting generation of optical frequency combs with low inputpower, and, therefore, stable microcombs excluding externalreferences are potentially possible via a single WGM resonator,which could advance the microcomb system in size-, weight-, andpower-constrained environments.
MethodsLaser stabilization to the thermal-compensation WGM resonator. The 15 mWoutput power from the self-injection locked laser diode is split into two paths by a50/50 splitter after an acousto-optic modulator (AOM). One arm is used forstabilizing the laser and the other is reserved for characterizing the noise of theresonator by heterodyne-beating the stabilized laser against a 1 Hz FP cavityreference laser. The piezoelectric transducer (PZT) attached to the laser is used tocontrol the laser frequency. The PZT can be controlled either by a digitized signalon computer interface or by an analog voltage input for frequency modulation toobtain the beat frequency within the photodetector BW (New Focus model 1611).The beatnote is usually generated between 1 and 1.5 GHz and is down-mixed to50–100MHz for counting the beat frequency. We place an AOM before theWGM resonator, which assists the frequency stabilization and advances noisesuppression in the acoustic offset frequency regime by extending the feedbackBW (Supplementary Note 3). We apply the PDH locking technique to stabilizethe laser to the WGM resonator. The laser light (1 mW) is phase-modulated by afiber-coupled electro-optic modulator (5.5 dB loss) and then launched into theresonator. The transmitted light is detected by an internal photodetector in thepackaged aluminum box and the detected signal is demodulated with the samemicrowave source that phase-modulates the laser light at a double balancedfrequency mixer (model:ZAD-1+), which produces an error signal. The error signalis optimized by choosing the optimum modulation frequency and the lightintensity into the resonator, which are typically ~ 12MHz and ~ 20 μW,respectively. The error signal is split into two branches and fed into commercialhigh-speed proportional-integral servo controllers (New Focus, LB1005). A slowservo branch acts on the laser PZT and a fast servo branch is used to furthersuppress acoustic and laser technical noises. The feedback signal from the fast servocontroller is fed into a voltage controlled oscillator (VCO). The VCO output isamplified and then applied to the AOM, which shifts the laser frequency to controlthe frequency noise up to 400 kHz. The contribution of each servo loop isoptimized to achieve the lowest noise level.
Data availability. The data that support the plots within this paper and otherfindings of this research are available from the corresponding author on reasonablerequest.
Received: 15 August 2016 Accepted: 20 February 2017
References1. Young, B. C., Cruz, F. C., Itano, W. M. & Bergquist, J. C. Visible laser with
subhertz linewidths. Phys. Rev. Lett. 82, 3799–3802 (1999).2. Parthey, C. G. et al. Improved measurement of the hydrogen 1S-2S transition
frequency. Phys. Rev. Lett. 107, 203001 (2011).
0
–10
Sen
sor
tem
p. –
301
.2 K
(m
K)
0 1Time (hour)
2 –100 –75 –50 –25 0m
25 50 75 100
0.08N=100, 30 sets 0
–20
–40100 200 300
N400
Gaussian fit
0.06
0.04
0.02
0.00
Pro
babi
lity
dens
ity, P
N(m
)
m—
0.00
–17.540.000T
emp.
(mK
)
0.005 0.010
0
–1
–2
Bea
t fre
quen
cy (
MH
z)
0 1Time (hour)
2
a b
Fig. 5 Thermistor sensor temperature random walk distribution statistics. a The 10 kΩ thermistor sensor temperature measurement data. Due to thetemperature digitization, the measurement resolution is limited such that the upper and lower temperature bounds per every one second are recorded. Inset:resonance frequency shift during the temperature measurement period. b The probability distribution for N= 100, PN=100(m), where m is located at −10.05and ðΔmÞ2 is 9.97, which is approximately
ffiffiffiffi
Np
demonstrating that this measurement follows the random walk distribution. The inset shows that theincreased number of samples monotonically shifts m far from the centre
3. Takamoto, M., Hong, F.-L., Higashi, R. & Katori, H. An optical lattice clock.Nature 435, 321–324 (2005).
4. Hollberg, L. et al. Optical frequency/wavelength reference. J. Phys. B: At. Mol.Opt. Phys. 38, S469–S495 (2005).
5. Nicholson, T. L. et al. Comparison of two independent Sr optical clocks with1×10−17 stability at 103s. Phys. Rev. Lett. 109, 230801 (2012).
6. Abbott, B. P. et al. LIGO: the laser interferometer gravitational-waveobservatory. Rep. Prog. Phys. 72, 076901 (2009).
7. Fortier, T. M. et al. Generation of ultrastable microwaves via optical frequencydivision. Nat. Photon. 5, 425–429 (2011).
8. Coddington, I., Swann, W. C., Nenadovic, L. & Newbury, N. R. Rapid andprecise absolute distance measurements at long range. Nat. Photon. 3, 351–356(2009).
9. Thorpe, M. J., Rippe, L., Fortier, T. M., Kirchner, M. S. & Rosenband, T.Frequency stabilization to 6×10⁻¹⁶ via spectral-hole burning. Nat. Photon. 5,688–693 (2011).
10. Notcutt, M., Ma, L. S., Ye, J. & Hall, J. L. Simple and compact 1-Hz laser systemvia an improved mounting configuration of a reference cavity. Opt. Lett. 30,1815–1817 (2005).
11. Kessler, T. et al. A sub-40-mHz-linewidth laser based on a silicon single-crystaloptical cavity. Nat. Photon. 6, 687–692 (2012).
12. Numata, K., Kemery, A. & Camp, J. Thermal-noise limit in the frequencystabilization of lasers with rigid cavities. Phys. Rev. Lett. 93, 250602 (2004).
13. Cole, G. D., Zhang, W., Martin, M. J., Ye, J. & Aspelmeyer, M. Tenfoldreduction of Brownian noise in high reflectivity optical coating. Nat. Photon. 7,644–650 (2013).
14. Alnis, J., Matveev, A., Kolachevsky, N., Udem, Th & Hänsch, T. W. Subhertzlinewidth diode lasers by stabilization to vibrationally and thermally compensatedultralow-expansion glass Fabry-Pérot cavities. Phys. Rev. A 77, 053809 (2008).
15. Fox., R. W. Temperature analysis of low-expansion Fabry-Perot cavities. Opt.Express 17, 15023–15031 (2009).
16. Armani, D. K., Kippenberg, T. J., Spillane, S. M. & Vahala, K. J. Ultra-high-Qtoroid microcavity on a chip. Nature 421, 925–928 (2003).
17. Grudinin, I. S. et al. Ultrahigh Q crystalline microcavities. Opt. Commun. 265,33–38 (2006).
18. Vassiliev, V. V. et al. Narrow-line-width diode laser with a high-Qmicroresonator. Opt. Commun. 158, 305–312 (1998).
19. Liang, W. et al. Ultralow noise miniature external cavity semiconductor laser.Nat. Commun. 6, 2468 (2015).
20. Savchenkov, A. A. et al. Stabilization of a Kerr comb oscillator. Opt. Lett. 38,2636–2639 (2013).
21. Papp, S. B. et al. Microresonator frequency comb optical clock. Optica 1, 10–14(2014).
22. Gorodetsky, M. L. & Grudinin, I. S. Fundamental thermal fluctuations inmicrospheres. J. Opt. Soc. Am. B. 21, 697–705 (2004).
23. Matsko, A. B., Savchenkov, A. A., Yu, N. & Maleki, L. Whispering-gallery-moderesonators as frequency references. I. Fundamental limitations. J. Opt. Soc. Am.B. 24, 1324–1335 (2007).
24. Savchenkov, A. A., Matsko, A. B., Ilchenko, V. S., Yu, N. & Maleki, L.Whispering-gallery-mode resonators as frequency references. II. Stabilization.J. Opt. Soc. Am. B. 24, 2988–2997 (2007).
25. Alnis, J. et al. Thermal-noise-limited crystalline whispering-gallery-moderesonator for laser stabilization. Phys. Rev. A. 84, 011804 (2011).
26. Lee, H. et al. Spiral resonators for on-chip laser frequency stabilization.Nat. Commun. 4, 2468 (2013).
27. Strekalov, D. V., Thompson, R. J., Baumgartel, Grudinin, I. S. & Yu, N.Temperature measurement and stabilization in a birefringent whisperinggallery mode resonator. Opt. Express 19, 14495–14501 (2011).
28. Fescenko, I. et al. Dual mode temperature compensation technique for laserstabilization to a crystalline whispering gallery mode resonator. Opt. Express 20,19185–19193 (2012).
29. Drever, R. et al. Laser phase and frequency stabilization using an opticalresonator. Appl. Phys. B. 31, 97–1065 (1983).
30. Teraoka, I. & Arnold, S. Perturbation approach to resonance shifts ofwhispering-gallery modes in a dielectric microsphere as a probe of asurrounding medium. J. Opt. Soc. Am. B. 20, 1937–1945 (2003).
AcknowledgementsWe acknowledge discussions with Shu-Wei Huang, Zhenda Xie, and Tanya Zelevinsky,along with assistance from Parastou Mortazavian. Funding support is provided by AirForce Research Laboratory under contract FA9453-14-M-0090.
Author contributionsJ.L., C.W.W, A.B.M., and L.M. designed the experiment and J.L. performed theexperiment and analyzed the stabilization measurements. A.A.S. designed anddeveloped the thermal-compensation WGM resonator along with the package assembly,E.D. made the self-injection locked laser, W.L. assembled the reference WGM resonator,D.E. measured the WGM resonator thermal sensitivity and designed the laser controlelectronics, and V.I. designed the resonator and laser builds. A.B.M and A.A.S. providedthe theory, and all authors helped in the manuscript preparation.
Additional informationSupplementary Information accompanies this paper at doi:10.1038/s41467-017-00021-9.
Competing interests: The authors declare no competing financial interests.
Reprints and permission information is available online at http://npg.nature.com/reprintsandpermissions/
Publisher's note: Springer Nature remains neutral with regard to jurisdictional claims inpublished maps and institutional affiliations.
This work is licensed under a Creative Commons Attribution 4.0International License. The images or other third party material in this
article are included in the article’s Creative Commons license, unless indicated otherwisein the credit line; if the material is not included under the Creative Commons license,users will need to obtain permission from the license holder to reproduce the material.To view a copy of this license, visit http://creativecommons.org/licenses/by/4.0/


![Whispering Pines [1948]](https://static.documents.pub/doc/80x56/622dd9de07e5ed329f421c2d/whispering-pines-1948.jpg)


