Chelan County Grant No. G0800231 DRAFT SHORELINE INVENTORY and ANALYSIS REPORT for Shorelines in Chelan County and the Cities of Cashmere, Chelan, Entiat, Leavenworth and Wenatchee Project: Comprehensive Shoreline Master Program Update • Task 4: Conduct Shoreline Inventory • Task 5: Conduct Analysis of Shoreline Inventory Prepared for: Chelan County Natural Resources Department 316 Washington Street, Suite 401 Wenatchee, Washington 98801 Prepared by: 710 Second Avenue, Suite 550 Seattle WA 98104 750 Sixth Street South Kirkland WA 98033 This report was funded in part through a grant from the Washington Department of Ecology. March 3, 2009
Transcript
Chelan County Grant No. G0800231
DRAFT
SHORELINE INVENTORY and ANALYSIS REPORT for Shorelines in Chelan County and the Cities of Cashmere, Chelan, Entiat, Leavenworth and Wenatchee
Project: Comprehensive Shoreline Master Program Update • Task 4: Conduct Shoreline Inventory • Task 5: Conduct Analysis of Shoreline Inventory
Prepared for:
Chelan County Natural Resources Department 316 Washington Street, Suite 401 Wenatchee, Washington 98801
Prepared by:
710 Second Avenue, Suite 550 Seattle WA 98104
750 Sixth Street South Kirkland WA 98033
This report was funded in part through a grant from the Washington Department of Ecology.
1.2 Study Area ................................................................................................................ 2 1.3 Shoreline Jurisdiction ............................................................................................... 3 1.4 Chelan County Watersheds ...................................................................................... 7
1.4.1 Geographic Context ................................................................................... 7 1.4.2 Historic Geology, Topography, and Drainage Patterns ............................. 9 1.4.3 Major Land Use Changes and Current Shoreline Condition .................... 11
2. Current Regulatory Framework Summary ............................................................. 15 2.1 Existing Shoreline Master Programs ...................................................................... 15 2.2 Existing Critical Area Regulations .......................................................................... 16 2.3 Chelan County ........................................................................................................ 20 2.4 City of Cashmere .................................................................................................... 27 2.5 City of Chelan ......................................................................................................... 28 2.6 City of Entiat ........................................................................................................... 29 2.7 City of Leavenworth ................................................................................................ 30 2.8 City of Wenatchee .................................................................................................. 32 2.9 State Agencies/Regulations ................................................................................... 33 2.10 Federal Agencies/Regulations ................................................................................ 36
3. Shoreline Inventory ................................................................................................ 39 3.1 Land Use Patterns .................................................................................................. 39
3.1.1 Existing and Planned Land Use ............................................................... 39 3.1.2 Water-Oriented Uses ............................................................................... 41 3.1.3 Developing or Redeveloping Waterfronts ................................................ 44
3.4 Impervious Surfaces ............................................................................................... 58 3.5 Vegetation .............................................................................................................. 62 3.6 Shoreline Modifications .......................................................................................... 65 3.7 Existing and Potential Public Access ...................................................................... 67 3.8 Critical Areas .......................................................................................................... 69
3.8.1 Geologically Hazardous Areas ................................................................ 70 3.8.2 Frequently Flooded Areas ....................................................................... 70 3.8.3 Wetlands .................................................................................................. 70 3.8.4 Fish and Wildlife Habitat Conservation Areas ......................................... 71 3.8.5 Critical Aquifer Recharge Areas .............................................................. 74
3.9 Floodplains and Channel Migration Zones ............................................................. 74 3.9.1 Wenatchee River and Tributaries ............................................................ 76
i
3.9.2 Stehekin River ......................................................................................... 78 3.9.3 Entiat River .............................................................................................. 78
3.10 Historical or Archaeological Sites ........................................................................... 79 3.11 Water Quality .......................................................................................................... 82 3.12 Opportunity Areas ................................................................................................... 86
4.1.1 Land Use Patterns ................................................................................... 90 4.1.2 Existing and Potential Public Access ....................................................... 96 4.1.3 Critical Areas ........................................................................................... 97 4.1.4 Potential Restoration Opportunities ......................................................... 97
4.2 Wenatchee (WRIA 45) ............................................................................................ 98 4.2.1 Land Use Patterns ................................................................................. 110 4.2.2 Existing and Potential Public Access ..................................................... 121 4.2.3 Critical Areas ......................................................................................... 125 4.2.4 Peshastin Urban Growth Area ............................................................... 125 4.2.5 Potential Restoration Opportunities ....................................................... 128
4.3 Entiat (WRIA 46) ................................................................................................... 131 4.3.1 Land Use Patterns ................................................................................. 134 4.3.2 Existing and Potential Public Access ..................................................... 137 4.3.3 Critical Areas ......................................................................................... 138 4.3.4 Potential Restoration Opportunities ....................................................... 139
4.4 Chelan (WRIA 47) ................................................................................................ 142 4.4.1 Land Use Patterns ................................................................................. 149 4.4.2 Existing and Potential Public Access ..................................................... 156 4.4.3 Critical Areas ......................................................................................... 158 4.4.4 Manson Urban Growth Area .................................................................. 159 4.4.4 Potential Restoration Opportunities ....................................................... 161
4.5 City of Cashmere .................................................................................................. 162 4.5.1 Land Use Patterns ................................................................................. 163 4.5.2 Existing and Potential Public Access ..................................................... 166 4.5.3 Critical Areas ......................................................................................... 168 4.5.4 Potential Restoration Opportunities ....................................................... 168
4.6 City of Chelan ....................................................................................................... 170 4.6.1 Land Use Patterns ................................................................................. 171 4.6.2 Existing and Potential Public Access ..................................................... 175 4.6.3 Critical Areas ......................................................................................... 177 4.6.4 Potential Restoration Opportunities ....................................................... 177
4.7 City of Entiat ......................................................................................................... 177 4.7.1 Land Use Patterns ................................................................................. 178 4.7.2 Existing and Potential Public Access ..................................................... 180 4.7.3 Critical Areas ......................................................................................... 181 4.7.4 Potential Restoration Opportunities ....................................................... 181
4.8 City of Leavenworth .............................................................................................. 182 4.8.1 Land Use Patterns ................................................................................. 182 4.8.2 Existing and Potential Public Access ..................................................... 185 4.8.3 Critical Areas ......................................................................................... 186 4.8.4 Potential Restoration Opportunities ....................................................... 186
4.9 City of Wenatchee ................................................................................................ 187 4.9.1 Land Use Patterns ................................................................................. 188
ii
4.9.2 Existing and Potential Public Access ..................................................... 192 4.9.3 Critical Areas ......................................................................................... 193 4.9.4 Potential Restoration Opportunities ....................................................... 193
5. Analysis of Ecological Functions and Ecosystem-wide Processes ...................... 193 5.1 Model Methodology, Rationale and Limitations .................................................... 194
5.1.1 Methodology and Rationale ................................................................... 194 5.1.2 Limitations .............................................................................................. 196
5.2 Model Results ....................................................................................................... 196 5.2.1 Stemilt/Squilchuck - Colockum (WRIA 40a/b) ....................................... 196 5.2.2 Wenatchee (WRIA 45) ........................................................................... 197 5.2.3 Entiat (WRIA 46) .................................................................................... 200 5.2.4 Chelan (WRIA 47) .................................................................................. 201 5.2.5 City of Cashmere ................................................................................... 203 5.2.6 City of Chelan ........................................................................................ 204 5.2.7 City of Entiat .......................................................................................... 206 5.2.8 City of Leavenworth ............................................................................... 207 5.2.9 City of Wenatchee ................................................................................. 208
6. Land Use Analysis ............................................................................................... 224 6.1 Shoreline Land Capacity Analysis ........................................................................ 224
6.1.1 Stemilt/Squilchuck – Colockum (WRIA 40a/b) ....................................... 226 6.1.2 Wenatchee (WRIA 45) ........................................................................... 227 6.1.3 Entiat (WRIA 46) .................................................................................... 229 6.1.4 Chelan (WRIA 47) .................................................................................. 229 6.1.5 City of Cashmere ................................................................................... 230 6.1.6 City of Chelan ........................................................................................ 231 6.1.7 City of Entiat .......................................................................................... 232 6.1.8 City of Leavenworth ............................................................................... 232 6.1.9 City of Wenatchee ................................................................................. 233
6.2 Available Economic Studies ................................................................................. 234 6.2.1 City of Entiat .......................................................................................... 235 6.2.2 City of Wenatchee ................................................................................. 236
7. Public Access Analysis ........................................................................................ 237 7.1 Parks and Recreation Easements ........................................................................ 237 7.2 Opportunities for Future Public Access ................................................................ 240
7.2.1 Road/Street Ends .................................................................................. 240 7.2.2 Vacant and “No Owner” Parcels ............................................................ 241 7.2.3 Land Trusts ............................................................................................ 242 7.2.4 Public Utility District No. 1 of Chelan County ......................................... 243 7.2.5 Informal Public Access .......................................................................... 244
8. Data Gaps ............................................................................................................ 245
iii
9. Report References and Bibliography ................................................................... 246 Aerial Photography ........................................................................................................ 246 Multi-Topic General Reference Materials/GIS Sources ................................................ 246 Critical Areas ................................................................................................................. 248 Wetlands ....................................................................................................................... 248 Geologically Hazardous Areas ...................................................................................... 248 Critical Aquifer Recharge Areas .................................................................................... 248 Fish and Wildlife Habitat/Priority Species ...................................................................... 248 Toxic or Hazardous Material Clean-Up Sites ................................................................ 249 Land Use ....................................................................................................................... 249 Stormwater/Wastewater Utilities ................................................................................... 250 Floodplains and Channel Migration Zones .................................................................... 251 Historical or Archaeological Sites .................................................................................. 251 Transportation ............................................................................................................... 252 Impervious Surfaces ...................................................................................................... 252 Shoreline Modifications ................................................................................................. 252 Soils ............................................................................................................................ 252 Vegetation ..................................................................................................................... 252 Parks/Existing and Potential Public Access Sites ......................................................... 253 Opportunity Areas ......................................................................................................... 254 Water Quality ................................................................................................................. 254
10. List of Acronyms and Abbreviations ..................................................................... 256 Appendix A: Complete Ecological Function Score Results Appendix B: Land Capacity Analysis Assumptions Appendix C: Zoning Standards Summary Map Folio (see DVD attached to back cover)
1. Chelan County Shorelines – searchable poster 2. Surficial geology name key 3. Soils description
48k folder (Unincorporated Chelan County, excluding UGA)
1. Analysis segments 2. Current land use 3. Federal forest designations 4. Flood zones and wetlands 5. Function analysis scores 6. Geohazards 7. Impaired waterbodies 8. Impervious surface 9. Land capacity analysis 10. Map tile index 11. Overwater structures 12. Ownership 13. PHS fish 14. PHS wildlife 15. Planned land use 16. Precipitation and ROS
iv
17. Public access 18. Public access analysis 19. Restoration sites 20. Sewer 21. Soils 22. Surficial geology 23. Toxic sites 24. Vegetation NLCD 25. Water-oriented use
9.6k folder (Cashmere, Chelan, Entiat, Leavenworth, and Wenatchee sub-folders)
1. Analysis segments 2. Current land use 3. Flood zones and wetlands 4. Function analysis scores 5. Geohazards (Chelan and Entiat only) 6. Impaired waterbodies 7. Impervious surface 8. Jurisdiction 9. Land capacity analysis 10. Overwater structures 11. Ownership 12. PHS fish 13. PHS wildlife 14. Planned land use 15. Public access 16. Public access analysis 17. Sewer 18. Soils 19. Surficial geology 20. Toxic sites 21. Vegetation NLCD 22. Water-oriented use
List of Tables Page No.
Table 1. Shoreline Jurisdiction Streams and Rivers ................................................ 5
Table 3. Critical Area Regulations summary (as of 2008) ..................................... 18
Table 4a. Shoreline permit history in unincorporated Chelan County on the Entiat River. ....................................................................................................... 21
Table 4b. Shoreline permit history in unincorporated Chelan County on the Columbia River. ....................................................................................... 22
Table 4c. Shoreline permit history in unincorporated Chelan County on Lake Wenatchee. ............................................................................................. 22
Table 4d. Shoreline permit history in unincorporated Chelan County on Lake Chelan. .................................................................................................... 23
v
Table 4e. Shoreline permit history in unincorporated Chelan County on Nason and Peshastin Creeks. ................................................................................... 24
Table 4f. Shoreline permit history in unincorporated Chelan County on the Chiwawa, Icicle, Little Wenatchee, Napeequa, Mad, Stehekin and White Rivers. ..................................................................................................... 24
Table 4g. Shoreline permit history in unincorporated Chelan County on Antilon, Roses, and Wapato Lakes. ..................................................................... 25
Table 4h. Shoreline permit history in unincorporated Chelan County on 25-Mile, Chiwaukum, Chumstick, Ingalls, and Mission Creeks. ............................ 26
Table 4i. Shoreline permit history in unincorporated Chelan County on the Wenatchee River. .................................................................................... 27
Table 5. Shoreline Permit History in the City of Chelan Since 1999. .................... 29
Table 6. Shoreline Permit History in the City of Entiat Since 1999. ....................... 30
Table 7. Shoreline Permit History in the City of Leavenworth Since 1999. ........... 31
Table 8. Shoreline Permit History in the City of Wenatchee Since 1999. .............. 33
Table 9. Water-Oriented Uses Definitions and Examples. .................................... 41
Table 10a. Total Impervious Surface within Each Shoreline in Unincorporated Chelan County by WRIA, Outside of Cities and Their Urban Growth Areas. ....... 59
Table 10b. Total Impervious Surface within Each Shoreline by City, Including Their Urban Growth Areas. ............................................................................... 60
Table 11. Overwater Cover by Waterbody in Shoreline Jurisdiction ....................... 66
Table 12. Parks and Recreation Resources ............................................................ 67
Table 13. Priority species use of shorelines in Chelan County. .............................. 72
Table 14. Federal Endangered Species Act listed fish and wildlife species in shoreline jurisdiction of Chelan County. .................................................. 73
Table 15a. Category 2 - Waters of Concern. ............................................................. 82
Table 15b. Category 4 – Polluted Waters That Do Not Require a TMDL. ................. 83
Table 16. Total Maximum Daily Load (TMDL) projects in Chelan County, Including Non-Shoreline Waterbodies. ................................................................... 85
Table 17. Summary Table of Basic Characteristics of Each Shoreline Waterbody in WRIA 40a/b ............................................................................................. 89
Table 18. WRIA 40a/b Shorelines Land Use, Comprehensive Plan Designation, and Shoreline Environment Designation ........................................................ 92
Table 19. Summary Table of Basic Characteristics of Each Shoreline Waterbody in WRIA 45, Outside of Cities and their Urban Growth Areas. .................... 99
Table 20. WRIA 45 Land Use, Comprehensive Plan Designation, and Shoreline Environment Designation ...................................................................... 112
Table 21. WRIA 45 Shorelines and Parcels without Buildings. ............................. 120
vi
Table 22. Open Space along Shorelines in WRIA 45. ........................................... 121
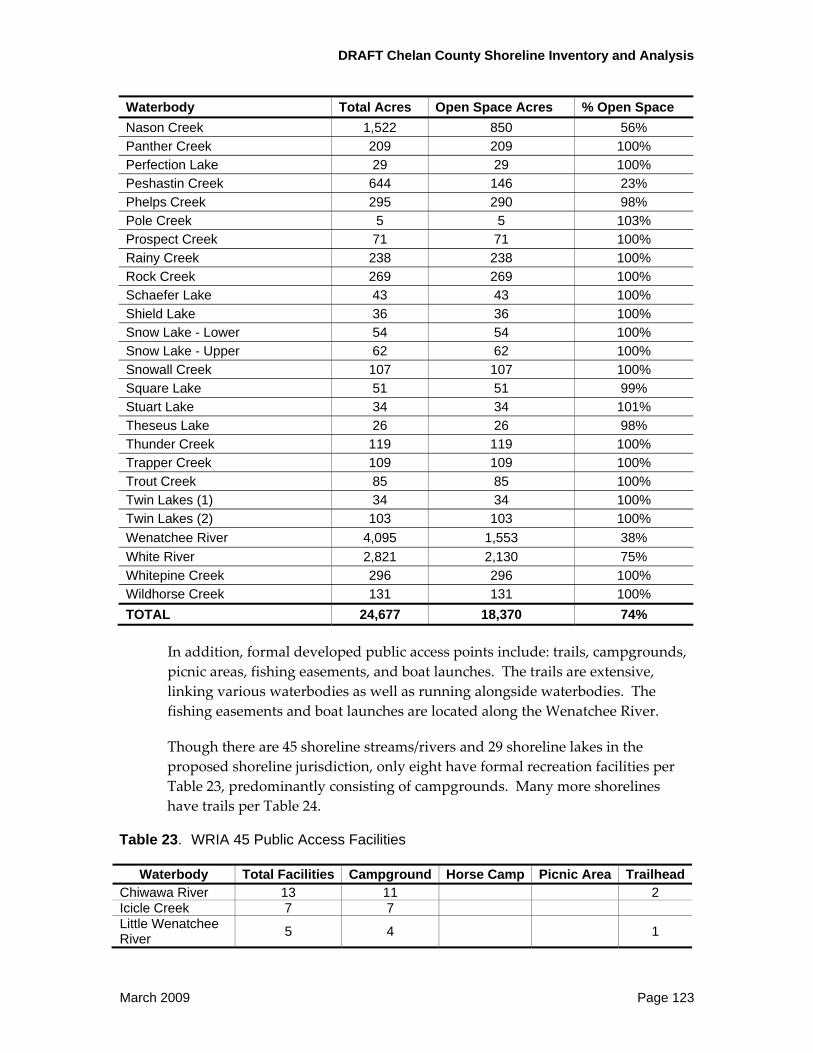
Table 23. WRIA 45 Public Access Facilities .......................................................... 123
Table 25. Summary Table of Basic Characteristics of Each Shoreline Waterbody in the Peshastin Urban Growth Area ......................................................... 125
Table 26. Peshastin UGA Land Use, Comprehensive Plan Designation, and Shoreline Environment Designation ...................................................... 126
Table 27. Summary of proposed restoration types for each reach of the Nason Creek study area based on findings of geomorphic assessment. ......... 130
Table 28. Summary Table of Basic Characteristics of Each Shoreline Waterbody in WRIA 46, Outside of Cities and their Urban Growth Areas. .................. 131
Table 29. WRIA 46 Land Use, Comprehensive Plan Designation, and Shoreline Environment Designation ...................................................................... 135
Table 30. Open Space along Shorelines in WRIA 46. ........................................... 137
Table 31. WRIA 46 Public Access Facilities .......................................................... 138
Table 33. Summary Table of Basic Characteristics of Each Shoreline Waterbody in WRIA 47, Outside of Cities and their Urban Growth Areas. .................. 142
Table 34. WRIA 47 Land Use, Comprehensive Plan Designation, and Shoreline Environment Designation ...................................................................... 149
Table 35. WRIA 47 Shorelines and Parcels without Buildings .............................. 155
Table 36. Open Space along Shorelines in WRIA 47 ............................................ 156
Table 37. WRIA 47 Public Access Facilities .......................................................... 157
Table 39. Summary Table of Basic Characteristics of Each Shoreline Waterbody in the Manson Urban Growth Area. ........................................................... 159
Table 40. Manson UGA Land Use, Comprehensive Plan Designation, and Shoreline Environment Designation ...................................................................... 159
Table 41. Summary Table of Basic Characteristics of Each Shoreline Waterbody in the City of Cashmere and its Urban Growth Area. ................................ 163
Table 42. Cashmere Shorelines: Land Use, Comprehensive Plan Designation, and Shoreline Environment Designation ...................................................... 164
Table 43. Summary Table of Basic Characteristics of Each Shoreline Waterbody in the City of Chelan and its Urban Growth Area. ..................................... 170
Table 44. City of Chelan Shorelines: Land Use, Comprehensive Plan Designation, and Shoreline Environment Designation ............................................... 173
Table 45. City of Chelan Shoreline Parcels without Buildings ............................... 174
Table 46. Summary Table of Basic Characteristics of Each Shoreline Waterbody in the City of Entiat and its Urban Growth Area. ........................................ 178
vii
Table 47. Entiat Shorelines: Land Use, Comprehensive Plan Designation, and Shoreline Environment Designation ...................................................... 179
Table 48. Summary Table of Basic Characteristics of Each Shoreline Waterbody in the City of Leavenworth and its Urban Growth Area. ............................ 183
Table 49. Leavenworth Shorelines: Land Use, Comprehensive Plan Designation, and Shoreline Environment Designation ............................................... 183
Table 50. Summary Table of Basic Characteristics of Each Shoreline Waterbody in the City of Wenatchee and its Urban Growth Area. ............................... 188
Table 51. City of Wenatchee Shorelines: Land Use, Comprehensive Plan Designation, and Shoreline Environment Designation .......................... 189
Table 52. Function Scores by Reach in WRIA 40a/b (outside of Cities and their UGAs). ................................................................................................... 197
Table 53. Function Scores by Waterbody and Sub-Watershed in WRIA 45 (outside of Cities and their UGAs). ...................................................................... 198
Table 54. Function Scores by Waterbody and Sub-Watershed in WRIA 46 (outside of Cities and their UGAs). ...................................................................... 200
Table 55. Function Scores by Waterbody in WRIA 47 (outside of Cities and their UGAs). ................................................................................................... 202
Table 56. Function Scores by Reach for the City of Cashmere and its Urban Growth Area. ...................................................................................................... 203
Table 57. Function Scores by Reach for the City of Chelan and its Urban Growth Area. ...................................................................................................... 204
Table 58. Function Scores by Reach for the City of Entiat and its Urban Growth Area. ...................................................................................................... 206
Table 59. Function Scores by Reach for the City of Leavenworth and its Urban Growth Area. ......................................................................................... 207
Table 60. Function Scores by Reach for the City of Wenatchee and its Urban Growth Area. ......................................................................................... 208
Table 61. WRIA 40a/b Shoreline Land Capacity Estimates .................................. 226
Table 62. WRIA 45 Shoreline Land Capacity Estimates ....................................... 227
Table 63. WRIA 46 Shoreline Land Capacity Estimates ....................................... 229
Table 64. WRIA 47 Shoreline Land Capacity Estimates ....................................... 230
Table 65. City of Cashmere Shoreline Land Capacity Estimates .......................... 231
Table 66. City of Chelan Shoreline Land Capacity Estimates ............................... 231
Table 67. City of Entiat Shoreline Land Capacity Estimates ................................. 232
Table 68. City of Leavenworth Shoreline Land Capacity Estimates ...................... 233
Table 69. City of Wenatchee Shoreline Land Capacity Estimates ........................ 234
Table 70. Wenatchee River fishing access locations. ........................................... 238
Table 71. Street Ends ............................................................................................ 240
viii
ix
Table 72. No Owner” Parcels ................................................................................ 242
DRAFT Chelan County Shoreline Inventory and Analysis
CHELAN COUNTY SHORELINE MASTER PROGRAM UPDATE
DRAFT SHORELINE INVENTORY AND ANALYSIS
1. INTRODUCTION 1.1 Background and Purpose
Chelan County (County) obtained a grant from the Washington Department of Ecology (Ecology) in 2007 to conduct a comprehensive Shoreline Master Program (SMP) update. The Cities of Cashmere, Chelan, Entiat, Leavenworth and Wenatchee are active partners with the County, and will participate in all SMP Update‐related efforts. This effort is precipitated by new Shoreline Master Program Guidelines (Chapter 173‐26 WAC) promulgated by Ecology in 2003.
The Shoreline Inventory and Analysis report and accompanying map folio (see DVD mounted in back cover of this report) establishes the framework for future steps in the SMP update process. Those future steps include development of the updated SMP, and preparation of the Cumulative Impacts Analysis and Restoration Plan. This Shoreline Inventory and Analysis report will serve as the baseline from which the possible effects of potential development actions in the shoreline will be measured. The Guidelines require the County to demonstrate that its updated SMP yields “no net loss” in shoreline ecological functions relative to the baseline due to its implementation. Ideally, the SMP in combination with other County, City and regional efforts, will ultimately produce a net improvement in shoreline ecological functions.
1.1.1 Shoreline Inventory As laid out in the Guidelines, one of the first steps of the update process is to prepare an inventory of all County and City shorelines as defined by the State’s Shoreline Management Act (SMA) (RCW 90.58). The inventory is conducted according to direction provided in the Guidelines (WAC 173‐26‐201) and in the Grant Agreement promulgated by Ecology. A key excerpt from the WAC is presented below:
Gather and incorporate all pertinent and available information, existing inventory data and materials from state agencies, affected Indian tribes, watershed management planning, port districts and other appropriate sources… Local governments shall be prepared to demonstrate how the inventory information was used in preparing their local master program amendments. Collection of additional inventory information is encouraged
March 2009 Page 1
DRAFT Chelan County Shoreline Inventory and Analysis
and should be coordinated with other watershed, regional, or statewide inventory and planning efforts in order to ensure consistent methods and data protocol as well as effective use of fiscal and human resources. Data from inter‐jurisdictional, watershed, or regional inventories may be substituted for an inventory conducted by an individual jurisdiction, provided it meets the requirements of this section.
WAC 173‐26‐201(3)(c) includes a detailed list of information that should be gathered “to the extent such information is relevant and reasonably available.“ The references list (Chapter 9) outlines information sources for each general topic. The references was generated by soliciting information from County, City, State, and Federal agencies; utilities; private non‐governmental organizations; and Advisory Committee members, among others. In addition, the County compiled a list of key potential stakeholders and interested groups. Many parties on the list became active participants in the Advisory Committee for the SMP Update; the remaining parties have been and will continue to be notified at key project stages and provided with opportunities to submit relevant information. Collected information was supplemented with other resources such as scientific literature, personal communications, aerial photographs, and Internet documents.
Chapters 3 and 4 contain the Shoreline Inventory component of this report.
1.1.2 Shoreline Analysis WAC 173‐26‐201(3)(d) contains direction regarding analysis of the information gathered as part of the Shoreline Inventory. Accordingly, Chapters 5, 6 and 7 analyze the shorelines by waterbody and/or by reach, as appropriate, for ecological function/ecosystem‐wide processes, land use, and public access. Chapter 8 contains additional analyses and specific recommendations related to development of the updated Shoreline Master Program. The Guidelines encourage use of available “regional environmental management plan[s]” when available. This Shoreline Inventory and Analysis utilizes the existing watershed and sub‐basin plans to the maximum extent practicable given the Guidelines and the topical coverage of those management plans.
1.2 Study Area
Chelan County encompasses 2,294 square miles and is located in the north‐central part of Washington. The county is bordered to the south by Kittitas County, to the southwest by King County, to the west by Snohomish County, to the northwest by Skagit County, to the northeast by Okanogan County, and to the east by Douglas County. Chelan County is predominantly rural in nature, with unincorporated areas making up most of the land area. Incorporated areas
Page 2 March 2009
DRAFT Chelan County Shoreline Inventory and Analysis
of the County include the cities of Cashmere, Chelan, Entiat, Leavenworth, and Wenatchee.
The study area for this report includes all land currently within the County and each City’s proposed shoreline jurisdiction. This area is distributed among 80 rivers and streams and 53 lakes and reservoirs. Federal lands on which shoreline waterbodies lie are included in this report, but discussion is more limited in keeping with the application of the future SMP only to certain actions undertaken by non‐federal parties on those lands.
1.3 Shoreline Jurisdiction
As defined by the Shoreline Management Act of 1971, shorelines include certain waters of the State plus their associated “shorelands.” At a minimum, the waterbodies designated as shorelines of the State are streams whose mean annual flow is 20 cubic feet per second (cfs) or greater or lakes whose area is greater than 20 acres.1 In addition, shorelines of statewide significance are those streams and rivers that meet one or more of the following criteria:
“i. that have either: a mean annual flow of 200 cubic feet per second or more, or;
ii. the portion downstream from the first 300 square miles of drainage areas.
Shorelands are defined as:
“those lands extending landward for 200 feet in all directions as measured on a horizontal plane from the ordinary high water mark; floodways and contiguous floodplain areas landward 200 feet from such floodways; and all wetlands and river deltas associated with the streams, lakes, and tidal waters which are subject to the provisions of this chapter…. Any county or city may determine that portion of a one‐hundred‐year‐floodplain to be included in its master program as long as such portion includes, as a minimum, the floodway and the adjacent land extending landward two hundred feet therefrom…. Any city or county may also include in its master program land necessary for buffers for critical areas…” (RCW 90.58.030)
1 Future climate change could affect precipitation patterns and snowpack in Chelan County in ways that are not yet fully understood or predictable. These changes will affect mean annual flow and lake size, which may alter the extent of shoreline jurisdiction. This shoreline inventory effort does not consider climate change impacts as part of its scope.
March 2009 Page 3
DRAFT Chelan County Shoreline Inventory and Analysis
The County and City shoreline boundaries have been updated (subject to Board of County Commissioners (BOCC), City Councils, and Ecology approval) concurrent with this inventory. While extension of jurisdiction to encompass the entire 100‐year floodplain and critical areas buffers are options, the County and Cities have elected to regulate the minimum required jurisdictional area in their SMPs. In summary, improved stream flow modeling by the United States Geological Survey (USGS) and improved lake area mapping has resulted in increased accuracy of jurisdiction identification and mapping.
The Shoreline Management Act had always intended that jurisdiction extend onto federal land, but an error originally made by USGS in the early 1970s and perpetuated by Ecology omitted federal lands from jurisdiction maps and lists. As stated in WAC 173‐27‐060(3), “The policies and provisions of chapter 90.58 RCW [Shoreline Management Act], including the permit system, shall apply statewide to all nonfederal developments and uses undertaken on federal lands and on lands subject to nonfederal ownership, lease or easement, even though such lands may fall within the external boundaries of a federal ownership.” These past mapping errors by USGS and Ecology have been corrected so that federal lands are no longer excluded from shoreline jurisdiction.
The current Shoreline Master Programs regulate 23 streams/rivers and 18 lakes. As considered in this shoreline inventory, 80 streams/rivers and 53 lakes may meet shoreline jurisdiction criteria. The total acreage of upland shorelands (excluding area of the shoreline waterbodies) is 42,693. Federal lands make up 68 percent of that acreage, or 29,211 acres total. Of the 133 total shoreline waterbodies, 94 are entirely on federal lands and another 17 have more than 50 percent of their shoreland areas on federal land. The three federal entities that own the majority of the federal land are the U.S. Forest Service (USFS), the National Park Service (NPS), and the U.S. Bureau of Land Management (BLM). Four USFS wilderness areas are found along Chelan County shorelines: Lake Chelan Sawtooth Wilderness, Glacier Peak Wilderness, Henry M. Jackson Wilderness, and Alpine Lakes Wilderness. These areas have the greatest level of protection and stringent prohibitions on alteration. A large area at the north end of Lake Chelan is also part of the National Park Service’s Lake Chelan National Recreation Area.
Minor additional changes have been made based on new information about floodways, floodplains and wetland boundaries. Tables 1 and 2 present the list of shoreline jurisdictional waterbodies, and some basic jurisdictional history. The “total length of proposed shoreline” column in Table 1 represents the combined length of shoreline of current and potential additional jurisdiction based on USGS data. The length of existing stream shoreline is not available.
Page 4 March 2009
DRAFT Chelan County Shoreline Inventory and Analysis
Table 1. Shoreline Jurisdiction Streams and Rivers
River/Creek Name
Map
ped
as
Shor
elin
e U
nder
Ex
istin
g SM
P
Tota
l Len
gth
of
Prop
osed
Sh
orel
ine
(ft)
River/Creek Name
Map
ped
as
Shor
elin
e U
nder
Ex
istin
g SM
P
Tota
l Len
gth
of
Prop
osed
Sh
orel
ine
(ft)
Agnes Creek No 29,474 Mill Creek No 6,781 Basin Creek No 1,770 Mission Creek Yes 39,870 Big Meadow Creek No 5,541 Mountaineer Creek No 15,747 Boulder Creek 1 No 20,203 Napeequa River Yes 88,773Boulder Creek 2 No 4,702 Nason Creek* Yes 122,246
Bridge Creek No 62,307 North Fork Bridge Creek No 33,667
Buck Creek No 19,291 North Fork Entiat River No 34,972
Cady Creek No 15,527 North Fork Thirtyfive Mile Creek No 3,104
Chelan River* Yes 21,818 Panther Creek No 22,409 Chikamin Creek Yes 14,641 Park Creek No 28,140 Chiwaukum Creek No 41,892 Peshastin Creek Yes 64,582 Chiwawa River* Yes 200,777 Phelps Creek Yes 31,266 Chumstick Creek No 24,601 Pole Creek No 249 Colockum Creek No 19,380 Prince Creek No 27,914 Columbia River* Yes 395,252 Prospect Creek No 7,479 Company Creek No 47,709 Railroad Creek Yes 78,823 Cottonwood Creek No 2,617 Rainbow Creek No 21,952 Cougar Creek No 41 Rainy Creek No 25,678 Doubtful Creek No 59 Rimrock Creek No 2,849 Eightmile Creek Yes 21,678 Roaring Creek No 75 Entiat River* Yes 269,902 Rock Creek No 29,154 Fish Creek No 20,158 Snowall Creek No 11,418
Fish Creek No 17,825 South Fork Agnes Creek No 48,380
Flat Creek No 41,871 South Fork Bridge Creek No 12,953
French Creek No 38,892 South Fork Chiwaukum Creek Yes 16,709
Ibex Creek No 3,443 South Fork Flat Creek No 4,702 Ice Creek No 6,088 Spruce Creek No 16,427 Icicle Creek* Yes 151,122 Stehekin River* Yes 125,759 Indian Creek No 35,568 Swamp Creek No 5,190 Ingalls Creek Yes 56,766 Thunder Creek No 12,715 Jack Creek No 45,045 Tommy Creek No 7,255 Lake Creek No 8,846 Trapper Creek No 7,437 Lake Creek No 21,104 Trout Creek No 9,324 Leland Creek No 24,814 Twentyfive Mile Creek Yes 15,544 Lightning Creek No 4,059 Wenatchee River* Yes 278,629
Little Wenatchee River* Yes 117,784 West Fork Agnes Creek No 34,890
March 2009 Page 5
DRAFT Chelan County Shoreline Inventory and Analysis
River/Creek Name
Map
ped
as
Shor
elin
e U
nder
Ex
istin
g SM
P
Tota
l Len
gth
of
Prop
osed
Sh
orel
ine
(ft)
River/Creek Name
Map
ped
as
Shor
elin
e U
nder
Ex
istin
g SM
P
Tota
l Len
gth
of
Prop
osed
Sh
orel
ine
(ft)
Mad River Yes 104,360 West Fork Flat Creek No 10,583 Maple Creek No 10,153 White River* Yes 153,763 McAlester Creek No 12,397 Whitepine Creek Yes 31,390 Meadow Creek No 9,909 Wildhorse Creek No 13,921
TOTAL: 3,452,102 ft (653.8 miles)* Streams/rivers that are partial or complete Shorelines of Statewide Significance. Table 2. Shoreline Jurisdiction Lakes
Lake Name
Map
ped
as
Shor
elin
e U
nder
Ex
istin
g SM
P
Tota
l Are
a of
Pr
opos
ed
Shor
elin
e La
ke
(acr
es)
Lake Name
Map
ped
as
Shor
elin
e U
nder
Ex
istin
g SM
P
Tota
l Are
a of
Pr
opos
ed
Shor
elin
e La
ke
(acr
es)
Antilon Lake Yes 35 Lichtenwasser Lake No 26
Black Lake (aka Wheeler Hill or Spring Hill Reservoir)
Yes 33 Loch Eileen Lake Yes 26
Chiwaukum Lake Yes 70 Lost Lake No 27 Colchuck Lake Yes 88 Lyman Lake No 74 Cortez Lake Yes 34 Meadow Lake Yes 36 Cub Lake No 23 Mirror Lake No 25 Domke Lake No 273 Nada Lake No 23 Doubtful Lake No 30 Perfection Lake No 21 Dry Lake Yes 81 Rainy Lake No 53 Eightmile Lake Yes 65 Roses Lake Yes 178 Fish Lake Yes 503 Schaefer Lake No 83 Glasses Lake No 23 Shield Lake No 39 Green View Lake No 41 Snow Lake-Lower Yes 65 Hart Lake No 33 Snow Lake-Upper Yes 126 Heather Lake No 86 Square Lake No 73
Ice Lakes (1) No 44 Stemilt Project Reservoir No 22
Ice Lakes (2) No 20 Stuart Lake No 41 Josephine Lake No 24 Surprise Lake No 40 Klonaqua Lakes (1) Lower Yes 66 Theseus Lake No 29
Klonaqua Lakes (2) Upper Yes 65 Trapper Lake No 148
Lake Augusta No 24 Twin Lakes (1) No 33
Page 6 March 2009
DRAFT Chelan County Shoreline Inventory and Analysis
Lake Name
Map
ped
as
Shor
elin
e U
nder
Ex
istin
g SM
P
Tota
l Are
a of
Pr
opos
ed
Shor
elin
e La
ke
(acr
es)
Lake Name
Map
ped
as
Shor
elin
e U
nder
Ex
istin
g SM
P
Tota
l Are
a of
Pr
opos
ed
Shor
elin
e La
ke
(acr
es)
Lake Chelan* Yes 32,623 Twin Lakes (2) No 259 Lake Leland No 36 Unnamed Lake 1 No 34
Lake Valhalla No 25 Upper Wheeler Reservoir Yes 34
Lake Victoria Yes 26 Wapato Lake Yes 195
Lake Wenatchee* Yes 2,449 White Rock Lakes (1) No 20
Larch Lake No 30 TOTAL: 38,577 acres
* Lakes that are partial or complete Shorelines of Statewide Significance.
WRIA 40a/b encompasses the southeast portion of the County and continues southward into neighboring counties. In this vicinity, the County boundary does not follow stream or watershed boundaries, so portions of the WRIA boundary and the County boundary do not coincide. Because of this discrepancy, the WRIA was divided into two parts – WRIA 40a, the Stemilt/Squilchuck, and WRIA 40b, the Alkali/Colockum. Chelan County includes most of WRIA 40a, and significant portions of Colockum Creek. These drainages are tributary to the Columbia River, bounded on the north and east by the Columbia, and on the west by Mission Peak and Naneum Ridge. Mission Creek, which also drains Mission Ridge to the north, is a tributary to the Wenatchee and not part of WRIA 40.
WRIA 40a is the smallest WRIA in the State, at about 49,000 acres, or just over 76 square miles. It consists of four primary sub‐basins: Stemilt (21,430 acres), Squilchuck (17,600 acres), Malaga (7,490 acres), and Wenatchee Heights (2,200 acres). Elevations in the basin range from close to 6,900 feet at Mission Ridge to 605 feet at the Columbia.
The Colockum Basin is approximately 36 square miles (23,000 acres), over half of which is located within the County limits. It lies immediately south of the Malaga and Stemilt basins, and like the others in WRIA 40a/b, it drains directly
March 2009 Page 7
DRAFT Chelan County Shoreline Inventory and Analysis
to the Columbia. Elevations range from about 5,800 feet at Naneum Ridge to 550 feet at the Columbia.
Wenatchee (WRIA 45)
The Wenatchee basin is the largest basin in the county, at approximately 1,370 square miles (877,000 acres), draining an area from the Cascade Crest to the Columbia immediately north of the WRIA 40 drainages. The basin is oriented with headwaters in the northwest and the confluence with the Columbia to the southeast, at the City of Wenatchee. It is the most heavily populated of the basins in Chelan County, with Leavenworth, Cashmere and Wenatchee as the primary population centers. Over 80 percent of the land in the basin is federally or State owned (Wenatchee Watershed Planning Unit [WWPU] 2006).
There are seven major tributaries to the Wenatchee. The White River originates at the south side of Glacier Peak, the least well known of the Cascade volcanoes, and empties into Lake Wenatchee. Glacial runoff from Glacier Peak gives the river its name. The Little Wenatchee drains from non‐glaciated portions of the Cascade Crest south of Glacier Peak, and also flows into Lake Wenatchee. The outlet of Lake Wenatchee forms the mainstem Wenatchee River. The Chiwawa, which originates between Fortress and Buck Mountains northeast of Glacier Peak, joins the Wenatchee just north of the town of Plain. Nason Creek originates south of the Little Wenatchee basin near Stevens Pass and flows into the Wenatchee just downstream of Lake Wenatchee. Icicle Creek drains an area south of the Nason Creek basin, including the west side of Mt. Stuart and the Chiwaukum Mountains, and meets the Wenatchee in Leavenworth. The Peshastin Creek drainage includes the south side of Mt. Stuart and the Stuart Range as well as the Blewett Pass area. Peshastin Creek meets the Wenatchee at Peshastin. Mission Creek drains the area to the west of the Peshastin Basin, from Naneum Ridge northward to its confluence with the Wenatchee at Cashmere.
In total, there are about 230 miles of major stream in the Wenatchee Basin (WWPU 2006). The Wenatchee itself has about 61 linear miles of stream accessible to salmonids (Laura Berg Consulting, et al. [Berg] 2004b).
Entiat (WRIA 46)
The Entiat basin is just north of the Wenatchee basin. Like the Wenatchee, it is oriented with the headwaters in the northwest (the Entiat Cirque) and the outlet in the southeast (at the City of Entiat). The Entiat basin is considerably smaller than the Wenatchee basin, at 466 square miles (approximately 298,000 acres) (Berg 2004a). Approximately 83% of the basin is owned by State and Federal agencies, primarily the U.S. Forest Service. The majority of privately held land is within 1 mile of the mainstem Entiat, along a 26‐mile‐long corridor from the
Page 8 March 2009
DRAFT Chelan County Shoreline Inventory and Analysis
Columbia. However, a few private “checkerboard” plots are held away from the Entiat (Berg 2004a).
The two major tributaries to the Entiat are the North Fork Entiat, which drains the northeast part of the basin below Pyramid Mountain and joins the Entiat at about river mile (RM) 34, and Mad River, which originates at below Klone Peak on the western boundary of the basin and joins the Entiat at Ardenvoir (RM 10.5). Elevations in the basin range from 9,249 feet at Mt. Fenrow to 713 feet at the Columbia.
Chelan (WRIA 47)
The Chelan basin forms the northern border of both the Wenatchee and the Entiat basins. It also shares the same NW/SE orientation, with headwaters at the Cascade Divide, draining Mt. Logan, Sahale Mountain, Spider Mountain and Dome Peak. The basin is 937 square miles (about 600,000 acres) (Berg 2004c), making it the second largest basin in the County. The North Cascades National Park and the Lake Chelan National Recreation Area occupy most of the upper basin. The middle basin is primarily owned by the Forest Service as part of the Wenatchee National Forest, and the lower basin is primarily privately owned.
Unlike the other basins in the County, a lake, rather than a river, occupies much of the primary valley. Lake Chelan comprises 50.4 miles of the approximately 75‐mile‐long valley bottom, and at over 1,400 feet deep is the third deepest lake in the United States. Lake Chelan outlets to the shortest river in Washington, the 4.1‐mile‐long Chelan River, which in turn outlets to the Columbia, the longest river in Washington (Berg 2004c).
1.4.2 Historic Geology, Topography, and Drainage Patterns Topography and Geology
Throughout most of the County, the upper elevations area are characterized by deeply incised, high‐relief terrain of the eastern Cascade Mountains, consisting primarily of metamorphic and intrusive igneous rocks, though significant sedimentary and volcanic rocks occur in the Stemilt/Squilchuck basin and portions of the Wenatchee basin. The Cascade Range has been formed over the last 37 million years by the subduction of the oceanic Juan de Fuca plate under the continental North American plate. The plate boundary is just off the coast of Washington, and as the Juan de Fuca plate subsides, it is forced downward at an angle under the North American plate. As the plate moves downward, the temperature around it increases to the point that the plate begins to melt. The melted material moves upward, forcing its way through and blending with the overriding continental crust. Where the melted material emerges at the surface, volcanoes are formed, including Glacier Peak near Chelan County. The upward
March 2009 Page 9
DRAFT Chelan County Shoreline Inventory and Analysis
migration of material also created a general uplift in the area, forming the Cascade Range
The Cascades have been heavily influenced by Quaternary mountain glaciation, with landforms typical of such glaciation, including cirques, arêtes, U‐shaped valleys, and moraines. The valleys bottoms are largely filled with glacial and fluvial deposits, primarily unconsolidated silts, sands and gravels, as well as significant volumes of landslide/debris flow deposits. In the Wenatchee basin, deposits of glacial and post‐glacial material are up to 170 feet thick (EEC and Golder 1998), and on the Icicle in Leavenworth, deposits are up to 300 feet thick (Andonaegui 2001).
Along the extreme eastern edge of County, nearest the Columbia as well as throughout most of the upper elevations of the Stemilt/Squilchuck watershed, flood basalts of the Columbia Plateau are the prevalent bedrock. These rocks were formed over a period of 10 million years or so, beginning about 17 million years ago, as several series of vents released massive volumes of basaltic lava, that flowed over most of the lower‐lying areas of Eastern Washington and continued to the Pacific Ocean through the Columbia Gorge. These vents were located along several nearly north‐south lines, up to 100 miles long, ranging from central Oregon to the Tri Cities, Spokane, Pullman, and central Idaho. Over 300 individual flows have been identified, with accumulations of over 6,000 feet in places. Broad plateaus or gently rolling hills with steep‐walled, incised, stream‐carved valleys, typify the topography.
The lower elevation areas of the county were heavily influenced by continental glaciation. At its maximum extent, the Cordilleran ice sheet reached a point just south of present‐day City of Chelan within the county. In the Chelan Basin, the combination of mountain glaciation from the Cascades and continental glaciation combined to carve out and dam the lake. The valley flooded by the lake is a typical U‐shaped mountain‐glacier carved valley. The valley was subsequently dammed by moraine deposits from the Cordilleran ice sheet (Hillman and Giorgi 2000). Because of this, the lower lake, from Wapato Point eastward, is relatively shallow, having been filled with glacial deposits that form the dam. The upper lake, by contrast, is exceptionally deep, with steep walls that plunge deep into the water with little or no beach formation.
In other low‐lying parts of the County, especially in the more northern portions close to the terminus of the Okanogan‐Columbia Valley lobe, loess plains were formed as wind deposited fine sediments that had been eroded out of glacially deposited materials. Along the Columbia, massive floods scoured and deposited material when lakes that were dammed by the Cordilleran ice sheet were catastrophically released.
Page 10 March 2009
DRAFT Chelan County Shoreline Inventory and Analysis
Drainage Patterns
There is significantly more precipitation in the upper portions of the basins in Chelan County than in the lower basins. The greatest discrepancy is in the Wenatchee basin, where the upper portions see up to 150” of precipitation annually, and the lower portions less than 10” (Berg 2004b). In the smaller, and less‐steep Stemilt/Squilchuck basin, the difference is less pronounced, with 32” in the upper reaches and about 8” in the lower (RH2 Engineering, Inc. 2007).
In all the basins, precipitation in the higher elevations usually occurs in the winter as snowfall (RH2 Engineering, Inc. 2007; WWPU and Chelan County Natural Resources 2003; Berg 2004a, c), though the White River is the only major tributary with heavy glacial input. Because most of the precipitation is snowfall, peak flows tend to be in the spring and summer months, as the snow melts. However, rain‐on‐snow events in the late fall and winter can produce dramatic flood events. Occasional, localized summer thunderstorms occur, which can lead to localized flash flood events.
The upper basins, being primarily rock with little soil or stored sediment, tend to have little sub‐surface storage of water, though jointing and faulting can produce some potential water storage. Most of the snowmelt instead runs off to lower elevation/lower relief areas. The alluvial and/or glacial sediments that tend to fill the valleys store a significant portion of the runoff as groundwater. As stream flow decreases during the hot, dry summers water stored in the valley floor sediment re‐enters the stream and contributes to low flow volumes. However, even with this contribution, summer flows tend to be quite low. Water withdrawals, both from the streams directly and from the valley‐floor sediments, exacerbate the problem. In the Wenatchee basin, for example, the mainstem Wenatchee River, and the Icicle, Chumstick, Peshastin, and Mission Creeks, to name a few, have been included on the State 303(d) list for lack of flow (as well as low dissolved oxygen content, high temperatures, and pH) (Berg 2004b).
1.4.3 Major Land Use Changes and Current Shoreline Condition Stemilt/Squilchuck – Colockum (WRIA 40a/b)
According to the 2007 Census, the population in the Stemilt/Squilchuck basin was 3,770. Most of these people work outside the drainage, mostly in the city of Wenatchee. The upper portion of the basin is predominately zoned as commercial forest land. However, the upper basin is also a popular place for recreational activities, including hunting, snow‐machining, hiking, biking, fishing and skiing. The Mission Ridge ski area hosts 100,000 visitors annually.
The lower portions of the basin are primarily rural residential/resource or commercial agriculture. Unlike the other basins in the County, public land makes up very little of this basin.
March 2009 Page 11
DRAFT Chelan County Shoreline Inventory and Analysis
Agricultural land is dominated by fruit trees, with cherry being the most common. The Wenatchee Heights sub‐basin “Most relatively flat area[s in this basin] are covered by orchard” (RH2 Engineering 2007).
The industrial properties that exist in the drainage are located in the Malaga sub‐basin, along the Columbia River. However, subsurface gold mining and some hydropower generation have occurred historically in the lower Squilchuck basin.
Wenatchee (WRIA 45)
The Wenatchee basin is home to approximately 54,000 people, according to Chelan County Office of Long Term Planning. The majority of the population is concentrated in the lower basin, with major population centers including Wenatchee, Cashmere, and Leavenworth.
The City of Wenatchee is located at the confluence of the Wenatchee and Columbia Rivers. With a population of about 36,000 people, it makes up two‐thirds of the overall basin population. It is expected to grow to about 54,000 by 2025 (Chelan County Community Development).
Cashmere is located at the confluence of Mission Creek and the Wenatchee River. It is the second largest city in the basin, with a population of 11,000. As with Wenatchee, Cashmere is expected to grow significantly in the future, with 17,000 expected by 2025 (Chelan County Community Development).
Leavenworth is located at the confluence of Icicle Creek and the Wenatchee River, near RM 25.6. Leavenworth, a popular tourist destination, has a full‐time resident population of about 6,000 people, or roughly 11 percent of the basin total. Like the other cities in the basin, the population of Leavenworth is expected to increase significantly over the next 20 years, to 8,500 by 2025.
Peshastin is a small community established in the 1890s, during which time a depot was erected along the Northern Pacific Railroad. Today, Peshastin is a small unincorporated community located within the newly adopted Peshastin UGA. The UGA contains 610 acres, 93 acres of which lie in shoreline jurisdiction along the Wenatchee River and approximately 3 acres of which lie in shoreline jurisdiction along Peshastin Creek. A majority of the area is surrounded by orchards, with some wineries and bed and breakfasts. According to the Peshastin Urban Growth Area Comprehensive Plan, the community is expected to grow to approximately 1,110 residents within the Peshastin UGA by 2025.
Publicly owned lands dominate the basin, with 76% of the basin, totaling 671,000 acres, owned by the USFS. Of this area, 316,000 acres is designated wilderness, 243,000 acres is designated as multiple resource (i.e. forestry, recreation, water supply, etc.), and 112,000 acres is designated as no‐cut forest (Berg 2004b).
Page 12 March 2009
DRAFT Chelan County Shoreline Inventory and Analysis
Though less than 25% of the basin is privately owned, private landholders border two‐thirds of the lineal extent of anadromous streams (Chelan PUD 1998, Berg 2004b). The largest industry in the basin is agriculture, dominated by fruit trees. Indeed, the region is internationally recognized for its fruit production, especially winter pears (WWPU 2006). Low rainfall in the lower portions of the basin makes it necessary to irrigate in order to have fruit production (WWPU 2006). Such irrigation must be year‐round and continuous, since unlike annual crops, the trees live year‐round and take several years to mature. One interruption in irrigation can damage or kill the trees, which cannot be quickly replaced (WWPU 2006).
Entiat (WRIA 46)
Similar to the Wenatchee basin, much of the Entiat basin is owned by public agencies. Over 80% of the land in the Entiat basin is publicly owned, with 63% designated as “reserve” land, including wilderness, old‐growth reserves, and wildlife and riparian reserves. Also as with the Wenatchee and Stemilt/Squilchuck basins, fruit production is an important activity. However, less than 1% is irrigated agricultural land (Berg 2004a).
The primary population center in the basin is Entiat. The population of Entiat was 957 in 2000, spurred by an increase of 133% in the 1990s. Prior to that, the population had remained relatively steady at about 450 people. In 1960, when the Rocky Reach dam was completed a portion of downtown Entiat was flooded, causing significant economic hardship to the city and the school district.
Historically, the Entiat basin has been a traditional hunting and gathering area for Native Americans (Berg 2004a; Chelan County Conservation District 2004). Bitterroot was harvested from the lower valleys (Berg 2004a; Chelan County Conservation District 2004) and game was hunted in the forests and grasslands. Fishing and other water‐dependant species were sought in the riparian areas.
The first significant non‐native use of the basin was for trapping, primarily pine martin, starting in the 1880s (Berg 2004a; Chelan County Conservation District 2004). Sheepherding followed soon after, and by the early 1900s, 60,000 sheep used the basin annually (Chelan County Conservation District 2004), resulting in overgrazing and dramatic cutbacks in numbers allowed. Irrigated agriculture began by at least 1887, when the first ditch was made in the basin.
The first sawmill in the basin was established in Entiat in 1892 (Berg 2004a). Logging increased in the 20th century in response to homebuilding and the demand for apple‐boxes (Berg 2004a; Chelan County Conservation District 2004). Mills were also built near the mouth of the Entiat, and on lower tributaries such as Mills Canyon, Crum Canyon and Muddy Creek (Berg 2004a). Holding dams were constructed at various locations and used to drive logs to the sawmills
March 2009 Page 13
DRAFT Chelan County Shoreline Inventory and Analysis
(Chelan County Conservation District 2004). Timber harvests peaked in the early 1970s, with salvage logging after the 1970 Entiat fires (Berg 2004a). Since those fires, harvest rates have declined significantly. Over time, a significant road network was constructed to facilitate the logging operations. Most roads presently in the basin were built by 1980.
Gold has been periodically extracted from mines around Crum Canyon (Berg 2004a; Chelan County Conservation District 2004). Pumice has also been mined in the area from open pits near Stormy Creek and Cottonwood.
Chelan (WRIA 47)
Publicly owned lands also heavily dominate the Chelan basin, with about 90% of the basin in public ownership. Approximately 70% is part of the Wenatchee National Forest, and over 20% is within the North Cascades National Park (over 500,000 acres). The upper 9 miles of the lake and the Stehekin River are in the Lake Chelan National Recreation Area (63,000 acres) (Berg 2004c).
Historically, the Chelan tribe, now part of the Confederated Tribes of the Colville Reservation, used the basin. Most of the historic use was centered on the waterways, for fishing, hunting and gathering. Some areas are still used in these traditional ways.
The basin has approximately 10,000 residents (Lake Chelan Chamber of Commerce (http://www.lakechelan.com/), most of whom live in the lower third of the valley, where there is extensive private land ownership and less steep topography. The City of Chelan is the only incorporated community in the basin. It has about 3,500 residents (growing to around 6,000 in summer), and is located on the southernmost point of the lake, straddling a dam that serves as the outlet to the Chelan River. Manson, located approximately 8 miles up‐lake from Chelan, has a population that varies from about 2,000 to 4,000. At the opposite end of the lake, unconnected by roads, lies the town of Stehekin. With only 70 or so year‐round residents, it receives frequent commercial boat service from Chelan, and is primarily a tourist destination and a starting point for outdoor recreational activities. Similarly, the community of Lucerne, located at the mouth of Railroad Creek, is also inaccessible by automobile, and consists of a small number of private cabins, served by commercial boats.
The lake is used for hydroelectric production, resulting in an annual fluctuation of approximately 10 feet. Historically, the basin saw significant timber harvest activities, but little timber is now harvested from the basin. Mining was also once an important industry in the basin, with copper, gold, zinc, and silver extracted from the Holden Mine on Railroad Creek, near the community of Lucerne. Ore extracted from the mine was barged down‐lake to the City of Chelan. While mining is currently only a minor activity in the basin, several
Page 14 March 2009
DRAFT Chelan County Shoreline Inventory and Analysis
other patented claims exist in the basin in private inholdings. Under current mining laws, such claims could be exercised in the future.
Because the upper two‐thirds of the basin is inaccessible by automobile, there is very little development outside of Stehekin and Lucerne. Shoreline development in the upper part of the lake is largely limited to primitive campgrounds managed by the USFS and the NPS.
In privately held areas, agriculture is the predominant land use, with nearly 9,500 acres of orchard (primarily apple), though wineries have begun to gain popularity since the first was established in 2002. Significant growth in primary and secondary residential development has occurred in the past few decades, including docks and boat ramps at lakeside residences. Resorts and other public recreation activities are also common in the lower portion of the basin.
2. CURRENT REGULATORY FRAMEWORK SUMMARY
This section presents a brief summary of land use regulations that are related to shoreline activities. The Shoreline Management Recommendations report provides additional analysis of shoreline, critical area, and zoning regulations in particular.
2.1 Existing Shoreline Master Programs
The Shoreline Management Act of 1971 (Chapter 90.58 RCW) was established to:
“…prevent the inherent harm in an uncoordinated and piecemeal development of the stateʹs shorelines…” and to “provide for the management of the shorelines of the state by planning for and fostering all reasonable and appropriate uses. This policy is designed to insure the development of these shorelines in a manner which, while allowing for limited reduction of rights of the public in the navigable waters, will promote and enhance the public interest. This policy contemplates protecting against adverse effects to the public health, the land and its vegetation and wildlife, and the waters of the state and their aquatic life, while protecting generally public rights of navigation and corollary rights incidental thereto.”
The SMA emphasizes accommodation of reasonable and appropriate uses, protection of shoreline environmental resources and protection of the public’s right to access and use the shorelines” (http://www.ecy.wa.gov/programs/sea/ sma/st_guide/intro.html). Ecology is responsible for developing and overseeing
March 2009 Page 15
DRAFT Chelan County Shoreline Inventory and Analysis
implementation of Shoreline Master Program Guidelines (Chapter 173‐26 WAC), which provide direction to local governments regarding development and implementation of local Shoreline Master Programs. While cities and counties are the primary regulators under the Shoreline Management Act, Ecology has final approval authority over the local government’s SMP. Ecology also reviews and has final approval over Shoreline Conditional Use and Shoreline Variance permits processed under the local jurisdiction’s SMP.
The first Chelan County Shoreline Master Program (SMP) was adopted by Chelan County and Washington State Department of Ecology in 1975, with minor revisions adopted in 1979. Text amendments were adopted in 1994 to Section 21.A Piers and Docks. The most recent text and map amendments were adopted in 1997, removing Chumstick Creek as a designated shoreline.
There are currently four shoreline environment designations: Urban, Rural, Conservancy and Natural (Figure 1). These designations cover 23 rivers and streams and 18 lakes. The Cities of Cashmere, Chelan, Entiat, Leavenworth, and Wenatchee all adopted the original 1975 Chelan County SMP regulations, generally substituting the City’s name for Chelan County in appropriate places. However, the Cities have not uniformly adopted subsequent County‐initiated amendments or updates. The City of Wenatchee modified the procedural sections slightly to increase administrative decision‐making and limit hearing examiner involvement. In each of the cities, all proposed projects must comply with the State’s Shoreline Management Act (RCW 90.58), Washington Administrative Code (WAC) Chapter 173‐26, and the Shoreline Master Program. In addition, all proposed projects must be consistent with local comprehensive plans, municipal development regulations, International Building Code, and other local and federal laws.
2.2 Existing Critical Area Regulations
Chelan County and the Cities of Cashmere, Chelan, Entiat, Leavenworth and Wenatchee each have their own set of critical area regulations that dictate protection of environmentally sensitive areas, including wetlands, streams (fish and wildlife habitat conservation areas), geologically hazardous areas, frequently flooded areas, and aquifer recharge areas. All regulations use a version of the Department of Ecology’s Eastern Washington Wetland Rating System, although only Chelan County and City of Entiat specify use of the most current (2004/2007) version.
Table 3 summarizes critical areas regulations by jurisdiction:
Page 16 March 2009
DRAFT Chelan County Shoreline Inventory and Analysis
Figure 1. Shoreline jurisdiction and environment designations under the existing
Shoreline Master Program.
March 2009 Page 17
DRAFT Chelan County Shoreline Inventory and Analysis
Table 3. Critical Area Regulations summary (as of 2008)
Jurisdiction Date of
Last Update
Wetland Rating System
Stream Classification
System Buffer Width (feet)
Chelan County
2007 Ecology E. WA (2004)
WA DNR Interim water typing system (WAC 222-16-031)
Wetlands High Intensity
Low Intensity Title No.
11.78-11.86; Fish & Wildlife Habitat Cons. Areas; Wetland Areas Ov. Dist.; Aq. Recharge Area Ov. Dist; Freq. Flooded Areas Ov. Dist.; Geo. Haz. Area Ov. Dist.
Title No. 14.10A-E Wetlands; Crit. Aq. Rchg. Areas; Fish & Wildlife Habitat Cons. Areas; Geog. Haz Areas; Freq. Flooded Areas.
200 100 50 20
Streams General protection standards only for fish and wildlife habitat conservation areas, no dimensional standards for buffers
City of Entiat 2006 Ecology
E. WA (2004/ 2007)
Two-tiered system based on sensitivity of habitat to development-related disruption
Wetlands Level 1 Critical Level 2 Awareness
Title No. EMC 17.10A-F Wetlands; Fish & Wildlife Cons. Areas; Aquifer Recharge Areas; Freq. Flooded Areas; Geolog. Haz. Areas.
Cat I and Cat II - 75 Cat III and Cat IV - 25
Aquatic Habitat
Minor 50
Major
75
Minor 25
Major 50
City of Leavenworth
1994 Ecology E. WA
WA DNR (WAC 222-16- Wetlands High Intensity
Land Use Low Intensity Land Use
Page 18 March 2009
DRAFT Chelan County Shoreline Inventory and Analysis
Jurisdiction Date of
Last Update
Wetland Rating System
Stream Classification
System Buffer Width (feet)
Title No. Chapter 16.08 Critical Areas
(1991) 030) Cat 1 25-150 25-125 Cat 2 25-100 25-75 Cat 3 25-50 25-50 Cat 4 25 exempt Streams Class I, II or III = 25 feet (slope distance)
City of Wenatchee
1991 Ecology E. WA (1991)
None Wetlands
Cat I Cat II Cat III Cat IV
250 150 75 50 Title No. Chapter 12.08.130-170 Wetlands; Crit. Aq. Recharge Areas; Freq. Flooded Areas; Geo. Haz Areas; Fish & Wildlife Hab. Cons. Areas
General protection standards only for fish and wildlife habitat conservation areas, no dimensional standards for buffers
Streams
Chelan County’s critical areas regulations were recently updated (2007), and are considered to be consistent with Growth Management Act “best available science” standards. No further revisions to the regulations in the near future are anticipated.
The City of Cashmere received a three‐year extension of the critical areas regulations update deadline to December 1, 2009.
The City of Chelan has begun work on an updated critical areas ordinance, expected to continue into 2009. The fish and wildlife habitat conservation areas section will be revised extensively to add specific protections for streams and riparian areas.
The City of Entiat completed a critical areas regulations update in 2006.
The City of Leavenworth is also planning to update its critical areas regulations in 2009.
The City of Wenatchee just updated its critical areas regulations based on input from the Washington Department of Ecology.
As noted above in Table 3, the County has included specific buffers in its critical areas regulations for shoreline streams and lakes by current environment designation. The County will likely continue to utilize a version of that same four‐category system and the associated buffers in the revised SMP, although the assignment of a particular designation to a particular area will be revisited. Additional designations may be added to the extent required by the SMP
March 2009 Page 19
DRAFT Chelan County Shoreline Inventory and Analysis
Guidelines, such as an Aquatic environment for shoreline areas waterward of the ordinary high water mark, or as appropriate for federal or other lands.
Because each City’s critical areas regulations do not establish shoreline buffers or setbacks, they have greater flexibility in establishing a new environment designation scheme, possibly mirroring the suggested designation system presented in the SMP Guidelines. Each jurisdiction’s critical areas regulations will be included in the SMP as an appendix, likely with minor revisions necessary to meet Shoreline Management Act requirements. Each jurisdiction’s critical areas regulations will be considered in greater detail in future work phases of this Shoreline Master Program update project.
2.3 Chelan County
Comprehensive Plan: The Chelan County Comprehensive Plan 2000 (with Amendments through April 2007) guides land use and many other elements for a horizon period of 20 years.
In addition to the basic elements required by the Growth Management Act (GMA) such as land use, rural, housing, transportation, utilities, capital facilities, economic, and parks and recreation, Chelan County’s Comprehensive Plan contains optional subarea plans. Subarea plans focus on smaller geographic areas and allow the County and citizens to develop local visions for a community’s future. The County has adopted subarea plans for Sunnyslope, Peshastin, and Malaga. Other subarea plans are in draft stages, such as for Manson and Lake Chelan.
Land use designations fall into three broad categories: urban, rural, and resource. All categories can be found along waterbodies; some categories that are particularly prevalent include: commercial forest lands2, rural residential, water, and commercial agriculture. Local areas of rural resort and recreation, rural village, rural waterfront, and rural industrial area, among others, are focused in smaller areas.
Zoning Code: The Comprehensive Plan and Subarea Plans are implemented through the Development Regulations, including the Zoning Code. Title 11 of the Chelan County Code provides zoning standards that more specifically direct uses, building bulk, scale, and location, and other design considerations. The zones match the Comprehensive Plan designations.
2 “Commercial forest” lands refer to a Chelan County Comprehensive Plan future land use map designation that applies to lands with long‐term significance for forestry, whether or not commercial harvest is occurring or may occur. Much of the designated “commercial forest” areas are classified as federal Wilderness or National Park, and are protected.
Page 20 March 2009
DRAFT Chelan County Shoreline Inventory and Analysis
Floodplain Regulations: Floodplain regulations are contained within Chapter 3.20 – Flood Hazard Development and Chapter 11.84 – Frequently Flooded Areas Overlay District. Flood hazards as regulated under Chapter 3.20 are defined as “those lands which have been determined to carry the capacity of a base flood as identified by the Federal Insurance Administration.” “Frequently flooded areas” as regulated under Chapter 11.84 are defined as “[t]hose areas located within the one‐hundred‐year floodplain” as mapped by FEMA. Chapter 11.84 prohibits residential construction in floodways. New lots in frequently flooded areas are only allowed if a buildable area is available outside of the floodway, and if all improvements, including parking, are constructed outside of the floodway. Other development in frequently flooded areas must comply with Chapter 3.20 and the SMP. Chapter 3.20 contains a number of standards for developments approved in flood hazard areas, including requirements for anchoring, use of best practices in construction methods and materials, design standards for residential and nonresidential construction, limitations on fill/grading activities that would reduce the area’s ability to store or move flood water. Non‐residential encroachments into the floodway are prohibited except as certified by a professional engineer.
Shoreline Permit History: The following series of tables (Tables 4a‐4i) outlines shoreline permit history from 2000 to 2007 in unincorporated Chelan County for those waterbodies regulated as shorelines under the existing Shoreline Master Program (see Figure 1 and Tables 1 and 2 above for identification of existing shoreline jurisdictional waterbodies). The “# of Cases” column does not always match the “Permit Type” or “Description” column totals as some projects included more than one permit type, some projects had multiple components, and some projects in County or City records did not have sufficient data to determine either the permit type or the project type accurately. Single‐family homes and agricultural‐related developments historically have not been required to obtain a shoreline exemption.
Table 4a. Shoreline permit history in unincorporated Chelan County on the Entiat River.
SDP = Substantial Development Permit, SCUP = Shoreline Conditional Use Permit, SF = single-family
Table 4g. Shoreline permit history in unincorporated Chelan County on Antilon, Roses, and Wapato Lakes.
Year
# of
Cas
es
Permit Type Description
SDP
SCU
P
Rip
aria
n Va
rianc
e
Shor
elin
e Va
rianc
e
Exem
ptio
n
Doc
k
Publ
ic
Faci
litie
s &
U
tiliti
es
Antilon Lake1 2008 1 1 Roses Lake 2001 3 1 2 3
March 2009 Page 25
DRAFT Chelan County Shoreline Inventory and Analysis
Year
# of
Cas
es
Permit Type Description
SDP
SCU
P
Rip
aria
n Va
rianc
e
Shor
elin
e Va
rianc
e
Exem
ptio
n
Doc
k
Publ
ic
Faci
litie
s &
U
tiliti
es
2002 1 1 1 2003 1 1 1 2004 1 1 1 Wapato Lake 2006 2 2 2 SDP = Substantial Development Permit, SCUP = Shoreline Conditional Use Permit 1 2008 data was excluded for other waterbodies as it did not cover a complete year. Data was included for Antilon Lake as it is the only record.
Table 4h. Shoreline permit history in unincorporated Chelan County on 25-Mile, Chiwaukum, Chumstick, Ingalls, and Mission Creeks.
SDP = Substantial Development Permit, SCUP = Shoreline Conditional Use Permit
2.4 City of Cashmere
Comprehensive Plan: The City of Cashmere Comprehensive Plan “The Heart of Cashmere” (January 14, 2008, Ordinance 1117) provides for urban land use designations in the City and UGA, and addresses other important elements such as capital facilities (e.g. parks and recreation). The Comprehensive Plan may be updated no more frequently than on an annual basis.
Zoning Code: Title 18 Zoning regulates land in the city limits related to uses, building bulk, scale, and location, and other design considerations. Until land is annexed, the County is responsible for permitting in the UGA. However, the County has a Memorandum of Understanding with the City regarding the adoption and use of the City’s zoning and zoning standards for review of proposals in the City’s UGA.
Floodplain Regulations: Chapter 15.36 of the Cashmere Municipal Code addresses flood damage prevention. Under these regulations, the City applies standards to “areas of special flood hazard,” which are equivalent to the extent of FEMA’s 100‐year floodplain. General standards are provided for all types of special flood hazard areas, including requirements for anchoring, use of best practices in construction methods and materials, and design standards for residential and nonresidential construction, including manufactured homes. Additional specific standards are provided for floodways, including general
March 2009 Page 27
DRAFT Chelan County Shoreline Inventory and Analysis
prohibition on new construction, fill, and certain improvements unless certified by a professional engineer. Finally, additional specific standards are provided for “shallow flooding areas,” which generally corresponds to those areas that experience sheet flow between depths of 1 to 3 feet outside of a defined channel. Chapter 18.10E of the critical areas code contains complementary regulations for frequently flooded areas.
Shoreline Permit History: The City reports a “very low level of activity” in shoreline jurisdiction. Only a few shoreline permits have been processed in the last five years: 1) excavation work in 2003 for multi‐family development near Mission Creek, and 2) grading/use for Bethlehem Construction.
2.5 City of Chelan
Comprehensive Plan: The City of Chelan Comprehensive Plan 2007 provides for urban land use designations in the City and UGA, and addresses other important elements such as capital facilities (e.g. parks and recreation). The Comprehensive Plan may be updated no more frequently than on an annual basis.
Zoning Code: Title 17 Zoning regulates land in the city limits related to uses, building bulk, scale, and location, and other design considerations. Until land is annexed, the County is responsible for permitting in the UGA. However, the County has a Memorandum of Understanding with the City regarding the adoption and use of the City’s zoning and zoning standards for review of proposals in the City’s UGA.
Floodplain Regulations: Chapter 14.10.60E of the Chelan Municipal Code contains brief critical areas provisions for frequently flooded areas, describing the need for a sensitive areas study and for compliance with Chapter 15.10. Chapter 15.10, titled Flood Damage Prevention, is virtually identical to Cashmere’s flood regulations in Chapter 15.36, with the addition of special standards for recreational vehicles.
Shoreline Permit History: The City of Chelan has issued 94 shoreline permits in the past nine years (Table 5). Most of these permits were issued for upland structures, such as residences, and for new piers.
Page 28 March 2009
DRAFT Chelan County Shoreline Inventory and Analysis
Table 5. Shoreline Permit History in the City of Chelan since 1999.
TOTAL 94 3 16 12 9 1 22 10 11 6 57 0 0 37 SSDP = Shoreline Substantial Development Permit, SCUP = Shoreline Conditional Use Permit * Not enough information on permit types for some permits in 2007
2.6 City of Entiat
Comprehensive Plan: The City of Entiat Washington Comprehensive Land Use Plan 2007 provides for urban land use designations in the City and UGA, and addresses other important elements such as capital facilities (e.g. parks and recreation). The Comprehensive Plan may be updated no more frequently than on an annual basis.
Zoning Code: Title 18 Zoning Code regulates land uses in the City limits related to use type, building height, lot coverage, and other design considerations. Until land is annexed, the County is responsible for permitting in the UGA. However, the County has a Memorandum of Understanding with the City regarding the adoption and use of the City’s zoning regulations for review of proposals in the City’s UGA.
Floodplain Regulations: According to the Land Use Element of the City’s Comprehensive Plan, the City has identified two types of frequently flooded areas: those within the 100‐year floodplain as identified by FEMA Flood Insurance Rate Maps (FIRMs), and those that have been involved in significant flooding events but not identified by FEMA maps. The City classifies these frequently flooded areas as “Level 1: Critical Flood Areas” (development
March 2009 Page 29
DRAFT Chelan County Shoreline Inventory and Analysis
prohibited) and “Level 2: Awareness Flood Areas” (development subject to increased construction standards). According to FEMA designations, only portions of the Entiat River are identified as frequently flooded areas, none of which are located within the UGA. No areas along the Columbia River are identified because of the City’s upland proximity from the river.
The Comprehensive Plan states that development which “alters the course and flow of floodwaters and result in damages to other property owners or natural areas shall be prohibited.” Additionally, fills are not permitted in floodplain areas that would reduce floodwater storage capacity.
Shoreline Permit History: Until 2008, there has been very little shoreline permit activity in the City, and all of it has been for upland structures. However, as of October 2008, the City has received applications for five substantial development permits, four shoreline conditional use permits, and two variances. Many of these are for private piers and boatlifts. Improvement of the existing PUD/Entiat City Park, and implementation of the City’s Waterfront Plan and Entiat River Outdoor Learning Center are the primary sources of considerable future shoreline permit activity.
Table 6. Shoreline Permit History in the City of Entiat since 1999.
2001 1 1 1 1 SDP = Shoreline Development Permit, SCUP = Shoreline Conditional Use Permit
2.7 City of Leavenworth
Comprehensive Plan: The City of Leavenworth Comprehensive Plan (2003) provides for urban land use designations in the City and UGA, and addresses other important elements such as capital facilities (e.g. parks and recreation). The City continually updates its Comprehensive Plan.
Page 30 March 2009
DRAFT Chelan County Shoreline Inventory and Analysis
Zoning Code: Title 18 Zoning regulates land in the City limits related to uses, building bulk, scale, and location, and other design considerations. Until land is annexed, the County is responsible for permitting in the UGA. However, the County has a Memorandum of Understanding with the City regarding the adoption and use of the City’s zoning and zoning standards for review of proposals in the City’s UGA.
Floodplain Regulations: Chapter 14.24 of the Leavenworth Municipal Code, Flood Damage Prevention Standards, applies to areas within the City limits identified as “special flood hazard” as identified by the Federal Insurance Administration’s FIRM map for the City of Leavenworth.
As indicated in the regulations, general regulations apply to anchoring, drainage paths, construction materials and methods, utilities, subdivision proposals, and building permits. Specific standards are applied to all residential, nonresidential, manufactured homes and recreational vehicles located within special flood hazard zones. No new construction, substantial improvements or fills are permitted within zones A1‐30 and AE on the FIRM. Additionally, no new construction or substantial improvements are permitted within the floodway. The code does, however, have appeal and variance procedures for development projects that would otherwise not be permitted. In shoreline jurisdiction, the appeal and variance procedures would be dictated by the SMP.
Shoreline Permit History: Since 1999, the City has experienced minimal shoreline development activity (Table 7). Shoreline development permits have been issued for eight projects in the past nine years, all for upland structures.
Table 7. Shoreline Permit History in the City of Leavenworth since 1999.
DRAFT Chelan County Shoreline Inventory and Analysis
Year # of Cases Upland Structure
Permit Type
SDP
SCU
P
Varia
nce
Exem
ptio
n
TOTAL 8 8 6 0 2 0 SDP = Shoreline Development Permit, SCUP = Shoreline Conditional Use Permit
2.8 City of Wenatchee
Comprehensive Plan: The Planning to Blossom 2025 Wenatchee Urban Area Comprehensive Plan provides for urban land use designations in the City and UGA, and addresses other important elements such as capital facilities (e.g. parks and recreation). The Waterfront Subarea Plan is a part of the City’s Comprehensive Plan and guides the development of the Columbia River waterfront. The Comprehensive Plan may be updated no more frequently than on an annual basis.
Zoning Code: Ordinance No. 2007‐34 ‐ Zoning Code (effective November 14, 2007) regulates land in the city limits related to uses, building bulk, scale, and location, and other design considerations. Until land is annexed, the County is responsible for permitting in the UGA. However, the County has a Memorandum of Understanding with the City regarding the adoption and use of the City’s zoning and zoning standards for review of proposals in the City’s UGA.
Floodplain Regulations: Chapter 2.05 of the Wenatchee City Code (WCC) addresses flood hazard prevention. These regulations apply to lands identified as “special flood hazard areas” on the Department of Housing and Urban Development Urban Development Flood Insurance Rate Maps (FIRM). Standards for preventing flood hazards are provided for all types of special flood hazard areas located in the City, including requirements for anchoring, construction methods and materials, utilities, design standards for residential and nonresidential construction, including manufactured homes, and recreational vehicles and crawlspaces.
The Code stipulates that no new construction, substantial improvements, or other significant development actions (including fill) is permitted within “AE and A1‐30 zones with base flood elevations but no floodways” designated. The exception to this rule is a demonstration that the cumulative effect of the proposed actions will not increase the surface elevation of the base flood by more than one foot. Additional specific standards are provided for “shallow flooding areas,” which generally corresponds to those areas that experience sheet flow
Page 32 March 2009
DRAFT Chelan County Shoreline Inventory and Analysis
between depths of 1 to 3 feet outside of a defined channel. WCC 12.08.150 of the critical areas code contains complementary regulations for frequently flooded areas.
Shoreline Permit History: Wenatchee reports relatively little shoreline permit activity, primarily related to bridges, the Riverside Dock, and other public docks (Table 8). Implementation of the Waterfront Subarea Plan will lead to more shoreline permit activity.
Table 8. Shoreline Permit History in the City of Wenatchee since 1999.
Aside from the Shoreline Management Act, State regulations most pertinent to development in the Cities’ and County’s shorelines include the State Hydraulic Code, the Growth Management Act, State Environmental Policy Act, tribal agreements and case law, Watershed Planning Act, Water Resources Act, and Salmon Recovery Act. A variety of agencies (e.g., Washington Department of Ecology, Washington Department of Fish and Wildlife, Washington Department of Natural Resources) are involved in implementing these regulations or otherwise own shoreline areas. The Department of Ecology reviews all shoreline projects that require a shoreline permit, but has specific regulatory authority over Shoreline Conditional Use Permits and Shoreline Variances. Other agency reviews of shoreline developments are typically triggered by in‐ or over‐water work, discharges of fill or pollutants into the water, or substantial land clearing.
Depending on the nature of the proposed development, State regulations can play an important role in the design and implementation of a shoreline project, ensuring that impacts to shoreline functions and values are avoided, minimized,
March 2009 Page 33
DRAFT Chelan County Shoreline Inventory and Analysis
and/or mitigated. During the comprehensive SMP update, the County and Cities will consider other State regulations to ensure consistency as appropriate and feasible with the goal of streamlining the shoreline permitting process. A summary of some of the key State regulations and/or State agency responsibilities follows.
Washington Department of Natural Resources: Washington Department of Natural Resources (WDNR) is charged with protecting and managing use of State‐owned aquatic lands. Toward that end, water‐dependent uses waterward of the ordinary high water mark require review by WDNR to establish whether the project is on State‐owned aquatic lands. In Lake Chelan, for example, WDNR has authority over aquatic lands waterward of the 1079‐foot elevation. In the Columbia River, WDNR has authority over activities extending into the original (pre‐dam) channel. If WDNR has jurisdiction, the project may be required to obtain an Aquatic Use Authorization from WDNR and enter into a lease agreement. Certain project activities, such as single‐family or two‐party joint‐use residential piers, on State‐owned aquatic lands are exempt from these requirements. WDNR recommends that all proponents of a project waterward of the ordinary high water mark contact WDNR to determine jurisdiction and requirements.
Chelan County Public Utility District: Although the Chelan County PUD is not a State agency, it does act like an agency in its review and denial or approval of certain projects on the Columbia River (Rocky Reach and Rock Island Reservoirs) and in Lake Chelan (Chelan Reservoir).
• Rocky Reach Reservoir (Lake Entiat): Construction of Rocky Reach Dam began in 1956. The PUD’s “jurisdiction” over reservoir shorelines originates with “right‐to‐flood” easements, sold to the PUD by the original property owners along the river. These easements extend to elevations that were projected to be reached by a catastrophic or extreme flood event of similar magnitude to an 1894 flood. These elevations will not likely be reached by flood waters with current management of the dams consistent with USACE and Federal Energy Regulatory Commission (FERC) requirements. Based on flood‐water elevations of the 1894 flood, the original easements were obtained by the PUD. They extend up to elevations significantly higher than the reservoir’s standard operating levels. These elevations were illustrated on a set of maps labeled Exhibit K, and the maps’ elevations are now generally known as the K line. As part of the hydroelectric project relicensing in the 1990s, the PUD resurveyed and recalculated anticipated flood elevations taking into consideration more recent upstream dams and their reservoirs’ storage capacities, and illustrated newer anticipated flood elevations
Page 34 March 2009
DRAFT Chelan County Shoreline Inventory and Analysis
on a series of maps labeled Exhibit G. These newer maps show the “G line” is generally lower in elevation than the K line, except in areas near the dam, where the G and K lines both are 711 feet above sea level. (This is the lowest level for these lines, as rivers flow downhill.) Subsequent to the new designed G line some property owners (who signed a new easement agreement with the PUD) can build down to the new G line at their own risk, using the area above the G line, within the upper area of the original K line easement, for residential purposes. As part of federal requirements, portions of parcels lying below the K or G line may not be modified through grading, filling, excavating, clearing, or other activities, without written approval of the PUD and the federal agency which licenses hydroelectric projects. Exceptions are allowed for some docks or irrigation pumps, with the owner’s understanding that construction of those structures is at the owner’s risk.
• Rock Island Reservoir: Rock Island Dam was originally constructed in 1933, and then modified in 1953 and 1979. The current project boundary for the Rock Island Hydroelectric Project, as licensed with the Federal Energy Regulatory Commission (FERC), is delineated on a set of maps labeled Exhibit G. The PUD owns the majority of land within the project boundary on the Rock Island reservoir. Similar to the restrictions on the Rocky Reach Reservoir, alteration of the land within the project boundary is restricted. The PUD maintains and operates a number of parks on its land along the Rock Island Reservoir.
• Chelan Reservoir: The Chelan dam was completed in 1927, and was recently relicensed in 2006. As part of dam management, Lake Chelan is flooded, by right and by obligation, to 1,100 feet above sea level during summer months to accommodate private and public recreational uses.
Section 401 Water Quality Certification: Section 401 of the federal Clean Water Act allows states to review, condition, and approve or deny certain federal permitted actions that result in discharges to State waters, including wetlands. In Washington, the Department of Ecology is the State agency responsible for conducting that review, with their primary review criteria of ensuring that State water quality standards are met. Actions within shoreline waterbodies, or wetlands and streams within the shoreline zone that require a Section 10 or Section 404 permit (see Section 2.10 below), will also need to be reviewed by Ecology.
March 2009 Page 35
DRAFT Chelan County Shoreline Inventory and Analysis
Watershed Planning Act: The Watershed Planning Act of 1998 (Chapter 90.82 RCW) was passed to encourage local planning of local water resources, recognizing that there are citizens and entities in each watershed that “have the greatest knowledge of both the resources and the aspirations of those who live and work in the watershed; and who have the greatest stake in the proper, long‐term management of the resources.” Chelan County and partners in the County have taken advantage of the available funding for watershed planning to complete the watershed management plans for the Entiat watershed (WRIA 46) in 2004, the Wenatchee watershed (WRIA 45) in 2006, and the Stemilt/Squilchuck watershed (WRIA 40a) in 2007. The Chelan watershed does not yet have a watershed management plan, although a draft Lake Chelan sub‐basin plan was completed for the Northwest Power & Conservation Council in 2004. WRIA 40b (the Alkali Squilchuck, which includes Colockum Creek and is otherwise located primarily in Kittitas County) also does not have a watershed management plan.
Hydraulic Code: Chapter 77.55 RCW (the Hydraulic Code) gives the Washington Department of Fish and Wildlife (WDFW) the authority to review, condition, and approve or deny “any construction activity that will use, divert, obstruct, or change the bed or flow of State waters.” These activities may include stream alteration, culvert installation or replacement, pier and bulkhead repair or construction, among others. WDFW can condition projects to avoid, minimize, restore, and compensate adverse impacts.
Water Pollution Control Act: Chapter 90.48 RCW establishes the State’s policy “to maintain the highest possible standards to insure the purity of all waters of the State consistent with public health and public enjoyment thereof, the propagation and protection of wild life, birds, game, fish and other aquatic life, and the industrial development of the State, and to that end require the use of all known available and reasonable methods by industries and others to prevent and control the pollution of the waters of the State of Washington.” The Department of Ecology is the agency charged with crafting and implementing rules and regulations in accordance with this legislation.
2.10 Federal Agencies/Regulations
Federal regulations most pertinent to development in the Cities’ and County’s shorelines include the Endangered Species Act, the Clean Water Act, and the Rivers and Harbors Appropriation Act. Other relevant federal laws include the National Environmental Policy Act, Anadromous Fish Conservation Act, Clean Air Act, and the Migratory Bird Treaty Act. A variety of agencies (e.g., U.S. Army Corps of Engineers [Corps], National Marine Fisheries Service, U.S. Fish and Wildlife Service) are involved in implementing these regulations, but review by these agencies of shoreline development in most cases would be triggered by in‐ or over‐water work, or discharges of fill or pollutants into the water.
Page 36 March 2009
DRAFT Chelan County Shoreline Inventory and Analysis
Depending on the nature of the proposed development, federal regulations can play an important role in the design and implementation of a shoreline project, ensuring that impacts to shoreline functions and values are avoided, minimized, and/or mitigated. During the comprehensive SMP update, the County and Cities will consider other federal regulations to ensure consistency as appropriate and feasible with the goal of streamlining the shoreline permitting process. A summary of some of the key State regulations and/or State agency responsibilities follows.
Section 404: Section 404 of the federal Clean Water Act provides the Corps, under the oversight of the U.S. Environmental Protection Agency, with authority to regulate “discharge of dredged or fill material into waters of the United States, including wetlands” (http://www.epa.gov/owow/wetlands/pdf/ reg_authority_pr.pdf). The extent of the Corps’ authority and the definition of fill have been the subject of considerable legal activity. However, it generally means that the Corps must review and approve many activities in shoreline waterbodies, and other streams and wetlands. These activities may include wetland fills, stream and wetland restoration, and culvert installation or replacement, among others. Similar to Washington State Environmental Policy Act (SEPA) requirements, the Corps is interested in avoidance, minimization, restoration, and compensation of impacts.
Section 10: Section 10 of the federal Rivers and Harbors Appropriation Act of 1899 provides the Corps with authority to regulate activities that may affect navigation of “navigable” waters. The Columbia River and Lake Chelan are designated navigable waters. Accordingly, proposals to construct new or modify existing in‐water structures (including piers, marinas, bulkheads, breakwaters), to excavate or fill, or to “alter or modify the course, location, condition, or capacity of” these waterbodies must be reviewed and approved by the Corps.
Federal Endangered Species Act (ESA): Section 9 of the ESA prohibits “take” of listed species. Take has been defined in Section 3 as: “harass, harm, pursue, hunt, shoot, wound, kill, trap, capture, or collect, or to attempt to engage in any such conduct.” The take prohibitions of the ESA apply to everyone, so any action of the County or Cities that results in a take of listed fish or wildlife would be a violation of the ESA and exposes the County and Cities to risk of lawsuit. Per Section 7 of the ESA, activities with potential to affect federally listed or proposed species and that either require federal approval, receive federal funding, or occur on federal land must be reviewed by the National Marine Fisheries Service (NOAA Fisheries) and/or U.S. Fish and Wildlife Service (USFWS) via a process called “consultation.” As previously mentioned, a Corps permit under Section 10 of the Rivers and Harbors Appropriation Act is required for projects in Lake Chelan and the Columbia River, and Section 404 permits are required for discharges of fill material into other river, streams and wetlands
March 2009 Page 37
DRAFT Chelan County Shoreline Inventory and Analysis
within shoreline jurisdiction. Since the listing of chinook salmon, sockeye salmon, steelhead trout, and bull trout as Threatened under the ESA, the Corps, NOAA Fisheries and USFWS have jointly developed a number of Regional General Permits (RGPs) or programmatic consultations to streamline permitting of projects in waterbodies containing listed fish, including:
RGP 1: Authorizes installation, maintenance, repair, replacement, and retention of noncommercial watercraft lifts at existing residential waterfront structures.
RGP 4: Lake Chelan only, authorizes installation of float anchor piling, floats with or without access ramps, and small piers for noncommercial use, as well as discharge of fill material for minor bank stabilization projects and 10 cubic yards of material for pile footings.
RGP 5: Columbia River between Chief Joseph and Rock Island dams, authorizes maintenance, modification and construction of residential overwater structures for the purpose of watercraft moorage and water‐oriented recreational use.
Programmatic for restoration or enhancement of aquatic and associated riparian habitat, including culvert replacements (nine separate categories of work are covered). Applicable to Washington State waters, with exceptions to some categories of work on mainstem Columbia River.
Phase 1 programmatics are also available in Chelan County for:
• Placement of navigation aids and regulatory markers, including placement of buoys for such purposes.
• Placement of mooring buoys for single boat, non‐commercial use. • Placement of temporary buoys, markers, small floating docks, and
similar devices or structures that are for recreational use during specific events such as water skiing competitions and boat races.
• Replacement of up to eighteen existing piling. • Placement of new devices or replacement of old devices (with no
greater dimensions than those already in place) whose purpose is to measure and record scientific data such as staff gages, tide gages, water recording devices, water quality testing and improvement devices, and similar structures.
• Activities required for the containment (but not cleanup) of oil and hazardous substances, including placement of booms and anchors.
• Placement of up to 25 cubic yards of fill material waterward of the ordinary high water (OHW) line to meet mitigation requirements imposed by Washington State Department of Fish and Wildlife
Page 38 March 2009
DRAFT Chelan County Shoreline Inventory and Analysis
(WDFW) in association with an Hydraulic Project Approval (HPA) where all other work (the bank stabilization activity and associated stockpiling) is outside Corps jurisdiction (landward of the OHW line) and has already been constructed. (Not applicable to Columbia River mainstem)
Clean Water Act: The federal Clean Water Act has a number of programs and regulatory components, but of particular relevance to Chelan County is the National Pollutant Discharge Elimination System (NPDES) program. In Washington State, the Department of Ecology has been delegated the responsibility by the U.S. Environmental Protection Agency for managing implementation of this program. The County and the City of Wenatchee are engaged in compliance with the NPDES Phase II Municipal Stormwater General Permit requirements that address stormwater system discharges to surface waters (see Section 3.3.2 below).
3. SHORELINE INVENTORY The following discussion identifies each of the required inventory elements and sources of information for each element, and may provide a brief Countywide or watershed‐wide narrative. In this chapter discussions and calculations are broken as needed into the four Watershed Resource Inventory Areas (WRIAs) (WRIA 40a ‐ Stemilt‐Squilchuck and part of WRIA 40b located in Chelan County [Colockum Creek basin], WRIA 45 ‐ Wenatchee, WRIA 46 ‐ Entiat, and WRIA 47 – Chelan) and five Cities (Cashmere, Chelan, Entiat, Leavenworth, Wenatchee). The WRIA discussions and calculations do not include data for the incorporated Cities and their UGAs. The City discussions and calculations include each City’s UGA. Additional watershed‐, shoreline‐, or City‐specific discussions, as needed, can be found in Section 4.0, along with brief summaries of conditions in the isolated UGA communities of Peshastin and Manson.
3.1 Land Use Patterns
3.1.1 Existing and Planned Land Use Land use patterns were derived from geographic information system (GIS) data provided by County and partner cities, including County Assessor records for current land use and Comprehensive Plan designations for planned land use. The method and approach to data collection are described below:
• Unincorporated shorelines are addressed by watershed, i.e. WRIAs. City and associated Urban Growth Areas (UGAs) are addressed by jurisdiction. Each area is more specifically described in Section 4.
March 2009 Page 39
DRAFT Chelan County Shoreline Inventory and Analysis
• Assessor use types were sorted into similar categories to show current use patterns (e.g. Commercial includes retail, business services, and other related activities). Existing land use information is parcel based and relatively extensive except in government owned forested areas where data is omitted. Assessor existing land use data is not the most important piece of information in County assessments and thus it is not updated as frequently as other property information. However, it represents the best readily available information on current land use in the shoreline area3. Due to City and citizen input, current land use maps have been modified in some locations through the inventory review process, with emphasis on shoreline jurisdictional areas. Current land use was generally not updated for areas outside of shoreline jurisdiction.
• Future land use categories are based on adopted Comprehensive Plans and are reported by the category names in each City and County comprehensive plan. Future land use data is based on area‐wide classifications and include roads, resource lands (unlike Assessor data), etc., which tends to mean the future land use acres are greater than existing land use acres for the same jurisdictional area.
In the unincorporated WRIAs, the current land use patterns are predominantly rural residential, government/utility, and forestry and agriculture resource lands with exceptions – such as small towns along rivers and streams, lake communities, and some focused areas of rural industrial and rural waterfront commercial.
Relatively more urban and intensive development is found in the cities, particularly Lake Chelan (commercial, tourist, recreation), Cashmere (mixed use), and Wenatchee (utility and industrial). Some cities have extensive open space along their shorelines, such as Entiat, Leavenworth and Wenatchee, due to municipal, PUD, County, or State park lands.
Future land use designations tend to reinforce current land use patterns, but there are areas of the County that are identified for new or greater uses. Unincorporated shorelines that are in public ownership tend to be identified for resource uses such as commercial forest4 lands. Unincorporated shorelines that are in private ownership tend to be planned for rural residential, rural
3 The County has an on‐going inventory of land use data; however, the focus has been on non‐shoreline areas; therefore the Assessorʹs data was considered the best available for the SMP inventory and analysis.
4 “Commercial forest” is a Chelan County assessor designation that appears to be applied to all federal forest lands, whether or not commercial harvest is occurring or may occur. Much of the designated “commercial forest” areas are classified as Wilderness or National Park, and are protected.
Page 40 March 2009
DRAFT Chelan County Shoreline Inventory and Analysis
commercial/waterfront, or rural industrial uses. City shorelines are planned for a wider variety of activities that support their role as centers of the local community – residential at a variety of single family and multifamily densities, local and tourist oriented commercial, manufacturing/industrial, mixed use, open space and recreation. Many areas in the cities are already developed, but some are likely to see re‐development as discussed in Section 3.1.3.
As is true for nearly all developments around the world, most human settlements (both pre‐historic and historic) in Chelan County have developed along waterbodies where lands are more arable and level, water for drinking or irrigating is present, the climate is more accommodating, wildlife (for food, clothing and other uses) tend to congregate, and transportation is available (on navigable waterbodies). Maps of existing land use today are a testimony to this pattern, and location along waterbodies is still perpetuated. The developed communities are likewise connected along waterbodies by transportation and utility corridors.
3.1.2 Water-Oriented Uses According to Ecology’s SMP Guidelines (173‐26‐020 WAC), “water‐oriented use means a use that is water‐dependent, water‐related, or water‐enjoyment, or a combination of such uses.” The Shoreline Management Act promotes uses that are “unique to or dependent upon use of the Stateʹs shoreline” as well as “ports, shoreline recreational uses including but not limited to parks, marinas, piers, and other improvements facilitating public access to shorelines of the State, industrial and commercial developments which are particularly dependent on their location on or use of the shorelines of the State and other development that will provide an opportunity for substantial numbers of the people to enjoy the shorelines of the State.” (RCW 90.58.020)
Definitions and examples of water‐oriented uses are included in Table 9 below.
Table 9. Water-Oriented Uses Definitions and Examples.
Water-Oriented Use Definitions Water-Oriented Use Examples "Water-dependent use" means a use or portion of a use which cannot exist in a location that is not adjacent to the water and which is dependent on the water by reason of the intrinsic nature of its operations. (WAC 173-26-020(36))
Examples of water-dependent uses may include ship cargo terminal loading areas, ferry and passenger terminals, barge loading facilities, ship building and dry docking, marinas, aquaculture, float plane facilities, sewer outfalls, and water diversion facilities, such as agricultural pumphouses.
"Water-related use" means a use or portion of a use which is not intrinsically dependent on a waterfront location but whose economic viability is dependent upon a waterfront location because: (a) The use has a functional requirement for a
Examples of water-related uses may include warehousing of goods transported by water, seafood processing plants, hydroelectric generating plants, gravel storage when
March 2009 Page 41
DRAFT Chelan County Shoreline Inventory and Analysis
Water-Oriented Use Definitions Water-Oriented Use Examples waterfront location such as the arrival or shipment of materials by water or the need for large quantities of water; or
(b) The use provides a necessary service supportive of the water-dependent uses and the proximity of the use to its customers makes its services less expensive and/or more convenient. (WAC 173-26-020 (40))
transported by barge, oil refineries where transport is by tanker, log storage, and (potentially) agriculture and agriculturally related water transportation systems.
"Water-enjoyment use" means a recreational use or other use that facilitates public access to the shoreline as a primary characteristic of the use; or a use that provides for recreational use or aesthetic enjoyment of the shoreline for a substantial number of people as a general characteristic of the use and which through location, design, and operation ensures the public's ability to enjoy the physical and aesthetic qualities of the shoreline. In order to qualify as a water-enjoyment use, the use must be open to the general public and the shoreline-oriented space within the project must be devoted to the specific aspects of the use that fosters shoreline enjoyment. (WAC 173-26-020 (37))
Primary water-enjoyment uses may include, but are not limited to, parks, piers and other improvements facilitating public access to the shorelines of the State; and general water-enjoyment uses may include, but are not limited to restaurants, museums, aquariums, scientific/ecological reserves, resorts/hotels (as part of mixed use development or with significant public access or restoration components), and mixed-use commercial/office.
Based on a review of County Assessor records, the current use categories that were considered most likely to meet the definition of water‐oriented uses were selected as follows:
• Agriculture • Hotels/Motels • Marine Craft Transportation • Open Space • Parks • Recreational Activities • Resorts and Group Camps • Retail Trade‐Eating/Drinking
In addition to these categories, wastewater treatment plants have been identified based on available information from the cities of Cashmere and Leavenworth; more sewer information is provided in Section 3.3.1, and on sewer maps. In addition, in the City of Chelan, two zoning districts encompass existing water‐oriented uses, Waterfront Commercial and Tourist Accommodations, and those zones are identified as water‐oriented.
In the unincorporated portions of the County, much of the potential water‐oriented uses are agricultural. Agriculture is considered a potential water‐oriented use where the shoreline waterbody provides a source of water to the crops or other agricultural product. Also, many orchardists along shoreline
Page 42 March 2009
DRAFT Chelan County Shoreline Inventory and Analysis
waterbodies have indicated that they are sited near the water to take advantage of the riparian microclimate that is important to agricultural operations, such as mediating temperatures.5
Recreation and group camp water‐oriented uses tend to be located on the major rivers and lakes in the County, such as the Columbia River, Wenatchee River, Lake Wenatchee, and Lake Chelan.
More urban examples of water‐oriented uses, including hotels/motels and eating/drinking places, are found in the cities as well as in compact rural areas.
Fish hatcheries are another active, water‐oriented use found on many of Chelan County’s shorelines. Chelan County PUD operates the Rock Island Fish Hatchery Complex, which includes the central hatchery on the Columbia River at Rock Island Dam, and satellite sites on the Wenatchee and Chiwawa Rivers and on Lake Wenatchee. The complex produces spring and summer Chinook salmon, sockeye salmon, and steelhead trout.
The U.S. Fish and Wildlife Service operates the Leavenworth National Fish Hatchery, which includes sites on the Icicle River, 2 miles south of Leavenworth, and on the Entiat River, 6 miles southwest of the City of Entiat. The current target species for the Icicle and Entiat facilities is spring Chinook salmon. The Confederated Tribes of the Colville and the Yakama Indian Nation are both partners of the Leavenworth National Fish Hatchery.
WDFW has four active fish hatchery facilities in the Chelan County area, known collectively as the Eastbank Complex. The Eastbank Fish Hatchery is located on the Douglas County‐side of the Columbia River near Rocky Reach Dam, and includes five satellite facilities. The hatchery supplements Lake Wenatchee sockeye, Wenatchee River summer Chinook (planted at Dryden Pond), Chiwawa River spring and summer chinook (planted at Chiwawa Pond). The Chelan Fish Hatchery is located along the Columbia River on Beebe Springs Creek. The
5 Washington Apple Country Tours reports that “The topography surrounding the lake [Lake Chelan] creates something of a ʹmicro‐climateʹ along the lakeshore which moderates the temperatures during the colder months of winter and the hotter months of summer.” (http://www.appleorchardtours.com/hist01.htm). Tiny’s Orchards in East Wenatchee is close to the Columbia River in Douglas County “in a superb microclimate with weather conditions ideal for growing stone fruit ...” The orchardist reports that this particular location has “only experienced frost and/or extreme cold conditions or hail or damaging winds only a couple of times since …1979.” The other orchard location is close to the airport in East Wenatchee and temperatures in this location away from the river generally “run 5 to 10 degrees cooler than at the lower river elevation.” See http://www.ilovetiny.com/OurFarmandHarvestDates.aspx. While in Douglas County, Tiny’s fronts the Columbia River, a shared shoreline waterbody with Chelan County. Attendees at several shoreline visioning workshops verbally corroborated the relationship between shoreline microclimate and orchard location.
DRAFT Chelan County Shoreline Inventory and Analysis
hatchery produces German brown, eastern brook, kokanee, rainbow and cutthroat trout for distribution in the Columbia basin.
3.1.3 Developing or Redeveloping Waterfronts This inventory compiles several sources of information to characterize which shorelines are likely to see new development or redevelopment. The data includes local government land use plans, Assessor information regarding parcels without buildings, and permitting activity in the recent past.
Local plans contain the vision and strategies for waterfront redevelopment. The two cities with the most ambitious waterfront plans include Entiat, which is anticipating 18 acres of commercial, tourist, and mixed uses, and Wenatchee with its Waterfront Subarea Plan where a mostly industrial waterfront is planned to change to a mixed use area with nodes. The Wenatchee Waterfront Subarea Plan provides guidance for how this redevelopment will occur. Most of the redevelopment activity will take place outside of shoreline jurisdiction as a large percentage of the Columbia River frontage in the Wenatchee Waterfront Subarea Plan is already developed with PUD parks and the railroad corridor.
All of the WRIAs are likely to see additional rural residential growth as well, since aside from resource lands, rural residential categories are applied most frequently in unincorporated Chelan County. Other areas in the County likely to see new or redevelopment include WRIA 40a/b Stemilt‐Squilchuck, where manufacturing/industrial uses account for 3 percent of the existing shoreline uses, but are planned for rural industrial use of 22 percent of the shoreline, primarily along the Columbia River between Malaga and Alcoa.
All of the jurisdictions have shorelines with numerous parcels lacking buildings. These parcels include vacant properties and properties in a use that does not require buildings, such as parcels with extensive forestry, agriculture, or government activities. These properties without structures could see shoreline permits for new structures or improvements in the future. However, a review of permitting indicates that most shorelines have not seen rapid development with the exception of Lake Chelan, Lake Wenatchee, Wenatchee River, and a few others (see Tables 4‐8 in Section 2.3 through 2.8).
3.2 Transportation
As outlined below, there are several State and federal highway road sections and railroad corridors in Chelan County that either parallel, cross, or are otherwise located in existing or future shoreline jurisdiction.
• U.S. Highway 2 frequently crosses or parallels shoreline jurisdiction along a majority of the Wenatchee River between Lake Wenatchee
Page 44 March 2009
DRAFT Chelan County Shoreline Inventory and Analysis
and the City of Wenatchee. The highway also crosses Nason Creek between Stevens Pass and the SR 207 junction, as well as Chiwaukum Creek a few miles south of the SR 207 junction.
• U.S. Highway 97 between Peshastin and Blewett Pass crosses or parallels shoreline jurisdiction along Peshastin Creek between the 20 cfs point just south of Ingalls Creek and the U.S. Highway 2 junction. The highway also crosses the Columbia River just north of Chelan Falls.
• Alternate U.S. Highway 97 (97a), between the City of Wenatchee and Lake Chelan, parallels the Columbia River and Lake Chelan shoreline jurisdictions, as well as crossing the Entiat River at the confluence with the Columbia. The highway, known as East Woodin Avenue within the City of Chelan, crosses the south end of Lake Chelan.
• SR 207 crosses or parallels shoreline jurisdiction along Nason Creek between SR 207 and near the mouth of the creek at Lake Wenatchee.
• SR 209 (Chumstick Highway) crosses or parallels shoreline jurisdiction along Chumstick Creek between the 20 cfs point just north of Spromberg Canyon Road (County Rd. 694) and the confluence with the Wenatchee River.
• SR 285 crosses shoreline jurisdiction at the Wenatchee River Bridge just west of the confluence with the Columbia River and also at the Columbia River Bridge between the cities of Wenatchee and East Wenatchee.
• SR 971 (S. Lakeshore Road) parallels shoreline jurisdiction between Twenty‐Five Mile Creek State Park and Alternate U.S. Highway 97 just west of Chelan City limits.
• The Malaga Alcoa Highway (actually a County road) also parallels the Columbia River south of Wenatchee to the County line, and is within shoreline jurisdiction in a few areas.
• Burlington Northern Santa Fe (BNSF) rail lines parallel the Columbia River and the Wenatchee River. A main track line runs along the south bank of the Wenatchee River from the western County limits to the City of Wenatchee, and then south along the west shore of the Columbia River.
• A RailAmerica, Inc. subsidiary named Cascade & Columbia River Railroad operates a line parallel to the Columbia River from Wenatchee north to Oroville. In Chelan County, the line has interchange stations at Wenatchee, Rocky Reach, Entiat, Chelan Falls, Brewster, Pateros, and Chief Joseph.
These major transportation corridors have had and continue to have a variety of affects on watershed processes and shoreline function by limiting channel migration, interfering with natural recruitment of gravels and woody debris,
March 2009 Page 45
DRAFT Chelan County Shoreline Inventory and Analysis
eliminating or minimizing riparian vegetation, constricting flows, and providing a source of pollutants such as hydrocarbons and heavy metals. The remainder of the transportation corridors within shoreline jurisdiction is county, city, local access or private roads, and driveways. These roadways can have similar impacts on processes and functions, but generally on a smaller scale.
The Wenatchee Valley Transportation Council (WVTC) is the Metropolitan Planning Organization (MPO) consisting of nine State and local agencies that work within the greater Wenatchee Valley area. This group, along with the North Central Regional Transportation Planning Organization (NCRTPO), which consists of all communities located within Okanogan, Chelan, and Douglas Counties and the Confederated Tribes of the Colville Nation, coordinates long‐range transportation planning projects in the region. Typically, federal law requires MPOs to submit a transportation improvement program annually, while the NCRTPO is required by State law to submit a regional transportation improvement program every two years. The partnership between the WVTC and NCRTPO has developed the North Central Washington Regional Transportation Improvement Program (NCW RTIP), the most recent of which is the 2008‐2013 NCW RTIP. The NCRTPO is already planning an update.
• There are 10 federally funded Urban transportation projects identified in the NCW RTIP that are located within the Wenatchee urban area of Chelan County, three of which are either partially or fully within shoreline jurisdiction. These include bridge repairs, paving, and a congestion relief study.
• There are 26 federally funded Rural transportation projects identified in the NCW RTIP that are located in rural areas of Chelan County, 3 of which are fully within shoreline jurisdiction. The three projects within shoreline jurisdiction are the Chelan River Bridge within the City of Chelan, the Old Blewett Bridge #1 replacement south of U.S. Highway 2, and the Wenatchee River Bridge replacement along Highway 2 near the City of Cashmere.
• In addition to the fully funded projects listed above, there are 72 planned projects within Chelan County that are currently unfunded. None of these projects are confirmed to be within or outside of shoreline jurisdiction as information and specific map locations are currently unavailable.
The County is currently planning an update of the transportation element of its Comprehensive Plan, including a prioritized list of transportation projects (motorized and non‐motorized) that compiles the work in the Chelan County Six‐Year Transportation Improvement Program (2007‐2012) and, where appropriate,
Page 46 March 2009
DRAFT Chelan County Shoreline Inventory and Analysis
regional plans/projects. Shoreline projects are planned for 10 sub‐areas as outlined briefly below:
• Cashmere/Monitor Sub‐Area: Improvements to three bridges over the Wenatchee River, roadway improvements to Sleepy Hollow Road and Sunset Highway, other intersection and roadway improvements
• City of Chelan and Chelan Sub‐Area: non‐motorized improvements along U.S. 97A and SR 150, bridge improvement across the Chelan River, intersection improvements
• Entiat Sub‐Area: roadway improvement along Entiat River Road, just upstream of the City of Entiat
• City of Leavenworth and Leavenworth Sub‐Area: roadway improvements to East Leavenworth Road along Wenatchee River and along and across Icicle Creek, roadway improvement along US 2, road improvements along North Road across Chumstick Creek
• Malaga sub‐area: roadway improvements to West Malaga Road near the Columbia River, Cortez Lake and Meadow Lake
• Manson sub‐area: roadway improvements to South Lakeshore Road/SR 971, road improvements to Manson Boulevard along Lake Chelan, road improvements to South Quetilquasoon Road
• Peshastin/Dryden sub‐area: Improvements to two bridges over the Wenatchee River, improvements to North Road
• Plain/Lake Wenatchee sub‐area: Improvements to Chiwawa Loop Road/Chumstick Highway along Wenatchee River and along and crossing Chiwawa River
• Sunnyslope sub‐area: Roadway improvements to Sleepy Hollow Road along and crossing the Wenatchee River, non‐motorized improvements leading to Columbia River south of bridge to East Wenatchee
The City of Leavenworth is considering pedestrian/bike bridge crossing improvements on Highway 2 and Icicle Road over the Wenatchee River.
The NCRTPO is working on an update of the Regional Transportation Plan.
3.3 Utilities
3.3.1 Wastewater General Information Sources
Basic information about wastewater facilities and programs was derived from meeting notes with City staff, Chelan County Comprehensive Plan, Chelan County PUD website, Washington Department of Ecology website, Lake Chelan Reclamation District website, City of Wenatchee website, City of Wenatchee
March 2009 Page 47
DRAFT Chelan County Shoreline Inventory and Analysis
Comprehensive Plan, City of Cashmere Comprehensive Plan, City of Leavenworth Comprehensive Plan, City of Chelan Comprehensive Plan, City of Entiat Comprehensive Plan, and data provided by the Washington Department of Health.
Chelan County
While a majority of Chelan County consists of on‐site (septic) wastewater treatment, there are a number of wastewater facilities located throughout the County. Chelan County Public Utility District (PUD) provides wastewater services for three geographic areas: Lake Wenatchee, Peshastin and Dryden. According to Chelan County PUD, these three wastewater systems provide service to approximately 450 residential and commercial customers. In addition to the three systems listed above, Chelan County PUD will also provide services to the Sunnyslope and Olds Station areas, which will serve approximately 46 customers and discharge into the City of Wenatchee’s collection system.
Lake Chelan Reclamation District (LCRD) provides wastewater collection and transmission service in the Manson area from Willow Point to Rocky Point. A series of lift stations and 15 miles of collection and transmission lines send wastewater to the City of Chelan’s Wastewater Treatment Plant. According to the LCRD website, it is one of two reclamation districts in the State of Washington to provide wastewater treatment. The LCRD expects that planned costs of improvements within the district over 20 years will be $8.2 million (Maul Foster Alongi 2008).
The Lake Chelan Sewer District (LCSD) serves over 700 customers to the south shore residents outside of the City of Chelan. According to the Lake Chelan Regional Strategic Action Plan (Maul Foster Alongi 2008), it is unknown how many miles of collection pipe are within the LCSD. However, the LCSD operates 5 miles of force main and five lift stations. LCSD cost for systems improvements over 20 years is expected to be $31.4 million.
The Stevens Pass Sewer District serves the Stevens Pass area (resort and nearby private cabins and lodges) in Chelan and King Counties. According to the Stevens Pass website (http://www.stevenspass.com/Stevens/the‐mountain/green‐commitment‐other.aspx), wastewater is treated by a “State‐of‐the‐art…membrane bioreactor (MBR) wastewater system. The new treatment system produces a high‐quality effluent that exceeds all Washington Department of Ecology requirements and addresses important secondary objectives like simplicity of operation and accommodation of variable flows, remote sensing, and monitoring.” The treated wastewater is discharged into Nason Creek.
The Washington Department of Health has a record of 25 “large on‐site sewage systems” (LOSS) in Chelan County. The majority of the sites (11) are park‐
Page 48 March 2009
DRAFT Chelan County Shoreline Inventory and Analysis
related, and serve State parks like Lake Chelan State Park, RV parks, campgrounds, and County parks, including the Chelan County fairgrounds. Six of the LOSS sites serve residential communities, including several mobile home parks and farm worker housing. Public facilities (schools, Rocky Reach Dam, rest areas) and commercial uses (fruit co‐op, restaurant, resorts) each contribute six LOSS sites to the total. These sites have not been mapped, but many are likely in or very close to shoreline jurisdictions of Lake Chelan, Columbia River, Nason Creek, Twentyfive Mile Creek, Wenatchee River, and others.
City of Cashmere
The City of Cashmere provides wastewater service to all residents within the City limits and portions of the UGA. According to the City’s Comprehensive Plan, the City operates both a Class 2 aerated wastewater stabilization pond plant as well as a pre‐treatment industrial bulk volume fermenter (BVF) plant. The existing wastewater treatment plant discharge flows average approximately 350,000 gallons per day. Prior to 2007, Tree Top, Inc. was the City’s largest commercial user. However, they ceased operations in 2007 and have no current plans to resume operations. Currently, the City’s largest commercial user is Crunch Pak, which discharges its wastewater into Cashmere’s wastewater collection system directly to wastewater lagoons. Both the City and Crunch Pak have been working on a solution to pipe Crunch Pak’s wastewater to the BVF. Crunch Pak’s apple solids are hauled off by large truck and deposited on local orchards as organic fertilizer.
The City has indicated that the lagoon treatment plant, which was originally built in the 1970s, is out of compliance with the Department of Ecology. Due to an expansion of the City’s UGA and an increased demand for wastewater services, the City is required by Department of Ecology to update its lagoon system. The City’s NPDES permit (which authorizes discharge of up to 900,000 gallons per day) expires November 30, 2010. The City is planning on constructing a new wastewater treatment facility, along with other improvements to a number of gravity and force mains. A plan of this facility was sent to Ecology in the summer of 2008 for review, and construction is expected to begin early in 2010.
City of Chelan
The City of Chelan operates two wastewater treatment facilities, a primary and secondary plant, and serves residents within the City limits, the City’s UGA, and surrounding areas. According to the City’s Comprehensive Plan, the treatment plants are unique in that they treat not only wastewater from domestic and commercial users, but also stormwater as well. The City operates and maintains 16 pumping stations and over 1,500 miles of sewer lines. Staff has indicated that the secondary plant may be removed once the primary treatment plant is
March 2009 Page 49
DRAFT Chelan County Shoreline Inventory and Analysis
expanded. The City of Chelan’s wastewater treatment facilities have been the recipient of Ecology’s “Outstanding Wastewater Treatment Plantʺ award several times, most recently in 2006. The award is issued to treatment plants that have perfect compliance with their wastewater discharge permits. New development in City limits is required to connect to the City’s sewer system, and developments within the UGA are also encouraged to hook up. The City of Chelan expects improvements over six years will reach $11.8 million, with costs over 20 years of $40.7 million (Maul Foster Alongi 2008).
City of Entiat
As of 2008, the City of Entiat is building a new wastewater treatment plant (south of Waterfront Plan area), as well as upgrading five of the City’s six pump stations. The City has three gravity lift stations that serve the network and pump waste back to the wastewater treatment plant (Whitehall, pers. comm., August 2008). Only a few areas in the southwest City limits and the UGA are not served by sewer. Once properties redevelop, they will be required to be connected to the City’s wastewater treatment network provided it is economically and logistically feasible. The City of Entiat’s wastewater treatment facility earned Ecology’s “Outstanding Wastewater Treatment Plantʺ for the first time in 2007.
City of Leavenworth
According to the City’s Comprehensive Plan, there are over 46,000 feet of gravity lines throughout the City’s wastewater network that serves areas within City limits and the UGA. Three lift stations and two interceptor/trunk lines serve the system. According to wastewater system maps maintained by the City of Leavenworth’s consultant, there are only a few sewer lines within shoreline jurisdiction. One of the lines parallels the Wenatchee River in shoreline jurisdiction west of the US 2 bridge on the north side of the river, and another segment crosses the bridge from the south side of the river.
According to City staff, there was a failure in a sewer line paralleling the north bank of the Wenatchee River. This was scheduled to be replaced in phases (approximately 800 feet in length) during the summer of 2008.
The City has had wastewater treatment plant capacity issues in the past due to short‐term high‐inflow of stormwater entering the system. This issue has since been resolved. Depending on the results of Total Maximum Daily Load Requirements (TMDL) development related to phosphorus discharges into the Wenatchee River (see Section 3.11 below), expansion of the treatment plant might be needed. Otherwise, expansion will not be needed for some time.
Page 50 March 2009
DRAFT Chelan County Shoreline Inventory and Analysis
City of Wenatchee
The City of Wenatchee provides wastewater services to residents within the City limits, residents within Olds Station north of the Wenatchee River Bridge, and areas within the UGA boundary of Sunnyslope. The City has one treatment plant located in downtown Wenatchee along the shores of the Columbia River. In order to reduce the number of pollutants that enter the treatment plant, the City utilizes a pre‐treatment program to remove contaminants prior to entering the system. As mentioned previously, the Sunnyslope and Olds Station areas are provided wastewater services under a revenue sharing agreement with Chelan County. In 2006, the City updated its General Sewer Plan, which identifies specific details about the wastewater network.
3.3.2 Stormwater General Information Sources
Basic information about County and City stormwater management was derived from Chelan County Comprehensive Plan, City of Wenatchee website, and meeting notes with City and County staff.
Chelan County
In February 2007, the Department of Ecology issued the Eastern Washington Phase II Municipal Stormwater Permit under the federal NPDES and the State Waste Discharge General Permit for Discharges from Small Municipal Separate Storm Sewers [MS4s] in Eastern Washington. For those jurisdictions to which the permit applies, coverage must be sought under the permit in order to comply with provisions of the State of Washington Water Pollution Control Law and the Federal Water Pollution Control Act (the Clean Water Act). In Chelan County, the two entities that require permit coverage because of their urban density are Chelan County and the City of Wenatchee.
Under the conditions of the permit, the MS4s must protect and improve water quality through public education and outreach, detection and elimination of illicit non‐stormwater discharges (e.g., spills, illegal dumping, wastewater), management and regulation of construction site runoff, management and regulation of runoff from new development and redevelopment, and pollution prevention and maintenance for municipal operations. Construction activities and “new development and redevelopment projects that result in a land disturbance of equal to or greater than one acre and construction activities and projects less than one acre that are part of a larger common plan of development or sale” that discharge their stormwater runoff into a permitted MS4 must comply with requirements of the MS4 established for purposes of reducing the pollutant load.
March 2009 Page 51
DRAFT Chelan County Shoreline Inventory and Analysis
Chelan County adopted a stormwater utility in January 2008 to manage stormwater needs in developing areas around Wenatchee and outside of the City limits. Service fees paid by owners of developed properties will fund implementation of neighborhood improvements, maintenance, development review, utility administrative services, field inspection, and regulatory compliance.
For surface water control, treatment, and regulation, the County currently follows its 1997 Storm Drainage Standards and Guidelines and recommends utilizing Washington State Department of Ecology Stormwater Management Manual for Eastern Washington. These guidelines, which are intended to reduce stormwater impacts, implement practices that protect the health, safety and welfare of the general public.
Wenatchee Valley Stormwater Technical Advisory Committee
In April 2006, the Wenatchee Valley Stormwater Technical Advisory Committee (WVSTAC) was established through an interlocal agreement with Chelan County, Douglas County, the City of East Wenatchee and the City of Wenatchee. According to the City of Wenatchee website, the goal of the committee is to develop a regional stormwater program and meet the requirements of the Eastern Washington Phase II Municipal Stormwater Permit. This permit requires public involvement through education, outreach and participation, illicit discharges shall be detected and eliminated, construction site stormwater runoff must be controlled, stormwater management shall be implemented for new and redeveloped properties, municipal facilities shall be reduce pollution, implementation of TMDLs and stormwater monitoring.
As part of the WVSTAC’s role in public involvement, the Public Involvement, Education and Outreach Plan was developed in February 2008. In addition, the Wenatchee Valley Stormwater Program Development Steering Committee was formed, which includes elected officials, private citizens, business owners and community stakeholders. Through the review of program elements, public education and recommendations to local jurisdictions, the Committee is tasked with protecting the water quality in the Wenatchee Valley urbanized area.
In May 2008, the Wenatchee Valley Stormwater Management Program was completed. This document will be reviewed and updated annually in accordance with the NPDES permit.
City of Wenatchee
The City of Wenatchee’s stormwater system includes a series of catch basins and stormwater pipes that divert stormwater to 14 separate outfalls along the Columbia River. The system, originally installed in 1952, includes over 100 miles of drainage pipe. In 1994, the City’s stormwater utility was formed. As a
Page 52 March 2009
DRAFT Chelan County Shoreline Inventory and Analysis
member of WVSTAC, the City is working together with other member cities to meet the NPDES permit requirements.
According to the City’s Comprehensive Plan, the City is considering alternative methods for stormwater treatment, including low‐impact development. Additionally, the City is also considering filtering stormwater through wetlands, re‐using stormwater for irrigation, and educational efforts about the effects stormwater has on water quality.
City of Cashmere
Most of the City is served by a stormwater drainage system. Extensions to the existing system are typically the responsibility of a developer. In the near future, the City of Cashmere will be evaluating the stormwater system in order to comply with the Department of Ecologyʹs Phase II Stormwater Management Regulations. The City uses the Washington State Department of Ecology Stormwater Management Manual for Eastern Washington.
City of Chelan
According to the City’s Comprehensive Plan, the City uses surface and subsurface stormwater collection methods. All major roads contain a subsurface drainage system and discharge to Lake Chelan. As of 2008, the City does not have a stormwater management plan. However, the City uses the Washington State Department of Ecology Stormwater Management Manual for Eastern Washington.
City of Entiat
Stormwater conveyance is relatively new within the City, with older developments mainly consisting of swales, roadside ditches, catch basins and large detention ponds. Today, developments within the City limits and UGA are constructed with curb and gutter. According to City staff, there are no plans for a Citywide drainage system, although the City plans to construct several small mini‐parks within shoreline jurisdiction that will be utilized as detention ponds. Each of these ponds will be located at least 10 feet above the Columbia River banks, and evaporation of contained water is very likely before any would be discharged into the Columbia River. New development is subject to standards in Washington State Department of Ecology Stormwater Management Manual for Eastern Washington.
City of Leavenworth
The City of Leavenworth’s stormwater system includes a series of catch basins and drainage pipes that divert stormwater to seven outfalls to the Wenatchee River. Most of the development within the City treats stormwater via oil and water separators before being diverted into waterbodies. Many of the larger projects have detention on‐site, which is often required for new development.
March 2009 Page 53
DRAFT Chelan County Shoreline Inventory and Analysis
According to the City’s Comprehensive Plan, there are a number of roadways within the City that do not properly drain. The City’s Downtown Master Plan has ten phases or projects, including re‐engineering of roads to avoid drainage problems.
The City was the first to adopt the Washington State Department of Ecology Stormwater Management Manual for Western Washington, and then adopted the Eastern Washington manual once it became available. The City will be creating a Stormwater Master Plan in 2009, and investigating creation of a stormwater utility.
3.3.3 Water Supply General Information Sources
Basic information about County and City water supplies was derived from County and City comprehensive plans and water system plans, Chelan County PUD website, water district websites, and the Lake Chelan Reclamation District (LCRD) website.
Chelan County PUD
A majority of the County’s drinking water is supplied by Chelan County PUD. The District assumed ownership of water operations in 1974 after Wenatchee Valley Water Company was unable to finance system improvements. Today, there are nine water systems that the District operates.
In 1979, the District entered into an agreement with the City of Wenatchee for joint development of a regional water supply system using a groundwater aquifer near Rocky Reach Dam. The system, which includes the aquifer, regional wells and water mains, was brought into operation in 1983 and is operated by the City of Wenatchee. The City provides wholesale water to the PUD, who then provides the water to their customers. East Wenatchee Water District, located in Douglas County, became a partner with the District in 1998, and today all residents in the greater Wenatchee area are served by one regional water system. The District also provides water to the Sunnyslope, Olds Station, Monitor, and western and southern boundaries of the greater Wenatchee areas. Improvements are continually being made to improve service in outer service areas. Four other systems operated by Chelan County PUD include Chelan Falls, Chelan Ridge, Olalla Canyon, and Dryden (LCRD website).
During summer 2008, the PUD extended drinking water service to the Monitor community from the Sunnyslope area. The new line crossed the Wenatchee River, mounted underneath the Monitor Bridge.
Page 54 March 2009
DRAFT Chelan County Shoreline Inventory and Analysis
Lake Chelan Reclamation District (LCRD)
The LCRD began services to the Manson area in 1922. Expansions in 1974 and 1982 brought the service area to existing levels, and a treatment plant was completed in 1998. Currently, LCRD provides services to over 5,500 residents. The majority of the customers in the District are rural residential and agricultural.
In 1920, LCRD assumed irrigation assets of the Lake Chelan Water Company. As part of the acquisition, over 4,300 acres of its 6,800 acres was irrigable. Also included was 14 miles of collection lines between Big Grade Creek and Antilon Reservoir, a partially completed distribution system and Wapato Lake Reservoir.
During several decades of expansions and debt repayment, the LCRD’s service area steadily expanded. In 1955, LCRD asked the U.S. Bureau of Reclamation for rehabilitation of the district’s gravity collection and distribution network. Chief Joseph Dam Irrigation project was approved in 1966 by Congress as an alternative to the original request for service area expansion a decade earlier. Once the dam and irrigation project was completed in 1975, the system served over 6,300 acres (LCRD website).
LCRD facilities include:
• Two intakes from Lake Chelan • Water treatment plant which capacity is 4 million gallons per day • Approximately 1,360 year‐round connections, with peak tourist
population of 3,500 connections during summer
LCRD project connections will reach over 2,220 in 2025, with estimated peak connections of approximately 5,700. Over $2.2 million is the expected cost for water system improvements within six years, and over $7.0 million in the next 20 years (Maul Foster Alongi 2008).
Malaga & Three Lakes Water Districts
The Malaga Water District consists of several small water systems that currently have just over 300 connections. The District is located along the Malaga‐Alcoa Highway, and consists of the Three Lakes Water District, Stemilt and the Stemilt Irrigation District domestic system. The Three Lakes Water District is located on Tract B of the Three Lakes subdivision. Additional demand has been requested over the last decade requiring permits from the Department of Ecology.
City of Cashmere
The City of Cashmere provides domestic water services to the City and some of the UGA and the Warner flats area located within the County for nearly eighty years. The Warner flats water service area consist of approximately thirty homes
March 2009 Page 55
DRAFT Chelan County Shoreline Inventory and Analysis
and one commercial business bakery located adjacent to Highway 2/97 near Old Monitor Road. The City’s chlorinated water supply is provided by two groundwater wells (Kennedy and Sherman Reservoirs) and the Wenatchee River source, which flows through a slow sand filter treatment plant. Water storage is provided by two (2) reservoirs (Kennedy and Sherman Reservoirs) that have a total capacity of 3.0 million gallons. In addition, the Cashmere water system has four pressure zones with seven pressure‐reducing stations, one booster pump station, and approximately 16 miles of main. There are also a number of land uses in the UGA that are served by individual wells. According to the Department of Ecology, the City’s water rights are limited to an annual total use of 1,452 acre‐feet (473,135,000 gallons). The City has utilized 1,352 acre‐feet, an additional 48 have been dedicated to new developments, and 52 remain unallocated. The City currently has a water moratorium on water right connects and extensions within the UGA.
The City of Cashmere adopted, in 2003, a Comprehensive Water System Plan establishing policies, standards, inventory, projected water needs, and recommendations for operations and conservation of water resources. The 2001 Comprehensive Water System Plan includes a detailed description and analysis of proposed improvements to the Cityʹs water system. In general the six‐year projects include implementation of an annual water main replacement program and a conservation/leak detection program, water main extensions, the addition of a new pressure reducing station, and installation of a new telemetry system. In 2009‐2010, the City of Cashmere will update its Comprehensive Water System Plan, which is required every seven years.
City of Chelan
The City of Chelan Water System operates a water filtration plant, ten reservoirs, and a water distribution system that supplies water to over 4,000 residents inside and outside the city limits. The water system also supplies water to the Chelan River and Isenhart Irrigation Districts. The City last updated its Comprehensive Water System Plan in 1993, which provides specific details regarding its water system and necessary improvements.
City of Chelan water facilities include:
• One intake from Chelan River • One raw water reservoir totaling 275,000 gallons • Three treatment plant reservoirs totaling 1.4 million gallons • Seven other finished water reservoirs totaling 1.1 million gallons • Water treatment plant which serves 0.5 to 2.5 million gallons per day • 30 miles of distribution pipe (Lower Lake Chelan Regional Strategic
Action Plan – Preliminary Draft 2008).
Page 56 March 2009
DRAFT Chelan County Shoreline Inventory and Analysis
City of Entiat
The City of Entiat Water System provides water service to all City residents. The Entiat Irrigation District provides water to all land within the UGA. According to City staff, the Irrigation District’s water rights will likely be absorbed by the City and converted to potable water once surrounding orchards have been redeveloped as either residential or commercial development (Personal communication, Whitehall 2008).
According to the 2001 Comprehensive Water System Plan, recent accomplishments include implementation of an annual water main replacement program and conservation/leak detection program, water main extensions, the addition of a new pressure reducing station, and installation of a new telemetry system.
City of Leavenworth
The City of Leavenworth Water System supplies water to residents within city limits, within the City’s UGA, and in some instances outside the UGA. The water supply system consists of supply, storage, treatment, transmission and storage facilities, which serve over 1,200 residential and commercial customers. The water supply is from two wells in the City and surface water withdrawals at a plant on the Icicle River outside of City limits and the UGA. According to the City of Leavenworth Comprehensive Plan, the City needs to complete a number of system improvements in order to accommodate for future growth within the City and UGAs. This includes additional distribution and transmission pipes.
City of Wenatchee
The City of Wenatchee and its UGA are supplied with water by the City of Wenatchee in its service area and Chelan County PUD in its service area. The City serves approximately 23,073 people over a 6‐square‐mile area, covering portions of areas within and outside of City limits. City‐supplied drinking water originates in regional wells and is then stored in two reservoirs for distribution into supply lines and two additional reservoirs.
Peshastin Water District
The Peshastin Water District, founding in 1999, supplies water to the community of Peshastin. The system includes four wells, two reservoirs, and over 4 miles of service lines. The system currently serves approximately 238 customers. According to the Peshastin Water District website, the District completed a major rehabilitation project in 2004.
Alpine Water District
The Alpine Water District, founded is 1999, is located at the east end of Lake Wenatchee and serves the populated areas surrounding the lake. Originally built
March 2009 Page 57
DRAFT Chelan County Shoreline Inventory and Analysis
by the Chelan County PUD, this system consists of a well, pump, storage tank, and service lines. This system serves the Alpine Tracts, YMCA camp, Midway Village and Lake Wenatchee State Park. Other private systems in the surrounding vicinity include Chiwawa Community Association, Ponderosa Community Club and Thousand Trails Water System.
Other Sources
Along with the water districts listed above, there are several other small water, reclamation and irrigation districts throughout Chelan County. These include: Little Butte Water System, Pioneer Water Users, Icicle Irrigation District, Peshastin Irrigation District, Spring Hill Irrigation Company, Wenatchee Heights Water Company, Wenatchee Heights Reclamation District, Wenatchee Reclamation District, Greater Wenatchee Irrigation District, Cascade Orchard Irrigation Company, Entiat Irrigation District, Lower Squilchuck Irrigation District, Sunnyslope Irrigation Company, Sleepy Hollow Water System, Lower Stemilt Irrigation District, Chelan Falls Irrigation District, Wenatchee‐Chiwawa Irrigation District, and Beehive Irrigation District.
Chelan County also has 310 active Group B water systems, which are public water systems:
• “Constructed to serve less than fifteen residential services regardless of the number of people; or
• Constructed to serve an average nonresidential population of less than twenty‐five per day for sixty or more days within a calendar year; or
• Any number of people for less than sixty days within a calendar year.” (WAC 246‐291)
According to Washington State Department of Health records, most of these (66%) are located in WRIA 45, with 19 percent in WRIA 47, and the remainder in WRIAs 46 and 40a/b. The 310 systems reportedly serve 2,104 parties.
3.4 Impervious Surfaces
Impervious surface mapping and analysis was developed using the U.S. Geological Survey National Land Cover Data (NLCD 2001). The data captured include impenetrable surfaces such as rooftops, roads, or parking lots, but may not include reduced perviousness caused by compaction or vegetative changes. The data was generated using 30‐meter cells, with each cell reporting the percentage of that cell that is impervious. For purposes of this analysis, each cell was considered to be completely impervious if it had any percentage of impervious surface. While this results in a net over‐estimation of actual impervious, it allows for a comparison of impervious surface between waterbodies providing useful information.
Page 58 March 2009
DRAFT Chelan County Shoreline Inventory and Analysis
The following tables (10a and 10b) show percent impervious surface for those shoreline areas that have impervious surfaces; shorelines with no impervious surfaces (or impervious surface data) are not listed. All waterbodies in the cities and their UGAs have impervious surface percentages greater than 10 percent. Shoreline areas with impervious surface percentages greater than 10 percent in the remainder of the county are shaded for easy identification.
Table 10a. Total Impervious Surface within Each Shoreline in Unincorporated Chelan County by WRIA, Outside of Cities and Their Urban Growth Areas.
Waterbody Total Upland Shoreline Area (Acres)
Impervious Surface (acres)
% Impervious
WRIA 40a/b (Stemilt/Squilchuck - Colockum) Black Lake (aka Wheeler Hill or Spring Hill Reservoir) 30.20 0.46 2%
Colockum Creek 180.48 26.45 15% Columbia River 413.66 22.90 6% Cortez Lake 33.24 16.89 51% Meadow Lake 30.88 7.73 25% Stemilt Project Reservoir 21.24 1.08 5% Upper Wheeler Reservoir 29.33 4.66 16% WRIA 45 (Wenatchee) Big Meadow Creek 56.12 2.51 4% Chikamin Creek 154.18 3.40 2% Chiwaukum Creek 398.65 21.78 5% Chiwawa River 3,274.58 59.49 2% Chumstick Creek 220.73 64.50 29% Colchuck Lake 48.86 6.83 14% Columbia River 112.87 34.15 30% Eightmile Creek 201.36 8.51 4% Fish Lake 257.68 14.93 6% Icicle Creek 1,805.41 174.35 10% Ingalls Creek 527.76 12.54 2% Jack Creek 411.78 1.37 0% Lake Creek 2 196.01 11.82 6% Lake Wenatchee 319.87 44.60 14% Little Wenatchee River 1,432.90 18.64 1% Mill Creek 65.19 15.48 24% Mission Creek 324.77 38.63 12% Mountaineer Creek 146.96 2.52 2% Napeequa River 934.15 2.19 0% Nason Creek 1,520.70 222.18 15% Perfection Lake 28.93 3.26 11% Peshastin Creek 645.91 273.80 42% Phelps Creek 295.14 0.89 0%
March 2009 Page 59
DRAFT Chelan County Shoreline Inventory and Analysis
Waterbody Total Upland Shoreline Area (Acres)
Impervious Surface (acres)
% Impervious
Rainy Creek 238.47 10.12 4% Rock Creek 268.89 0.96 0% Snow Lake - Lower 53.84 7.91 15% Stuart Lake 34.20 0.86 3% Wenatchee River 4,070.47 776.60 19% White River 2,820.85 43.38 2% Whitepine Creek 296.49 0.86 0% WRIA 46 (Entiat) Columbia River 399.76 154.01 39% Entiat River 3,103.81 257.99 8% Lake Creek 1 84.30 1.88 2% Mad River 961.74 48.14 5% North Fork Entiat River 321.57 1.20 0% Tommy Creek 69.45 0.61 1% WRIA 47 (Chelan) Antilon Lake 51.59 4.11 8% Boulder Creek 1 189.61 1.13 1% Bridge Creek 578.89 1.13 0% Chelan River 161.25 15.23 9% Columbia River 674.01 102.67 15% Company Creek 445.56 1.70 0% Cottonwood Creek 24.87 0.01 0% Dry Lake 67.88 19.79 29% Lake Chelan 2,592.15 324.89 13% North Fork Thirtyfive Mile Creek 32.29 2.36 7% Park Creek 281.95 1.34 0% Railroad Creek 804.68 20.07 2% Rainbow Creek 203.90 2.05 1% Roses Lake 57.37 0.37 1% Stehekin River 1,244.04 60.87 5% Twentyfive Mile Creek 148.12 8.68 6% Unnamed Lake 1 41.83 4.88 12% Wapato Lake 82.38 14.30 17% 14.30 17%
Table 10b. Total Impervious Surface within Each Shoreline by City, Including Their Urban Growth Areas.
Waterbody Total Shoreline Area (Acres)
Impervious Surface (acres)
% Impervious
Cashmere and UGA Mission Creek 71.55 47.79 67% Wenatchee River 166.20 70.02 42%
Page 60 March 2009
DRAFT Chelan County Shoreline Inventory and Analysis
Waterbody Total Shoreline Area (Acres)
Impervious Surface (acres)
% Impervious
Chelan UGA Chelan River 29.09 13.23 45% Lake Chelan 490.2 313.3 64% Entiat and UGA Columbia River 85.61 26.66 31% Entiat River 32.60 9.82 30% Leavenworth and UGA Chumstick Creek 7.45 3.31 44% Icicle Creek 0.10 0.09 88% Wenatchee River 140.80 39.75 28% Wenatchee and UGA Columbia River 177.78 65.87 37% Wenatchee River 104.27 20.10 19%
Impervious surface is relevant to shoreline functions because of the relationship between impervious surfaces and stormwater runoff. In a number of ways, vegetated areas slow the movement and reduce the quantity of runoff that makes its way into streams and other waterbodies. Increases in impervious surface coverage, and the consequent reduction in soil infiltration, have been correlated with increased velocity, volume and frequency of surface water flows. This hydrologic shift alters sediment and pollutant delivery to streams and other receiving bodies (Booth 1998; Arnold and Gibbons 1996).
Increased surface water flows associated with impervious surface coverage of suburban areas (20‐30%) has been linked to decreased bank stability and increased erosion (May et al. 1997a). Rainwater can evaporate off of vegetation without ever reaching the ground, infiltrate into the soils to recharge groundwater, infiltrate into the soils where it is taken up by vegetation and evapotranspirated, or move slowly over the surface or subsurface into a waterbody.
In parts of Chelan County, generally lower lying areas in the eastern portions of the County, low precipitation combined with pervious soil types allows for infiltration of much of the annual rainfall. The effect of increased impervious surface in these areas may be less pronounced. Such areas generally have little vegetation given the dry climate and well‐drained soils. With less vegetation, transpiration and interception rates are lower than in more heavily vegetated areas, so that the loss of vegetation has less of an effect on runoff volumes. Nevertheless, the loss of direct infiltration caused by impervious surfaces still has an effect on runoff volume and the associated bank stability and erosion issues that result from increases in runoff volumes.
March 2009 Page 61
DRAFT Chelan County Shoreline Inventory and Analysis
3.5 Vegetation
Vegetative cover mapping and analysis was generated using the U.S. Environmental Protection Agency’s 2001 National Land Cover Data (NLCD). Other data sets were evaluated, including information from the U.S. Forest Service (USFS) and the Interior Columbia Basin Ecosystem Management Project (ICEBMP). However, the USFS data, while providing exceptional detail for forest lands, lumped or mis‐categorized non‐forest lands. The ICEBMP data is at a much larger scale than the NLCD (1,000 meters rather than 30 meters), and is older (1994 vs. 2001). NLCD provided the most accurate mapping of the entire County, with vegetation classifications that would be most useful to SMP development. An additional benefit of the NLCD is the integration of impervious surface data in the classification of various intensities of developed lands. The following cover type descriptions are those developed in conjunction with and pertaining directly to the NLCD data. While each is present as a unit within Chelan County shorelines, individual components included in the NLCD cover class definitions grouped and summarized below may be absent from Chelan County shorelines.
• Developed (high, medium and low intensity) cover classes
Development in Chelan County shorelines ranges from high intensity to low intensity. These categories are defined primarily by amount of impervious surface. Percentage of impervious cover in “high intensity” developed areas ranges from 80 to 100. “Medium” and “low” intensity developed areas have 50 to 79 percent and 21 to 49 percent cover by impervious surface, respectively. Commercial and industrial development tends to characterize high intensity areas, while single‐family structures predominate in medium intensity areas, and low intensity areas feature trees, grasses, and landscaping in addition to the types of structures in medium‐intensity developed areas. Areas where parks, golf courses, and other land uses that may be considered development but generally do not require large expanses of impervious surface are classified as open space development.
• Cultivated crops and pasture/hay cover classes
Per the NLCD general definition, cultivated crops are primarily annual bean and vegetable crops, nurseries, orchards, vineyards, and all actively tilled lands. In contrast, the pasture/hay classification comprises grasses and legumes planted for livestock, typically untilled and on a perennial cycle. [Note: pasture/hay also captures areas of lawn on a number of park and residential properties]
Page 62 March 2009
DRAFT Chelan County Shoreline Inventory and Analysis
Upland vegetative cover types with more natural compositions are the grassland/herbaceous category, which includes meadows, fields, and naturally vegetated undeveloped lands, covering at least 80 percent of the area. Grassland/herbaceous land can be grazed, but is generally not intensively managed.
The scrub/shrub cover category is typically at least 20 percent shrub canopy cover and includes both shrub species and early seral stage tree species, provided the area is dominated by vegetation less than 5 meters tall. Early seral stands are made up of shade‐intolerant species such as western larch, western white pine, ponderosa pine, and Douglas‐fir, as well as dense shrubs, grasses, and forbs. Johnson and O’Neil (2001) categorize eastern Washington scrub/shrub as “Eastside canyon shrublands,” which are most commonly dominated by mallowleaf ninebark, bitter cherry, choke cherry, oceanspray, or Rocky Mountain maple. Species compositions vary with location and may include snowberry, rabbitbrush, smooth sumac, currants, Nootka rose, black hawthorn, and various grasses.
Deciduous, evergreen, and mixed forest cover types are dominated by trees greater than 5 meters in height, again in quantities amounting to at least 20 percent of canopy cover. At least 75 percent of trees species in evergreen forest maintain leaves year‐round, the same percentage lose leaves in deciduous forest, and neither evergreen nor deciduous trees make up more than 75 percent of the cover in mixed forest. Montane conifer and mixed forest in Chelan County is usually dominated by Pacific silver fir, mountain hemlock, subalpine fir, Shasta red fir, Engelmann spruce, noble fir, or Alaska yellow‐cedar. Possible co‐dominants are Douglas‐fir, lodgepole pine, western hemlock, western red cedar, or white fir.
Forest cover types generated by NLCD data can be more finely described for Chelan County shorelines using sources specific to the Northwest. Eastern Washington interior forest is typically dominated by Douglas‐fir; other dominants or co‐dominants often depend on elevation and moisture regime and may include western red cedar, western hemlock, ponderosa pine, or grand fir. Deciduous forests include quaking aspen and Garry oak as dominants, although Oregon white oak can be found in areas (Johnson and O’Neil 2001; Franklin and Dyrness 1988). Understories support numerous and diverse shrub and herbaceous species. These also tend to vary with elevation and moisture. Common species are vine maple, serviceberry, oceanspray, ninebark, fool’s
March 2009 Page 63
DRAFT Chelan County Shoreline Inventory and Analysis
huckleberry, low huckleberry, snowberry, baldhip rose, Oregon grape, vanilla leaf, wild ginger, false Solomon seal, lupines, plantains, and many others.
Numerous wetlands are associated with Chelan County shorelines. In accordance with the NLCD system, wetlands are classified according to vegetative cover. Palustrine emergent wetlands include those dominated by persistent emergent vascular plants, mosses, and lichens. In the study area, emergent wetlands are most likely to be sedge meadows and montane meadows, although numerous variations of this cover type occur throughout Chelan County. Some representative dominant groups are the bulrushes, sedges, slough sedges, rushes, and spike rushes. The forbs species arrowleaf groundsel and lady fern occasionally dominate in montane meadow wetlands (Johnson and O’Neil 2001). Total vegetative cover must exceed 80 percent for inclusion in this category.
Palustrine forested wetland is also documented in Chelan County shoreline jurisdiction. This category includes wetlands dominated by woody vegetation at least 5 meters in height and forming at least 20 percent cover. The most common type of woody wetland in the study area is mountain coniferous wetland, which most often occurs along watercourses. Indicator tree species of this type of forested wetland are Engelmann spruce, subalpine fir, western hemlock, and western red cedar. Douglas‐fir, grand fir, quaking aspen, and black cottonwood can co‐dominate. Common in the understory are devil’s club, stink currant, swamp gooseberry, red‐osier dogwood, Douglas spiraea, Sitka alder, sedges, spike rushes, and many other woody and herbaceous species (Johnson and O’Neil 2001).
Documented non‐vegetated areas in shorelines are open water, barren land, and perennial ice/snow. The open water classification is assigned to areas with less than 25 percent cover by vegetation and soil and includes lakes, ponds, streams, rivers, and reservoirs. Barren land comprises talus, bedrock, sand dunes, glacial debris, gravel pit, dry riverbeds, and exposed rock, and generally has less than 10 percent vegetative cover. Ice and snow must make up more than 25 percent cover for an area to be classified as perennial ice/snow.
The U.S. Forest Service also mapped old‐growth corridors as part of its Northwest Forest Plan. Although this data set is old, the information is shown on the vegetation maps. Additional USFS land management allocations and vegetation management designations (e.g., late successional reserves, congressionally designated wilderness, MATRIX, etc.) will be considered in the analysis phase of this Shoreline Master Program update project.
Page 64 March 2009
DRAFT Chelan County Shoreline Inventory and Analysis
Information about the dominant vegetation communities in specific shorelines of the County (by WRIA) and in the Cities with their UGAs is provided in Chapter 4.
3.6 Shoreline Modifications
Shoreline modifications are human‐caused alterations to the natural water’s edge and nearshore environments, and include a variety of armoring types to protect bridge footings, roads, and upland structures on private property. County‐wide mapping of shoreline armoring is not available, but is expected to be most common along urban waterfronts, particularly those dominated by single‐family residences, along roads or other transportation corridors that closely parallel shorelines, and along many public parks. A recent Stehekin River study focusing on the area between Lake Chelan and High Bridge identified 6,761 linear feet of shoreline stabilized by erosion control measures. Some of these measures may have fish habitat benefits (such as log cribbing and jams, cabled logs), while others provide no direct habitat benefits (such as rip‐rap or concrete bags) (Riedel 2008). These sorts of modifications alter the function of lake and stream edges, change erosion and sediment movement patterns, block channel migration, affect the distribution of aquatic vegetation, and are often accompanied by upland/riparian vegetation loss.
Countywide data is available for over‐water structures, another common type of shoreline modification. The Washington Department of Natural Resources has digitized piers and other in‐water structures such as boatlifts, boathouses, and moorage covers. As expected, the two shorelines with the greatest number of overwater structures are Lake Chelan and the Columbia River. Lake Chelan is primarily comprised of both residential and commercial boat docks, moorages and piers. At the south end of the lake, there are two bridges that cross the water (Alternate U.S. Highway 97/W. Webster Avenue and E. Woodin Avenue), as well as the Lake Chelan Hydroelectric Project (aka Lake Chelan Dam). The Columbia River is crossed by a number of bridges, mainly in the Wenatchee area, as well as Rock Island Dam, Rocky Reach Dam, and Wells Dam.
Also as expected, the highest amount of overwater cover area can be found in Lake Chelan. This is attributed to the presence of several commercial marinas, large park‐associated piers, the prevalence of single‐family piers, and multiple large piers that serve condominiums and resorts. Two other waterbodies which have a large number of residential overwater structures include Lake Wenatchee and Fish Lake. These two lakes have a number of residential homes with boat docks and moorages.
March 2009 Page 65
DRAFT Chelan County Shoreline Inventory and Analysis
Table 11 below provides more detail on the extent of overwater structures in Chelan County shorelines as mapped by Washington Department of Natural Resources using aerial photographs from 2002 to 2006.
Table 11. Overwater Cover by Waterbody in Shoreline Jurisdiction
Area Residential Docks Large Commercial or Public
Facilities (incl. bridges) Total Cover (ft2) Area (ft2) Area (ft2)
City of Cashmere and UGA Wenatchee River --- 18,065 18,065
City of Chelan and UGA Chelan River --- 112,953 112,953 Lake Chelan 732,640 1,107,816 1,840,456
City of Entiat and UGA Columbia River 55,467 12,174 67,641
Entiat River --- 18,166 18,166 City of Leavenworth and UGA
Wenatchee River --- 14,264 14,264 City of Wenatchee and UGA
Columbia River 3,558 17,690 21,248 Wenatchee River --- 51,076 51,076
WRIA 40a/b Columbia River 191,790 12,777 204,568
WRIA 45 Columbia River 261,145 89,658 350,803
Fish Lake 40,040 --- 40,040 Icicle Creek 3,187 10,635 13,822
Lake Wenatchee 144,952 --- 144,952 Wenatchee River 40,554 205,437 245,990
WRIA 46 Columbia River 275,857 180,687 456,544
Entiat River 2,788 148,615 151,403 Mad River --- 4,612 4,612
WRIA 47 Chelan River 11,315 88,117 99,432
Columbia River 112,754 770,478 883,232 Lake Chelan 1,344,528 8,385 1,352,913
Railroad Creek 3,022 --- 3,022 Twentyfive Mile
Creek 4,175 --- 4,175 1 Overwater cover calculations include piers and docks, but also include areas of covered moorage and boathouses.
Page 66 March 2009
DRAFT Chelan County Shoreline Inventory and Analysis
Both measures, total overwater cover and number of structures, are relevant to ecological function assessment. Total overwater cover is an indication of the amount of water surface that may be shaded, which can impact growth of aquatic vegetation and subsequently the food chain as a whole. Overwater cover is also implicated in exacerbating the predator‐prey relationship between native fish and non‐native fish. The number of structures is relevant as it indicates the number of impedances to juvenile salmon migration along the shoreline.
3.7 Existing and Potential Public Access
Information about public access sites in the County was drawn from County and city GIS data, adopted parks and recreation plans, watershed plans, and other sources. Parks and public access categories include:
• Public or protected lands – government owned, land trust, or similar properties
• View corridors identified by local cities • Public trails; campgrounds; picnic areas; fishing easements; and boat
launches
The County contains extensive public or protected lands owned by the government, such as National Forests, National Parks, State Parks, State Wildlife Areas (e.g. Chelan Butte Unit, Entiat Unit, White River Unit, Swakane Unit, Colockum Wildlife Area), and other Federal (BLM), State (WDNR) and County lands. The County also contains trails, campgrounds, picnic areas, fishing easements, and boat launches. Cities or the PUD provide more formal parks, recreation, and open space opportunities.
In October 2007, Chelan County completed the Comprehensive Parks and Recreation Plan, which is considered an element of the County Comprehensive Plan. The Plan identifies a vision for parks and recreation throughout the County, provides a demand and need assessment, establishes goals and policies, and provides implementation measures.
The plan indicates the following recreational resources in the County.
Table 12. Parks and Recreation Resources
Agency Parks and Recreation Acres
Example Facilities (Land Owned by Agency; May be Managed by Others)
Chelan County 50 Wenatchee River County Parks, Chelan County Expo Center
Chelan County PUD 467 10 facilities including, but not limited to Entiat Park, Chelan Falls Park, Chelan Riverwalk Park Manson Bay Park, Walla Walla Point Park, Washington Confluence
March 2009 Page 67
DRAFT Chelan County Shoreline Inventory and Analysis
Agency Parks and Recreation Acres
Example Facilities (Land Owned by Agency; May be Managed by Others) State Park, and others
Local Parks
244 Communities of Chelan, Cashmere, Dryden, Entiat, Leavenworth, Manson, Peshastin Wenatchee and Wenatchee School District own and operate numerous facilities including parks, ball fields, marinas, RV parks, gardens, many of them waterfront parks.
State of Washington 28,582 Parks and wildlife areas, including: 25-mile creek, Chelan Butte Wildlife Area, Swakane and Entiat Wildlife Areas, Lake Chelan State Park, Lake Wenatchee State Park, Ohme Garden State Park, Peshastin Pinnacles State Park, and Squilchuck State Park
Federal Lands 1,480,681 Lake Chelan National Recreation Area, Mt. Baker Snoqualmie National Forest, and Wenatchee-Okanogan National Forest
The following elements of the Comprehensive Parks and Recreation Plan are relevant to the Shoreline Master Program update:
• Vision: Chelan County provides a mix of parks, recreation and open space that complements community character, creates diverse opportunities for residents and visitors, and preserves ecological functions.
• Goals and Policies: Among several, the following are most relevant: o Goal PR2, Policy 1: Encourage the following criteria to be addressed
in the development of park plans by public entities: A. Evaluate the need for new park facilities using the Recreation and Conservation Funding Board format; B. Neighborhood parks should be sited for accessibility and the enhancement of neighborhood; C. Evaluate need for waterfront access and waterfront‐dependent activities, activity fields (soccer, etc.), special purpose facilities (sky park, skate park, etc.), indoor facilities, community centers, trails, funding mechanisms, and construction, and maintenance and operation.
o Goal PR2, Policy 3: Encourage public access to shoreline areas in the development and maintenance of park and recreation opportunities, where consistent with the protection of critical areas and private property rights.
• Improvement Program: The improvement program includes additional plans and improvements, such as a Comprehensive Trails Plan, Expo Center improvements, Stemilt Basin Land Exchange and Subarea Plan (Stemilt‐Squilchuck Community Vision, TPL), Subarea Parks Planning, Citizen Questionnaire and Feasibility studies, Columbia River Water Access and Boating Plan, Multi‐Sport Eight‐Plex, Manson’s Old Mill
Page 68 March 2009
DRAFT Chelan County Shoreline Inventory and Analysis
Campground, Manson Marina Expansion, and Wenatchee Row and Paddle Boating Facility Upgrade.
Due to extensive government ownership throughout the County, current and potential park and public access opportunities are fairly abundant. However, the present public access opportunities may not be ideally located (e.g. fishing easements) and identification of whether and how opportunities can be consolidated to meet local needs and create efficiencies for maintenance and other issues is warranted. Scattered, small access points with low levels of alteration are preferred by some recreationists for certain uses (e.g., fishing), but not others (e.g., RV camping, swim beaches, picnicking, event facilities).
Potential public access points have been identified, including road ends and properties with no owners according to Assessor records (see maps titled ROW Analysis). This information requires review and evaluation such as in the forthcoming shoreline analysis phase of this Shoreline Master Program update project.
The Chelan County Shoreline Master Program Update Advisory Committee members are anticipated to verify information and add to the knowledge base of parks and public access opportunities.
3.8 Critical Areas
The inventory of critical areas was based on a wide range of information sources. A complete listing of citations used to compile information on critical areas is included in Section 5.0 at the end of this study. Shorelands mapped as one or more of the following critical area types are suitable only for certain uses and developments, which factor into future environment designations.
The Chelan County Multi‐Jurisdiction Natural Hazard Mitigation Plan identifies Chelan County’s natural hazard areas and provides strategic methods in mitigating for a number of natural hazards that County residents are subject to, including flooding, earthquakes, severe storms, volcanoes, landslides, drought, wildfires, and avalanches. The Plan’s “Mitigation Strategy” provides a number of implementation measures that could mitigate the effects of these natural disasters and reduce the risk of damage to structures, property, and loss of life.
As identified in the Plan, the mission statement is:
“To promote sound public policy designed to protect citizens, critical facilities, infrastructure, private property and the environment from natural hazards by increasing public awareness, documenting the resources for risk reduction and loss‐prevention, and identifying activities to guide Chelan County towards building a safer, more sustainable community.”
March 2009 Page 69
DRAFT Chelan County Shoreline Inventory and Analysis
3.8.1 Geologically Hazardous Areas Maps of geologically hazardous areas were developed using WDNR data. Presumably, WDNR based those designations on topographic information and soil types as cataloged by the Natural Resources Conservation Service (NRCS). The presence of geologically hazardous areas in shorelines can be a factor in determining suitability of the area for certain activities, including restoration and development. Human safety is an important concern for development in geologically hazardous areas. In addition, geologically hazardous areas can be important sources of large woody debris and sediment to the aquatic system, the latter to the benefit or detriment of aquatic life. This WDNR data provided coverage for areas outside of the Cities and their UGAs, except for 31 acres in the City of Chelan and its UGA. Mapped geohazards are also located just outside of Entiat and its UGA.
The Cities of Chelan and Wenatchee also contributed geologically hazardous areas mapping.
3.8.2 Frequently Flooded Areas For all practical purposes, “frequently flooded areas” are those areas within the 100‐year floodplain. Maps were developed using FEMA’s floodplain data, as well as floodways where available.
Recent information prepared by the University of Washington Climate Impacts Group indicates that flooding may decrease in drainage basins that currently have high amounts of snow accumulation and where the biggest floods come from rain‐on‐snow events. Climate change is expected to raise the snow level, thus reducing the amount of snow stored in the basin. The rain event may be higher volume than in recent years, but the amount of snow available to be melted will be even less. The models indicate that a reduction in peak flow will result. These models contain a high level of uncertainty, and future changes in flooding due to climate change cannot yet be reliably predicted.
3.8.3 Wetlands Wetland mapping was assembled from the National Wetlands Inventory, and supplemented with hydric soils information contained in the Natural Resources Conservation Service’s Soil Survey Geographic (SSURGO) Database. Soil types classified as “hydric” are often indicative of wetland soils. Wetlands provide a number of hydrologic functions, including water storage, groundwater recharge, and maintenance of stream base flows; water quality improvement functions; and fish and wildlife habitat functions. Shoreline wetlands should be targeted for protection and restoration. To establish the potential wetland area in shoreline jurisdiction by waterbody as presented in Chapter 4 below, the NWI and hydric soils layers were combined to determine net potential wetland area.
Page 70 March 2009
DRAFT Chelan County Shoreline Inventory and Analysis
In some instances, the reported percentages are elevated when the NWI polygon incorporates some open water, on Lake Chelan or the Columbia River for example.
Many wetlands are not identified by NWI or hydric soils, and some NWI wetlands may not meet wetland criteria. Whether or not they are captured by this mapping effort, actual wetland conditions that may or may not be found on a site determine shoreline jurisdiction on a site‐specific basis.
3.8.4 Fish and Wildlife Habitat Conservation Areas Streams and lakes are one type of fish and wildlife habitat conservation area (FWHCA). Stream data was gathered from WDFW, WDNR, and Pacific States Marine Fisheries Commission. Many shoreline and non‐shoreline streams and lakes contain State or federally listed fish species, as well as other WDFW‐designated “priority”6 fish species. Priority fish species include:
• Pacific lamprey (federal Species of Concern) • White sturgeon • Leopard dace (State Candidate) • Umatilla dace (State Candidate) • Mountain sucker (State Candidate) • Bull trout (federal Threatened, State Candidate) • Chinook salmon (federal Endangered, State Candidate) • Coho salmon (State Candidate) • Kokanee salmon • Pygmy whitefish (federal Species of Concern, State Sensitive) • Rainbow trout • Steelhead trout (federal Threatened, State Candidate) • Sockeye salmon (State Candidate) • Westslope cutthroat trout (federal Candidate)
In addition to streams, lakes and priority fish, fish and wildlife habitat conservation areas include other priority habitats, habitat features and wildlife. WDFW Priority Habitats and Species map data are of two general types: habitat/feature polygons, either general features or specific habitats associated with a particular species, and Natural Heritage points. A number of habitats,
6 Priority species require protective measures for their survival due to their population status, sensitivity to habitat alteration, and/or recreational, commercial, or tribal importance. Priority species include State Endangered, Threatened, Sensitive, and Candidate species; animal aggregations (e.g., heron colonies, bat colonies) considered vulnerable; and species of recreational, commercial, or tribal importance that are vulnerable.
March 2009 Page 71
DRAFT Chelan County Shoreline Inventory and Analysis
features and species7 are found in Chelan County’s shoreline areas. Many of the priority species rely on shoreline waterbodies or riparian areas to meet certain life cycle requirements. Table 13 highlights some of the major habitat components that are found in shoreline areas and utilized by priority wildlife species, and Table 14 identifies the federally listed species and their WRIA or City location.
Table 13. Priority species use of shorelines in Chelan County.
Species Shoreline Habitat Components Birds Bald eagle Fish-bearing waters (lakes, streams, rivers) for foraging
Tall trees for nesting and perching Golden eagle Rocky cliffs for nesting Osprey Fish-bearing waters (lakes, streams, rivers) for foraging
Tall trees for nesting and perching Wood duck Open water
Forested riversides Cavities
Harlequin duck Fast-moving mountain streams in breeding season Gravel bars and in-stream rocks for roosting Rocky coastlines in winter
Common loon Forested mountain lakes in breeding season Trumpeter swan Open water for foraging Sandhill crane Wet meadows
River valleys Great blue heron Lakes and lakeshores
Show-moving streams Wetlands Wet meadows
Spruce grouse no specific habitat needs related to shorelines Waterfowl concentration
Open water Meadows Wetlands
Mammals Marten Riparian zones for winter foraging
Lakeshores for winter foraging Fisher no specific habitat needs related to shorelines, but commonly
found in forests interspersed with rivers and lakes Western gray squirrel no specific habitat needs related to shorelines Mule deer Streams and lakes for year-round water Mountain goat no specific habitat needs related to shorelines Bighorn sheep no specific habitat needs related to shorelines Elk Lakes, rivers, streams and wetlands for year-round water
Wet meadows in winter Lynx no specific habitat needs related to shorelines Herptiles Cascades frog Streams with pools for breeding
7 Although northern spotted owl habitat may be mapped by WDFW or other agencies in shoreline jurisdiction, these areas are not shown on the inventory maps because of the sensitivity of the information.
Page 72 March 2009
DRAFT Chelan County Shoreline Inventory and Analysis
Species Shoreline Habitat Components Ponds, bogs and wetlands with mud substrate for wintering
Tailed frog Streams needed for all lifecycle stages Columbia spotted frog Ponds, lakes, and slow-moving streams year-round Western toad Pools, ponds, wetlands and lakes for breeding
Soft substrate (e.g., wetland soils) for wintering Racer no specific habitat needs related to shorelines and in fact
prefer arid climes, but frogs are common prey item so may benefit from the presence of aquatic habitats
Great Columbia spire snail
Clear, cold streams needed for all lifecycle stages
Table 14. Federal Endangered Species Act listed fish and wildlife species in shoreline jurisdiction of Chelan County.
Common Name Scientific Name ESU/DPS1 Federal
Status2 Critical Habitat? WRIAs / City
Bald eagle Haliaeetus leucocephalus
(none) C, Monitor No 45, 46, 47, City of Entiat
Bull trout Salvelinus confluentus
USA coterminous, (lower 48 states)
T Yes 40, 45, 46, 47
Canada lynx Lynx canadensis USA T Yes 45, 46, 47
Chinook salmon, spring run Oncorhynchus tshawytscha
Upper Columbia Basin, Spring Run
E Yes 40, 45, 46, 47, all Cities
Fisher Martes pennanti
West Coast DPS C No 47
Great Columbia spire snail (Columbia pebblesnail) Fluminicola columbiana
(none) SC No 45
Northern spotted owl Strix occidentalis caurina (none) T Yes Chelan County
Pacific lamprey Entosphenus tridentatus (none) SC No 47, City of Entiat
Pygmy whitefish Prosopium coulteri (none) SC No 47, City of Chelan
Steelhead trout Oncorhynchus mykiss
Upper Columbia River Basin
T Yes
40, 45, 46, Cities of Cashmere, Entiat, Leavenworth and Wenatchee
Western gray squirrel Sciurus griseus griseus (none) SC No 47, City of Chelan
1 Status codes: C = Candidate, SC = Species of Concern, T = Threatened, E = Endangered, UR = Under review
March 2009 Page 73
DRAFT Chelan County Shoreline Inventory and Analysis
Other priority habitats found in County or City shorelines include aspen stands, old‐growth/mature forest, riparian zones, and wetlands. Priority habitat features found in County or City shorelines include talus slopes, cliffs, and snag‐rich areas.
WDFW maps do not capture every priority species location or habitat in shoreline jurisdiction, particularly those species that use the water for foraging and drinking, but that nest or den farther from the shoreline. Absence of mapping information does not indicate that a particular species does not or could not utilize the shoreline or adjacent lands.
3.8.5 Critical Aquifer Recharge Areas Specific information about locations of critical aquifer recharge areas could not be located. As noted in the County’s 2008 critical areas regulations (Chapter 11.82), “There is insufficient scientific data at this time, to determine with any specificity the location of areas having a critical recharging effect on aquifers used for potable water within the boundary of Chelan County.”
3.9 Floodplains and Channel Migration Zones
WAC 173‐26‐201(3)(c) directs local government to collect the “[g]eneral location of channel migration zones, and flood plains… to the extent such information is relevant and reasonably available. Towards that end, maps have been developed showing the locations of floodplains, floodways, and channel migration zones (CMZ), the definitions of which are provided below:
• Floodplain (SMA): synonymous with 100‐year floodplain, land area susceptible to inundation with a one percent chance of being equaled or exceeded in any give year. The limit of this area shall be based upon flood ordinance regulation maps or a reasonable method which meets the objective of the SMA.
• Floodway (FEMA): channel of a river or other watercourse and the adjacent land areas that must be reserved in order to discharge the base flood without cumulatively increasing the water surface elevation more than a designated height (FEMA definition)
• Floodway (SMA): area, as identified in a shoreline master program, that either:
(i) Has been established in federal emergency management agency flood insurance rate maps or floodway maps; or
(ii) Areas flooded with reasonable regularity: “those portions of the area of a river valley lying streamward from the
Page 74 March 2009
DRAFT Chelan County Shoreline Inventory and Analysis
outer limits of a watercourse upon which flood waters are carried during periods of flooding that occur with reasonable regularity, although not necessarily annually.”
(iii) Identified by soil and vegetation: floodway to be “identified, under normal condition, by changes in surface soil conditions or changes in types or quality of vegetative ground cover condition.”
(iv) Not to include lands protected from floods by legal dikes and levees: “The floodway shall not include those lands that can reasonably be expected to be protected from flood waters by flood control devices maintained by or maintained under license from the federal government, the State, or a political subdivision of the State.”
• Channel Migration Zone (SMA): the area along a river within which the channel(s) can be reasonably predicted to migrate over time as a result of natural and normally occurring hydrological and related processes when considered with the characteristics of the river and its surroundings.8
Floodplain boundaries have been determined for the majority of large rivers and creeks in Chelan County through FEMA mapping.
The FEMA mapping corresponds to the 100‐year flood event and is typically limited to the lower reaches. FEMA‐mapped floodplains are completed for portions of the following waterbodies: Wenatchee River, Entiat River, Stehekin
8 As relayed by Martin Fisher, P.E., ICF Jones & Stokes, defining the CMZ also considers the influence of certain human‐made structures. Many human‐made structures like roads do not meet the current standard of being able to withstand the 100‐year flood. Most of them were built 50 or more years ago and the science of fluvial geomorphology and river engineering have advanced significantly since then based on observations of performance of human made structures in the river environment. These structures, even if not up to current standards, represent a boundary for the CMZ. If damaged from erosion, as occurred on U.S. 97 in January 2009, the boundary would be restored by emergency maintenance. When maintenance activities occur, they are ideally implemented using modern methodologies and standards which lead to a more stable CMZ boundary.
When defining CMZ boundaries, the typical method is to define human‐made hard points that will be maintained with some certainty as a CMZ boundary. This includes public roads, railroads, and levees that have a governmental agency or diking district overseeing maintenance. Erosion may occur to these locations of the CMZ boundary, but it is fairly certain that the responsible maintaining agency will repair the erosion. On the other hand, human‐made hard points on private property, like private driveways and farm fields protected by riprap, are an area requiring judgment by the authors of the CMZ study as it is unknown if the landowner will maintain/restore the hard point or if damage occurs. Often these privately owned human‐made hard points are not considered a CMZ boundary.
March 2009 Page 75
DRAFT Chelan County Shoreline Inventory and Analysis
River, Chelan River, Nason Creek, White River, Little Wenatchee River, Icicle Creek, Chumstick Creek, Peshastin Creek, and Mission Creek.
Chelan County’s original Flood Insurance Study was prepared by CH2M‐Hill for FEMA; it started in 1976 and became effective on February 4, 1981. Detailed studies were performed for portions of the Wenatchee, Chiwawa, Entiat, Mad and Stehekin Rivers, and Mission, Peshastin, Icicle, Chumstick and Squilchuck Creeks. A revision to the original study was also performed by CH2M‐Hill for FEMA; this revision added detailed study for Nason Creek and portions of the Wenatchee River.
Available CMZ mapping from a Chelan County‐commissioned study of the Wenatchee River and the lower portions of a few key tributaries, and from the National Park Service’s assessment of the Stehekin River are provided on maps included in this report. A January 2009 study of the Entiat River is described below as well. Development of additional CMZ mapping was not undertaken as part of this project due to the cost of conducting a thorough analysis. Because a CMZ boundary can have regulatory power, similar to a floodplain boundary, conducting a less‐than‐complete assessment has implications for future development on sites that may be inappropriately included in a map, and other consequences for property owners. Further, because of the extent of shoreline jurisdiction in the County and Cities (generally only 200 feet from the OHWM, floodways and portions of floodplains, and associated wetlands), CMZs where they exist may extend well outside of shoreline jurisdiction.
3.9.1 Wenatchee River and Tributaries After major flooding on the Wenatchee River in November 1995 that exceeded 100‐year discharges and, in some areas, 500‐year discharges, FEMA contracted with the Corps of Engineers to revise the Wenatchee River floodplain maps in the vicinity of the City of Leavenworth, from the confluence with Chumstick Creek to the confluence with Icicle Creek. That study became effective on July 2, 2002. Subsequently, FEMA contracted with the Corps again to study the Wenatchee River from Leavenworth through Cashmere and down to Wenatchee. That study became effective on September 30, 2004.
As many of the rivers and creeks within Chelan County are confined due to geologic and human influences, the FEMA floodplains and CMZs are generally limited to natural areas directly adjacent to the waterbodies and not within dense human development, with some exceptions. Floodplain areas on the Wenatchee River near the City of Leavenworth at the Icicle Creek confluence do extend to include residential areas; however, most of the FEMA floodplain is composed of naturally vegetated islands and City Parks. On the lower Wenatchee River, the FEMA floodplain extends at the Mission Creek confluence to within residential
Page 76 March 2009
DRAFT Chelan County Shoreline Inventory and Analysis
areas in the City of Cashmere. The lower reaches of the Stehekin River also have mapped FEMA floodplains within residential areas.
Channel migration zone boundaries have been developed for the Wenatchee River, from above Leavenworth to the confluence with the Columbia River and the lower reaches of tributaries including the mouths of Icicle, Peshastin, and Mission Creeks, and the lower four miles of Nason Creek (NHC 2003). The CMZs were determined through interpretation of current and historic channel and floodplain features identified in aerial photographs and compiled within a GIS database.
The CMZ analysis showed that the Wenatchee River is partly incised or entrenched with a narrow floodplain and has maintained the same general alignment for at least 100 years. Its banks are mostly stable due to both geologic and human constraints. Human development on the lower Wenatchee River has reduced the total floodplain area to 60 percent of the pre‐development area. The loss of floodplain to development over time is due to construction of the railway, major roads, and levees, all of which are assumed to be barriers to flooding by the Wenatchee River. The Peshastin Creek floodplain has been reduced to 71 percent of the pre‐development area primarily due to the construction of U.S. 97. Icicle Creek’s floodplain has been reduced to 89 percent of the pre‐development area (NHC 2003). The loss of floodplain area was not calculated for Nason Creek (NHC 2003).
The CMZ maps show erosion hazard zones based on the potential for channel migration. Erosion or migration potential on the Wenatchee River is generally limited to localized bank erosion on outer channel bends. Large channel avulsion or migration is typically not a threat due to both geologic and human confinement. However, bank stability (and curtailment of channel migration) is not an indicator that the area upland of those geologic and human conditions is protected from flooding, nor are any human alterations completely invulnerable to failure. Potential areas of channel migration include the confluence of the Icicle Creek and Wenatchee River, the area below South Dryden along Stines Hill Road, and the Sleepy Hollow area on the Lower Wenatchee River. While these areas do have the potential for channel migration due to the lack of geologic or human confinement, the river banks are typically hardened in places with rip‐rap which has greatly reduced the risk of migration. Human features, such as bridges, roads, and the railroad, that prevent channel migration are typically found downstream of the Peshastin River confluence. Bridges at Sleepy Hollow Road, Main Street in Monitor, and Cottage Avenue and Aplets Way in Cashmere limit the migration potential of the river. The construction of SR 2 downstream of Monitor also prevents the migration of the river and use of its historic floodplain. Upstream of the Peshastin River confluence, the river is more commonly confined by geologic features than human features.
March 2009 Page 77
DRAFT Chelan County Shoreline Inventory and Analysis
3.9.2 Stehekin River The Stehekin River drains into the northwest end of Lake Chelan. The majority of the river is located on public lands characterized by steep slopes, deep canyons, and naturally confined floodplains. The lower 10 miles of river below the High Bridge is characterized by a wide alluvial valley with varying degrees of confinement (Riedel 2008). The National Park Service has mapped the floodplain in the lower Stehekin River valley, which generally represents the limits of the CMZ (Riedel 2008). The CMZ within this valley is bounded by the bedrock toes of the valley walls, alluvial fan terraces, and bank stabilization projects built to protect human infrastructure. The majority of the lower Stehekin River is dominated by a meandering island‐bar pattern. Two sites in the valley, above Harlequin Bridge and near the Boulder Creek confluence, have straight channel reaches which have been stable for the past 50 years (Riedel 2008).
Channel instability is generally occurring throughout the lower valley on the outside of unconfined channel bends; however, there are two main areas of channel instability. One is the area extending a half‐mile above the confluence with Lake Chelan, and the other is at McGregor Meadows (Riedel 2008). There are over 40 sites along the lower river where hardened structures have been installed to control bank erosion. Most of these efforts have focused on the McGregor Meadows and river mouth areas. One 400‐foot‐long levee is located on the lower river near Company Creek Road which limits flood flows (Riedel 2008).
3.9.3 Entiat River As part of the Tributary Habitat Program, which aims to increase the survival rate of Upper Columbia River salmonid species, the Bureau of Reclamation assessed channel morphology on the Entiat from the confluence with the Columbia/Lake Entiat to approximately the Forrest Service boundary at RM 26 (Bureau of Reclamation 2009). This study area is divided into three valley segments, each of which contains a number of reaches.
Valley Segment 1 (VS‐1) occupies the lowest part of the basin, from the confluence to the Potato Creek Moraine at RM 16.1. This reach is characterized by a relatively high gradient, predominantly single‐thread channel with low sinuosity. VS‐2 extends upstream to RM 21.1, and is predominantly a low‐gradient reach with high sinuosity. VS‐3 makes up the upper portion of the study area, from RM 21.1 to RM 26.0. VS‐3 has a higher gradient than VS‐2, but has a relatively high sinuosity as well. Alluvial fans developed from tributary creeks have a greater influence on VS‐3 than the other reaches, producing steep, relatively straight reaches at each fan or group of fans, with lower gradient, more meandering reaches between the fans.
Page 78 March 2009
DRAFT Chelan County Shoreline Inventory and Analysis
The CMZ in all three reaches generally coincides with the active (historical) floodplain as determined by geologic mapping. However, where the active floodplain is broad, the floodplain boundary (presumably the FEMA 100 year floodplain) often extends well beyond both the CMZ and the active floodplain.9
In VS‐1, the CMZ is somewhat variable, but is generally narrower than other reaches, and can be discontinuous. Higher terraces, alluvial fans, bedrock and outwash terraces serve to confine the CMZ through much of VS‐1. In terms of historical channel change, of the seven reaches in VS‐1, all but one has a low degree of channel change, i.e. the change in the channel location is less than the width of the channel (ETA 2009). The one reach that shows a high degree of channel change (change of more than one channel width at numerous locations) is a reach that was artificially straightened (channelized) at some point between 1945 and 1962.
VS‐2 and VS‐3 show a larger variation in the width of the CMZ. Where alluvial fans constrict the valley, the CMZ is narrow, often limited to the active channel. But where there is no such control, the CMZ is broad, occupying much of the valley bottom. The result is an alternating pattern of CMZ widths, wide between fans and narrow at the fans. Similarly, there is an alternating pattern of historic channel change, with low or moderate change at the fans, and a high degree of change between the fans.
3.10 Historical or Archaeological Sites
Throughout Chelan County there are known and many more unknown historical/cultural resource sites that occur within the shorelines. The existing Chelan County Shoreline Master Program (1975) provides general goals and policies to protect and restore historical and cultural areas having significant historic, cultural, educational, or scientific value that are located within the shoreline jurisdiction.
According to the National Register of Historic Places and the Washington Heritage Register (list dated January 23, 2008) that are maintained by the Washington State Department of Archaeology and Historic Preservation (DAHP), there are numerous known sites listed throughout Chelan County. The listed historical sites include the following:
• Ardenvoir; Steliko Ranger Station; East of Entiat River, Wenatchee National Forest
• Cashmere; Brisky Treadwell Cemetery, Hazel Place Road 9 Channel migration zone mapping was not available for inclusion in this draft report. However, it will be included in the next iteration. Maps 39‐41 can be viewed at http://www.usbr.gov/pn/programs/fcrps/thp/ucao/entiat/tribassmt/index.html
March 2009 Page 79
DRAFT Chelan County Shoreline Inventory and Analysis
• Cashmere; Old Missionary Cemetery, Eeels Road and Highway 2/97 • Cashmere; Cottage Avenue Historic District; 208‐509 Cottage Avenue, 103
Maple Street, 107 Parkhill Street • Cashmere; Pioneer Village; East End of Cottage Avenue at East End of the
Wenatchee River Bridge • Cashmere vicinity; Blewett Arrastra; Near Mouth of Culver Gulch on Swauk
Pass, U.S. Route 97 • Chelan; Ruby Theater; 135 East Woodin Avenue • Chelan; St. Andrews Episcopal Church; 120 E. Woodin Avenue • Chelan vicinity; Lake Chelan Hydroelectric Power Plant; Lake Chelan • Chelan vicinity; Lord, Richard Hinton, House; 121 E. Highland Avenue • Chelan vicinity; Lucas Homestead; Brick House Canyon • Leavenworth; Chatter Creek Guard Station; Wenatchee National Forest • Leavenworth vicinity; Lake Wenatchee Residence No. 1200; WA 207, North
Shore of Lake Wenatchee, Wenatchee National Forest • Leavenworth vicinity; Leavenworth National Fish Hatchery; 12790 Fish
Hatchery Road • Leavenworth vicinity; Penstock Bridge; Spans Wenatchee River, North of
Leavenworth on US 2 • Lucerne; Lucerne Guard Station; South Shore of Lake Chelan, Wenatchee
National Forest • Monitor; Burbank Homestead Waterwheel; Off Main Near Monitor Bridge • Monitor; West Monitor Bridge; Spans Wenatchee River • North Cascades National Park; Black Warrior Mine; Beside the Waterfall on
the West Side of the Mouth of Horseshoe Basin • Rock Island vicinity; Rock Island Railroad Bridge; SW of Rock Island Over
the Columbia River • Stehekin; Buckner Cabin; Lake Chelan National Recreation Area • Stehekin; Buckner Homestead Historic District; Stehekin Valley Road • Stehekin; Courtney Cabin; Lake Chelan National Recreation Area • Stehekin; Golden West Lodge Historic District; Stehekin Landing, Lake
Chelan National Recreation Area • Stehekin; High Bridge Ranger Station Historic District; Stehekin Valley Road,
Lake Chelan National Recreation Area • Stehekin; Miller, George, House; East Side of Lake Chelan on Stehekin Valley
Road • Stehekin; Purple Point‐‐Stehekin Ranger Station House; East Side of Lake
Chelan • Stehekin; Stehekin School; Lake Chelan National Recreation Area • Stehekin vicinity; Bridge Creek Cabin‐‐Ranger Station; Bridge Creek
Campground off Stehekin Valley Road • Stehekin vicinity; Bridge Creek Shelter; Bridge Creek Campground off
Stehekin Valley Road
Page 80 March 2009
DRAFT Chelan County Shoreline Inventory and Analysis
• Stehekin vicinity; Flick Creek Shelter; East Side of Lake Chelan South of Flick Creek
• Stehekin vicinity; High Bridge Shelter; High Bridge Campground off Stehekin Valley Road
• Stehekin vicinity; Sulphide‐‐Frisco Cabin; Bridge Creek Trail, Nine Miles North of Stehekin Valley Road
• Wenatchee; Columbia and Okanogan Steamship Company Boat Yard; On Columbia River at Foot of Fifth Street
• Wenatchee; Columbia River Bridge; Spans Columbia River Between Wenatchee and East Wenatchee
• Wenatchee; Horan, Michael, House; 2 Horan Road • Wenatchee vicinity; Columbia River Bridge at Wenatchee; U.S. Route 2 and
Wenatchee, Spanning the Columbia River • Wenatchee vicinity; Lincoln Rock; Directly Above Hwy 97, Between
Wenatchee and Entiat, Near Rocky Reach Dam • Wenatchee vicinity; Rock Island Dam; Spanning the Columbia River ‐ 8 Miles
SE of Wenatchee • Wenatchee vicinity; Wenatchee Avenue Southbound Bridge; State Route 285
at Wenatchee River • Wenatchee vicinity; Wenatchee Flat Site; Address Restricted (8/14/1973)
In addition to these known historic sites and structures, Chelan County was once home to a number of Native American tribes, many of which had permanent winter settlements along shoreline streams, rivers and lakes. The Wenatchi, Yakama, and Chelan tribes were three of the most prominent. In 1855, the Wenatchee chief and 13 other tribal leaders signed the Yakama Treaty, which ceded 10.8 million acres of land in exchange for reservation lands and other benefits. The Wenatchi, Chelan, and Yakama Tribes were now part of the “Confederated Tribes and Bands of the Yakama Nation”. In 1902 and 1903, the Wenatchi, Chelan, Entiat and a few other tribes of the original Confederated Tribes and Bands of the Yakama Nation that had not moved to the Yakama Reservation were moved to the Colville Indian Reservation. These tribes and others became the Confederated Tribes of the Colville Reservation.
Many of these tribes were highly nomadic prior to establishment at the reservations, particularly between spring and fall. As a result, artifacts and campsites may be scattered along many of Chelan County’s shorelines and other streams and lakes. Many of the County’s shorelines are or have been of significance to the tribes, as indicated by many of the waterbody names. The tribes are actively involved with fish recovery and shoreline management in general. The tribes continue to exercise their traditional treaty rights in these areas. For example, as noted on the USFWS website for the Leavenworth National Fish Hatchery, “Adult salmon returning to the Hatchery are an important component of tribal fisheries activities. The focus of the fishery is the
March 2009 Page 81
DRAFT Chelan County Shoreline Inventory and Analysis
large pool located below the Leavenworth NFH spillway. The character of the river here provides access to construct scaffolds and fishing platforms. The fishery is important to tribal members as one of the few remaining places in Washington State that offers a productive fishing opportunity utilizing traditional methods.”
3.11 Water Quality
As a requirement of Section 303(d) of the federal Clean Water Act that all waterbodies be “fishable and swimmable,” Ecology classifies waterbodies into five categories:
• Category 1: Meets tested standards, • Category 2: Waters of concern, • Category 3: No data, • Category 4: polluted waters that do not require a TMDL, and • Category 5: polluted waters requiring a TMDL.
Individual waterbodies are assigned to particular “beneficial uses” (public water supply; protection for fish, shellfish, and wildlife; recreational, agricultural, industrial, navigational, and aesthetic purposes). Waterbodies must meet certain numeric and narrative water quality criteria established to protect each of those established beneficial uses. Waterbodies may provide more than one beneficial use, and may have different levels of compliance with different criteria for those beneficial uses in different segments of the stream or lake. As a result, many waterbodies may be on the 303(d) list for more than one parameter in multiple locations. The following tables (Tables 15a‐15c) outline the different parameters for which each shoreline waterbody is designated as Category 2, 4 or 5 polluted waters.
Table 15a. Category 2 - Waters of Concern.
Waterbody
Tota
l Fre
quen
cy
Am
mon
ia-N
Chl
orpy
rifos
Die
ldrin
Dis
solv
ed O
xyge
n
Feca
l Col
iform
Gut
hion
(azi
npho
s-m
ethy
l)
pH
Tem
pera
ture
Tota
l Pol
ychl
orin
ated
B
iphe
nyls
(PC
Bs)
Tota
l Pho
spho
rus
Wat
er C
olum
n B
ioas
say
Antilon Lake 1 1 Black Lake (aka Wheeler Hill or Spring Hill Reservoir)
1 1
Page 82 March 2009
DRAFT Chelan County Shoreline Inventory and Analysis
Waterbody
Tota
l Fre
quen
cy
Am
mon
ia-N
Chl
orpy
rifos
Die
ldrin
Dis
solv
ed O
xyge
n
Feca
l Col
iform
Gut
hion
(azi
npho
s-m
ethy
l)
pH
Tem
pera
ture
Tota
l Pol
ychl
orin
ated
B
iphe
nyls
(PC
Bs)
Tota
l Pho
spho
rus
Wat
er C
olum
n B
ioas
say
Chelan River 65 32 33 Chiwawa River 6 6 Chumstick Creek 42 30 12 Columbia River 7 6 1 Dry Lake 1 1 Entiat River 1 1 Icicle Creek 65 18 10 5 32 Indian Creek 1 1 Ingalls Creek 1 1 Jack Creek 4 4 Little Wenatchee River 6 4 2
Mission Creek 76 28 4 24 20 Panther Creek 1 1 Rainy Creek 1 1 Roses Lake 6 6 Wapato Lake 20 10 10 Wenatchee River 108 14 12 33 32 17 Upper Wheeler Reservoir 1 1
White River 5 3 2 TOTAL 419 32 0 10 88 49 0 102 85 32 20 1
Table 15b. Category 4 – Polluted Waters That Do Not Require a TMDL.
Waterbody
Tota
l Of
Freq
uenc
y
Inst
ream
Flo
w
Inva
sive
Exo
tic
Spec
ies
Tem
pera
ture
Tota
l D
isso
lved
Gas
Tota
l Ph
osph
orus
Lake Chelan 2 1 1 Chumstick Creek 8 8 Columbia River 20 20 Cortez Lake 2 2 Domke Lake 1 1 Entiat River 7 2 5 Icicle Creek 6 6 Mission Creek 6 6
March 2009 Page 83
DRAFT Chelan County Shoreline Inventory and Analysis
Inva
sive
Exo
tic
Spec
ies
Tem
pera
ture
Tota
l D
isso
lved
Gas
Tota
l Ph
osph
orus
Waterbody
Tota
l Of
Freq
uenc
y
Inst
ream
Flo
w
Peshastin Creek 6 6 Roses Lake 6 6 Wapato Lake 20 10 10 Wenatchee River 5 5 TOTAL 89 33 20 5 20 11
Table 15c. Category 5 – Polluted Waters Requiring a TMDL.
Waterbody
Tota
l Fre
quen
cy
Gut
hion
(a
zinp
hos-
met
hyl)
pH
Tem
pera
ture
Tota
l PC
Bs
Tota
l Pho
spho
rus
Chl
orpy
rifos
Die
ldrin
Dis
solv
ed
Oxy
gen
Feca
l Col
iform
Wat
er C
olum
n B
ioas
say
Am
mon
ia-N
Lake Chelan 4 2 2 Chelan River 160 32 32 32 32 32 Chiwaukum Creek 5 5 Chiwawa River 2 2 Chumstick Creek 44 35 9 Columbia River 12 12 Entiat River 5 5 Icicle Creek 34 7 7 20 Little Wenatchee River 10 10
Mission Creek 208 15 30 30 6 59 15 22 31 Nason Creek 17 17 Peshastin Creek 12 12 Roaring Creek 1 1 Rock Creek 1 1 Roses Lake 6 6 Wapato Lake 10 10 Wenatchee River 290 33 33 33 33 8 38 79 33 TOTAL 821 80 103 95 65 6 15 104 15 72 199 67
Water Quality Improvement Projects or Total Maximum Daily Loads (TMDLs) have been established or are under development for Chumstick Creek, Mission Creek, other segments of the Wenatchee River Basin, Lake Chelan, and Lake Chelan tributaries as outlined in Table 16. Local governments and the local
Page 84 March 2009
DRAFT Chelan County Shoreline Inventory and Analysis
community that will be impacted by implementation of a cleanup plan develop the TMDL, with agency support. TMDLs include a description of the type, amount and sources of water pollution and analysis of the necessary pollutant reduction needed to meet water quality standards. The final result is a strategy for controlling the targeted pollutant.
Table 16. Total Maximum Daily Load (TMDL) projects in Chelan County, Including Non-Shoreline Waterbodies.
Waterbody Name Pollutant Status (Approved by EPA, Under Development or Implementation)
Mission Creek DDE DDT Approved
Wenatchee River Basin DDT Dissolved Oxygen pH10
Under Development
Wenatchee River Basin Brender Creek Chumstick Creek Eagle Creek Fox Irrigation Return Icicle Irrigation Return Little Chumstick Creek Mission Creek No Name Creek Peshastin Irrigation Return Van Creek Yaksum Creek
Fecal Coliform Approved
Wenatchee River Basin Brender Creek Chiwaukum Creek Chumstick Creek Icicle Creek Little Wenatchee River Mission Creek Nason Creek Peshastin Creek Wenatchee River
Temperature Approved
Lake Chelan Tributaries: Lake Chelan Watershed Roses Lake
DDT PCB
Approved Implementation Plan submitted to EPA on August 5, 2008
Lake Chelan Total Phosphorus Approved Source: http://www.ecy.wa.gov/programs/wq/tmdl/TMDLsbyWria/TMDLbyWria.html
The Washington State Department of Health has issued a statewide fish consumption for mercury that applies to all fresh waters and suggests that certain groups (e.g., pregnant women, children) should not eat more than two large‐ or smallmouth bass per month. Only two waterbody‐specific
10 The TMDL developed to address dissolved oxygen and pH water quality exceedances targets control of phosphorus loading as the mechanism to restore dissolved oxygen and pH parameters.
March 2009 Page 85
DRAFT Chelan County Shoreline Inventory and Analysis
consumption advisories have been issued in Chelan County: lake trout in Lake Chelan and mountain whitefish in the Wenatchee River downstream of Leavenworth. The contaminant of concern in Lake Chelan lake trout is DDT, with a recommendation to limit consumption to one fish per month. In the Wenatchee River, PCBs are a concern in mountain whitefish, with a recommendation to consume none of that species.
3.12 Opportunity Areas
Ecology’s Shoreline Master Program Guidelines (173‐26 WAC) includes the following definition:
“Restore,” “Restoration” or “ecological restoration” means the reestablishment or upgrading of impaired ecological shoreline processes or functions. This may be accomplished through measures including but not limited to re‐vegetation, removal of intrusive shoreline structures and removal or treatment of toxic materials. Restoration does not imply a requirement for returning the shoreline area to aboriginal or pre‐European settlement conditions.
Consistent with Ecology’s definition, use of the word “restore,” or any variations, in this document is not intended to encompass actions that re‐establish historic conditions. Instead, it encompasses a suite of strategies that can be approximately delineated into four categories: creation (of a new resource), restoration (of a converted or substantially degraded resource), enhancement (of an existing degraded resource), and protection (of an existing high‐quality resource).
There is a critical distinction between restoration and mitigation. Mitigation will require applicants whose shoreline proposals have adverse impacts to complete actions to mitigate those impacts or provide compensation in other ways for losses of ecological function. The County and Cities cannot require applicants to go beyond returning the impacted area (or compensating in other ways for lost functions) to the condition it was in at the time of this inventory or as further detailed at the time of application. However, the County and Cities can encourage applicants to implement restoration actions that will improve ecological functions relative to the applicant’s pre‐project condition. As stated in WAC 173‐26‐201(2)(c):
It is intended that local government, through the master program, along with other regulatory and nonregulatory programs, contribute to restoration by planning for and fostering restoration and that such restoration occur through a combination of public and private programs and actions. Local government should identify restoration opportunities
Page 86 March 2009
DRAFT Chelan County Shoreline Inventory and Analysis
through the shoreline inventory process and authorize, coordinate and facilitate appropriate publicly and privately initiated restoration projects within their master programs. The goal of this effort is master programs which include planning elements that, when implemented, serve to improve the overall condition of habitat and resources within the shoreline area of each city and county.”
The Opportunity Areas discussions in this section and in Chapter 4 present options for “restoration” that would improve ecological functions. For example, enhancement of riparian vegetation, reductions or modifications to shoreline hardening, minimization of in‐ and over‐water structures, and improvements to fish passage would each increase one or more ecological parameters of the County and Cities’ shorelines. These options could be implemented voluntarily by the local governments, non‐profit entities, residents or, depending on specific project details, could be required measures to mitigate adverse impacts of new shoreline projects.
The mission statement of the Upper Columbia Salmon Recovery Board (UCSRB), whose planning area includes all of Chelan County except for the Chelan watershed, is:
To restore viable and sustainable populations of salmon, steelhead, and other at risk species through collaborative, economically sensitive efforts, combined resources, and wise resource management of the Upper Columbia region.
The Upper Columbia Spring Chinook Salmon and Steelhead Recovery Plan (UCSRB 2007) summarizes 12 factors for decline of the covered species:
• Social, Cultural, and Economic Factors • Public Policy • Management Actions • Harvest • Hatcheries • Hydropower • Habitat (includes alteration from land use practices, logging, mining,
diversions, and other uses) • Ecological Factors • Factors Outside the ESU [Evolutionarily Significant Unit] and DPS
[Distinct Population Segment] 11
11 ESU and DPS are terms used by National Marine Fisheries Service and U.S. Fish and Wildlife Service, respectively, to identify “distinct populations that are substantially reproductively isolated from other conspecific populations and that represent an important component of the evolutionary legacy of the species.”
March 2009 Page 87
DRAFT Chelan County Shoreline Inventory and Analysis
• Interaction of Factors • Current Threats • Uncertainties
Development and implementation of the updated SMP and its components will primarily influence public policy, management actions, and habitat factors, either directly or indirectly.
Projects included on the Restoration Projects maps in the enclosed DVD originate from data provided by Chelan County Department of Natural Resources and the Cascadia Conservation District.
A Restoration Plan document will be prepared in 2009 as a later phase of the Shoreline Master Program update process, consistent with WAC 173‐26‐201(2)(f). The Restoration Plan will “include goals, policies and actions for restoration of impaired shoreline ecological functions. These master program provisions should be designed to achieve overall improvements in shoreline ecological functions over time, when compared to the status upon adoption of the master program.” The Restoration Plan will mesh the specific potential projects mapped or identified in this report, with regional or County/City‐wide efforts and programs of the County or Cities, watershed planning entities, and environmental organizations that contribute or could potentially contribute to improved ecological functions of the shoreline. Prioritization of specific projects and project types, implementation strategies, and schedules will be based on information found in watershed or basin plans.
The Stemilt/Squilchuck ‐ Colockum watershed (WRIA 40a/b) is approximately 49,000 acres, and includes two shoreline streams/rivers and five lakes. The area of upland shoreline jurisdiction totals 739 acres along 137,001 linear feet (26 miles) of shoreline. A summary table (Table 17) provides further details on each waterbody’s shoreline characteristics.
Page 88 March 2009
DRAFT Chelan County Shoreline Inventory and Analysis
Table 17. Summary Table of Basic Characteristics of Each Shoreline Waterbody in WRIA 40a/b
Evergreen forest 62%; scrub/shrub 22%; high-intensity development 12%
• PHS elk • 7% wetland • 82.3% geohazard
1 Major existing land use is reported by acres located in the shoreline jurisdiction rather than full parcels. “Government/Utility” includes governmental services, utilities, and other transportation and communication utilities. 2 Acres of shoreline owned by public or private entities. Public includes municipal, County, PUD, state, and federal lands. 3 Three dominant types listed. Consult maps for distribution and other types. 4 PHS = Priority Habitat or Species as identified by WDFW 5 Owned by the Stemilt Project irrigation purveyor.
4.1.1 Land Use Patterns Existing and Planned Uses
WRIA 40a/b is dominated by resource lands, including commercial agriculture and commercial forestry. Residential and industrial uses tend to congregate closer to the Columbia River and other waterbodies in the eastern portion of the WRIA (RH2 Engineering, Inc. 2007). The shorelands within WRIA 40a/b exhibit the following existing land uses:
DRAFT Chelan County Shoreline Inventory and Analysis
• Undeveloped – 27%
The existing land uses vary by individual waterbody, with some shorelines dominated by governmental/utility uses (Stemilt Project Reservoir, Black Lake, Columbia River), resource uses (Upper Wheeler Reservoir), and rural residential (Cortez Lake, Colockum Creek), and undeveloped lands (Meadow Lake). While “governmental/utilities” represents the largest current use category on the Columbia River, its shoreline is characterized by the widest variety of existing uses, including single‐family, agriculture, other natural resource, transportation, and manufacturing. The Columbia River is the only shoreline in WRIA 40a/b with transportation and manufacturing activities.
The County Comprehensive Plan includes a variety of rural and urban land use designations. WRIA 40a/b is predominantly rural in character and planned to continue that way. Much of the area along the Malaga Alcoa Highway in the Malaga community is designated for limited areas of more intensive rural development (LAMIRDs). LAMIRDs are designated in accordance with the Growth Management Act to identify more intense areas of existing development, and to minimize and contain those existing developed areas within the rural lands. LAMIRDs in the County Comprehensive Plan include:
• Rural Waterfront: Provides the opportunity for the development, redevelopment and infill of existing intensely developed shoreline areas for residential, and water related/water dependant recreational and tourist development.
• Rural Recreational and Residential: Provides provide the opportunity for the development, redevelopment and infill of existing intensely developed rural recreational/residential areas for residential, recreational and tourist development.
• Rural Village: Recognizes the existence of intensely developed rural residential developments and communities, with densities less than 2.5 acres per dwelling unit, which typically will not have sewer service.
• Rural Commercial: Provide for a range of commercial uses to meet the needs of local residents, and small scale tourist or recreational uses including commercial facilities to serve those recreational or tourist uses within the rural areas to meet the needs of local residents and visitors.
• Rural Industrial: Recognize the need for rural industrial and resource based industrial activities within the rural areas.
Except for Rural Waterfront, all of the LAMIRD designations are present in WRIA 40a/b. In the shoreline jurisdiction, the predominant LAMIRD is Rural Industrial, which is designated along the Columbia River. Rural Recreational and Residential is designated surrounding Cortez Lake and applies to the golf course and homes.
March 2009 Page 91
DRAFT Chelan County Shoreline Inventory and Analysis
Chelan County has planned the following uses for all the shorelines as a whole:
Based on Chelan County’s Comprehensive Plan, future land uses vary by waterbody as shown in Table 17. Rural Residential categories are designated along Colockum Creek, Cortez Lake, and Stemilt Project Reservoir. Resource lands categories predominate on the Black Lake, Meadow Lake, and Upper Wheeler Reservoir shorelines. Various categories of Rural Residential and Rural Industrial are planned on the Columbia River.
Current environment designations include Rural and Conservancy for shorelines currently in jurisdiction (see Table 18). Except along the Columbia River which shows both designations, only single designations are applied along smaller waterbodies, either Rural or Conservancy.
Table 18. WRIA 40a/b Shorelines Land Use, Comprehensive Plan Designation, and Shoreline Environment Designation
Jurisdictional Streams/
Lakes (Existing/ Future Acres)
Existing Land Use Comprehensive Plan Designation (Chelan County)
Current Shoreline Environment Designation
(Chelan County)
Streams/Rivers Colockum Creek (167.66/ 180.48)
Single Family 48%, Undeveloped 39%, Agriculture 12%, Natural Resources <1%
• Rural Residential (5, 10, 20)
• 180.48 acres/100%
--
Columbia River (341.39/ 381.01)
Government/Utility 32%, Undeveloped 24%, Natural Resources 14%, Single Family Residential 11%, Agriculture 11%, Manufacturing/ Industrial 6%, Transportation 2%, No Category <1%
• Rural Residential (2.5, 5, 20)
• Rural Industrial
• Urban Growth Area
• 222.37 acres/58%
• 158.64 acres/42%
• 0.3/<1%
• Conservancy • Rural
Lakes Black Lake (aka Spring Hill
Government/Utility 44%, Forestry 30%, Undeveloped
• Commercial Forest Lands
• 30.20 acres/ 100%
• Conservancy
12 The UGA area is 0.30 acres. The WRIA 40a/b analysis is intended to focus on non‐City and non‐UGA lands. However, the data that the County and the individual cities maintain is not always 100% edge‐matched. The small UGA figures are likely the result of slight discrepancies in boundary digitization.
Page 92 March 2009
DRAFT Chelan County Shoreline Inventory and Analysis
Jurisdictional Streams/
Lakes (Existing/ Future Acres)
Existing Land Use Comprehensive Plan Designation (Chelan County)
Current Shoreline Environment Designation
(Chelan County)
or Wheeler Hill Reservoir) (30.20/ 30.20)
26%
Cortez Lake (31.22/ 33.24)
Other Residential 69%, Single Family Residential 26%, Cultural/Recreation/ Assembly 4%
• Rural Recreation & Resource
• 33.24 acres/ 100%
• Rural
Meadow Lake (27.74/ 30.88)
Undeveloped 52%, Agriculture 30%, Single Family Residential 18%
There are two planning efforts sponsored by Chelan County in conjunction with local citizens and stakeholders that have influenced plans or activities in WRIA 40a. The Malaga Community Vision Subarea Plan focuses on the community of Malaga and the future vision and land use. The Stemilt‐Squilchuck Community Vision addresses the basin‐level conservation and development of the Stemilt‐Squilchuck basin area in WRIA 40a. Each plan is described below.
Malaga Community Vision Subarea Plan
In 2005 and 2006, the Malaga Area Vision plan was developed to identify the vision and potential land use designations that implement the vision for the Malaga community. The BOCC adopted the recommendations in 2006.
The vision, originally adopted in the year 2000 into the County Comprehensive Plan, states:
The citizens of the Malaga‐Stemilt‐Squilchuck Study Area believe that their greatest asset is the rural character of the community. Rural character may be defined as that mixture of open space, housing, and agricultural land
March 2009 Page 93
DRAFT Chelan County Shoreline Inventory and Analysis
uses which are believed to express and preserve the quality of life desired by the residents.
The citizens of the Malaga‐Stemilt‐Squilchuck Study Area envision future development that will complement and enhance, and not unreasonably impact, our rural character, our strong agricultural economy, and natural resource based industries.
We foresee maintaining the areaʹs high quality of life while sustaining growth that can be served with the necessary public services and, facilities. Open spaces, wildlife conservation, and recreational opportunities will be encouraged.
We foresee expansion of transportation systems to allow efficient movement of goods, services and people within the planning area and connecting with the rest of Chelan County.
We foresee the establishment of quality educational facilities to meet the needs of community growth.
We foresee varied levels of development with suitable mitigation between different land uses. We envision that the expansion of our existing residential, commercial and industrial land uses will take place in those areas already characterized by that type of use.
We foresee the requirement to support sustainable hydroelectric power generation to maintain and meet our community growth.
In recognition of the importance of preservation of existing water rights and future need for water for our community and its agricultural base; we foresee the continued support, development and expansion, and maintenance of water supplies and their associated sources.
In conclusion we envision growth that will maintain the continuity of our rural character and quality of life while protecting the private property rights of the citizens of this area.
In the Malaga area, the future land use designations along the Columbia River, and Meadow Lake were largely left intact, but the designations outside of the shoreline jurisdiction and south of the Malaga Alcoa Highway and north of Malaga/Saturday Road were modified to add greater areas of Rural Residential Recreation, Rural Village, Rural Commercial, and Rural Residential 2.5. A small area changed to Rural Residential Recreation around Cortez Lake. All of these changes recognize the Malaga area as a LAMIRD consistent with the Growth Management Act.
Page 94 March 2009
DRAFT Chelan County Shoreline Inventory and Analysis
Stemilt-Squilchuck Community Vision
The Washington State Department of Natural Resources (WDNR) proposed to privatize 2,500 acres of public land in the Stemilt basin. Chelan County formed The Stemilt Partnership including agriculture, wildlife, recreation, development, and conservation representatives. The plan describes a landscape‐based vision and strategies for the overall Stemilt‐Squilchuck basin that form a portion of WRIA 40a and places the importance of the exchange parcels in the context of the basin. The vision includes the following:
• Water resources are protected, ensuring adequate water supply for irrigation and domestic purposes
• Wildlife resources are conserved, maintaining critical habitat and corridors
• Recreational access to hunting grounds, trails, fishing reservoirs, and other recreational lands is maintained and enhanced where appropriate, and
• New development is low impact and well‐planned, considers multiple uses where appropriate, and meets the requirements of the community’s shared goals.
A conceptual plan identifies areas in use for agricultural activities as well as areas that are suitable or should be managed as snow retention areas, primary wildlife and habitat areas, secondary wildlife and habitat areas, recreational resources, and water storage priority. In terms of the shoreline jurisdiction waterbodies, the plan identifies the following:
• Columbia River: the land along the river is shown for low, moderate, and high development intensity, recreational resources, as well as agriculture
• Cortez Lake: lakeside property is shown for high development intensity • Meadow Lake: lakeside property is shown for agriculture and low and
moderate development intensity • Upper Wheeler Reservoir: land surrounding the reservoir is shown as
low development intensity, primary wildlife and habitat area, snow retention area, water storage priority area and recreational resource
• Black Lake (Spring Hill Reservoir): shown as primary wildlife and habitat area, water storage priority area, and recreational resource
• Stemilt Project Reservoir: shown with low development intensity, primary wildlife and habitat areas, and water storage priority area
Colockum Creek is not included in the boundaries of the vision plan.
A land exchange between WDNR and Western Pacific Timber, LLC occurred in February 2008, but did not include the 2,500‐acre Stemilt property (The Stemilt Partnership and Trust for Public Land, September 2008).
March 2009 Page 95
DRAFT Chelan County Shoreline Inventory and Analysis
The vision plan includes strategies to help implement the plan. The plan is a resource for the County, citizens, and stakeholder groups. It has not been adopted by the BOCC as part of the County’s Comprehensive Plan (pers. com., Lilith Yanagimachi, November 3, 2008).
Water-Oriented Uses
In WRIA 40a/b, potential water‐oriented uses include agriculture at 68 acres, with most of the acreage on the Columbia River, followed by Colockum Creek and Meadow Lake. Also there are 9 acres of open space (noncommercial forest) along Black Lake (Spring Hill Reservoir).
Developing or Redeveloping Waterfronts
WRIA 40a/b shorelines tend to have parcels without buildings as follows:13
• Black Lake – 4 parcels or 100% of shoreline acres • Colockum Creek – 18 parcels, 54% of shoreline acres • Columbia River – 65 parcels or 60% of shoreline acres • Cortez Lake – 18 parcels or 35% of shoreline acres • Meadow Lake – 5 parcels or 59% of shoreline acres • Stemilt Project Reservoir – 5 parcels or 99% of shoreline acres • Upper Wheeler Reservoir – 2 parcels or 5% of shoreline acres
As undeveloped lands convert to the planned future land uses, the shorelines are likely to see added single‐family rural residential dwellings, which make up 23% of current uses, but are planned for 65% of the shorelands. Likewise, manufacturing/industrial uses account for 3% of the existing shoreline uses but are planned for 22% of the shoreline as rural industrial. Lands in government/utility uses may not convert to rural residential or industrial uses since government/utility uses are allowed activities in multiple County land use and zoning districts.
4.1.2 Existing and Potential Public Access WRIA 40a/b shorelines include properties characterized as open space that are either publicly owned or protected from development. Open space in the shoreline jurisdiction totals about 166 acres. Most of the acreage is on the Columbia River. By waterbody, the acres and the percent of that shoreline in open space are presented below:
• Colockum Creek, over 2 acres, 2% of shoreline jurisdiction
13 Note: Selected parcels have a BLDGAV of $0. All parcels with the following Assessor Use Codes have been excluded from this analysis: ʹagriculture‐not in open spaceʹ; ʹagric in open space rcw 84.34ʹ; ʹdesig forest land rcw 84.33ʹ; or ʹmining activitiesʹ.
Page 96 March 2009
DRAFT Chelan County Shoreline Inventory and Analysis
• Columbia River, approximately 162 acres, 47% of shoreline jurisdiction
• Black Lake (aka Spring Hill Reservoir or Wheeler Hill Reservoir), approximately 13 acres, 44% of shoreline jurisdiction
• Upper Wheeler Reservoir, over 1 acre, 4% of shoreline jurisdiction
Though there are areas of open space, no parks or recreation facilities have been inventoried along the two shoreline streams/rivers and five lakes.
Chelan County’s Comprehensive Parks and Recreation Plan includes recommendations for subarea parks planning in the Malaga area. It also calls for a County trails plan. Depending on the more detailed parks planning results, additional shoreline public access may be possible. Other Comprehensive Parks and Recreation Plan recommendations address the Stemilt Basin Land Exchange. However, this project would not address public access on shorelines of the State.
4.1.3 Critical Areas Shorelines in WRIA 40a/b contain a combined total of 569 acres of priority habitats and habitat features, including wetlands, riparian zones, cliffs/bluffs, elk and mule deer habitat, and wood duck breeding areas (see Table 16 above). The river and the stream each contain priority fish species as well. According to the NWI and hydric soils information, as much as 17% of the total shoreline area may be wetlands. Geologically hazardous areas (as mapped by WDNR) are common, particularly around the three reservoirs, which are considered to have 100% geohazard coverage.
Potential Restoration Opportunities The purpose of the WRIA 40a Watershed Plan (RH2 Engineering Inc. 2007) was to assess water quantity and multi‐purpose water storage. Water quality, instream flow, and habitat were not direct components of the WRIA 40a plan. However, as the plan notes:
“…increasing the flow and expanding the timing of water in streams may benefit riparian and wetland habitat conditions. Diverting excess storm runoff may reduce flooding risk, preserve instream habitat and mitigate some of the effects of development. Enlarging or creating new reservoirs may create new recreational and/or habitat conditions.”
Actions and facilities that increase storage may also “substantially modify the landscape and change hydrologic conditions,” potentially to the detriment of in‐stream and riparian habitats.
The WRIA 40a Watershed Plan is the deliverable for Phase 3 of the watershed planning process. Phase 4 (implementation plan) is underway. When specific
March 2009 Page 97
DRAFT Chelan County Shoreline Inventory and Analysis
projects are carried forward for agency permits or grant funding, specific environmental assessments will be conducted that will evaluate the possible benefits and adverse impacts of each water quantity or water storage project. Any adverse impacts would be mitigated consistent with rules and guidelines established by the various reviewing agencies, which may include the U.S. Army Corps of Engineers, Washington Department of Fish and Wildlife, Washington Department of Ecology, National Marine Fisheries Service, U.S. Fish and Wildlife Service, Washington Department of Natural Resources, tribal governments, local government, and others.
WDFW completed a Diversion Screening and Fish Passage Inventory Report for Colockum Creek, Stemilt Creek and Squilchuck Creek in 2006. In the area of Colockum Creek identified as shoreline jurisdiction, at least five potential barriers to fish passage were identified. These are all recommended for removal or repair, as they block or hinder anadromous salmonids access to suitable habitat upstream. According to WDFW (2006), “Reconnecting fragmented habitat, increasing fish passage and decreasing juvenile mortality by correcting all passage barriers and screening surface water diversions could realistically be attained in the Colockum watershed due to the low quantity of barriers, habitat quality and current fish distribution.”
4.2 Wenatchee (WRIA 45)
The Wenatchee watershed (WRIA 45) is approximately 1,370 square miles, and contains 45 shoreline streams/rivers and 29 shoreline lakes. The area of upland shoreline jurisdiction totals 24,652 acres along 2,159,741 linear feet (409 miles) of shoreline. The headwaters of WRIA 45 originate in the Cascade Mountain range as the Little Wenatchee and White Rivers. These rivers flow into Lake Wenatchee, the source of the Wenatchee River. Various tributaries to the Wenatchee River add significant volume to the river (WRIA 45 Planning Unit 2006). A summary table (Table 19) provides further details on each waterbody’s shoreline characteristics.
Page 98 March 2009
DRAFT Chelan County Shoreline Inventory and Analysis
Table 19. Summary Table of Basic Characteristics of Each Shoreline Waterbody in WRIA 45, Outside of Cities and their Urban Growth Areas.
Juris
dict
iona
l St
ream
s/La
kes
Are
a of
Upl
and
Shor
elin
e Ju
risdi
ctio
n (a
cres
)
Maj
or E
xist
ing
Land
Use
s1
Ow
ners
hip
Prof
ile2
Vege
tatio
n Pr
ofile
3
Crit
ical
A
rea/
Prio
rity
Hab
itat o
r Sp
ecie
s (P
HS)
5 Pr
esen
ce
Streams/Rivers
Big Meadow Creek 56.12 Government/
Utility
• Public (Federal) 100%
Evergreen forest 93%; low intensity development 4%; woody wetlands 3%
1 Major existing land use is reported by acres located in the shoreline jurisdiction rather than full parcels. “Government/Utility” includes governmental services, utilities, and other transportation and communication utilities. 2 Acres of shoreline owned by public or private entities. Public includes municipal, County, PUD, state, and federal lands. 3 Three dominant types listed. Consult maps for distribution and other types. 4 There is no parcel-based current land use data for numerous waterbodies that are 100% in Federal ownership. 5 PHS = Priority habitats and species as identified by WDFW
4.2.1 Land Use Patterns Existing and Planned Land Uses
The combined WRIA 45 shorelines exhibit the following existing land uses:
• Agriculture – 3% • Commercial – 1% • Cultural/Recreation/Assembly – 1% • Forestry – 11% • Government/Utility – 58% • Manufacturing/Industrial – <1% • Natural Resources – 1% • No Category – 1% • Open Space – 3% • Other Residential – 11% • Single Family Residential – 6%
Page 110 March 2009
DRAFT Chelan County Shoreline Inventory and Analysis
• Transportation – <1% • Undeveloped Land – 3%
Government/utility uses and resource lands (forestry, agriculture, other natural resources) dominate along a majority of the 75 shorelines under review. Shorelines exhibiting a wider mix of uses, such as residential, commercial, industrial, recreation, or other uses, include:
• Chiwaukum Creek • Chiwawa River • Chumstick Creek • Colchuck Lake • Columbia River • Fish Lake • Icicle Creek • Lake Wenatchee • Mission Creek • Nason Creek • Peshastin Creek • Wenatchee River • White River
WRIA 45 contains unincorporated and incorporated lands. Unincorporated lands are under the jurisdiction of Chelan County. The County has planned the following uses for its shorelines as a whole:
• Commercial Agricultural Lands – 1% • Commercial Forest Lands – 65% • Industrial – <1% • Commercial Mineral – <1% • Public Lands and Facilities – 1% • Rural Commercial – <1% • Rural Industrial – <1% • Rural Residential – 24% • Rural Recreational and Resource – <1% • Rural Village –<1% • Rural Waterfront – 2% • Urban Growth Area –<1%14 • Water – 5%
14 The UGA area is 64.71 acres – a fraction of the total shoreline acres of 24,652. The WRIA 45 analysis is intended to focus on non‐City and non‐UGA lands. However, the data that the County and the individual cities maintain is not always 100% edge‐matched. The small UGA figures are likely the result of slight discrepancies in boundary digitization.
March 2009 Page 111
DRAFT Chelan County Shoreline Inventory and Analysis
Based on Chelan County’s Comprehensive Plan, future land uses vary by waterbody as shown in Table 20. Shorelines that are dominated by government/utility uses or forestry uses tend to be designated as Commercial Forest Lands. Shorelines planned for a wider variety of uses including residential, commercial, industrial, recreation, or other uses tend to be those that currently exhibit a variety of uses.
Current shoreline use environment designations vary by waterbody, but typically include Rural and Conservancy through most of the unincorporated areas, though there are several areas identified as Natural, and more limited areas as Urban. Numerous shorelines are not currently in the SMP jurisdiction, but appear to meet thresholds for jurisdiction in the proposed SMP based on currently available information.
Table 20. WRIA 45 Land Use, Comprehensive Plan Designation, and Shoreline Environment Designation
Single Family Residential (28%), Government/ Utility (24%), Forestry (19%), Other Residential (16%), Agriculture (7%), Undeveloped Land (3%), No Category (2%), Cultural/Recreation/ Assembly (1%)
Existing Land Use Comprehensive Plan Designation (Chelan County)
Current Shoreline
Environment Designation
(Chelan County) Rock Creek (no info. 1/ 268.89)
Not applicable 1 • Commercial Forest Lands
• 268.89 acres/ 100%
--
SF Chiwaukum Creek (159.92/ 159.92)
Government/Utility (100%)
• Commercial Forest Lands
• 159.92 acres/ 100%
• Conservancy
Snowall Creek (no info. 1/ 106.93)
Not applicable 1 • Commercial Forest Lands
• 106.93 acres/ 100%
--
Thunder Creek (no info. 1/ 119.45)
Not applicable 1 • Commercial Forest Lands
• 119.45 acres/ 100%
--
Trapper Creek (no info. 1/ 109.11)
Not applicable 1 • Commercial Forest Lands
• 109.11 acres/ 100%
--
Trout Creek (no info. 1/ 85.21)
Not applicable 1 • Commercial Forest Lands
• 85.21 acres/ 100%
--
Wenatchee River (2,388.22/ 3,955.95)
Government/ Utility (30%), Other Residential (24%), Single Family Residential (12%), Forestry (11%), Agriculture (8%), Undeveloped (6%), Commercial (3%), No Category (2%), Open Space (1%), Cultural/Recreation/ Assembly (1%)
• Rural Residential (2.5, 5, 10, 20)
• Water • Commercial
Forest Land • Commercial
Agricultural Land • Rural Waterfront • Public Lands
Existing Land Use Comprehensive Plan Designation (Chelan County)
Current Shoreline
Environment Designation
(Chelan County) White River (1,905.18/ 2,820.15)
Government/ Utility (51%), Forestry (18%), Open Space (17%), Other Residential (5%), Undeveloped (4%), Natural Resources (2%), Single Family Residential (2%), Cultural/Recreation/ Assembly (1%)
• Rural Residential (5, 10, 20)
• Commercial Forest Land
• Water • Commercial
Mineral • Rural Waterfront
• 1,847.38 acres/ 66%
• 800.42 acres/
28% • 158.47 acres/
6% • 11.33 acres/
<1% • 2.55 acres/ <1%
• Natural
Whitepine Creek (94.30/ 296.49)
Government/ Utility (100%)
• Commercial Forest Land
• 296.49 acres/ 100%
• Natural
Wildhorse Creek (no info. 1/ 130.62)
Not applicable 1 • Commercial Forest Land
• 130.62 acres/ 100%
--
Lakes Chiwaukum Lake (45.58/ 45.58)
Government/Utility (100%)
• Commercial Forest Land
• 45.58 acres/ 100%
• Natural
Colchuck Lake (48.86/ 48.86)
Commercial (68%), Government/Utility (32%)
• Commercial Forest Land
• 48.86 acres/ 100%
• Natural
Eightmile Lake (48.00/ 48.00)
Government/ Utility (100%)
• Commercial Forest Land
• 48.00 acres/ 100%
• Natural
Fish Lake (246.65/ 257.68)
Government/ Utility (76%), Cultural/Recreation/ Assembly (20%), Other Residential (4%)
• Commercial Forest Land
• Public Lands and Facilities
• Rural Residential (2.5, 20)
• Rural Village • Water
• 113.50 acres/ 44%
• 80.84 acres/ 31%
• 50.24 acres/ 19%
• 11.61 acres/ 5% • 1.49 acres/ 1%
• Conservancy • Natural
Glasses Lake (no info. 1/ 25.97)
Not applicable 1 • Commercial Forest Land
• 25.97 acres/ 100%
--
Heather Lake (no info. 1/ 43.08)
Not applicable 1 • Commercial Forest Land
• 43.08 acres/ 100%
--
Josephine Lake (no info. 1/ 20.62)
Not applicable 1 • Commercial Forest Land
• 20.62 acres/ 100%
--
Klonaqua Lakes Lower (1) (35.75/ 36.04)
Government/ Utility (100%)
• Commercial Forest Land
• 36.04 acres/ 100%
• Natural
Klonaqua Lakes Upper (2) (20.91/ 38.03)
Government/ Utility (100%)
• Commercial Forest Land
• 38.03 acres/ 100%
• Natural
March 2009 Page 117
DRAFT Chelan County Shoreline Inventory and Analysis
Existing Land Use Comprehensive Plan Designation (Chelan County)
Current Shoreline
Environment Designation
(Chelan County) Square Lake (no info. 1/ 50.50)
Not applicable 1 • Commercial Forest Land
• 50.50 acres/ 100%
--
Stuart Lake (34.20/ 34.20)
Government/ Utility (100%)
• Commercial Forest Land
• 34.20 acres/ 100%
--
Theseus Lake (no info. 1/ 25.61)
Not applicable 1 • Commercial Forest Land
• 25.61 acres/ 100%
--
Twin Lakes (1) (33.87/ 34.03)
Government/ Utility (100%)
• Commercial Forest Land
• 34.03 acres/ 100%
--
Twin Lakes (2) (102.29/ 103.30)
Government/ Utility (100%)
• Commercial Forest Land
• 103.30 acres/ 100%
--
1 There is no parcel-based current land use data for numerous waterbodies that are 100% in Federal ownership.
Water-Oriented Uses
Water‐oriented uses along shorelines in WRIA 45 include agriculture, parks/recreation/recreational activities, resorts and group camps, hotel/motel, eating and drinking places, and others. The following shorelines may contain water‐oriented uses totaling 1,628 acres:
• Chiwaukum Creek – 13 acres in non‐commercial forest open space • Chiwawa River – approximately 24 acres in non‐commercial forest
open space, 3 acres in general open space and less than 1 acre in resort and group camps
• Chumstick Creek – approximately 3 acres in agriculture • Columbia River – about 16 acres in parks and open space and less
than 1 acre in agriculture • Fish Lake – approximately 49 acres in recreational activities • Icicle Creek – approximately 55 acres in agriculture, 33 acres in non‐
commercial forest open space, 3 acres in resort and group camps, 2 acres in general open space, and less than 1 acre in hotel/motel
• Ingalls Creek – about 4 acres in non‐commercial forest open space • Little Wenatchee River – about 21 acres in general open space and 19
acres in non‐commercial forest open space • Mission Creek – approximately 136 acres in agriculture and 6.53 acres
in non‐commercial forest open space • Napeequa River –approximately 33 acres in recreational activities • Nason Creek – about 207 acres in non‐commercial forest open space, 7
acres in eating/drinking, 5 acres in hotel/motel, and 2 acres in general open space
March 2009 Page 119
DRAFT Chelan County Shoreline Inventory and Analysis
• Peshastin Creek – approximately 36 acres in agriculture and 20 acres in non‐commercial forest open space
• Lake Wenatchee – about 24 acres in general open space, 9 acres in resort and group camps, and 6 acres in non‐commercial forest open space
• Wenatchee River – approximately 210 acres in open space (non‐commercial forest), 200 acres in agriculture, 27 acres in parks and open space, 16 acres in recreational activities, and less than 1 acre in eating/drinking
• White River – about 345 acres in parks and open space and 59 acres in non‐commercial forest open space
Developing or Redeveloping Waterfronts
WRIA 45 shorelines tend to have parcels without buildings largely due to the commercial forest lands in the watershed (Table 21).
Table 21. WRIA 45 Shorelines and Parcels without Buildings.
Waterbody Total Parcels Total Acres
Parcels Without Buildings
Parcels without Buildings - Acres
% Without Buildings
Big Meadow Creek 3 55 3 55 100% Chikamin Creek 8 154 6 117 76% Chiwaukum Creek 31 395 21 374 95% Chiwaukum Creek South Fork 6 160 6 160 100%
Chiwaukum Lake 2 46 2 46 100% Chiwawa River 189 1,800 67 1,572 87% Chumstick Creek 124 192 28 29 15% Colchuck Lake 3 49 3 49 100% Columbia River 41 56 36 56 100% Eightmile Creek 15 201 10 199 99% Eightmile Lake 4 48 4 48 100% Fish Lake 57 247 15 188 76% Icicle Creek 273 959 131 609 63% Ingalls Creek 22 526 19 521 99% Jack Creek 1 3 1 3 100% Klonaqua Lakes (1) Lower 1 36 1 36 100%
Klonaqua Lakes (2) Upper 1 21 1 21 100%
Lake Augusta 1 22 1 22 100% Lake Victoria 2 26 2 26 100% Lake Wenatchee 360 284 111 142 50% Little Wenatchee River 20 563 16 475 84%
Loch Eileen Lake 2 22 2 22 100% Mill Creek 7 55 7 55 100% Mission Creek 133 306 23 38 12%
Page 120 March 2009
DRAFT Chelan County Shoreline Inventory and Analysis
Waterbody Total Parcels Total Acres
Parcels Without Buildings
Parcels without Buildings - Acres
% Without Buildings
Mountaineer Creek 8 147 8 147 100% Nada Lake 4 37 4 37 100% Napeequa River 35 232 20 198 85% Nason Creek 247 1,249 142 912 73% Perfection Lake 2 29 2 29 100% Peshastin Creek 210 497 70 233 47% Phelps Creek 10 252 7 222 88% Pole Creek 1 5 1 5 100% Roaring Creek 3 2 2 1 47% Shield Lake 2 36 2 36 100% Snow Lake - Lower 4 54 4 54 100% Snow Lake - Upper 3 62 3 62 100% Stuart Lake 1 34 1 34 100% Trout Creek 2 85 2 85 100% Twin Lakes (1) 1 34 1 34 100% Twin Lakes (2) 4 102 4 102 100% Wenatchee River 1,453 2,400 598 1,467 61% White River 127 1,905 88 1,518 80% Whitepine Creek 4 94 4 94 100% TOTAL 3,428 13,503 1,480 10,154 75%
Note: Selected parcels have a BLDGAV of $0. All parcels with the following Assessor Use Codes have been excluded from this analysis: 'agriculture-not in open space'; 'agric in open space RCW 84.34'; 'desig. forest land RCW 84.33'; or 'mining activities'.
Most of the shoreline land is under government/utility use, and is expected to remain in that pattern even where there are vacant parcels. Where undeveloped lands convert to the planned future land uses, the shorelines are likely to see added rural residential which makes up 17% of current uses but is planned over 24% of the shoreline lands.
Lake Wenatchee and the Wenatchee River were the locations of numerous County shoreline permits between 2000 and 2007 (see Tables 4c and 4i in Section 2.3 above).
4.2.2 Existing and Potential Public Access Parks and open space are found along numerous shorelines in WRIA 45. Open space is estimated at approximately 24,699 acres (Table 22). Park acres total about 17 acres and are found along the Columbia and Wenatchee Rivers.
Table 22. Open Space along Shorelines in WRIA 45.
Waterbody Total Acres Open Space Acres % Open Space Big Meadow Creek 56 56 100% Boulder Creek 2 46 46 100%
March 2009 Page 121
DRAFT Chelan County Shoreline Inventory and Analysis
Waterbody Total Acres Open Space Acres % Open Space Buck Creek 175 175 100% Cady Creek 145 145 100% Chikamin Creek 154 117 76% Chiwaukum Creek 399 366 92% Chiwaukum Creek South Fork 160 160 100% Chiwaukum Lake 46 46 99% Chiwawa River 3,275 2,971 91% Chumstick Creek 221 2 1% Colchuck Lake 49 49 100% Columbia River 114 33 29% Cougar Creek 3 3 109% Eightmile Creek 201 200 100% Eightmile Lake 48 48 100% Fish Creek 2 166 166 100% Fish Lake 258 255 99% French Creek 357 357 100% Glasses Lake 26 26 100% Heather Lake 43 43 100% Ibex Creek 34 34 101% Icicle Creek 1,814 1,244 69% Indian Creek 342 342 100% Ingalls Creek 527 500 95% Jack Creek 412 412 100% Josephine Lake 21 21 98% Klonaqua Lakes (1) Lower 36 36 100% Klonaqua Lakes (2) Upper 38 38 100% Lake Augusta 22 22 99% Lake Creek 2 196 196 100% Lake Leland 28 28 100% Lake Valhalla 24 24 100% Lake Victoria 26 26 98% Lake Wenatchee 321 175 54% Larch Lake 27 27 98% Leland Creek 234 234 100% Lichtenwasser Lake 23 23 102% Lightning Creek 40 40 100% Little Wenatchee River 1,433 1,320 92% Loch Eileen Lake 22 22 99% Lost Lake 26 26 99% Meadow Creek 94 94 100% Mill Creek 65 65 100% Mission Creek 325 6 2% Mountaineer Creek 147 147 100% Nada Lake 37 37 100% Napeequa River 933 889 95%
Page 122 March 2009
DRAFT Chelan County Shoreline Inventory and Analysis
Waterbody Total Acres Open Space Acres % Open Space Nason Creek 1,522 850 56% Panther Creek 209 209 100% Perfection Lake 29 29 100% Peshastin Creek 644 146 23% Phelps Creek 295 290 98% Pole Creek 5 5 103% Prospect Creek 71 71 100% Rainy Creek 238 238 100% Rock Creek 269 269 100% Schaefer Lake 43 43 100% Shield Lake 36 36 100% Snow Lake - Lower 54 54 100% Snow Lake - Upper 62 62 100% Snowall Creek 107 107 100% Square Lake 51 51 99% Stuart Lake 34 34 101% Theseus Lake 26 26 98% Thunder Creek 119 119 100% Trapper Creek 109 109 100% Trout Creek 85 85 100% Twin Lakes (1) 34 34 100% Twin Lakes (2) 103 103 100% Wenatchee River 4,095 1,553 38% White River 2,821 2,130 75% Whitepine Creek 296 296 100% Wildhorse Creek 131 131 100% TOTAL 24,677 18,370 74%
In addition, formal developed public access points include: trails, campgrounds, picnic areas, fishing easements, and boat launches. The trails are extensive, linking various waterbodies as well as running alongside waterbodies. The fishing easements and boat launches are located along the Wenatchee River.
Though there are 45 shoreline streams/rivers and 29 shoreline lakes in the proposed shoreline jurisdiction, only eight have formal recreation facilities per Table 23, predominantly consisting of campgrounds. Many more shorelines have trails per Table 24.
Table 23. WRIA 45 Public Access Facilities
Waterbody Total Facilities Campground Horse Camp Picnic Area TrailheadChiwawa River 13 11 2 Icicle Creek 7 7 Little Wenatchee River 5 4 1
March 2009 Page 123
DRAFT Chelan County Shoreline Inventory and Analysis
Waterbody Total Facilities Campground Horse Camp Picnic Area TrailheadNason Creek 3 2 1 Rock Creek 2 1 1 Wenatchee Lake 2 2 Wenatchee River 3 2 1 White River 3 3
Table 24. WRIA 45 Trails
Waterbody Trail Length – Linear Feet Waterbody Trail Length –
Linear Feet Big Meadow Creek 730 Little Wenatchee River 5,165Boulder Creek 2 774 Loch Eileen Lake 17Buck Creek 3,772 Meadow Creek 3,078Cady Creek 2,707 Mountaineer Creek 7,965Chikamin Creek 754 Nada Lake 3,741Chiwaukum Creek 20,450 Napeequa River 10,264Chiwaukum Creek South Fork 10,950 Nason Creek 10,231
Chiwaukum Lake 3,512 Perfection Lake 2,505Chiwawa River 19,452 Phelps Creek 8,393Colchuck Lake 3,359 Prospect Creek 2,756Eightmile Creek 6,370 Rainy Creek 625Eightmile Lake 205 Rock Creek 3,952Fish Lake 6,205 Schaefer Lake 1,862French Creek 15,674 Snow Lake - Lower 6,558Heather Lake 200 Snow Lake - Upper 206Icicle Creek 20,641 Snowall Creek 4,177Indian Creek 6,534 Square Lake 336Ingalls Creek 17,985 Stuart Lake 1,563Jack Creek 15,262 Thunder Creek 465Josephine Lake 1,462 Trout Creek 715Klonaqua Lakes (1) Lower 184 Twin Lakes (1) 3,837
Lake Augusta 561 Twin Lakes (2) 123Lake Creek 2 2,120 Wenatchee Lake 9,913Lake Leland 69 Wenatchee River 21,561Larch Lake 10 White River 32,065Leland Creek 12,335 Whitepine Creek 7,789Lightning Creek 466 Wildhorse Creek 124
The County Comprehensive Parks and Recreation Plan identifies several parks and recreation projects in the Wenatchee watershed along the shoreline jurisdiction. The Comprehensive Parks and Recreation Plan recommends the preparation of a comprehensive trails plan and suggests that the plan address, among other items:
• Leavenworth‐Wenatchee Valley Non‐motorized Trail • Wenatchee River Water Trail
Page 124 March 2009
DRAFT Chelan County Shoreline Inventory and Analysis
• Monitor Connector Trail
Another relevant project includes the Wenatchee Row and Paddle Boating Facility Upgrade. Subarea planning for the Monitor and Sunnyslope areas may provide for additional parks and recreation facilities.
4.2.3 Critical Areas Shorelines in WRIA 45 contain a combined total of 19,433 acres of priority habitats and habitat features (see Table 19 above). The most common habitats, in order of frequency of occurrence, are those for elk calving, migration, concentrations, or foraging and mountain goat breeding or concentrations. Twenty‐seven separate osprey nest sites are mapped in shoreline jurisdiction, distributed on five waterbodies. Twenty‐five additional point locations of 12 other species are also found in WRIA 45 shoreline jurisdiction. Many of the rivers, streams and lakes also contain priority fish species. According to the NWI and hydric soils information, as much as 39% of the total shoreline area may be wetlands. Floodplains and a few geohazard areas are also documented in the WRIA.
Peshastin Urban Growth Area The Peshastin community was established in the 1890s along the Northern Pacific Railroad, and a depot was erected. Peshastin is a small town in unincorporated Chelan County, and is village‐like in character surrounded by orchards. The Peshastin UGA contains 610 acres, with about 93 acres lying in the shoreline jurisdiction along the Wenatchee River. About 3 acres of shoreline jurisdiction lies along Peshastin Creek, though the waterbody immediately abuts the UGA and does not lie within the UGA. Table 25 summarizes key characteristics of the Peshastin UGA shoreline areas.
Table 25. Summary Table of Basic Characteristics of Each Shoreline Waterbody in the Peshastin Urban Growth Area
Juris
dict
iona
l St
ream
s/La
kes
Are
a of
Upl
and
Shor
elin
e Ju
risdi
ctio
n (a
cres
)
Maj
or E
xist
ing
Land
Use
s1
Ow
ners
hip
Prof
ile2
Vege
tatio
n Pr
ofile
3
Crit
ical
A
rea/
Prio
rity
Hab
itat o
r Sp
ecie
s (P
HS)
4 Pr
esen
ce
Streams/Rivers
Peshastin Creek 2.96 Single Family
Residential • Private
100%
Low-intensity development 61%, medium-intensity
• PHS riparian zone
March 2009 Page 125
DRAFT Chelan County Shoreline Inventory and Analysis
Juris
dict
iona
l St
ream
s/La
kes
Are
a of
Upl
and
Shor
elin
e Ju
risdi
ctio
n (a
cres
)
Maj
or E
xist
ing
Land
Use
s1
Ow
ners
hip
Prof
ile2
Vege
tatio
n Pr
ofile
3
Crit
ical
A
rea/
Prio
rity
Hab
itat o
r Sp
ecie
s (P
HS)
4 Pr
esen
ce
development 39%
Wenatchee River 92.79 Other
Residential
• Private 95%
• Public 5%(State/ PUD)
Low-intensity development 28%, cultivated crops 26%; 13% grassland
• PHS mule deer • PHS riparian zone • Heritage Point
osprey (1) • 5% wetland
1 Major existing land use is reported by acres located in the shoreline jurisdiction rather than full parcels. “Government/Utility” includes governmental services, utilities, and other transportation and communication utilities. 2 Acres of shoreline owned by public or private entities. Public includes municipal, County, PUD, State, and federal lands. 3 Three dominant types listed. Consult maps for distribution and other types. 4 PHS = Priority habitats and species as identified by WDFW
Current land uses along the Wenatchee River and Peshastin Creek shorelines include (Table 26):
• Agriculture – 5% • Commercial – 1% • Forestry – 38% • Government – 10% • Natural Resources – 3% • No Category – 5% • Other Residential – 8% • Single Family Residential – 30%
Table 26. Peshastin UGA Land Use, Comprehensive Plan Designation, and Shoreline Environment Designation
In 2008, Chelan County adopted the Peshastin UGA Plan. The Plan details a community vision, new urban growth area boundaries, and future land use designations, including along the Wenatchee River, and goals and policies. The vision states, in part, that the community desires to have:
• future development that complements and enhances the rural character of the community without unreasonable negative impacts
• open spaces and recreational opportunities, particularly the rivers and streams, and
• protection of the environment and maintenance of the community’s high quality of life, including air and water quality, and the availability of water.
Future land use designations along the Wenatchee River include: Industrial, Downtown Commercial, Highway Commercial, Public, Medium Density Residential, and Low Density Residential. Peshastin Creek is outside of the UGA boundaries along the southern boundary though the shoreline jurisdiction apparently lies inside the UGA to some degree.
The planned land use maps accompanying this Shoreline Inventory and Analysis Report do not yet show the new designations, though the planned land use statistics are up‐to‐date. A map from the Peshastin UGA plan is included as Figure 2 and supersedes those shown on the Countywide planned land use map for the Peshastin area.
March 2009 Page 127
DRAFT Chelan County Shoreline Inventory and Analysis
Figure 2. Peshastin Urban Growth Area Land Use Designations
Current SMP designations include Conservancy and Rural on the Wenatchee River, and Rural along Peshastin Creek.
4.2.5 Potential Restoration Opportunities The Wenatchee River system provides important habitat for many life stages of spring and summer chinook, steelhead, bull trout and other culturally important species, and needs to be protected, enhanced, and restored. The Salmon, Steelhead, and Bull Trout Habitat Limiting Factors for the Wenatchee Subbasin (WRIA
Page 128 March 2009
DRAFT Chelan County Shoreline Inventory and Analysis
45) and Portions of WRIA 4015 within Chelan County (Squilchuck, Stemilt and Colockum Drainages). Final Report (Andonaegui 2001) identifies some broad habitat limiting factors for salmon.
• Road and railroad construction and placement; • Conversion of riparian habitat to agriculture and residential
development; • Reduced large woody debris (LWD) recruitment; • Flood control efforts that include LWD removal, berm construction,
and stream channelization;
These activities have generally been responsible for decreasing habitat complexity, function, and abundance and are primarily found in lower gradient, lower reaches of all Chelan County watersheds, not just WRIAs 40a and 45.
The WRIA 45 Planning Unit identified 25 opportunities for habitat actions in the Wenatchee watershed, including six short‐term actions and four hatchery‐oriented actions. Opportunities exist to increase habitat and or restore complexity and riparian function to benefit ESA‐listed endangered and threatened salmonid species throughout the Wenatchee watershed. The following opportunities for watershed‐wide habitat actions are summarized from those in the Wenatchee Watershed Management Plan, as well as from the WDFW Habitat Work Schedule for Chelan County (http://hws.ekosystem.us/SiteView.aspx?sid=290#).
• Restore floodplain function, particularly on the Wenatchee River from the Mission Creek confluence downstream to the Columbia River confluence and in the Nason Creek watershed
• Improve access to spawning habitat and migration corridors in the Chumstick Creek, Lower Wenatchee River, and Mission Creek watersheds by eliminating barriers for anadromous salmonids.
• Noxious weeds threaten aquatic and terrestrial ecosystems throughout the Wenatchee Watershed. Opportunities exist for control and eradication and should be supported.
• Improve channel structure and complexity on the lower Wenatchee River and in Nason Creek.
• Take efforts to reduce excessive sediment in the Lower Wenatchee River and improve overall water quality.
• Improve riparian areas and increase the amount of large woody debris in the Nason Creek watershed.
15 WRIA 40 (Alkali‐Squilchuck) extends south outside of Chelan County. Discussions in this report are for the area known as 40a (Stemilt‐Squilchuck) and the Chelan County‐portion of WRIA 40b (the Colockum Creek basin).
March 2009 Page 129
DRAFT Chelan County Shoreline Inventory and Analysis
• Identify the presence of habitat limiting factors in Peshastin Creek drainage.
The Wenatchee Watershed Management Plan classifies the 12 sub‐watersheds into three categories based on existing function, fragmentation, and salmonid habitat quality. Category 1 sub‐watersheds are prioritized for protection because they “most closely resemble natural, fully functional aquatic ecosystems.” Six sub‐watersheds are ranked Category 1: White, Little Wenatchee, Chiwawa, Lake Wenatchee, Chiwaukum, and Upper Wenatchee. Category 2 sub‐watersheds “are strongholds for one or more listed species,” but “have a higher level of fragmentation.” Four sub‐watersheds are ranked Category 2: Nason, Icicle, Peshastin, and Lower Wenatchee. Finally, Category 3 sub‐watersheds “support salmonids, but they have experienced substantial degradation…” Two sub‐watersheds are ranked Category 3: Chumstick and Mission.
The U.S. Bureau of Reclamation prepared an assessment of processes and habitat for three reaches in a 10‐mile‐long stretch of Nason Creek, a tributary of the Wenatchee River. The purpose of the assessment was to “develop a restoration and protection strategy based on a sound scientific assessment of channel processes.” The overall goals of the restoration actions are to:
• increase the complexity of the main channel, • increase availability and quality of off‐channel areas, and • increase the amount of accessible floodplain.
The second of the three reaches, corresponding to a rest area, was determined to have low restoration opportunity, so specific actions were not recommended. Actions for the other two reaches (Table 27) are identical in type, although at the project level the scales and specific habitat element improvement targets are different.
Table 27. Summary of proposed restoration types for each reach of the Nason Creek study area based on findings of geomorphic assessment.
Reach
Rip
aria
n R
esto
ratio
n w
ithin
HC
MZ
Rip
aria
n R
esto
ratio
n w
ithin
Flo
odpl
ain
Side
-cha
nnel
R
econ
nect
ion
Obs
truc
tion
Rec
onne
ctio
n
Roa
d M
aint
enan
ce
Floo
dpla
in
Res
tora
tion
LWD
Res
tora
tion
1 (RM 4.6 – 8.9) Coles Corner to Rest Area
X X X X X X X
Page 130 March 2009
DRAFT Chelan County Shoreline Inventory and Analysis
Reach
Rip
aria
n R
esto
ratio
n w
ithin
HC
MZ
Rip
aria
n R
esto
ratio
n w
ithin
Flo
odpl
ain
Side
-cha
nnel
R
econ
nect
ion
Obs
truc
tion
Rec
onne
ctio
n
Roa
d M
aint
enan
ce
Floo
dpla
in
Res
tora
tion
LWD
Res
tora
tion
3 (RM 9.4 – 14.3) Rest Area to White Pine Railroad Bridge
X X X X X X X
Source: Table excerpted and modified from USBR 2008.
In 2006, Chelan County commissioned a riparian assessment of private and County‐owned riparian lands in the Wenatchee subbasin along streams that contained priority fish species and lands that were identified in the Wenatchee Salmon Recovery Implementation Schedule (UCSRB 2005; EcoA.I.M. 2006). After analysis of aerial photos, 588 individual sites were determined to need some level of riparian enhancement, either full revegetation or just addition of conifers.
A number of government organizations have or are developing plans to raise salmon and steelhead in the Wenatchee River watershed. While this may enhance salmon recovery efforts, care needs to be taken in implementation of hatchery projects that riparian habitat and water quality are not adversely affected.
4.3 Entiat (WRIA 46)
WRIA 46 contains 305,641 acres, including 5,065 acres of shorelands and 526,093 linear feet (100 miles) of shoreline along seven streams/rivers and two lakes. Within the Entiat watershed area (WRIA 46), there are seven shoreline streams/rivers and three shoreline lakes. A summary table (Table 28) provides further details on each waterbody’s shoreline characteristics.
Table 28. Summary Table of Basic Characteristics of Each Shoreline Waterbody in WRIA 46, Outside of Cities and their Urban Growth Areas.
Juris
dict
iona
l St
ream
s/La
kes
Are
a of
Upl
and
Shor
elin
e Ju
risdi
ctio
n (a
cres
)
Maj
or E
xist
ing
Land
Use
s1
Ow
ners
hip
Prof
ile2
Vege
tatio
n Pr
ofile
3
Crit
ical
A
rea/
Prio
rity
Hab
itat o
r Sp
ecie
s (P
HS)
5 Pr
esen
ce
Streams/Rivers Columbia 397.51 Other • Private Scrub/shrub • PHS bald eagle
March 2009 Page 131
DRAFT Chelan County Shoreline Inventory and Analysis
Juris
dict
iona
l St
ream
s/La
kes
Are
a of
Upl
and
Shor
elin
e Ju
risdi
ctio
n (a
cres
)
Maj
or E
xist
ing
Land
Use
s1
Ow
ners
hip
Prof
ile2
Vege
tatio
n Pr
ofile
3
Crit
ical
A
rea/
Prio
rity
Hab
itat o
r Sp
ecie
s (P
HS)
5 Pr
esen
ce
River Residential 91% • Public
(PUD) 19%
36%; low intensity development 29%; developed open space 22%
DRAFT Chelan County Shoreline Inventory and Analysis
Juris
dict
iona
l St
ream
s/La
kes
Are
a of
Upl
and
Shor
elin
e Ju
risdi
ctio
n (a
cres
)
Maj
or E
xist
ing
Land
Use
s1
Ow
ners
hip
Prof
ile2
Vege
tatio
n Pr
ofile
3
Crit
ical
A
rea/
Prio
rity
Hab
itat o
r Sp
ecie
s (P
HS)
5 Pr
esen
ce
Lake Creek 84.09 Not applicable 4
• Public (Federal) 100%
Evergreen forest 82%; scrub/shrub 13%; grassland and low-intensity development 2% each
• PHS old-growth/ mature forest
• PHS fish • 2% wetland
Mad River 960.14 Government/ Utility
• Public (Federal) 94%
• Private 6%
Evergreen forest 70%; scrub/shrub 23%; low-intensity development 3%
• PHS riparian zone
• PHS fish • 4% wetland • FEMA floodplain
NF Entiat River 321.42 Not
applicable 4
• Public (Federal) 100%
Evergreen forest 99%
• PHS old-growth/ mature forest
• PHS lynx • PHS fish • 12.4% geohazard
Tommy Creek 69.45 Not
applicable 4
• Public (Federal) 100%
Evergreen forest 81%; scrub/shrub 14%; grassland and woody wetlands 2% each
• 2% wetland
Lakes
Ice Lake 1 39.98 Not applicable 4
• Public (Federal) 100%
Barren land 87%; grassland 12% scrub/shrub 1%
• PHS lynx • PHS mountain
goat • 47% wetland
Ice Lake 2 23.71 Not applicable 4
• Public (Federal) 100%
Barren land 62%; grassland 32%; scrub/shrub 6%
• PHS lynx • PHS mountain
goat • 51% wetland
1 Major existing land use is reported by acres located in the shoreline jurisdiction rather than full parcels. “Government/Utility” includes governmental services, utilities, and other transportation and communication utilities. 2 Acres of shoreline owned by public or private entities. Public includes municipal, County, PUD, State, and federal lands.
March 2009 Page 133
DRAFT Chelan County Shoreline Inventory and Analysis
3 Three dominant types listed. Consult maps for distribution and other types. 4 There is no parcel-based current land use data for numerous waterbodies that are 100% in Federal ownership. 5 PHS = Priority Habitat or Species as identified by WDFW
4.3.1 Land Use Patterns Current land uses in WRIA 46 shorelines include orchards, livestock production and grazing, timber harvest, residential housing, and recreation. U.S. Forest Service and timber lands dominate in terms of acres (Chelan County Conservation District 2004). Non‐federal shorelines exhibit the following existing land uses:
• Agriculture – 7% • Commercial – <1% • Cultural/Recreation/Assembly – <1% • Forestry – 6% • Government/Utility – 29% • Natural Resources – 2% • No Category – 1% • Open Space – 2% • Other Residential – 37% • Single Family Residential – 10% • Undeveloped Land – 6%
The existing land uses vary by individual waterbody, but primarily consist of residential (Entiat River), governmental/utility uses (Mad River), and a mix of both those uses (Columbia River).
WRIA 46 unincorporated lands are under the jurisdiction of Chelan County, which has planned the following uses for its shorelines as a whole:
• Commercial Agricultural Lands – 5% • Commercial Forest Lands – 57% • No Category – <1% • Public Lands and Facilities – <1% • Rural Residential – 35% • Rural Village – <1% • Rural Waterfront – 3% • Urban Growth Area ‐‐ <1% 16
16 The UGA area is 0.07 acres – a fraction of the total shoreline acres of 5,065. The WRIA 46 analysis is intended to focus on non‐City and non‐UGA lands. However, the data that the County and the individual cities maintain is not always 100% edge‐matched. The small UGA figures are likely the result of slight discrepancies in boundary digitization.
Page 134 March 2009
DRAFT Chelan County Shoreline Inventory and Analysis
Three shorelines are designated with use environments in the current SMP, the Columbia, Entiat and Mad Rivers, and each is applied multiple use environments per Table 29. The Columbia and Entiat Rivers both include Conservancy, Rural and small areas of Urban shoreline environments. The Mad River currently is assigned Conservancy, Natural, and Rural environments.
Table 29. WRIA 46 Land Use, Comprehensive Plan Designation, and Shoreline Environment Designation
Jurisdictional Streams/
Lakes (Existing/ Future Acres)
Existing Land Use Comprehensive Plan Designation (Chelan County)
Current Shoreline
Environment Designation
(Chelan County) Streams/Rivers Columbia River (139.54/ 377.95)
Other Residential 37%, Government/Utility 29%, Single Family Residential 9%, Undeveloped 7%, No Category 6%, Open Space 4%, Natural Resources 4%, Cultural/Recreation/Assembly 2%, Agriculture 1%, Commercial <1%
Other Residential 51%, Single Family Residential 12%, Agriculture 10%, Government/Utility 8%, Forestry 7%, Undeveloped 7%, Open Space 3%, Natural Resources 1%, Cultural/Recreation/Assembly <1%, Commercial <1%, No Category 1%
DRAFT Chelan County Shoreline Inventory and Analysis
Jurisdictional Streams/
Lakes (Existing/ Future Acres)
Existing Land Use Comprehensive Plan Designation (Chelan County)
Current Shoreline
Environment Designation
(Chelan County) NF Entiat River (no info. 1/ 321.42)
Not applicable 1 • Commercial Forest Lands
• 321.42 acres/ 100% --
Tommy Creek (no info. 1/ 69.45)
Not applicable 1 • Commercial Forest Lands
• 69.45 acres/ 100% --
Lakes Ice Lakes (1) (no info. 1/ 39.98)
Not applicable 1 • Commercial Forest Lands
• 39.98 acres/ 100% --
Ice Lakes (2) (no info. 1/ 23.71)
Not applicable 1 • Commercial Forest Lands
• 23.71 acres/ 100% --
1 There is no parcel-based current land use data for numerous waterbodies that are 100% in Federal ownership.
The Entiat and Mad Rivers are identified as having a more extensive shoreline jurisdiction, and new areas of shoreline jurisdiction also include Ice Creek, Lake Creek, Tommy Creek, and the North Fork of the Entiat River. Ice Lakes 1 and 2 also are proposed jurisdictional areas. These added jurisdictional areas do not presently have SMP shoreline environment designations.
Water-Oriented Uses
In WRIA 46, uses that are potentially considered water‐oriented include agriculture at approximately 170 acres, with most of the agricultural acreage on the Entiat River, followed by somewhat lesser agricultural acreage on the Columbia River. Other water‐oriented uses include open space (non‐commercial forest) totaling 154 acres and recreational activities at about 3 acres. See also Parks and Public Access below.
Developing or Redeveloping Waterfronts
Since the year 2000, the County has issued 12 shoreline substantial development permits or variances or exemptions on the Entiat River and two riparian exemptions; projects involved bridge construction, property access construction, wells, and shoreline restoration. A bridge replacement on the Mad River was also considered in the shoreline permits issued. For permits on the Columbia River, see Table 4b in Section 2.3, which provides a cumulative review for the entire Columbia River in unincorporated Chelan County.
Page 136 March 2009
DRAFT Chelan County Shoreline Inventory and Analysis
The major WRIA 46 shorelines tend to have parcels without buildings as follows:17
• Columbia River – 73 parcels and 74% of shoreline acres • Entiat River – 220 parcels and 53% of shoreline acres • Mad River – 24 parcels and 93% of shoreline acres
As undeveloped lands convert to the planned future land uses, the shorelines are likely to see some modifications. Most of the area is planned for Commercial Forestry, Rural Residential, and Rural Waterfront uses. Forestry uses likely would not result in permanent shoreline development. Residential lands are likely to continue in similar patterns as today, with some infill on vacant parcels. Rural Waterfront recognizes current compact shoreline activities, and some infill development may occur. Rural Waterfront uses include: residential, and water related/water dependant recreational and tourist development.
4.3.2 Existing and Potential Public Access Public access consists of view corridors, open space and parks. View corridors are prominent along the Columbia and Entiat Rivers from higher elevations. Open space is estimated at approximately 3,084 acres (Table 30). Outside of incorporated areas, park acres total about 1 acre (along the Entiat River).
Table 30. Open Space along Shorelines in WRIA 46.
Waterbody Total Of Acres Open Space Acres % Open Space
Columbia River 398 77 19% Entiat River 3,110 1,595 51% Ice Creek 59 59 100% Ice Lakes (1) 40 40 100% Ice Lakes (2) 24 24 100% Lake Creek 1 84 84 100% Mad River 960 903 94% North Fork Entiat River 321 321 100% Tommy Creek 69 69 100% TOTAL 5,065 3,173 63% Note: Selected parcels have a BLDGAV of $0. All parcels with the following Assessor Use Codes have been excluded from this analysis: 'agriculture-not in open space'; 'agric in open space RCW 84.34'; 'desig. forest land RCW 84.33'; or 'mining activities'.
In addition, formal developed public access points include: trails and campgrounds in shoreline jurisdiction. Three of 10 shorelines have campground
17 Note: Selected parcels have a BLDGAV of $0. All parcels with the following Assessor Use Codes have been excluded from this analysis: ʹagriculture‐not in open spaceʹ; ʹagric in open space rcw 84.34ʹ; ʹdesig forest land rcw 84.33ʹ; or ʹmining activitiesʹ.
March 2009 Page 137
DRAFT Chelan County Shoreline Inventory and Analysis
facilities and one shoreline has several trailheads listed in Table 31. Seven of the 10 shorelines have trails (Table 32). The trails are extensive, linking various waterbodies as well as running alongside waterbodies. The Entiat Watershed Planning Unit is addressing public access on the Entiat River.
Table 31. WRIA 46 Public Access Facilities
Waterbody Total Facilities Campground Trailhead Columbia River 1 1 Entiat River 8 4 4 Lake Creek 1 1 1 Mad River 1 1
Table 32. WRIA 46 Trails
Waterbody Trail Length in feet Entiat River 31,010 Ice Creek 835 Ice Lakes (2) 710 Lake Creek 1 2,331 Mad River 69,167 North Fork Entiat River 5,153 Tommy Creek 4,512
County Comprehensive Parks and Recreation Plan recommendations include the following in the Entiat watershed:
• Comprehensive trails plan addressing Upper Columbia River Water Trail, Entiat Bridge trail, among others
• Subarea parks and recreation planning including for the Entiat subarea
4.3.3 Critical Areas Shorelines in WRIA 46 contain a combined total of 5,504 acres of priority habitats and habitat features (see Table 28 above). The most common priority habitats, in order of frequency of occurrence, are those for lynx, followed by old‐growth/mature forests and priority riparian zones. The Entiat River is the only shoreline with point locations for priority species – five locations of four species. Many of the rivers, streams and lakes also contain priority fish species. According to the NWI and hydric soils information, as much as 24% of the total shoreline area may be wetlands. Floodplains and a few geohazard areas are also documented in the WRIA.
Page 138 March 2009
DRAFT Chelan County Shoreline Inventory and Analysis
4.3.4 Potential Restoration Opportunities Entiat WRIA 46 Management Plan: Chapter 7 of the Entiat WRIA 46 Management Plan (Chelan County Conservation District 2004) identified fish distributions, migration timing, life history, and available habitat information within the Entiat Subbasin. The Entiat and Mad Rivers provide significant spawning and rearing habitat for spring and late‐spawning chinook salmon, sockeye salmon, and summer steelhead and bull trout. Opportunities exist to increase habitat and or restore complexity and riparian function to benefit ESA‐listed endangered and threatened salmonid species within the Entiat watershed. The following opportunities for habitat actions are summarized from the Entiat Watershed Management Plan, as well as from the WDFW Habitat Work Schedule for Chelan County (http://hws.ekosystem.us/SiteView. aspx?sid=290#).
• Address poor water temperatures in the Entiat and Mad Rivers during juvenile salmon rearing periods.
• Increase channel structure and complexity in the Lower Entiat. • Restoration of floodplain function and connectivity, particularly on
the Lower Entiat River. • Increase tributary habitat diversity and access for spawning in the
Lower Entiat and Mad Rivers. • Improve riparian areas and large woody debris recruitment in the
Lower Entiat and Mad Rivers. • Noxious weeds threaten aquatic and terrestrial ecosystems
throughout the Entiat Watershed. Opportunities exist for control and eradication.
In addition, the Plan calls for a number of programmatic efforts in uplands management and land use planning, fisheries management, water rights management, instream flow, and community involvement.
The Detailed Implementation Plan Entiat Water Resource Inventory Area (WRIA) 46 was published in 2006 (Chelan County Conservation District 2006). It further divides the four major assessment units (lower Entiat, middle Entiat, upper Entiat, and Mad River) into nine implementation units, which are then ranked from 1 to 8 (excluding the implementation unit comprised of minor Columbia River tributaries) and categorized into three prioritization tiers (high, medium and low) as indicated on the following graphic excerpted from the Implementation Plan (Figure 3). The following discussion summarizes the major project actions in each of the four assessment units, many of which may be occurring outside of shoreline jurisdiction, but have beneficial effects on shoreline functions.
March 2009 Page 139
DRAFT Chelan County Shoreline Inventory and Analysis
Figure 3. WRIA 46 habitat restoration priority.
Lower Entiat Assessment Unit (RM 0.0 to RM 16.2):
• To address water quantity issues, consolidate and extend irrigation ditches, improve irrigation water conveyance and diversions, improve farm irrigation practices, meter and report all diversions, and convert surface water diversions to groundwater/well withdrawals.
Page 140 March 2009
DRAFT Chelan County Shoreline Inventory and Analysis
• To address habitat quality issues, install up to 65 rock and/or wood structures, reconnect off‐channel areas, plant 30,000 linear feet of riparian vegetation, and preserve existing undisturbed riparian areas.
• Screen and/or upgrade existing screens on pumps/diversion intakes.
Middle Entiat Assessment Unit (RM 16.2 to RM 33.8, Entiat Falls):
• To address watershed condition issues, decommission 50 to 60 miles of USFS roads; maintain/reconstruct 30 miles of USFS roads; and delineate, map, rate, and protect or enhance remaining wetlands.
• To address water quality issues, increase nutrients through hatchery carcass out‐planting, increase shading of key stream reaches and reduce width‐depth ratio to lower temperatures, develop farm plans with property owners to prevent livestock access to streams, and improve septic systems.
• To address habitat quality issues, implement 10 large woody debris restoration projects, plant 10,000 linear feet of riparian vegetation, and preserve existing undisturbed riparian areas.
• To address water quantity issues, pipe ditches and otherwise improve conveyance and diversion efficiency, improve farm irrigation practices, and convert surface water diversions to groundwater/well withdrawals.
• To address habitat access issues, improve fish passage at two Stormy Creek culverts.
Upper Entiat Assessment Unit (above Entiat Falls):
• None.
Mad River Assessment Unit:
• To address watershed condition issues, decommission 4 miles of USFS roads (completed); maintain/reconstruct 52 miles of USFS roads (completed); and eliminate side‐casting of Mad River Road maintenance materials.
• To address habitat quality issues, install 5 to 10 rock gravel‐catchers to promote gravel recruitment.
Many of these same projects and goals are also identified in the Entiat Subbasin Plan (2004).
Habitat Farming Enterprise Program: The Entiat Watershed, and specifically an orchard enterprise on the Entiat River, is the geographic area of a pilot study for the Habitat Farming Enterprise Program (HFEP) (GeoEngineers 2007). HFEP is a program being developed by the Initiative for Rural Innovation and Stewardship
March 2009 Page 141
DRAFT Chelan County Shoreline Inventory and Analysis
(IRIS), in cooperation with the Entiat Watershed Planning Unit, Chelan County Conservation District, Chelan‐Douglas Land Trust, Chelan County, and several other environmental interests. The HFEP pilot is evaluating the benefits and costs of compensating area farmers to grow riparian habitat and accommodate other restoration measures on their property, in lieu of growing marketable crops. The potential of the HFEP to realize significant improvement in shoreline functions is high.
4.4 Chelan (WRIA 47)
Chelan watershed (WRIA 47) as a whole contains 670,080 acres, including 11,160 acres of shorelands along 1,596,517 linear feet (302 miles) of shoreline, distributed among 29 shoreline streams/rivers and 17 shoreline lakes. A summary table (Table 33) provides further details on each waterbody’s shoreline characteristics.
Table 33. Summary Table of Basic Characteristics of Each Shoreline Waterbody in WRIA 47, Outside of Cities and their Urban Growth Areas.
1 Major existing land use is reported by acres located in the shoreline jurisdiction rather than full parcels. “Government/Utility” includes governmental services, utilities, and other transportation and communication utilities. 2 Acres of shoreline owned by public or private entities. Public includes municipal, County, PUD, State, and federal lands. 3 Three dominant types listed. Consult maps for distribution and other types. 4 There is no parcel-based current land use data for numerous waterbodies that are 100% in Federal ownership. 5 PHS = Priority habitat or species as identified by WDFW
Page 148 March 2009
DRAFT Chelan County Shoreline Inventory and Analysis
4.4.1 Land Use Patterns Existing and Planned Land Uses
Approximately 87% of WRIA 47 is in federal, State, and local government ownership (Table 34). The remaining 13% is in private ownership. Current land uses in the WRIA as a whole include conservation, recreation, primary and secondary (vacation and second homes) residential, resorts and agriculture. The upper two‐thirds of the WRIA can be accessed only by water, foot, horseback or air (floatplane) (Northwest Power and Conservation Council 2004). The shoreline areas exhibit the following existing land uses:
• Agriculture – 3% • Commercial – 5% • Forestry – 3% • Government/Utility – 42% • Natural Resources – 1% • No Category – < 1% • Open Space ‐ <1% • Other Residential – 32% • Cultural/Recreation/Assembly – < 1% • Single Family Residential – 8% • Undeveloped Land – 5%
Table 34. WRIA 47 Land Use, Comprehensive Plan Designation, and Shoreline Environment Designation
Jurisdictional Streams/
Lakes (Existing/ Future Acres)
Existing Land Use Comprehensive Plan Designation (Chelan County)
Current Shoreline Environment Designation
(Chelan County)
Streams/Rivers Agnes Creek (no info. 1/ 272.09)
Not applicable 1 • Commercial Forest Lands
• Rural Residential (20)
• 234.92 acres/ 86%
• 37.17 acres/ 14%
--
Basin Creek (no info. 1/ 19.03)
Not applicable 1 • Commercial Forest Lands
• 19.03 acres/ 100%
--
Boulder Creek (1) (46.93/ 189.61)
Government/ Utility (99%), Other Residential (1%)
• Commercial Forest Lands
• Rural Residential (2.5, 5, 20)
• 96.57 acres/ 51%
• 93.04 acres/ 49%
--
Bridge Creek (no info. 1/ 578.89)
Not applicable 1 • Commercial Forest Lands
• 578.89 acres/ 100%
--
March 2009 Page 149
DRAFT Chelan County Shoreline Inventory and Analysis
Jurisdictional Streams/
Lakes (Existing/ Future Acres)
Existing Land Use Comprehensive Plan Designation (Chelan County)
Current Shoreline Environment Designation
(Chelan County)
Chelan River (152.39/ 159.71)
Government/ Utility (100%)
• Rural Residential (20)
• Public Lands and Facilities
• Urban Growth Area
• 158.67 acres/ 99%
• 0.91 acres/ 1% • 0.13 acres/
<1%
• Conservancy • Rural • Urban
Columbia River (409.19/ 614.60)
Government/ Utility (37%), Single Family Residential (29%), Other Residential (20%), Agriculture (5%), Commercial (2%), Natural Resources (1%), Transportation (2%), Forestry (2%), Undeveloped (<1%), No Category (1%)
• Rural Residential (2.5, 5, 10. 20)
• Commercial Agricultural Lands
• Public Lands and Facilities
• Rural Waterfront
• Rural Industrial • No Category
• 382.81 acres/ 62%
• 86.51 acres/
14% • 72.70 acres/
12% • 59.46 acres/
10% • 11.65 acres/
2% • 1.47 acres/
<1%
• Conservancy • Rural
Company Creek (103.01/ 445.56)
Government/ Utility (60%), Undeveloped Land (40%), Other Residential (1%)
• Commercial Forest Lands
• Rural Residential (5, 20)
• 332.26 acres/ 75%
• 113.30 acres/ 25%
--
Cottonwood Creek (no info.1/ 24.87)
Not applicable 1 • Commercial Forest Lands
• 24.87 acres/ 100%
--
Doubtful Creek (no info. 1/ 3.41)
Not applicable 1 • Commercial Forest Lands
• 3.41 acres/100%
--
Fish Creek (1) (34.65/ 187.43)
Undeveloped Land (37%), Government/ Utility (32%), Other Residential (31%)
• Commercial Forest Lands
• Rural Residential (20)
• 156.19 acres/ 83%
• 31.25 acres/ 17%
--
Flat Creek (no info.1/ 424.87)
Not applicable 1 • Commercial Forest Lands
• 424.87 acres/ 100%
--
Maple Creek (no info.1/ 95.87)
Not applicable 1 • Commercial Forest Lands
• 95.87 acres/ 100%
--
McAlester Creek (no info.1/ 116.63)
Not applicable 1 • Commercial Forest Lands
• 116.63 acres/ 100%
--
Page 150 March 2009
DRAFT Chelan County Shoreline Inventory and Analysis
Jurisdictional Streams/
Lakes (Existing/ Future Acres)
Existing Land Use Comprehensive Plan Designation (Chelan County)
Current Shoreline Environment Designation
(Chelan County)
NF Bridge Creek (no info.1/ 383.05)
Not applicable 1 • Commercial Forest Lands
• 383.05 acres/ 100%
--
NF Thirtyfive Mile Creek (24.86/ 31.32)
Government/ Utility (100%)
• Commercial Forest Lands
• 31.32 acres/ 100%
--
Park Creek (no info.1/ 281.95)
Not applicable 1 • Commercial Forest Lands
• 281.95 acres/ 100%
--
Prince Creek (no info.1/ 259.07)
Not applicable 1 • Commercial Forest Lands
• 259.07 acres/ 100%
--
Railroad Creek (14.84/ 804.68)
Forestry (100%) • Commercial Forest Lands
• 804.68 acres/ 100%
--
Rainbow Creek (66.62/ 203.90)
Government/ Utility (98%), Other Residential (2%)
• Commercial Forest Lands
• Rural Residential (2.5, 20)
• 136.21 acres/ 67%
• 67.69 acres/ 33%
--
Rimrock Creek (no info.1/ 29.04)
Not applicable 1 • Commercial Forest Lands
• 29.04 acres/ 100%
--
SF Agnes Creek (no info.1/ 456.73)
Not applicable 1 • Commercial Forest Lands
• 456.73 acres/ 100%
--
SF Bridge Creek (no info.1/ 120.79)
Not applicable 1 • Commercial Forest Lands
• 120.79 acres/ 100%
--
SF Flat Creek (no info.1/ 46.02)
Not applicable 1 • Commercial Forest Lands
• 46.02 acres/ 100%
--
Spruce Creek (no info.1/ 154.46)
Not applicable 1 • Commercial Forest Lands
• 154.46 acres/ 100%
--
Stehekin River (309.02/ 1,244.04)
Government/ Utility (73%), Undeveloped Land (14%), Other Residential (13%)
• Commercial Forest Lands
• Rural Residential (2.5, 5, 20)
• 692.22 acres/ 56%
• 551.82 acres/ 44%
• Conservancy • Natural
Swamp Creek (no info.1/ 50.50)
Not applicable 1 • Commercial Forest Lands
• 50.50 acres/ 100%
--
March 2009 Page 151
DRAFT Chelan County Shoreline Inventory and Analysis
Jurisdictional Streams/
Lakes (Existing/ Future Acres)
Existing Land Use Comprehensive Plan Designation (Chelan County)
Current Shoreline Environment Designation
(Chelan County)
Twentyfive Mile Creek (143.72/ 146.34)
Commercial (64%), Other Residential (17%), Government/ Utility (12%), Single Family Residential (3%), Forestry (1%), Undeveloped (1%)
• Commercial Forest Lands
• Rural Residential (5, 10, 20)
• Public Lands and Facilities
• Rural Waterfront
• 88.69 acres/ 61%
• 32.68 acres/ 22%
• 22.52 acres/
15% • 2.45 acres/ 2%
• Conservancy • Natural
WF Agnes Creek (no info.1/ 334.97)
Not applicable 1 • Commercial Forest Lands
• 334.97 acres/ 100%
--
WF Flat Creek (no info.1/ 100.69)
Not applicable 1 • Commercial Forest Lands
• 100.69 acres/ 100%
--
Lakes Antilon Lake (36.56/ 51.59)
Government/ Utility (100%)
• Rural Residential (20)
• Commercial Forest Lands
• 48.52 acres/ 94%
• 3.07 acres/ 6%
• Conservancy
Cub Lake (no info.1/ 24.13)
Not applicable 1 • Commercial Forest Lands
• 24.13 acres/ 100%
--
Domke Lake (no info.1/ 87.90)
Not applicable 1 • Commercial Forest Lands
• 87.90 acres/ 100%
--
Doubtful Lake (no info.1/ 22.37)
Not applicable 1 • Commercial Forest Lands
• 22.37 acres/ 100%
--
Dry Lake (54.95/ 67.88)
Single Family Residential (47%), Government/ Utility (23%), Agriculture (20%), Undeveloped (10%)
• Commercial Agricultural Lands
• Rural Residential (2.5)
• 64.44 acres/ 95%
• 3.44 acre/5%
• Rural
Green View Lake (no info.1/ 31.29)
Not applicable 1 • Commercial Forest Lands
• 31.29 acres/ 100%
--
Hart Lake (no info. 1/ 27.78)
Not applicable 1 • Commercial Forest Lands
• 27.78 acres/ 100%
--
Lake Chelan (1,150.85/ 2,585.98)
Other Residential (60%), Government/ Utility (25%), Forestry (4%), Commercial (2%), Single Family Residential (2%),
• Commercial Forest Lands
• Rural Residential (2.5, 5, 10, 20)
• Rural
• 1,398.70 acres/ 54%
• 540.77 acres/ 21%
• 411.12 acres/
• Conservancy • Rural • Urban
Page 152 March 2009
DRAFT Chelan County Shoreline Inventory and Analysis
Jurisdictional Streams/
Lakes (Existing/ Future Acres)
Existing Land Use Comprehensive Plan Designation (Chelan County)
Current Shoreline Environment Designation
(Chelan County)
Undeveloped Land (2%), Agriculture (2%), Cultural/Recreation/Assembly (1%), Open Space (1%), No Category (1%)
Waterfront • Public Lands
and Facilities • Wapato • Water • Commercial
Agricultural Lands
• Rural Recreational and Resource
• Urban Growth Area
• No Category
16% • 59.22 acres/
2% • 52.22 acres/
2% • 31.23 acres/
1% • 17.55 acres/
1% • 14.95 acres/
1% • 0.43 acres/
<1% • 0.11 acres/<1%
Lyman Lake (no info. 1/ 41.98)
Not applicable 1 • Commercial Forest Lands
• 41.98 acres/ 100%
--
Mirror Lake (no info. 1/ 28.98)
Not applicable 1 • Commercial Forest Lands
• 28.98 acres/ 100%
--
Rainy Lake (no info. 1/ 32.57)
Not applicable 1 • Commercial Forest Lands
• 32.57 acres/ 100%
--
Roses Lake (44.13/ 57.37)
Single Family Residential (50%), Government/ Utility (18%), Agriculture (14%), Undeveloped Land (11%), Natural Resources (4%), Other Residential (2%), No Category (1%)
• Rural Residential (2.5)
• Water • Rural
Waterfront • Public Lands
and Facilities • Commercial
Agricultural Lands
• 30.06acres/ 52%
• 14.22
acres/25% • 7.52 acres/
13% • 5.09 acres/ 9% • 0.49 acres/ 1%
• Rural
Surprise Lake (no info. 1/ 33.76
Not applicable 1 • Commercial Forest Lands
• 33.76 acres/ 100%
--
Trapper Lake (no info. 1/ 71.16)
Not applicable 1 • Commercial Forest Lands
• 71.16 acres/ 100%
--
Unnamed Lake (1) (34.58/ 41.83)
Government/ Utility (100%)
• Rural Residential (20)
• 41.83acres/ 100%
--
Wapato Lake (73.79/ 80.45)
Other Residential (41%), Single Family Residential (28%),
• Rural Residential (2.5, 5, 10)
• 29.07 acres/ 36%
• Rural
March 2009 Page 153
DRAFT Chelan County Shoreline Inventory and Analysis
Jurisdictional Streams/
Lakes (Existing/ Future Acres)
Existing Land Use Comprehensive Plan Designation (Chelan County)
1 There is no parcel-based current land use data for numerous waterbodies that are 100% in Federal ownership.
The existing land uses vary by individual waterbody, with some shorelines dominated by residential uses (Lake Chelan, Roses Lake, Wapato Lake), commercial uses (Chelan River, Twentyfive Mile Creek), and undeveloped lands (Fish Creek, Dry Lake).
WRIA 47 shorelines contain unincorporated and incorporated lands. Unincorporated lands are under the jurisdiction of Chelan County, which has planned the following uses for the shorelines:
• Commercial Agricultural Lands – 2% • Commercial Forest Lands – 71% • Commercial Mineral –<1% • No Category – <1% • Public Lands and Facilities – 2% • Rural Commercial – <1% • Rural Industrial – <1% • Rural Residential – 20% • Rural Recreational and Resource – <1% • Rural Waterfront – 5% • Urban Growth Area – <1%18 • Wapato – <1% • Water – < 1%
18 The UGA area is 0.56 acres – a fraction of the total shoreline acres of 14,660. The WRIA 47 analysis is intended to focus on non‐City and non‐UGA lands. However, the data that the County and the individual cities maintain is not always 100% edge‐matched. The small UGA figures are likely the result of slight discrepancies in boundary digitization.
Page 154 March 2009
DRAFT Chelan County Shoreline Inventory and Analysis
Individually, most shorelines are planned for commercial forestry and rural residential uses. Shorelines with urban categories include Columbia River and Lake Chelan. Shorelines planned for focused rural development (including rural waterfront development) include Twentyfive Mile Creek, Roses Lake, and Wapato Lake.
Current shoreline use environment designations vary by waterbody, but typically include Rural and Conservancy through most of the unincorporated areas, though there are several areas identified as Natural, and more limited areas as Urban. Numerous shorelines are not currently in the SMP jurisdiction, but appear to meet thresholds for jurisdiction in the proposed SMP based on currently available information.
Water-Oriented Uses
Approximately 75 acres of land along Columbia River, Dry Lake, Lake Chelan, Roses Lake, Twentyfive Mile Creek, and Wapato Lake contain agricultural uses. Of these waterbodies, most of the agriculture use is along Lake Chelan, followed by the Columbia River and Dry Lake. About 65 acres are in parks or open space including non‐commercial forest. Almost 9 acres of recreational activities, resorts and group camps, eating/drinking places, and hotel/motel are located along Lake Chelan. These are considered potential water‐oriented uses.
In addition to these upland uses, there are many other water‐oriented uses, including docks.
Developing or Redeveloping Waterfronts
WRIA 47 shorelines tend to have parcels without buildings as follows:
Table 35. WRIA 47 Shorelines and Parcels without Buildings
Waterbody Total Parcels
Total Acres
Parcels Without Buildings
Parcels Without Buildings - Acres
% Without Buildings
Antilon Lake 3 37 3 37 100% Boulder Creek 1 6 47 4 47 99% Chelan River 20 152 17 152 100% Columbia River 180 409 106 291 71% Company Creek 15 103 15 103 100% Dry Lake 34 55 9 25 46% Fish Creek 1 8 35 4 21 60% Lake Chelan 1,622 1,135 552 666 59% North Fork Thirtyfive Mile Creek 2 25 2 25 100%
Railroad Creek 1 15 1 15 100% Rainbow Creek 4 67 3 65 98% Roses Lake 53 44 23 24 55%
March 2009 Page 155
DRAFT Chelan County Shoreline Inventory and Analysis
Waterbody Total Parcels
Total Acres
Parcels Without Buildings
Parcels Without Buildings - Acres
% Without Buildings
Stehekin River 93 309 65 280 90% Twentyfive Mile Creek 27 144 17 133 92% Unnamed Lake 1 4 35 4 35 100% Wapato Lake 57 74 17 29 40% TOTAL 2,129 2,684 842 1,948 73%
Note: Selected parcels have a BLDGAV of $0. All parcels with the following Assessor Use Codes have been excluded from this analysis: 'agriculture-not in open space'; 'agric in open space RCW 84.34'; 'desig forest land RCW 84.33'; or 'mining activities'.
As undeveloped lands convert to the planned future land uses, the shorelines are likely to see added development. Based on prior permit activity, residential and commercial uses are likely to infill on vacant parcels. The County has seen extensive permitting on Lake Chelan as identified in Table 4d of Section 2.3.
4.4.2 Existing and Potential Public Access Parks and open space are found along numerous shorelines in the unincorporated area. Open space is estimated at approximately 9,417 acres (Table 36). Park acres total less than 1 acre along Lake Chelan.
Table 36. Open Space along Shorelines in WRIA 47
Waterbody Shoreline Acres Open Space Acres % Open Space Agnes Creek 272 272 100% Antilon Lake 52 50 96% Basin Creek 19 19 100% Boulder Creek 1 190 190 100% Bridge Creek 582 582 100% Chelan River 160 152 95% Columbia River 672 195 29% Company Creek 446 446 100% Cottonwood Creek 25 25 100% Cub Lake 24 24 100% Domke Lake 88 88 100% Doubtful Creek 3 3 100% Doubtful Lake 22 22 100% Dry Lake 68 0 0% Fish Creek 1 187 164 87% Flat Creek 425 425 100% Green View Lake 31 31 100% Hart Lake 28 28 100% Lake Chelan 2,592 1,694 66% Lyman Lake 42 42 100% Maple Creek 96 96 100% McAlester Creek 117 117 100% Mirror Lake 29 29 100% North Fork Bridge Creek 383 383 100%
Page 156 March 2009
DRAFT Chelan County Shoreline Inventory and Analysis
Waterbody Shoreline Acres Open Space Acres % Open Space North Fork Thirtyfive Mile Creek 31 31 100% Park Creek 282 282 100% Prince Creek 259 259 100% Railroad Creek 805 796 99% Rainbow Creek 204 204 100% Rainy Lake 33 33 100% Rimrock Creek 29 29 100% Roses Lake 57 5 8% South Fork Agnes Creek 457 457 100% South Fork Bridge Creek 121 121 100% South Fork Flat Creek 46 46 100% Spruce Creek 154 154 100% Stehekin River 1,244 1,239 100% Surprise Lake 34 34 100% Swamp Creek 51 51 100% Trapper Lake 71 71 100% Twentyfive Mile Creek 146 111 76% Unnamed Lake 1 42 25 59% Wapato Lake 82 0 0% West Fork Agnes Creek 335 335 100% West Fork Flat Creek 101 101 100% White Rock Lakes (1) 24 24 100% TOTAL 11,160 9,483 85%
In addition, formal developed public access points include: trails, campgrounds, and boat launches. The trails are more extensive in the northern and western portion of the WRIA and alongside and between waterbodies. Most trails near Lake Chelan do not parallel the water, and radiate to other destinations away from the lake. Boat launches are numerous along Lake Chelan. View corridors are prominent along Lake Chelan in the vicinity of the City of Chelan.
Lake Chelan is the most developed shoreline in WRIA 47, with boating and camping facilities. There are fewer facilities on a handful of other waterbodies as shown in Table 37. Similar to other WRIAs, more waterbodies have trails in shoreline jurisdiction (Table 38).
Table 37. WRIA 47 Public Access Facilities
Waterbody Total Facilities
Boating Facility Campground Marina Picnic Area Trailhead
Domke Lake 2 2 Lake Chelan 57 27 28 1 1 Prince Creek 1 1 Railroad Creek 1 1 Twentyfive Mile Creek 4 3 1
March 2009 Page 157
DRAFT Chelan County Shoreline Inventory and Analysis
Table 38. WRIA 47 Trails
Waterbody Trail Length Agnes Creek 813Antilon Lake 1,518Bridge Creek 1,790Company Creek 1,626Cub Lake 1,605Domke Lake 2,998Fish Creek 1 5,487Hart Lake 1,885Lake Chelan 15,117Lyman Lake 1,856Maple Creek 803North Fork Bridge Creek 2,798North Fork Thirtyfive Mile Creek 608
Prince Creek 7,350Railroad Creek 4,558South Fork Agnes Creek 20,496Surprise Lake 102Swamp Creek 1,550Twentyfive Mile Creek 875Unnamed Lake 1 704West Fork Agnes Creek 9,664West Fork Flat Creek 933White Rock Lakes (1) 416
County Comprehensive Parks and Recreation Plan recommendations include the following projects in the Chelan watershed:
• Comprehensive Trails Plan • Old Mill Manson Campground • Manson Marina Expansion • Subarea Parks Planning including for Manson
4.4.3 Critical Areas Shorelines in WRIA 47 contain a combined total of 7,858 acres of priority habitats and habitat features (see Table 33 above). The most common priority habitats, in order of frequency of occurrence, are those for lynx (found in 28 shorelines), followed by mule deer breeding areas, concentrations, and migratory corridors. Nine separate western gray squirrel sites are mapped in shoreline jurisdiction, distributed along four waterbodies. Seventeen additional point locations of eight other species are also found in WRIA 47 shoreline jurisdiction. Many of the rivers, streams and lakes also contain priority fish species. According to the NWI and hydric soils information, as much as 16% of the total shoreline area may be
Page 158 March 2009
DRAFT Chelan County Shoreline Inventory and Analysis
wetlands. Floodplains and a few geohazard areas are also documented in the WRIA.
4.4.4 Manson Urban Growth Area The Manson UGA is approximately 256 acres in size, with 76 acres in shoreline jurisdiction. Manson is an unincorporated community founded on Lake Chelan with a town center, waterfront parks, and residential uses. Tables 39 and 40 provide some basic information about conditions in the Manson UGA.
Table 39. Summary Table of Basic Characteristics of Each Shoreline Waterbody in the Manson Urban Growth Area.
Juris
dict
iona
l St
ream
s/La
kes
Are
a of
Upl
and
Shor
elin
e Ju
risdi
ctio
n (a
cres
)
Maj
or E
xist
ing
Land
Use
s1
Vege
tatio
n Pr
ofile
3
Crit
ical
A
rea/
Prio
rity
Hab
itat o
r Sp
ecie
s (P
HS)
4 Pr
esen
ce
Ow
ners
hip
Prof
ile2
Lakes
Lake Chelan 76.4 Other Residential
• Private 96%
• Public (Chelan PUD) 4%
Pasture/hay 41%; low-intensity development 21%; 13% each medium-intensity development and scrub/shrub
• Heritage Point western gray squirrel (2)
• 20% wetland
1 Major existing land use is reported by acres located in the shoreline jurisdiction rather than full parcels. “Government/Utility” includes governmental services, utilities, and other transportation and communication utilities. 2 Acres of shoreline owned by public or private entities. Public includes municipal, county, PUD, State, and federal lands. 3 Three dominant types listed. Consult maps for distribution and other types. 4 PHS = Priority habitats and species as identified by WDFW
Table 40. Manson UGA Land Use, Comprehensive Plan Designation, and Shoreline Environment Designation
A draft Subarea Plan intended to supplement the Chelan County Comprehensive Plan was prepared in March 2008 addressing growth and development in Manson. The Subarea Plan vision is:
“The Vision of the Manson Subarea Plan is to protect and enhance the quality of life within the Manson community through protection of its resources, its lakes, and its environment for future generations and the provision for sustainable economic growth”
Some of the proposed policies address shoreline issues, such as promotion of public access to Lake Chelan, particularly in the Town Center. The draft Subarea Plan is currently under review; the future approval process is not certain at this time (pers. com. Lilith Yanagimachi, November 3, 2008).
Lake Chelan Regional Action Plan
Currently Chelan County and the City of Chelan are producing a regional vision, conceptual land use plan, and level of service analysis for water and sewer in the study area, which includes the southern area of Lake Chelan. Public outreach was focused in the Summer of 2008. Four land use visions were presented for public comment, and as a result of preliminary regional strategic action and vision plan was prepared and shared for public review in Fall 2008. The preliminary plan proposes urban density between Manson and the City along the Lake Chelan shoreline. Proposed strategic actions include:
• Encouraging public lakefront access at the time of new development applications
• Ensuring boats have been washed or passed inspection before entering the lake
Page 160 March 2009
DRAFT Chelan County Shoreline Inventory and Analysis
• Considering a regional aquatic center on the lakefront for a visual connection with the water
• Continued collaboration on the SMP update, including specific requirements for public access to the lake
4.4.4 Potential Restoration Opportunities Lake Chelan Subbasin Plan: In 2004, a draft Lake Chelan Subbasin Plan was produced for the Northwest Power and Conservation Council (Berg 2004). The goal of the plan is to “restore conditions to a more natural state” by employing “ecosystem‐based perspectives that consider multiple species, their life histories, and their inter‐relationships.” Toward that end, the Subbasin Plan includes a detailed inventory, and concludes with a number of habitat or biological objectives for key species and key habitats in the basin.
Many of the objectives are to conduct additional species/habitat assessments, “identify and provide biological and social conservation measures to sustain focal species populations and habitats,” and in a number of instances to “[m]aintain and/or enhance habitat function (i.e., focal habitat attributes) by improving silvicultural practices, fire management, weed control, livestock grazing practices, and road management…”
Specific projects and specific locations are not listed; however, the following general restoration and conservation strategies are suggested:
Terrestrial
• Improve habitat quantity and quality by emphasizing conservation, protection, and connectivity of large blocks of high quality focal habitat. “Strategies to achieve this goal include promoting local planning and zoning, utilizing governmental plans and programs, implementing habitat stewardship projects with private landowners, and protecting lands through acquisition, conservation easements, and cooperative agreements. The plan also promotes the development and implementation of fire management protocols (protection and prescribed burning), and weed control and road management plans.”
• Protect and restore beaver habitat and, where possible, prepare for reintroduction into suitable habitat where natural recolonization may not occur. “Both the fish and wildlife portions of this management plan provide strategies to protect and restore beaver habitat and, where possible, to prepare for reintroduction into suitable habitat where natural recolonization may not occur. The restored habitat would benefit beaver, whose activities would in turn benefit the salmon and steelhead that use the watershed for a portion of their life
March 2009 Page 161
DRAFT Chelan County Shoreline Inventory and Analysis
history. Natural and reintroduced beaver populations would be protected through state harvest restrictions. The plan also provides for the maintenance of mule deer populations and ensures their habitat needs are met.”
Aquatic
• Increase populations of westslope cutthroat trout by reducing direct harvest impacts and eliminating introductions of, and/or removing, non‐native species.
• Reintroduce bull trout to form self‐sustaining nonmigratory populations. Measures that support this goal include reducing abundance of non‐native fish, maintaining suitable habitat and ecosystem‐wide processes, and increasing harvest on competitor or predator fish.
• Increase the abundance and productivity of kokanee to ensure self‐sustaining populations by increasing harvest of chinook salmon and lake trout, reducing the abundance of mysids, and planting appropriate numbers of hatchery fish.
Chelan River: Coordinated restoration efforts between the County and Chelan County PUD could arrive on a plan to restore the Chelan River for historical, educational, recreational and ecological gain. The PUD has begun a recovery effort that includes year‐round discharge over the Chelan Dam and stream restoration along the river’s lowest reach, near the dam’s powerhouse (in the town of Chelan Falls). Restoration attention could be focused on the section of the Chelan River, downstream of City limits in the 3.9 miles (6.3 km) of steep, rocky gorge downstream of the Chelan Dam. Native vegetative cover could be improved to add habitat complexity and contribute to large woody debris and residual fish recruitment.
4.5 City of Cashmere
Within the City of Cashmere and its UGA are two shoreline waterbodies: Mission Creek and the Wenatchee River. The shoreline acres in the City and UGA equal 238, and the shoreline length equals 12,159 feet. Table 41 summarizes the characteristics for each shoreline waterbody within the City and its UGA.
Page 162 March 2009
DRAFT Chelan County Shoreline Inventory and Analysis
Table 41. Summary Table of Basic Characteristics of Each Shoreline Waterbody in the City of Cashmere and its Urban Growth Area.
Juris
dict
iona
l St
ream
s/La
kes
Are
a of
Upl
and
Shor
elin
e Ju
risdi
ctio
n (a
cres
)
Maj
or E
xist
ing
Land
Use
s1
Vege
tatio
n Pr
ofile
3
Crit
ical
A
rea/
Prio
rity
Hab
itat o
r Sp
ecie
s (P
HS)
4 Pr
esen
ce
Ow
ners
hip
Prof
ile2
Mission Creek 71.55 Single Family
Residential
• Private 96% • Public
(Municipal) 4%
Low-intensity development 51%; medium-intensity development 26%; developed open space 10%
• PHS mule deer
• PHS riparian zones
• 7% wetland • FEMA
floodplain
Wenatchee River 166.20 Open Space
• Private 63% • Public
(Municipal, State) 37%
Low-intensity development 36%; medium-intensity development 21%; developed open space 16%
• PHS mule deer
• PHS riparian zone
• 31% wetland • CMZ • FEMA
floodplain 1 Major existing land use is reported by acres located in the shoreline jurisdiction rather than full parcels. “Government/Utility” includes governmental services, utilities, and other transportation and communication utilities. 2 Acres of shoreline owned by public or private entities. Public includes municipal, county, PUD, state, and federal lands. 3 Three dominant types listed. Consult maps for distribution and other types. 4 PHS = Priority habitat or species as identified by WDFW
4.5.1 Land Use Patterns Existing and Planned Land Uses
Cashmere is a historic community in the lower Wenatchee River valley known for its agricultural oriented industries, traditional downtown, and residential character. The Cashmere City limits and UGA contain two shorelines of the state: Mission Creek and Wenatchee River.
Mission Creek is largely flanked by single family residential, but also commercial and government uses (a school and community pool). The Wenatchee River is fronted mostly by open space and government/utility uses, such as the City’s wastewater treatment plant, Riverside Park, City sanitation and recycling facility, and a City mulching facility.
March 2009 Page 163
DRAFT Chelan County Shoreline Inventory and Analysis
Planned land uses are likewise a mix, and follow the existing pattern – a majority of land is planned for single family on Mission Creek and public for the Wenatchee River (Table 42).
Table 42. Cashmere Shorelines: Land Use, Comprehensive Plan Designation, and Shoreline Environment Designation
Jurisdictional Streams/Lakes
(Existing/ Future Acres)
Existing Land Use Comprehensive Plan Designation (Cashmere City Limits and UGA)
Current Shoreline
Environment Designation
Mission Creek (68.08/ 68.22)
Single Family Residential (54%), No Category (22%), Government/Utility (10%), Natural Resources (4%), Open Space (4%), Other Residential (3%), Agriculture (3%), Cultural/Recreation/ Assembly (2%), Commercial (1%), Forestry (1%), Transportation (1%)
Open Space (23%), No Category (22%), Single Family Residential (19%), Manufacturing/ Industrial (12%), Government/ Utility (14%), Agriculture (5%), Cultural/Recreation/ Assembly (3%), Forestry (1%), Transportation (1%), Commercial (<1%), Other Residential (<1%), Undeveloped Land (<1%)
Potential water‐oriented uses include agricultural uses along the Wenatchee River (over 7 acres) and along Mission Creek (over 2 acres). In addition, public parks and open space total about 33 acres along the Wenatchee River and approximately 3 acres along Mission Creek; see Parks and Public Access below. The City’s water treatment facility covers about four acres along the Wenatchee River.
Page 164 March 2009
DRAFT Chelan County Shoreline Inventory and Analysis
Developing or Redeveloping Waterfronts
Shoreline permits within the City limits in the last five years have been few and involved excavation for multi‐family development near Mission Creek, and grading/use for concrete segment storage for Bethlehem Construction along the Wenatchee River (pers. com., Mark Botello, April 2008). The County has also issued permits in unincorporated areas of the Wenatchee River and Mission Creek (see Tables 4h and 4i in Section 2.3).
Several parcels do not contain buildings on Mission Creek or the Wenatchee River in the City and UGA:19
• Mission Creek – 40 parcels and 4% of land in the shoreline jurisdiction • Wenatchee River – 33 parcels and 29% of land in the shoreline
jurisdiction
The City’s two shorelines are mostly committed to urban development today, primarily single family residential. However, some of the land along the Wenatchee River in the City limits contains older industrial structures or improvements that may redevelop. There may be additional growth on shorelines in the UGA, since this area has not yet fully developed.
The City may see additional commercial or industrial uses along Mission Creek – 1% is in commercial use, but 15% of the land is planned for mixed commercial/light industrial and 10% in warehouse industrial.
The Old Cashmere Mill Site is an example of a property that could be further developed for commercial or industrial uses. A portion of the site is in the shoreline jurisdiction of Mission Creek. Based on a 2007 appraisal, possible uses could include commercial and light industrial. The portion of the property that contains a wetland (considered an associated wetland on the shoreline jurisdiction map) would not be developed. The wetland and required buffer were noted to offer “the amenity of potential scenic or park‐like conditions” and that it could “have a positive affect on the desirability of the usable acreage.” The eastern portion of the property in the 200‐foot shoreline jurisdiction of Mission Creek may be difficult to develop due to the cost of preparing the site for development (exporting and importing fill) (Pacific Appraisal Associates, PLLC, April 2007).
19 Selected parcels have a BLDGAV of $0. All parcels with the following Assessor Use Codes have been excluded from this analysis: ʹagriculture‐not in open spaceʹ; ʹagric in open space RCW 84.34ʹ; ʹdesig. forest land RCW 84.33ʹ; or ʹmining activitiesʹ.
March 2009 Page 165
DRAFT Chelan County Shoreline Inventory and Analysis
In 2008, the Port of Chelan County received a grant from the Washington State Community Economic Revitalization Board to conduct a marketing feasibility study. (Port of Chelan County, June 2008).
4.5.2 Existing and Potential Public Access Public access features include parks and open space as follows:
• Mission Creek – about 3 acres of parks and 1 acre of open space, equaling 6% of shoreline jurisdiction
• Wenatchee River – approximately 31 acres of open space at 23% of shoreline jurisdiction and over 34 acres in parks, equaling 25% of shoreline jurisdiction
Other public access features include a river access ramp easement along the Wenatchee River within Riverside Park, as well as visual access corridors from lands east and west of the Wenatchee River in the vicinity of US 2, Riverside Park, and higher elevations.
The City’s Comprehensive Plan includes Park and Recreation goals that seek to improve the City’s existing Riverside Park and add new parks and trails:
• Plan for a recreational trail along the Wenatchee River from Goodwin Road to the East End of the Sewage treatment plant.
• Establish a plan for improvement of the kayak park and improve direct river access at Riverside Park.
• Provide efforts to support or develop a river trail access plan on dike. • Establish a plan to develop a park at the mulch site, and connect a
trail system on dike to connect to Riverside Park.
The City recently updated its Comprehensive Park & Recreation Plan 2009‐2015. The plan identifies numerous parks and recreation improvements which include converting other government‐owned properties into passive and active parks areas, including the sewage treatment lagoons, mulching center, portions of power substation properties, among others. This will add substantially to park and public access opportunities in the community. These opportunities are listed below. Reported acres are total acres of the facility, which may go beyond the shoreline jurisdiction:
• Riverside Park (7.32 acres) was opened in 1987 and is the center piece of the park system. It is a popular destination for rafters and kite flyers, and hosts a number of special events ranging from Founders Days to the Farmers Market and soccer events. Existing facilities include a river access ramp, paved trail, multi‐use field, softball backstop, children’s play equipment, parking, picnic tables, and a
Page 166 March 2009
DRAFT Chelan County Shoreline Inventory and Analysis
sand volleyball court. The Riverside Community Center is also located at the park site. It is a community center that provides meeting space for the Boy Scouts and multi‐purpose room which is popular for weddings, other rental activities, and public meetings.
• River Street Park (0.68 acre) was the location of City Hall prior to demolition in the early 1990s, and it also contains the Simmer electrical substation. The site currently features mature trees and picnic tables. Across from River Street Park is the City of Cashmere recycling center, and sanitation building and infrastructure.
• Jarvis property (1.28 acres). This property consists of two generally flat, triangular‐shaped areas that border Parkhill Street and Burlington Northern Railroad tracks. It is basically a utility substation; the fenced portion of the substation will transfer to Chelan County PUD on October 30, 2008. The site is currently undeveloped with trees and shrubs. Future plans call for a passive mini‐park.
• City of Cashmere Wastewater treatment lagoons (~20 acres). The site is an existing treatment plant lagoon system. The City’s NPDES permit for the lagoon system expiries November 30, 2010. The City is currently in the process of updating its lagoon system or constructing a package plant. In mid‐2008, the City submitted its wastewater facility plan for alternative plant designs to the Department of Ecology for review and comment. Since alternative designs may not require full use of the property for wastewater facilities, the City is considering conversion of the northern and southern thirds of the property into nature areas for trails, fish and wildlife habitat, picnicking facilities, and other features.
• City of Cashmere Mulching Center (6 acres) located at the North terminus of Hagman Road within City UGA. The site currently contains a mulching center for Cashmere citizens, and the remaining portion of the property is undeveloped. The City is considering a park in the future, including a skate court, fitness trail, and ball and play fields, as well as other amenities.
• Riverfront Trail (.53 miles) from Aplets Way, through Riverfront Park and ends at North Douglas Street. This is a primary trail that when complete will extend approximately 20 miles from Leavenworth, through Riverfront Park to Wenatchee. The project is included in the City of Cashmere, Wenatchee, Leavenworth and Chelan County Comprehensive Plans. The Chelan Douglas Land Trust is working to assist in the development of the projects. The trail consists of paved multi‐use with benches.
• Cashmere Water Park (1.12 acres) site was the first community “pool” established in the 1920s. In 1936, improvements were made by building a concrete pool and a bathhouse. A water filtering system
March 2009 Page 167
DRAFT Chelan County Shoreline Inventory and Analysis
was installed in 1950. The present bathhouse was constructed in 1979. In 2001, Cashmere updated and enlarged the pool. The existing facility includes a 25‐yard outdoor swimming pool with water jets, slide, diving board, spray feature and zero depth entry. The site has picnic tables, mature shade trees, limited parking, locker rooms and a grassy area.
Including both existing and proposed trails in the City and UGA, the shorelines trail lengths are as follows:
4.5.3 Critical Areas Shorelines in the City of Cashmere and its UGA contain a combined total of 46 acres of priority habitats and habitat features (see Table 34 above). Both the Wenatchee River and Mission Creek contain priority fish species. According to the NWI and hydric soils information, as much as 24% of the total shoreline area may be wetlands.
The critical area most prevalent on the City’s Wenatchee River shoreline is “frequently flooded areas.” Most of the City is protected by a City‐owned, Corps‐certified/built levee on the Wenatchee River. However, there is a gap in the Wenatchee River levee along Riverfront Drive, south of the Cotlets Way bridge. The area near Riverfront Drive is susceptible to flooding during heavy rains or high elevation snow melt.
4.5.4 Potential Restoration Opportunities Wenatchee Watershed Management Plan: The Wenatchee Watershed Management Plan includes four specific habitat actions for the Lower Wenatchee Watershed, which includes the City of Cashmere:
• LowWenH‐1: Use practical and feasible means to increase stream flows (within the natural hydrologic regime and existing water rights) in the Wenatchee River (UCSRB, 2005).
• LowWenH‐2: Reduce water temperatures by restoring riparian vegetation along the river (UCSRB, 2005).
• LowWenH‐3: Increase habitat diversity and quantity by restoring riparian habitat along the Wenatchee River, reconnecting side channels and the floodplain with the river, and increasing large woody debris in the side channels (UCSRB, 2005).
• LowWenH‐4: Protect existing riparian habitat and channel migration floodplain function (UCRTT, 2002).
Page 168 March 2009
DRAFT Chelan County Shoreline Inventory and Analysis
Five separate habitat actions, as follows, are included for the Mission sub‐watershed:
• MissionH‐1: Re‐establish connectivity throughout the assessment unit by removing, replacing, or fixing artificial barriers (culverts and diversions) (UCSRB, 2005).
• MissionH‐2: Use practical and feasible means to increase stream flows (within the natural hydrologic regime and existing water rights) in Mission Creek (UCSRB, 2005).
• MissionH‐3: Decrease water temperatures and improve water quality by restoring riparian vegetation along the stream (UCSRB, 2005).
• MissionH‐4: Reduce unnatural sediment recruitment to the stream by restoring riparian habitat and improving road maintenance (UCSRB, 2005).
• MissionH‐5: Increase habitat diversity and quantity by restoring riparian habitat, reconnecting side channels and the floodplain with the channel, increasing large woody debris within the channel, and by adding instream structures (UCSRB, 2005).
Several of the water‐quality actions for the Lower Wenatchee Watershed address inputs of nutrients, particularly phosphorus to the Wenatchee River. Many parks and other intensively maintained lawns or landscape areas are potential sources of nutrient run‐off. The Plan specifically mentions a need to reduce phosphorus inputs from wastewater treatment plants, including the City of Cashmere’s facility. The Plan also includes 19 water‐quality actions in the Lower Wenatchee Watershed and 33 water‐quality actions for the Mission sub‐watershed.
Riverside Park: Wenatchee River spring and fall discharges of 20,000 cfs or greater threaten the existing streamside canopy cover, vegetation and dike stability. Left and right bank reduction of shoreline armoring, addition of LWD, river meandering and revegetation could stabilize the stream bank and create off‐channel salmonid spawning and juvenile rearing areas. Nature interpretive signs can be posted to entice the birding and naturalist communities to utilize this park. Special restoration attention to the left bank could decrease noise from U.S. Highway 2, improving the overall park and City aesthetic.
Chelan County Historical Museum and Pioneer Village: Similar Wenatchee River armor reduction, stream bank stabilization and revegetation, as mentioned above, can continue downstream of the Riverside Park to the end of Riverfront Drive (right bank) and the Chelan County Historical Museum and Pioneer Village (left bank). The Chelan County Historical Museum and Pioneer Village has wonderful restoration potential providing opportunities for public involvement and education.
DRAFT Chelan County Shoreline Inventory and Analysis
Mission Creek: Seasonal floods cause considerable property damage, bank erosion and sediment loss throughout the creek. Reduce armoring and improve native vegetative cover to add habitat complexity and contribute to large woody debris recruitment. Creation of off‐channel areas may minimize flooding and provide salmonid spawning and juvenile rearing areas. A combination of native revegetation and bioengineering techniques could be provided to secure the bank from excessive erosion.
General: At an October 2008 public meeting, a number of attendees commented that several sections of the Wenatchee River and Mission Creek contain debris (old tractors, large metal pieces, household appliances etc…) that could be removed to improve stream and fish habitat, and City aesthetics.
4.6 City of Chelan
Within the City of Chelan and its UGA are two shoreline waterbodies: Chelan River and Lake Chelan. Together the City and its UGA have 517 acres and 109,558 linear feet in shoreline jurisdiction. Table 43 summarizes the characteristics of each shoreline waterbody within the City and its UGA.
Table 43. Summary Table of Basic Characteristics of Each Shoreline Waterbody in the City of Chelan and its Urban Growth Area.
Juris
dict
iona
l St
ream
s/La
kes
Are
a of
Upl
and
Shor
elin
e Ju
risdi
ctio
n (a
cres
)
Maj
or E
xist
ing
Land
Use
s1
Ow
ners
hip
Prof
ile2
Vege
tatio
n Pr
ofile
3
Crit
ical
A
rea/
Prio
rity
Hab
itat o
r Sp
ecie
s (P
HS)
4 Pr
esen
ce
Chelan River 28.03 Government • Public
(PUD) 60% • Private 40%
Developed open space 35%; scrub/shrub 30%; low-intensity development 26%
DRAFT Chelan County Shoreline Inventory and Analysis
Juris
dict
iona
l St
ream
s/La
kes
Are
a of
Upl
and
Shor
elin
e Ju
risdi
ctio
n (a
cres
)
Maj
or E
xist
ing
Land
Use
s1
Ow
ners
hip
Prof
ile2
Vege
tatio
n Pr
ofile
3
Crit
ical
A
rea/
Prio
rity
Hab
itat o
r Sp
ecie
s (P
HS)
4 Pr
esen
ce
Lake Chelan 489.13 Other Residential
• Private 90%• Public
(PUD, municipal) 10%
Low-intensity development 31%; developed open space 21%; pasture/hay 19%
• Heritage Point common loon
• Heritage Point western gray squirrel (2)
• FEMA floodplain • 7% wetland • 3% geohazard
1 Major existing land use is reported by acres located in the shoreline jurisdiction rather than full parcels. “Government/Utility” includes governmental services, utilities, and other transportation and communication utilities. 2 Acres of shoreline owned by public or private entities. Public includes municipal, County, PUD, state, and federal lands. 3 Three dominant types listed. Consult maps for distribution and other types. 4 PHS = Priority habitat or species as identified by WDFW
4.6.1 Land Use Patterns Existing and Planned Land Uses
The City of Chelan anchors the eastern end of Lake Chelan. The Chelan community attracts tourists and seasonal residents due to its historic charm, provision of commercial services, and recreational opportunities along Lake Chelan. The dominant feature around which the community is oriented is Lake Chelan. However, the community also contains the Chelan River and a small portion of the Columbia River.
Current land uses along the entire City and UGA shorelines include residential, commercial, recreation, government, and others as follows:
• Agriculture – 1% • Commercial – 7% • Cultural/Recreation/Assembly – 2% • Government – 8% • Natural Resources – <1% • No Category – 25% • Open Space – 10% • Other Residential – 25% • Single Family Residential – 16% • Undeveloped Land – 7%
March 2009 Page 171
DRAFT Chelan County Shoreline Inventory and Analysis
Most of the shoreline is developed apart from parklands.
The City’s Comprehensive Plan intends to provide for a mix of uses that efficiently use land and provide for recreation. The Comprehensive Plan includes the following land use policies applicable to the City’s shorelines:
Land Use Element Commercial Policy 18: Plans for development or redevelopment along Lake Chelan and other public open space should be oriented to tourist commercial, recreational services, activities, and residential.
Land Use Element Urban Growth Area Policy 4: Encourage efficient public use of shoreline properties by techniques such as higher density zoning, use of off‐site parking, integration with waterfront structures, flexibility and setbacks for publicly desired uses, and use of waterfront parcels for docks, swimming, and other water‐related uses, when not in conflict with other private use of waterfront property, provided that the development is consistent with the Shoreline Master Program of the City of Chelan.
Economic Development Element Open Space and Recreation Policy 3: Allow public and private development of adequate camping, boat launching, docking and moorage facilities, marinas, and other water‐related recreational opportunities on Lake Chelan and the Columbia River.
Consistent with these policies, the City’s future land use plan provides for a wide variety of uses, including single family and multifamily residential, waterfront and highway commercial, tourist accommodations, public lands, and other uses (Table 44). On all of the City’s shorelines, the following land uses are proposed:
• C‐H: High Density Commercial – 1% • C‐HS: Highway Service Commercial – <1% • C‐W: Waterfront Commercial – 5% • PLF: Public Lands and Facilities – 17% • R‐L: Single Family Residential – 46% • R‐M: Multifamily Residential – 9% • SUD: Special Use District – 6% • T‐A: Tourist Accommodations – 15% • W‐I: Warehousing and Industrial – <1% • No Category – 1%
Page 172 March 2009
DRAFT Chelan County Shoreline Inventory and Analysis
Table 44. City of Chelan Shorelines: Land Use, Comprehensive Plan Designation, and Shoreline Environment Designation
Jurisdictional Streams/Lakes
(Existing/ Future Acres)
Existing Land Use Comprehensive Plan Designation (City of Chelan) [1]
Current Shoreline
Environment Designation
Chelan River (32.38/ 27.67)
Government (37%), Open Space (21%), Single Family Residential (18%), No Category (16%), Commercial (5%), Agriculture (3%)
• PLF • R-L • R-M
• No Category
• 19.68 acres/71%
• 6.89 acres/25%
• 1.04 acres/4%
• 0.05 acres/ <1%
• Rural • Urban
Columbia River (0.026/ 0.021)
Undeveloped Land (87%), No Category (13%)
• W-1 • 0.021 acres/ 100%
• Conservancy • Urban
Lake Chelan (238.53/ 239.33)
Other Residential (29%), No Category (27%), Single Family Residential (16%), Undeveloped Land (8%), Open Space (8%), Commercial (7%), Government (4%), Cultural/Recreation/ Assembly (2%), Natural Resources (<1%), Agriculture (<1%)
• R-L • T-A • PLF • R-M • SUD • C-W • C-H • C-HS
• No Category
• 115.77 acres/49%
• 38.65 acres/16%
• 26.59 acres/11%
• 21.81 acres/9%
• 16.89 acres/7%
• 13.42 acres/6%
• 3.17 acres/1%
• 0.19 acres/ <1%
• 2.18 acres/ 1%
• Rural
1 City of Chelan designations are defined as follows: C-H: High Density Commercial C-HS: Highway Service Commercial C-W: Waterfront Commercial PLF: Public Lands and Facilities R-L: Single Family Residential R-M: Multifamily Residential SUD: Special Use District T-A: Tourist Accommodations W-I: Warehousing and Industrial
Present shoreline designations include Urban and Rural on Lake Chelan, Urban and Conservancy on the Chelan River, and Rural for the Columbia River.
March 2009 Page 173
DRAFT Chelan County Shoreline Inventory and Analysis
Water-Oriented Uses
Lake Chelan shorelines contain some water‐oriented uses including parks (about 16 acres), agriculture (about than 2 acres), and eating/drinking places (less than 1 acre). The Chelan River has about 7 acres in shoreline jurisdiction for parks use. Another indicator of water‐oriented uses are two zones, Waterfront Commercial and Tourist Accommodation, which mostly contain water‐oriented uses (e.g. resorts, eating/drinking places, marine craft transportation, and recreation). In shoreline jurisdiction, these designations total 14 and 26 acres respectively.
Developing or Redeveloping Waterfronts
Potential growth could occur on properties that are vacant or that do not have structures, as well as on lands the City has identified for further development in its plans.
Table 45 identifies the number of shoreline parcels that do not include buildings by each shoreline area. Public or private property owners may construct buildings or improvements on these parcels in the future consistent with applicable plans and regulations. Along Lake Chelan, there are nearly 200 parcels, and about one‐third of shoreline acres, that do not presently have buildings.
Table 45. City of Chelan Shoreline Parcels without Buildings
Waterbody Total Parcels
Total Acres
Parcels Without Buildings
Parcels Without Buildings - Acres
% Without Buildings
Chelan River 30 19 12 15.54 81% Columbia River 2 0 2 0.02 100% Lake Chelan 799 198 194 63.61 32%
Note: Selected parcels have a BLDGAV of $0. All parcels with the following Assessor Use Codes have been excluded from this analysis: 'agriculture-not in open space'; 'agric in open space RCW 84.34'; 'desig. forest land RCW 84.33'; or 'mining activities'.
Areas of potential growth as identified in City plans include Lord Acres and the Northern UGA. On the south side of the lake future development is more likely to occur on uplands (personal communication, Craig Gildroy, City of Chelan, April 2008).
City plans identify the Lord Acres area as a special use district:
Land Use Element Commercial Policy 20: The Lord’s Acres area should be designated as a special use district as a mixed use agricultural, tourist commercial, and residential use area.
Page 174 March 2009
DRAFT Chelan County Shoreline Inventory and Analysis
A subarea plan has been prepared to further guide the development of the area. As the area contains agricultural activities, some larger lots remain.
The Northern UGA has been planned for Single Family Residential, and several larger lots remain which may be further developed. The lots abutting the shoreline on the Southern UGA have been platted to a fine scale, and development is more likely to occur on areas outside of the shoreline jurisdiction on lands proposed for Single Family Residential and Special Use District.
The City has issued many shoreline permits in the last several years for in water and shoreland construction per Table 5 in Section 2.5. Future development on sites without structures and on redeveloping lots will result in additional shoreline permits.
4.6.2 Existing and Potential Public Access Public access consists of view corridors, open space and parks. View corridors are prevalent along roadways paralleling the water, and from higher elevations above the lake including in the Lord’s Acres vicinity. Parks and open space in shoreline jurisdiction total about 48 acres, with about 19 acres along the Chelan River and about 29 acres along Lake Chelan. Based on the shoreline inventory, there are 17 recreation facilities on Lake Chelan within the City and UGA as follows:
The City has planned for its parks in its Parks and Recreation Comprehensive Plan 2008‐14 (City of Chelan 2007). That Plan identifies the following existing City and non‐City facilities in the shoreline vicinity:
• Athletic Field Complex – This park is located on the southern most portion of the downtown section of Chelan and is bordered by the Chelan River on one side and residential areas on three sides. This property is owned by the Chelan County PUD and leased to the City for recreation purposes. It is used by leagues and schools, and provides fields for a variety of sports as well as a children’s play area.
• Centennial Park – This park is located on Third Street on the south shore of Lake Chelan. This park was designed for passive use and taking advantage of views of Lake Chelan and the Chelan Valley. The park contains picnic tables, benches and limited duration parking.
• Don Morse Park – This park is located on the north shore of Lake Chelan and is bordered by Highway 150, Lakeshore RV Park, Lakeshore Marina
March 2009 Page 175
DRAFT Chelan County Shoreline Inventory and Analysis
and Lake Chelan. Facilities at the site include: an 105,840 square foot swimming area with 1,350 feet of buoy line and beach bulkhead containing three stair areas and ramp, two docks, 2,000 square foot shallow pool with sand beach, day‐use lawn area with: picnic tables, picnic shelters, tennis, basketball and volleyball courts, a skate park, a children’s play area, a concession and restroom building, walkways, a golf putting course, go‐cart race track and a sports equipment rental office.
• Lakeshore Marina – This park is located on the north shore of Lake Chelan and is bordered by Highway 150, Don Morse Memorial Park, Campbell’s Resort and Lake Chelan. Public moorage accommodates 68 boats. The park also includes a launch ramp. Additional facilities include a restroom building, boater pump‐out structure, a storage building, and breakwater.
• Lakeshore RV Park – This park was designed primarily for recreational vehicle use and has water, wastewater, cable, and power hookups for 165 recreational vehicles. The park includes restroom/shower buildings and picnic tables.
• Lakeside Park – This parcel of land is located on the south shore of Lake Chelan. Facilities at the park include: 17,500 square feet of sandy beach and swimming area, picnic tables, volleyball and basketball courts, and a restroom.
• Lakeside Trail – The City is currently developing the first two phases of the Lakeside Trail. This is a Primary Trail that when completed will extend from Lakeside Park, along the southern shore of Lake Chelan, through downtown and up the north shore to the City limits. The trail will extend 2.2 miles when complete.
• Riverwalk Park and Trail – The Chelan County Public Utility District owns and maintains the one‐mile trail. The trail loops around the Chelan River and is located in the downtown core. The trail features benches, overlooks, and other amenities.
The City of Chelan’s Parks and Recreation Comprehensive Plan 2008‐14 has calculated the demand for parks and trails citywide through 2014 based on levels of service:
• Mini, neighborhood, and community parks: demand for 24 acres • Trails, pathways, bikeways: demand for 7.1 miles a portion of which is to
be satisfied by the Lakeside Trail.
It is possible that in meeting some of the parks and recreation demand, the City may plan future facilities along shorelines where appropriate.
Page 176 March 2009
DRAFT Chelan County Shoreline Inventory and Analysis
In addition to the Parks and Recreation Comprehensive Plan, the City has developed a Lakeside Trail Feasibility Study (City of Chelan 2000). As described above, the City has begun implementation of the 2.2‐mile trail with a 0.5‐mile segment.
Including both existing and proposed trails, the shoreline jurisdiction is anticipated to contain 8,225 linear feet of trails. Considering the whole Lakeside Trail, including the portions of the trail outside the 200‐foot shoreline jurisdiction, the trail length is anticipated to equal 13,200 feet (2.5 miles).
4.6.3 Critical Areas Shorelines in the City of Chelan and its UGA contain less than 0.1 acre of priority habitat, limited to mule deer habitat in the small area of Columbia River shoreline (see Table 43 above). All of the City’s shorelines contain priority fish species. According to the NWI and hydric soils information, as much as 11% of the total shoreline area may be wetlands. However, most of these potential wetlands are located in the Chelan River shorelands. The portions of the Chelan River and Columbia River in the City and UGA contain substantial areas identified as geologic hazards.
4.6.4 Potential Restoration Opportunities Riverwalk Park: Coordinate with the PUD to reduce shoreline armoring, improve streambank stabilization, remove non‐native plantings, and add native vegetation and LWD.
City of Chelan Parks (Don Morse and Lakeside Parks): Reduce shoreline armoring, create a shoreline buffer that includes non‐native vegetation, and improve shoreline stabilization. Don Morse Park is currently in the design process for updated facilities, including a restoration component.
General: Many residential shoreline properties throughout the City’s Lake Chelan shoreline have the potential for improvement of ecological functions through: 1) reduction or modification of shoreline armoring, 2) reduction of overwater cover and in‐water structures (grated pier decking, pier size reduction, pile size and quantity reduction, moorage cover removal), 3) improvements to nearshore native vegetative cover, and/or 4) reductions in impervious surface coverage. A combination of native revegetation and bioengineering techniques could be provided to secure the shoreline from excessive erosion.
4.7 City of Entiat
Within the City of Entiat and its UGA are two shoreline waterbodies: Columbia River and Entiat River. The City of Entiat and its UGA contain 117 acres and
March 2009 Page 177
DRAFT Chelan County Shoreline Inventory and Analysis
22,500 linear feet in shoreline jurisdiction. Table 46 summarizes the characteristics of each shoreline waterbody within the City and its UGA.
Table 46. Summary Table of Basic Characteristics of Each Shoreline Waterbody in the City of Entiat and its Urban Growth Area.
• PHS bald eagle • PHS mule deer • PHS riparian zone • PHS waterfowl
concentrations • 6% wetland
Entiat River 32.02 Government/ Utility
• Private 54%• Public
(PUD) 46%
Pasture/hay 43%; low-intensity development 22%; scrub/shrub 17%
• PHS mule deer • PHS riparian zone • 42% wetland
1 Major existing land use is reported by acres located in the shoreline jurisdiction rather than full parcels. “Government/Utility” includes governmental services, utilities, and other transportation and communication utilities. 2 Acres of shoreline owned by public or private entities. Public includes municipal, County, PUD, state, and federal lands. 3 Three dominant types listed. Consult maps for distribution and other types. 4 PHS = Priority habitat or species as identified by WDFW
4.7.1 Land Use Patterns Existing and Planned Land Uses
The City serves as a central gathering point for a broader community surrounding the City limits. Table 47 presents information about existing and planned use by waterbody. Along the two shorelines in the Entiat community – the Columbia River and Entiat River – primary land uses are government/utility and residential:
• Government/Utility – 17% • Open Space – 54% • Other Residential – <1% • Single Family Residential – 28% • No Category – <1%
Page 178 March 2009
DRAFT Chelan County Shoreline Inventory and Analysis
Table 47. Entiat Shorelines: Land Use, Comprehensive Plan Designation, and Shoreline Environment Designation
Jurisdictional Streams/Lakes
(Existing/ Future Acres)
Existing Land Use Comprehensive Plan Designation
Current Shoreline
Environment Designation
Columbia River (69.21/ 85.34)
Open Space (67%), Other Residential (1%), Single Family Residential (33%)
• Waterfront Business
• Residential Low
• Commercial Light Industrial
• Highway Commercial
• 55.40 acres/ 65%
• 26.78 acres/ 31%
• 3.09 acres/ 4%
• 0.07 acres/
<1%
• Urban
Entiat River (15.79/ 26.77)
Government/Utility (92%), Single Family Residential (8%), No Category (<1%)
• Waterfront Business
• Residential Low
• 20.76 acres/ 78%
• 6.01 acres/ 22%
• Conservancy • Rural • Urban
Along both the Columbia and Entiat Rivers, future land use plans call for a wider mix of uses including commercial and business:
Shoreline designations include Urban along the Columbia River, Urban at the confluence of the Entiat River, and Conservancy and Rural for the remainder of the Entiat River.
Water-Oriented Uses
Existing water‐oriented uses in the City limits include parks with shoreline recreation facilities described under Parks and Public Access below.
Developing or Redeveloping Waterfronts
Based on Assessor data, the number of lots without structures (not necessarily without uses) has been summed as a potential gauge of future development activity:20
• Columbia River – 15 parcels and 71% of shoreline acres
20 Selected parcels have a BLDGAV of $0. All parcels with the following Assessor Use Codes have been excluded from this analysis: ʹagriculture‐not in open spaceʹ; ʹagric in open space RCW 84.34ʹ; ʹdesig. forest land RCW 84.33ʹ; or ʹmining activitiesʹ.
March 2009 Page 179
DRAFT Chelan County Shoreline Inventory and Analysis
• Entiat River – 7 parcels and 68% of shoreline acres
However, the most important measure of future development/redevelopment activity is the City’s efforts towards a waterfront plan for approximately 18 acres along the Columbia River. This gives the City a chance to create a vital mixed‐use shoreline area near one of its original townsites. Through a visioning process, citizens and City leaders have indicated the following facilities are desired: launching and fueling facility, boat repair facility, lodging, cafes, boutique retail, sporting goods, and a walkable waterfront with natural features (City of Entiat, October 2008).
The Waterfront Plan is intended to encourage tourist commercial uses and economic development for the community. Preliminary conceptual plans dated Fall 2008 identify the following potential uses: marina, business and commercial, mixed use condominiums and retail, open space, riparian restoration, multi‐use trail, a new waterfront road, and parking, among other features. The development may be phased over 20 years as a current gravel operation completes extraction and reclamation.
The Waterfront Plan represents the major shoreline redevelopment in Entiat and will focus on tourist and commercial uses. As part of its relicensing requirement, the Chelan County PUD has committed to a complete redesign and upgrade of the Entiat City Park, located along the Columbia River waterfront, just south of the City’s waterfront development area. This park upgrade may potentially include additional boat launch facilities, additional upland buildings and parking, and a public swimming area. Another project that is tied to the relicensing of the Rocky Reach Dam is the outdoor learning center and trail along the Entiat River, near the confluence with the Columbia. This trail is intended to cross under the Entiat River Bridge at U.S. 97A and connect with a new waterfront trail in the upgraded Entiat City Park. The trail will continue north and connect to the trail along the City’s waterfront development.
Additional infill development may occur on some residential lots north of the commercial waterfront development dependent on the availability of wastewater service which has generally been sized for the number of present lots (pers. com., Susan Driver, City of Entiat, January 2009). Although there may be additional docks, only a few private docks are anticipated since most of the residential area is built out. Since October 2007, there have been five private dock permit applications in the City (pers. com., Susan Driver, City of Entiat, October 2008).
4.7.2 Existing and Potential Public Access The Columbia River is lined with parks and open space acres estimated at about 46 (54% of the shoreline). Open space acres along the Entiat River are estimated
Page 180 March 2009
DRAFT Chelan County Shoreline Inventory and Analysis
at about 15 acres (47% of the shoreline). This area may be more formally developed as the Entiat River Outdoor Learning Center described further below.
Much of the Entiat community enjoys visual access to the Columbia River shoreline either from hilltops or immediately along the shoreline. Physical access is primarily found at the Entiat City Park. Shoreline visual access is also found along roadways paralleling the Entiat River or the hills above.
According to the Working Draft Parks, Recreation, and Open Space Plan (March 2008), the 40‐acre Entiat City Park has over 4,000 feet of shoreline. The facilities at this park include 3 restrooms, 2 showers, 25 tent camping sites, 31 RV camping sites, and a boat launch. At this location, park users can boat, water ski, jet ski, swim, and picnic. Additionally, a local museum is also located near the site. Additional docks and other improvements are planned at the park.
Future shoreline parks and public access opportunities include the “river walk” associated with the Columbia River waterfront plan described above. According to the “Waterfront Visioning Process 2008/2009,” the trail in the redevelopment area is intended to connect with a trail along the shoreline at Entiat Park, to the south of, and progress under the Entiat River Bridge to connect with the proposed Entiaqua trail. A conceptual loop trail plan could connect the east end of the Entiaqua trail to the north end of the waterfront trail at the Columbia Breaks Fire Interpretive Center via irrigation district right‐of‐way. Additionally, the City is also involved in a cooperative process with Chelan County PUD and the United States Forest Service to develop the Entiat River Outdoor Learning Center located on the Entiat River near its confluence with the Columbia River. This proposal involves the development of day‐use and interpretive facilities on the River (City of Entiat 2008). Facilities are anticipated to include parking, education facilities, and recreation improvements, including a swim platform, trails and rafting haul‐out.
4.7.3 Critical Areas Shorelines in the City of Entiat and its UGA contain 160 acres of priority habitats, including bald eagle, riparian zones, mule deer, and waterfowl concentrations (see Table 46 above). All of the City’s shorelines contain priority fish species. According to the NWI and hydric soils information, as much as 16% of the total shoreline area may be wetlands. No information was available regarding presence of geologically hazardous areas in the City of Entiat.
4.7.4 Potential Restoration Opportunities Waterfront Plan: Implementation of the City’s Waterfront Plan is expected to result in substantial improvements to shoreline function. The City has worked to balance environmental restoration of the Columbia River waterfront with
March 2009 Page 181
DRAFT Chelan County Shoreline Inventory and Analysis
development of uses that are water‐oriented and provide economic return to the community.
Entiat River Outdoor Learning Center: Implementation of the City’s Entiat River Outdoor Learning Center plan also has potential for providing environmental restoration paired with public recreation access and environmental education. The current plan includes areas of native vegetation restoration.
Entiat City Park/Silico Saska Park: Create a shoreline buffer, improve shoreline stabilization, remove non‐native plantings and add native vegetation. Nature interpretive signs can be posted to entice the birding and naturalist communities to utilize this park.
General: Residential shoreline properties on the Columbia River have the potential for improvement of ecological functions through: 1) reduction or modification of shoreline armoring, 2) reduction of overwater cover and in‐water structures (grated pier decking, pier size reduction, pile size and quantity reduction, moorage cover removal), 3) improvements to nearshore native vegetative cover, and/or 4) reductions in impervious surface coverage. A combination of native revegetation and bioengineering techniques could be provided to secure the shoreline from excessive erosion.
4.8 City of Leavenworth
Within the City of Leavenworth and its UGA are two shoreline waterbodies: Chumstick Creek and the Wenatchee River. In the City and its UGA, total shoreland area is approximately 148 acres and runs 5,071 linear feet. Table 48 summarizes the characteristics of each shoreline waterbody within the City and its UGA.
4.8.1 Land Use Patterns Existing and Planned Land Uses
Leavenworth is located in the upper reaches of the Wenatchee River Valley. Leavenworth is known for its Bavarian‐themed downtown, as well as for its environmental quality such as along the Wenatchee River, where the City has obtained much of the shoreline for recreation or open space purposes. Table 49 presents information about existing and planned use by waterbody. Along Leavenworth’s combined shoreline area (including the UGA), the current land uses are dominated by open space, residential, government/utility, and commercial uses, as follows:
DRAFT Chelan County Shoreline Inventory and Analysis
• Government/Utility – 11% • Natural Resources – <1% • No Category – <9% • Open Space – 43% • Other Residential – 2% • Single Family Residential – 25% • Undeveloped Land – 3%
Table 48. Summary Table of Basic Characteristics of Each Shoreline Waterbody in the City of Leavenworth and its Urban Growth Area.
Juris
dict
iona
l St
ream
s/La
kes
Are
a of
Upl
and
Shor
elin
e Ju
risdi
ctio
n (a
cres
)
Maj
or E
xist
ing
Land
Use
s1
Ow
ners
hip
Prof
ile2
Vege
tatio
n Pr
ofile
3
Crit
ical
A
rea/
Prio
rity
Hab
itat o
r Sp
ecie
s (P
HS)
4 Pr
esen
ce
Chumstick Creek 7.45 Government/
Utility
• Private 52%
• Public (County, PUD) 48%
Cultivated crop 55%; low-intensity development 24%; medium-intensity development 21%
• PHS riparian zone
• FEMA floodplain
• 1% wetland
Wenatchee River 140.8 Open Space
• Private 59%
• Public (Municipal, PUD) 41%
Evergreen forest 26%; low-intensity development 18%; scrub/shrub 14%
• PHS riparian zone
• CMZ • FEMA
floodplain • 28% wetland
1 Major existing land use is reported by acres located in the shoreline jurisdiction rather than full parcels. “Government/Utility” includes governmental services, utilities, and other transportation and communication utilities. 2 Acres of shoreline owned by public or private entities. Public includes municipal, County, PUD, State, and federal lands. 3 Three dominant types listed. Consult maps for distribution and other types. 4 PHS = Priority habitat or species as identified by WDFW
Table 49. Leavenworth Shorelines: Land Use, Comprehensive Plan Designation, and Shoreline Environment Designation
Jurisdictional Streams/Lakes
(Existing/ Future Acres)
Existing Land Use Comprehensive Plan Designation Current
Shoreline Environment Designation
Chumstick Creek (7.47/ 7.37)
Government/Utility (48%), Single Family
• Light Industrial • RL-6 Zone
• 4.57 acres/62% • 2.79 acres/38%
• Conservancy • Urban
March 2009 Page 183
DRAFT Chelan County Shoreline Inventory and Analysis
Jurisdictional Streams/Lakes
(Existing/ Future Acres)
Existing Land Use Comprehensive Plan Designation Current
Shoreline Environment Designation
Residential (24%), No Category (17%), Undeveloped Land (10%), Agriculture (1%)
Wenatchee River (107.27/ 118.83)
Open Space (46%), Single Family Residential (25%), No Category (9%), Government/Utility (8%), Commercial (4%), Other Residential (3%), Undeveloped Land (3%), Cultural/ Recreation/ Assembly (3%), Natural Resources (1%)
Along the Wenatchee River and Chumstick Creek, future land plans generally recognize current patterns, though some additional development would occur consistent with the following categories:
• Central Commercial Zone – 2% • General Commercial Zone – 4% • Light Industrial Zone – 4% • Recreation Public Zone – 46% • Recreation Zone – 5% • Residential Multi‐family Zone – 4% • RL‐12 Zone – 16% • RL‐6 Zone – 9% • Tourist Commercial Zone – 2% • No Category 7%
Current SMP shoreline environments include Conservancy, Rural, and predominantly Urban.
Page 184 March 2009
DRAFT Chelan County Shoreline Inventory and Analysis
Water-Oriented Uses
Parks and recreation uses, which are extensive along the Wenatchee River in the Leavenworth community, total approximately 67 acres in shoreline jurisdiction. In addition, there are hotels/motels (3 acres approx.), a wastewater treatment plant (about 2 acres), and eating and drinking venues (less than 1 acre). Water‐oriented uses include a small agricultural property (0.10 acre) on Chumstick Creek.
Developing or Redeveloping Waterfronts
There are several public and private parcels with no structures on them (though the sites may be used for land use activities).21 These sites may be a location for future waterfront development. Four of 13 parcels on Chumstick Creek do not have buildings, and represent 40% of the shoreline acres. Seventy‐three of the 172 parcels on the Wenatchee River, representing 32% of the shoreline acres, do not contain buildings presently. These locations restrict development due to their proximity within the floodplain of the Wenatchee River.
Additionally, sites for redevelopment include lands in the downtown vicinity that are marketable for more intensive activities that are allowed in the community’s plans and zoning. These include hotels and condominiums such as on the present location of a mini‐golf business on Commercial Street, and land north of the City‐owned Waterfront Park (pers. com., Connie Krueger, City of Leavenworth, April 2008).
Other potential areas for development or redevelopment are located in the UGA, such as infill of lots in subdivisions or redevelopment of resorts.
In general, extensive changes along the shoreline are not anticipated due to the public recreation ownership of the public golf course and parks along much of the shoreline and the remaining developed condition. The City has generally received an average of just under one application per year between 1999 and 2007 (see Table 6 in Section 2.7).
4.8.2 Existing and Potential Public Access Shoreline visual access along the Wenatchee River is possible from public parks and access points on both sides of the river. The Downtown Master Plan includes shoreline visual access improvements, such as a cantilevered public access/view platform with interpretive signs overlooking Blackbird Island (City of Leavenworth 2007).
21 Selected parcels have a BLDGAV of $0. All parcels with the following Assessor Use Codes have been excluded from this analysis: ʹagriculture‐not in open spaceʹ; ʹagric in open space RCW 84.34ʹ; ʹdesig. forest land RCW 84.33ʹ; or ʹmining activitiesʹ.
March 2009 Page 185
DRAFT Chelan County Shoreline Inventory and Analysis
Approximately 71 acres of parks and open space lie in the shoreline jurisdiction along both shorelines with most located on the Wenatchee River. The following parks and recreation facilities along the Wenatchee River provide physical and visual shoreline access and are owned by the City (City of Leavenworth 1997, 2008). Acres represent total acres of parks within and beyond the shoreline jurisdiction:
• Waterfront Park including Blackbird Island – over 24 acres including trails, play apparatus, picnic areas, and restrooms. Blackbird Island contains productive steelhead rearing ponds and is a popular fishing spot for children.
• Enchantment Park – 10 acres with baseball and softball fields, picnic tables, trails and play equipment. The trails connect to Blackbird Island and Waterfront Park.
• Leavenworth Golf Club – over 100 acres with an 18‐hole public golf course and a restaurant. The course operator leases the site from the City.
• Boat/raft/tube takeout ‐ There are two boat access facilities, one formal boat launch on the southeast side of the Wenatchee River, and a raft/tube takeout south of the Golf Course on the west.
4.8.3 Critical Areas Shorelines in the City of Leavenworth and its UGA contain 115 acres of priority habitats, consisting only of priority riparian zones concentrations (see Table 48 above). All of the City’s shorelines contain priority fish species. According to the NWI and hydric soils information, as much as 26% of the total shoreline area may be wetlands. No information was available regarding presence of geologically hazardous areas in the City of Leavenworth shorelines.
4.8.4 Potential Restoration Opportunities The City of Leavenworth is already engaged in a number of cooperative restoration efforts with Trout Unlimited and U.S. Fish and Wildlife Service. The City is working with Trout Unlimited to enhance ponds in public recreation areas, including Enchantment Park and Blackbird Island. The north channel of the Wenatchee River around Blackbird Island is the subject of a study by USFWS for inclusion of large woody debris to provide habitat and control bank erosion.
Wenatchee Watershed Management Plan: The same four habitat projects listed above in Section 4.5.4 for the City of Cashmere are relevant to City of Leavenworth’s Wenatchee River and Chumstick Creek shorelines. Five separate habitat actions, as follows, are included for the Chumstick sub‐watershed, which is located for a small area at its downstream end in the City of Leavenworth:
Page 186 March 2009
DRAFT Chelan County Shoreline Inventory and Analysis
• ChumH‐1: Re‐establish connectivity throughout the assessment unit by removing, replacing, or fixing artificial barriers (culverts and diversions) (UCSRB, 2005).
• ChumH‐2: Use practical and feasible means to increase stream flows (within the natural hydrologic regime and existing water rights) in Chumstick Creek (UCSRB, 2005).
• ChumH‐3: Decrease water temperatures and improve water quality by restoring riparian vegetation along the stream (UCSRB, 2005).
• ChumH‐4: Increase habitat diversity and quantity by restoring riparian habitat, reconnecting side channels and the floodplain with the channel, increasing large woody debris within the channel, and by adding instream structures (UCSRB, 2005).
• ChumH‐5: Protect remaining floodplain and riparian habitat (UCRTT, 2002).
Several of the water‐quality actions for the Lower Wenatchee Watershed address inputs of nutrients, particularly phosphorus to the Wenatchee River. The Plan specifically mentions a need to reduce phosphorus inputs from wastewater treatment plants, including the City of Leavenworth’s plant. To date, the cities and townsites within the Wenatchee Upper Valley area are working to determine all sources of phosphorus contamination, as there appears to be a large amount of ʺnaturally occurringʺ phosphorus in the area. The Plan also includes 20 water‐quality actions in the Chumstick sub‐watershed.
Blackbird Island: The City should continue to remain involved stream bank stabilization and native vegetation establishment efforts. According to the City, the southwest tip of Blackbird Island has eroded 40 feet in 10 years. This site may be a good candidate for shoreline stabilization using bioengineering techniques. A combination of native revegetation and bioengineering techniques could be provided to secure the streambank from excessive erosion, such as was caused by the November 2006 high water event. Design of any stabilization would need to consider the high velocities in the mainstem Wenatchee River and safety issues related to high use of this section of river by non‐motorized boaters and recreationists. The interpretive signs could also be updated to provide relevant information about the Wenatchee River, its biological value, and its potential.
4.9 City of Wenatchee
Within the City of Wenatchee and its UGA are two shoreline waterbodies: the Columbia River and the Wenatchee River. In the City and its UGA, shoreline jurisdiction contains 282 acres and 51,484 linear feet. Table 50 summarizes the characteristics of each shoreline waterbody within the City and its UGA.
March 2009 Page 187
DRAFT Chelan County Shoreline Inventory and Analysis
Table 50. Summary Table of Basic Characteristics of Each Shoreline Waterbody in the City of Wenatchee and its Urban Growth Area.
Juris
dict
iona
l St
ream
s/La
kes
Are
a of
Upl
and
Shor
elin
e Ju
risdi
ctio
n (a
cres
)
Maj
or E
xist
ing
Land
Use
s1
Ow
ners
hip
Prof
ile2
Vege
tatio
n Pr
ofile
3
Crit
ical
A
rea/
Prio
rity
Hab
itat o
r Sp
ecie
s (P
HS)
4 Pr
esen
ce
Columbia River 177.78 Open Space
• Private 60% • Public (PUD,
Municipal) 40%
Low-intensity development 28%; medium-intensity development 16%; evergreen forest 14%
• PHS bald eagle
• PHS bighorn sheep
• PHS mule deer
• PHS riparian zone
• FEMA floodplain
• 19% wetland
Wenatchee River 104.27 Open Space
• Private 69% • Public (PUD)
31%
Woody wetlands 30%; developed open space 27%; medium-intensity development 12%
• Heritage Point osprey
• PHS mule deer
• PHS riparian zone
• FEMA floodplain
• CMZ • 70% wetland
1 Major existing land use is reported by acres located in the shoreline jurisdiction rather than full parcels. “Government/Utility” includes governmental services, utilities, and other transportation and communication utilities. 2 Acres of shoreline owned by public or private entities. Public includes municipal, County, PUD, State, and federal lands. 3 Three dominant types listed. Consult maps for distribution and other types. 4 PHS = Priority habitat or species as identified by WDFW
4.9.1 Land Use Patterns Existing and Planned Land Uses
The City of Wenatchee and its UGA are located along the banks of the Columbia River at the confluence of the Wenatchee River. Wenatchee is the largest city in Chelan County and is the primary center for jobs. Table 51 presents information about existing and planned use by waterbody. Along the two shorelines in the Wenatchee community – the Columbia and Wenatchee Rivers – the current land uses are dominated by Government/Utility and open space, as follows:
• Agriculture – 4% • Commercial – 6%
Page 188 March 2009
DRAFT Chelan County Shoreline Inventory and Analysis
• Government/Utility – 24% • Manufacturing/Industrial – 6% • Other Residential – 3% • Open Space – 37% • Single Family Residential – 4% • Transportation – 4% • Undeveloped Land – 4% • No Category – 7%
Table 51. City of Wenatchee Shorelines: Land Use, Comprehensive Plan Designation, and Shoreline Environment Designation
Jurisdictional Streams/Lakes
(Existing/ Future Acres)
Existing Land Use Comprehensive Plan Designation Current
Shoreline Environment Designation
Columbia River (149.67/ 187.95)
Open Space (30%), Government/Utility (26%), Manufacturing/ Industrial (9%), No Category (9%), Commercial (8%), Transportation (5%), Single Family Residential (4%), Other Residential (4%), Agriculture (4%), Undeveloped Land (1%)
• Industrial • Waterfront
Mixed Use • Residential
High
• 110.35 acres/59%
• 63.82 acres/ 34%
• 13.78 acres/ 7%
• Urban • Natural • Rural
Wenatchee River (36.58/ 99.20)
Open Space (59%), Government/Utility (20%), Undeveloped (14%), Single Family (5%), Agriculture (3%), Commercial (1%), No Category (<1%)
Through its Comprehensive Plan the City envisions that “increased riverfront development and recreation, combined with regional partnerships,” will “inspire a unique identity for the City.” The City has adopted a Waterfront Master Plan for the Columbia River shoreline creating a series of mixed‐use activity nodes. Wenatchee is partnering with the County on the Sunnyslope/Olds Station area on the north bank of the Wenatchee River, which intends to maintain a pattern of industrial and residential development similar to present conditions.
March 2009 Page 189
DRAFT Chelan County Shoreline Inventory and Analysis
Development along the total of both shorelines would occur consistent with the following categories:
• Industrial – 41% • North Wenatchee Business District – < 1% • Residential High – 5% • Residential Moderate – 2% • Residential Single Family – 6% • Waterfront Mixed Use – 46%
Current SMP shoreline environments include Conservancy, Rural, Urban, and Natural.
Sunnyslope Subarea Plan
Sunnyslope is part of unincorporated Chelan County, within the Urban Growth Boundary for the City of Wenatchee, on the north side of the Wenatchee River and its confluence with the Columbia River.
The area is forecast to have an additional 6,000 new residents by 2025. The Sunnyslope Long Range Plan and Supplemental Environmental Impact Statement (SEIS) includes goals and policies that and a proposed land use scenario to guide growth in the Sunnyslope subarea, and was intended to support Chelan County and the City of Wenatchee’s comprehensive planning efforts.
The plan includes modification to future land use designations that are designed to achieve:
• Builds on the existing land use mix • Increase residential density in Central Sunnyslope including creation
of a new town center at School Road and Easy Street, introducing a mixed‐use commercial/residential concept intended to become the hub of a safe and walkable community.
• Retain Olds Station as a regional employment center
Planned Land Uses along the waterfront of the Columbia River include Industrial, High Density Residential, and Parks. Planned Land Uses along the Wenatchee River include Single Family Residential, Industrial, and Parks.
Water-Oriented Uses
Water‐oriented uses include approximately 80 acres of parks and open space, and 6 acres of agriculture, with 50 combined acres on the Columbia River and 30 combined acres on the Wenatchee River. There are also parks and recreation uses. See Parks and Public Access below.
Page 190 March 2009
DRAFT Chelan County Shoreline Inventory and Analysis
Developing or Redeveloping Waterfronts
The City has experienced little shoreline permit activity as much of the Columbia River shoreline is owned by the PUD (see Section 2.8). The waterfront is flanked by public properties such as PUD recreation facilities and the railroad. The Sunnyslope area along the Wenatchee and Columbia Rivers is generally developed with homes and industrial uses, and is unlikely to see a significant change in the land use pattern (pers. com, Brian Frampton, City of Wenatchee, April 2008).
Although the Wenatchee area has not seen a high level of permit activity in the recent past, future development could occur on vacant parcels and on parcels subject to the City’s Waterfront Subarea Plan which promotes redevelopment.
Parcels with No Structures: There are several public and private parcels with no structures on them (though the sites may be committed to particular activities such as recreation).22 These sites may be a location for future waterfront development. Seventy‐seven of 125 parcels on the Columbia River do not have buildings, and represent 66% of the shoreline acres. Twenty of the 31 parcels on the Wenatchee River representing 94% of the shoreline acres do not contain buildings.
Waterfront Subarea Plan: The Columbia River in Wenatchee has had an urban character for some time and historically developed with industrial uses. The City’s Waterfront Subarea Plan proposes instead a mix of residential, commercial, and recreation uses. The Waterfront Subarea Plan intends that the growth be focused in north, central and south nodes as illustrated by the following policy:
• Create a series of development nodes or focal points along the waterfront – each with a different type of setting, different mix of land uses, design emphasis, and park improvements. Specifically:
• Encourage a concentration of pedestrian‐oriented retail uses near the boat basin.
• Encourage mixed‐use development between the pedestrian bridge and Thurston Street.
• Foster the development of a pedestrian‐oriented mixed‐use focus area in the area between 5th and 9th streets.
• Encourage the development of a permanent Farmers Market facility in the Central Node.
• Encourage the development of private/public recreational uses in the North End, including indoor sports complex, water‐park, and/or an
22 Selected parcels have a BLDGAV of $0. All parcels with the following Assessor Use Codes have been excluded from this analysis: ʹagriculture‐not in open spaceʹ; ʹagric in open space RCW 84.34ʹ; ʹdesig. forest land RCW 84.33ʹ; or ʹmining activitiesʹ.
March 2009 Page 191
DRAFT Chelan County Shoreline Inventory and Analysis
aquatic center, that complement existing park uses and add vitality to the waterfront.
• Encourage the development of a variety of housing types in the North End.
• Allow for a variety of uses west of Walla Walla Avenue, including general commercial, recreational, offices, industrial, and residential.
• Promote agri‐tourism uses and activities in the North End that build on the area’s rich agricultural history.
The most intense development/redevelopment is planned/zoned for the area between Orondo Avenue and Walla Walla Avenue. Most of this activity will take place outside of shoreline jurisdiction as a large percentage of the Columbia River frontage in the Waterfront Subarea Plan is already developed with PUD parks and the railroad corridor.
4.9.2 Existing and Potential Public Access Open space and park acres within the shoreline jurisdiction include about 120 acres total on the Wenatchee and Columbia Rivers. Several park areas offer water access via boat launches, piers, or trails.
Waterfront parks and trails in the City and UGA of Wenatchee include the following (acres below show total property within and outside of the 200‐foot shoreline jurisdictional area):
• Washington Confluence State Park at the “confluence” of the Columbia and Wenatchee Rivers: The facility was built and is owned by the Chelan County PUD, but is operated and maintained by Washington State Parks and includes overnight RV and tent campsites, a boat launch, swimming beach, restrooms, showers, picnic shelter, volleyball, tennis courts, playground, pedestrian bridge across the river, 4.5 miles of trail, wildlife habitat, and interpretive graphics.
• Riverfront Park: This 31‐acre park is owned and managed by the Chelan County PUD, and contains restrooms, an ice rink, a boat launch, short‐term moorage and boat trailer parking, 1.1 miles of shoreline trail, and a “special event” mini‐railroad.
• Walla Walla Park: This 70‐acre park adjoins the Riverfront Park, and contains restrooms, picnic shelters, ballfields, swimming area, 1.2 miles of trail, tennis and volley ball courts, horseshoe pits, a playground, and fishing pier platform.
• Apple Capital Loop Trail: This trail fronts the Columbia River along Wenatchee in Chelan County and “loops” through East Wenatchee in Douglas County. The portion in Wenatchee is a multi‐use trail approximately 5 miles long. It was established in 1990.
Page 192 March 2009
DRAFT Chelan County Shoreline Inventory and Analysis
Planned parks and recreation improvements through 2012 in or near the shoreline include waterfront moorage and parking, waterfront trail upland access and boathouse, and open space acquisition in the City of Wenatchee and its UGA at +/‐ 200 acres (City of Wenatchee 2006).
4.9.3 Critical Areas Shorelines in the City of Wenatchee and its UGA contain 253 acres of priority habitats, consisting of bald eagle, bighorn sheep, mule deer, and priority riparian zones concentrations (see Table 50 above). All of the City’s shorelines contain priority fish species. According to the NWI and hydric soils information, as much as 38% of the total shoreline area may be wetlands. However, this figure is high because of the inclusion of some of the mainstem Columbia River as wetland. No information was available regarding presence of geologically hazardous areas in the City of Wenatchee.
4.9.4 Potential Restoration Opportunities Wenatchee Watershed Management Plan: The same four habitat projects listed above in Section 4.5.4 for the City of Cashmere are relevant to the City of Wenatchee’s Wenatchee River shoreline.
Wenatchee Parks (Riverfront and Confluence State Parks): Reduction of shoreline armoring, removal of non‐native vegetation, native revegetation, shoreline stabilization, and the addition of interpretive nature and/or historical signs. Enhance and maintain the habitat along the south Confluence State Park wetland area.
General: Reduce shoreline armoring, improve shoreline stabilization, and remove non‐native plantings. A combination of native revegetation and bioengineering techniques could be provided to secure the shoreline from excessive erosion.
5. ANALYSIS OF ECOLOGICAL FUNCTIONS AND ECOSYSTEM-WIDE PROCESSES
A simple semi‐quantitative method was developed to characterize the relative performance of each relevant watershed ecological process and function by shoreline reach (delineated based on function and land use), as outlined in WAC 173‐26‐201(3)(d)(i). The developed “model” utilizes the available information gathered as part of the Shoreline Inventory and applies a standardized ranking criterion for each independent shoreline reach to provide a consistent methodological treatment among reaches for comparison purposes. These numerical results will ensure consistent and well‐documented treatment of all
March 2009 Page 193
DRAFT Chelan County Shoreline Inventory and Analysis
reaches when assigning existing ecological function and hopefully reduce observer bias associated with the arbitrary assignment of ecological value. The numerical results are intended to complement the inventory information in Chapters 3 and 4, the brief narrative discussions were developed using the available data, and the watershed plans, and should not be viewed as a quantitative measure of existing ecological function.
5.1 Model Methodology, Rationale and Limitations
5.1.1 Methodology and Rationale Chelan County and/or its partners have produced a number of watershed and/or sub‐basin plans that were used extensively to place the waterbody in its WRIA context, particularly with regards to basic geography, geology, climate, and major land uses (see Section 1.4). Discussion of the land use changes by WRIA focuses on those that have had particularly significant impacts on shoreline functions/processes, such as dams, transportation corridors, highly developed urban areas, forestry, and agriculture.
The 134 stream, river and lake shorelines contained within the county were broken into appropriate reaches. The first reach breaks isolated the Cities and their UGAs from the rest of the County. Additional breaks were made within the Cities/UGAs as needed to delineate differences in sections of shoreline based on ecological conditions (e.g., vegetation, wetlands, channel migration zones), current/planned land use, and presence in City limits or the UGA. The shorelines in the remainder of the County were broken into reaches using either reach break precedence from previous scientifically based assessments23 or were located based on major changes in ecological conditions, current land use, and ownership.
Current/planned land use breaks and ownership breaks (except federal vs. non‐federal) are secondary to ecological condition. Current land use in particular is part of the function assessment method because many land uses may have direct, discrete impacts on ecological function and processes. Planned land use and ownership breaks are intended to facilitate use of this data to assign environment designations. Several environment designations have designation criteria that specifically relate to current and planned land use. The County also anticipates that a unique environment designation(s) may be assigned to many of the federal lands because of their level of existing protection and the different authority of the SMP over many federal lands.
23 While several studies did assess various reaches of a number of waterbodies, the reach breaks were generally not sufficient for purposes of this shoreline assessment. See additional discussion in Section 5.3.
Page 194 March 2009
DRAFT Chelan County Shoreline Inventory and Analysis
Four major function categories are identified in the Department of Ecology’s guidelines: hydrologic, shoreline vegetation, habitat, and hyporheic.24 The available information gathered County‐wide in the Shoreline Inventory was used as a proxy for determining the performance and relative rank score of these functions. Assessment of each function using this model is based upon quantitative data results derived from the GIS inventory information described in Chapters 3 and 4.
Each of the four major functions were divided into related processes and numerically scored based on the available data for each reach. The geometric mean of each major function was calculated to provide a simple standardized tool useful for inter‐reach functional comparison. While the functional score is derived from a standardized numerical process that formalizes and enables a basis for comparison of ecological functions among reaches, it is important to emphasis that the initial rankings were often assigned using categorical information. Thus, differences in numerical rankings among reaches should be viewed as a relative difference in ecological function and not as a quantified difference among areas. A list detailing each functional breakdown and tables identifying how each data layer contributed to each process score for lakes and rivers/streams can be found in the appendices. The Columbia River is evaluated through the lake branch of the model because of its essential lake character resulting from a sequence of managed dams.
Functional categories varied slightly to account for the inherent differences between streams/rivers and reservoir/lake functions. For each of the final selected parameters used in the function assessment, the quantitative data was sorted into four categories, with 4 being the most desired end of the range (e.g., impervious 0‐5% = 4, >5‐15% = 3, >15‐45% = 2, and >45% = 1). The exact sorting of quantitative data into categories was based on the actual range of numbers for the parameter for each WRIA and for each City. The Cities are separately categorized as it was expected that their high level of development and alteration compared to the rest of the County would obscure differences in level of function among reaches within each City. Separately rating each City and its UGA will facilitate assignments of environment designations.
For multi‐parameter data, such as vegetation type, the categorization varies depending on the particular function for which that vegetation parameter is being considered. For example, for large woody debris recruitment, the various forested types may be grouped and classified as value ‘4’ if percent forested is greater than 75%, ‘3’ if between 50‐75%, etc. Any other vegetation type would
24 Department of Ecology Hydrogeologist Patricia Olson has confirmed that “hyporheic function” is a non sequitur for lakes, which do not have true hyporheic zones as by definition a hyporheic zone can only be found along flowing waters. The remaining three functions identified for lakes are valid.
March 2009 Page 195
DRAFT Chelan County Shoreline Inventory and Analysis
have no value for LWD recruitment. However, for sediment removal functions, forested types may be classified as a ‘1’ and emergent/herbaceous wetland may be the high‐rating vegetation type.
Scoring was completed on a 1 to 4 scale, with 1 representing “low” function and 4 representing “high” function. Points are assigned to each function, and then are averaged for each of the four major processes. Finally, the process average scores are averaged, so as not to weight one process more than another, to reach a final function score that is identified in Tables 52 through 60. The scores are broadly mapped, and the raw data are provided in Appendix A.
Each reach has an average score for each of the function/process parameters and can be compared to other reaches within the same waterbody and to reaches in other waterbodies within the same WRIA. The scores will not be independently meaningful, but will provide a way to evaluate relative differences between reaches.
5.1.2 Limitations This simple model can not take into account that some areas naturally may function “lower” than others, not because of any anthropogenic alteration or natural disaster, but simply because of the combined effects of a particular locale’s geology, aspect, or topography. This model, for instance, considers forest to be the ideal condition, but some areas are naturally not suited for forest. Many functions operate “better” in this model when there is a floodplain to capture sediments or store water, but there are a number of drainages in steep areas that do not have floodplains. However, when the results for a particular stream are averaged, the general finding matches the intuitive hypothesis that the lower elevation areas which are typically more altered score lower than the higher elevation areas which are typically less altered and often protected through Northwest Forest Plan or Wenatchee National Forest Land and Resource Management Plan land use allocations.
The Stemilt/Squilchuck – Colockum shoreline was broken into 23 unique segments containing separate characteristics and functions that were used to produce ecological function scores (Table 52). Functional scores within WRIA 40a/b ranged from 1.9 in the Cortez Lake 1 reach to 3.3 in the Columbia River 02 reach. Despite the relatively low score of the Cortez Lake 1 segment compared
Page 196 March 2009
DRAFT Chelan County Shoreline Inventory and Analysis
with the other segments in this WRIA, the ecological function of Cortez Lake 1 is considered at a moderate level. The lower score of Cortez Lake 1 resulted primarily from the relatively high amount of impervious surfaces, presence of geologic hazards, and the impaired waterbody status of the lake. Conversely, the Columbia River 02 reach with its high amount of shrub/scrub wildlife habitat, low amount of developed land, and lack of impervious surfaces rated as an area containing relatively high ecological function.
Table 52. Function Scores by Reach in WRIA 40a/b (outside of Cities and their UGAs).
Reach Name Function Score Reach Name Function Score Colockum Creek 1 3.0 Columbia River 10 2.0 Colockum Creek 2 2.4 Columbia River 11 2.2 Colockum Creek 3 2.8 Cortez Lake 1 1.9 Columbia River 01 2.8 Cortez Lake 2 2.5 Columbia River 02 3.3 Meadow Lake 1 2.7 Columbia River 03 3.0 Meadow Lake 2 2.2
Columbia River 04 2.6 Spring Hill Reservoir 1 2.6
Columbia River 05 2.5 Spring Hill Reservoir 2 3.2
Columbia River 06 2.6 Stemilt Project Reservoir 1 2.5
Columbia River 07 2.2 Upper Wheeler Reservoir 2 2.4
Columbia River 08 2.7 Upper Wheeler Reservoir 1 2.2
Columbia River 09 2.6
Implications for Protection or Restoration
The model results suggest that the ecological function of Cortez Lake would benefit from restoration efforts primarily aimed at improving water quality in the lake. Similarly, the Columbia River reaches contained in WRIA 40 had relatively high levels of ecological function, suggesting these areas would be ideal for protection. Model results suggested that Columbia River reaches would benefit most from efforts to protect and restore native vegetation, and from improvements in land use practices that facilitated water infiltration, storage, and filtration.
5.2.2 Wenatchee (WRIA 45) Results
Because of the large number of segments in this watershed (457) and in order to correspond with the Wenatchee Watershed Management Plan sub‐watershed analysis, Table 53 is organized by the 12 sub‐watersheds rather than by segment. Segment‐specific scores can be found in Appendix A. Ecological function scores
March 2009 Page 197
DRAFT Chelan County Shoreline Inventory and Analysis
for WRIA 45 ranged from 1.7 in Peshastin Creek 23 R reach to 3.5 in the White River 07 R reach. Less than 50 percent of the 24 functional scores calculated for Peshastin Creek 23R reach obtained a moderate score of 2.0, with the lion’s share of these moderate level scores associated with hydrologic function. The Peshastin Creek sub‐watershed reaches consistently scored moderate to below moderate functional marks across all categories of the functional assessment. Conversely, all of the 34 segments on the White River consistently scored high for ecological function with 74 percent of reaches averaging above 3.0. Similarly, reaches located in the broader White sub‐watershed scored moderately high to high scores across the majority of the functional categories assessed.
Table 53. Function Scores by Waterbody and Sub-Watershed in WRIA 45 (outside of Cities and their UGAs).
Waterbody Function Score1 Sub-Watershed Category2
Columbia River 2.3 Not included Lower Wenatchee Sub-Watershed 2.5
Category 2 Wenatchee River (Wenatchee River 1L/1R-19L/19R) 2.5
Category 2 Peshastin Creek 2.4 Ingalls Creek 2.4 Chumstick Sub-Watershed 2.6
Category 3 Chumstick Creek 2.6 Wenatchee River (Wenatchee River 20L/20R-21L/23R) 2.7
Icicle Sub-Watershed 2.6
Category 2
Eightmile Creek 2.5 French Creek 2.3 Icicle Creek 2.7 Jack Creek 2.4 Leland Creek 2.6 Meadow Creek 2.4 Mountaineer Creek 2.5 Prospect Creek 2.3 Snowall Creek 2.2 Trapper Creek 2.8 Trout Creek 2.6 Colchuck Lake 2.0 Eightmile Lake 2.3 Josephine Lake 2.3 Klonaqua Lakes Lower 2.9 Klonaqua Lakes Upper 2.8 Lake Leland 2.9 Lake Victoria 2.7 Nada Lake 2.7 Perfection Lake 2.7 Shield Lake 2.9
Page 198 March 2009
DRAFT Chelan County Shoreline Inventory and Analysis
Waterbody Function Score1 Sub-Watershed Category2
Snow Lake Lower 2.3 Snow Lake Upper 3.0 Square Lake 2.7 Stuart Lake 2.4 Upper Wenatchee Sub-Watershed 2.7
Category 1 Wenatchee River (Wenatchee River 22L/24R - 37L/40R) 2.7
Lake Augusta 2.4 Chiwaukum Sub-Watershed 2.6
Category 1 Chiwaukum Creek 2.5 South Fork Chiwaukum Creek 2.6 Chiwaukum Lake 2.8 Larch Lake 2.6 Chiwawa Sub-Watershed 2.9
Category 1
Chiwawa River 3.0 Big Meadow Creek 2.6 Pole Creek 2.8 Chikamin Creek 2.7 Rock Creek 2.4 Phelps Creek 2.6 Buck Creek 2.5 Schaefer Lake 2.4 Nason Sub-Watershed 2.8
Category 2
Nason Creek 2.9 Roaring Creek 3.3 Whitepine Creek 2.6 Wildhorse Creek 3.0 Mill Creek 2.4 Lake Valhalla 2.8 Lichtenwasser Lake 2.9 Loch Eileen Lake 2.8 White Sub-Watershed 3.0
Category 1
White River 3.1 Napeequa River 2.9 Panther Creek 2.5 Ibex Creek 2.5 Cougar Creek 2.4 Indian Creek 2.6 Boulder Creek 2 2.4 Thunder Creek 2.5 Lightning Creek 2.4 Twin Lakes (1) 2.5 Twin Lakes (2) 3.3 Little Wenatchee Sub-Watershed 2.7
Category 1
Little Wenatchee River 2.9 Rainy Creek 2.3 Lake Creek 2 2.2 Fish Creek 2 2.3 Cady Creek 2.3 Lost Lake 2.6 Heather Lake 2.6
March 2009 Page 199
DRAFT Chelan County Shoreline Inventory and Analysis
Waterbody Function Score1 Sub-Watershed Category2
Glasses Lake 2.7 Theseus Lake 2.6 Lake Wenatchee Sub-Watershed 2.7
Category 1 Lake Wenatchee 2.4 Fish Lake 3.0
1 Average for waterbody weighted by area of segment. 2Source: Wenatchee Watershed Management Plan, Wenatchee Watershed Planning Unit 2006. Category 1 – “closely resembles natural, fully functional aquatic ecosystems” Category 2 – “higher level of fragmentation resulting from habitat disturbance or loss” Category 3 – “substantial degradation and are strongly fragmented by habitat loss”
Implications for Protection or Restoration
Model results suggest that a variety of restoration and protection efforts would benefit the broad ecological function of WRIA 45. Lower‐scoring shoreline segments similar to the Peshastin Creek sub‐watershed would benefit from a broad range of restoration efforts often associated with shoreline vegetation and improvements to wildlife habitat. Similarly, shoreline segments containing relatively high ecological function scores offer some of the more appropriate areas for protection efforts. The Wenatchee Watershed Management Plan and Detailed Implementation Plan classifications suggest that the Category 1 sub‐watersheds should be protected, Category 2 sub‐watersheds should be restored (e.g., improving ecosystem function and connectivity), and Category 3 sub‐watersheds should receive restoration actions designed to “rectify the primary factors that cause habitat degradation.”
5.2.3 Entiat (WRIA 46) Results
Shorelines contained in WRIA 46 were separated into 116 separate segments contained in five main river drainage basins. Overall, the ecological function scores for WRIA 46 were high with an average of 2.7 and ranging from 1.7 in a Columbia River segment to a 3.4 found in the Entiat River. Low ecological function segments in the Columbia were often associated with low levels of shoreline vegetation. Similarly, areas associated with higher ecological function scores often contained relatively high amounts of shoreline vegetation and resulted in high‐functioning wildlife habitat areas.
Table 54. Function Scores by Waterbody and Sub-Watershed in WRIA 46 (outside of Cities and their UGAs).
Waterbody by Assessment Unit Function Score1
Habitat Restoration Priority – Rank/Tier21
Columbia River 2.2 Not included Lower Entiat 2.5 -- Entiat River 2.7 1 / High
Page 200 March 2009
DRAFT Chelan County Shoreline Inventory and Analysis
Waterbody by Assessment Unit Function Score1
Habitat Restoration Priority – Rank/Tier21
(Entiat River 1L/1R-12L/19R) Entiat River (Entiat River 13L/20R– 17L/28R) 2.3 3 / High
Middle Entiat 2.8 -- Entiat River (Entiat River 18L/29R-25L/38R) 3.0 2 / High
Entiat River (Entiat River 39 – 40) 2.6 4 / Medium
Lake Creek 2.2 4 / Medium Tommy Creek 2.2 4 / Medium Upper Entiat 2.6 -- Entiat River (Entiat River 41) 2.7 7 / Low
Entiat River (Entiat River 42-44) 2.7 8 / Low
North Fork Entiat River 2.4 7 / Low Ice Lakes (1) 2.9 8 / Low Ice Lakes (2) 2.7 8 / Low Mad River 2.6 -- Mad River (Mad River 1– 4L/3R) 2.5 5 / Medium
Mad River (Mad River 5L/4R– 13L/12R) 2.6 6 / Low
1 Average for waterbody weighted by area of segment. 2 Source: Detailed Implementation Plan Entiat Water Resource Inventory Area (WRIA) 46, Chelan County Conservation District 2006
Implications for Protection or Restoration
Model results suggest that restoration activities in WRIA 46 should be broad and cover a variety of the important components associated with ecological function. However, shoreline vegetation exhibited the most notable differences between high‐ and low‐scoring shoreline segments in WRIA 46. Model results appear to suggest that healthy shoreline vegetative areas will provide for more ecological function and restoration and protection opportunities should address potential deficiencies in native vegetation. The prioritization of assessment units for restoration in the Detailed Implementation Plan Entiat Water Resource Inventory Area (WRIA) 46 appears to be very salmon‐centric and do not correlate strongly with the model’s function scores.
5.2.4 Chelan (WRIA 47) Results
Shorelines in WRIA 47 were separated into 245 distinct shoreline segments in river and lake systems. Overall, the ecological function scores were relatively high, with a low of 1.8 and a high of 3.4. Shorelines making up the Twentyfive Mile Creek and Swamp Creek drainages consistently had lower scores for the
March 2009 Page 201
DRAFT Chelan County Shoreline Inventory and Analysis
WRIA, whereas shorelines in the Stehekin River and parts of the Lake Chelan basin contained some of the highest functional scores. Shoreline segments with low average scores consistently performed poorly across all of the areas that contributed to ecological function scores, whereas wildlife habitat and good shoreline vegetation increased the ecological function of many of the higher‐rated shoreline areas.
Table 55. Function Scores by Waterbody in WRIA 47 (outside of Cities and their UGAs).
Waterbody Function Score1 Waterbody Function Score Agnes Creek 2.5 Spruce Creek 2.8 Basin Creek 2.5 Stehekin River 2.7 Boulder Creek 1 2.5 Swamp Creek 2.2
Bridge Creek 2.7 Twentyfive Mile Creek 2.3
Chelan River 2.7 WF Agnes Creek 2.7 Columbia River 2.6 WF Flat Creek 2.8 Company Creek 2.6 Antilon Lake 2.5 Cottonwood Creek 2.6 Cub Lake 2.3 Doubtful Creek 2.6 Domke Lake 2.2 Fish Creek 1 2.2 Doubtful Lake 2.9 Flat Creek 2.8 Dry Lake 2.6 Maple Creek 2.5 Green View Lake 2.3 McAlester Creek 2.4 Hart Lake 2.8 NF Bridge Creek 2.9 Lake Chelan 2.3 NF Thirtyfive Mile Creek 2.4 Lyman Lake 2.6
Park Creek 2.7 Mirror Lake 3.0 Prince Creek 2.2 Rainy Lake 2.6 Railroad Creek 2.8 Roses Lake 2.7 Rainbow Creek 2.4 Surprise Lake 2.5 Rimrock Creek 2.5 Trapper Lake 3.0 SF Agnes Creek 2.7 Unnamed Lake 1 2.9 SF Bridge Creek 2.5 Wapato Lake 2.4 SF Flat Creek 2.8 White Rock Lake 1 2.6
1 Average for waterbody weighted by area of segment.
Implications for Protection or Restoration
Model results suggest that areas with poor ecological function in WRIA 47 are often deficient in multiple areas associated with shoreline function. However, areas that often rate high in ecological function also contained some of the highest amounts of wildlife habitat and shoreline vegetation. Model results suggest that protection efforts should be focused in areas containing good vegetation patterns and high wildlife habitat. No clear focus for restoration efforts was identified by the model; rather, the results suggested that each shoreline segment should be looked at individually to assess the appropriate restoration efforts needed to restore ecological function.
Page 202 March 2009
DRAFT Chelan County Shoreline Inventory and Analysis
5.2.5 City of Cashmere Results
Shorelines in the City of Cashmere were broken into 29 separate segments, with 10 unique segments located in Mission Creek and 19 in the Wenatchee River. Model results for Mission Creek segments produced low to moderate scores for ecological function, with a low score of 2.0, and high of 2.5. Whereas, the Wenatchee River results produced moderate to moderate‐high scores, with a low of 1.8 and a high of 2.9. The majority of functional scores in Cashmere were negatively impacted by poor wildlife habitat scores and areas of impaired water quality. Areas containing high amounts of impervious surfaces were also a significant detriment to function scores in many shoreline segments.
Table 56. Function Scores by Reach for the City of Cashmere and its Urban Growth Area.
Reach Name Hydrologic Function
Shoreline Vegetation
Hyporheic Function Habitat Average
Score Mission Creek CCA Mission Creek 1L 2.8 2.5 2.3 2.4 2.5 CCA Mission Creek 1R 2.6 2.3 2.3 2.0 2.3 CCA Mission Creek 2L 2.8 2.5 2.2 2.1 2.4 CCA Mission Creek 2R 2.7 2.3 2.3 1.9 2.3 CCA Mission Creek 3L 2.6 2.2 2.1 1.6 2.1 CCA Mission Creek 3R 2.5 2.1 2.0 1.5 2.0 CCA Mission Creek 4L 2.5 2.1 2.0 1.6 2.1 CCA Mission Creek 4R 2.6 2.2 2.2 1.8 2.2 CCA Mission Creek 5R 2.7 2.3 2.3 1.8 2.3 CCA Mission Creek 6R 2.5 2.1 2.0 1.5 2.0 CCA Mission Creek 7 2.7 2.2 2.1 1.5 2.1 Wenatchee River CCA Wenatchee River 1L 2.6 2.3 2.3 2.1 2.3 CCA Wenatchee River 1R 3.2 2.9 2.8 2.8 2.9 CCA Wenatchee River 2L 2.5 2.2 2.1 2.0 2.2 CCA Wenatchee River 2R 2.4 2.0 1.9 1.6 2.0 CCA Wenatchee River 3L 2.3 2.2 2.2 1.9 2.1 CCA Wenatchee River 3R 2.2 2.1 2.1 1.6 2.0 CCA Wenatchee River 4L 2.2 2.0 2.1 1.8 2.0 CCA Wenatchee River 4R 2.7 2.3 2.2 1.7 2.2 CCA Wenatchee River 5R 2.4 2.3 2.4 1.9 2.3 CCA Wenatchee River 6R 2.6 2.6 2.7 2.1 2.5 CCA Wenatchee River 7R 2.1 2.0 2.0 1.4 1.9 CCA Wenatchee River 8R 2.6 2.1 2.2 1.8 2.2 CCA Wenatchee River 9R 2.6 2.2 2.2 1.8 2.2 CCA Wenatchee River 10R 2.5 2.1 2.0 1.5 2.1 CCA Wenatchee River 11R 2.4 2.3 2.3 2.1 2.3
March 2009 Page 203
DRAFT Chelan County Shoreline Inventory and Analysis
Reach Name Hydrologic Function
Shoreline Vegetation
Hyporheic Function Habitat Average
Score CCA Wenatchee River 12R 2.1 1.9 1.9 1.4 1.8 CCA Wenatchee River 13R 2.7 2.5 2.4 2.6 2.5
Implications for Protection or Restoration
Model results suggest that restoration and protection of wildlife habitat and efforts to limit and reduce impervious surfaces would provide the most benefit to the ecological function of shorelines in the City of Cashmere. Mission Creek reaches were estimated to be the most heavily impacted and in need of restoration efforts, while the Wenatchee River segments offer areas that could benefit from protective measures.
5.2.6 City of Chelan Results
The City of Chelan shorelines were broken into 37 Lake Chelan‐associated shoreline segments and five Chelan River‐associated segments. Lake Chelan shorelines averaged an ecological function score of 2.2, slightly above moderate levels, with a low score of 1.7 in three segments and a high score of 3.0 (Table 57). Lake segments with low overall scores consistently were rated as containing poor wildlife habitat and vegetative scores. Conversely, the higher‐rated lake segments contained relatively high quality wildlife habitat. Chelan River shoreline segment model results were less variable than those found around the lake, with an average of 2.5, low of 2.4 and high of 2.7. Similar to the Lake results, low‐scoring river segments often contained lower‐quality wildlife habitat and vegetative scores.
Table 57. Function Scores by Reach for the City of Chelan and its Urban Growth Area.
Reach Name Hydrologic Function
Shoreline Vegetation
Hyporheic Function Habitat Average
Score Lake Chelan CCH Lake Chelan L1 2.7 2.4 NA 2.1 2.4 CCH Lake Chelan 2 2.1 1.8 NA 1.6 1.9 CCH Lake Chelan 3 2.6 2.3 NA 2.0 2.3 CCH Lake Chelan 4 2.5 2.2 NA 2.0 2.2 CCH Lake Chelan 5 2.8 2.5 NA 2.3 2.5 CCH Lake Chelan 6 2.0 1.7 NA 1.4 1.7 CCH Lake Chelan 7 2.6 2.1 NA 1.7 2.1 CCH Lake Chelan 8 2.7 2.3 NA 2.0 2.3 CCH Lake Chelan 9 2.4 2.1 NA 1.8 2.1 CCH Lake Chelan 10 2.2 1.9 NA 1.6 1.9 CCH Lake Chelan 11 2.7 2.4 NA 2.1 2.4
Page 204 March 2009
DRAFT Chelan County Shoreline Inventory and Analysis
Reach Name Hydrologic Function
Shoreline Vegetation
Hyporheic Function Habitat Average
Score CCH Lake Chelan 12 3.1 3.0 NA 3.3 3.1 CCH Lake Chelan 13 2.3 2.0 NA 1.6 1.9 CCH Lake Chelan 14 2.4 2.1 NA 1.7 2.1 CCH Lake Chelan 15 2.8 2.6 NA 2.7 2.7 CCH Lake Chelan 16 2.6 2.4 NA 2.0 2.3 CCH Lake Chelan 17 2.5 2.2 NA 2.0 2.3 CCH Lake Chelan 18 2.1 1.7 NA 1.4 1.7 CCH Lake Chelan 19 2.4 2.0 NA 1.7 2.1 CCH Lake Chelan 20 2.7 2.4 NA 2.1 2.4 CCH Lake Chelan 21 2.4 2.0 NA 1.6 2.0 CCH Lake Chelan 22 2.1 1.8 NA 1.5 1.8 CCH Lake Chelan 23 2.2 2.0 NA 1.7 2.0 CCH Lake Chelan 24 2.4 2.1 NA 1.8 2.1 CCH Lake Chelan 25 2.4 2.1 NA 2.0 2.2 CCH Lake Chelan 26 2.5 2.2 NA 1.9 2.2 CCH Lake Chelan 27 2.3 2.0 NA 1.5 1.9 CCH Lake Chelan 28 2.9 2.6 NA 2.4 2.6 CCH Lake Chelan 29 2.6 2.3 NA 2.1 2.3 CCH Lake Chelan 30 2.5 2.2 NA 2.1 2.2 CCH Lake Chelan 31 2.7 2.4 NA 2.3 2.5 CCH Lake Chelan 32 2.6 2.4 NA 2.3 2.4 CCH Lake Chelan 33 2.5 2.2 NA 1.9 2.2 CCH Lake Chelan 34 2.8 2.6 NA 2.5 2.6 CCH Lake Chelan 35 2.2 2.4 NA 2.5 2.4 CCH Lake Chelan 36 2.9 3.0 NA 3.0 2.9 CCH Lake Chelan 37 2.2 2.2 NA 2.1 2.2 Chelan River CCH Chelan River 1L 2.5 2.4 2.5 2.7 2.5 CCH Chelan River 1R 2.5 2.6 2.5 2.2 2.5 CCH Chelan River 2L 2.7 2.5 2.6 2.7 2.7 CCH Chelan River 3L 2.8 2.8 2.4 2.5 2.6 CCH Chelan River 4L 2.4 2.6 2.6 2.2 2.5
Implications for Protection or Restoration
Model results for the City of Chelan suggest that protection efforts should focus on maintaining quality native vegetation patches which provide space for wildlife habitat and provide a number of benefits to the hydrologic function of the shorelines. Opportunities for restoration of shoreline vegetation and natural shorelines would improve the ecological function of both Lake and River shorelines.
March 2009 Page 205
DRAFT Chelan County Shoreline Inventory and Analysis
5.2.7 City of Entiat Results
The City of Entiat was broken into 13 separate segments: three Entiat River segments and ten Columbia River segments. Functional scores ranged from a low of 2.1 in the Entiat River 3 segment to a high of 3.2 located in the Columbia River 5 segment (Table 58). The low functional score for the Entiat River segment resulted from the high amount of impervious surfaces and the prevalent flood zones in this area, while the Columbia River 5 segment benefited from high hydrologic and wildlife habitat scores.
Table 58. Function Scores by Reach for the City of Entiat and its Urban Growth Area.
Reach Name Hydrologic Function
Shoreline Vegetation
Hyporheic Function Habitat Average
Score Entiat River CEN Entiat River 1 2.5 2.5 2.6 2.5 2.5 CEN Entiat River 2 3.1 2.8 2.9 2.7 2.9 CEN Entiat River 3 2.5 2.1 2.0 1.9 2.1 Columbia River CEN Columbia River 1 2.1 1.7 NA 1.6 1.8 CEN Columbia River 2 2.4 2.1 NA 2.2 2.2 CEN Columbia River 3 2.3 2.0 NA 2.0 2.1 CEN Columbia River 4 2.7 2.4 NA 2.4 2.5 CEN Columbia River 5 2.9 2.7 NA 3.1 2.9 CEN Columbia River 6 2.7 2.4 NA 2.5 2.5 CEN Columbia River 7 2.4 2.1 NA 2.0 2.2 CEN Columbia River 8 2.7 2.6 NA 2.9 2.7 CEN Columbia River 9 2.5 2.4 NA 2.6 2.5 CEN Columbia River 10 2.3 1.8 NA 1.8 2.0
Implications for Protection or Restoration
Model results suggest that restoration efforts in the City of Entiat would have the most impact if they were directed at improving the Entiat River reaches in its jurisdiction. Reductions in the total amount of impervious surface or use of low impact development (LID) building standards could improve the ecological function of the Entiat River. Similarly, model results identified the protection and restoration of native vegetation in the Columbia River segments of the City of Entiat would benefit the ecological function of this area.
Page 206 March 2009
DRAFT Chelan County Shoreline Inventory and Analysis
5.2.8 City of Leavenworth Results
The City of Leavenworth shorelines were broken into 18 unique segments contained in the Chumstick Creek and Wenatchee River drainages. The two segments making up the Chumstick Creek shorelines scored moderate to moderate‐high levels of ecological function. Chumstick Creek scores differed slightly primarily due to the differing levels of road density and other impervious surfaces between the segments. Conversely, model results for the Wenatchee River segments were highly variable with the highest and lowest ecological function scores produced in adjacent segments. The Wenatchee River 1L segment provided the poorest ecological function score of 2.2 due to high impervious surfaces and impaired water quality conditions, while the Wenatchee River 1R segment produced the highest score of 3.2 due to its relatively undeveloped landscape.
Table 59. Function Scores by Reach for the City of Leavenworth and its Urban Growth Area.
Reach Name Hydrologic Function
Shoreline Vegetation
Hyporheic Function Habitat Average
Score Chumstick Creek CLV Chumstick Creek 1 2.8 2.4 2.4 2.6 2.6 CLV Chumstick Creek 2 2.8 2.2 2.3 2.1 2.4 Wenatchee River CLV Wenatchee River 1L 2.5 2.0 2.0 1.8 2.1 CLV Wenatchee River 1R 3.1 2.8 2.9 3.1 3.0 CLV Wenatchee River 2L 2.1 1.8 2.0 1.7 1.9 CLV Wenatchee River 2R 2.6 2.1 2.3 2.1 2.3 CLV Wenatchee River 3L 2.7 2.1 2.2 1.9 2.2 CLV Wenatchee River 3R 2.0 1.6 1.9 1.6 1.7 CLV Wenatchee River 4L 2.7 2.3 2.2 2.2 2.4 CLV Wenatchee River 4R 2.6 2.2 2.3 2.0 2.3 CLV Wenatchee River 5L 2.9 2.9 3.0 3.3 3.0 CLV Wenatchee River 5R 3.3 3.1 3.2 3.5 3.3 CLV Wenatchee River 6L 2.9 2.6 2.7 2.5 2.7 CLV Wenatchee River 7L 2.7 2.3 2.5 2.0 2.4 CLV Wenatchee River 8L 3.0 3.2 3.4 3.7 3.3 CLV Wenatchee River 9L 3.0 2.7 2.6 2.8 2.8 CLV Wenatchee River 10L 2.7 2.3 2.4 2.2 2.4 CLV Wenatchee River 11L 2.7 2.3 2.4 2.6 2.5 CLV Wenatchee River BI 3.0 2.8 2.7 3.1 2.9
March 2009 Page 207
DRAFT Chelan County Shoreline Inventory and Analysis
Implications for Protection or Restoration
Similar to other City jurisdictions in Chelan County, model results for Leavenworth indicate that ecological function is primarily being impacted by the high amounts of impervious surfaces found in the shoreline boundary. Restoration of ecological function through the reduction of impervious surfaces would be costly and time consuming. Efforts to protect the Wenatchee River and Chumstick Creek from further degradation of ecological function would benefit from Low Impact Development standards and efforts to reduce the overall amount of impervious surfaces placed within the watershed.
5.2.9 City of Wenatchee Results
Shorelines in the City of Wenatchee were separated into 20 distinct segments: 7 segments in the Wenatchee River drainage and 14 segments contained in the Columbia River. Columbia River shorelines average slightly lower than Wenatchee River segments with functional scores of 2.6 and 2.8 respectively. Similarly, the lowest scoring shoreline segment is found in the Columbia River, whereas the highest is located in the Wenatchee River system. Low‐ranking shorelines in the Columbia River consistently ranked low across all aspects of the functional analysis, while lower‐ranking segments in the Wenatchee often had lower vegetation scores.
Table 60. Function Scores by Reach for the City of Wenatchee and its Urban Growth Area.
Reach Name Hydrologic Function
Shoreline Vegetation
Hyporheic Function Habitat Average
Score Wenatchee River CWN Wenatchee River 1L 2.9 2.9 3.0 3.2 3.0 CWN Wenatchee River 1R 2.6 2.5 2.6 2.9 2.7 CWN Wenatchee River 2L 2.1 1.9 2.0 1.9 2.0 CWN Wenatchee River 2R 1.9 1.8 1.9 2.0 1.9 CWN Wenatchee River 3L 3.0 3.0 3.2 3.5 3.2 CWN Wenatchee River 4L 3.1 3.2 3.3 3.7 3.3 CWN Wenatchee River 5L 2.9 2.8 2.6 2.8 2.8 Columbia River CWN Columbia River 1 2.6 2.4 NA 2.5 2.5 CWN Columbia River 2 2.6 2.2 NA 2.2 2.3 CWN Columbia River 3 2.7 2.4 NA 2.5 2.6 CWN Columbia River 4 2.2 2.3 NA 2.4 2.3 CWN Columbia River 5 1.9 2.0 NA 1.9 2.0 CWN Columbia River 6 2.0 1.8 NA 1.7 1.8 CWN Columbia River 7 2.3 2.2 NA 2.3 2.3 CWN Columbia River 8 3.1 3.0 NA 3.3 3.1
Page 208 March 2009
DRAFT Chelan County Shoreline Inventory and Analysis
Reach Name Hydrologic Function
Shoreline Vegetation
Hyporheic Function Habitat Average
Score CWN Columbia River 9 2.7 2.4 NA 2.5 2.6 CWN Columbia River 10 2.7 2.3 NA 2.2 2.4 CWN Columbia River 11 2.8 2.6 NA 2.6 2.7 CWN Columbia River 12 2.3 1.9 NA 1.6 1.9 CWN Columbia River 13 2.5 2.0 NA 1.8 2.1 CWN Columbia River 14 2.3 1.8 NA 1.8 2.0
Implications for Protection or Restoration
Model results suggest that shoreline segments associated with lower ecological function scores often contained limited amounts of shoreline vegetation. Restoration of shoreline vegetative areas offers a relatively cost‐efficient and tractable opportunity for the restoration of ecological function in the shorelines of the City of Wenatchee. Similarly, protection of the existing vegetated areas should be a high priority in both the Wenatchee and Columbia River jurisdictions of the City of Wenatchee.
5.3 Function Assessments from Other Studies
The following discussions present some narrative descriptions of function for major waterbodies within the WRIAs for which information is readily available. There is certainly more information available about a number of these waterbodies and others not discussed, but that information is not considered necessary to craft the updated SMP.
5.3.1 Stemilt/Squilchuck - Colockum (WRIA 40a/b) Colockum Creek
According to USGS, the lower approximately 3.7 miles of Colockum Creek has a mean annual flow of 20 cubic feet per second and is therefore in shoreline jurisdiction. Bob Steele of WDFW expressed doubts that Colockum Creek in fact met that minimum flow requirement (pers. comm., 28 October 2008). According to WDFW (2006), “Stream flow is primarily from snowmelt and fluctuates from year to year” and “Water use and permeable soils reduce the amount of surface flow reaching the mouth of Colockum Creek during the summer low flow period.”
In spite of flow issues, portions of the mainstem Colockum Creek and its tributaries are utilized by ESA‐listed chinook and summer steelhead. The first complete passage barrier on the mainstem Colockum Creek is located approximately 2 miles upstream of the mouth, and consists of a poured concrete dam (see Section 4.1.4 for additional barrier information). Resident
March 2009 Page 209
DRAFT Chelan County Shoreline Inventory and Analysis
rainbow/cutthroat trout and planted brook trout are also present in Colockum Creek (WDFW 2006). The lower 4.3 miles of Colockum Creek have been rated “good to excellent” for chinook rearing and spawning potential. Riparian vegetation condition is generally good, except through a 150‐foot‐long canyon and in a few riparian areas impacted by clearing and livestock use. Substrates are almost uniformly gravels and cobbles, large woody debris and undercut banks are abundant, and beaver dams and debris jams create abundant pools and ponds (WDFW 2006).
Cortez Lake
According to Ecology (1997), Cortez Lake is “an irrigation reservoir fed by diversions from Stemilt Creek and drainage from Meadow Lake.” Based on measurements taken in 1994, the lake is eutrophic (high productivity) based on phosphorus and chlorophyll a findings. These measurements generally indicate that water quality overall may be poor, as excessive productivity can result in depressed dissolved oxygen and mortality of some organisms. A survey of aquatic vegetation in 1994 noted a number of native species, as well as milfoil, possibly the invasive, non‐native Eurasian variety.
5.3.2 Wenatchee (WRIA 45) The following are brief summaries of ecological functions as derived primarily from the Final Wenatchee Watershed Management Plan (WRIA 45 Planning Unit 2006), unless referenced otherwise. Other sources included the Nason Creek Tributary Assessment (USBR 2008) and various Ecology water quality studies. These reports can be consulted for more detailed information.
The Final Wenatchee Watershed Management Plan (WRIA 45 Planning Unit 2006) has classified each of the sub‐watersheds into three categories based on current condition and expected effectiveness of restoration efforts. The categories are defined as follows:
“Category 1 – These sub‐watersheds represent systems that most closely resemble natural, fully functional aquatic ecosystems. In general, they support large, often continuous blocks of high‐quality habitat and smaller drainages supporting multiple populations. Connectivity among smaller drainages and through the main sub‐watershed stream corridor is good, and more than two species of federally listed fish are known to occur. Exotic species may be present but are not dominant. Protecting functioning ecosystems in these sub‐watersheds is a priority.
Category 2 – These sub‐watersheds support important aquatic resources, often with smaller drainages classified as strongholds for one or more populations. The most important difference between Category 1 and
Page 210 March 2009
DRAFT Chelan County Shoreline Inventory and Analysis
Category 2 is an increased level of fragmentation that has resulted from habitat disturbance or loss. These sub‐watersheds have a substantial number of smaller drainages where native populations have been lost or are at risk for a variety of reasons. At least one federally listed fish species can be found within each of these sub‐watersheds. Connectivity among smaller drainages may still exist or could be restored within the watershed so that it is possible to maintain or rehabilitate life history patterns and dispersal. Restoring ecosystem functions and connectivity within these sub‐watersheds are priorities.
Category 3 – These sub‐watersheds may still contain smaller drainages that support salmonids. In general, however, these smaller drainages have experienced substantial degradation and are strongly fragmented by extensive habitat loss, most notably through loss of connectivity with the mainstem corridor. At this time, the opportunities for restoring full expression of life histories for multiple populations found within the sub‐watershed are limited. The priority for funding in these subwatersheds should be to rectify the primary factor that is causing the habitat degradation.”
Lower Wenatchee Sub-Watershed
The Lower Wenatchee Sub‐Watershed is classified as Category 2, and extends from the confluence with the Columbia River upstream to Tumwater Canyon. As a result of land use alterations related to agriculture, residential development, and transportation corridors, the lower Wenatchee River shoreline has experienced the following impacts to ecological functions and processes:
• Hydrology: Major roadways (including U.S. 2), bridge crossings, and railroad lines paralleling the river have reduced channel migration, floodplain connectivity, recruitment of large woody debris and substrate materials, and riparian vegetation (both width and composition). Water withdrawals and alteration of base flow support have reduced late summer stream flows, and development with associated stormwater runoff has increased spring peak flows. Reduced summer stream flows and loss of riparian vegetation contribute to high water temperatures. The Wenatchee Subbasin Plan also reports possible increased sedimentation related to increased peak flows and loss of soil‐stabilizing vegetation. Sedimentation would have direct impacts on suitability of substrates for salmon spawning.
• Vegetation: Loss and alteration of riparian vegetation has reduced future large woody debris for instream use; downed wood and snags for terrestrial wildlife; and cover, nesting, foraging, and perching sites for terrestrial wildlife. The ability of riparian vegetation to moderate the
March 2009 Page 211
DRAFT Chelan County Shoreline Inventory and Analysis
microclimate and instream temperatures is limited. Vegetation is also not able to provide full water quality improvement and overland flow moderation. Inadvertent introductions of noxious weeds are also threatening native plant communities. According to the Wenatchee Subbasin Plan, “Riparian and floodplain conditions have been substantially altered (70% measured)…”
• Habitat: The hydrologic and vegetation impacts described above have reduced the quality and quantity of instream and riparian habitat. Background high levels of phosphorus are aggravated by possible nutrient inputs from wastewater treatment plant discharges and septic failures.
Upper Wenatchee Sub-Watershed including Chiwaukum Creek
The Upper Wenatchee Sub‐Watershed is classified as Category 1, extends from Tumwater Canyon upstream to the mouth of Lake Wenatchee, including Chiwaukum Creek. This sub‐watershed is dominated by “commercial forest” zoning, which would be more accurately characterized as “forest management,” including activities ranging from commercial harvest to wilderness protection. As a result, the Upper Wenatchee Sub‐Watershed is functioning at a much higher level than the Lower Wenatchee Sub‐Watershed. However, railways and private developments are present to a lesser degree and have similar impacts as those described above, but at a much smaller scale. U.S. 2and SR 207 are still highly impacting constructed elements that interfere with channel migration, large woody debris and gravel recruitment, and the width and composition of riparian vegetation, and has isolated an oxbow near the mouth of Nason Creek.
The Upper Wenatchee Sub‐Watershed has also been affected by past harvest practices, which have reduced the availability of wood suitable for recruitment. Fires in the sub‐watershed have also reduced soil stability, resulting in sedimentation impacts to the Wenatchee River, particularly near Tumwater Canyon.
Mission Sub-Watershed
The Mission Sub‐Watershed is classified as Category 3. The Mission Creek shoreline has experienced the following impacts to ecological functions and processes:
• Hydrology: Reduced channel migration, and loss of sinuosity and floodplain connectivity have resulted from roadways, urban development in Cashmere, and agriculture. Reduced summer stream flows and loss of riparian vegetation contribute to high water temperatures.
Page 212 March 2009
DRAFT Chelan County Shoreline Inventory and Analysis
• Vegetation: Loss and alteration of riparian vegetation has reduced future large woody debris for instream use; downed wood and snags for terrestrial wildlife; and cover, nesting, foraging, and perching sites for terrestrial wildlife. The ability of riparian vegetation to stabilize banks and moderate the microclimate and instream temperatures is limited. Vegetation is also not able to provide full water quality improvement and overland flow moderation.
• Habitat: The Mission Sub‐Watershed contains several culvert fish passage barriers, likely not on the mainstem of Mission Creek however. Water quality (septic systems and livestock effects) and riparian habitat degradation and reduced summer stream flows have substantially reduced upland and aquatic habitat conditions. The Wenatchee Basin Plan also notes that “Mission Creek does not meet State water quality standards for DDT; 4, 4‐DDT; 4, 4‐DDE and Gunthion, as well as dissolved oxygen,[and] fecal coliform. Currently, only Mission Creek in the Wenatchee River subbasin is listed as impaired due to pesticides in fish tissues.”
Peshastin Sub-Watershed
The Peshastin Sub‐Watershed is classified as Category 2. The Peshastin Sub‐Watershed has experienced the following impacts to ecological functions and processes:
• Hydrology: US 97 has had substantial effects on Peshastin Creek through direct channel re‐routing, reduced channel migration (affects recruitment of large woody debris and substrate material), and loss of sinuosity and floodplain connectivity. Reduced summer stream flows from irrigation and other withdrawals and loss of riparian vegetation contribute to high water temperatures, and affect migration and rearing of salmonids.
• Vegetation: Loss and alteration of riparian vegetation related to US 97 and other land uses has reduced future large woody debris for instream use; downed wood and snags for terrestrial wildlife; and cover, nesting, foraging, and perching sites for terrestrial wildlife. The riparian corridor has been fragmented. Vegetation is also not able to provide full water quality improvement and overland flow moderation. Ponderosa pine community habitat has been reduced in the lower watershed as a result of fire suppression, timber harvest and other development. Much of the upper sub‐watershed is protected as part of the Alpine Lakes Wilderness.
• Habitat: “This sub‐watershed provides important bull trout and steelhead spawning and rearing habitat, both in the mainstem Peshastin and in Peshastin tributaries.” However, ongoing modifications described above
March 2009 Page 213
DRAFT Chelan County Shoreline Inventory and Analysis
as well as historic mining are limiting the distribution and quality of instream habitat.
Chumstick Sub-Watershed
The Chumstick Sub‐Watershed is classified as Category 3. This highly altered watershed “has been substantially degraded and is strongly fragmented.” The Chumstick Sub‐Watershed has experienced the following impacts to ecological functions and processes:
• Hydrology: SR 209 (Chumstick Highway), rail line, multiple creek crossings by the highway, and other developments have had substantial effects on Chumstick Creek through reduced channel migration (affects recruitment of large woody debris and substrate material), and loss of sinuosity and floodplain connectivity.
• Vegetation: Forest management, including a series of harvests and fire suppression, has altered the community composition, distribution, and density. A number of noxious weeds have been introduced and are spreading, possibly permanently displacing native species.
• Habitat: Alteration and fragmentation of forest communities has degraded habitat for fish and wildlife. In spite of this, the sub‐watershed does contain a wide range of special‐status species. However, non‐native brook trout are distributed through much of the sub‐watershed, and the only native anadromous species is the steelhead trout. Partial barriers to fish passage exist through culverts in lower Chumstick Creek and farther upstream. Loss of vegetation has had impacts on water temperature, and fecal coliform levels from livestock and septic systems are also elevated. Land development and road runoff have also increased sediment delivery to the system, which can adversely affect substrate suitability for spawning and invertebrate production.
Icicle Sub-Watershed
The Icicle Sub‐Watershed is classified as Category 2, and is the largest of the Wenatchee sub‐watersheds. The Icicle Sub‐Watershed has experienced the following impacts to ecological functions and processes:
• Hydrology: Several locations of Icicle Road and development downstream of the Leavenworth National Fish Hatchery (LNFH) reduce channel migration (affects recruitment of large woody debris and substrate material), sinuosity and floodplain connectivity, and formation of and access to off‐channel habitat. Instream flows are low to non‐existent during the summer downstream of the hatchery intake in general
Page 214 March 2009
DRAFT Chelan County Shoreline Inventory and Analysis
and in particular between the intake and the outflow, although this is substantially attributable to irrigation withdrawals.
• Vegetation: Loss of vegetation resulting from the 1994 Rat Creek fire has destabilized soils and resulted in increased water temperatures and sedimentation of lower and middle Icicle Creek.
• Habitat: “This sub‐watershed contains high quality aquatic and terrestrial habitat in the upper watershed above RM 5.7, and is designated as a Key Watershed25 by the Northwest Forest Plan.” The LNFH has been a major barrier to fish passage as a deliberate management decision to protect hatchery‐reared spring chinook from disease. Summer low flows have also affected water temperature.
Nason Sub-Watershed
The Nason Sub‐Watershed is classified as Category 2. The Nason Sub‐Watershed has experienced the following impacts to ecological functions and processes:
• Hydrology: US 2 and SR 207, rail line, and other developments have had substantial effects on Nason Creek through reduced channel migration (affects recruitment of large woody debris and substrate material), and loss of sinuosity and floodplain connectivity.
• Habitat: Nason Creek is on Ecology’s 303(d) list for water temperature standard exceedances.
The U.S. Bureau of Reclamation (2008) evaluated three reaches of Nason Creek, between RM 4.6 (Coles Corner) and RM 14.3 (White Pine Railroad Bridge). These three reaches correspond to segments Nason Creek 5 to Nason Creek 7 in this analysis (see Section 5.2 above). The general conclusions drawn from the USBR study supplementary to the Final Wenatchee Watershed Management Plan (WRIA 45 Planning Unit 2006) follow:
• Vegetation: Although much of the Nason Creek watershed had been heavily impacted by timber harvest, “within the valley floor of the assessment area, the forest appears to be recovering back to the historical grand fir forest.” This is true only where permanent loss or maintenance of vegetation has not occurred due to US 2, other roads, rail lines, or power/transmission line corridors. LWD recruitment potential is
25 Key Watersheds “provide habitat critical for the maintenance and recovery of anadromous salmonids and resident fish species” as part of the Northwest Forest Plan’s Aquatic Conservation Strategy (Entiat Planning Unit 2004).
March 2009 Page 215
DRAFT Chelan County Shoreline Inventory and Analysis
relatively high, considering past and current impacts, as well as the percent shading of Nason Creek.
• Hydrology: While the recruitment potential may be relatively high, the ability of the stream to retain the wood is low because of channel straightening that tends to facilitate passage of wood (and sediment) through the assessment area. Existing large woody debris in the channel is still fairly low in areas, and results in reduced complexity of pools and reduced pool formation. Bank hardening associated with roads, rail lines, and other developments has also altered sediment/gravel recruitment. Within the assessment area alone, anthropogenic alterations have disconnected 386 acres of floodplain, 59% of that was accomplished by the railroad.
• Habitat: The hydrologic and vegetation impacts described above have reduced the quality and quantity of instream habitat.
Chiwawa Sub-Watershed
The Chiwawa Sub‐Watershed is classified as Category 1, and is the second largest of the Wenatchee sub‐watersheds. “Chiwawa is designated as a Key Watershed by the Northwest Forest Plan. “Significant resource extraction (timber, mineral, and grazing), heavy recreational use, and excellent fish, wildlife, and rare plant values co‐exist in this [sub‐]watershed,” (USFS, 1997).” The Chiwawa Sub‐Watershed has experienced the following relatively limited impacts to ecological functions and processes:
• Hydrology: “Water withdrawals in the lower Chiwawa River could potentially affect the amount of juvenile rearing habitat available in low flow years.” According to the Wenatchee Subbasin Plan (Chelan County and Yakama Nation 2004), “The Chiwawa River valley floor has an extensive high quality network of ponds, beaver canals, side channels, abandoned oxbows and other wetlands. Abundance, diversity, connectivity and quality of these wetlands are extremely high.”
• Vegetation: The lower Chiwawa River has a few residential housing developments that may have reduced riparian vegetation.
• Habitat: “Overall, the Chiwawa sub‐watershed supports moderate to high‐quality terrestrial habitat.” Riparian vegetation that may be lost due to a few residential developments could increase water temperatures and reduce cover.
Page 216 March 2009
DRAFT Chelan County Shoreline Inventory and Analysis
Upper Watershed (Lake Wenatchee, White, and Little Wenatchee Sub-Watersheds)
The three sub‐watersheds comprising the Upper Watershed are classified as Category 1. The Upper Watershed has experienced the following relatively limited impacts to ecological functions and processes:
• Hydrology: No major impacts to hydrologic functions/processes were noted in the Final Wenatchee Watershed Management Plan for the White and Little Wenatchee Sub‐Watersheds. However, the Wenatchee Subbasin Plan noted that localized sections of the White River have been armored in conjunction with roads, bridges, and residential or recreational developments. Shoreline armoring on Lake Wenatchee has the potential to affect wave processes ability to recruit and distribute substrates, which in turn affects invertebrate production and habitat condition.
• Vegetation: Past riparian harvests and log drives in the White and Little Wenatchee Sub‐Watersheds has affected large woody debris presence and potential, which in turn has affects on channel form and function. According to the Wenatchee Subbasin Plan, those activities coupled with the accompanying sediment pulse have reduced pool frequency in the White River. Some minor alterations in riparian vegetation were also noted along the lower Little Wenatchee River.
• Habitat: “The watershed is located at an important point along the Cascade Range and provides connectivity for terrestrial wildlife for species moving north‐south and east‐west. ‘From a landscape scale/range‐wide status of many species, it is important to maintain the integrity of the White River and Little Wenatchee watershed,’ (USFS, 1998).” “Important terrestrial habitat contributions of these sub‐watersheds include habitat for ‘rare plant species, disjunct plant species, and species endemic to the Wenatchee Mountains [which] occur within these watersheds,’ (USFS, 1998).” The three watersheds provide important rearing and/or spawning habitat for a variety of salmonids, as well as a number of federally listed wildlife species.
5.3.3 Entiat (WRIA 46) The Entiat watershed consists of the Entiat and Mad River sub‐basins. The Entiat River has two major tributaries that include the North Fork Entiat and the Mad River. The following are brief summaries of ecological functions for the Entiat watershed as derived primarily from the Entiat WRIA 46 Management Plan (Chelan County Conservation District 2004), unless referenced otherwise.
• Hydrology: Water quality temperature standard exceedences occur in both the Entiat and Mad Rivers during the late summer/fall period.
March 2009 Page 217
DRAFT Chelan County Shoreline Inventory and Analysis
Wintertime low temperatures and the formation of anchor ice in the lower mainstem Entiat and Mad Rivers may be a greater limiting factor than summertime highs (Berg 2004a). Soils in the Entiat basin are generally very erodible, and most land types have high sediment delivery rates. Additional sediment pulses have occurred as a result of fire/flood scenarios in 1976‐1977 (Crum Canyon Fire), 1988‐1989 (Dinkelman Fire), and 1994 (Tyee Fire).
• Habitat: Many priority species use the wildlife habitats within the Entiat WRIA for at least part of the year. Priority habitats that occur in the Entiat WRIA include: aspen stands, caves, cliffs, old‐growth/mature forests, prairies and steppe, instream, riparian, shrub‐steppe (both large and small blocks), snag habitat, talus, rural and urban natural open space, freshwater wetlands and fresh deepwater habitats.
Entiat Sub-Watershed
A range of elevations, from the Entiat headwaters to the mouth, results in a wide variety of ecosystems, from alpine to shrub‐steppe. As a result of land use alterations related to wildfire, animal grazing, residential development and transportation corridors, the Entiat watershed has experienced the following minimal impacts to ecological functions and processes:
• Hydrology: The Entiat headwaters are fed by a rim of snow‐covered peaks, resulting in rapid runoff with relatively frequent flood events in the mainstem. It is unregulated and sustained largely by groundwater (vs. precipitation) during the late summer to late winter (August through February) period. The stream channel shape of the lower 10 miles of the Entiat River, between the town of Ardenvoir and the mouth of the Entiat, has been influenced by past human activities, such as channel straightening/widening and diking, and streamside vegetation disturbance. The lack of aquatic habitat diversity, high width:depth ratio, and stream downcutting are also concerns. Typical flood and bank protection activities include dikes, rock riprap, and log revetments. Bankfull discharge is primarily responsible for the maintenance of current channel geometry in the Entiat River. These flows move and redistribute streambed and bank material, sediment, and incoming debris, and these processes are most responsible for forming or removing channel bars, bends and meanders. Current system dynamics are working to develop channel features that create a balance between stream flow and sediment loads.
• Vegetation: Wildfire is noted as one of the primary disturbance factors affecting riparian vegetation and function throughout the Entiat sub‐watershed, whereas human influences cause most of the disturbance in
Page 218 March 2009
DRAFT Chelan County Shoreline Inventory and Analysis
the lower 10 miles of shoreline. This lower section of the Entiat River experiences the highest water temperatures, decreased riparian vegetation (primarily deciduous species), and poor to good shade and recruitment of large woody debris. In general, the upper sub‐watershed (from the headwaters to RM 25) is reported as having fair to excellent shade levels and recruitment of large woody debris. In the upper sub‐watershed, there is only minimal impact to riparian areas at localized developed campgrounds (such as Cottonwood Campground). Throughout the sub‐watershed, in areas where there is a loss of vigorous shrubs, the riparian zone has reduced instream organic input and shade, which contributes to unstable stream banks and associated erosion.
• Habitat: The Entiat sub‐watershed is listed as having a lack of and/or an improperly functioning riparian zone in the lower 10 river miles that acts as a major limiting factor for fish habitat (Andonaegui 1999). The WRIA 46 Limiting Factors Analysis reported that a lack of overwintering juvenile rearing habitat is perhaps the most limiting factor of the aquatic habitat in the Entiat watershed to fully sustain salmon populations (Andonaegui 1999). Data indicates that the benthic macroinvertebrate community condition is generally healthy; however, specific characteristics of the community condition indicate slight degradation. Macroinvertebrate studies on the lower Entiat River may indicate environmental stress or an altered site. Studies conducted on the lower Entiat River have recorded exceedances in both temperature and pH, suggesting some degree of eutrophication.
Mad River Sub-Watershed
The Mad River flows into the lower Entiat River near the town of Ardenvoir, at RM 10.5. From limited available sources, the section below describes the Mad River shoreline as experiencing very few impacts to ecological function and process.
• Hydrology: As mentioned earlier, the Mad River experiences water quality temperature standard exceedences during the late summer/fall period and wintertime low temperatures with the formation of anchor ice in the lower portion of the stream.
• Habitat: The Mad River has good macroinvertebrate species richness and diversity. It currently supports steelhead, bull trout, and spring and late‐run chinook salmon.
March 2009 Page 219
DRAFT Chelan County Shoreline Inventory and Analysis
5.3.4 Chelan (WRIA 47) The Chelan basin is primarily made up of a 50‐mile lake that consists of two sub‐basins. The Lucerne basin is deep (max. depth of 1,486 feet) and fjord‐like, and extends for 38 miles containing over 92% of the total lake volume. The Wapato basin is relatively wide and shallow in comparison (max. depth of 400 feet), and extends for 12 miles. With the exception of the Stehekin and Lucerne areas, there is very little development in the Lucerne basin, resulting in natural and healthy habitat function and processes. The majority of inflow to Lake Chelan is from two major tributaries: the Stehekin River, which feeds into the lake from the west, provides 65%, and Railroad Creek provides 10%. Approximately 50 small streams provide the remaining 25% of the inflow. Due to the shape of the valley, most tributaries are relatively steep and short.
The following information on the ecological function and processes of WRIA 47 shorelines were summarized primarily from the Lake Chelan Subbasin Plan (Berg 2004c) and the Stehekin River Corridor Implementation Plan (National Park Service 2008).
Stehekin River Sub-Watershed
The Stehekin River provides most of the inflow to Lake Chelan. It has a fairly low gradient; a wide, broad floodplain; and has a mostly gravel substrate. In the broadest sense, the Stehekin is typical of a glacial‐fluvial river, with gravel bed and riffle‐pool morphology.
• Hydrology: The Stehekin watershed is flood prone due to its climate, steep topography, and other watershed factors. Many of these floods come on very quickly, causing substantial erosion. Most of the erosion sites have rip‐rap banks or rock barb protection. Massive accumulation of gravel and large wood in the river channel has revived interest in returning to the practice of large‐scale removal of woody debris and channel dredging.
• Vegetation: The growth of native riparian vegetation at the mouth of the Stehekin River is greatly affected by changes in the lake’s seasonal elevation due to the Lake Chelan Hydroelectric Project (Project). These riparian areas are inundated for an extended period of time during the growing season (April through October). There has been residential development near the mouth of the Stehekin River, where high quality riparian and wetland habitat has been removed and low areas filled.
• Habitat: The Stehekin River meanders through floodplain, providing excellent fish and rearing habitat, good spawning gravels, and plenty of instream large woody debris. Overall, there is very little unnatural
Page 220 March 2009
DRAFT Chelan County Shoreline Inventory and Analysis
impact to the aquatic and terrestrial habitat function and processes throughout the Stehekin sub‐watershed.
Lake Chelan
Lake Chelan is considered to be one of the most pristine water bodies in North America. It is a natural lake, but its levels are affected and controlled by the Project, a dam and powerhouse which are located at the mouth of the lake on the Chelan River. The 40‐foot‐high concrete gravity dam raised the elevation of the lake by 21 feet above normal high water levels. The Project reservoir, Lake Chelan, is operated between elevations of 1,079 feet and 1,100 feet to ensure optimum use of the reservoir for power generation, fish and wildlife conservation, recreation, water supply, and flood control.
Lake Chelan is characterized by deep, cold, clear water, with little organic material in the sediments, high dissolved oxygen levels, and relatively low nutrient levels. It therefore has low biological productivity. The lake’s productivity is also hindered by elevated bacterial levels near water supply intakes and elevated pesticide residues (DDT and PCBs) in lake sediments and fish populations.
• Hydrology: Seasonal changes in the lake level lead to shoreline erosion, causing slope instability, including some slumping, rockslides and debris flows, along portions of the relatively steep shoreline. Fecal coliform found throughout the lake (primarily in the Wapato sub‐basin) is likely caused by seasonal differences in waterfowl abundance, recreation use, and irrigation return flow that coincide with lake level fluctuations. The highest lake levels are maintained during the summer by Project operations. As a result, the highest lake levels also coincide with the highest seasonal population in the area, peak irrigation operations and waterfowl activity. Waterfowl activities appear to be the most likely source of the observed bacterial inputs. Nevertheless, fecal coliform levels in the Wapato sub‐basin have not exceeded applicable State water quality standards.
• Vegetation: Riparian areas along the shoreline of Lake Chelan are small, distinctly linear, and concentrated in the few areas of relatively flat terrain on tributary alluvial fans, and in a few scattered pockets near Manson. The basin is mostly steep‐sided due to its formation by glacial activity, and consists of coarse substrates, including cobbles, boulders and bedrock. These coarse substrates are generally unsuitable for plant colonization and limit the extent of riparian and emergent vegetation on most areas along the lake shoreline. The long and narrow basin results in heavy wave action during the frequently windy conditions, which limits the establishment of riparian vegetation along most of the shoreline.
March 2009 Page 221
DRAFT Chelan County Shoreline Inventory and Analysis
Human activities also influence the extent and condition of riparian zones.
• Habitat: Both the aquatic and shoreline habitats are functioning well. Competition between native fish species and introduced game fish has reduced and possibly eliminated certain native fish populations. Levels of nitrates, phosphorous, chlorophyll a, zooplankton, and benthic organisms are low, especially in the Lucerne basin, preventing the lake from supporting high densities of fish. There also have been releases of pesticides, especially DDT, and polychlorinated biphenyls (PCBs) into Lake Chelan. Large woody debris is considered a navigational hazard so much of it is removed, limiting cover and reducing habitat complexity for fish.
Railroad Creek Sub-Watershed
Railroad Creek flows past the village of Holden into Lake Chelan at Lucerne. The creek has elevated levels of metals (iron, zinc and arsenic) due to runoff from abandoned contaminated tailings at the Holden Mine.
Chelan River Sub-Watershed
Nearly the entire Lake Chelan outflow, averaging approximately 2,000 cfs, is diverted through a 2.2‐mile‐long power tunnel that passes the water through the powerhouse for hydroelectric generation and into the tailrace, which empties into the Columbia River. The remaining Lake Chelan outflow passes through the 3.9‐mile Chelan River channel. The Chelan River has been without flow during most of the year since the Project’s completion, with flow only in the spring and early summer when snow melt raises the lake to levels requiring spill for flood control. The 76‐year‐old Project was relicensed for 50 years by FERC in November 2006. Provisions of the implementation agreement include “year‐round minimum flow in the Chelan River, maintaining existing parks, regulating lake levels, fish habitat enhancements in the Chelan River, adding a trail that improves access to the Chelan River, and a variety of other actions” (http://www.chelanpud.org/282.html).
• Hydrology: The flows in the river are controlled by the Project. The water temperature leaving Lake Chelan is potentially high enough to exceed Washington State’s numeric standard for riverine water temperatures. Water quality parameters (nutrients, hardness, pH, conductivity, and fecal coliform levels) are expected to be similar to those in Lake Chelan. Shoreline erosion along the rivers banks may affect turbidity under high flow conditions, during spill events, but most of the highly unstable bank areas have been armored. A small amount of
Page 222 March 2009
DRAFT Chelan County Shoreline Inventory and Analysis
ground water enters in the steep areas within the gorge, but the cooling effect of this flow is negligible except at low flow.
• Vegetation: The Chelan River descends through a steep‐walled gorge to a broad floodplain and is bordered by shrub‐steppe, open coniferous forest, cliffs, and urban areas. Vegetation is sparse, mostly restricted to upper and lower sections of the stream, and consists primarily of deciduous trees and shrubs.
• Habitat: The Chelan River has not functioned properly since the Project’s installation. It may provide poor habitat for terrestrial species, but aquatic and riparian habitat has been nearly nonexistent. Most of the Chelan River is currently unsuitable habitat for fish, given that it has been dewatered for most of the year until recently. With flows returning and stream enhancement projects by the Chelan PUD, there should be improvement to the biological function of the Chelan River habitat in years to come.
Mid-Columbia Mainstem The Columbia River has been classified by the Washington Department of Ecology as a “Class A” water. On a scale ranging from Class AA (extraordinary) to Class C (fair), Class A waters are considered “excellent.” State and federal regulations require that Class A waters meet or exceed certain requirements for all uses. The following section summarizes impacts to ecological function and process as related in the Upper Middle Mainstem Subbasin Plan (Berg 2004d).
• Hydrology: Columbia River hydrology has been greatly altered with the construction of 14 hydroelectric dams throughout the basin (United States and Canada). Smoothing of the hydrograph and lack of significant reservoir fluctuation has increased the amount of fine sediment present in the Columbia River. Flows average more than 180,000 cfs in the mid‐Columbia, mostly coming from upriver areas in the Columbia basin and from the Kettle and Spokane Rivers. While water quality is good, compared to other rivers in the United States, there is still cause for concern. Primary concerns include levels of dissolved gases, changes in stream temperatures, turbidity levels, and exposure to environmental contaminates above biological thresholds for fish species utilizing the river. These concerns are generally related to hydropower production.
• Vegetation: Vegetation along the upper mid‐Columbia mainstem consists mainly of steppe and shrub‐steppe vegetation. Forest vegetation is generally confined to mountain slopes with sufficient precipitation. Present vegetative communities vary widely from historic conditions, as much of it was cultivated or grazed by livestock. Low‐bank riparian
March 2009 Page 223
DRAFT Chelan County Shoreline Inventory and Analysis
habitat is extremely rare along the river and some areas that were once dominated by cottonwood have been lost. Some of this habitat was lost because of the development of hydropower on the river that altered the natural flood regime. As a result, some of the upper mid‐Columbia now exhibits steep shorelines and sparse riparian vegetation providing limited fish and wildlife habitat.
• Habitat: Embayments connected to the river via culverts or small channels provide special wildlife habitat. The reduced water fluctuation and protection from wave action is beneficial to wildlife. Columbia River anadromous salmonid spawning is concentrated at the upstream portions of reservoirs, where it is generally assumed that river hydraulics are sufficient to maintain well‐sorted substrates that are relatively free of fine sediment. Water velocity in the upstream reservoir areas is also sufficient for adult anadromous salmonids to move cobble substrate for redd construction. Terrestrial and aquatic habitat functions and processes have dramatically been impacted with the damming of the river. Many avian and terrestrial species utilize the modified shoreline throughout the mid‐Columbia.
6. LAND USE ANALYSIS This section presents a use analysis, identifying current and projected shoreline use patterns, as well as estimating future demand for shoreline space, consistent with SMP guidelines.
This section is broken into two subsections: a land capacity analysis of parcels that are partially or fully included in the shoreline jurisdiction and a discussion of economic analyses prepared for shoreline areas in the County, where available.
6.1 Shoreline Land Capacity Analysis
The purpose of the shoreline land capacity analysis is to gauge the potential level of development that may occur in the future along shorelines given adopted future land use designations. The information is intended to provide an understanding of the future level of intensity that may occur given current plans and regulations.
The County’s and cities’ future land use plans contained in their Comprehensive Plans give a more specific picture of likely future activities on shorelines than the present SMP’s which allow many uses/activities in each of the shoreline environments. For example, in the Urban shoreline environment, residential,
Page 224 March 2009
DRAFT Chelan County Shoreline Inventory and Analysis
commercial, and industrial activities are allowed by the SMP whereas County or city Comprehensive Plans and zoning regulations may have designated a particular area for residential uses only.
The method to determine shoreline land capacity is summarized below. A more detailed matrix of assumptions is included in Appendix B.
• Determine shoreline use boundaries. The analysis includes all parcels that intersect with the shoreline jurisdiction (generally 200 feet of the ordinary high water mark, associated wetlands, and the floodway) whether the parcels are wholly contained in the shoreline jurisdiction or not.
• Compile County and City land capacity analyses. Based on adopted Comprehensive Plans and County and City planner input, assumptions about vacant, partially used, and under‐utilized properties have been compiled.
• Determine development potential. The analysis estimates developable acres by future land use category. Developable acres include: 1) vacant (no building value); 2) partially used (e.g. single family properties containing one home but the land can be further subdivided); or 3) under‐utilized (land value exceeds building value on multifamily, commercial or industrial properties). Constraints such as critical areas, rights of way, and infrastructure are deducted from gross acres. Market factor reductions, which account for land that may not be available (e.g. owner does not wish to develop), are also included. Densities or floor area ratios are applied to the net buildable acres to estimate total future dwellings or commercial/industrial square feet.
The statistical results exclude the following lands:
• Lands specifically identified as “public” on comprehensive plans. Lands identified as “public” on future land use maps were mapped if they met the developable parcel attributes (e.g. vacant, etc.), but excluded from statistical analysis of additional residences and commercial/ industrial square footages. However, since public uses may result in shoreline development of structures or facilities, designated public acres are described in each subsection where applicable. In contrast, statistics do include lands that are designated on future land use maps for resource, residential, commercial or industrial activities – whether they are publicly or privately owned. Though this may overestimate land capacity currently, the market factor discount reduces the potential that
March 2009 Page 225
DRAFT Chelan County Shoreline Inventory and Analysis
these lands skew results. Further, public ownership may change overtime, though rare.
• Government owned forest lands are excluded. The County’s Assessor database includes little information on these lands. It should be noted that some leasing of lands may be possible on federal government forest lands, and could be subject to the SMP, though rare in general.
• Lands specifically designated for mineral extraction are excluded. These activities have few structures, but may alter shorelines. However, designated mineral lands acres are described in each subsection where applicable.
Maps are also provided of parcels that meet the initial screening criteria. Through a review of statistics, some parcels are removed, though they remain present on the maps, e.g. public lands.
It is important to note that this analysis is intended to give an overall picture of the potential for development along shorelines, but is not an exact predictor of which parcels may develop or redevelop. In addition, the analysis does not provide a “rate” of development; review of past shoreline permits in Section 2.3 may help provide a gauge of activity levels over time.
Results are shown by WRIA and jurisdiction below.
6.1.1 Stemilt/Squilchuck – Colockum (WRIA 40a/b) The Stemilt/Squilchuck – Colockum watershed is unincorporated and designated for predominantly rural land uses. Future land use designations along shorelines include Rural Industrial, Rural Residential, and Commercial Forestry Lands among others. Based on these designations, the most intense use of property appears to be with Rural Industrial designated lands along the Columbia River at a potential for 10 million square feet on vacant shoreline lands. Single‐family dwellings would be spread along the remaining waterbodies. Single‐family dwellings are estimated at between 90 to 172 additional dwellings, dependent on whether vacant non‐resource lands are considered or whether all lands meeting the land capacity criteria are considered. The resulting capacity for development along shorelines in the watershed is shown in Table 61.
Table 61. WRIA 40a/b Shoreline Land Capacity Estimates
Waterbody Net Acres- Vacant
Net Acres- Partially Used/ Underused
Single Family Units
Multi-Family Units
Commercial Sq Ft
Industrial Sq Ft
Colockum Creek 573 202 81 - - -
Page 226 March 2009
DRAFT Chelan County Shoreline Inventory and Analysis
Net Acres- Partially Used/ Underused
Waterbody Net Acres- Vacant
Single Family Units
Multi-Family Units
Commercial Sq Ft
Industrial Sq Ft
Columbia River 856 423 56 - - 10,307,790Cortez Lake 2 2 12 - - -Meadow Lake * - 19 3 - - -Spring Hill Reservoir * - 221 11 - - -Stemilt Project Reservoir 32 - 3 - - -Upper Wheeler Reservoir - 576 29 - - -Total 1,463 1,442 195 - - 10,307,790 Partially Used Reduction (Existing Units)
23
Adjusted Total 1,463 1,442 172 - - 10,307,790 Vacant Only** 1,463 809 131 - - 10,307,790 Adjusted Total Minus Resource Lands 1,463 633 131 - - 10,307,790
Vacant Only Minus Resource Lands 1,463 - 90 - - 10,307,790
Note: * Majority of acres in Commercial Agricultural or Commercial Forest Lands designations. **The “partially used/underused acres” in this row represent vacant commercial agriculture or forest lands. The reason these acres are treated as “partially used/underutilized” is that they have an activity on them presently and because the analysis applied a higher market factor reduction since these lands are less likely to develop with residential uses than non-resource lands.
6.1.2 Wenatchee (WRIA 45) The Wenatchee watershed is likely to see growth in single‐family dwellings along the shorelines, ranging from 355 to 1,132 new dwellings depending on whether resource lands are considered. Nason and Peshastin Creeks, and the Wenatchee River have some commercial capacity, and Peshastin Creek and the Wenatchee River have potential for additional industrial development.
In addition to the results in Table 62, shoreline development may occur on vacant parcels designated for public uses at about 86 acres, and on vacant commercial mineral lands equaling about 41 acres (excluding critical areas). These acres exclude critical areas, but no further deductions for rights of way/infrastructure or market factors are taken.
Table 62. WRIA 45 Shoreline Land Capacity Estimates
Peshastin UGA: Wenatchee River 36 16 63 - 59,896 536,263
Total 1,900 16,312 1,487 - 148,069 827,416Partially Used Reduction (Existing Units)
- - 355 - - -
Adjusted Total 1,900 16,312 1,132 - 148,069 827,416Vacant Only*** 1,891 14,820 1,128 - 97,529 827,416Adjusted Total Minus Resource Lands 1,538 554 700 - 148,069 861,095
Vacant Only Minus Resource Lands 1,527 - 355 - 97,529 827,416
Page 228 March 2009
DRAFT Chelan County Shoreline Inventory and Analysis
Notes: * Majority of acres in Commercial Agricultural or Commercial Forest Lands designations. **Analysis excludes public acres. On the Columbia River, public acres equal approximately 40. *** The “partially used/underused acres” in this row represent vacant commercial agriculture or forest lands. The reason these acres are treated as “partially used/underutilized” is that they have an activity on them presently and because the analysis applied a higher market factor reduction since these lands are less likely to develop with residential uses than non-resource lands.
6.1.3 Entiat (WRIA 46) The Entiat watershed is largely unincorporated, with rural and commercial forestry uses. As shown in Table 63, depending on whether resource lands are included, between 103 and 230 dwellings may be added to shoreline areas. Small amounts of rural commercial square footage may occur along the Entiat or Mad Rivers on vacant properties designated for these uses. In addition, about 20 acres of designated Commercial Mineral lands may be altered on vacant shoreline properties, as may approximately 7 acres of public designated property (excluding critical areas).
Table 63. WRIA 46 Shoreline Land Capacity Estimates
Adjusted Total 498 2,952 230 - 26,484 -Vacant Only 498 2,479 230 - 26,484 -Adjusted Total Minus Resource Lands
498 122 134 - 26,484 -
Vacant Only Minus Resource Lands 498 - 103 - 26,484 -
Note: * Majority of acres in Commercial Agricultural or Commercial Forest Lands designations. **The “partially used/underused acres” in this row represent vacant commercial agriculture or forest lands. The reason these acres are treated as “partially used/underutilized” is that they have an activity on them presently and because the analysis applied a higher market factor reduction since these lands are less likely to develop with residential uses than non-resource lands.
6.1.4 Chelan (WRIA 47) The Chelan watershed is largely rural, with commercial forest and agricultural lands. With the attractiveness of Lake Chelan and other lakes and streams,
March 2009 Page 229
DRAFT Chelan County Shoreline Inventory and Analysis
additional residential dwellings are likely. The land capacity analysis estimates a range of 697 to 806 dwellings, depending on whether resource lands are included (Table 64). A small amount of additional rural commercial and pedestrian commercial (Manson) uses may occur along Lake Chelan or the Columbia River on vacant properties. In addition, about 342 acres of public lands (excluding critical areas) are vacant and may be modified along the shorelines in the future.
Table 64. WRIA 47 Shoreline Land Capacity Estimates
Adjusted Total 2,108 1,943 806 - 10,645 110,820Vacant Only** 2,121 1,321 769 - 10,645 110,820Adjusted Total Minus Resource Lands 2,141 129 1,002 - 10,645 110,820
Vacant Only Minus Resource Lands 2,121 - 697 - 10,645 110,820Note: * Majority of acres in Commercial Agricultural or Commercial Forest Lands designations. **The “partially used/underused acres” in this row represent vacant commercial agriculture or forest lands. The reason these acres are treated as “partially used/underutilized” is that they have an activity on them presently and because the analysis applied a higher market factor reduction since these lands are less likely to develop with residential uses than non-resource lands.
6.1.5 City of Cashmere The City of Cashmere is largely developed along its shoreline, but may see additional development in the form of residential dwellings: 8 to 58 single‐family and 57 to 103 multi‐family units. The lower range represents vacant land development and the upper range represents subdivision of lots that already
Page 230 March 2009
DRAFT Chelan County Shoreline Inventory and Analysis
have a home, or addition of multi‐family dwellings on multi‐family properties where the land value exceeds the building value. Commercial and industrial uses may be expanded on existing underutilized properties or added to vacant properties (Table 65). Also, there are about 7 acres (excluding critical areas) of vacant properties designated for public uses which may be modified along the shoreline.
Table 65. City of Cashmere Shoreline Land Capacity Estimates
Waterbody Net
Acres -
Vacant
Net Acres - Partially
Used/ Underused
Single Family Units
Multi-family Units
Commercial Sq Ft
Industrial Sq Ft
Mission Creek 1 18 76 28 3,310 17,396Wenatchee River 6 7 25 75 27,282 22,452Total 7 26 101 103 30,591 39,848Partially Used Adjustment - - 43 - - -Adjusted Total 7 26 58 103 30,591 39,848Total - Vacant Only 7 0 8 57 8,027 21,391
6.1.6 City of Chelan Future development along Lake Chelan and the Chelan River may add 208 to 466 new dwellings, most of which are single‐family. More commercial development is also possible on those same shorelines in the commercial and tourist‐oriented districts. There is also capacity for industrial development along the Columbia River (Table 66). In addition to the land capacity estimates, there are approximately 41 acres (excluding critical areas) of public lands which may see modification along the shoreline in the future.
Table 66. City of Chelan Shoreline Land Capacity Estimates
DRAFT Chelan County Shoreline Inventory and Analysis
6.1.7 City of Entiat The City of Entiat is expected to see additional growth of all types: single‐family, multi‐family, commercial, and industrial. The land capacity analysis was modified to ensure that the parcels that are part of the waterfront redevelopment plan were accounted for, whether or not they met the initial land capacity analysis screening requirements. Though the City does not designate “public” properties in their zoning districts, some PUD properties shown on the land capacity mapping are excluded in the statistics; there are about 9 acres of PUD property that maybe modified along the shoreline in the future.
The range of potential single‐family dwellings is 44 to 49, though the configuration of current lots, location of dwellings, and availability of utilities may make additional subdivision difficult (Table 67). Multi‐family equals about 40 dwelling units (assumed as part of mixed use on waterfront). Commercial square footage is possible both along the waterfront plan area and in areas designated for Commercial/Light Industrial on vacant properties. Also, some industrial square footage is estimated on Commercial/Light Industrial designated properties that are vacant.
Table 67. City of Entiat Shoreline Land Capacity Estimates
Waterbody Net
Acres - Vacant
Net Acres - Partially
Used/ Underused
Single Family Units
Multifamily Units
Commercial Sq Ft
Industrial Sq Ft
Columbia River 22 9 79 40 133,974 91,406Entiat River 1 4 17 0 0 0Total 22 13 96 40 133,974 91,406Partially Used Adjustment - - 47 - - -
Adjusted Total 22 13 49 40 133,974 91,406Total Vacant Only 22 0 44 40 133,974 91,406
6.1.8 City of Leavenworth Land capacity results show additional single‐family, multi‐family, commercial and industrial is possible along Leavenworth shorelines. In particular, commercial uses are possible along the Wenatchee River. The statistics in Table 68 do not show development on public recreation properties, which total about 116 acres (excluding critical areas). These 116 acres may see modification of parks and recreation facilities, but are not likely to see commercial or residential uses.
Page 232 March 2009
DRAFT Chelan County Shoreline Inventory and Analysis
Table 68. City of Leavenworth Shoreline Land Capacity Estimates
Waterbody Net
Acres -
Vacant
Net Acres - Partially
Used/ Underused
Single Family Units
Multi-family Units
Commercial Sq Ft
Industrial Sq Ft
Chumstick Creek 3 2 3 - - 79,427Alternative Assumptions 3 2 2 - - 79,427Wenatchee River 14 11 14 41 142,795 0Alternative Assumptions 14 10 8 41 140,452 0Total - All 17 13 18 41 142,795 79,427Partially Used Adjustment - - 31 - - -Adjusted Total 17 13 -13 41 142,795 79,427Total - Minus parcel screen 17 12 10 41 140,452 79,427Partially Used Adjustment 31 Adjusted Total - Minus Parcel Screen 17 12 -21 41 140,452 79,427
Total - Vacant Only 17 0 5 15 102,846 48,755
About five additional single‐family residential dwellings may be added along Leavenworth shorelines, as well as 41 multi‐family dwellings. The City of Leavenworth requested a higher parcel screen to exclude residential parcels less than 10,000 square feet from the analysis. A comparison is made, similar to other jurisdictions, to the standard approach of excluding lots less than 2,500 square feet.
Since the single‐family parcels that are considered partially developed have very little area left for second dwellings given various discount factors, there are a negative number of single‐family dwellings shown. It is unlikely that the City will see a reduction in housing. Rather, it is more likely that owners of properties that theoretically could subdivide would not add a second dwelling, and rather that the City would see five additional dwellings on the vacant acres only.
6.1.9 City of Wenatchee The City of Wenatchee and its UGA contain potential for additional mixed use, multi‐family/commercial, and residential and industrial uses. Uses near the waterfront are likely to be the most intense in the County due to greater density and height allowed compared to other communities. However, most new development will occur beyond the 200‐foot shoreline jurisdiction.
Though the City’s plans do not separately designate public lands, and rather include them in the Waterfront Mixed Use district, much of the land in the shoreline jurisdiction consists of PUD and State parkland, as well as BNSF railroad property, and thus the development will be based on the primary function of those properties as recreation and transportation. Table 69 identifies
March 2009 Page 233
DRAFT Chelan County Shoreline Inventory and Analysis
land capacity with and without Waterfront Mixed Use lands. For reference, it also includes an estimate with only a portion of Waterfront Mixed Use lands removed (those removed are public properties per the Ownership map). Estimates partially excluding the Waterfront Mixed Use lands are more likely given that the majority of Waterfront Mixed Use lands in shoreline jurisdiction consist of public or infrastructure uses.
Table 69. City of Wenatchee Shoreline Land Capacity Estimates
Waterbody Net
Acres -
Vacant
Net Acres - Partially
Used/ Underused
Single Family Units
Multifamily Units
Commercial Sq Ft
Industrial Sq Ft
Columbia River 82 26 - 1,200 85,926 910,551Minus Waterfront Mixed Use 42 14 - 82 - 910,551
Wenatchee River 62 68 25 1,844 123,417 639,870Minus Waterfront Mixed Use 31 23 25 238 - 639,870
Total - All 144 94 25 3,044 209,344 1,550,421Partially Used Adjustment - - 7 - - -
Adjusted Total 144 94 18 3,044 209,344 1,550,421Total - Minus Waterfront Mixed Use
72 37 25 320 - 1,550,421
Partially Used Adjustment - - 7 - - -
Adjusted Total - Minus Partial Waterfront Mixed Use
74 46 25 530 16,098 155,0421
Adjusted Total - Minus All Waterfront Mixed Use
72 37 18 320 - 1,550,421
Total - All Zones - Vacant Only 144 - 21 1,753 116,800 1,020,270
Total - Minus Waterfront Mixed Use - Vacant Only
72 - 21 233 - 1,020,270
6.2 Available Economic Studies
This section describes economic or market studies to give context to the land capacity analysis results. Two communities with recent waterfront plans have prepared such studies: Entiat and Wenatchee.
Page 234 March 2009
DRAFT Chelan County Shoreline Inventory and Analysis
6.2.1 City of Entiat Entiat intends to transform a portion of its Columbia River waterfront currently used for mining activity to a mixed use tourist‐oriented center. The area available for development is approximately 19.3 acres. Entiat’s “Waterfront Visioning Process 2008/2009” provides a summary of citizen input, conceptual plans, and environmental and economic information. The visioning report notes
“Currently, Entiat has a very small retail base that does not generate enough tax revenue to balance the cost of growth. The community has identified a desire for a tourist‐commercial waterfront area within the city limits as a means of generating sales and lodging tax revenue while providing both visitors and residents better opportunities for water access.”
Conceptual waterfront plans identify the following potential uses: marina, business and commercial, mixed use condominiums and retail, open space, riparian restoration, multi‐use trail, a new waterfront road, and parking, among other features. The development may be phased over 20 years as a current gravel operation completes extraction and reclamation.
In terms of economic impact, the visioning report identifies the following basis for considering a tourist‐based economic strategy and the potential local economic impact:
• Chelan County is listed as one of six Counties in the State in which more than 10% of jobs are travel generated.
• In 2006, visitors to public campgrounds in Chelan County spent a total of $10.7 million, while visitors that stayed in hotels and motels spent $202.3 million, almost 19 times the amount spent by campers.
• Visitor spending on Food & Beverage Services in Chelan County amounted to $98.3 million in 2006
• A 50 unit hotel and restaurant could provide $56,430.90 tax revenue to Entiat in its first year and $93,783.60 revenue in its second year of operation.
• Based on a comparison of marinas in the City of Lake Chelan, Port of the Dalles, and Port of Hood River, a 60 to 70 slip marina could have slightly better than break‐even potential. Because the goal of offering a marina facility on Lake Entiat is to bring in tourists who will spend money on hotels, restaurants, and shops rather than to be profitable in itself, a 60 to 70 slip size could be effective for the City of Entiat.
March 2009 Page 235
DRAFT Chelan County Shoreline Inventory and Analysis
• It is likely that the City would enter into a public/private partnership with developers who would lease the land designated for marina and take on the costs of permitting, design, land construction in return for a long‐term operational lease of the facility.
Land capacity analysis results for the subject waterfront plan area show the following: 77,000 square feet of additional commercial space and 40 multifamily units. This assumes a 75% commercial and 25% residential split, with residential at 17 dwelling units per acre. This also assumes a shoreline setback of 50 feet for purposes of a conservative estimate.
6.2.2 City of Wenatchee The City has adopted the Wenatchee Waterfront Sub‐area Plan for an area bounded by the Wenatchee River confluence on the north, the Columbia River on the east, pedestrian bridge to the south, and the BNSF Railroad tracks on the west. This plan intends to transform this area from an industrial intensive area to a mixed use district with residential, commercial, and recreation uses. Three major nodes are planned, each with a different emphasis:
• North node: commercial, recreation and residential • Central node: recreation, retail, mixed use • South node: mixed use development building or boating and recreation
activity
An economic analysis (Berk & Associates 2003) projected the following levels of development:
• 1,440 Waterfront dwelling units developed incrementally and geographically spread over the south, central and north ends of the Waterfront;
• 96,000 square feet of new retail development likely consisting of convenience and boutique shopping;
• 155,000 square feet of office space spread between the south and central portions of the Waterfront;
• Other uses that are considered: A family‐oriented restaurant located on the Waterfront at the foot of Orondo; long‐term development of two Waterfront hotel concepts, one catering to conference attendees and the other to tournament‐goers; and indoor sports complex and a water park.
Because the Wenatchee Waterfront Sub‐area Plan is much larger in area than the 200‐foot shoreline jurisdiction area, these development projections are far greater than projected in the shoreline land capacity analysis for shoreline jurisdiction. Additionally, the shoreline jurisdiction largely falls on the PUD and State parkland, as well as BNSF railroad property, and thus the development there
Page 236 March 2009
DRAFT Chelan County Shoreline Inventory and Analysis
will be based on the primary function of those properties as recreation and transportation.
7. PUBLIC ACCESS ANALYSIS Discussions in Chapters 3 and 4 describe existing and planned public access sites. This chapter describes additional opportunities for future public access sites.
7.1 Parks and Recreation Easements
This section describes lands and easements that are dedicated for public use, but which have not been fully improved. The focus is upon fishing easements along the Wenatchee River; however, Public Access maps provided with this report generally identify fishing and recreation areas and constraints throughout the County.
The Trust for Public Land “Wenatchee Watershed Vision: Ideas for Sustaining and Enhancing a Balanced Landscape” describes the current status of fishing easements as follows:
In the 1970s, the Chelan PUD purchased over 30 fishing easements along the Wenatchee River as part of mitigation efforts for Rocky Reach Dam. The fishing easements were transferred to the Washington Department of Fish and Game, now WDFW. The easements are an incredible public asset but have not been adequately mapped in decades and are not currently maintained. Opportunities exist to accurately map the fishing easements, contact relevant landowners, pursue “low‐hanging fruit” easements, and embark on educating the public about fishing‐access opportunities along the Wenatchee River. Several challenges will need to be overcome to make progress on the fishing easement issue. (The Trust for Public Land 2007)
Discussions with WDFW and PUD staff are recommended to sort out the status of the easements, and to collect legal descriptions. Easements likely need to be reviewed and surveyed prior to determining appropriate actions. Actions may include improving access on unused sites, consolidating access points for maintenance purposes, or land surplus, exchanges or purchases, etc. Scattered, small access points with low levels of alteration are preferred by some recreators for certain uses (e.g., fishing), but not others (e.g., RV camping, swim beaches, picnicking, event facilities).
The Wenatchee River fishing easements are identified generally on Public Access maps provided with this report. For purposes of the Shoreline Analysis, additional information has been added to the Public Access maps, showing the areas within shoreline jurisdiction that exceed 15% slope and areas that contain
March 2009 Page 237
DRAFT Chelan County Shoreline Inventory and Analysis
wetlands. These may be constraints to future use of unmaintained fishing easements. Opportunities for additional fishing easements may include the vacant lands that lie along the shoreline, and these are also mapped on the Public Access maps.
A summary of active Wenatchee River fishing access locations and concerns are shown in Table 70. Some of these sites encompass WDFW easements and others do not. The WDFW easements are identified generally on the Public Access maps.
Table 70. Wenatchee River fishing access locations.
Name General Location Comments Braeburn Road
• Near Lake outlet • Downstream of first bridge across
Wenatchee River
• Do not block access to Braeburn Road residents.
• This can also be takeout for Nason Creek.
Cashmere • Downstream of Cotlets Bridge • Cross bridge, then immediately turn
left onto Riverfront Drive • Park on road right-of-way, after
Parkhill Street
• No facilities • Short trail to river
Cashmere Riverfront Park
• Follow signs to Riverside Park located downstream of river, right side of bridge
• Parking, restrooms, changing rooms • Landing on river right, below bridge
Confluence State Park
• Highway 2 exit at Wenatchee interchange; follow State park signs
• Requires short paddle up Columbia River
• Use dock or beach Dryden • Access located on State Fish &
Wildlife property • Below Gorilla Falls, across from
irrigation flume
• Parking and toilet
Glacier View Campground
• Access located in Wenatchee National Forest
• 5.5 miles from south State Park entrance
• Located on opposite side of lake from other sites
• Can be takeout for White River, but shuttle is longer
• Boat launch and picnic fees
Goodwin Bridge
• Road right-of-way above Snow Blind rapid
• Opposite Camino Real Café
• Lift boats over guard rail
Lake Wenatchee State Park
• Use south park entrance • Parking and boat launch fees
Lake Wenatchee – University Beach
• Parking located between YMCA camp and first houses on N Shore Road
• Path leads to N Shore Road, but no signage exists
Page 238 March 2009
DRAFT Chelan County Shoreline Inventory and Analysis
Name General Location Comments Lake Wenatchee – Wenatchee National Forest
• Access located along Forest Service road to lake, after 1211 N Shore Drive
Problems with this Lake Wenatchee Landing Area Access • Access point is on list of land that
Forest Service might sell in future • Gated dirt road is approximately
one-quarter of a mile long and goes down hill
• Lack of parking space Leavenworth • Access located on City property
• East Leavenworth Road, between the bridge and Safeway shopping center
• Continue approximately one-half mile and when road bends left, follow dirt road to right
• No fees for non-commercial use • Large parking area
Peshastin Dryden Dam
• Access located on Department of Transportation and Chelan Public Utility District properties
• Gate was locked in spring 2006 due to neighbor complaints, excessive littering, and damage to WSDOT equipment.
• Reasons for unlocking gate: emergency vehicle access; Ability to put in and run some challenging water
• Future plans: WSDOT says site will be declared surplus in few years
Peshastin State Fish & Wildlife
• River Road • Portable toilet • State Fish and Wildlife parking
permit required • Easy carry to river
Plain • Highway right-of-way at bridge • Bridge on Highway 209, near Plain
• Room to park approximately 4 vehicles
• Upstream, river right • Carry boats to river
Rodeo Hole / Fox Access
• Access located on State Fish & Wildlife property
• Popular access point • Parking and toilet • Watch out for poison oak
Schugart Flat Gravel Pit
• Schugard Flat Road • Caution – check suitability of eddy, especially when cfs is high
Sleepy Hollow Bridge
• Access located on Chelan County property
• River access is left of power pole
• After unloading, return to Lower Sunnyslope Road and park
• This site was only recently made available.
• During summer, toilet available on other side of road
Monitor #1 • Access located on State Fish & Wildlife property
• Cross bridge at town of Monitor, then turn right
Monitor #2 • Access located on State Fish & Wildlife property. Old Monitor Road to dirt road.
• Located just above fish trap
March 2009 Page 239
DRAFT Chelan County Shoreline Inventory and Analysis
Name General Location Comments Tumwater Campground
• Located along Highway 2 in the Wenatchee National Forest
• Located at bridge just south of campground entrance
• Large parking area near bridge • Access upstream of bridge • Access trail to river is steep • Check out eddy before shuttle and
launch Turkey Shoot Road
• Access located on State Fish & Wildlife property
• Turkey Shoot Road. Continue 0.7 miles to access point at end of road
• Toilet • Easy carry to river
Source: Pers. com., Spencer, 2008
7.2 Opportunities for Future Public Access
This section describes opportunities for future public access along shorelines in Chelan County beyond those identified in County and City plans. Opportunities include road/street ends, potential acquisitions based on vacant parcels, and “no owner” parcels, land trust activities, and areas where informal access is occurring now.
7.2.1 Road/Street Ends Road or street ends consist of street segments that are not required for vehicular access and that can potentially provide the public with visual or physical access to a body of water and its shoreline. Table 71 provides a summary of the number and acres of such road/street ends that have been identified along 12 waterbodies. The most are identified along Lake Chelan and along the Wenatchee River. The potential road/street ends are mapped on the series “ROW Analysis.” The maps and data require verification by City public works staffs and citizens.
Peshastin Creek 2 5.50 2 5.50 Wenatchee River 40 5.15 33 4.35 7 0.79 TOTAL 148 32.71 120 28.94 28 3.77
1 Two street ends along the Columbia River appear to lie in the Entiat City limits and are under review for confirmation.
The following examples of street end programs in other jurisdictions may provide management ideas for Chelan County. The City of Seattle, Washington has a “street ends” program applicable to 149 street ends. The program includes a process for improving a shoreline street end for public access and permitting of private uses. Neighbors that petition for development of a street end for public access may assume maintenance. A City resolution includes criteria to be employed in “evaluating the suitability of a street end for public use improvements, and providing that new private use permits will be granted only when there is no active proposal for a public street improvement.” A City ordinance further clarified the intent and process to: “a) keep adjacent property owners from encroaching on the publicʹs shoreline street‐ends; b) encourage people with permitted encroachments to remove them; c) require unpermitted encroachments to be permitted and removed; and d) discourage private use permit applications” (City of Seattle 2008).
The City of Lakewood, Washington is currently addressing street ends around a lake. Initial staff and parks board recommendations identify particular street ends that should be retained as is, improved, leased, or vacated. The process involved two years of efforts by staff and the parks board, including consultation with citizens (City of Lakewood 2008).
An implementation strategy for the SMP could be to further study street ends for purposes of public visual or physical access.
7.2.2 Vacant and “No Owner” Parcels Opportunities for public access and recreation properties may be found by reviewing the location of vacant parcels and parcels with “no owners” according to the Assessor records.
Vacant properties have been layered along with parks and public and protected lands inventories on “Public Access” maps. There are numerous properties without structures along shorelines in all basins and communities. Statistics regarding parcels without buildings are provided in Section 4 for each basin and City/UGA under the heading “Developing or Redeveloping Waterfronts.”
March 2009 Page 241
DRAFT Chelan County Shoreline Inventory and Analysis
“No owner” parcels are identified on inventory maps titled “ROW Analysis.” These are properties for which the Assessor has not identified an owner. Some parcels may be associated with a condominium development (e.g. common open space) and are “under review,” but others appear to be separate full parcels unassociated with other properties. Table 72 summarizes the number of “no owner” parcels along 17 shorelines. The full set of identified parcels requires review and conformation by the County, Cities, and citizens.
Table 72. No Owner” Parcels
Waterbody Total Parcels Total Acres No Owner No Owner, in Review
Count Acres Count Acres Chiwawa River 2 3.73 1 3.05 Columbia River 23 26.22 18 25.57 2 0.21 Dry Lake 1 0.13 1 0.13 Eightmile Creek 2 2.20 2 2.20 Entiat 1 0.52 Entiat River 4 10.48 4 10.48 Fish Lake 1 0.63 1 0.63 Icicle Creek 16 6.21 2 5.00 Lake Chelan 25 11.12 21 4.19 3 6.71 Lake Chelan: City Data 23 10.41 Mad River 5 1.92 2 0.87 Mission Creek 11 1.40 2 0.65 9 0.76 Nason Creek 3 5.93 2 5.75 Peshastin Creek 4 10.76 4 10.76 Roses Lake 2 0.49 1 0.26 Stehekin River 1 1.14 1 1.14 Wenatchee Lake 11 2.47 1 0.63 Wenatchee River 46 30.68 17 26.35 4 1.08 Total 181 126.43 80 98 18 9
7.2.3 Land Trusts Two land trusts are particularly active in Chelan County: The Chelan‐Douglas Land Trust and The Trust for Public Land. Both trusts have active programs for land stewardship and open space acquisition in and around Chelan County. Trust planning, stewardship and land acquisitions may help local governments and citizens to further public access goals and prioritize efforts. Recent programs are described below.
Chelan-Douglas Land Trust
The Chelan‐Douglas Land Trust has a mission: “Conserving our land, our water, and our way of life through voluntary land agreements, education, partnerships, stewardship, and well planned growth.” The Trust’s projects along shorelines include, but are not limited to:
Page 242 March 2009
DRAFT Chelan County Shoreline Inventory and Analysis
• White River: Working with private landowners, federal and State agencies and Chelan County to permanently protect the natural functions and scenic qualities of the White River watershed.
• Entiat River Valley: Actively involved in efforts to protect fish habitat, wildlife habitat, and floodplain function along the ʺStillwatersʺ reach of the Entiat River.
• Icicle Valley: Acquisitions near Mountain Home Road. • Wenatchee Valley Trail: Active planning with grant funding. (Chelan‐
Douglas Land Trust 2008 a, b)
The Trust for Public Land
The Trust for Public Land is a national non‐profit organization, with a mission to conserve “land for people to enjoy as parks, community gardens, historic sites, rural lands, and other natural places, ensuring livable communities for generations to come.” The Trust has been actively involved in land management strategies including the “Stemilt‐Squilchuck Community Vision and Conceptual Plan” and “Wenatchee Watershed Vision: Ideas for Sustaining and Enhancing a Balanced Landscape.”
The “Stemilt‐Squilchuck Community Vision” includes a conceptual plan identifying areas in use for agricultural activities as well as areas that are suitable or should be managed as snow retention areas, primary wildlife and habitat areas, secondary wildlife and habitat areas, recreational resources, and water storage priority. The areas identified as suitable for recreation may be opportunity areas to purchase or conserve for public access.
The “Wenatchee Watershed Vision” provides a plan for “critical mass of orchards, compact urban development, biodiversity conservation, migration corridor protection, and safe recreational corridors and connections.” Biodiversity conservation and migration corridor protection is shown along the major shorelines in the basin. Recreation corridors are designated along Icicle Creek, Peshastin Creek, Mission Creek, and the Wenatchee River. Additionally, the plan identifies areas with significant mass for agriculture running along the Wenatchee River valley, and compact development in current urban areas and towns. This plan is likewise useful as a guide to potential priorities for parks and recreation plans and acquisition.
7.2.4 Public Utility District No. 1 of Chelan County Section 3.7 describes parks and recreation facilities across the County. One key provider along shorelines in Chelan County is the Public Utility District (PUD). The PUD maintains 10 facilities and 467 acres, including, but not limited to, Entiat Park, Chelan Falls Park, Chelan Riverwalk Park, Manson Bay Park, Walla Walla Point Park, Washington Confluence State Park, and others.
March 2009 Page 243
DRAFT Chelan County Shoreline Inventory and Analysis
The PUD has also worked with local communities in the Wenatchee River valley to plan for parks and recreation areas. In March 2003, the Upper Valley Plan for the Wenatchee River was completed to develop an interpretive program focusing on sites exhibiting the natural and cultural resources of the Wenatchee River Upper Valley. The sites are located in Leavenworth, Peshastin, Dryden, Cashmere, and Monitor. The plan was not formally adopted, but serves as a guide to identify interpretive sites, river access points, and habitat enhancement, as well as promoting tourism. The PUD worked with property owners, stakeholders, government agencies, and others. The process involved identifying opportunity sites, and analyzing and ranking them for further concept development. The five sites selected for concept development included:
• Leavenworth Fish Hatchery – Owned by the U.S. Fish and Wildlife Service, the site is described as suitable for passive recreation, interpretation, and habitat enhancement.
• Peshastin Log Deck – Owned by the Port Authority of Chelan County, the opportunities included relationship to the Port’s development plans, passive recreation, interpretation, with a potential trail link to Leavenworth on an old rail bed.
• Dryden Beaver Pond – Habitat enhancement, environmental education, passive recreation, site protection, and local community use are proposed features on the Washington Department of Fish and Wildlife property.
• Cashmere Museum – Key features for the Chelan County Historical Museum‐owned property include reinforcing existing and proposed interpretive displays, adding signs, trails, and an interpretive orchard at the entry.
• Monitor Eagle Overlook – This private property is described as a suitable passive recreation site with an interpretive kiosk, viewpoint, and interpretive signs, as well as bird, river, and valley viewing opportunities.
Concept plans are included in the Upper Valley Plan for the Wenatchee River and provide more detail (J.T. Atkins & Company PC and J.A. Brennan and Associates PLLC, March 2003).
7.2.5 Informal Public Access At shoreline visioning workshops, several citizens identified informal or private access points, such as: KOA campground at Leavenworth, an informal boat launch down river of Cashmere, the mouth of the Entiat River, and “Three Fingers” in Lake Chelan. There are likely many more informal access points. Planning for more public access points in high use areas can reduce pressure at other crowded public access points and avoid trespass of private properties.
Page 244 March 2009
DRAFT Chelan County Shoreline Inventory and Analysis
8. DATA GAPS Information was not located for the following parameters:
• Geohazard mapping for Cities of Cashmere, Entiat, and Leavenworth • Sewer system mapping for City of Entiat • Mapping of aquifer recharge areas • Channel migration zone mapping for areas outside of the Wenatchee
CMZ study (NHC 2003), the Stehekin River CMZ study (Riedel 2008), and the Entiat River CMZ study (Bureau of Reclamation 2009).
• Mapping of groundwater movement patterns – this is not a required element, but may be useful in future analysis and development siting efforts.
• Shoreline armoring mapping.
Although information about each of the above items might help develop a fuller picture of shoreline conditions and processes, it is not expected that the absence of these items would have significant impacts on the selection of environment designations or the development of the SMP. The presence/absence in shoreline jurisdiction of other environmental conditions for which data is available is expected to be more relevant to decision making.
March 2009 Page 245
DRAFT Chelan County Shoreline Inventory and Analysis
9. REPORT REFERENCES AND BIBLIOGRAPHY
(Note: Many of the references listed below may not be directly utilized in the preceding chapters, but may be sources for the map folio)
Aerial Photography
Washington Department of Ecology. 36” and 18” orthophotos.
Multi-Topic General Reference Materials/GIS Sources
Andonaegui, C. 2001. Trout Habitat Limiting Factors for the Wenatchee Subbasin (Water Resource Inventory Area 45) and Portions of WRIA 40 within Chelan County (Squilchuck, Stemilt and Colockum drainages). Final Report. November 2001. http://www.scc.wa.gov/index.php/265‐WRIA‐45‐40‐partial‐Wenatchee‐Subbasin/View‐category.html
Chelan County. 1975. Shoreline Master Program. Prepared for Chelan County Regional Planning Council. April 22, 1975.
Chelan County Conservation District. 1998. Entiat River Inventory and Analysis. Prepared for the Entiat WRIA Planning Unit. January 1998.
Chelan County Conservation District. 2004. Entiat Water Resource Inventory Area (WRIA 46) Management Plan. Prepared for the Entiat WRIA Planning Unit. October 2004. http://www.cascadiacd.org/index.php?page_id=255
Chelan County Conservation District. 2006. Detailed Implementation Plan, Entiat Water Resource Inventory Area (WRIA 46). Prepared for the Entiat WRIA Planning Unit. February 2006.
Chelan County PUD. 2000. Shoreline Erosion Control Study Plan. Final Report. January 15, 2000. http://www.chelanpud.org/rr_relicense/study/plans/1764_2.pdf
Chelan County and City of Chelan. 2008. Preliminary Draft – Lake Chelan Strategic Plan. Prepared for the Lower Lake Chelan Basin. October 2008.
City of Leavenworth Community Development Department. 2007. Draft Leavenworth Downtown Master Plan. September 2007.
GeoEngineers, Inc. 2007. Habitat Farming Enterprise Program: Conceptual Riparian and Aquatic Habitat Restoration Plan – Sanray Orchards, Entiat River Valley, Chelan
DRAFT Chelan County Shoreline Inventory and Analysis
County, WA. Prepared for Initiative for Rural Innovation and Stewardship (IRIS). June 2007.
Healthy Lands Initiative. Institute for Rural Innovation and Stewardship (IRIS). 2007.
Laura Berg Consulting, et al. 2004a. Entiat Subbasin Plan. Prepared for the Northwest Power and Conservation Council. May 2004. http://www.nwppc.org/fw/subbasinplanning/entiat/plan/EntirePlan.pdf
Laura Berg Consulting, et al. 2004b. Wenatchee Subbasin Plan. Prepared for the Northwest Power and Conservation Council. May 2004. http://www.nwppc.org/fw/subbasinplanning/wenatchee/plan/WenatcheePlan_screen.pdf
Laura Berg Consulting. 2004c. Lake Chelan Subbasin Plan. Prepared for the Northwest Power and Conservation Council. May 2004. http://www.nwppc.org/fw/subbasinplanning/lakechelan/plan/EntirePlan.pdf
Laura Berg Consulting, et al. 2004d. Upper Middle Mainstem Subbasin Plan. Prepared for the Northwest Power and Conservation Council. May 2004. http://www.nwcouncil.org/fw/subbasinplanning/uppermidcolumbia/plan/
RH2 Engineering, Inc. 2007. WRIA 40A Watershed Plan. Prepared for WRIA 40A – Squilchuck/Stemilt Planning Unit. May 2007.
The Trust for Public Land. 2007. Wenatchee Watershed Vision: Ideas for Sustaining and Enhancing a Balanced Landscape. September 2007. http://www.tpl.org/content_documents/wa_WenatcheeWatershedVision_FullReport.pdf
UCRTT [Upper Columbia Regional Technical Team]. 2007. A Biological Strategy to Protect and Restore Salmon Habitat in the Upper Columbia Region, A Report to the Upper Columbia River Salmon Recovery Board. Available from the Upper Columbia Salmon Recovery Board, Chelan, Washington.
USDA Forest Service. 1990. Land and Resource Management Plan ‐ Wenatchee National Forest.
USDA Forest Service. Mt. Baker‐Snoqualmie National Forest GIS data. http://www.fs.fed.us/r6/mbs/maps/gis.shtml
USDA Forest Service. Wenatchee National Forest GIS data. http://www.fs.fed.us/r6/data‐library/gis/wenatchee/index.shtml
USDI Bureau of Land Management. GIS data. http://www.blm.gov/or/gis/data.php
March 2009 Page 247
DRAFT Chelan County Shoreline Inventory and Analysis
USDI Bureau of Land Management. 2008. Nason Creek Tributary Assessment, Chelan County, Washington. 123 pp.
Wenatchee Watershed Planning Unit and Chelan County Natural Resources. 2003. Wenatchee River Basin Watershed Assessment. August 2003. http://www.co.chelan.wa.us/nr/data/watershed_assessment/chaps_1_2_3_jan.pdf
Wenatchee Watershed Planning Unit. 2006. Wenatchee Watershed Management Plan. April 2006. http://www.co.chelan.wa.us/nr/nr_watershed_plan.htm
Chelan County Emergency Management Council. 2006. Chelan County Multi‐Jurisdiction Natural Hazard Mitigation Plan. Breaking the Disaster Cycle: Planning for a Disaster‐Resistant Chelan County. http://www.chelandem.org/documents/Chelan%20County%20Hazard%20Plan%20_Final%20Draft_%200630041.pdf
Washington Department of Natural Resources. GIS data.
Critical Aquifer Recharge Areas
No mapping available.
Fish and Wildlife Habitat/Priority Species
Hillman, T.W. and A.E. Giorgi. 2000. Historical occurrence of anadromous salmonids in Lake Chelan, Washington. Prepared for Chelan County Public Utility District.
Washington State Conservation Commission. 2001. Salmon, Steelhead, and Bull Trout Habitat Limiting Factors for the Wenatchee Subbasin (Water Resource Inventory Area 45) and Portions of WRIA 40 within Chelan County (Squilchuck, Stemilt and
Page 248 March 2009
DRAFT Chelan County Shoreline Inventory and Analysis
Colockum drainages. Final Report. November 2001. http://salmon.scc.wa.gov/reports/wria40_45.pdf
Washington Department of Fish and Wildlife. 2008. Priority Habitats and Species database.
Toxic or Hazardous Material Clean-Up Sites
Washington Department of Ecology. Toxics Cleanup website. http://www.ecy.wa.gov/programs/tcp/sites/sites_information.html
Washington Department of Ecology. Hazardous Sites List. February 2008. http://www.ecy.wa.gov/pubs/0809043.pdf
Land Use
Chelan County GIS.
Chelan County. 2000. Chelan County Comprehensive Plan. Last amended 12 April 2007.
Chelan County. 2007. Comprehensive Parks and Recreation Plan. October.
Chelan County. 2008. Peshastin Urban Growth Area Comprehensive Plan. October.
City of Cashmere. GIS data.
City of Cashmere. January 14, 2008. Comprehensive Land Use Plan. Ordinance 1117.
City of Cashmere. 2008. Draft Parks and Recreation Comprehensive Plan 2009‐15. October.
City of Chelan Zoning Code.
City of Chelan. 2007. City of Chelan Comprehensive Plan 2007
City of Chelan. GIS data.
City of Entiat. GIS data.
City of Entiat. 2007. City of Entiat Comprehensive Plan.
City of Entiat. 2008. City of Entiat Waterfront Visioning Process 2008/2009. October.
City of Leavenworth Critical Areas Code. Chapter 16.08.
City of Leavenworth. 2007. Leavenworth Downtown Master Plan.
March 2009 Page 249
DRAFT Chelan County Shoreline Inventory and Analysis
City of Leavenworth. GIS data.
City of Leavenworth. 2003. City of Leavenworth Comprehensive Plan. August 12, 2003.
City of Wenatchee and Chelan County Public Utility District. 2003. Wenatchee Waterfront Sub‐Area Plan.
City of Wenatchee. 2007. Planning to Blossom 2025: Wenatchee Urban Area Comprehensive Plan.
City of Wenatchee. GIS data.
Malaga Community Council. 2006. Malaga Vision Plan.
Pacific Appraisal Associates, PLLC. 2007. Summary Appraisal of Cedarbrook Property, 5455 Sunset Highway, Cashmere, WA. April 5, 2007.
SMD Solutions. 2009. Lord Acres Subarea Plan. Prepared for City of Chelan. January 2009.
Studio Cascade. 2008. Draft Manson Subarea Plan. March.
The Trust for Public Land, The Stemilt Partnership, and Core GIS. 2008. Stemilt‐Squilchuck Community Vision. September.
U.S. Forest Service. GIS data.
United States Department of Agriculture. GIS data.
Washington State Community Economic Revitalization Board and Port of Chelan County. 2008. Final Contract, Economic Feasibility Study Grant/Site Pre‐Development Planning Grant. June 4, 2008.
Washington State Department of Transportation GeoData Distribution Catalog. http://www.wsdot.wa.gov/mapsdata/geodatacatalog/default.htm
Stormwater/Wastewater Utilities
Chelan County GIS.
Chelan County. 2000. Chelan County Comprehensive Plan.
Chelan County PUD. GIS data.
Page 250 March 2009
DRAFT Chelan County Shoreline Inventory and Analysis
City of Wenatchee. Wenatchee Valley Stormwater Technical Advisory Committee. City of Wenatchee website. http://www.wenatcheewa.gov/Index.aspx?page=319
City of Wenatchee. Stormwater Utility. City of Wenatchee website. http://www.wenatcheewa.gov/Index.aspx?page=318
Maul Foster Alongi. 2008. Lake Chelan Strategic Action Plan – Preliminary Draft.
Washington State Department of Health, Division of Environmental Health. List of LOSS (Large On‐site Sewage Systems) with approximate locations
Wenatchee Valley Stormwater Technical Advisory Committee. 2008. Wenatchee Valley Stormwater Management Program. May 2008.
Floodplains and Channel Migration Zones
Bureau of Reclamation. 2009a. Entiat Tributary Assessment. January 2009. Prepared by Technical Service Center, Sedimentation and River Hydraulics Group (M/S 86‐68240), Denver, CO in cooperation with Pacific Northwest Regional Office, Boise, ID and Wenatchee‐Entiat Field Station, Wenatchee, WA.
Chelan County GIS.
Chelan County Emergency Management Council. 2006. Chelan County Multi‐Jurisdiction Natural Hazard Mitigation Plan. Breaking the Disaster Cycle: Planning for a Disaster‐Resistant Chelan County. http://www.chelandem.org/documents/Chelan%20County%20Hazard%20Plan%20_Final%20Draft_%200630041.pdf
Jones & Stokes. 2004. Chelan County Natural Resource Program, Final Wenatchee River Channel Migration Zone Study ‐ Phase II. April 16. (J&S 01243.01) Bellevue, WA. Prepared for the Chelan County Natural Resource Program, Wenatchee, WA.
nhc (Northwest Hydraulic Consultants). 2003. Wenatchee River Channel Migration Zone Study. Draft Technical Memorandum. Tukwila, WA.
Riedel, J. 2008. Stehekin River Information Base, Lake Chelan National Recreation Area, White Paper #1 – Stehekin River Corridor Implementation Plan. National Park Service.
Historical or Archaeological Sites
Washington Department of Archaeology & Historic Preservation. http://www.dahp.wa.gov/pages/wisaardIntro.htm
March 2009 Page 251
DRAFT Chelan County Shoreline Inventory and Analysis
Website of the Confederated Tribes of the Colville Reservation http://www.colvilletribes.com/
Website of the Confederated Tribes and Bands of the Yakama Nation. http://www.critfc.org/text/yakama.html
Transportation
Chelan County GIS.
Chelan County. 2000. Chelan County Comprehensive Plan.
Chelan County. Six‐Year Transportation Improvement Program 2007‐2012.
Washington State Department of Transportation GeoData Distribution Catalog. http://www.wsdot.wa.gov/mapsdata/geodatacatalog/default.htm
Wenatchee Valley Transportation Council and North Central Regional Transportation Planning Organization. 2007. 2008‐2013 North Central Washington Regional Transportation Improvement Program
Impervious Surfaces
Chelan County GIS.
Shoreline Modifications
Riedel, J. 2008. Stehekin River Information Base, Lake Chelan National Recreation Area, White Paper #1 – Stehekin River Corridor Implementation Plan. National Park Service.
Washington Department of Natural Resources GIS data (overwater structures). 2007 interpretation of 2002‐2006 aerial photographs.
Soils
Web Soil Survey, United States Department of Agriculture, Natural Resources Conservation Service.
Vegetation
Johnson, D.H. and T. O’Neil, eds. 2001. Wildlife‐Habitat Relationships in Oregon and Washington. Oregon State University Press, Corvallis, OR. 768 pp.
Franklin, J. F. and C.T. Dyrness. 1988. Natural vegetation of Oregon and Washington. Corvallis, OR: Oregon State University Press.
Page 252 March 2009
DRAFT Chelan County Shoreline Inventory and Analysis
Parks/Existing and Potential Public Access Sites
Chelan County GIS.
Chelan County PUD. Website. http://www.chelanpud.org/parks.html
Chelan Douglas Land Trust GIS data.
Chelan‐Douglas Land Trust. 2008a. Personal Communication, Sharon Lunz, Communications & Outreach Director, regarding trust active projects. December 20.
Chelan‐Douglas Land Trust. 2008b. http://www.cdlandtrust.org/index.html. Accessed December 20, 2008
City of Cashmere. GIS data.
City of Chelan Parks and Recreation Department. 2007. City of Chelan Parks and Recreation Comprehensive Plan. July 26, 2007.
City of Chelan. GIS data.
City of Entiat. GIS data.
City of Entiat. March 25, 2008. Working Draft Parks, Recreation, and Open Space Plan 2008/2009
City of Lakewood. 2008. http://www.cityoflakewood.us/news‐and‐events/466‐lakefront‐street‐ends‐update.html. Accessed December 20, 2008.
City of Leavenworth. April 1997. Park and Recreation Comprehensive Plan.
City of Leavenworth. GIS data.
City of Seattle. 2008. http://www.seattle.gov/Transportation/stuse_stends.htm. Accessed December 20, 2008.
City of Wenatchee. GIS data.
City of Wenatchee. 2006. Parks, Recreation & Open Space Plan.
JAO Planning & Project Management. Chelan Valley Comprehensive Trails Plan. Prepared for the Lake Chelan Recreation Association. East Wenatchee, WA. http://www.parks.wa.gov/plans/lkchelan25milecrk/Chelan%20Valley%20Comprehensive%20Trails%20Plan.pdf
March 2009 Page 253
DRAFT Chelan County Shoreline Inventory and Analysis
JAO Planning and Project Management. 1996. Lake Chelan Valley Public Trails Comprehensive Plan. Prepared for Lake Chelan Recreation Association. March 13, 1996.
J.T. Atkins & Company and J.A. Brennan and Associates PLLC. 2003. Upper Valley Plan. Prepared for Public Utility District No. 1 of Chelan County. March.
Landerman‐Moore Associates and Robert W. Droll. 1997. City of Leavenworth Park & Recreation Comprehensive Plan. Leavenworth, WA. April 1997.
Silverline Projects, Inc. 2000. Lakeside Trail Feasibility Study. Prepared for City of Chelan. September 28, 2000.
Spencer, Dick and Kathy. 2008. Personal communication to Mike Kaputa, Director, Department of Natural Resources, Chelan County, regarding Wenatchee River fishing access, July 18, 2008.
Washington State Parks. Lake Chelan and Twenty‐Five Mile Creek State Parks planning projects: http://www.parks.wa.gov/plans/lkchelan25milecrk/ (Multiple documents, current project)
Washington State Parks. Lake Wenatchee planning projects: http://www.parks.wa.gov/plans/lkwen/ (Multiple documents, current project)
Washington State Parks. Wenatchee Area State Parks planning projects, including Wenatchee Confluence State Park: http://www.parks.wa.gov/plans/wenatchee/ (Multiple documents, current project)
Opportunity Areas
See watershed and sub‐basin plans.
EcoA.I.M. 2006. Wenatchee Subbasin Riparian Assessment – Draft. Prepared for Chelan County Department of Natural Resources.
Washington Department of Fish and Wildlife. 2006. Diversion Screening and Fish Passage Inventory Report for Colockum Creek, Stemilt Creek and Squilchuck Creek. http://wdfw.wa.gov/hab/tapps/reports/wria40paper.pdf
Water Quality
Washington Department of Ecology. 2004. 303(d) list. http://www.ecy.wa.gov/programs/wq/303d/2002/2002‐index.html
Washington Department of Ecology. 1997. Water quality assessments of selected lakes within Washington State – 1994. Publication No. 97‐307.
Page 254 March 2009
DRAFT Chelan County Shoreline Inventory and Analysis
Washington Department of Ecology. 2002. Water Quality Assessments of Volunteer‐Monitored Lakes Within Washington State, 1998‐1999. Publication No. 02‐03‐019.
Washington Department of Ecology. TMDL activity website. http://www.ecy.wa.gov/programs/wq/tmdl/TMDLsbyWria/TMDLbyWria.html
See watershed and sub‐basin plans.
See numerous other water quality references at: http://www.ecy.wa.gov/biblio/wria45.html http://www.ecy.wa.gov/biblio/wria46.html http://www.ecy.wa.gov/apps/watersheds/wriapages/47.html http://www.ecy.wa.gov/biblio/wria40.html
March 2009 Page 255
DRAFT Chelan County Shoreline Inventory and Analysis
10. LIST OF ACRONYMS AND ABBREVIATIONS CAO ............................. Critical Areas Ordinance cfs ................................. cubic feet per second CMZ ............................. channel migration zone Corps ........................... U.S. Army Corps of Engineers DPS .............................. Distinct Population Segment Ecology ........................ Washington Department of Ecology ESA .............................. Endangered Species Act ESU .............................. Evolutionarily Significant Unit FEMA .......................... Federal Emergency Management Agency FERC ............................ Federal Energy Regulatory Commission FIRM ............................ Flood Insurance Rate Map FWHCA ...................... Fish and Wildlife Habitat Conservation Area GIS ............................... Geographic information systems GMA ............................ Growth Management Act HFEP ............................ Habitat Farming Enterprise Program HPA ............................. Hydraulic Project Approval ICEBMP ....................... Interior Columbia Basin Ecosystem Management Project IRIS .............................. Initiative for Rural Innovation and Stewardship LCRD ........................... Lake Chelan Reclamation District LOSS ............................ large on‐site sewage systems LWD ............................ large woody debris MPO ............................. Metropolitan Planning Organization MS4s ............................ Small Municipal Separate Storm Sewers NCRTPO ..................... North Central Regional Transportation Planning Organization NCW RTIP .................. North Central Washington Regional Transportation Improvement
Program NOAA Fisheries ......... National Marine Fisheries Service NLCD .......................... National Land Cover Data NPDES ......................... National Pollutant Discharge Elimination System NRCS ........................... Natural Resources Conservation Service NWI ............................. National Wetlands Inventory OHW/M ...................... ordinary high water/mark PCBs ............................. Polychlorinated biphenyls PHS .............................. Priority Habitats and Species PUD ............................. Public Utility District RCW ............................ Revised Code of Washington RGP .............................. Regional General Permit SDP .............................. Shoreline Substantial Development Permit SEPA ............................ State Environmental Policy Act SCUP ........................... Shoreline Conditional Use Permit
Page 256 March 2009
DRAFT Chelan County Shoreline Inventory and Analysis
March 2009 Page 257
SMA ............................. Shoreline Management Act SMP .............................. Shoreline Master Program SSURGO ...................... Soil Survey Geographic Database SWS .............................. Shoreline Works and Structures TMDL .......................... total maximum daily load UGA ............................. Urban Growth Area USFS ............................ United States Forest Service USFWS ........................ U.S. Fish and Wildlife Service USGS ............................ United States Geological Survey WAC ............................ Washington Administrative Code WCC ............................ Wenatchee City Code WDFW ......................... Washington Department of Fish and Wildlife WDNR ......................... Washington Department of Natural Resources WRIA ........................... Watershed Resource Inventory Area WVSTAC ..................... Wenatchee Valley Stormwater Technical Advisory Committee WVTC .......................... Wenatchee Valley Transportation Council
DRAFT Chelan County Shoreline Inventory and Analysis
March 2009 Appendix A
Appendix A: Complete Ecological Function Score Results
DRAFT Chelan County Shoreline Inventory and Analysis
March 2009 Appendix B
Appendix B: Land Capacity Analysis Assumptions
DRAFT Chelan County Shoreline Inventory and Analysis
No. Step Proposed Assumption Chelan County Residential LCA
City of Cashmere Comp Plan LUE
City of Chelan Residential LCA
City of Entiat Residential LCA
City of Leavenworth Residential LCA
City of Wenatchee Comp Plan LUE
Geography/ Time Period 1. Base point in time 2008 (Use SMP Inventory Assessor
data date as baseline) Undated. Included in 2007 plan. New analysis in 2008 for Peshastin UGA.
2008 2007 2007 2003 2007 plan (2005 UGA boundaries)
2. Study area boundaries Parcels fully within or intersecting shoreline jurisdiction. Look at whole parcel – not just 200 foot jurisdictional area by water body (determined by WRIA, and cities).
City and UGA City and UGA City and UGA City and UGA City and UGA
Gross Developable Land Inventory
Include public and private lands that meet criteria since all lands may have shoreline uses. Can discount or remove public/reserved lands after Step 11 as needed.
3. Developable Land: Vacant
Assessor Building Value = $0; Remove lots less than 2,499 s.f.
Vacant land and orchards Recommend: 2,499 instead of 2,500 to capture 25 x 100 cabin lots
Available land (not defined)
Vacant land and orchards
Vacant land and orchards
Vacant, non-governmental land Recommend: 10,000 or 20,000 s.f. (Note: for conservative estimate kept smaller screen. Can alter market factor if needed in Leavenworth.)
Vacant land in low density residential district, waterfront and Sunnyslope
4. Developable Land: Partially Used
Single Family. Parcel is 2 times the minimum allowed by zoning. (Note: more conservative; may capture some ADU trend.)
Not addressed Recommend: method to account for ADUs
Available land (not defined)
Not addressed Not addressed Residentially used parcels greater than 1 acres Recommend: 2 times instead of 3.
Not addressed
5. Developable Land: Under-Utilized
Multifamily, commercial, industrial designated parcels occupied by single family uses. Also, multifamily, commercial, industrial parcels where the ratio of improvement value to land value is <1.0.
Not addressed Available land (not defined)
Not addressed in supply (see below in deductions)
Not addressed in supply (see below in deductions)
Not addressed Recommend: removing small CC zone lots with 60% lot coverage. (Note: can remove CC zone property after #11 if needed)
Not addressed
Deduct Critical Areas 6. Wetlands Deduct actual wetlands acres using
SMP inventory maps. Comp. Plan: Not deducted. Peshastin: Flat 5%.
Not deducted Not deducted Not deducted Part of 15% flat deduction Recommend: deduct actual wetland acres
Not deducted
7. Streams/lakes Deduct streams and lakes based on ordinary high water mark.
Not deducted Not deducted Part of 15% flat deduction Recommend: Deduct floodways
Not deducted
10. Critical Area Buffers Rural: Assume an average buffer of 125 feet for wetlands and 150 feet for Type S or F streams/lakes. UGAs: Assume average 75 feet for wetlands; 100 feet for Type F streams/lakes, and 50 feet for Type S.
Not deducted Consider: Distinguishing larger wetlands. (Note: Due to limits of wetlands inventory data and variations in actual quality recommend continuing with average.)
Not deducted Not deducted Not deducted Not deducted Recommend: Riparian buffers are 25’ in current regulations. Assumed: Average buffers at left. Critical areas regulations likely to change in 2009.
Unclear
11. Determine developable acres by planned land use category
Sum developable acres (vacant, partially used, and underutilized with critical area deductions) by planned land use category. Use each jurisdiction’s planned land use categories.
Adopted land use categories in Comprehensive Plan
Deduct Future Infrastructure and Public Uses
12. Rights of Way and Other Development Requirements
Percentage reduction; vary by community.
Comp. Plan: 15% Peshastin: 30% Recommend: 20%
20% for future roads and utilities
15% 25% for future roads and utilities
20% for future roads and utilities Recommend: 5%
Unclear Assumed: 5% based on city input to recognize waterfront plan
13. Schools, police/fire stations, water, sewer, recreation/ open space, and similar.
Percentage reduction based on lands for public purposes. Vary by community.
Comp. Plan: 7% Peshastin: 0% (see above) Recommend: 0% (combine with above)
Part of roads/utilities 7% 10% Part of roads/utilities Recommend: 0% if deducting public lands (Note: can remove from consideration after Step 11 if needed)
Unclear Assumed: 0% based on city input to recognize waterfront plan
factor and 15% for lands unavailable. Peshastin Sub-area: 20% flat market factor. Also assumed 40% of vacant would not develop. Recommend 20-25% Assumed: 20%
Comp. Plan: 15% Recommend: 25% due to water supply
25% (market/safety factor)
25% Recommend: reduced market factor MDR and HDR lands due to marina development.
15% Use GIS data
Comp. Plan: 25% Recommended: 5 or 10% Assumed: 5% based on city input to recognize waterfront plan
15. Partially Used and Under-Utilized
UGAs: Use Plan assumption for each community, or where not included, 25% for land not likely to develop in next 20 years. Rural: 50% Agriculture and forestry lands treated as partially used/under-utilized
Comp. Plan: Not addressed Peshastin: Agricultural lands 25%
Comp. Plan: Not addressed Recommend: 25% due to water supply
30% - single family 20% multifamily 50% Tourist Accommodations and Special Use District (Unavailable/ Underutilized Land factor – percent not used for residential purposes)
Orchards - 40% remain in production. 50% of multifamily land will convert to highest density, (rest currently subdivided at single-family densities) Tourist Recreational Development, 25% e in
Not addressed 25%
Unclear Assumed: 10% - based on city input to recognize waterfront plan
Page B-2 March 2009
DRAFT Chelan County Shoreline Inventory and Analysis
March 2009 Page B-3
No. Step Proposed Assumption Chelan County Residential LCA
City of Cashmere Comp Plan LUE
City of Chelan Residential LCA
City of Entiat Residential LCA
City of Leavenworth Residential LCA
City of Wenatchee Comp Plan LUE
an open space use Determine Population Capacity 16. Mixed Use Development
Share Vary by local plan. If not addressed, assume 50/50 share of development will be residential or commercial.
Comp. Plan: Not addressed Peshastin: Assume 10% of commercial or mixed use will include residential dwellings.
Not addressed See underutilized/ unavailable factor
See underutilized/ unavailable factor
Not addressed 50/50
Comp. Plan: Unclear Waterfront Plan: Use economic study. Assumed 85%/15% residential/ commercial split based on report.
17. Determine Total Dwelling Units Capacity By Zone
Multiply net acres of developable land in each zone by assumed density of each zone to determine total dwelling units of capacity. Subtract existing dwelling units.
Comp. Plan: Unincorporated UGAs 4 units per acre Peshastin: LDR 4, MDR 8; HDR 16 Proposed: Urban per above. Rural areas – base on zoning.
Single Family 6 units/acre Suburban Residential Average 3/acre Multi Family 15 units/acre
Single Family 3 du/ac Multi-family 9 du/ac Tourist Accommodations 3 du/ac Special Use District 3 du/ac
Single Family: Up to 4 units per acre Multi Family: Up to 10 units per acre Mixed Tourist Recreational: Up to 4 units per acre Current analysis: Assuming 25% unbuildable and 17 du/ac for High Density
Goal is average 4.6 du/ac and average lot size of 9,400 s.f.
Comp Plan: 6.22 housing units (h.u.) per net acre from the low-density residential district Proposed: Waterfront Plan and Comprehensive Plan.
Determine Employment Capacity
18. Determine Total Square Footage Capacity By Zone
Vary by community if there is information. Otherwise, multiply net acres of commercial and industrial developable land by the assumed floor area ratio. Commercial = FAR of 0.25 Industrial = FAR of 0.4 Subtract existing building square footage on partially used and under-utilized land.
No employment land capacity conducted Recommended: Review Transportation Plan assumptions for commercial and industrial growth
No employment land capacity conducted
No employment land capacity conducted
No employment land capacity conducted
No employment land capacity conducted
Comp. Plan: No employment land capacity conducted Waterfront Plan: Market demand prepared. Used proposed assumption due to lack of FAR information.
DRAFT Chelan County Shoreline Inventory and Analysis
March 2009 Appendix C
Appendix C: Zoning Standards Summary
DRAFT Chelan County Shoreline Inventory and Analysis
Chelan County: Zoning Standards Summary.
Zone Primary Land Uses Minimum Lot Size (acres or sq ft.)
Maximum Building Height (ft.)
Standard Minimum Setbacks (ft.)
Maximum Building Coverage (%)
Commercial Agricultural Lands
Agriculture Single Family Residential
10 acres. Cluster subdivisions may have reduced minimum lot sizes. 35 ft., except for barns and similar agricultural buildings shall not exceed 50 ft. in height.
Front: 25 ft. from front property line or 55 ft. from the street centerline, whichever is greater. Side: 10 ft. Street side yard same as front. Rear: 20 ft. Dwelling Setbacks from agriculture: 100 ft. from property line including road width, with minimum 80 ft. from centerline or 50 ft. from front property line, whichever is greater.
35%
Commercial Forest Lands
Forestry Agriculture Single Family Residential
20 acres. Cluster subdivisions may have reduced minimum lot sizes. 35 ft. Required except when abutting commercial agricultural lands (AC), commercial forest lands (FC), riparian and shoreline areas. Front: 25 ft. from the front property line or 55 ft. from the street centerline, whichever is greater. Side: 10 ft. Street side yard same as front. Rear: 20 ft.
35%
Commercial Mineral
Sand, gravel extraction Agriculture Forestry
5 acres None specified Required except when abutting commercial agricultural lands (AC), commercial forest lands (FC), riparian and shoreline areas. Structures: 50 ft. setback from all property lines. Offices: 25 ft. setback from all property lines.
35%
Rural Public Lands and Facilities
Public and Government Agriculture Forestry
Lot size in accordance with the Chelan‐Douglas health district standards for public or community water and sewage disposal.
50 ft. Front: 15 ft. from the front property line or 45 ft. from the street centerline, whichever is greater. Side: 10 ft. Street Side: not specified Rear: 10 ft.
Lot size in accordance with the Chelan‐Douglas health district standards for public or community water and sewage disposal.
35 ft. Required except when abutting commercial agricultural lands (AC), commercial forest lands (FC), riparian or shoreline areas. Front: 10 ft. from the front property line or 40 ft. from the street centerline, whichever is greater. Side: Zero ft., except 30 ft. from the side property line when the lot abuts any zone other than a commercial or industrial district. Street Side: not specified Rear: Zero ft., except 30 ft. from the rear property when the lot abuts any district other than a commercial or industrial district.
No maximum.
Rural Industrial Industrial Agriculture Forestry
Lot size in accordance with the Chelan‐Douglas health district standards for public or community water and sewage disposal.
60 ft. Required except when abutting commercial agricultural lands (AC), commercial forest lands (FC), riparian and shoreline areas. Front: 10 ft. from the front property line or 40 ft. from the street centerline, whichever is greater. Side: Zero ft., except 30 ft. from the side property line when the lot abuts any district other than an industrial district. Street Side: not specified Rear: Zero ft., except 30 ft. from the rear property line when the lot abuts any zone other than an industrial district.
70%
Rural Recreational / Residential
Single Family Residential Agriculture Forestry
Lot size in accordance with the Chelan‐Douglas health district standards for public or community water and sewage disposal; however, in no case shall lot size be less than 12,000 sq ft., except for cluster subdivisions or planned development districts.
35 ft. Required except when abutting commercial agricultural lands (AC), commercial forest lands (FC), riparian or shoreline areas. Front: 25 ft. from the front property line or 55 ft. from the street centerline, whichever is greater. Side: 5 ft. Street side yard same as front. Rear: 20 ft.
35%
Rural Residential Single Family 2.5 acres. Cluster subdivisions or planned development districts may have 35 ft. Front: 25 ft. from the front property line or 55 ft. from the street centerline, 35%
March 2009 Page C-1
DRAFT Chelan County Shoreline Inventory and Analysis
Zone Primary Land Uses Minimum Lot Size (acres or sq ft.)
Maximum Building Height (ft.)
Standard Minimum Setbacks (ft.)
Maximum Building Coverage (%)
1_2.5 Residential Agriculture Forestry
reduced minimum lot sizes. whichever is greater.Side: 5 ft. from the side property line. Street side yard same as front. Rear: 20 ft.
Rural Residential 1_5
Single Family Residential Agriculture Forestry
5 acres. Cluster subdivisions or planned development districts may have reduced minimum lot sizes.
35 ft. Front: 25 ft. from the front property line or 55 ft. from the street centerline, whichever is greater. Side: 5 ft. Street side same as front. Rear: 20 ft. from the rear property line.
35%
Rural Residential 1_10
Single Family Residential Agriculture Forestry
10 acres. Cluster subdivisions or planned development districts may have reduced minimum lot sizes.
35 ft. Front: 25 ft. from the front property line or 55 ft. from the street centerline, whichever is greater. Side: 5 ft. from the side property line. Street side same as front. Rear: 20 ft.
35%
Rural Residential 1_20
Single Family Residential Agriculture Forestry
20 acres. Cluster subdivisions or planned development districts may have reduced minimum lot sizes.
35 ft. Front: 25 ft. from the front property line or 55 ft. from the street centerline, whichever is greater. Side: 5 ft. from the side property line. Street side yard same as front. Rear: 20 ft.
35%
Rural Village Single Family Residential Agriculture Forestry
Lot size, which measures to include 10% of the adjoining public rights‐of‐way, shall be in accordance with the Chelan‐Douglas health district standards for public or community water and sewage disposal. Single family minimum 12,000 sq ft.; duplex minimum 15,050 sq ft.; and 3,050 additional sq ft. for each additional multifamily dwelling unit, except for cluster subdivisions or planned development districts
35 ft. Front: 25 ft. from the front property line or 55 ft. from the street centerline, whichever is greater. Side: 5 ft. from the side property line. Street side yard same as front. Rear: 20 ft.
35%
Rural Waterfront Single Family Residential Agriculture Forestry
Lot sizes, which measures to include 10% of the adjoining public rights‐of‐way, shall be in accordance with the Chelan‐Douglas health district standards for public or community water and sewage disposal; however, in no case shall lot size be less than 12,000 sq ft. except for cluster subdivisions or planned development districts.
35 ft. Front: 25 ft. from the front property line or 55 ft. from the street centerline, whichever is greater. Side: 5 ft. Street side yard same as front. Rear: 20 ft.
35%
Urban Residential 2
Residential, detached & attached
7,000 sq ft. for single‐family, 10,000 sq ft. for duplex, 7,000 sq ft. plus 3,050 sq ft. per unit for multifamily.
35 ft. Front: 25 ft. from the front property line or 55 ft. from the street centerline, whichever is greater. Side: 5 ft. Street Side: not specified Rear: 25 ft.
35%
Urban Residential 3
Residential, detached & attached
5,000 sq ft. for single‐family, 7,000 sq ft. for duplexes, 4,000 sq ft. plus 1,650 sq ft. per multifamily unit, except for cluster subdivisions or planned development districts.
50 ft. Front: 10 ft. from the front property line or 55 ft. from the street centerline, whichever is greater. Side: 5 ft. Street Side: not specified Rear: 20 ft.
Buildings and structures up to 2 stories shall not occupy more than 50% of the lot area, less 5% for each additional story up to 4.
Urban Waterfront Residential
Residential, detached & attached
5,000 sq ft. for a single‐family dwelling unit, 7,000 sq ft. for a duplex dwelling unit, and 4,000 sq ft. plus 1,650 sq ft. per unit for multifamily dwelling units; except for cluster subdivisions or planned development districts.
35 ft. Front: 25 ft. from the front property line or 55 ft. from the street centerline, whichever is greater. Side: 5 ft. Street Side: not specified Rear: 15 ft.
35%
Low Density Residential (R‐1)
Single Family Duplex
7,500 sq ft. – single family 9,000 sq ft. – duplex
25 ft. Front: 25 ft.Side: 5 ft. Street Side: 25 ft. Rear: 20 ft.
50%
Medium Density Residential (R‐2)
Single Family Duplex Multifamily Condominium
7,000 sq ft. – single family 9,000 sq ft. – duplex plus 1,000 sq ft. for each additional unit
25 ft. Front: 20 ft.Side: 5 ft. Street Side: 20 ft. Rear: 15 ft.
65%
Page C-2 March 2009
DRAFT Chelan County Shoreline Inventory and Analysis
Zone Primary Land Uses Minimum Lot Size (acres or sq ft.)
Maximum Building Height (ft.)
Standard Minimum Setbacks (ft.)
Maximum Building Coverage (%)
High Density Residential (R‐3)
Single Family Duplex Multifamily Condominium
6,000 sq ft. – single family 9,000 sq ft. – duplex plus 1,000 sq ft. for each additional unit
35 ft. Front: 20 ft.Side: 5 ft. Street Side: 20 ft. Rear: 15 ft.
65%
Downtown Commercial
Commercial Residential
0 sq. ft. 35 ft. 0 ft. all sides None
Highway Commercial
Large scale commercial, multifamily
0 sq. ft. 45 ft. Front: 40 ft.Side: 20 ft. Street Side: 40 ft. Rear: 20 ft.
75%
Industrial Heavy Industrial 0 sq. ft. 45 ft. Front: 25 ft.Side: 25 ft. Street Side: 25 ft. Rear: 25 ft.
75%
Campus Industrial
Light Industrial, Technology
0 sq. ft. 45 ft. Front: 20 ft.Side: 20 ft. Street Side: 20 ft. Rear: 20 ft.
80%
Public Use Public facilities and services
0 sq. ft. 35% 0 ft. all sides 30%
City of Cashmere: Zoning Standards Summary.
Zone Primary Land Uses Minimum Lot Size (sq ft.)
Maximum Building Height (ft.)
Standard Minimum Setbacks (ft.)
Maximum Building Coverage (%)
Downtown Business District
Commercial That area necessary to comply with all applicable provisions, including without limitation requirements for off-street parking, ingress/egress, lot coverage, landscaping, etc.
3 stories, not greater than 40 ft. including all signs and decorations
Front: Same as adjacent buildings or zero. Side: Zero ft. common wall, or 5 ft. from side property line. Adjacent to residential 15 ft. Street Side: Not specified Rear: Zero ft. Adjacent to residential 15 ft. Alley 8 ft. from rear lot line.
80%
Mixed Commercial / Light Industrial
Commercial Industrial
That area necessary to comply with all applicable provisions, including without limitation requirements for off-street parking, ingress/egress, lot coverage, landscaping, etc.
3 stories, not greater than 40 ft., including all signs or decorations. Where development occurs adjacent to a residential or public district, maximum building height for all structures and storage of materials shall be 30 ft.
Front: Arterial 55 ft. from centerline or 25 ft. from front lot line, whichever is greater. Non-arterial, 50 ft. from centerline or 20 ft. from front lot line, whichever is greater. Side & Rear: 10 ft. Adjacent to residential 15 ft. Street Side: Not specified
80%
March 2009 Page C-3
DRAFT Chelan County Shoreline Inventory and Analysis
Zone Primary Land Uses Minimum Lot Size (sq ft.)
Maximum Building Height (ft.)
Standard Minimum Setbacks (ft.)
Maximum Building Coverage (%)
Multi Family Residential
Multifamily Duplex Single Family
SF: 7,000 sq ft. Duplex: 8,500 sq ft. MF: 8,500 sq ft.
3 stories; not greater than 40 ft.; cornices, eaves, gutters, sunshades and other similar architectural features may not project more than 2 ft. into required yard setback
Front: 20 ft. Side: 5 ft. for one-story structure, or 8 ft. for two-story structure, or 11 ft. for three-story structure. Street Side: Not specified Rear: 10 ft. Accessory buildings 5 ft. to the rear lot line. Setback from alley 8 ft.
50%
Public Public/ Semi-Public Recreation
That area necessary to comply with all applicable provisions, including without limitation requirements for off-street parking, ingress/ egress, lot coverage, landscaping, etc.
30 stories, not greater than 40 ft., including all signs or decorations. Where development is adjacent to a residential district, maximum building height shall be two stories or greater than 30 ft.
Front: Zero Side: Zero except adjacent to residential, 30 ft. Street Side: Not specified Rear: Zero ft. Adjacent to residential, 30 ft. and adjacent to alley 8 ft.
80%
Single Family Residential
Single Family Dwellings
7,000 sq ft. 2 stories; not greater than 30 ft.; cornices, eaves, gutters, sunshades and other similar architectural features may not project more than 2 ft. into a required yard setback
Front: 25 ft. from front property line or 50 ft. from centerline of the street ROW, whichever is greater. Side: 5 ft. Street Side: Not specified Rear: 10 ft. Accessory buildings 5 ft. Alley setback 8 ft.
35%
Suburban Residential
Single Family Dwellings Duplexes Multifamily Agriculture
10,000 sq ft. (Duplexes allowed 15,000 sq ft.) 2 stories; not greater than 30 ft.; cornices, eaves, gutters, sunshades and other similar architectural features may not project more than 2 ft. into required yard setback
Front: 25 ft. from front property line or 50 ft. from centerline of the street ROW, whichever is greater. Side: 5 ft. Street Side: Not specified Rear: 10 ft. Accessory buildings 5 ft. Alley setback 8 ft.
35%
Page C-4 March 2009
DRAFT Chelan County Shoreline Inventory and Analysis
Zone Primary Land Uses Minimum Lot Size (sq ft.)
Maximum Building Height (ft.)
Standard Minimum Setbacks (ft.)
Maximum Building Coverage (%)
Warehouse Industrial
Industrial Commercial
That area necessary to comply with all applicable provisions, including without limitation requirements for off-street parking, ingress/egress, lot coverage, landscaping, etc.
3 stories, not greater than 40 ft. (existing allows 80 ft.), including all signs or decorations. Where development occurs adjacent to a residential or public district, maximum building height for all structures and storage of materials shall be 30 ft.
Front, Side & Rear: None. Where necessary for roof snow sloughing, 8 ft. Street Side: Not specified
80%
City of Chelan: Zoning Standards Summary.
Zone Maximum Building Height (ft.)
Maximum Building Coverage (%)
Primary Land Uses Minimum Lot Size (sq ft.) Standard
Minimum Setbacks (ft.)
High Density Commercial
Commercial Lodging
No minimum 50 ft. Front: Zero ft. Side: Zero ft. Street Side: Not specified Rear: 5 ft.
No maximum
Highway Service Commercial
Highway and convenience commercial Trailer courts Boat building/sales
5,000 sq ft. 50 ft. Front: Zero ft. Side: Zero ft. Street Side: Not specified Rear: 5 ft.
65%
Multi Family Residential
Single family Dwellings Townhomes Multifamily
5,000 sq ft. or 1,000 sq ft. per dwelling unit, whichever is greater Townhouses 30 ft.; all other uses 50 ft. with the following exception: where the building site abuts an existing single-family residence, side step backs or an alternative design approved by City shall be required for any building taller than 30 ft.
Front: 20 ft. Side: 5 ft., plus one additional foot for each 2 ft. by which the building height exceeds 30 ft. Street Side: Not specified Rear: 20 ft. plus one additional foot for each 2 ft. by which the building height exceeds 30 ft.
40%
Public Lands & Facilities
Public and Semi-Public Uses Recreation Marinas
Not specified 35 ft. Abutting residential: Front: 25 ft. Side: 5 ft. Street Side: Not specified Rear: 20 ft.
35%
March 2009 Page C-5
DRAFT Chelan County Shoreline Inventory and Analysis
Zone Primary Land Uses Minimum Lot Size (sq ft.)
Maximum Building Height (ft.)
Standard Minimum Setbacks (ft.)
Maximum Building Coverage (%)
Commercial Leases
Abutting non-residential: Front: Zero ft. Side: Zero ft. Street Side: Not specified Rear: 5 ft.
Single Family Residential
Single Family Dwellings Agriculture
6,000 sq ft. 30 ft. Front: 25 ft. Side: 5 ft. Street Side: 15 ft., except garage 20 ft. Rear: 20 ft.
30%
Special Use District
Single Family Agriculture Commercial PUD Marinas
5,000 sq ft. 50 ft. Front: 25 ft. The setback for commercial structures may be reduced based on criteria. Side: 5 ft. Street Side: Not specified Rear: 20 ft.
75%
Tourist Accommo-dations
Residential Lodging Restaurants Personal services Travel services Small scale retail Boat launches Marinas Offices
5,000 sq ft. 50 ft. Front: 25 ft. The setback for commercial structures may be reduced based on criteria. Side: 5 ft. Street Side: Not specified Rear: 20 ft.
10,000 sq ft. Not specified Front: Not specified Side: Not specified Street Side: Not specified Rear: Not specified
Not specified
Waterfront Commercial
Boat transportation, boat building and sales, marinas, docks Residential Commercial
5,000 sq ft. 35 ft. Front: 25 ft. Side: 5 ft. Street Side: 25 ft. Rear: Zero ft.
65%
City of Entiat: Zoning Standards Summary.
Zone Primary Land Uses Minimum Lot Size (sq ft.)
Maximum Building Height (ft.)
Standard Minimum Setbacks (ft.)
Maximum Building Coverage (%)
Commercial / Light Industrial
Commercial Industrial Agricultural
No minimum lot area or dimensions 3 stories or 50 ft. Front: City streets, 45 ft. from the centerline or 15 ft. from the front property line, whichever is greater. State highway, 40 ft. from the front property line when front yard parking, or 20 ft. no front yard parking. Side: Zero ft. Street Side: not specified Rear: Zero ft.
60%
Page C-6 March 2009
DRAFT Chelan County Shoreline Inventory and Analysis
Zone Primary Land Uses Minimum Lot Size (sq ft.)
Maximum Building Height (ft.)
Standard Minimum Setbacks (ft.)
Maximum Building Coverage (%)
Highway Commercial
Commercial Limited Industrial
No minimum lot area or dimensions 3 stories or 40 ft. Front: City streets, 45 ft. from the centerline or 15 ft. from the front property line, whichever is greater. State highway, 40 ft. from the front property line when front yard parking, or 20 ft. no front yard parking. Side: Zero ft. unless adjacent to residential, then 15 ft. Street Side: not specified Rear: Zero ft. from the rear property line, improved access (alley, street) 5 ft. without established access. Adjacent to residential, then 20 ft.
50%
Residential Low Density
Residential Agriculture
8,500 sq ft. for a single-family dwelling 12,500 sq ft. for a duplex dwelling
2 stories or 35 ft. Front: 25 ft. from the front property line or 55 ft. from the centerline of the street, whichever is greater. Side: 5 ft. from side property line Street Side: Same as front Rear: 20 ft. from rear property line
35%
Waterfront Business
Commercial No minimum lot area or dimensions 2 stories or 35 ft. Front: City streets, 55 ft. from the centerline of city streets or 25 ft. from the front property line, whichever is greater. State highway, 40 ft. when front yard parking is provided, or 20 ft. not front yard parking Side: 5 ft. Street Side: not specified Rear: 20 ft.
50%
City of Leavenworth: Zoning Standards Summary.
Zone Primary Land Uses Minimum Lot Size (sq ft.)
Maximum Building Height (ft.)
Standard Minimum Setbacks (ft.)
Maximum Building Coverage (%)
Central Commercial
Commercial Office Lodging Condominiums
No minimum lot size 50 ft. Front: 25 ft. for parcels which have direct frontage on or along Highway 2 in the city or which are located across the street from residential or recreational zones. Side: 10 ft. when side yard abuts, touches or adjoins any residential or recreational zones. Street Side: not specified Rear: 15 ft. when rear yard abuts, touches or adjoins residential or recreational zones.
Not specified
General Commercial
Commercial Multifamily Lodging
No minimum lot size 35 ft. Front: 25 ft. for parcels which have frontage on or along Highway 2 in the city, or which are located across the street from any residential or recreational zone. Side: 10 ft. when side yard abuts, touches or adjoins any residential or recreational zone. Street Side: not specified Rear: 15 ft. when rear yard abuts, touches or adjoins any residential or recreational zone.
No minimum lot size 50 ft. Front: 25 ft. Side: 5 ft.; when abutting, touching or located across street or alley from residential or recreational zone, increased to 20 ft. Street side: Same as front. Rear: 10 ft., increased to 20 ft. when abutting, touching or located across street or alley from residential or recreational zone
Not specified
March 2009 Page C-7
DRAFT Chelan County Shoreline Inventory and Analysis
Zone Primary Land Uses Minimum Lot Size (sq ft.)
Maximum Building Height (ft.)
Standard Minimum Setbacks (ft.)
Maximum Building Coverage (%)
Low Density Residential 6,000 (RL6)
Single Family Dwellings
6,000 sq ft. for single-family; 12,000 sq ft. for duplex 35 ft. Front: 25 ft. Side: 5 ft. Street Side: 10 ft. Rear: No less than 15 ft. for lots without adjacent alley to rear yard; no less than 8 ft. for lots with alley adjacent to rear yard
35%
Low Density Residential 12,000 (RL12)
Single Family Dwellings
12,000 sq ft. for single-family and duplex 35 ft. Front: 25 ft. Side: 10 ft. Street Side: 15 ft. Rear: 15 ft. for lots without alley adjacent to rear yard; 8 ft. for lots with alley adjacent to rear yard
35%
Multi Family Residential
Duplex and multifamily dwellings
6,000 sq ft. for new land divisions of up to 3 units; 2,000 for each additional dwelling unit.
35 ft. Front: 25 ft. Side: 5 ft. Street Side: 10 ft. Rear: 15 ft. for lots without alley adjacent to rear yard; 8 ft. for lots with alley adjacent to rear yard
40%
Recreation Parks, golf course, cultural facilities, education
Area dedicated as park or open space must be equal to the total area begin developed, including supporting infrastructure
35 ft. Front: 25 ft. Side: 5 ft. Street Side: not specified Rear: 20 ft.
35%
Recreation Public
Parks, golf course, play areas, swimming pool, ballfields, commercial leases, wildlife refuge
Designated public open space must equal or exceed total gross floor area of all structures and parking
35 ft. Front: 25 ft. Side: 5 ft. Street Side: not specified Rear: 20 ft.
35%
Tourist Commercial
Commercial Office Lodging Multifamily
3,500 sq ft. 35 ft. Front: 25 ft. Side: 10 ft. Street Side: Rear: 10 ft., except yard area shall be increased to 20 ft. when abutting, touching or adjoining residential or recreational zone
50%
City of Wenatchee: Zoning Standards Summary.
Zone Primary Land Uses Minimum Lot Size (sq ft.)
Maximum Building Height (ft.)
Standard Minimum Setbacks (ft.)
Maximum Building Coverage (%)
Industrial Industrial Storage including Boat Storage Commercial Recreation including boat clubs, marinas, boat launch
5,000 sq ft. 6 stories above grade and 90 ft.
Front: Zero ft. from the front property line or 35 ft. from the street centerline, whichever is greater. Side: Zero ft. Street Side: Not specified Rear: Zero ft.
70%
North Wenatchee Business
Commercial Mixed Use Residential
None 6 stories above grade and 90 ft.
Front: Zero ft. from the front property line or 35 ft. from the street centerline, whichever is greater. Wenatchee Avenue 45 ft. from the centerline.
65%
Page C-8 March 2009
DRAFT Chelan County Shoreline Inventory and Analysis
March 2009 Page C-9
Zone Primary Land Uses Minimum Lot Size (sq ft.)
Maximum Building Height (ft.)
Standard Minimum Setbacks (ft.)
Maximum Building Coverage (%)
Office Boating and Mini-Storage
Side: Zero ft. If adjacent to a residential zone 15 ft. Street Side: Not specified Rear: Zero ft. If adjacent to a residential zone 20 ft.
Residential High
Single and Multifamily Residential
4,000 sq ft. 4 stories above grade and 60 ft.
Front: 10 ft. Minimum distance from the centerline of the road equal to one-half of the required right-of-way. Side: 6 ft. Plus one-half foot for each foot by which the building height exceeds 30 ft. if the lot adjoins an RS, RL, or RM district. Street Side: Not specified Rear: 10 ft.
55%
Residential Moderate
Single Family Dwellings Duplex
6,000 sq ft. 30 ft. Front: 25 ft. Minimum distance from the centerline of the road equal to one-half of the required right-of-way. Side: 5 ft. Street Side: Not specified Rear: 15 ft.
45%
Residential Single Family
Single Family Dwellings
10,000 sq ft.; minimum lot size shall be increased 1,500 sq ft. for accessory dwelling units.
30 ft. Front: 25 ft. Minimum distance from the centerline of the road equal to one-half of the required right-of-way. Side: 5 ft. Street Side: Not specified Rear: 20 ft.
35%
Waterfront Mixed Use
Commercial Office Recreation including boat clubs, marinas, boat launch
None Residential: 30 ft. Commercial/mixed use: 50 ft.
Front: None except for any required additional public right-of-way. Minimum distance from the centerline of the right-of-way equal to one-half of the required right-of-way. Side: None Street Side: Not specified Rear: None