SGP-TR-99 Chelated Indium Activable Tracers for Geothermal Reservoirs Constantinos V. Chrysikopoulos Paul Kruger June 1986 Financial support was provided through the Stanford Geothermal Program under Department of Energy Coi ktraat No. DE-AT03-80SF11459 and by the Department of Civil Engineering, Stanford University Stanford Geothermal Program Interdisciplinary Research in Engineering and Earth Sciences STANFORD UNIVERSITY Stanford, California
Transcript
SGP-TR-99
Chelated Indium Activable Tracers for Geothermal Reservoirs
Constantinos V. Chrysikopoulos Paul Kruger
June 1986
Financial support was provided through the Stanford Geothermal Program under Department of Energy Coi ktraat No. DE-AT03-80SF11459 and by the Department of Civil
Engineering, Stanford University
Stanford Geothermal Program Interdisciplinary Research in
Engineering and Earth Sciences STANFORD UNIVERSITY
Stanford, California
ACKNOWLEDGEMENTS
The authors acknowledge Mike Thompson of U. S. Geological Survey (USGS),
Menlo Park, for many stimulating discussions and permission to the high-temperature
laboratory facilities; as well as Don Busick and Gary Warren of Hcalth Physics, Stan-
ford Linear Accelerator Center (SLAC), for providing the califclmiurh-252 neutron
source. Appreciation is extended to Lew Semprini, Evangelos Vcludriqs and Yathrib
Al-Riyami, for their friendly assistances to our research efforts. T h i s investigation was
made possible by U. S. Department of Energy Grant DE-ATO3-8OS1:114$9.
iii
ABSTRACT
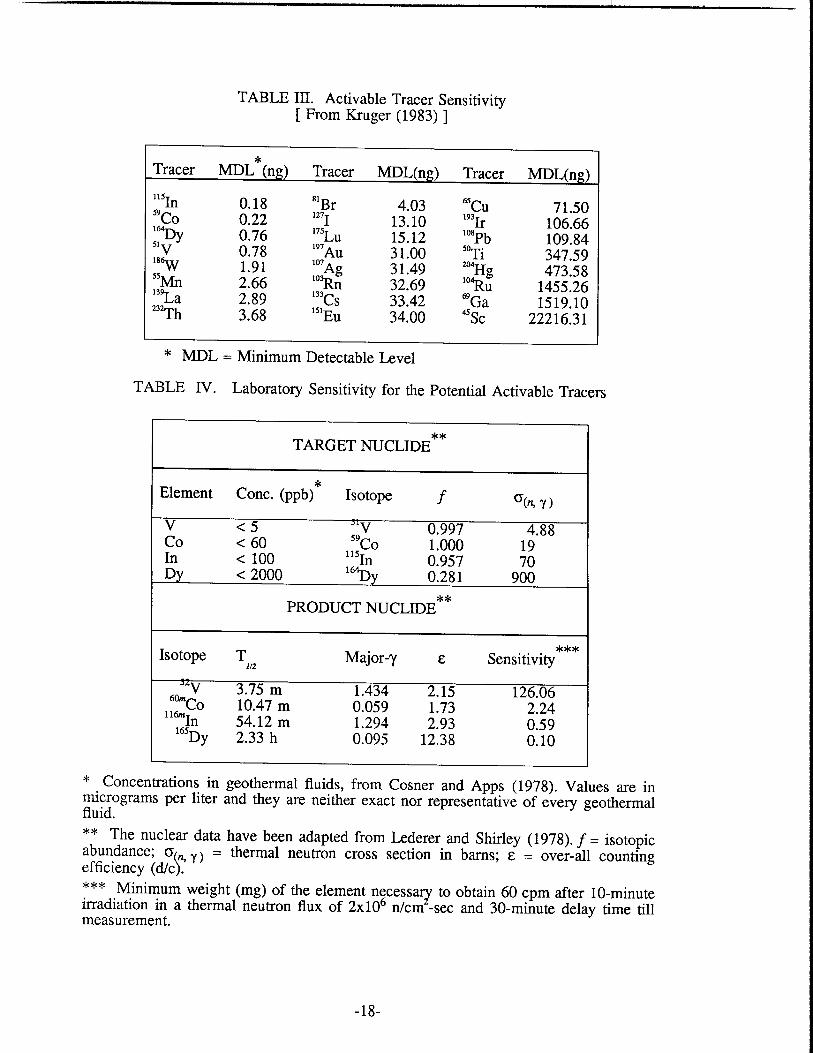
Sensitivity calculations for several potential activable tracers fcilr geothermal fluids
based on a 10-minute irradiation in a thermal flux of 2xl06n/cm'sec and 30-minute
delay time till measurement were performed. Indium was se1ecti:d to be the most
promising activable tracer. The thermal stability of indium tracer chelated with
organic ligands ethylenediaminetetraacetic acid (EDTA) and nitrilotriacedc acid (NTA)
was measured at several temperatures in the temperature range of 1;eothermal interest.
Measurement of the soluble indium concentration was made as a f'unction of time by
neutron activation analysis. From the data, thermal decomposition rates were
estimated. The results indicated that the ability of EDTA to enhance indium solubility
at elevated temperatures is superior compared to the ability of NTA. Adsorption
experiments at geothermal reservoir temperatures were run to exanine the effects of
adsorbate concentration, rock size, and temperature on the tracer adsoqjtion and ther-
mal degradation. The rock employed for these measurements was gragwacke, a prek
valent rock type at The Geysers, California geothermal field. The re:sults indicated that
significant adsorption of InEDTA did not occur at temperatures up to 200°C. At
higher temperatures a sharp reduction in soluble indium concentraltion was observed.
The change in temperature behavior was caused by the thermal (degradation of the
organic ligand. The experimental results indicate that InEDTA and InNTA are excel-
lent activable tracers for surface water and ground water systems, whila InEDTA can
be used effectively in geothermal reservoirs with temperatures up to 200°C
Abstract ...................................................................................................................... v List of Illustrations .................................................................................................... ix List of Tables ............................................................................................................. x Nomenclature ............................................................................................................ .xi
1.3. 1.4. 1.5. Objectives of the Study ............................................................... 9
LITERATURE REVIEW ..................................................................... 11 2.1. Chemical Nature of Geothermal Systems ................................. 11 2.2. The Sensitivity Calculation ......................................................... 15 2.3. Indium .......................................................................................... 19
Occurrence and Geochemistry .................................................... 19 Uses ............................................................................................. 22 Chemical Properties and Aqueous Chemistry ........................... 22 Liquid-Liquid Extraction ............................................................ 29 Ion Exchange Behavior .............................................................. 30 Detection Methods ....................................................................... 32 Nuclear Properties ........................................................................ 32
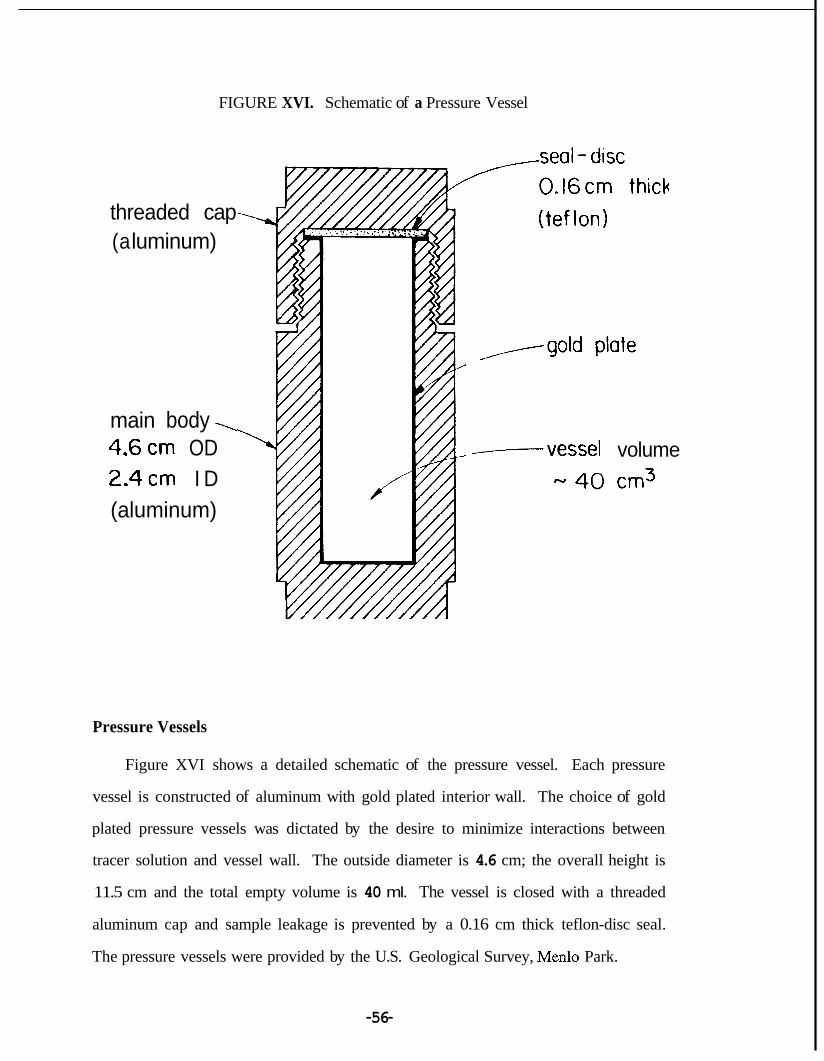
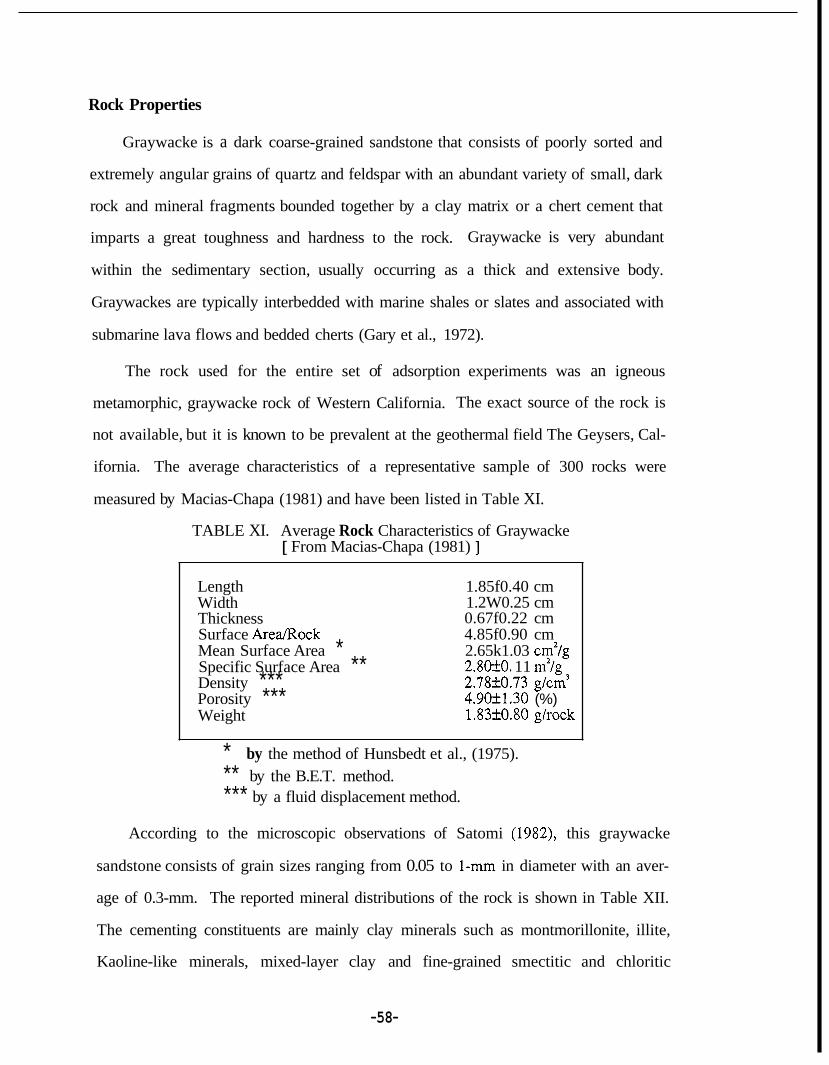
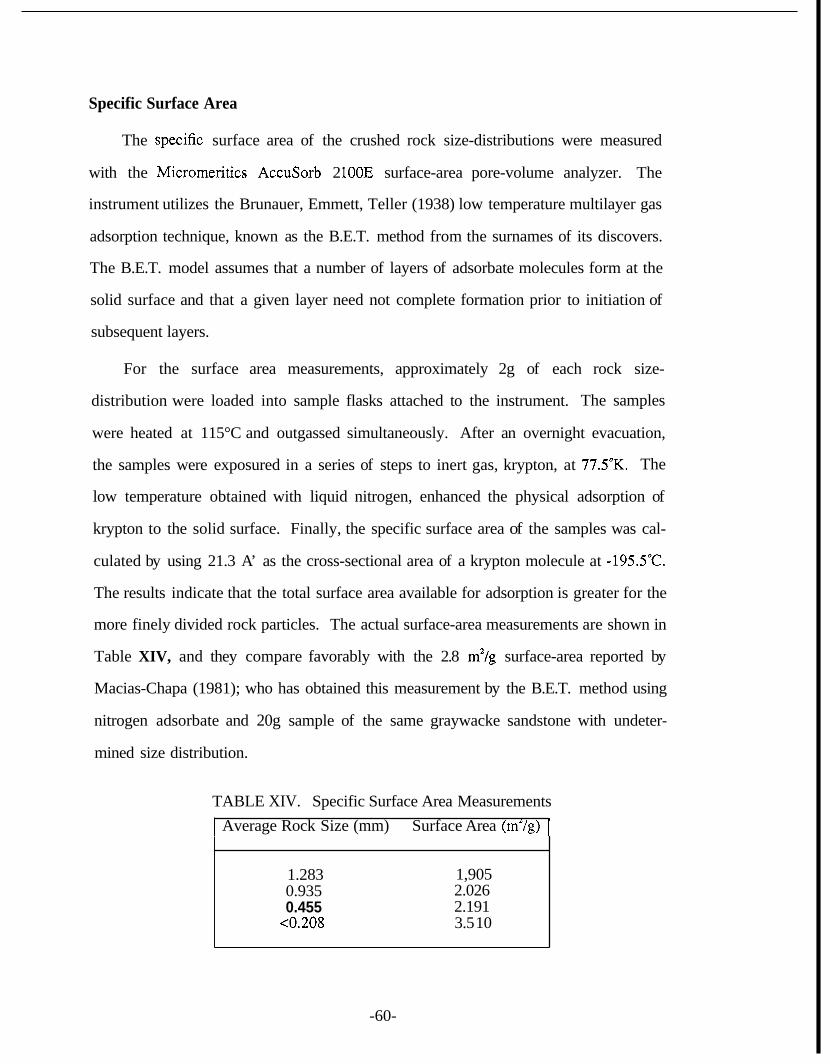
3.6. Tracer Adsorption Studies ........................................................... 57 Rock Properties .......................................................................... 58 Crushing and Sieving ................................................................. 59 . .
Specific Surface Area ................................................................. 60 Experimental Design ................................................................... 61
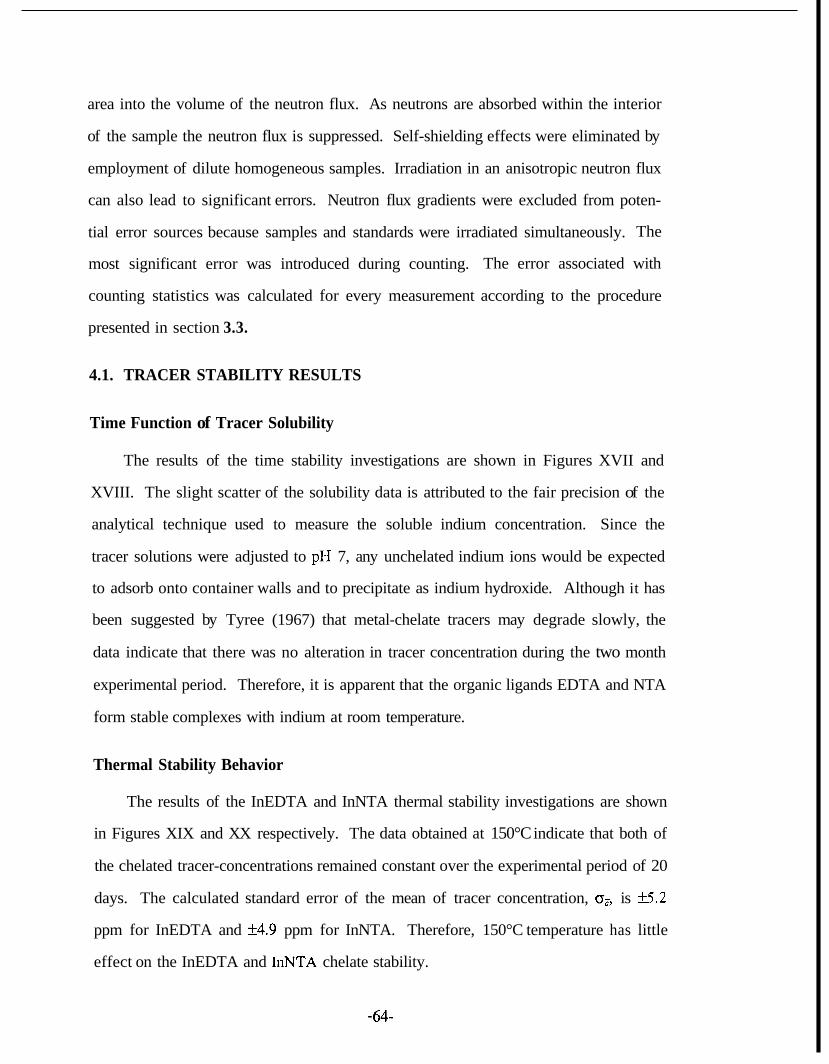
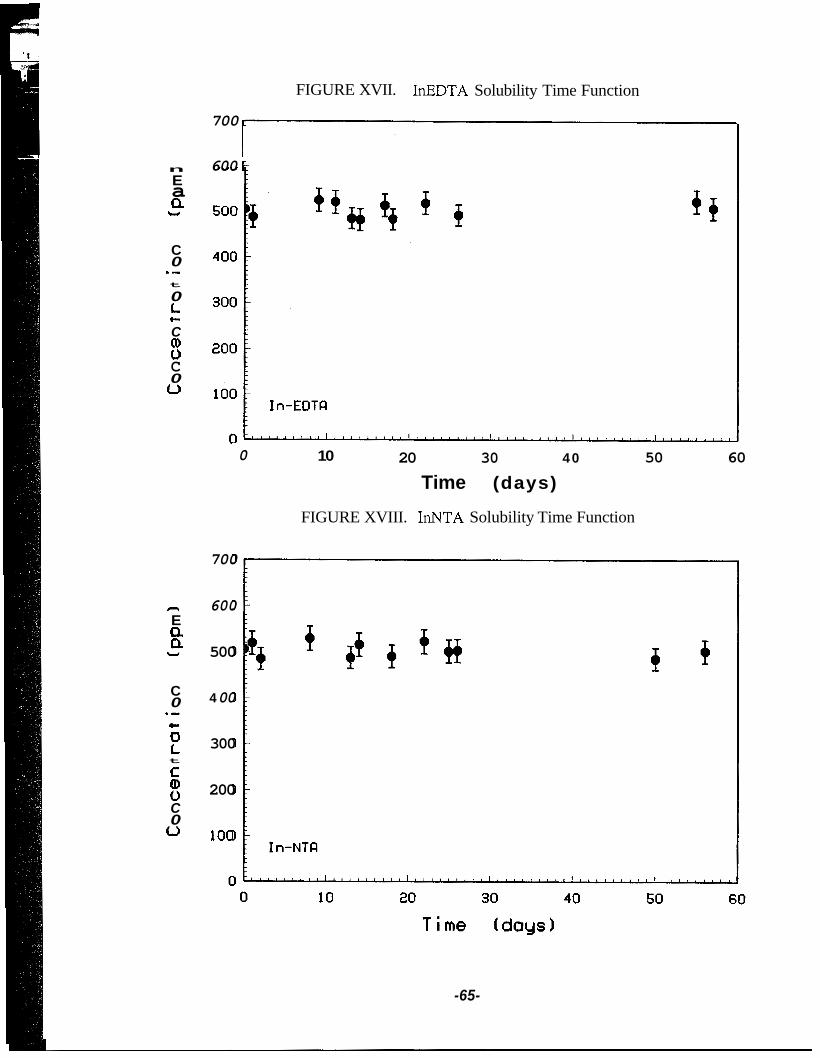
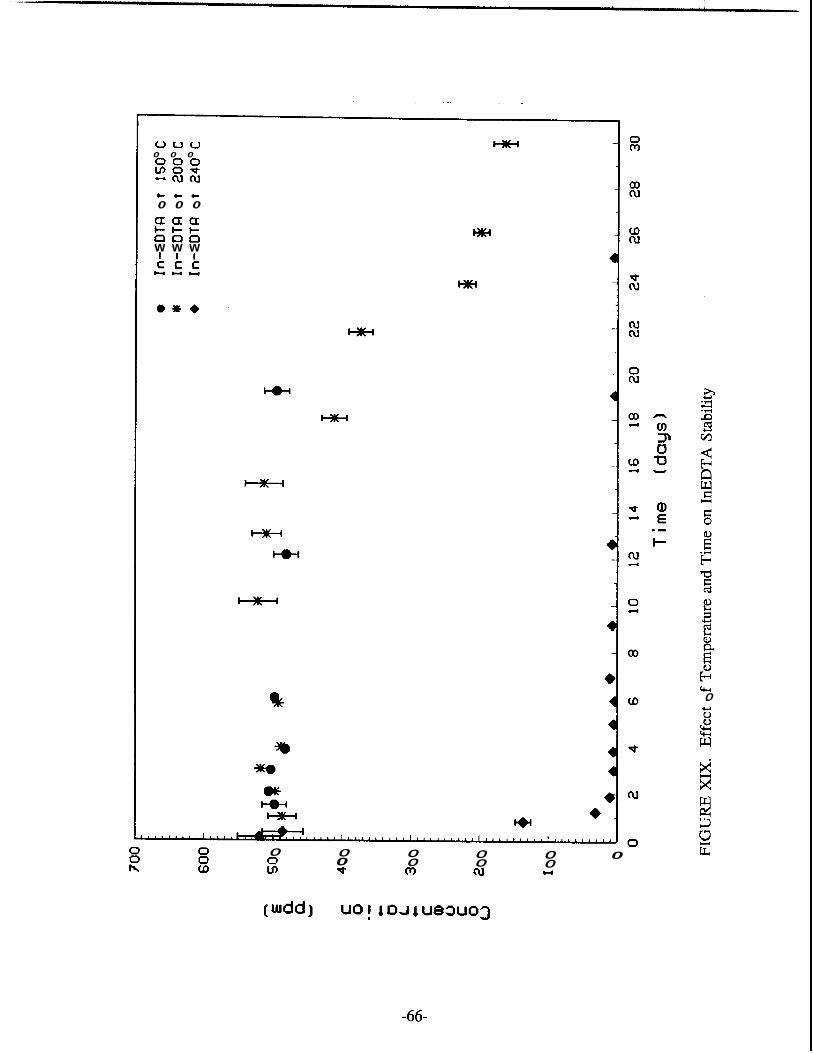
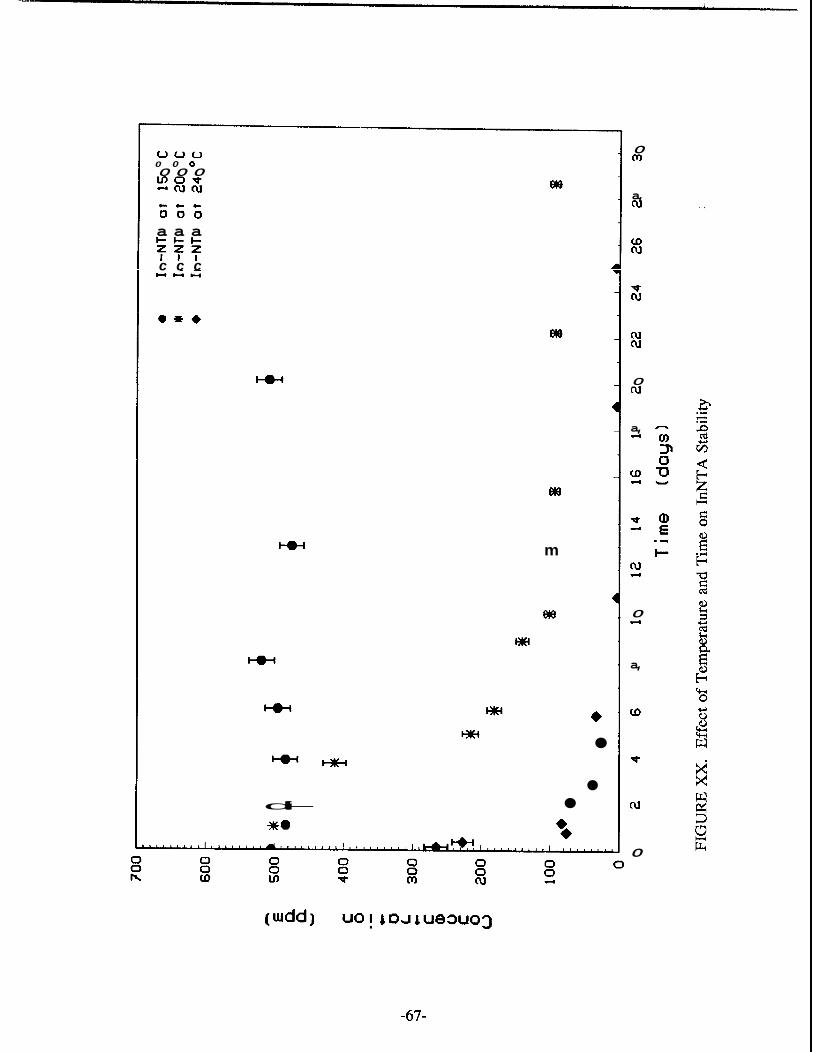
Time Function of Tracer Solubility .......................................... 64 Thermal Stability Behavior ....................................................... 64
4.2. Tracer Adsorption Results .......................................................... 69 Tracer Adsorption Evaluation at Room Temperatue ............... 69 Effect of Temperature ................................................................. 71
I I1 III IV V VI VI1 VI11 IX X XI XI1 XI11 XIV xv XVI XVII
Distribution Diagram of Indium Hydrolysis ................................................ 26 Precipitation Region of In+3 ........................................................................... 26 Predominance Diagram for III+~-OH-CL Species ........................................... 28 Gamma Spectra of Indium- 1 16m ................................................................. 34 palpH Diagram for EDTA ........................................................................... 38 Indium-EDTA Complex Formation .............................................................. 38
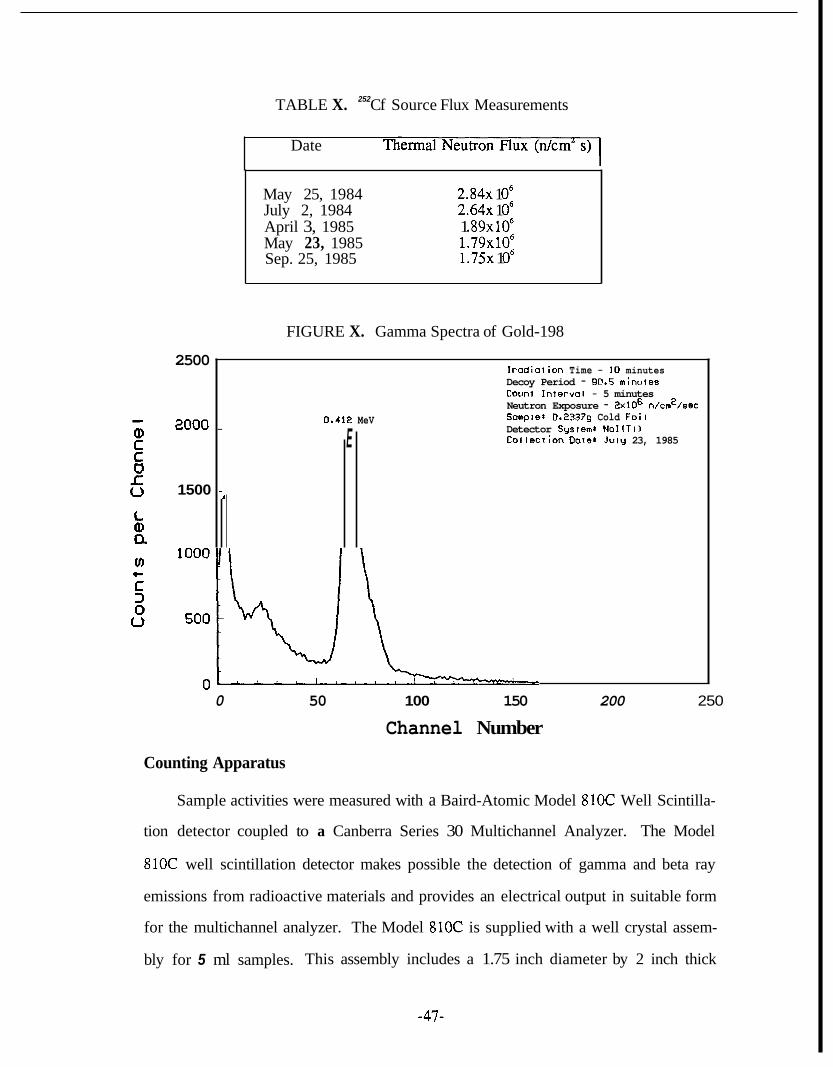
palpH Diagram for NTA .............................................................................. 42 Indium-NTA Complex Formation ................................................................ 42 Gamma Spectra of Gold-198 ........................................................................ 47
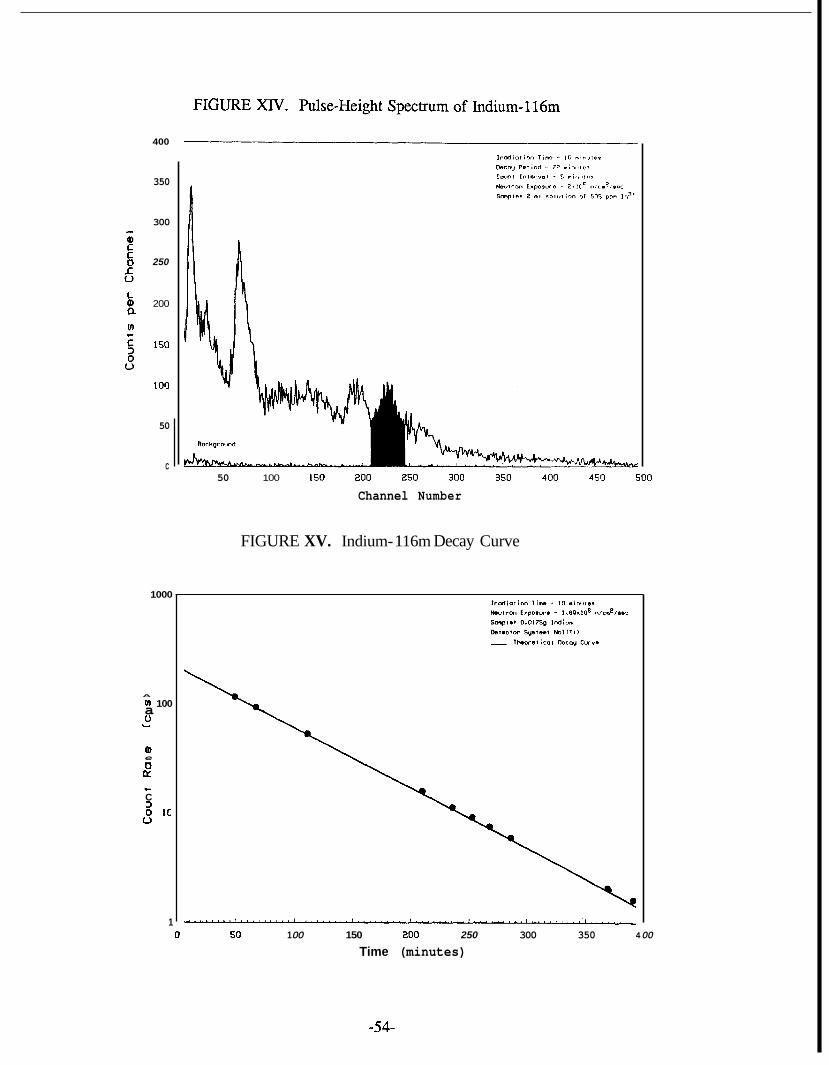
Correction Applied to Observed Counts for Decay During Countimg ........ 52 Calibration Curve .......................................................................................... 52 Pulse-Height Spectrum of Indium-116m ...................................................... 54 Indium- 1 16m Decay Curve .......................................................................... 54 Schematic of a Pressure Vessel .................................................................... 56 InEDTA Solubility Time Function ............................................................... 65
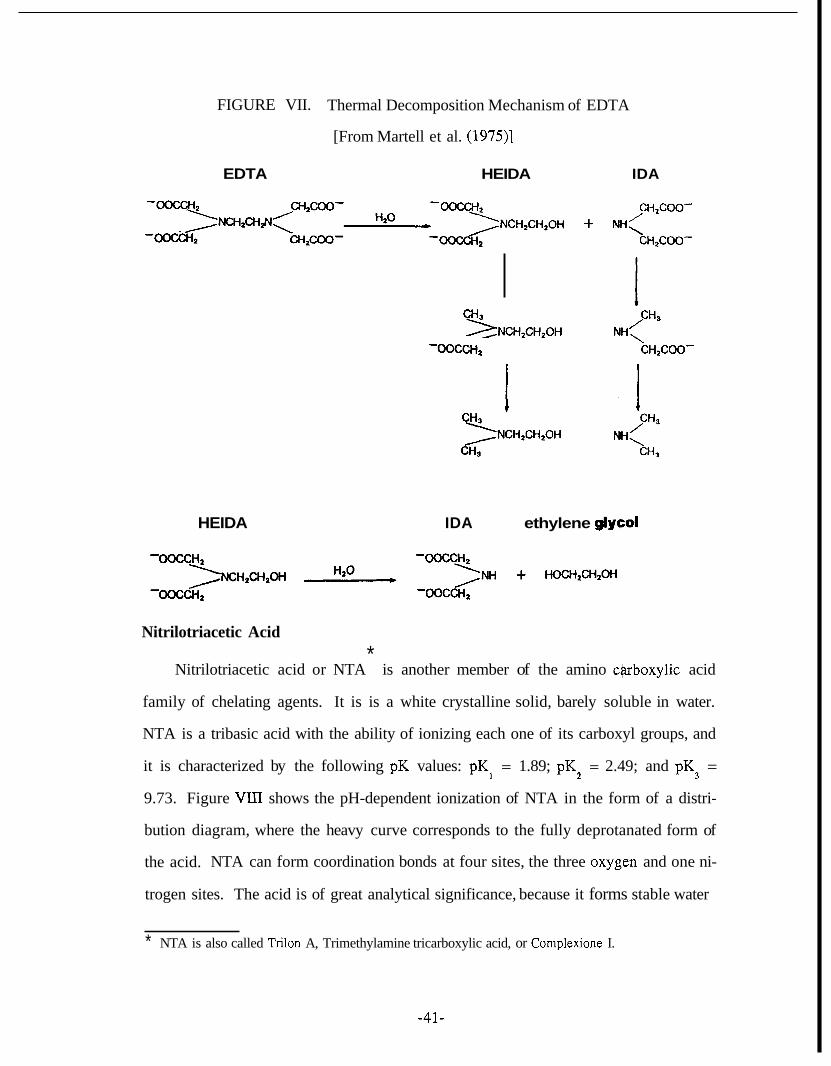
Thermal Decomposition Mechanism of EDTA ........................................... 41
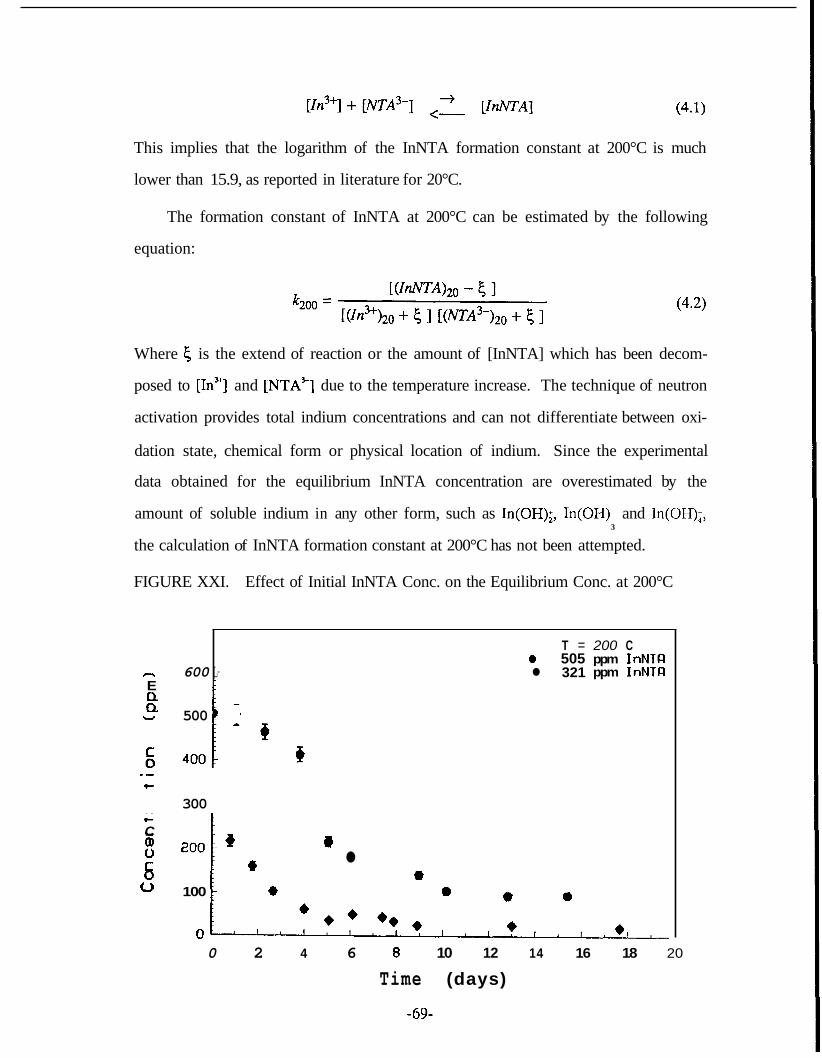
XVIII InNTA Solubility Time Function ................................................................. 65 XIX Effect of Temperature and Time on InEDTA Stability .............................. 66 XX Effect of Temperature and Time on InNTA Stability ................................. 67 XXI Effect of Initial InNTA Concentration on the Equilibrium
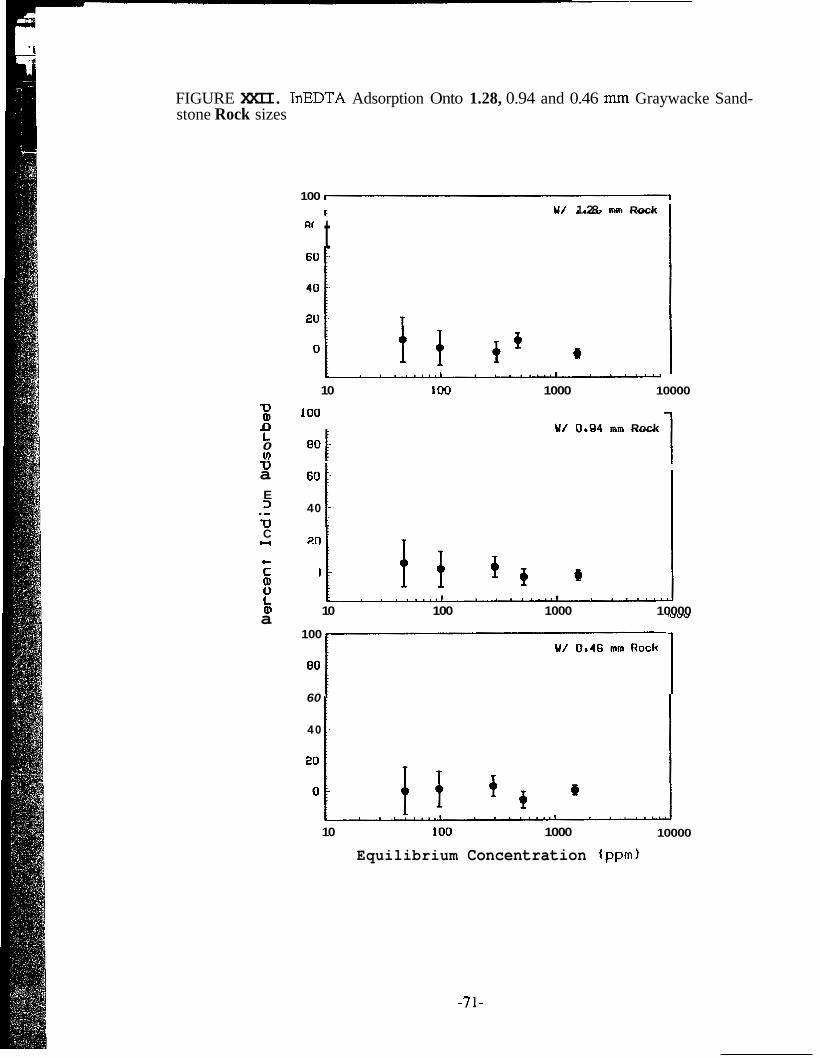
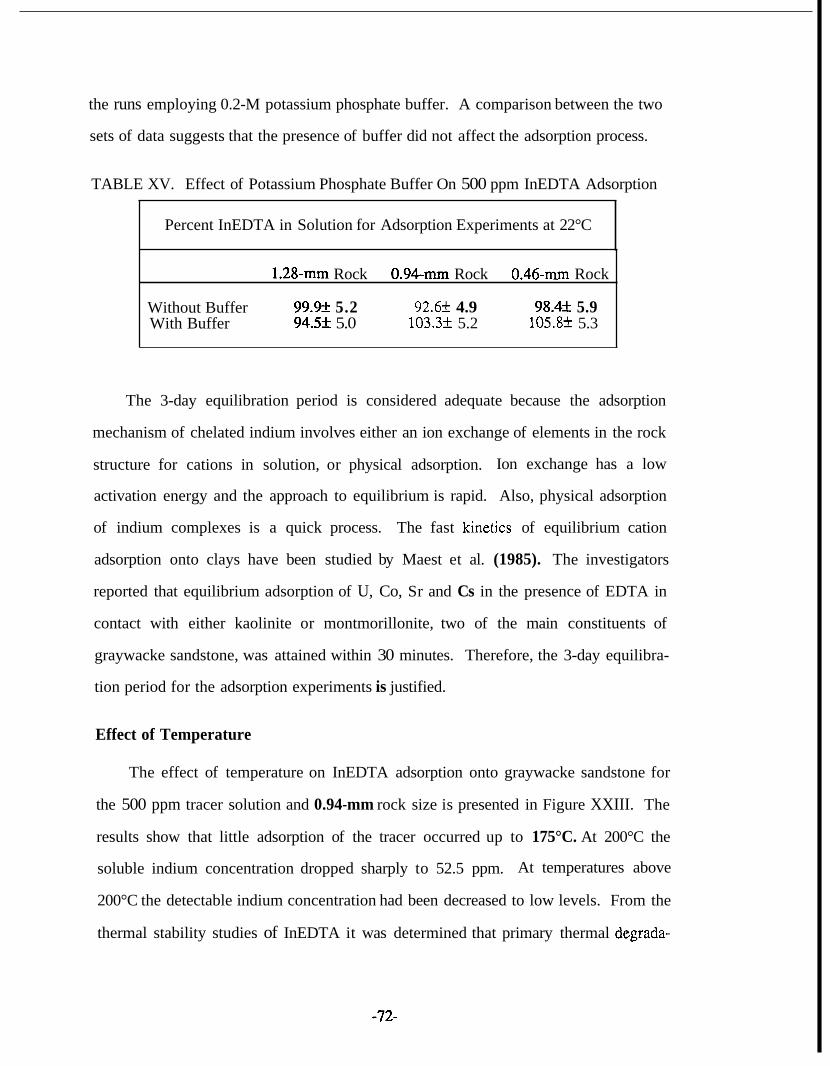
Concentration at 200°C .................................................................. ..,.. ......... 69 XXII InEDTA Adsorption Onto 1.28, 0.94 and 0.46 mm Graywacke
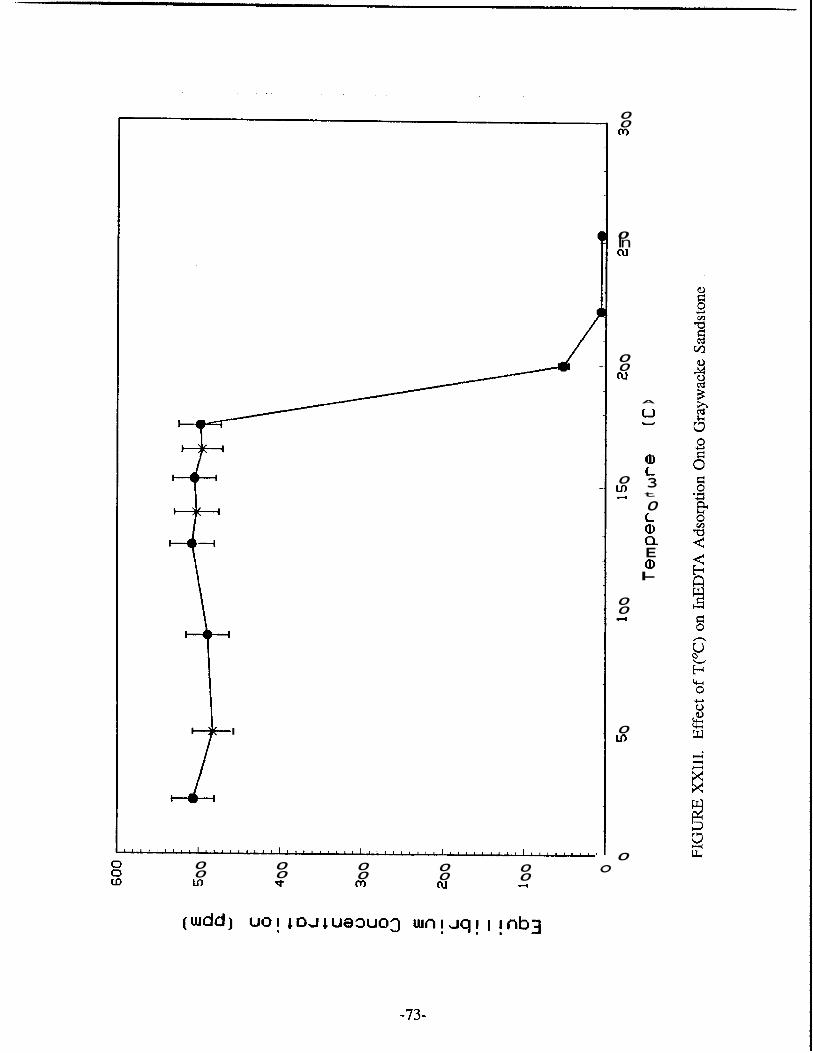
Sandstone Rock Sizes ................................................................................. 71 XXIII Effect of T(T) on InEDTA Adsorption Onto Graywacke
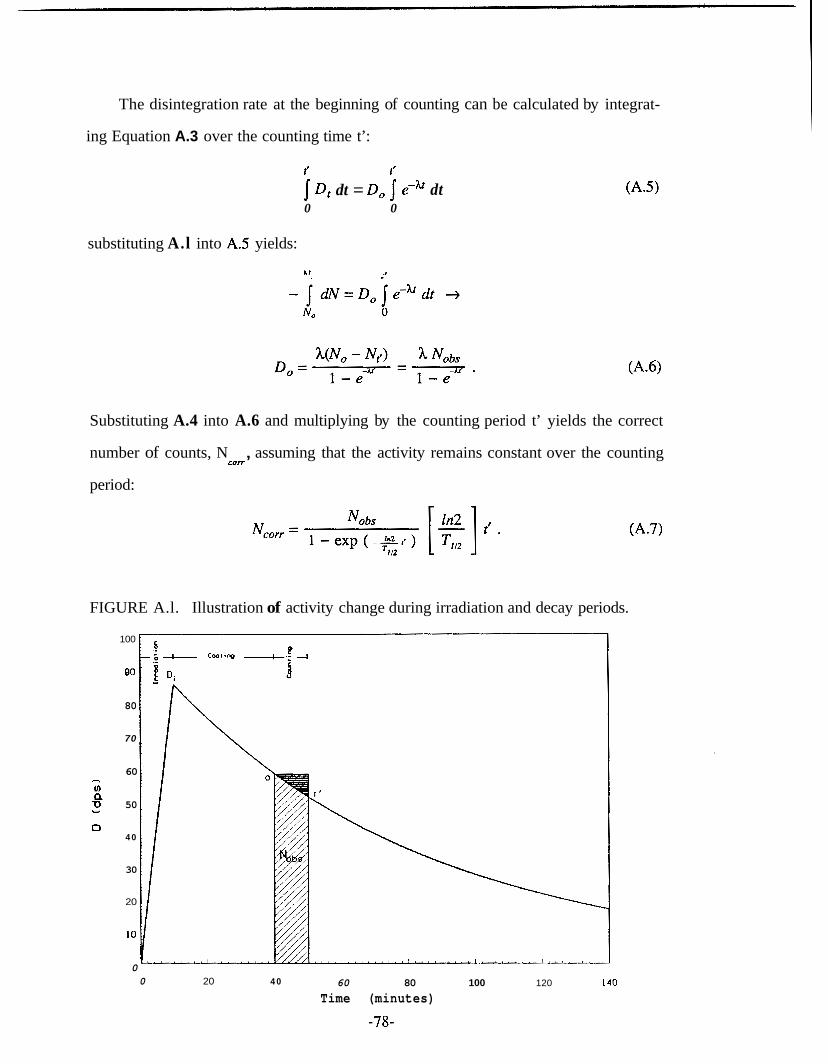
Sandstone .................................................................................................... 73 A . 1 . Illustration of Activity Change During Irradiation and
Decay Periods ............................................................................................. 78 D . 1 . Calculation of First Order Reaction Rate Constant ..................................... 85
ix
LIST OF TABLES
Table Page
I Chemical Composition of Geothermal Waters .............................................. 12 I1 Gas Composition of Geothermal Waters ....................................................... 12 III Activable Tracer Sensitivity ........................................................................... 17 IV Laboratory Sensitivity for Potential Activable Tracers ................................. 17 V Indium Concentration in Selected Minerals and Rocks ................................ 20 VI Stability Constants of Indium(1II) Complexes ............................................... 28 VI1 Selected Nuclides of Indium .......................................................................... 34 VI11 Stability Constants of EDTA Complexes at 20°C ....................... .................... 39 IX Stability Constants of NTA Complexes at 20°C ............................................ 43 X Cf Source Flux Measurements ..................................................................... 47 XI Average Rock Characteristics of Graywacke ................................................. 58 XI1 Mineral Distribution of Graywacke Sandstone ............................................... 59 XI11 Size Distributions of Crushed Rocks .............................................................. 59 XIV Specific Surface Area Measurements .............................................................. 60 XV Effect of Potassium Phosphate Buffer On 500 ppm
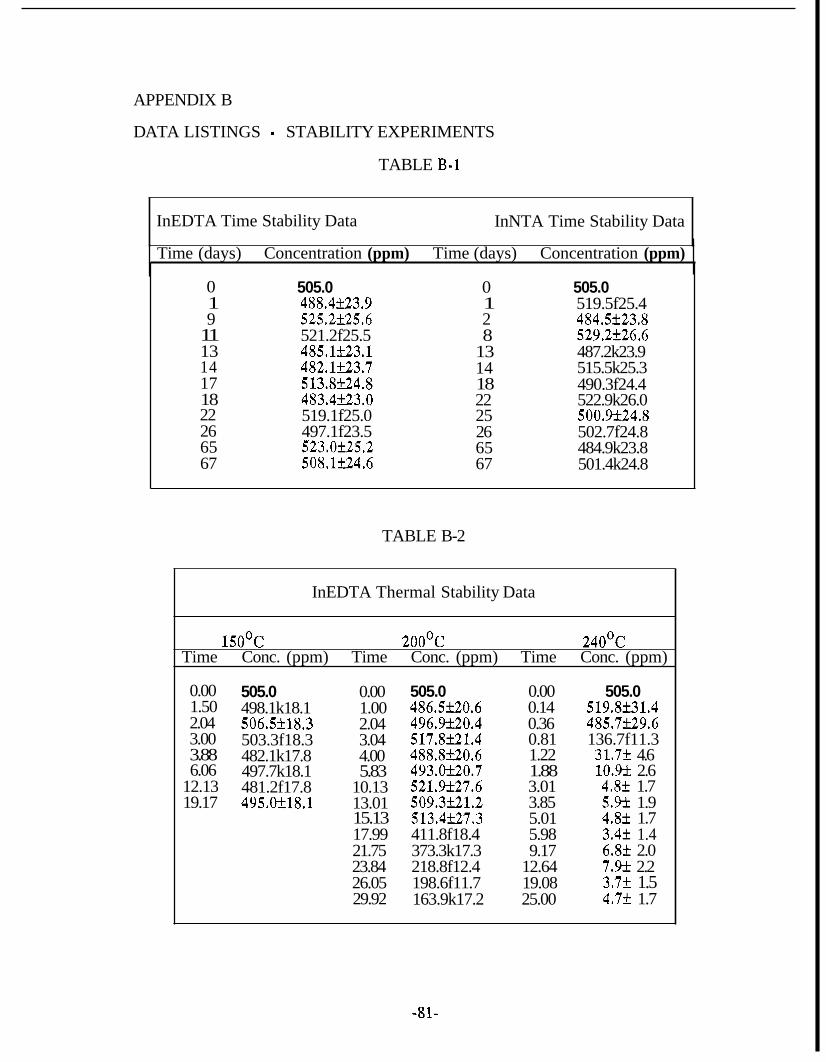
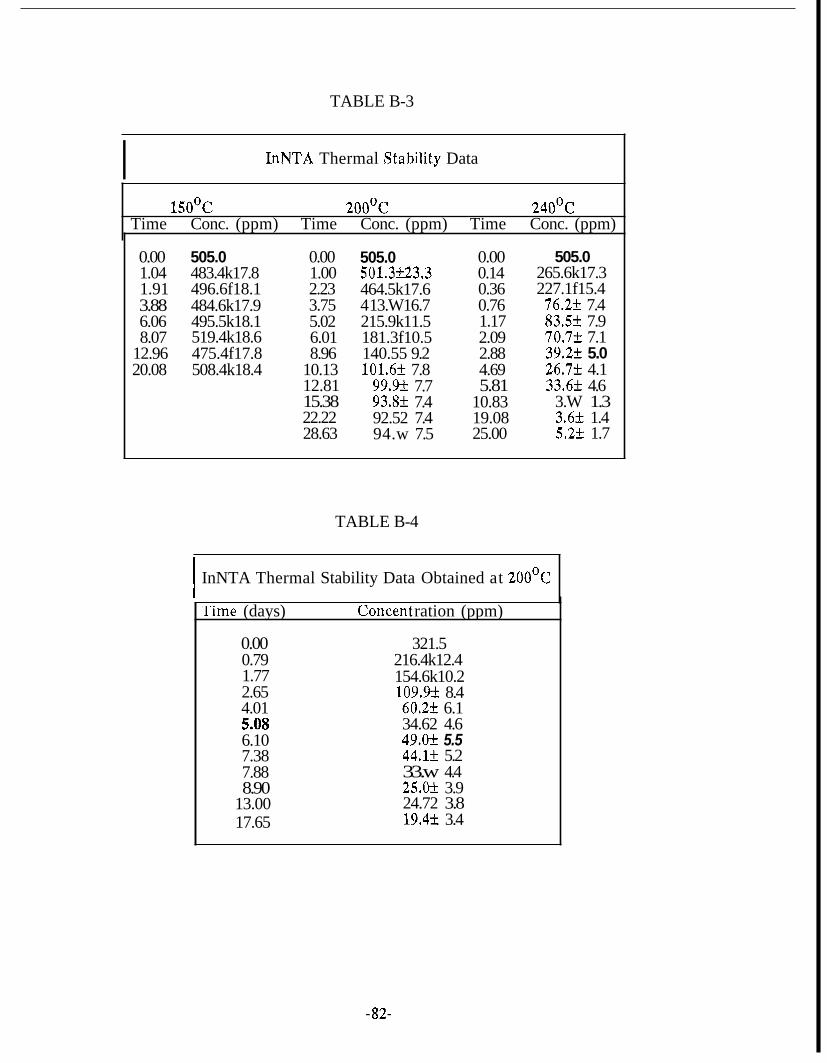
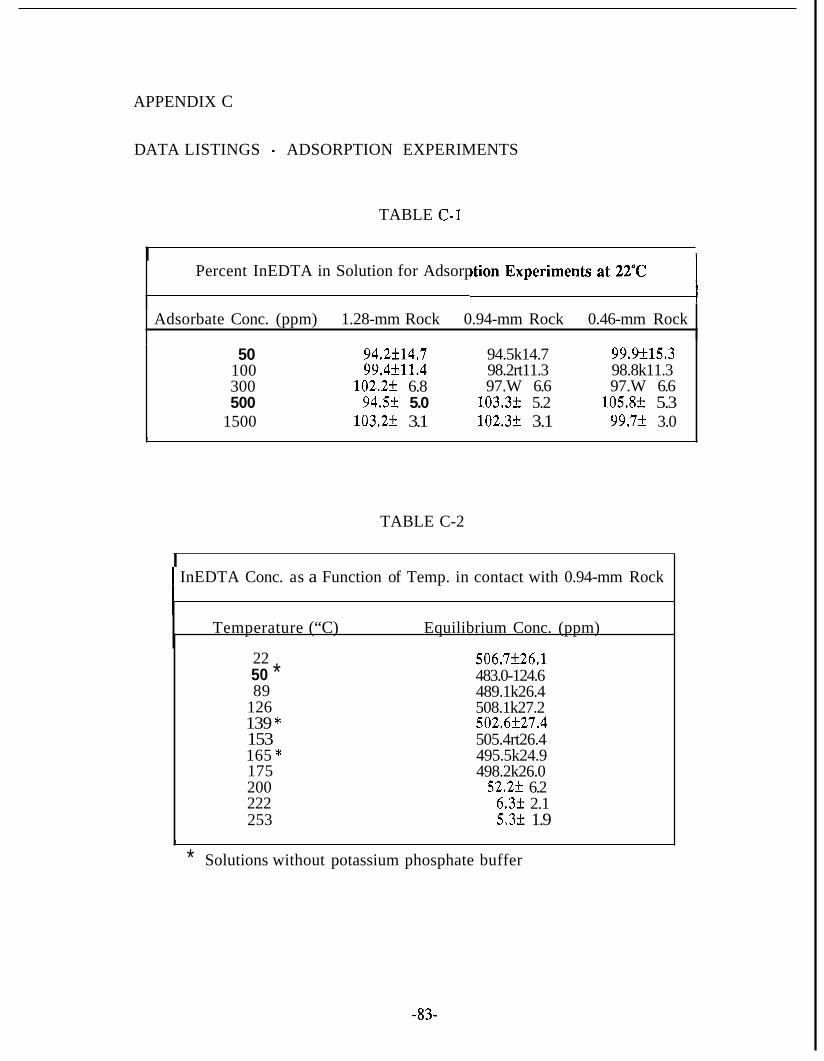
InEDTA Adsorption ...................................................................................... 72 B- 1 InEDTA and InNTA Time Stability Data ...................................................... 81 B-2 InEDTA Thermal Stability Data ..................................................................... 81 B-3 InNTA Thermal Stability Data .................................................... .................... 82 B-4 InNTA Thermal Stability Obtained at 200°C ................................................. 82 C-1 Percent InEDTA in Solution for Adsorption Experiments ........................... 83 C-2 InEDTA Concentration as a Function of Temperature in Contict
with 0.94 mm Rock ..................................................................................... 83
252
X
NOMENCLATURE
A
A
nei A
obs A
A’
CPS C
dPS D
D
D
D
t
std
tr
f I k
k
k
M
SP
O h
M
n
n
N.
N
N . N
corr
rmn
obs
PH
PK
mass number
Counting rate (cps)
Counting rate due to background (cps)
Net background rate (cps)
Observed counting rate (cps)
Avogadro’s number (6 .023~10~~ atoms/g-mole)
Counts per second
Counting correction factor
Disintegrations per second
Radioactivity of product radionuclide at the end of irrad atiorl (cps)
Radioactivity of product radionuclide at time T (cps)
Number of disintegrations of standard solution (dps)
Number of disintegrations of tracer solution (dps)
Fractional isotopic abundance
Ionic strength (solution property)
Stability constant
Solubility product
Observed reaction rate constant (day-’)
Atomic weight (gr/gr-mole)
Molarity
Neutron
Amount of tracer isotope (atoms)
Number of counts of radiation i during counting interval (counts)
Corrected number of counts (counts)
Minimum number of counts (counts)
Observed number of counts (counts)
Negative logarithm of the hydrogen ion concentration
Negative logarithm of the ionization constant
xi
PPm t
t'
T
It2 T W
W min
W std
W
Z
fr
Parts per million
Elapsed time from the end of irradiation to the start of c.ounting (sec)
Counting period (sec)
Temperature ("C)
Half life (time)
Weight of target element (gr)
Minimum weight of target element (gr)
Weight of target element in standard solution (gr)
Weight of target element in tracer solution (gr)
Atomic number
Greek Symbols
P- Beta particle
Pn Overall stability constant
Y Gamma radiation (MeV)
E Counting efficiency
0 Neutron capture cross section (cm')
Standard deviation
Standard error of the mean
Length of irradiation period (sec)
ON
0-
z
h Decay constant (sec-'1
5 Degree of advancement
0 Neutron flux (neutrons/cm2sec)
N
xii
CHAPTER 1
INTRODUCTION
1.1. OVERVIEW
Reinjection of thermally spent geothermal brines is attracti7.e for two distinct
advantages. For environmental protection, it provides disposal c If hatzardous waste
brines which cannot be discharged to surface waters. For operaional efficiency, it
serves to maintain reservoir pressure and enhance thermal energy recavery from the
reservoir formation. However, uncertainties exist about the long-term patential of rein-
jection, such as the possibility of permeability reduction, inducement of seismic events,
and the reduction of discharge enthalpy by initial breakthrough of cooled recharge fluid
causing losses in steam production. Commercial scale reinjection in mar$ of the exist-
ing liquid-dominated geothermal fields has proven that reinjectic n is a satisfactory
means of disposal of geothermal effluents as well as beneficial for nxycllng both water
and heat.
In a homogeneous reservoir, the advancing waste water can rxover most of the
heat stored in the formation rock. In a heterogeneous reservoir, t ie cold water may
follow preferential flow paths. If the fluid residence time is sma 1 coinpared to the
heat transfer time, much of the heat stored in the rock is bypas;ed causing colder
water breakthrough to the production zone. Since most geothermid fields are highly
fractured, detailed investigation of internal reservoir structure aiid flow paths are
important, particularly, where reinjection is being used to sustain the reservoir pres-
sure.
-1-
Traditional reservoir engineering tests identify fractures but cannot pr, wide means
of detection and evaluation of preferential path networks. Tracer tests, htiwemr, can
accomplish this purpose successfully. The usual tracing procedure is io in]ect an
external tracer into a reinjection well and to monitor tracer concentrations c ontinuously
in the geothermal fluid at the production wells. Such tests have been pxfortned in
Otake and Hatchobaru (Hayashi et al., 1978), Onuma (It0 et al., 1978), ‘Be Geysers
(Gulati et al., 1978), Kakkonda (Home, 1982), and Svartsengi (Gudmunclsson et al.,
1984).
The breakthrough time of the injected tracer and the long term tracer 1.ecovpy are
important information for determining flow characteristics of a geotherm il re$ervoir.
The fist identification of the external tracer represents the arrival of reinjected fluid.
The data are used to evaluate the speed of return as well as to estimate the geotihmal
reservoir permeability. For example, a slow return between injector aitd pmducer
wells denotes a low formation permeability with no preferential flow pzth network.
Early tracer arrival is attributed to dispersion caused primarily by the cmcedtration
gradient. If the produced tracer is recycled, the volume of the circulating fluid can be
estimated from the long term dilution of the tracer (Home, 1981).
1.2. CONVENTIONAL TRACERS
The term tracer generally signifies a material whose property or charac:teristi that
makes it possible to follow the dynamic behavior of a similar material i i a $owing
system. Tracers are categorized as either internal or external. Internal tracc:rs are indi-
genous to the system under study, whereas external tracers are deliberztely added.
Tracers are categorized as: chemical, radioactive, and activable materials.
Internal Tracers
Internal tracers are stable or radioactive elements which occur natu-ally in the
system being traced. Such tracers are ideal for geothermal systems but their direct
-2-
measurement is either difficult or impossible (Mazor, 1977; Mlzor and Truesdell,
1984).
Radon-222, a radioactive noble gas element that originates f-om the radioactive
decay of Radium-226, is naturally distributed in all geothermal fluids. Radon concen-
trations were measured in liquid-dominated geothermal fields in 1 iairakei, New Zeg-
land and Cerro Prieto, Mexico, as well as in the vapor-dominated field The Geyser$,
U.S.A. The results of these studies were significant for the detenrinatibn of flow and
thermodynamic characteristics of the geothermal reservoirs (Semprii ii, 198 1).
Chemical Tracers
Chemical tracers are detected by chemical analysis and have limitations of ther-
mal instability, potential reactivity, and high natural background. Betause of these
limitations, large quantities are needed to assure detectable concentratidns of tracer at
the sampling location. Alkali halides, potassium iodide (KI) and potasium bromide
(KBr) have less of a tendency for interaction with the reservoir f mnation, and havie
been used successfully in several Japanese geothermal reservoirs (H~rne, 1982).
Fluorescent dyes are organic pigments whose molecules can bt: excited to fluores-
cence at wavelengths of 480-560 millimicrons. Preparation and handling of fluorescent
tracers are simple and experiments with several colors can be performed simultans
ously. Fluorescence detection can be achieved by fluorometers with high sensitivity
(Channell, 1970). The most reliable fluorescent tracers are Uranine, Eosine, Amidorhoi
damine, and Rhodamine WT. These dyes are useful under ground ~ ~ a t e r reservoir con-
ditions, but are likely to break down and lose their fluorescent propc:rties at geothermal
reservoir temperatures. The instability of Rhodamine WT at geothermal reservoir tern-
peratures has been demonstrated experimentally by Al-Riyami (198t ). Also, fluorescent
tracers are sensitive to pH changes and are easily absorbed by reservoir formations.
Fluorescein dyes were used at Hatchobaru for identification of post ible reservoir then
mal breakthrough problems (Home, 1982). It was reported that th: fluwescent tracer
-3-
tests provided important data on first arrival times, Rhodamine WT was used in a
tracer test carried out in Klamath Falls, Oregon (Gudmundsson et al., 1983). The
results were used to study the injection behavior of a geothermal reservoir Imown to be
fractured.
Radioactive Tracers
Radioisotopes are available in wide selections according to materi d property,
radiation energy, and half-life. The radioisotope can be incorporated into a i wide
variety of organic and inorganic compounds and so there is great flexibilio of applica-
tions. Radioactive tracers are easy to measure continuously by their emittej gamma or
beta radiation with great sensitivity and negligible interference. Theoretica .ly, radioac-
tive tracers are capable of providing all the results obtainable with fluores1:ent tracers,
but the reverse is not true. The major drawback of the radioactive tracer xxhnique is
the safety hazard to the operators, population and environment. Althougf reasonable
precautions may be taken for the use of radioactive tracers in subsurface reservair test-
ing, the public reaction has generally been one of fear and mistrust.
Tritium, in the form of tritiated water, is considered the best tracer available for
vapor-dominated geothermal fields. Tritiated water travels with the san le velocity,
boils and changes phases like normal water. Tritium is less expensive tharl most
radioisotopes but is more difficult to measure, because its low radiation ene gy requires
sophisticated detection equipment. Tritium tracer surveys were conduc ted at The
Geysers for the determination of regional flow pattern of reservoir fluid ani efficiency
of water vaporization (Gulati et al., 1978). Radioactive tracers, 8.04-day Iodine-131
and 35.4-hour Bromine-82, have been used effectively in geothermal stuc lies in The
Philippines, El Salvador and the U.S.A. (Home, 1984); as well as in Wairakei and
Broadlands, New Zealand (McCabe, 1983).
-4-
in several countries including Sweden, Finland, Germany, Italy, Peru, Russia, Canada
and the United States.
Indium occurs in minerals either as an isomorphous replacement for other ele-
ments of similar ionic radii or as structural member of the principal mineral. Indium
is concentrated up to 0.1 percent in some minerals of zinc, copper, iron as well as in
several hydrothermal minerals. Also It becomes concentrated in various byproducts
during recovery of other metals, principally zinc and lead. Indium content in minerals
which are structurally dominated by iron has been observed to be higher than its nor-
mal abundance. The higher the iron concentration the higher the degree of indium
concentration. However any given mineral, even from the same deposit, could contain
different indium content if formed under different conditions. Therefore, indium
mineral content is strongly affected by depositional conditions &inn and Schmitt,
1972).
Numerous investigators have detected indium in minerals and rocks. The most
complete study of indium distribution has been conducted by Shaw, D. M. (1952),
who examined specimens from different geological materials. A spectrochemical
method of analysis was used with sensitivity of the order of 0.02 ppm and 220% pre-
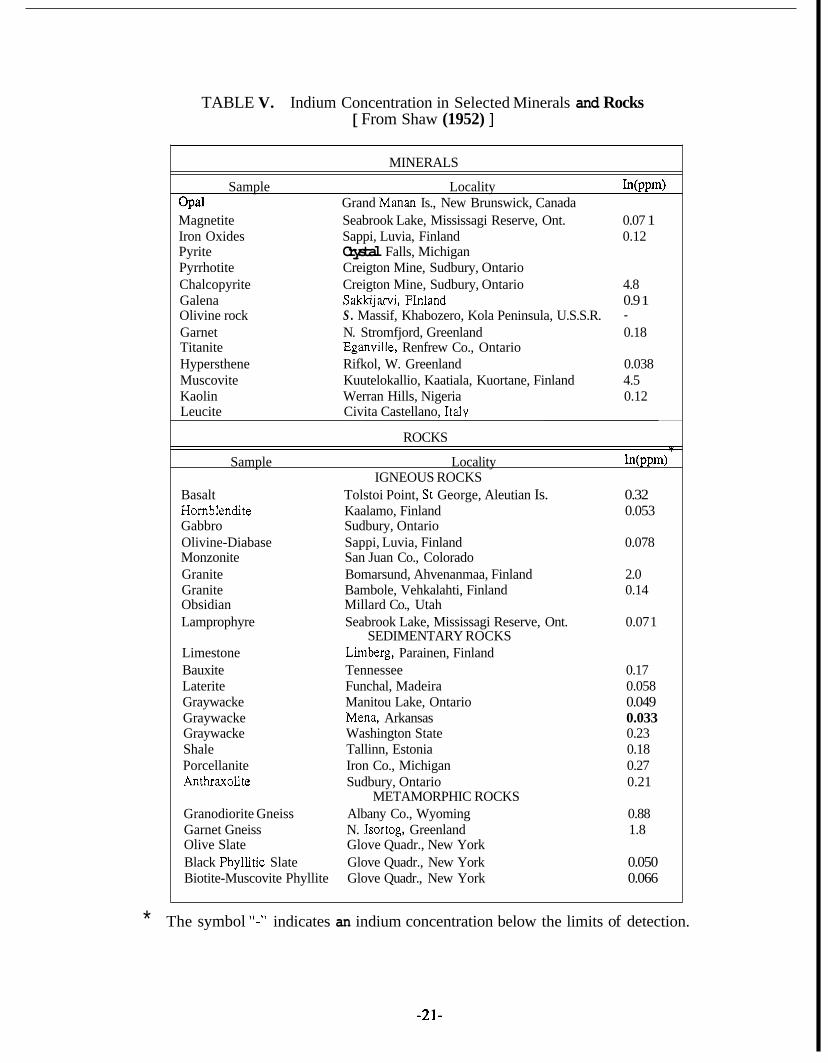
cision. Selected minerals and rocks with their indium concentrations are presented in
Table V for comparative purposes. The uniformly poor concentration of indium in all
of the common minerals and rocks confirms its low crustal abundance of 0.11 ppm.
The concentration of indium in soils ranges from 0.01 to 4 ppm. Indium concen-
tration in ambient air ranges from 5 . 3 ~ 1 0 - ~ ng/m3 to 43 ng/m3 depending on the site’s
mining activity and industrialization. Rain waters from nonindustrial areas have been
found to contain 0.002 to 2 ppb indium. Hot spring waters in Bulgaria were reported
to contain up to 40 ppb indium (Smith et al., 1978). Indium concentration in Pacific
Ocean water was found to be 4 ppt (Chow and Snyder, 1969), while its concentration
-20-
TABLE V. Indium Concentration in Selected Minerals and Rocks [ From Shaw (1952) ]
Pyrite Crystal Falls, Michigan Pyrrhotite Creigton Mine, Sudbury, Ontario Chalcopyrite Creigton Mine, Sudbury, Ontario 4.8 Galena Sakkijarvi, FInland 0.9 1 Olivine rock S . Massif, Khabozero, Kola Peninsula, U.S.S.R. - Garnet N. Stromfjord, Greenland 0.18 Titanite Eganville, Renfrew Co., Ontario Hypersthene Rifkol, W. Greenland 0.038
Grand Manan Is., New Brunswick, Canada
Iron Oxides Sappi, Luvia, Finland 0.12
Muscovite Kuutelokallio, Kaatiala, Kuortane, Finland 4.5 Kaolin Werran Hills, Nigeria 0.12 Leucite Civita Castellano, Italy
~~
ROCKS +
Sample Locality In(PPm) IGNEOUS ROCKS
Basalt Tolstoi Point, St George, Aleutian Is. 0.32 Hornblendite Kaalamo, Finland 0.053 Gabbro Sudbury, Ontario Olivine-Diabase Sappi, Luvia, Finland 0.078 Monzonite San Juan Co., Colorado
Granite Bambole, Vehkalahti, Finland 0.14 Obsidian Millard Co., Utah Lamproph yre Seabrook Lake, Mississagi Reserve, Ont. 0.07 1
Limestone Limberg, Parainen, Finland Bauxite Tennessee 0.17 Laterite Funchal, Madeira 0.058 Graywacke Manitou Lake, Ontario 0.049 Graywacke Mena, Arkansas 0.033 Graywacke Washington State 0.23 Shale Tallinn, Estonia 0.18 Porcellanite Iron Co., Michigan 0.27
Granite Bomarsund, Ahvenanmaa, Finland 2.0
SEDIMENTARY ROCKS
AntlUaXOli te Sudbury, Ontario 0.21 METAMORPHIC ROCKS
Granodiorite Gneiss Albany Co., Wyoming 0.88 Garnet Gneiss N. Isortog, Greenland 1.8 Olive Slate Glove Quadr., New York Black Phyllitic Slate Glove Quadr., New York 0.050 Biotite-Muscovite Phyllite Glove Quadr., New York 0.066
* The symbol ”-” indicates an indium concentration below the limits of detection.
-21-
in Atlantic Ocean water was reported to be 0.1 ppt (Matthews and Riley, 1970).
Uses
The first commercial use of indium was in 1934 as an ingredient of dental alloys.
Small amounts of indium increase the strength and ductility of dental solders and
orthodontic wires. Jewelry coatings and decorative arts have been using indium be-
cause of its color. Bearing manufacturing for military airplanes during the World War
I1 was a major consumer of indium. Indium bearings showed scarcely any corrosion
and good fatique resistance (Forrester, 1964). Low-melting alloys of indium are used
in meltable safety devices such as heat regulators, sprinklers, and other fire safety sys-
tems. Some indium alloys have the ability to wet glass and are being used for glass-
to-glass seals. Indium has found applications in semiconductors, transistors, mi-
crowave oscillators, amplifiers, piezoelectric units, infrared detectors, Touch Tone tele-
phones, and in several other products of the electronics industry (Rees and Gray, 1976;
Chynoweth, 1976). In the field of nuclear energy indium is employed in control rods
for nuclear reactors because of its large thermal neutron cross-section (Belous, 1974).
Petroleum industries use indium in some conventional catalysts to increase the concen-
tration of aromatics of gasoline and thus to reduce the knocking tendency of petroleum
products in internal combustion engines (Burke, 1972).
Chemical Properties and Aqueous Chemistry
The electron configuration of indium is 1s' 2s' 2p6 3s' 3p6 3d" 4s' 4p6 4d" 5s' 5p'.
Its first, second and third ionization potentials are 5.79, 18.79 and 57.8 eV, respective-
ly. The element exhibits positive oxidation states from one through three, but the
common valence is three.
Indium(II1) is stable in aqueous systems, while the monovalent and divalent indi-
um may exist in aqueous solutions at low concentrations but they are more often found
is solid halide compounds. In acidic solutions In3' is coordinated by six water
-22-
molecules. The anhydrous InF3 is not affected by water, while the anhydrous InC13
and InBr3 are quite soluble in both water and organic solvents. The binary compounds
of monovalent indium are insoluble solids and in aqueous solutions undergo dispropor-
tionation to give indium metal and In3+ (Carty and Tuck, 1975).
Weak mineral acid solutions dissolve indium slightly. The dissolution rate is in-
creased by heating the mineral acid, but this causes indium salt formation and evolu-
tion of hydrogen. Cold nitric acid dissolves the metal slowly, rapidly when heated
with formation of nitrogen oxides. Cold sulfuric acid dissolves the metal with evolu-
tion of hydrogen and precipitation of anhydrous indium. With hot sulfuric acid, sulfur
dioxide is evolved. Hydrochloric and oxalic acid dissolve the metal rapidly with evolu-
tion of hydrogen. The metal is not affected by dry air at normal temperatures, but
when in contact with water, some hydroxide formation occurs.
Indium(II1) appears to form all of its hydrolysis products rapidly and reversibly.
According to Biedermann (1956) the hydrolysis of the hydrated In3+ can be described
by the following equations:
In3+ + H 2 0 + InOH2+ + H+
= -4.42 k 0.05 [ZnOH2+] [H+] [zn3+]
log K1,J = log
(2.11)
Rossotti and Rossotti (1956) determined the mononuclear hydrolysis constants of indi-
um by examining the distribution of indium-2-thenoyltrifluoroacetone complex between
benzene and aqueous 3M sodium perchlorate solutions. The reported values of the hy-
drolysis constants are in agreement with those obtained potentiometrically by Bieder-
mann (1956), and their value of K = seems more realistic. Baes and Mesmer
(1976) obtained a value of K : 1 3
1 2
-23-
(2.13)
In(OH), is fairly stable and only slightly soluble in excess base. The solubility product
of In(0H) has been recommended by Feitknecht and Schindler (1963) to be: 3
From a subsequent study, Ferri (1972b) investigated the hydrolysis equilibria of
the indium chloride complex species. The chloride bearing products in the pH range
2.7 - 3.4, where hydrolysis occurs, were attributed to the formation of the following
equilibria
The main hydrolysis product were assumed to be the species I n C l O p . This sugges-
tion was criticized by Baes and Besmer (1976) who have estimated that InOHCf dom-
inate over a wide range of chloride concentrations near pH 5.
2
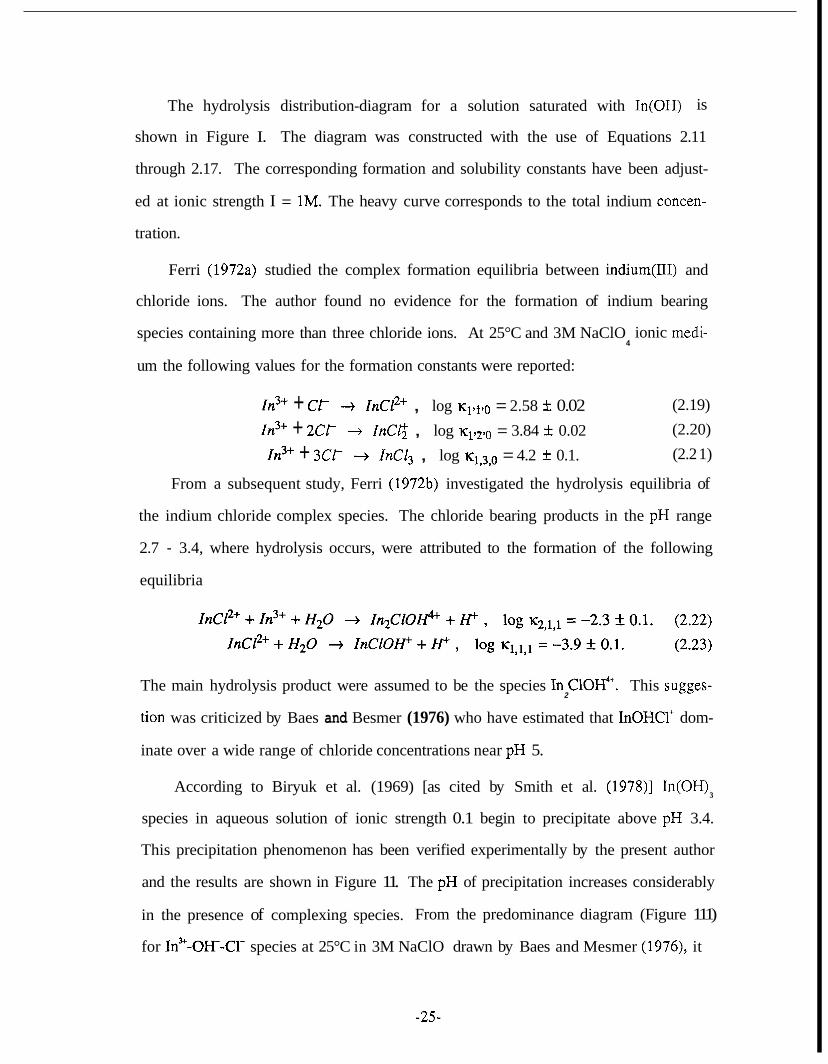
3 According to Biryuk et al. (1969) [as cited by Smith et al. (1978)l In(0H)
species in aqueous solution of ionic strength 0.1 begin to precipitate above pH 3.4.
This precipitation phenomenon has been verified experimentally by the present author
and the results are shown in Figure 11. The pH of precipitation increases considerably
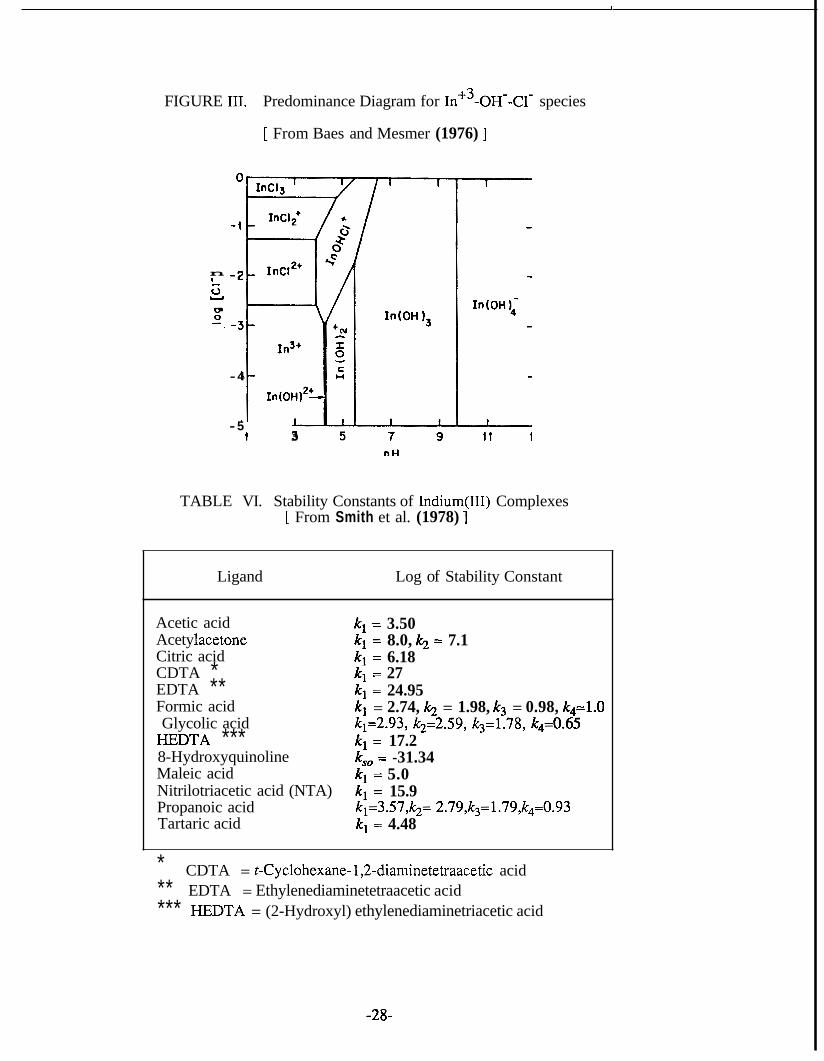
in the presence of complexing species. From the predominance diagram (Figure 111)
for In9-OH-Cl- species at 25°C in 3M NaClO drawn by Baes and Mesmer (1976), it
-25-
0 a I
n M
m (D
0
a 0 (D L a
C 3 0 E
Y
t
t .- .-
t
a
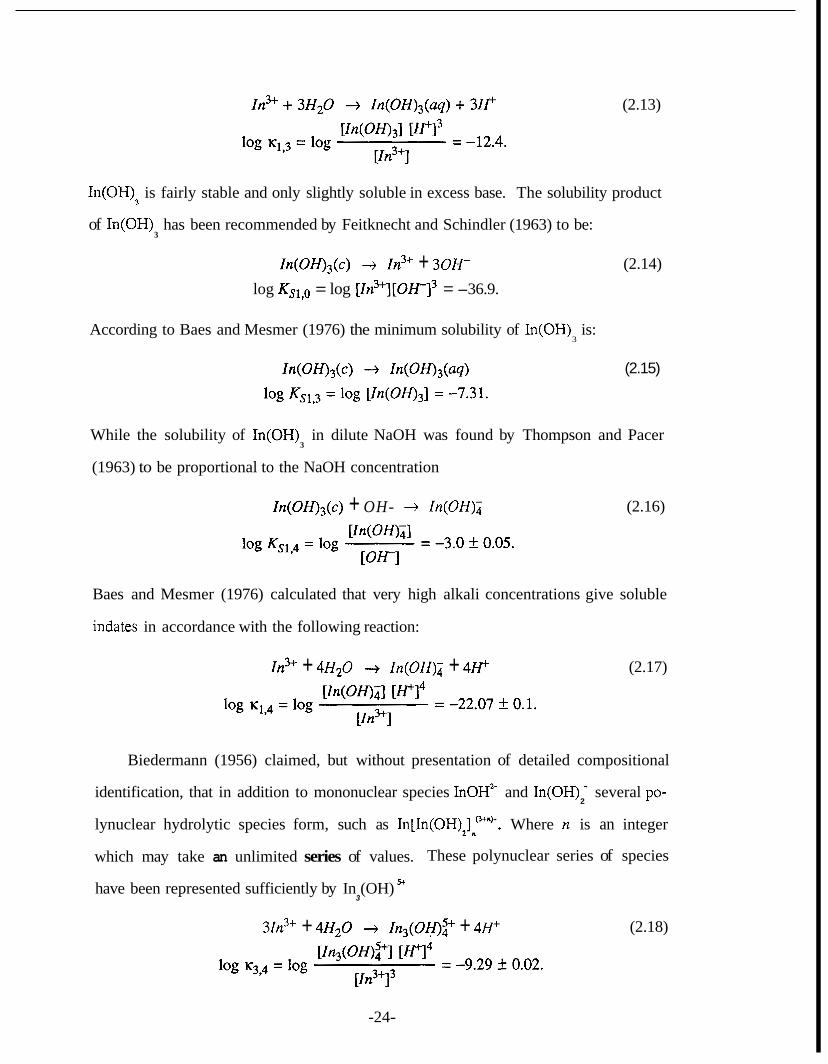
FIGURE I. Distribution Diagram of Indium Hydrolysis
o In (OH)$+
0 I&+
T = a~ c e = in!+ I In
d IntOH); 0 InlOH)3 f ln(DH);
0 2 4 6 8 10 12 14
PH
FIGURE 11. Precipitation Region of In+3
1 2 3 4 5 6 7 8
PH
-26-
is clear that chloride retards hydrolysis, and precipitation occurs in the pH range 5.5 - 9.8. In concentrated chloride solutions polynuclear species of unknown composition
are formed. These species are assumed to be In (OH) C1”. 2 2 2
The most common insoluble indium compounds are In2S3, In(OH)3, In2(C03)3,
In [Fe(CN) 3 , In(CN) , In (C 0 ) , InOH(C H 0 ) , 1nIO3, hP04 and In(oxinate)3.
There are two modifications of indium(II1) sulfide. a-In2S3 which is stable up to
‘330’C and the fairly stable p-In2S3 which dissolves in strong mineral acids in excess
of ammonium and alkali metal sulfides (Smith et al., 1978).
4 6 3 3 2 2 4 3 2 3 2 2
Separation of indium by sulfide precipitation has very limited applicability in ra-
diochemical separations because of its high contamination from other tracer activities
(Sunderman and Townley, 1960). Indium hydroxide is precipitated when NHOH is
added into the solution, but this process carries along traces of metals which are solu-
ble in dilute ammonia. Ferric, magnesium and bismuth hydroxides can be used as car-
riers for indium. Behrens et al. (1977) investigated groundwater flows with indium-
EDTA tracer. They used bismuth hydroxide as coprecipitation carrier as well as a
displacing reactant. They observed that 99% of the indium was found in the precipi-
tate when 1 ml of concentrated HSO and 2 ml bismuth solution were added in 100
ml water sample in addition to 10 rril 5 N ammonia. Indium basic acetate is precipi-
tated when sodium acetate is added into a boiling indium solution. Also, 8-
hydroxyquinoline precipitates indium from a neutral solution as In(oxinate)3. This pre-
cipitation method has been used in several radiochemical procedures for indium con-
centration prior to counting (Sunderman and Townley, 1960).
4
2 4
Several complexes of indium have been reported in the literature. Some of the
most widely used complexes of indium(1II) with organic ligands and their stability
constants in aqueous solutions are given in Table VI. Insoluble indium chelates are
employed in precipitation reactions, while other chelates soluble in organic solvents are
employed in solvent extraction procedures,
-27-
FIGURE III. Predominance Diagram for III+~-OH--C~- species
[ From Baes and Mesmer (1976) ]
n
V L u
- 4
- 5 1 3
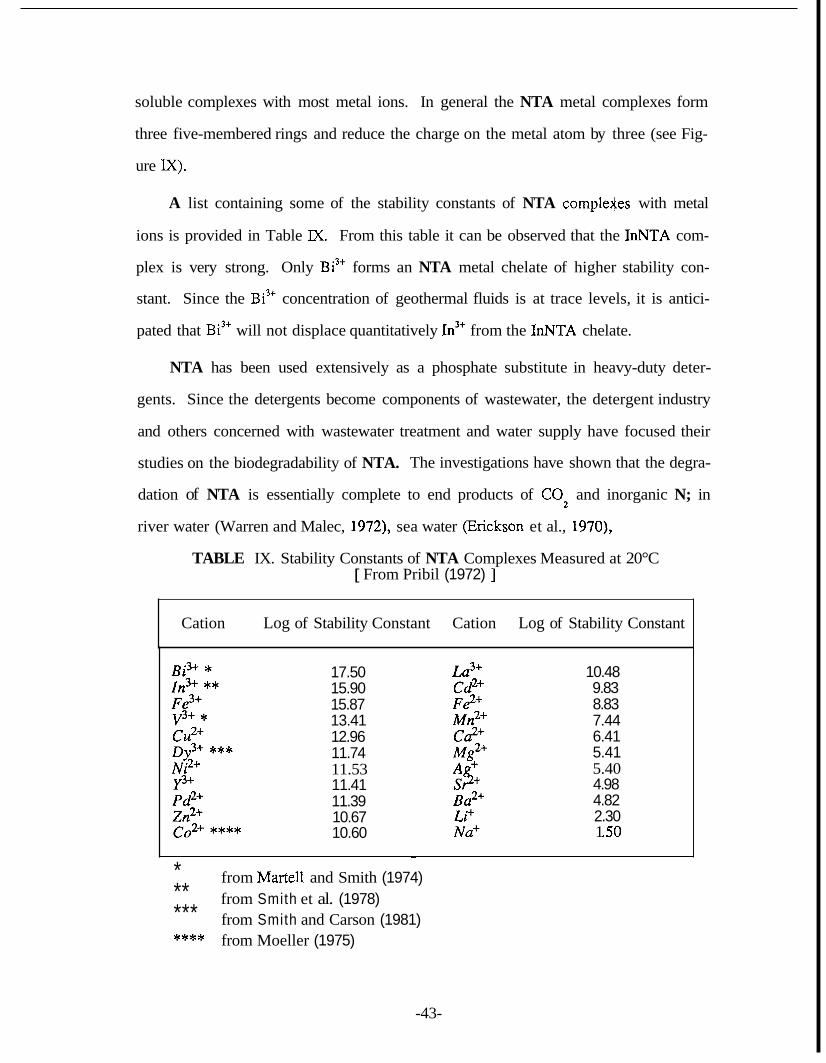
TABLE VI. Stability Constants of Indium(II1) Complexes [ From Smith et al. (1978) ]
* ** EDTA = Ethylenediaminetetraacetic acid *** E D T A = (2-Hydroxyl) ethylenediaminetriacetic acid
CDTA = t-Cyclohexane- lY2-diaminetetraacetic acid
-28-
Liquid-Liquid Extraction
Extraction is the process of transferring a solute between two immiscible solvents.
In inorganic chemical analysis, one solvent is usually water and the other solvent is a
suitable organic liquid.
Solvent extraction has been convenient and effective means for separating indium
from aqueous solutions. Sunderman and Townley (1960) summarized the early work
of several investigators involving extraction of indium halides in diethyl-ether and
isopropyl-ether, extraction separation of indium from gallium with cyclohexanone, as
well as extraction of chelate complexes of indium-acetylacetone into acetylacetone and
indium-diethyldiocarbamine into chloroform or carbon tetrachloride.
According to De and Sen (1967) indium is completely extracted with 100 percent
tributylphosphate (TBP) from 6-8M hydrochloric acid. Most of the coextracted ions
can be removed by repeated scrubbing with 6M hydrochloric acid. Irving and Damo-
daran (1970) reported that indium is extracted with 1,2-dichloroethane from tetra-n-
hexylammonium. Lee and Burrell (1 972) extracted trifluoroacetylacetone metal
chelates from sea water medium. They reported that iron and indium form coordina-
tion saturated chelates with trifluoroacetylacetone and that they extract excellently into
toluene from sea water. The major drawback of chelate extraction of indium into or-
ganic solvents is that a number of other metals extract as well under the same condi-
tions.
Stary and Hladky (1963) found that trivalent indium is quantitatively extracted by
0.1M solutions of acetylacetone, benzoylacetone and dibenzoylmethane in benzene.
The extraction constants and the two-phase stability constants of 30 metal p- diketonates were calculated by the investigators. These constants are useful for the
selection of the required separation conditions for the removal of indium from other in-
terfering metals.
solvent mixtures
Similarly, indium can be extracted from hydrochloric acid into binary
containing isobutil methyl ketone and any common cEiluent (Irving
-29-
and Lewis, 1967). According to Lyle and Shendrikar (1965), indium up to 1000 ppm
can be extracted with n-benzoyl-n-phenylhydroxylamine (BPHA) and chloroform from
0.05M acetic acid-acetate buffered solutions. Also, it has been reported that chloro-
form can extract efficiently indium- 1-(2-pyridylazo)-2-napthol chelate (usually abbrevi-
ated as In-PAN) (Shibata, 1961).
Ion Exchange Behavior
The general behavior of the ion exchange of indium is not available, but its main
ion exchange characteristics can be demonstrated by the numerous applications involv-
ing indium ions found in literature.
It has been demonstrated that anion exchange of metal complexes is a powerful
tool for the separation of ions, as well as for the study of complexing reactions. An-
dersen and Knutsen (1962) studied the adsorption of indium to anion exchanger
Dowex 1 (200-400 mesh) from HBr and HCl solutions. It was found that h is ad-
sorbed strongly in HBr solutions contrary to HC1 solutions. Also, the adsorption of In
in HBr rises rapidly with increasing acid concentration. Detailed analysis of the species
involved was not presented but it was concluded that indium prefers to form bromo-
complexes rather than chloro-complexes, and that bromide ions are adsorbed more
strongly than chloride ions on the Dowex 1 resin. The anion exchanger Dowex 1 has
also been used by Korkisch and Hazan (1964) for the chromatographic separation of
Al, Ga and In in hydrochloric acid-acetone and hydrochloric acid-2-methoxyethanol
mixtures. Since the distribution coefficients are not very high under the experimental
conditions employed, long columns have to be used. Wodkiewicz and Dybczynski
(1974) found that indium is adsorbed on anion exchanger Amberlite IRA-68 only at
HBr concentrations greater than 4M. The calculated adsorbability of indium on Am-
berlite IRA-68 in the bromide system is lower than the reported adsorbability on
Dowex 1 resin in a similar system. Dybczynski et al. (1977) investigated the effect of
degree of resin crosslinking on the anion exchange of indium phosphate complex,
-30-
[In(HPO ) 13-, on Dowex 1. It was concluded that lightly crosslinked resins are best
for separations of large ionic complexes. 4 3
Less information has been reported concerning cation exchange than anion ex-
change separations of indium. According to Strelow and Victor (1971) Al, Ga, In and
TI can be separated without tailing with 100 percent recoveries from AG50W-X8
(200-400 mesh) cation exchange resin with hydrochloric acid-acetone mixtures. The
reported cation exchange distribution coefficients compare favorably with analogous
coefficients obtained with Dowex 1 anion exchange resin. From a subsequent study,
Strelow (1980) prepared an elution curve for a mixture of In, Ga and Co. The author
claimed that indium and other elements which have a strong tendency to bromide com-
plex formation can be eluted with 0.5M hydrobromic acid in 86 percent acetone from
AG50W-X4 cation exchange resin. Riley and Taylor (1968) conducted studies on
trace element concentration from sea water. They achieved 100 percent total recovery
of indium with Chelex-100 (50-100 mesh) ion exchange column and 2 N nitric acid as
eluant. Muzzarelli et al. (1970) conducted separations of trace elements from sea wa-
ter brine and sodium and magnesium salt solutions by the natural chelating polymer
Chitosan. The eluting agent used was 0.1 N EDTA and indium recovery was estimat-
ed approximately 70 percent. This chelating polymer has the advantage that it does
not appreciably collect sodium and magnesium but its capability for indium recovery
cannot be favorably compared with the indium recoveries obtained by Dowex A1 or
Chelex-100 resins.
Cation exchange followed by anion exchange separation was employed by
Matthews and Riley (1970) for the determined indium in sea water. Since the concen-
tration of indium in sea water is low, a preconcentration stage is essential. They
selected Dowex A1 (50-100 mesh) chelating ion exchange resin in the sodium form to
investigate the absorbability of indium. It was found that 20 percent of the indium
was retained at pH 7.0, but the efficiency of the retention increased rapidly as the pH
-3 1-
I
was raised. The indium was eluted with 3 M hydrochloric acid. In addition to indium
the eluate contained milligram amounts of sodium, potassium, magnesium and calcium.
These trace elements were removed by passing the eluate from the Dowex A1 column
through a Dowex AG2-X8 (200-400 mesh) column where indium chloro-anions were
retained completely. The column was washed with 3 M hydrochloric acid which re-
moved 98 percent of the alkali and alkaline earth elements present in the original elu-
ate. No indium was removed from the column because its adsorption is optimum at
high acid concentration. The adsorbed indium was recovered by elution of the anion
exchanger with 0.1 M hydrochloric acid. The authors claimed that the two ion ex-
change procedures achieved an overall indium recovery exceeding 98 percent at con-
centration levels of the order of nanograms per liter.
Amphoteric ion exchange resins can also be employed in radiochemical and
analytical separations of indium. Dybczynski and Sterlinska (1 974) achieved separa-
tions of Ga-In-T1 mixtures with the amphoteric ion exchange resin, Retardion llA8.
This resin contains carboxylic and quaternary ammonium exchange groups, and can be
effectively used with metals that can exist both as cations and as anions in solution.
Detection Methods
Several methods have been described in the literature for the determination of in-
dium. The most common detection methods involve anodic stripping voltametry
(Florence et al., 1974), spectrophotometry (Shibata, 1960), polarography (Lin and
Feng, 1984), mass spectrometry (Chow and Snyder, 1969), atomic absorption (Riley
and Taylor, 1968; Rattonetti, 1974; Busheina and Headridge, 198l), and the very sen-
sitive method of neutron activation (Matthews and Riley, 1970; Behrens et al., 1977;
Navada et al., 1981; Drabaek, 1982).
Nuclear Properties
The only two naturally occurring isotopes of indium are with mass numbers 113
-32-
and 115; over 30 radionuclides of indium are known. Several of these isotopes are
formed during the thermal neutron fission of 235U and it is estimated that the uranium
fission in the United States produces approximately 0.05 tons of indium annually. The
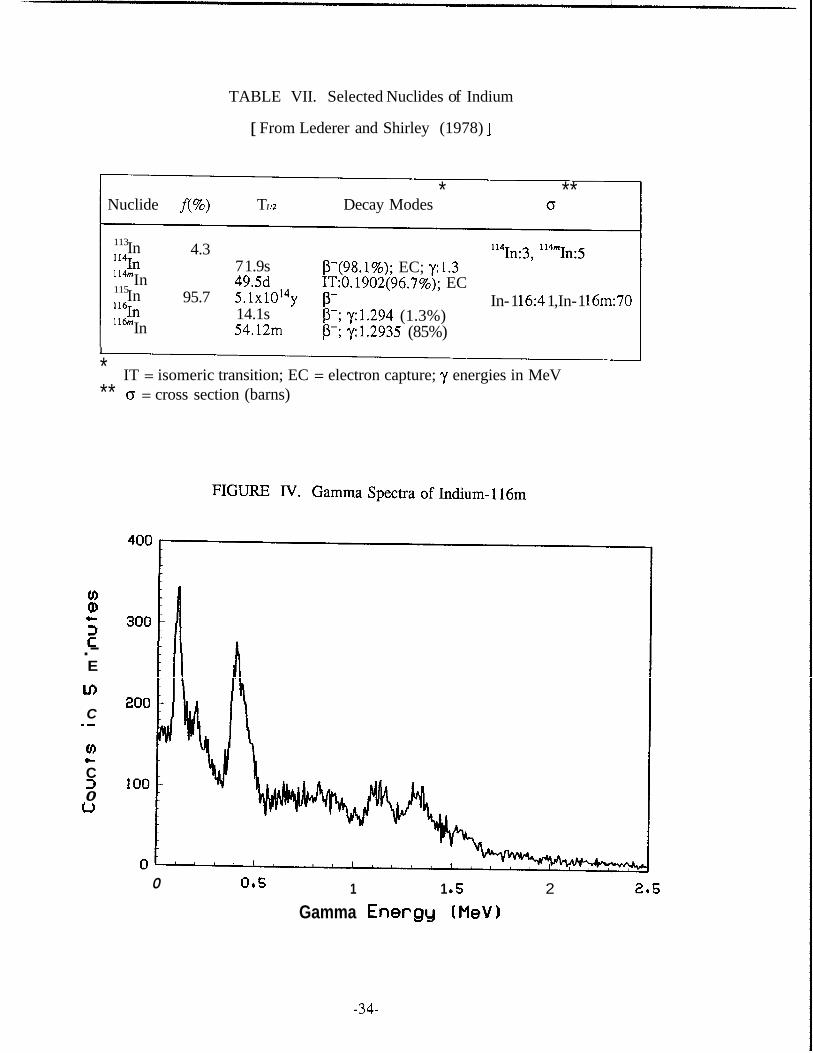
percentage isotopic abundances of the natural isotopes of indium are given in Table
VII, together with their products upon neutron irradiation, their half-lives, some details
of the decay modes, and the radiation emitted with energies in MeV. The cross sec-
tions for ,,In(n,y)':In and ':~In(n,y)"~In reactions are relatively small, 3 and 5 barns
respectively. Also, In has considerably short half-life (71.9 seconds), while '14'"In has
a half-life of 49.5 days which is very long for an activable tracer. In addition to these
unfavorable properties, In has a small isotopic abundance (4.3%); therefore, this na-
tural isotope of indium is not useful for geothermal tracing. On the other hand, the
cross sections for ':;In(n,r>':$ and lEIn(n,y)l'$In reactions are quite large, 41 and 70
barns respectively. The 14.1 second "?In is easily excluded from any tracing applica-
tions because of its extremely short half-life. The unique combination of good isotopic
abundance of ':;In (95.7%) and the fairly good half-life of its activation product (54.12
minute-'lbnIn) is the chief reason that makes indium an excellent activable tracer. The
beta particles emitted from ""In have energies of 1.00 (51%), 0.87 (28%), 0.60 (21%)
MeV and may be radioassayed with a proportional counter. The gamma spectrum of
this isotope (see Figure N) consists of several gamma rays ranging from 0.138 to
2.225 MeV. Its major gamma ray is 1.2935 MeV with an absolute intensity of 85 per-
cent, which makes its detection entirely tractable by scintillation detectors.
113
114
113
-33-
TABLE VII. Selected Nuclides of Indium
[ From Lederer and Shirley (1978) ]
* ** Nuclide f(%) T I I2 Decay Modes o
In '2n
In ""In
113
In 114m
115
In l l h
4.3
95.7
7 1.9s 49.5d 5 . 1 ~ 1 0 ' ~ ~ 14.1s 54.12m
P-(98.1%); EC; y:1.3 1T:O. 1902(96.7%); EC
P-; ~ 1 . 2 9 4 (1.3%) p-; ~1 .2935 (85%)
P-
"?n:3, 114m~:5
In- 1 16:4 1 ,In- 1 161~70
I
* IT = isomeric transition; EC = electron capture; y energies in MeV ** o = cross section (barns)
v) Q)
3 C
E
c
.-
C .- v)
C 3 0 u
t
1 1 e 5 2 2.5 0 0.5
Gamma Energy ( M e V )
-34-
2.4. CHELATES
Most metal ions are capable of sharing electron pairs with a nonmetal atom hav-
ing a free electron pair to form a coordination bond. However, it isn’t uncommon for
metal ions to contribute electrons to the bond as they do in n: bonding. Therefore for
simplicity purposes, any negative ion bound to a metal atom is customarily called a
ligand and the bond between them a metal-ligand bond. If a specie is capable of at-
taching itself to a metal ion through more than one donor atom to produce a cyclic
ring type of arrangement, it is known as chelating agent (Brady and Humiston, 1975).
The complex is called a chelate and its properties are influenced to a considerable ex-
tent by the nature and oxidation state of the central metal atom.
Chelating agents are polyprotic acids, and usually only the fully deprotonated
form of the acid gives complexes with the metal ion. This implies that the formation
of chelate complexes is affected by the acidity of the solution, and that the chelate sta-
bility is strongly enhanced in basic solutions. In such solutions most metals precipi-
tate. Therefore, a buffer medium acting as a subsidary complexing agent must be pro-
vided in order to prevent the precipitation of the hydroxide (Butler, 1964).
Metal chelates are inherently more stable than closely related nonchelate com-
plexes and their equilibrium relationships are written as formation rather than as disso-
ciation reactions. Chelates are usually developed by combination of stepwise reac-
tions:
M + L + M L ML+L+ML,
.............. ML,1 + L 3 ML,
where
M = metal
L = ligand.
-35-
(2.24)
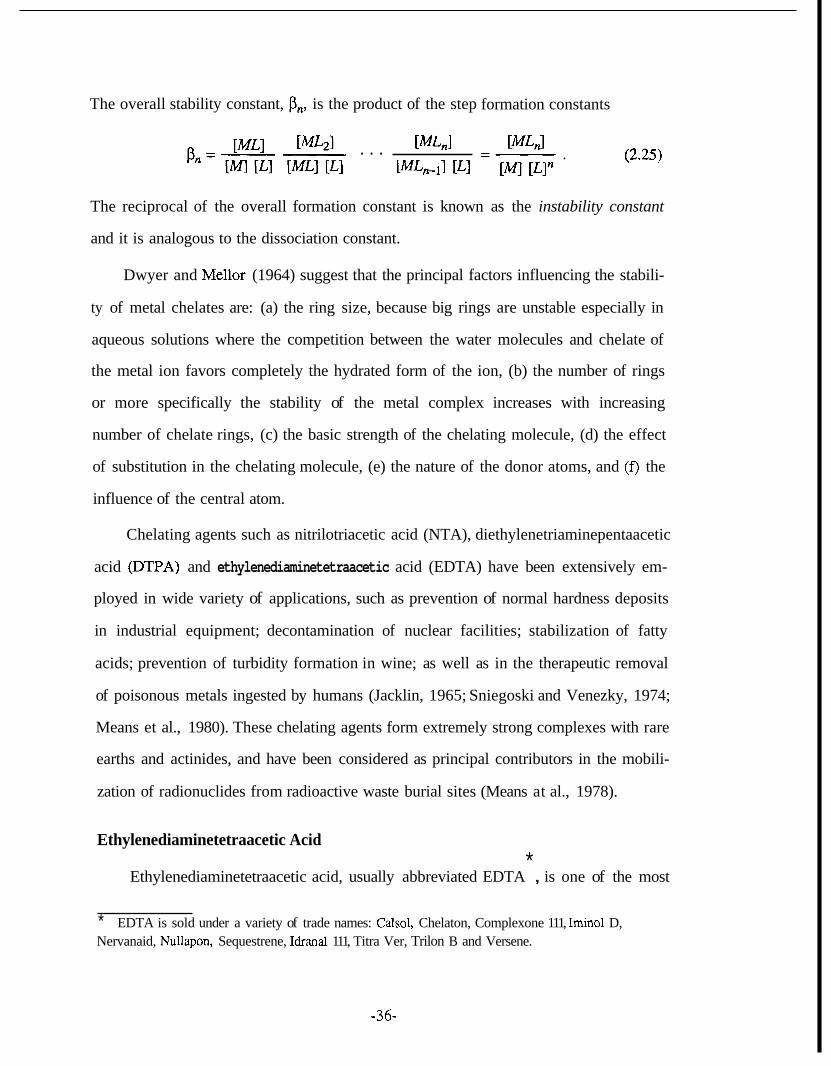
The overall stability constant, Pn, is the product of the step
[MLJ [MLn-lI [LI
. . .
formation constants
The reciprocal of the overall formation constant is known as the instability constant
and it is analogous to the dissociation constant.
Dwyer and Mellor (1964) suggest that the principal factors influencing the stabili-
ty of metal chelates are: (a) the ring size, because big rings are unstable especially in
aqueous solutions where the competition between the water molecules and chelate of
the metal ion favors completely the hydrated form of the ion, (b) the number of rings
or more specifically the stability of the metal complex increases with increasing
number of chelate rings, (c) the basic strength of the chelating molecule, (d) the effect
of substitution in the chelating molecule, (e) the nature of the donor atoms, and ( f ) the
influence of the central atom.
Chelating agents such as nitrilotriacetic acid (NTA), diethylenetriaminepentaacetic
acid @ P A ) and ethylenediaminetetraacetic acid (EDTA) have been extensively em-
ployed in wide variety of applications, such as prevention of normal hardness deposits
in industrial equipment; decontamination of nuclear facilities; stabilization of fatty
acids; prevention of turbidity formation in wine; as well as in the therapeutic removal
of poisonous metals ingested by humans (Jacklin, 1965; Sniegoski and Venezky, 1974;
Means et al., 1980). These chelating agents form extremely strong complexes with rare
earths and actinides, and have been considered as principal contributors in the mobili-
zation of radionuclides from radioactive waste burial sites (Means at al., 1978).
Ethylenediaminetetraacetic Acid *
Ethylenediaminetetraacetic acid, usually abbreviated EDTA , is one of the most
* EDTA is sold under a variety of trade names: Calsol, Chelaton, Complexone 111, Imino1 D, Nervanaid, Nullapon, Sequestrene, Idranal 111, Titra Ver, Trilon B and Versene.
-36-
1 1
common chelating agents used in analytical chemistry as a titrant for metal ions,
EDTA is a white anhydrous crystalline solid with a melting point of 24OOC. It is al-
most insoluble in water as well as in absolute acetone, ethanol and ether, but it is
readily soluble in inorganic acid solutions (Garvan, 1964). However, the mono-, di-,
tri- and tetrasodium salts of EDTA increase in water solubility with increasing tem-
perature.
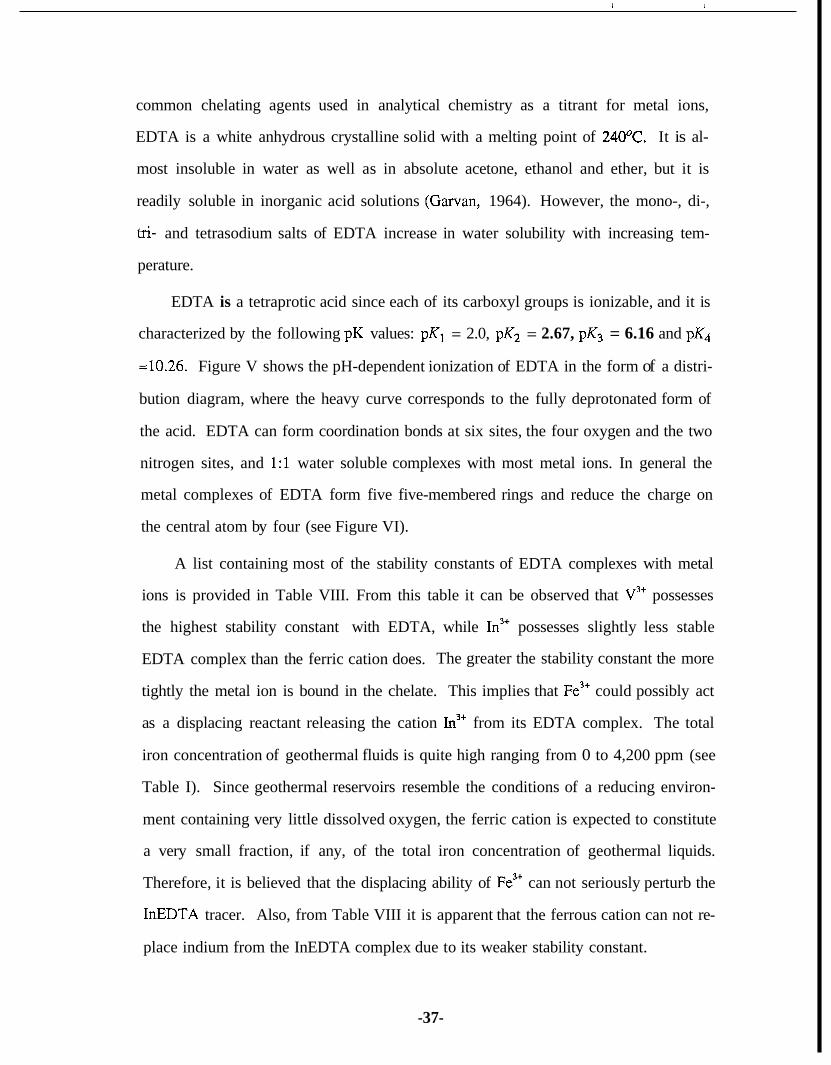
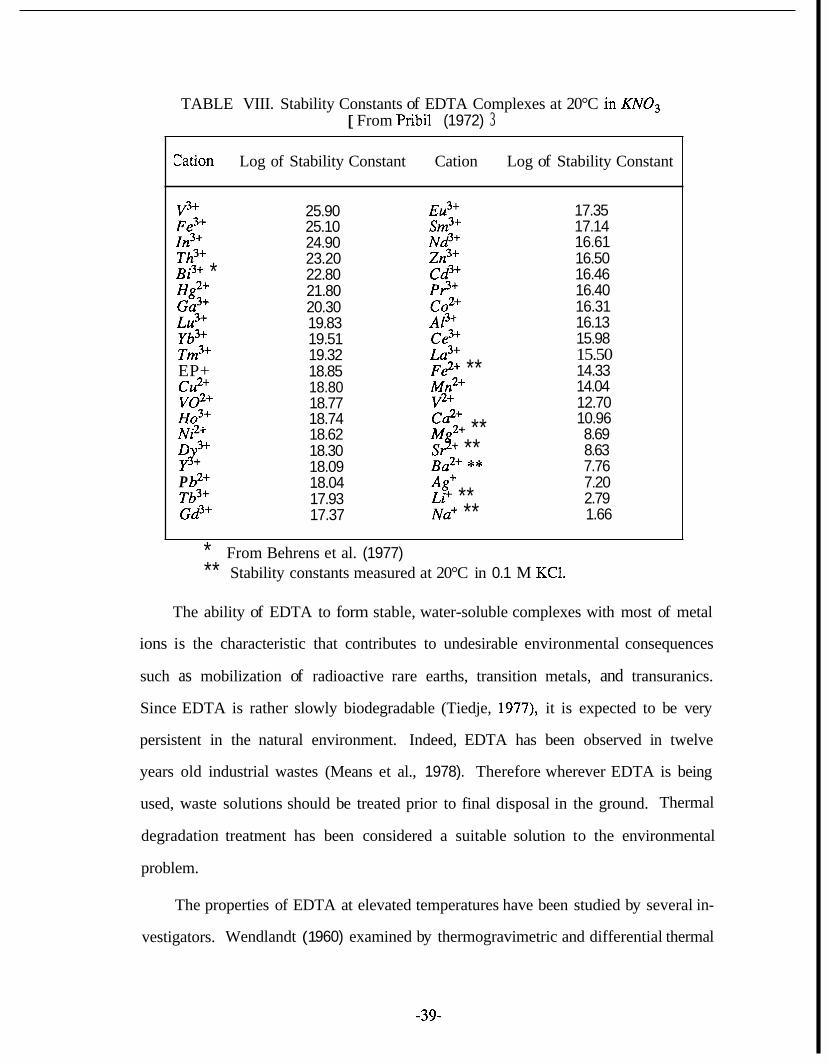
EDTA is a tetraprotic acid since each of its carboxyl groups is ionizable, and it is
characterized by the following pK values: pK, = 2.0, pK2 = 2.67, pK3 = 6.16 and pK4
=10.26. Figure V shows the pH-dependent ionization of EDTA in the form of a distri-
bution diagram, where the heavy curve corresponds to the fully deprotonated form of
the acid. EDTA can form coordination bonds at six sites, the four oxygen and the two
nitrogen sites, and 1:l water soluble complexes with most metal ions. In general the
metal complexes of EDTA form five five-membered rings and reduce the charge on
the central atom by four (see Figure VI).
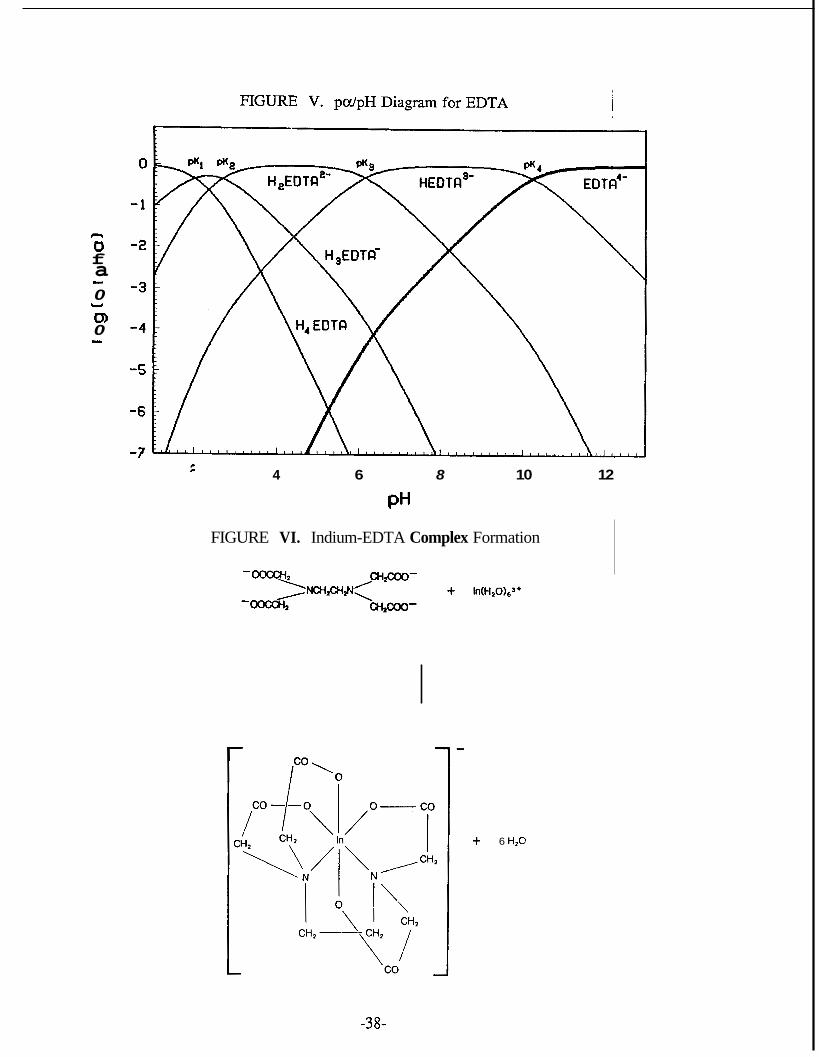
A list containing most of the stability constants of EDTA complexes with metal
ions is provided in Table VIII. From this table it can be observed that V3+ possesses
the highest stability constant with EDTA, while In3+ possesses slightly less stable
EDTA complex than the ferric cation does. The greater the stability constant the more
tightly the metal ion is bound in the chelate. This implies that Fe3+ could possibly act
as a displacing reactant releasing the cation In3' from its EDTA complex. The total
iron concentration of geothermal fluids is quite high ranging from 0 to 4,200 ppm (see
Table I). Since geothermal reservoirs resemble the conditions of a reducing environ-
ment containing very little dissolved oxygen, the ferric cation is expected to constitute
a very small fraction, if any, of the total iron concentration of geothermal liquids.
Therefore, it is believed that the displacing ability of Fe3+ can not seriously perturb the
InEDTA tracer. Also, from Table VIII it is apparent that the ferrous cation can not re-
place indium from the InEDTA complex due to its weaker stability constant.
-37-
n 0 f a 0
0 0
- U
I
4 6 8 10 12
PH
FIGURE VI. Indium-EDTA Complex Formation
6 H,O
-38-
TABLE VIII. Stability Constants of EDTA Complexes at 20°C in KN03 [ From Pribil (1972) 3
Cation Log of Stability Constant Cation Log of Stability Constant
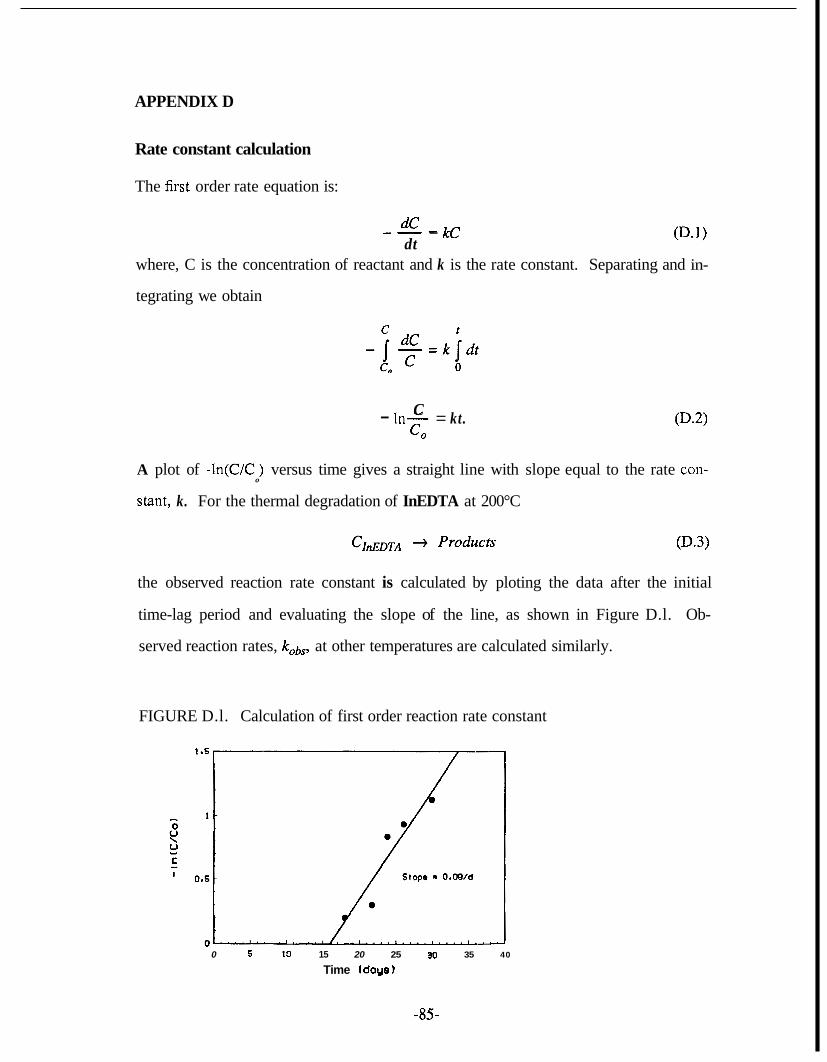
where, C is the concentration of reactant and k is the rate constant. Separating and in-
tegrating we obtain
C - In- = kt. co
A plot of -ln(C/C) versus time gives a straight line with slope equal to the rate con-
stant, k. For the thermal degradation of InEDTA at 200°C 0
the observed reaction rate constant is calculated by ploting the data after the initial
time-lag period and evaluating the slope of the line, as shown in Figure D.l. Ob-
served reaction rates, kobs, at other temperatures are calculated similarly.
FIGURE D.l. Calculation of first order reaction rate constant
0 5 10 15 20 25 30 35 40
Time (days)
-85-
REFERENCES
Al-Riyami, Y. (1986), Personal Communication
Andersen, T. and Knutsen, B. (1962), "Anion-Exchange Study: I. Adsorption of Some Elements in HBr Solutions," Acta Chem. Scand. 16 , pp. 849-854.
Armstead, H. C. H. (1983), Geothermal Energy, E. & F. N. Spon Ltd, New York, NY.
Baes, C. F. and Mesmer, R. E. (1976), The Hydrolysis of Cations, Wile Interscience, New York, NY.
Behrens, H., Moser, H. and Wildner, E. (1977), "Investigation of Groundwater Flow with the Aid of Indium-EDTA-Complex Using Neutron Activation for the Determination of the Tracer," J . Radioanal. Chem., 38 , pp. 491-498.
Belous, R. (1974), "Westinghouse Mulling Plans to Up Output Capacity at Nuclear Plant,'' Am. Metal Market, 81 , pp. 23-28.
Biedermann, G. (1956), "Studies on the Hydrolysis of Metal Ions. Part 14. The Hydrolysis of the Indium(II1) Ion, In3"," Arkiv For Kemi, 9 , pp. 277-292.
Brady, J. E. and Humiston, G. E. (1975), General Chemistry: Principles and Structure, Wiley Interscience, New York, NY.
Brunauer, S., Emmett, P. H. and Teller, E. (1938), "The Adsorption of Gasses in Mul- timolecular Layers," J. Am. Chem. SOC., 60 , pp. 309-316.
Burke, D. P. (1972), "Catalysts Part 1. Petroleum Catalysts," Chem. Week, 111 , pp. 23-33.
Busheina, I. S. and Headridge, J. B. (1981), "Determination of Indium by Hydride Generation and Atomic Absorption Spectrometry," Talanta, 29 , pp. 519-520.
Butler, J. N. (1964), Ionic Equilibrium A Mathematical Approach, Addison Wesley, Menlo Park, CA.
Butler, E. W. and Pick, J. B. (1982), Geothermal Energy Development, Plenum Press, New York, NY.
Carty, A. J. and Tuck, D. G. (1975), "Coordination Chemistry of Indium," Prog. Inorg. Chem. 1 9 , pp. 243-337.
-87-
Channell, J. K. (1970), Activable Rare Earth Elements as Estuarine Water Tracers, Ph.D. Dissertation, Civil Engineering Department, Stanford University, Stan: ford, CA.
Chow, T. J. and Snyder, C. B. (1969), "Indium Content of Sea Warter," Earth and Planetary Science Letters, 7 , pp. 221-223.
Chynoweth, A. G. (1 976), "Electronic Materials: Functional Substitutions," Science, 191 , pp. 725-732.
Collie, M. J., Ed. (1978), Geothermal Energy: Recent Developments, Noyes Data Cor- poration, Park Ridge, NJ.
Connolly, T. J. (1978), Foundations of Nuclear Engineering, Wiley Interscience, New York, NY.
Cosner, S. R. and Apps, J. A. (1978), "Compilation of Data on Fluids from Geother- mal Resources in the United States," U. S. Dept of Energy, W-7405-ENG-48.
D'Amore, F., Celati, R., Calore, C. and Bertrami, R. (1983), "Effects of Natural Recharge on Gas Composition in the Larderello-Castelnuovo Area," Proceed- ings Ninth Workshop on Geothermal Reservoir Engineering, SGP-TR-74, Stan- ford University, Stanford, CA.
De, A. K. and Sen, A. K. (1967), "Solvent Extraction and Separation of Gallium(III), Indium(II1) and Thallium(II1) with Tributylphosphate," 14 , pp. 629-635.
DeGroot, M. H. (1979, Probability and Statistics, Addison-Wesley, Menlo Park, CA.
DeVoe, J. R. and LaFleur, P. D., Eds. (1969), Modern Trends in Activation Analysis, Nattional Bureau of Standards Special Publication 312, Vols. I & II, National Bureau of Standards, Washington, D. C.
Drabaek, I. (1982), "Analysis and Time Stability of Activable Hydrospheric Tracers," J . Radioanal. Chem., 75 , pp. 97-106.
Dwyer, F. P. and Mellor, D. P. (1964), Chelating Agents and Metal Chelates, Academic Press, New York, NY.
Dybczynski, R., Polkowska-Motrenko, H. and Shabana, R. M. (1977), "Influence of Temperature and Degree of Resin Crosslinking on the Anion Exchange of Phosphate Complexes of Ga(1II) and In(III),tt J . Chromatogr., 134 , pp. 285- 297.
Dybczynski, R. and Sterlinska, E. (1974), "The Use of the Amphoteric Ion-Exchange Resin Retardion l lA8 for Inorganic Separations," J . Chromatogr., 102 , pp. 263-27 1.
Edwards, L. M., Chilingar, G. V., Rieke 111, H. H. and Fertl, W. H. (1982), Handbook of Geothermal Energy, Gulf Publishing Co, Houston, TX.
-88-
Ellis, A. J. and Mahon, W. A. J. (1977), Chemistry and Geothermal Systems, Academic Press, New York, NY.
Erickson, S . J., Maloney, T. E. and Gentile, J. H. (1970), "Effect of Nitrilotriacetic Acid on the Growth and Metabolism of Estuarine Phytoplankton," J . Water Pollut. Contr. Fed., 42 , pp. 329-335.
Feitknecht, W. and Schinder, P. (1963), "Solubility Constants of Metal Oxides, Metal Hydroxides and Metal Hydroxide Salts in Aqueous Solution," Pure and Applied Chemistry, 6 , pp. 125-199.
Ferri, D. (1972a), "On the Complex Formation Equilibria Between Indium(II1) and Chloride Ions," Acta Chem. Scand., 26 , pp. 733-746.
Ferri, D. (1972b), "On the Hydrolysis of the Indium(1II) Ion in Chloride Solutions,'' Acta Chem. Scand., 26 , pp. 747-759.
Florence, T. M., Batley, G. E. and Farrar, Y. J. (1974), "The Determination of Indium by Anodic Stripping Voltammetry," Electoanal. Chem. and I n t e ~ Electru- chem., 56 , pp. 301-309.
Forrester, P. G. (1964), "Materials for Plain Bearings," in Modern Materials Advances in Development and Applications, Vol. 4, Gosner, B. W. and Hausner H. H., Eds., Academic Press, New York, NY.
Friedlander, G., Kennedy, J. W., Macias, E. S . and Miller, J. M. (1981), Nuclear and Radiochemistry, Wiley Interscience, New York, NY.
Garvan, F. L. (1964), Metal Chelates of Ethylenediaminetetraacetic Acid and Related Substances, in "Chelating Agents and Metal Chelates," Edited by Dwyer, F. P. and Mellor, D. P., Academic Press, New York, NY.
Gary, M., McAfee, R. and Carol, L.(1972), Glossary of Geology, American Geological Institute, Washington, D.C.
Gudmundsson, J. S., and Hauksson, T. (1984), "Tracer Survey in Svartsengi Field 1984,"Stanford Geothermal Program, Draft Paper.
Gudmundsson, J. S., Johnson, S . E., Horne, R. N., Jackson, P. B. and Culver, G. G. (1983), "Doublet Tracer Testing in Klamath Falls, Oregon," Proceedings, Ninth Workshop on Geothermal Reservoir Engineering, SGP-TR-74, Stanford Univer- sity, Stanford, CA.
Gulati, M. S., Lipman, S. C. and Strobel, C. J. (1978), "Tritium Tracer Survey at the Geysers," Geothermal Resources Council, Trans., 2 , pp. 237-240.
Gupta, H. K. (1980), Geothermal Resources: an Energy Alternative, Elsevier Scientific, Amsterdam, The Netherlands.
-89-
Hayashi, M., Mimura, T. and Yamasaki, T., (1978), "Geological Setting of Reinjec- tion Wells in the Otake and the Hatchobaru Geothermal Field, Japan," Geother- mal Resources Council Trans., 2 , pp. 263-266.
Holman, J. P. (1978), Experimental Methods h o r Engineers, McGraw-Hill, New York, NY.
Home, R. N. (1981), "Tracer Analysis of Fractured Geothermal Systems," Geothermal Resources Council, Trans., 5 , pp. 291-294.
Home, R. N. (1982), "Geothermal Reinjection Experience in Japan," J . Pet. Tech., 34 pp. 495-503.
Home, R. N. (1984), "Reservoir Engineering Aspects of Reinjection," Prerared for the Seminar on Utilization of Geothermal Energy for Electric Power Production and Space Heating, Florence, Italy.
Hunsbedt, A., Kruger, P. and London, L. (1975), "A Laboratory Model of Simulated Geothermal Reservoirs," Stanford Geothermal Program, SGP-TR-7, Stanford University, Stanford, CA.
Irving, H. and Damodaran A. D. (1970), "The Extraction of Indium From Aqueous Halide and Thiocynate Media by Solutions of Liquid Anion Exchangers in Organic Solvents," Anal. Chim. Acta, 50 , pp. 277-285.
Irving, H. and Lews, D. (1967), "The Extraction of Indium Halides into Organic Sol- vents: Part VII. The Distribution of Indium Between Hydrochloric and Binary Solvent Mixtures Containing Isobutyl Ketone,'' Arkiv For Kemi, 28 , pp. 131- 143.
Ito, J., Kubota, Y. and Kurosawa, M. (1978), "The Tracer Tests Applied at the Onuma Geothermal Power Station, and the Considerations about the Geothermal Reser- voir and Water Shielding of the Wells," J . Jpn. Geotherm. Energy Assoc., 15 , pp. 25-33. (in Japanese, with English abstract)
Jacklin, C. (1965), "Chelating Agents for Boiler Treatment - Research and Actual Use," Proceedings Amer. Power Conf., 27 , pp. 807-816.
Katz, S. A. (198 l), "Nutron Activation Analysis: A Powerful Technique Becomes Available to Chemists,'' Chem. Internat., 5 , pp. 13-19.
Koenig, J. B. (1973), "Worldwide Status of Geothermal Resources Development," in Geothermal Energy, pp. 15-68. Kruger, P. and Otte, C., Eds., Stanford Univer- sity Press, Stanford, CA.
Korkish, J. and Hazan, I. (1964), Anion Exchange Separation of Gallium, Indium and Aluminum," Anal. Chem. 36 , pp. 2308-231 1.
Kruger, P. (1971), Principles of Activation Analysis, Wiley Interscience, New York, NY.
-90-
Kruger, P. and Otte, C., Eds. (1973), Geothermal Energy, Stanford University Press, Stanford, CA.
Kruger, P. (1983), in Geothermal Reservoir Engineering Research at Stanford Univer- sity, Third Annual Report, DOE Contract No DE-AT03-80SFll459, Stanford Geothermal Program, SGP-TR-76, Stanford University, Stanford, CA.
Lederer, C. M. and Shirley, V. S., Eds. (1978), Table of Isotopes, Wiley Interscience, New York, NY.
Lee, M. and Burrell, D. C. (1972), "Extraction of Cobalt, Iron, Indium and Zinc from Seawater by Means of the Trifluoacetylaceton-Toluene System," Anal. Chim. Acta, 62 , pp. 153-161.
Lin, S. R. and Feng, Q. S. (1984), "Indirect Polarographic Determination of Indium(II1) in the Presence of Cadmium(I1) by Utilising the Difference in their Kinetic Effects in an Appropriate Substitution Reaction," Analyst, 109 , pp. 97-98.
Linn, T. A. and Schmitt, R. A. (1972), "Indium," in Handbook of Geochemistry Vol. 2, Wedepohl, K. H., Ed., Springer-Verlag, Berlin, Heidelberg.
Lyle, S . J. and Shendrikar, A. D. (1965), ''A Separation Scheme for Gallium, Indium, Thallium, Germanium, Tin and Lead by Solvent Extraction with N-Benzoyl-N- Phenylhydroxylamine," Anal. Chim. Acta, 32 , pp. 575-582.
Macias-Chapa, L. (198 l), "Radon Emanation in Geothermal Reservoirs," Engineers Thesis, Civil Engineering Department, Stanford University, Stanford, CA.
Martell, A. E. and Smith, R. M. (1974), Critical Stability Constants, Volume-I: Amino Acids, Plenum Press, New York, NY.
Martell, A. E., Motekaitis, R. J., Fried, A. R., Wilson, J. S. and MacMillan, D. T. (1975), "Thermal Decomposition of EDTA, NTA, and Nitrilotrimethylenephos- phonic Acid in Aqueous Solution," Can. J . Chem., 53 , pp. 3471-3476.
Matthews, A. D. and Riley, J. P. (1970), "The Determination of Indium in Sea Water," Anal. Chim. Acta, 5 , pp. 287-294.
Mazor, E. (1977), "Geothermal Tracing with Atmospheric and Radiogenic Gases," Geothermics, 5 , pp. 21-36.
Mazor, E. and Truesdell, A. H. (1984), "Dynamics of a Geothermal Field Traced by Noble Gases: Cerro Prieto, Mexico," Geothermics, 13 , pp. 91-102.
Means, J. L., Crerar, D. A. and Duguid, J. 0. (1978), "Migration of Radioactive Wastes: Radionuclide Mobilization by Complexing Agents," Science, 200 , pp. 1477- 148 1.
-91-
Means, J. L., Kucak, T. and Crerar, D. A. (1980), "Relative Degradation Rates of NTA, EDTA and DTPA and Environmental Implications," Environ. Pollut. (Series-B), 1 , pp. 45-60.
Means, J. L., Meast, A. S. and Crerar, D. A. (1985), "Role of Organics in Radionu- clide Transport in Deep Groundwaters," Scientijic Basis for Nuclear Waste Management, 3
McCabe, W. J., Barry, B. J. and Manning, M. R. (1983), "Radioactive Tracers in Geothermal Underground Water Flow Studies," Geothermics, 12 , pp. 83-1 10.
Moeller, T. (1979, The Lanthanides , in "Comprehensive Inorganic Chemistry,'' Edited by Bailar, J. C., Emeleus, H. J., Sir Nyholm, R. and Trotman-Dickerson, A. F., Pergamon Press, Oxford, Great Britain.
Muzzarelli, R. A., Raith, G. and Tubertini, 0. (1970), "Separations of Trace Elements from Sea Water, Brine and Sodium and Magnesium Salt Solutions by Chroma- tography on Chitosan," J . Chromatog., 47 , pp. 414-420.
Navada, S. V., Kulkarni, V. P. and Rao, S. M. (1981), "Study of Tracer Analysis of Iodide by the Cerium(1V)-Arsenic(II1) Catalytic Method and Indium-EDTA Neutron Activation Method for Hydrological Investigation," in Trace Analysis and Technological Development, Spec. Contrib. Pap. Int. Symp., pp. 257-27 1. Sankar, D. M., Ed., Wiley Interscience, New York, NY.
Pribil, R. (1972), Analytical Applications of EDTA and Related Compounds, Pergamon Press, Oxford, Great Britain.
Rakevic, M. (1970), Activation Analysis, CRC Press, Cleveland, OH.
Rattonetti, A. (1974), "Determination of Soluble Cadmium, Lead, Silver, and Indium in Rainwater and Stream Water with the Use of Flameless Atomic Absorption," Anal. Chem., 46 , pp. 739-742.
Rees, H. D. and Gray, K. W. (1976), "Indium Phosphide: A Semiconductor for Microwave Devices," IEE J . Solid-state Electron Devices, 1 , pp. 1-8.
Riley, J. P. and Taylor, D. (1968), "Chelating Resins for the Concentration of Trace Elements from Sea Water and their Analytical Use in Conjunction with Atomic Absorption Spectrometry," Anal. Chim. Acta, 40 , pp. 479-485.
Rossotti, F. J. C. and Rossotti, H. (1956), "Studies on the Hydrolysis of Metal Ions: XV. Partition Equilibria in the System 1141n/TTA/Ben~ene,tl Acta Chem. Scand., 10 , pp. 779-792.
Rudd, J. W. M. and Hamilton, R. D. (1972), "Biodegradation of Trisodium Nitrilo- triacetate in a Model Aerated Sewage Lagoon," J . Fish Res., 29 , pp. 1203- 1207.
Ryan, V. A., Ed. (1973), Contemporary Activation Analysis, Marcel Dekker, Inc., New York, NY.
-92-
Satomi, K. (1982), "Radon Emanation Mechanism from Finely Ground Rocks," Engineers Thesis, Civil Engineering Department, Stanford University, Stanford, CA.
Semprini, L. (1981), "Radon and Ammonia Transects in Geothermal Reservoirs," Engineers Thesis, Civil Engineering Department, Stanford University, Stanford, CA.
Shaw, D. M. (1952), "The Geochemistry of Indium," Geochemica and Cosrnochernica Acta, 2 , pp. 185-206.
Shibata, S. (1960), "Solvent Extraction Behavior of Some Metal- l-(2-Pyridylazo)- Naphthol Chelates," Anal. Chim. Acta, 23 , pp. 367-369.
Shibata, S. (1961), "Solvent Extraction and Spectrophotometric Determination of Metals with 1-(2-Pyridylazo)-2-Naphthol," Anal. Chim. Acta, 25 , pp. 348-359.
Shumate, K. S., Thompson, J. E., Brookhart, J. D. and Dean C. L. (1970), "NTA Removal by Activated sludge - Field Study," J . Water Poflut. Contr. Fed., 42 , pp. 631-640.
Smith, C. I. and Carson, B. L. (1981), Trace Metals in the Environment, Vol. 6-Cobalt, Ann Arbor Science, Ann Arbor, MI.
Smith, C. I., Carson, B. L. and Hoffmeister, F. (1978), Trace Metals in the Environ- ment, VoZ. 5-Zndium, Ann Arbor Science, Ann Arbor, MI.
Sniegoski, P. J. and Venezky, D. L. (1974), "GLC Analysis of Organic Chelating Agents in Steam Propulsion Systems," J . Chromatugr. Sci., 12 , pp. 359-361.
Stary, J. and Hladky, E. (1963), "Systematic Study of the Solvent Extraction of Metal P-Diketonates," Anal. Chim. Acta, 28 , pp. 227-235.
Strelow, F. W. E. (1980), "Quantitative Separation of Galium from Uranium, Cobalt, Aluminum and Many Other Elements by Cation Exchange Chromatography in Mixtures of Hydrochloric or Hydrobromic Acid with Acetone," Anal. Chim. Acta, 113 pp, 323-329.
Strelow, F. W. E. and Victor, A. H. (1971), "Quantitative Separation of Al, Ga, In and T1 by Cation Exchange Chromatography in Hydrochloric Acid- Acetone," Talanta, 19 pp. 1019-1023.
Stumm, W. and Morgan, J. J. (1981), Aquatic Chemistry, 2nd Edition, Wiley Intersci- ence, New York, NY.
Sunderman, D. N. and Townley, C. W. (1960), The Radiochemistryof Nuclear Science Series, National Academy of Sciences-National Reserch Council, Washington, D.C.
-93-
Thompson L. C. A. and Pacer, R. (1963), "The Solubility of Indium Hydroxide in Acidic and Basic Media at 25"C," J. Inorg. Nucl. Chem., 25 , pp. 1041-1044.
Tiedje, J. M. (1977), "Influence of Environmental Parameters on EDTA Biodegrada- tion in Soils and Sediments," J . Environ. Qual., 6 , pp. 21-26.
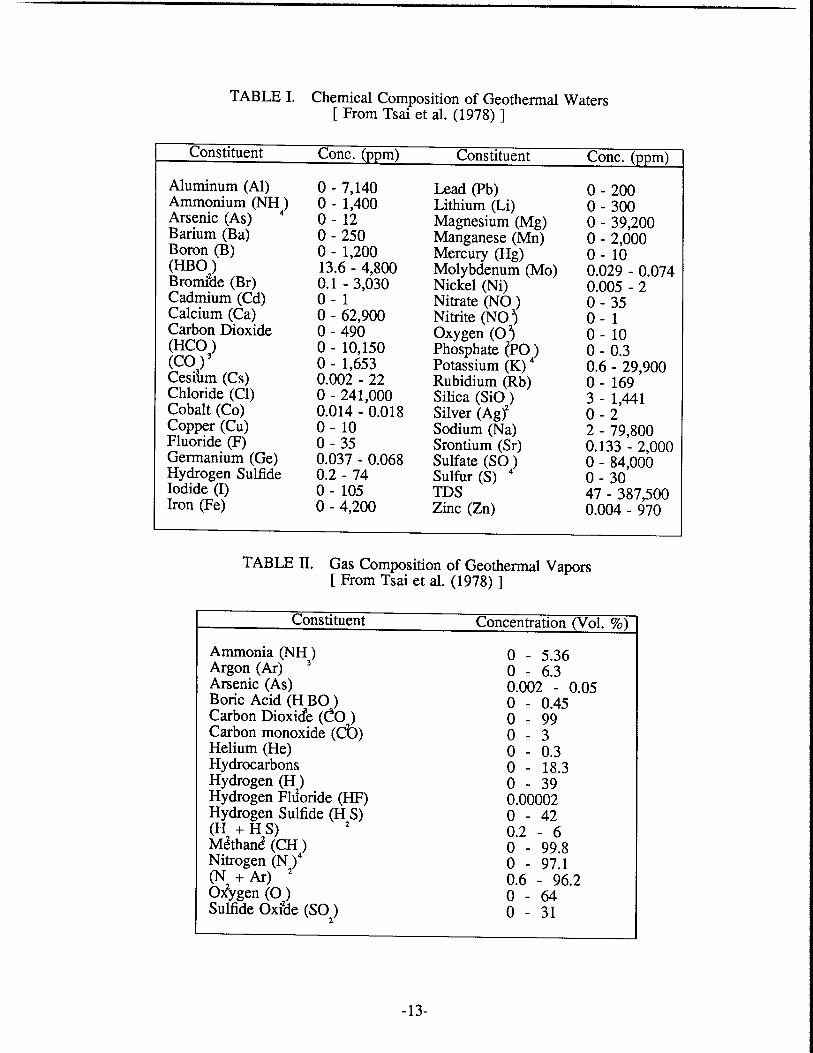
Tsai, F., Jupraset, S . and Sayal, S . K. (1978), "A Review of the Chemical Composition of Geothermal Effluents," Proceedings Second Workshop on Sampling Geother- mal Efjuents, 60017-78-121, EPA.
Tyree, S. Y., Jr. (1967), "The Nature of Inorganic Solute Species in Water," in Equili- brium Concepts in Natural Water Systems, pp. 183-195, Gould, R. F., Ed., American Chemical Society, Washington, D. C.
Venezky, D. L. and Moniz, W. B. (1969), "Nuclear Magnetic Resonance Study of the Thermal Decomposition of Ethylenedinitrilotetraacetic Acid and its Salts in Aqueous Solutions," Anal. Chem., 41 , pp. 11-16.
Venezky, D. L. and Moniz, W. B. (1970), NRL Report 7192, Naval Research Labora- tory, Washington, D. C.
Warren, C. B. and Malec, E. J. (1972), "Biodegradation of Nitrilotriacetic Acid and Related Imino and Amino Acids in River Water," Science, 176 , pp. 277-279.
Weast, R. C., Ed. (1984), Handbook of Chemistry and Physics, CRC Press, Boca Raton, FL.
Wendlandt, W. W. (1960), "Thermogravimetric and Differential Thermal Analysis of pp. (Ethylenedinitri1o)tetraacetic Acid and Its Derivatives," Anal. Chem., 32 ,
848-850.
White, D. E. (1973), "Characteristics of Geothermal Resources," in Geothermal Energy, pp. 69-94. Kruger, P. and Otte, C., Eds., Stanford University Press, Stanford, CA.
Wodkiewicz, L. and Dybczynski, R. (1974), "Anion-Exchange Behaviour of Some Ele- ments on a Weakly Basic Anion Exchanger in Hydrobromic Acid Medium," J . Chromatogr., 102 , pp. 277-285.
Wylie, A. W. (1984) Nuclear Assaying of Mining Boreholes, Methods in Geochemistry and Geophysics, 21, Elsevier Science Publishers B. V., Amsterdam, The Neth- erlands.