Colorado State University 2018.10.29 Page 1 of 5 CHEM 334 Quantitative Analysis Laboratory Determination of Calcium by Atomic Spectroscopy Introduction Atomic Spectroscopy is literally the spectroscopy (or spectrometry) of neutral atoms. It is made up of a group of methods suitable for elemental analysis, that is, the quantification of the amount of a particular element in an analyte. It offers little or no information on the state of the element in molecules or the molecules themselves. Optical atomic spectroscopy, that is, using visible or near visible light as a probe, can be segregated into several broad types: atomic absorption spectroscopy (AAS), atomic emission spectroscopy (AES) and atomic fluorescence spectroscopy (AFS). These types differ in certain aspects of their fundamental principles, in the details of the instrumentation used and in the measurement details, for example, the limit of detection. In all cases, however, the spectroscopic absorption, emission and fluorescence lines are exceedingly narrow, typically a small fraction of a nanometer in contrast to the corresponding lines associated with liquid or solid species which start at widths of many nanometers and increase seemingly without limit. Emission and fluorescence spectroscopies rely on the emission of specific wavelengths of light from the analyte in the gas phase. Absorption spectroscopy, in contrast, relies on the absorption of specific wavelengths of light by the analyte, also in the gas phase and requires a source of light to absorb. No matter which type of atomic spectroscopy is performed it is necessary to form a gaseous cloud of neutral atoms from an analyte. The sample, dissolved in a solvent is nebulized, that is, reduced to a fine spray, by a turbulent flow of gaseous oxidant. It is then mixed with a gaseous fuel and carried into a flame where atomization, that is, Figure 2. Schematic diagram of a flame atomic absorption spectrometer. An atomic emission would differ in the absence of the hollow cathode lamp since the atoms are emitting the light that the rest of the spectrometer is detecting. Figure 2. The Varian SpectrAA 55B atomic absorption spectrometer. The user interface and display are located at the upper right, the light source at the lower left, the sample nebulizer, aspirator and reservoir at the lower left, the burner at the upper left and the exhaust chimney at the extreme upper left.
Transcript
ColoradoStateUniversity 2018.10.29 Page1of5
CHEM334QuantitativeAnalysisLaboratory
DeterminationofCalciumbyAtomicSpectroscopy
IntroductionAtomicSpectroscopy is literally thespectroscopy (or spectrometry)ofneutralatoms. It ismadeupofagroupofmethods suitable for elemental analysis, that is, the quantification of the amount of a particular element in ananalyte.Itofferslittleornoinformationonthestateoftheelementinmoleculesorthemoleculesthemselves.
Optical atomic spectroscopy, that is, using visibleornear visible light as aprobe, canbe segregated into severalbroad types:atomicabsorptionspectroscopy (AAS),atomicemissionspectroscopy (AES)andatomic fluorescencespectroscopy (AFS). These types differ in certain aspects of their fundamental principles, in the details of theinstrumentationusedandinthemeasurementdetails,forexample,thelimitofdetection.Inallcases,however,thespectroscopic absorption, emission and fluorescence lines are exceedingly narrow, typically a small fraction of ananometer in contrast to the corresponding lines associatedwith liquidor solid specieswhich start atwidthsofmanynanometersandincreaseseeminglywithoutlimit.
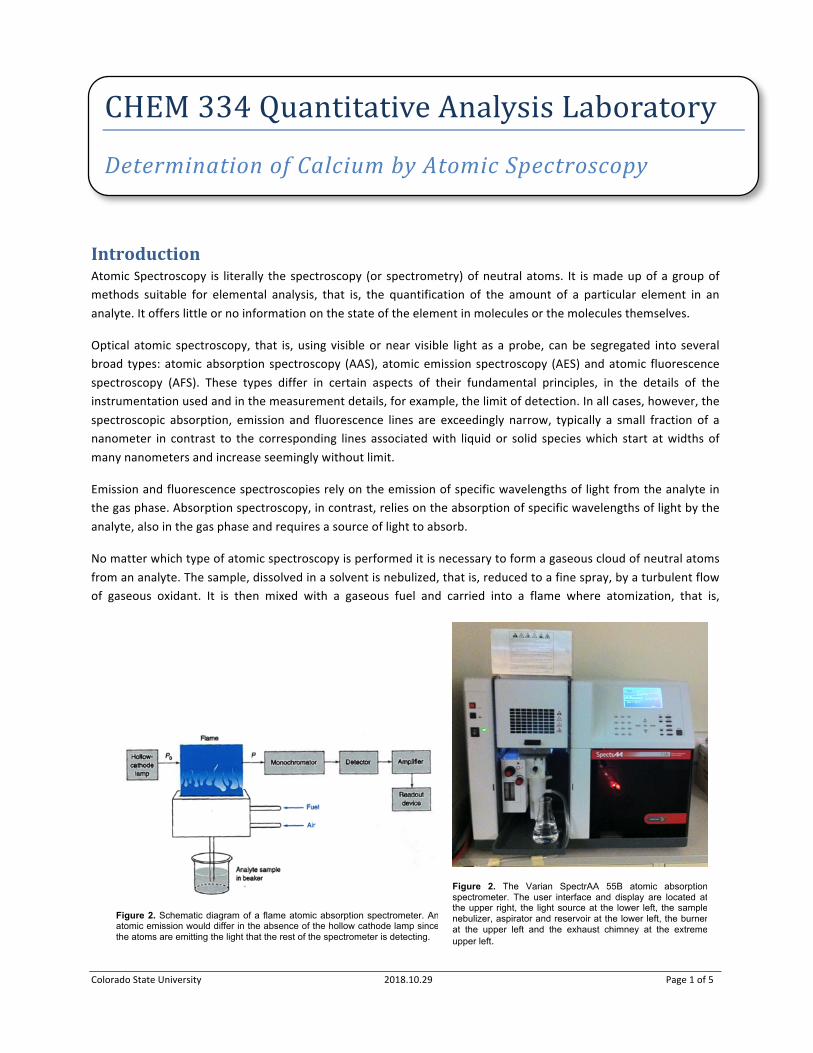
Nomatterwhichtypeofatomicspectroscopyisperformeditisnecessarytoformagaseouscloudofneutralatomsfromananalyte.Thesample,dissolvedinasolventisnebulized,thatis,reducedtoafinespray,byaturbulentflowof gaseous oxidant. It is then mixed with a gaseous fuel and carried into a flame where atomization, that is,
Figure 2. Schematic diagram of a flame atomic absorption spectrometer. An atomic emission would differ in the absence of the hollow cathode lamp since the atoms are emitting the light that the rest of the spectrometer is detecting.
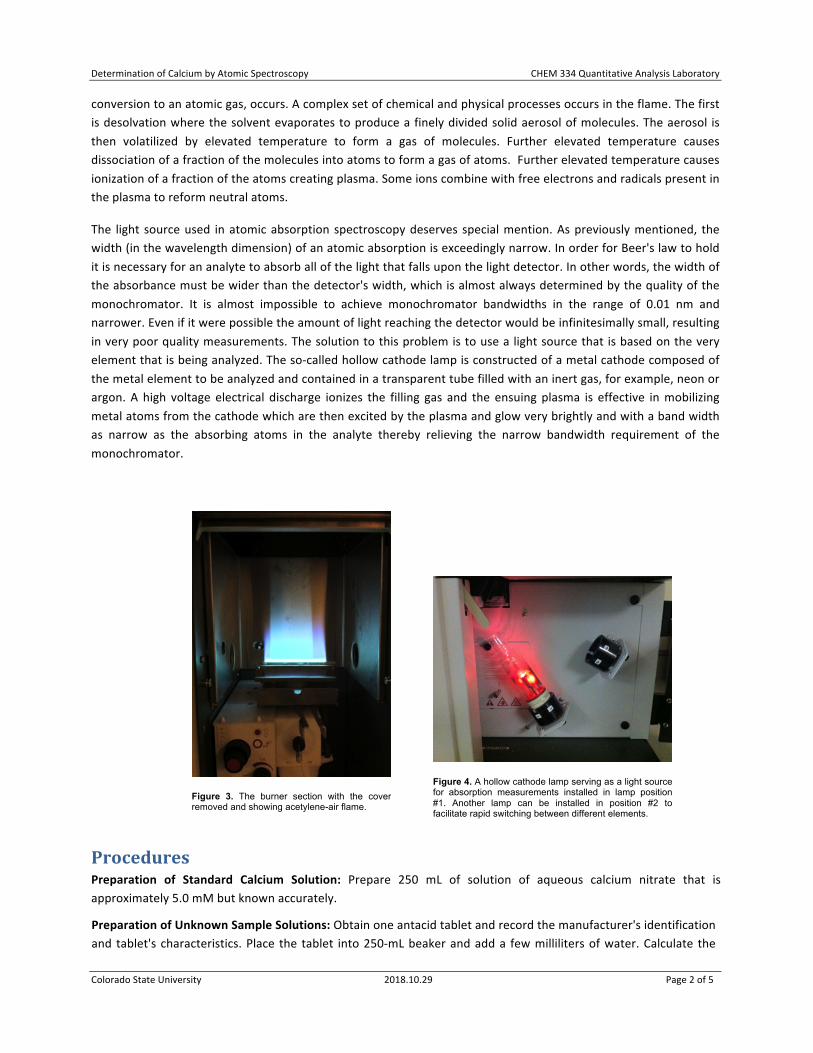
Figure 2. The Varian SpectrAA 55B atomic absorption spectrometer. The user interface and display are located at the upper right, the light source at the lower left, the sample nebulizer, aspirator and reservoir at the lower left, the burner at the upper left and the exhaust chimney at the extreme upper left.
conversiontoanatomicgas,occurs.Acomplexsetofchemicalandphysicalprocessesoccursintheflame.Thefirstisdesolvationwherethesolventevaporatestoproduceafinelydividedsolidaerosolofmolecules.Theaerosol isthen volatilized by elevated temperature to form a gas of molecules. Further elevated temperature causesdissociationofafractionofthemoleculesintoatomstoformagasofatoms.Furtherelevatedtemperaturecausesionizationofafractionoftheatomscreatingplasma.Someionscombinewithfreeelectronsandradicalspresentintheplasmatoreformneutralatoms.
The light sourceused inatomicabsorption spectroscopydeserves specialmention.Aspreviouslymentioned, thewidth(inthewavelengthdimension)ofanatomicabsorptionisexceedinglynarrow.InorderforBeer'slawtoholditisnecessaryforananalytetoabsorballofthelightthatfallsuponthelightdetector.Inotherwords,thewidthoftheabsorbancemustbewiderthanthedetector'swidth,whichisalmostalwaysdeterminedbythequalityofthemonochromator. It is almost impossible to achieve monochromator bandwidths in the range of 0.01 nm andnarrower.Evenifitwerepossibletheamountoflightreachingthedetectorwouldbeinfinitesimallysmall,resultinginverypoorqualitymeasurements.Thesolutiontothisproblemistousealightsourcethat isbasedontheveryelementthatisbeinganalyzed.Theso-calledhollowcathodelampisconstructedofametalcathodecomposedofthemetalelementtobeanalyzedandcontainedinatransparenttubefilledwithaninertgas,forexample,neonorargon. A high voltage electrical discharge ionizes the filling gas and the ensuing plasma is effective inmobilizingmetalatomsfromthecathodewhicharethenexcitedbytheplasmaandglowverybrightlyandwithabandwidthas narrow as the absorbing atoms in the analyte thereby relieving the narrow bandwidth requirement of themonochromator.
ProceduresPreparation of Standard Calcium Solution: Prepare 250 mL of solution of aqueous calcium nitrate that isapproximately5.0mMbutknownaccurately.
PreparationofUnknownSampleSolutions:Obtainoneantacidtabletandrecordthemanufacturer'sidentificationand tablet's characteristics.Place the tablet into250-mLbeakerandadda fewmillilitersofwater.Calculate the
Figure 3. The burner section with the cover removed and showing acetylene-air flame.
Figure 4. A hollow cathode lamp serving as a light source for absorption measurements installed in lamp position #1. Another lamp can be installed in position #2 to facilitate rapid switching between different elements.
volumeof1Mhydrochloricacidrequiredtocompletelyreactwiththemanufacturer'sreportedamountofcalciumcarbonateinthetablet.Slowlyandcarefullyadd110%ofthisvolumeofacidtothebeaker.Considerablefoamingwilloccurfromthecarbondioxideevolution.Thesolutionmaybeturbidorcontainbitsofresidualtabletcoatingatthispoint.Bring thesuspension just toaboilusingahotplate set to200 °C to removeany remaining tracesofcarbondioxide.Coolthenquantitativelytransferthebeaker'scontentstoa250mLvolumetricflaskandmakeup
the volume with water. This is named the “undiluted unknown sample solution.” Solutions with high turbidityrequirefiltrationtoremovetheparticlesthatwillclogthespectrometerinlet.Useasimplegravityfiltermadeupofeitherasinglefoldedpieceoffilterpaperorasmall(~2cm2)pieceoffilterlooselyballedupinthetopofthestemofafunneltofilterasmallquantityoftheundilutedunknownsamplesolution(~10mL).Dilutethisfilteredsolutionbyafactorofonehundred(100)toobtaina“dilutedunknownsamplesolution.”(Computetheapproximate[Ca2+]ofboththeundilutedanddilutedunknownsamplesolutions.)
PreparationofCalibrationCurveMeasurement:Prepareaseriesofsolutions,eachwithavolumeoffiftymilliliters.Add various volumes of the Standard Calcium Solution so that the set contains a series of known, calciumconcentrationsexcludingzero.Thecalciumconcentrationinanysolutionmustnotexceed1.0mM.Transferthesesolutionstoalabeledsetoffifty-milliliterErlenmeyerflasks.Measuretheabsorbanceofeachofthesesolutionsinthespectrophotometerasdescribedbelow.Prepare thesesolutionsandmeasure themoneata timeoratmosttwo at a time. For example, startwith 0.5 and 1.0mM. (Are the absorbances in the spectrophotometer’s linearregion?)Makeadditionalsolutionsofdifferentcalciumconcentrationaccordinglyandcollectatleastfour(4)gooddatapointsforalinearcalibrationcurve.
Unknown Sample Measurement: Measure the absorbance of the diluted unknown sample solution in thespectrophotometer. If the absorbance is above of themaximum found in the calibration curve then estimate asuitabledilutionfactoranddiluteuntilasolution isobtainedthatdisplaysanabsorbance less thanthemaximumfoundinthecalibrationcurve.Donotdiscardtheundilutedandthedilutedunknownsamplesolutionsjustyet.
StandardAdditionMethod:Prepareaseriesofstandardadditionsolutions,eachwithavolumeoffiftymilliliters.Select a volume of one of the diluted unknown sample solutions that when added to these standard addition
Figure 5. Display, control and readout section showing the Signal screen. The spectrometer has not yet been zeroed and displays a non-zero absorbance.
Figure 6. Detail of the sample area. The Erlenmeyer flask is the distilled water reservoir. While the flame is burning water must flow continuously into the nebulizer and the drain tube must be unobstructed.
solutionswillcontributeapproximately0.1totheirtotalabsorbance.AddvariousvolumesoftheStandardCalciumsolution to the series so that it contains several known calcium concentrations yet remains in thespectrophotometer’slinearrange.Prepareandmeasuretheirabsorbanceofthesesolutionsone-at-a-timenotallatonce.Collectatleastthreeandnomorethanfivemeasurements.
Atomic Absorption Spectrophotometer Measurement: Teaching staff will provide specific instructions on theoperationofthespectrometer.Thefollowingisabriefsynopsisoftherequiredsteps.
2. Aspirate the most concentrated calcium solution. Ensure that the instrument reads an absorbance ofapproximatelybutnomorethanone.
3.Aspirateasampleofdistilledwaterfromthereservoir.PresstheResultsbuttonfollowedbytheReadbutton.Thespectrometerwillwait roughly five seconds topermit theanalyte solution to flow to the flame then itwillmakeseveralmultiple-secondmeasurementsoftheabsorbance.Recordtheaveragedabsorbanceandits%RSD.
4. Aspirate all of the solutions in turn, pressing theRead button and recording the averaged absorbance and its%RSD.
ResultsReport theresultsof theboththecalibrationcurveandthestandardadditionmeasurements in tabular form.Becertaintocarefullycomputetheactualconcentrationofaddedcalcium(inappropriateunitsofmolarity)foreachsolution.Preparea figure showing the resultsof the calibration curveand standardadditionon the samegraph.(Remembertoalwaysusetheknownanalyteconcentrationonthexaxis.)Computealeastsquaresfitforeachofthe two sets of data using a linear function and draw the resulting lines with the experimental data points.Extrapolate the standard addition data to zero absorbance, calculate the unknown calcium concentration in thesolutionsinmMandestimateitsuncertainty.
FlameAtomicAbsorptionSpectrometry-AnalyticalMethods.UserManual#8510000900;8thedition;2010.[Online]Agilent Technologies, Inc. Literature Library. https://www.chem.agilent.com/Library/usermanuals/Public/0009.pdf(accessed9Oct,2011).