1 Chem 419/519 Bioanalytical chemistry 1 st half of 419 and 511: Biomolecular chemistry 2 nd half of 419 and 519: Bioanalytical chemistry 1 • Biomolecule purification and quantitation • Enzymes as analytical reagents • Antibodies as analytical reagents • Gel electrophoresis • DNA Hybridization (incl. microarrays) • DNA sequencing • Fluorescence microscopy •
Transcript
1
Chem 419/519Bioanalytical chemistry
1st half of 419 and 511: Biomolecular chemistry2nd half of 419 and 519: Bioanalytical chemistry
1
• Biomolecule purification and quantitation• Enzymes as analytical reagents• Antibodies as analytical reagents• Gel electrophoresis• DNA Hybridization (incl. microarrays)• DNA sequencing• Fluorescence microscopy•
2
Bioanalytical chemistry
1. Direct detection and quantitation of biomolecules in solution
Required reading: Section 1.1 to 1.3 of Mikkelsen and Cortón, Bioanalytical Chemistry
Objective for this section• You will be familiar with several methods of determining protein and DNA concentration.
Source Material• Chapters 4 and 12 of Introduction to Genetic Analysis Anthony: J.F. Griffiths, Jeffrey H. Miller, David T.
Suzuki, Richard C. Lewontin, William M. Gelbart (courtesy of the NCBI bookshelf).• Chapters 4 and 6 of Biochemistry: Berg, Jeremy M.; Tymoczko, John L.; and Stryer, Lubert (courtesy of the
NCBI bookshelf).• Chapters 3 and 7 of Molecular Cell Biology: Lodish, Harvey; Berk, Arnold; Zipursky, S. Lawrence;
Matsudaira, Paul; Baltimore, David; Darnell, James E. (courtesy of the NCBI bookshelf).• The Molecular Probes Handbook from Invitrogen (http://www.invitrogen.com/site/us/en/home/References/
Molecular-Probes-The-Handbook.html)• Other sources mentioned on specific slides
Determining DNA concentration:Ultraviolet absorbance
3
Average weight of a DNA basepair (sodium salt) = 650 daltons 1.0 A260 unit ds DNA = 50 µg/ml = 0.15 mM (in nucleotides) = 0.075 mM in basepairs 1.0 A260 unit ss DNA = 33 µg/ml = 0.10 mM (in nucleotides) 1.0 A260 unit ss RNA = 40 µg/ml = 0.11 mM (in nucleotides)
• The simplest way of determining the concentrations of either nucleic acids or proteins is to use UV absorbance measurements and then use the Beer-Lambert law with theoretical extinction coefficients. In addition, it is a non-destructive technique and the sample is easily recovered.
• DNA has a distinct absorbance band at 260 nm, while proteins have a distinct absorbance at 280 nm. In practice, these absorbance bands are broad and overlap with each other. Regardless, the ratio of A260/A280 can be used as a criterion of the purity of protein or nucleic acid samples during their purification. A ratio of 2 or greater indicates that the DNA is relatively free of proteins.
• Note that for many biomolecules, the idea of purity is arbitrary. It is often more accurate to say that a biomolecule has been ‘enriched’ rather than ‘purified’. What really matters is that the biomolecule is ‘pure enough’ for downstream applications.
There are a wide variety of synthetic dyes that increase fluorescence when bound to dsDNA
4
ethidium bromide, an intercalator
Bioconjugate Chem., 1998, 9 (3), pp 331–340
Toto-1, a bis-intercalator
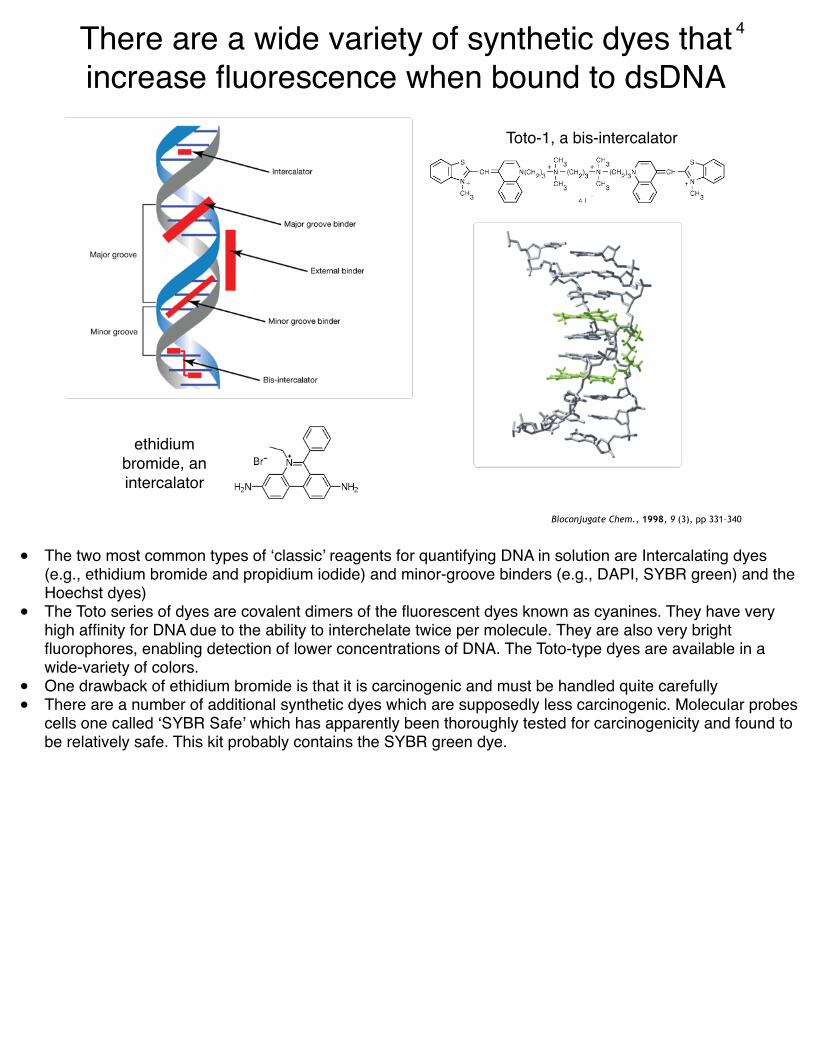
• The two most common types of ‘classic’ reagents for quantifying DNA in solution are Intercalating dyes (e.g., ethidium bromide and propidium iodide) and minor-groove binders (e.g., DAPI, SYBR green) and the Hoechst dyes)
• The Toto series of dyes are covalent dimers of the fluorescent dyes known as cyanines. They have very high affinity for DNA due to the ability to interchelate twice per molecule. They are also very bright fluorophores, enabling detection of lower concentrations of DNA. The Toto-type dyes are available in a wide-variety of colors.
• One drawback of ethidium bromide is that it is carcinogenic and must be handled quite carefully• There are a number of additional synthetic dyes which are supposedly less carcinogenic. Molecular probes
cells one called ‘SYBR Safe’ which has apparently been thoroughly tested for carcinogenicity and found to be relatively safe. This kit probably contains the SYBR green dye.
DAPI: a minor-groove binder
NH
NH
NH2HN
NH2
micro.magnet.fsu.edu
5
J Biomol Struct Dyn (1989) 7:477-491
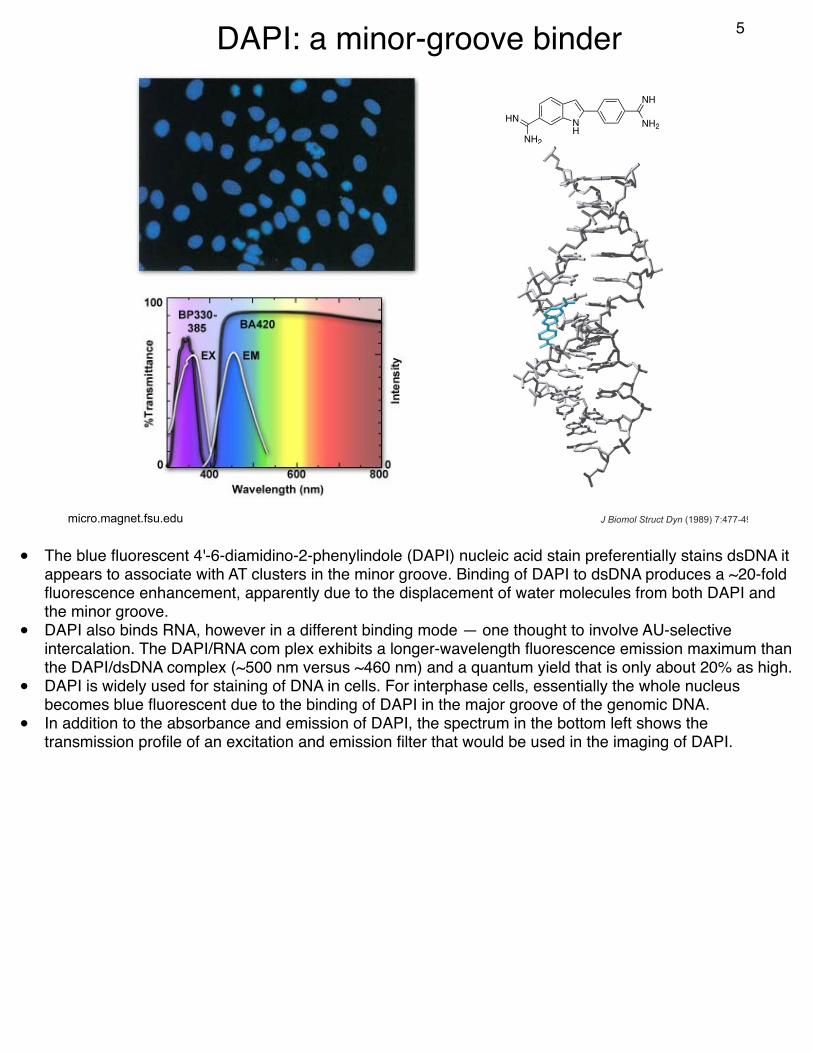
• The blue fluorescent 4'-6-diamidino-2-phenylindole (DAPI) nucleic acid stain preferentially stains dsDNA it appears to associate with AT clusters in the minor groove. Binding of DAPI to dsDNA produces a ~20-fold fluorescence enhancement, apparently due to the displacement of water molecules from both DAPI and the minor groove.
• DAPI also binds RNA, however in a different binding mode — one thought to involve AU-selective intercalation. The DAPI/RNA com plex exhibits a longer-wavelength fluorescence emission maximum than the DAPI/dsDNA complex (~500 nm versus ~460 nm) and a quantum yield that is only about 20% as high.
• DAPI is widely used for staining of DNA in cells. For interphase cells, essentially the whole nucleus becomes blue fluorescent due to the binding of DAPI in the major groove of the genomic DNA.
• In addition to the absorbance and emission of DAPI, the spectrum in the bottom left shows the transmission profile of an excitation and emission filter that would be used in the imaging of DAPI.
Determining DNA concentration:Real-time PCR
6
Figures from:Marisa L. Wong and Juan F. Medrano “Real-time PCR for mRNA quantitation” BioTechniques 2005, 39:75-85.
Jochen Wilhelm and Alfred Pingoud, “Real-Time Polymerase Chain Reaction” ChemBioChem 2003, 4, 1120 - 1128.
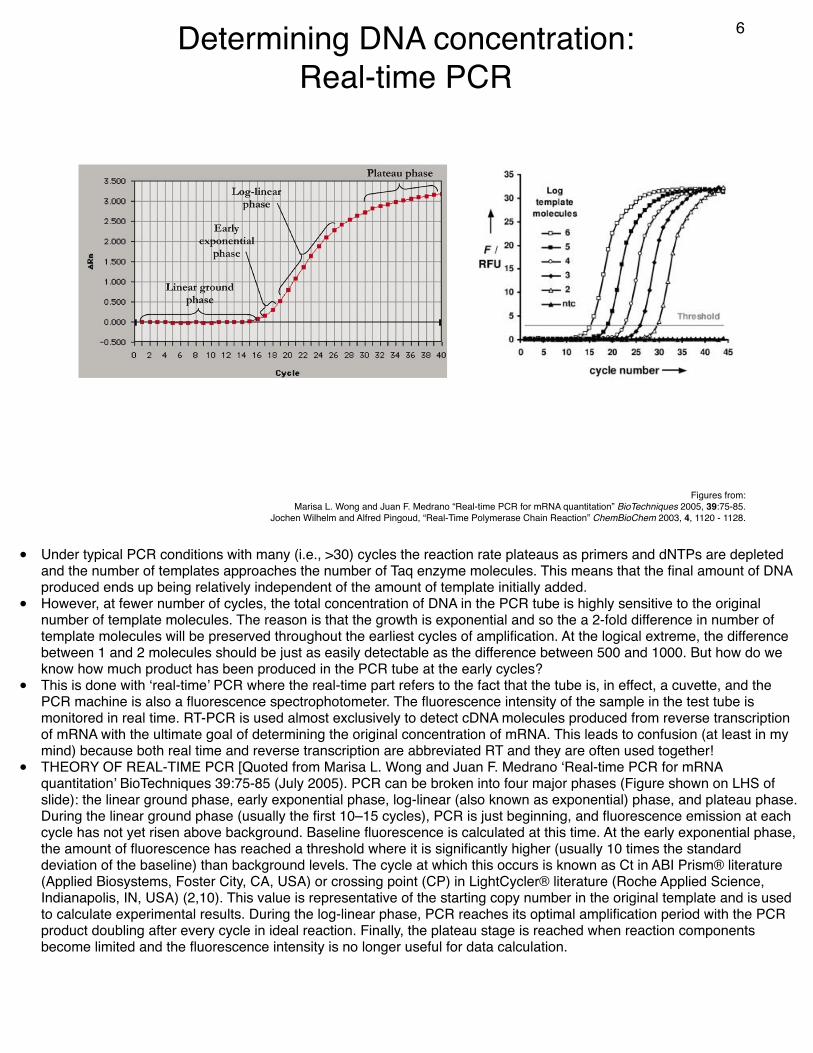
• Under typical PCR conditions with many (i.e., >30) cycles the reaction rate plateaus as primers and dNTPs are depleted and the number of templates approaches the number of Taq enzyme molecules. This means that the final amount of DNA produced ends up being relatively independent of the amount of template initially added.
• However, at fewer number of cycles, the total concentration of DNA in the PCR tube is highly sensitive to the original number of template molecules. The reason is that the growth is exponential and so the a 2-fold difference in number of template molecules will be preserved throughout the earliest cycles of amplification. At the logical extreme, the difference between 1 and 2 molecules should be just as easily detectable as the difference between 500 and 1000. But how do we know how much product has been produced in the PCR tube at the early cycles?
• This is done with ‘real-time’ PCR where the real-time part refers to the fact that the tube is, in effect, a cuvette, and the PCR machine is also a fluorescence spectrophotometer. The fluorescence intensity of the sample in the test tube is monitored in real time. RT-PCR is used almost exclusively to detect cDNA molecules produced from reverse transcription of mRNA with the ultimate goal of determining the original concentration of mRNA. This leads to confusion (at least in my mind) because both real time and reverse transcription are abbreviated RT and they are often used together!
• THEORY OF REAL-TIME PCR [Quoted from Marisa L. Wong and Juan F. Medrano ‘Real-time PCR for mRNA quantitation’ BioTechniques 39:75-85 (July 2005). PCR can be broken into four major phases (Figure shown on LHS of slide): the linear ground phase, early exponential phase, log-linear (also known as exponential) phase, and plateau phase. During the linear ground phase (usually the first 10–15 cycles), PCR is just beginning, and fluorescence emission at each cycle has not yet risen above background. Baseline fluorescence is calculated at this time. At the early exponential phase, the amount of fluorescence has reached a threshold where it is significantly higher (usually 10 times the standard deviation of the baseline) than background levels. The cycle at which this occurs is known as Ct in ABI Prism® literature (Applied Biosystems, Foster City, CA, USA) or crossing point (CP) in LightCycler® literature (Roche Applied Science, Indianapolis, IN, USA) (2,10). This value is representative of the starting copy number in the original template and is used to calculate experimental results. During the log-linear phase, PCR reaches its optimal amplification period with the PCR product doubling after every cycle in ideal reaction. Finally, the plateau stage is reached when reaction components become limited and the fluorescence intensity is no longer useful for data calculation.
Determining DNA concentration:Real-time PCR
7
Image sources: BioTechniques 2005, 39:75-85.Invitrogen, Wikipedia
SYBR green: a dye that increases in fluorescent intensity 1000x when bound to the minor groove of DNA
• The next question becomes, how do we detect the total amount of DNA produced using fluorescence?• There are a variety of creative solutions to this problem, many of which are schematically represented on
this slide. Many of these strategies use the phenomenon of fluorescence resonance energy transfer in order to quench the fluorescence of the donor or increase the fluorescence of the acceptor.
A. The simplest detection strategy to use is to include a dye that increases its fluorescence when bound to dsDNA
B. Hybridization probes work by positioning a donor and acceptor fluorophore close together using labeled probes.
C. Hydrolysis probes rely on the 5’,3’-exonuclease activity of the DNA polymerase to destroy the probe and separate the reporter fluorophore from a quencher.
D. Molecular beacons hybridize to newly synthesized DNA and, in doing so, disrupt a stem-loop structure that had originally positioned the reporter fluorophore close to a quencher.
E. Scorpions are a bit tricky to explain. It is essentially a molecular beacon attached to a primer as shown in the figure. The red circle with a line through it represents a nucleotide that can not serve as a template. So DNA synthesis is blocked when it reaches this point (in later cycles where the Scorpion-containing DNA strand is used as a template. The hairpin portion is designed to anneal to the adjacent region of newly synthesized DNA. It is this annealing that separates the quencher from the fluorophore.
F. Sunrise primers are sort of like Scorpions but with a somewhat simpler mechanism. In the double stranded PCR product that quencher is far away from the donor.
G. LUX primers include a dye that only fluoresces when the nucleotide it is attached to is incorporated into double stranded DNA. It has been found that certain dyes at the end of a hairpin structure can be quenched by certain sequences of nucleotides. In a sense, the hairpin itself is the quencher in this detection strategy.
Determining protein concentration: Ultraviolet absorbance
Trp # 5500 M-1cm-1 at 280nmTyr# 1490 M-1cm-1 at 280nmCys-Cys#125 M-1cm-1 at 280nm - note that this is per cystine (a.k.a disulfide)
In 6.0 M guanidium hydrochloride, 0.02 M phosphate buffer, pH 6.5.
Very good overview of protein concentration determination:http://www-class.unl.edu/biochem/protein_assay/
8
Amino acids with absorbance at 280 nm
• Determination of protein concentration by ultraviolet absorption (at 280 nm) depends almost entirely on the presence of aromatic amino acids in proteins. Tyrosine and tryptophan absorb at approximately 280 nm. Disulfides also absorb at 280 nm, but much more weakly. The real advantages of this method of determining protein concentration are that the sample is not destroyed and that it is very rapid.
• Different proteins will have different amino acid compositions and thus different molar absorptivity's. However, if you know the sequence of the protein, you can easily calculate a theoretical extinction coefficient based on the number of Trp, Tyr, and disulfide bonds in the protein. There are a number of online tools that can do this calculation for you.
• An even more quick and dirty method for estimating the protein concentration is to use [Protein] (mg/mL) = 1.55*A280 - 0.76*A260 . This method assumes that all proteins have more or less the same number of tryptophans and tyrosines.
• To make an even more accurate determination of protein concentration, you could produce a standard curve (A280) with known amounts of purified protein. You will also have to provide a blank that is appropriate for the sample and contains the same concentrations of buffer and salts as the sample. It is often convenient to dialyze the sample and measure the absorbance of the retentate (still in the dialysis sack) using the dialysate as the blank. Care must be taken to use quartz cuvettes, since glass absorbs UV light.
• For increased sensitivity, the wavelength can be lowered to the range of 210 to 225 nm. This measures the amide bond in proteins. However it is much more subject to interference from many more biological components and compounds used to make buffer solutions.
• In principle, you could also use the intrinsic fluorescence of your protein as a measure of protein concentration. Trp is the primary contributor to intrinsic fluorescence of proteins. Trp fluorescence is much less predictable than extinction coefficient, so the only way to do this with any degree of confidence would be to first make a standard curve with known concentrations of your protein.
binds to positively charged (mostly Arg) and aromatic amino acidschanges colour from pale red to blueprotein complex has absorbance maximum at 590 nm
popular because it is fast (~5 min) and simple however, some disadvantages
absorbance increase is non-linear generally underestimates protein concentrations relative to other methods
• The Bradford assay is a very popular protein assay method because it is simple, rapid, inexpensive and sensitive. The Bradford assay works by the action of Coomassie brilliant blue G-250 dye (CBBG). This dye specifically binds to proteins at arginine, tryptophan, tyrosine, histidine and phenylalanine residues. It should be noted that the assay primarily responds to arginine residues (eight times as much as the other listed residues) so if you have an arginine rich protein, you may need to find a standard that is arginine rich as well.
• CBBG binds to these residues in the anionic form, which has an absorbance maximum at 595 nm. The free dye in solution is in the cationic form, which has an absorbance maximum at 470 nm. The assay is monitored at 595 nm in a spectrophotometer, and thus measures the CBBG complex with the protein. It should be emphasized that the absorption spectra of the two forms of the dye overlap. This causes the assay to respond non-linearly in the standard curve.
• However, a standard curve is a close approximation of a straight line over relatively narrow ranges of concentrations.
• Question: In the Bradford assay: would we be maintaining the protein mix in a buffer with a pH<pI in order to ensure the + charged macromolecule for CBBG anion binding? This was not discussed and unless we are relying on the 5 amino acids that CBBG targets to be + charged at neutral pH I don't see how this assay would be very sensitive.
• Answer: It's not necessary to think about the overall pI in this case, just the pKa of the individual amino acids. For example, arginine will always be protonated at any reasonable pH value.
Determining protein concentration: Lowry and BCA assay
Cu2+
Formation of Cu2+:amide “Biuret” complex (purple)
Cu1+
10
Folin-Ciocalteureagent
protein+
Peptide bonds & Trp, Cys, Tyr
side chains
oxidized peptide bonds & Trp, Cys, Tyr
side chainsBCA
BCA:Cu+1 complex (562 nm absorbance)
Reduced Folin-Ciocalteu (660 nm absorbance) Lowry
BCA is generally the preferred method, though lipids can interfere
Lowry is not quite as popular as BCA, but better for protein samples with lipid contamination
• The Lowry method relies on two different reactions. The first is the formation of a copper ion complex with amide bonds. This is called a "Biuret" chromophore. The second is the reduction of Folin-Ciocalteu reagent (phosphomolybdate and phosphotungstate).
• The reduced Folin-Ciocalteu reagent is blue and thus detectable with a spectrophotometer in the range of 500-750 nm. The Biuret reaction itself is not all that sensitive. Using the Folin-Ciocalteu reagent to detect reduced copper makes the assay nearly 100 times more sensitive than the Biuret reaction alone. The assay is relatively sensitive, but takes more time than other assays and is susceptible to many interfering compounds.
• Many substances are known to interfere with the Lowry assay: detergents, carbohydrates, glycerol, Tricine, EDTA, Tris, potassium compounds, sulfhydryl compounds, disulfide compounds, magnesium and calcium. Most of these interfering substances are commonly used in buffers for preparing proteins. This is one of the major limitations of the assay.
• The Lowry assay is sensitive to variations in the content of tyrosine and tryptophan residues. If the protein you are assaying has an unusual content of these residues, an appropriate substitute standard is required. The standard curve is linear in the 1 to 100 µg protein region. Most researchers use 660 nm, but other wavelengths also work and may reduce the effects of contamination (e.g. chlorophyll in plant samples interferes at 660 nm, but not at 750 nm).
• The BCA assay is similar to Lowry assay, except that the Folin-Ciocalteu reagent used in the Lowry assay is replaced with bicinchoninic acid (BCA). The BCA reagent forms a complex with Cu+1, which has a strong absorbance at 562 nm. BCA is advantageous in that it does not interact with as many substances as the Folin-Ciocalteu reagent, especially detergents and buffers. The BCA assay is limited in that it interacts with most reducing agents and copper chelators. In general, these are not critical components of buffers and can be easily eliminated prior to assay.
Ninhydrin methodProtein is first completely hydrolyzed
(6 M HCl, 100 C, 24 h) to liberate ammonia from the peptide bonds.
absorbance ~ 560-580 nm
fluorescence ~550 nm
fluorescence ~464 nm
fluorescence ~455 nm
what determines the steepness of
the line?
• Other fluorescent assays involve dyes that specifically react with primary amines (lysines and N-terminus). The main source of variation would be number of exposed lysine residues. One example is CBQCA. Note that this is a variation on classic and widely available method for detecting amines. Molecular Probes has improved upon the classic reagents and made it work somewhat better (i.e. longer wavelength, lower background)
• In general, fluorescence is 100’s to 1000’s of times more sensitive than absorbance for any quantification, including proteins.
The NanoOrange assay is a
proprietary protein assay kit sold by Molecular Probes
(Invitrogen)
12
not exactly insightful
instructions...
• Molecular probes (and others) have introduced additional fluorescence-based assays for determining protein concentration.
• Nanoorange is a patented technology and Molecular probes does not reveal the structure in their literature (http://probes.invitrogen.com/handbook/sections/0902.html)
• One of the big advantages of NanoOrange (as claimed by the manufacturer) is little protein-to-protein variation. How could this be possible?
•
Direct detection and quantitation of biomolecules in solution
•Protein and DNA concentration can be determined by either intrinsic absorbance or by a variety of colorimetric or fluorescent assays.
•For most assays, a standard curve is required•Since protein assays tend to depend on specific properties of the protein
sequence, the best protein for a standard curve is the protein of interest.•Fluorescence-based detection is much more sensitive than absorbance-
based detection.•Many of the same methods that are used for determining protein and DNA
concentrations in solution can also be used to detect protein and DNA in gels.