23
Chem, Volume 3 Supplemental Information High-Throughput Multi-parametric Imaging Flow Cytometry Anandkumar S. Rane, Justina Rutkauskaite, Andrew deMello, and Stavros Stavrakis
Chem, Volume 3
Supplemental Information
High-Throughput Multi-parametric
Imaging Flow Cytometry
Anandkumar S. Rane, Justina Rutkauskaite, Andrew deMello, and Stavros Stavrakis
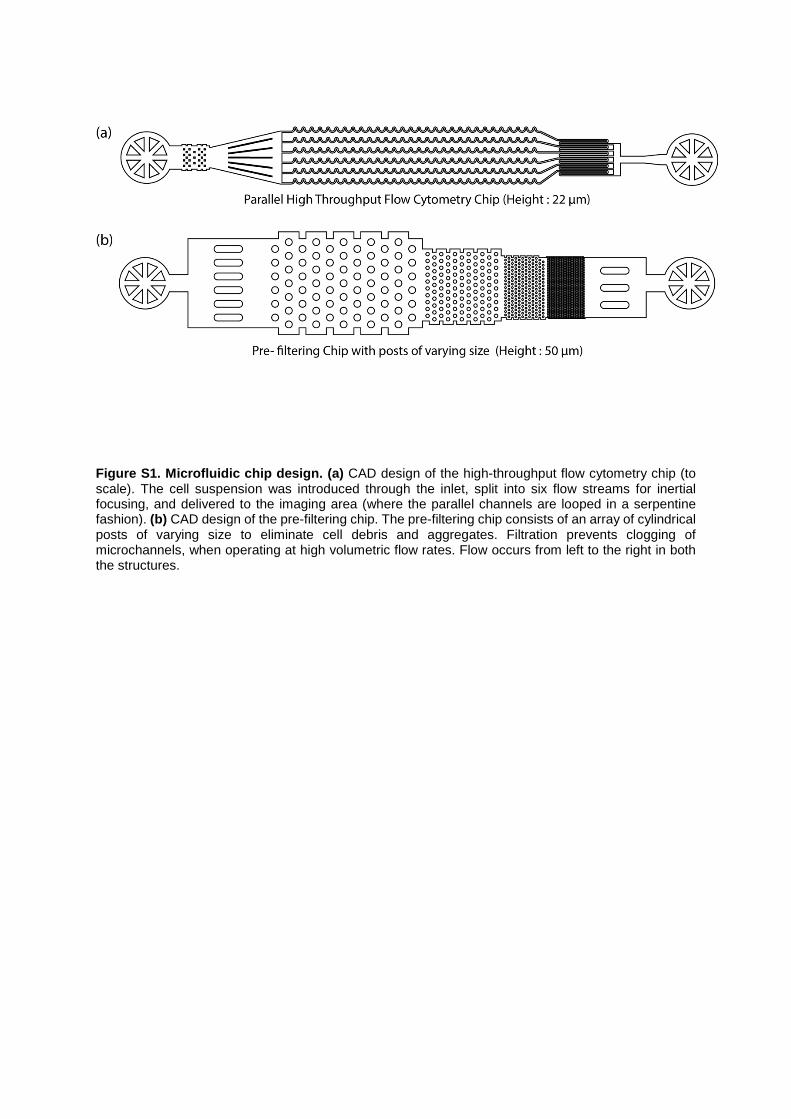
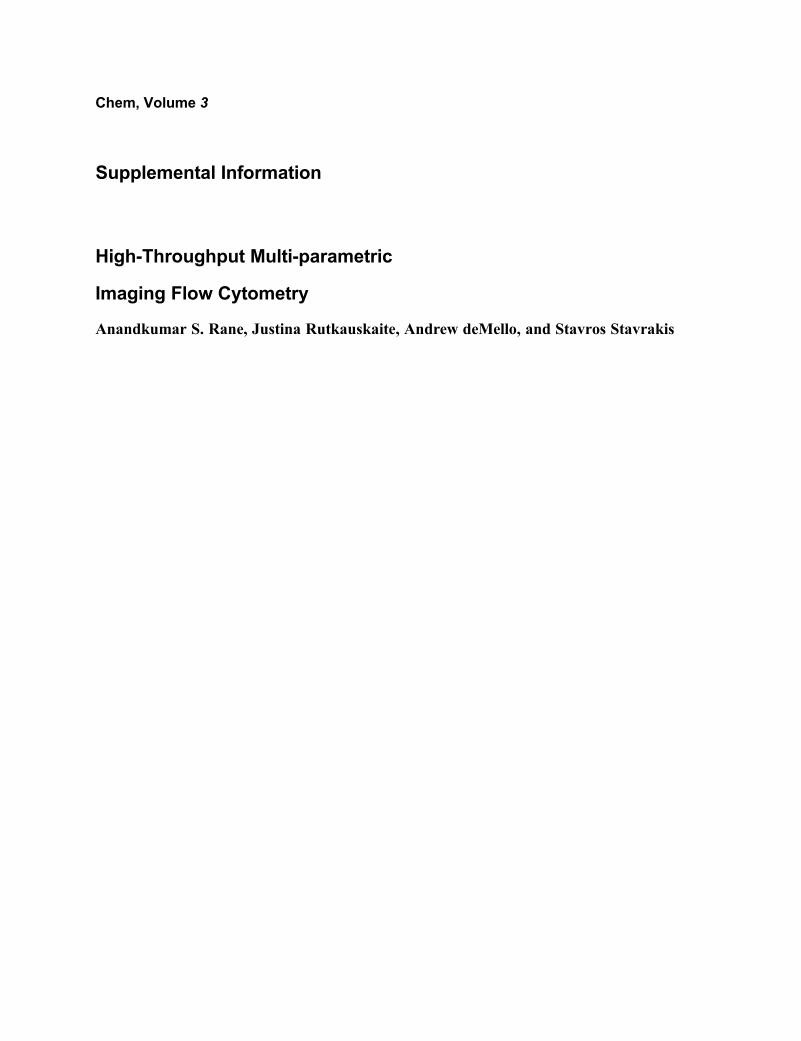
Figure S1. Microfluidic chip design. (a) CAD design of the high-throughput flow cytometry chip (to scale). The cell suspension was introduced through the inlet, split into six flow streams for inertial focusing, and delivered to the imaging area (where the parallel channels are looped in a serpentine fashion). (b) CAD design of the pre-filtering chip. The pre-filtering chip consists of an array of cylindrical posts of varying size to eliminate cell debris and aggregates. Filtration prevents clogging of microchannels, when operating at high volumetric flow rates. Flow occurs from left to the right in both the structures.
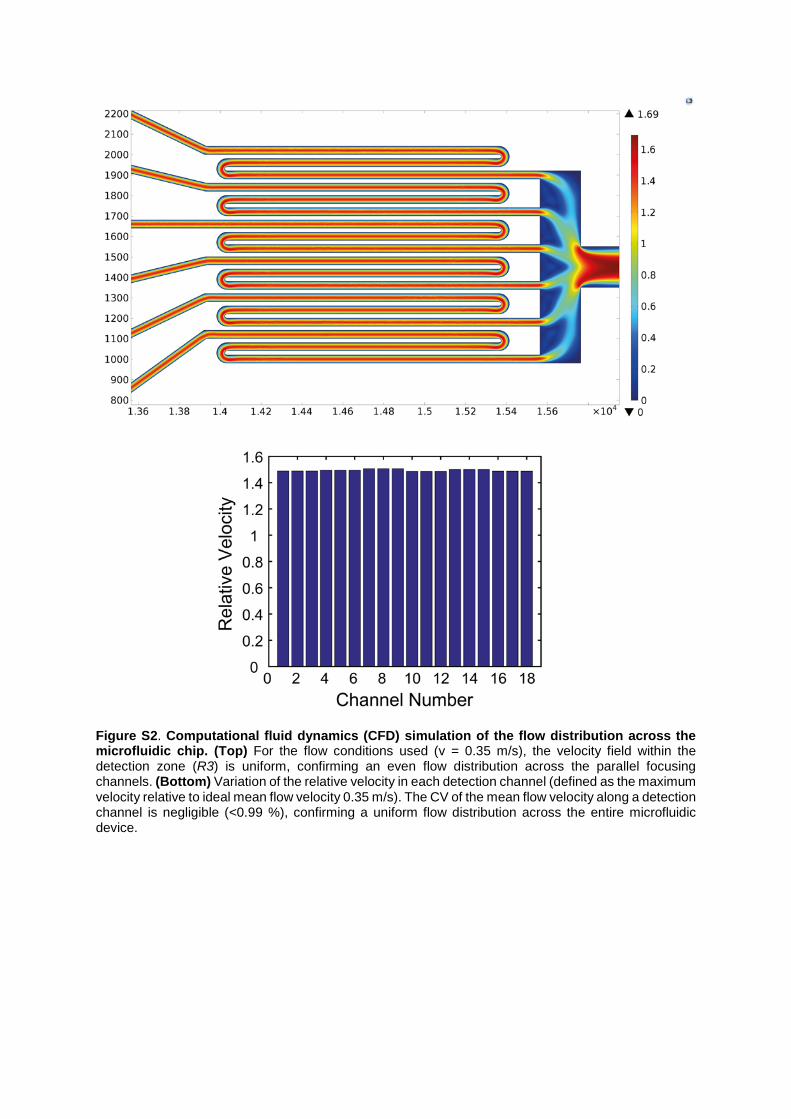
Figure S2. Computational fluid dynamics (CFD) simulation of the flow distribution across the microfluidic chip. (Top) For the flow conditions used (v = 0.35 m/s), the velocity field within the detection zone (R3) is uniform, confirming an even flow distribution across the parallel focusing channels. (Bottom) Variation of the relative velocity in each detection channel (defined as the maximum velocity relative to ideal mean flow velocity 0.35 m/s). The CV of the mean flow velocity along a detection channel is negligible (<0.99 %), confirming a uniform flow distribution across the entire microfluidic device.
Figure S3. Computational fluid dynamics simulations of the inertial focusing process.COMSOL simulations reporting the inertial focusing of 10 m particles. The microfluidic channel shown on the left hand side represents a functional unit of the parallel focusing zone (R2). The particle-tracing module of COMSOL is used to numerically evaluate the inertial focusing of the particles. Under the influence of the operating flow velocities (v = 0.35 m/s), simulations show that close to the inlet particles occupy positions across the entire cross-section of the channel (a). As they flow through the curved sections they are focused at a fixed position across the channel cross-section and move at a constant velocity (b).
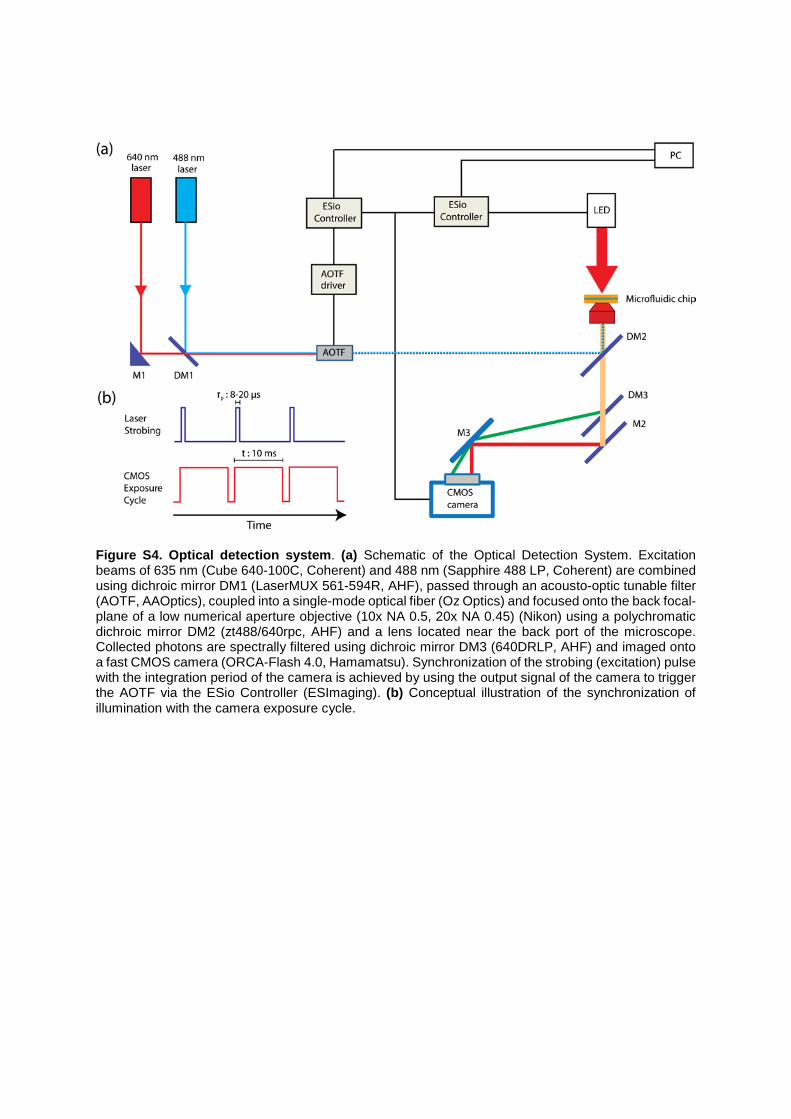
Figure S4. Optical detection system. (a) Schematic of the Optical Detection System. Excitation beams of 635 nm (Cube 640-100C, Coherent) and 488 nm (Sapphire 488 LP, Coherent) are combined using dichroic mirror DM1 (LaserMUX 561-594R, AHF), passed through an acousto-optic tunable filter (AOTF, AAOptics), coupled into a single-mode optical fiber (Oz Optics) and focused onto the back focal-plane of a low numerical aperture objective (10x NA 0.5, 20x NA 0.45) (Nikon) using a polychromatic dichroic mirror DM2 (zt488/640rpc, AHF) and a lens located near the back port of the microscope. Collected photons are spectrally filtered using dichroic mirror DM3 (640DRLP, AHF) and imaged onto a fast CMOS camera (ORCA-Flash 4.0, Hamamatsu). Synchronization of the strobing (excitation) pulse with the integration period of the camera is achieved by using the output signal of the camera to trigger the AOTF via the ESio Controller (ESImaging). (b) Conceptual illustration of the synchronization of illumination with the camera exposure cycle.
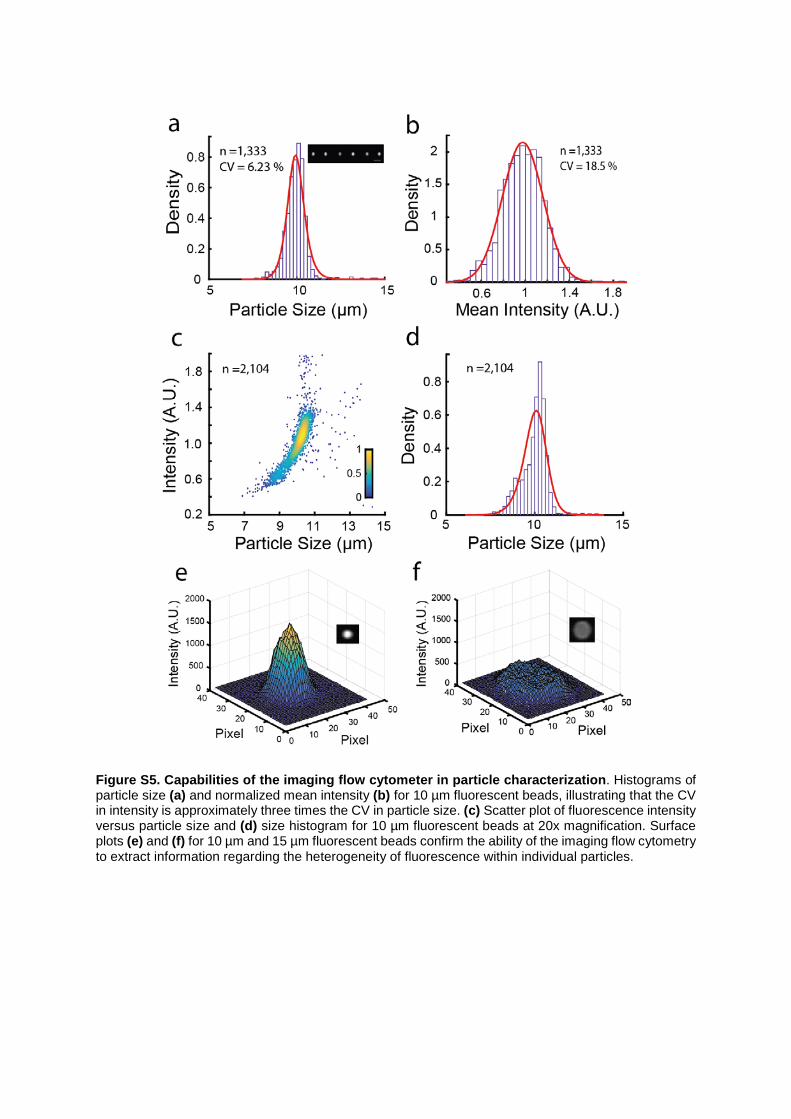
Figure S5. Capabilities of the imaging flow cytometer in particle characterization. Histograms of particle size (a) and normalized mean intensity (b) for 10 µm fluorescent beads, illustrating that the CV in intensity is approximately three times the CV in particle size. (c) Scatter plot of fluorescence intensity versus particle size and (d) size histogram for 10 µm fluorescent beads at 20x magnification. Surface plots (e) and (f) for 10 µm and 15 µm fluorescent beads confirm the ability of the imaging flow cytometry to extract information regarding the heterogeneity of fluorescence within individual particles.
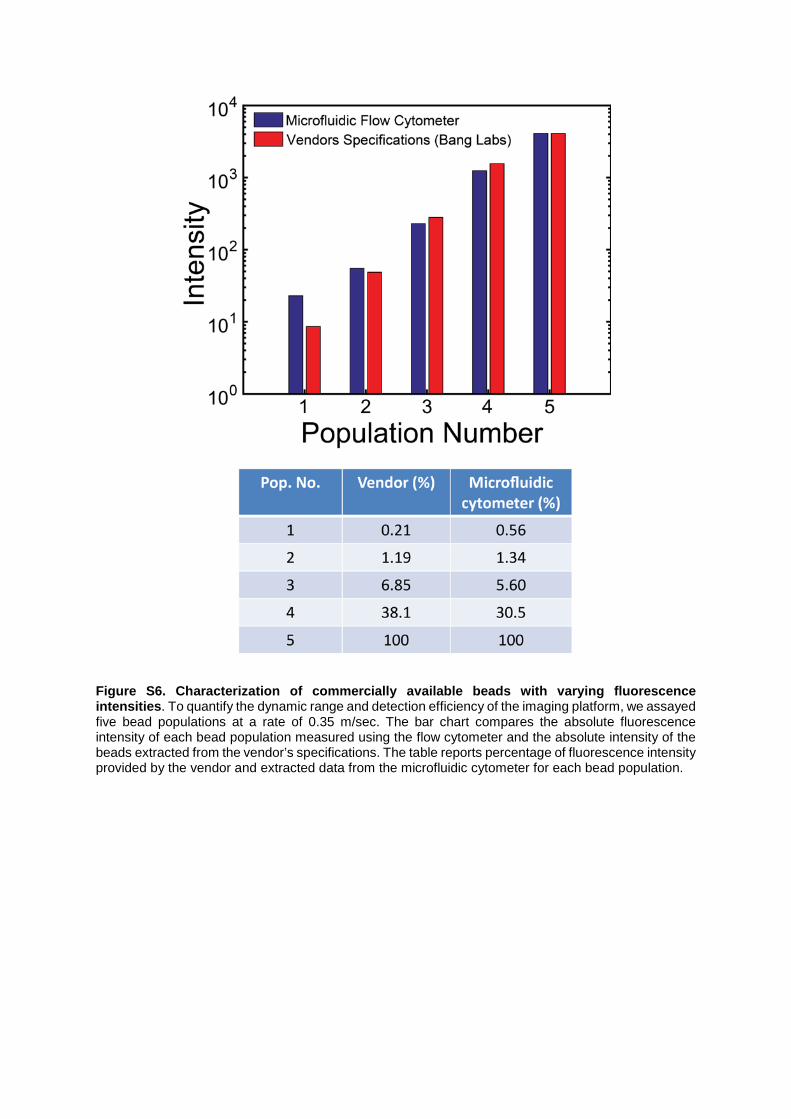
Figure S6. Characterization of commercially available beads with varying fluorescence intensities. To quantify the dynamic range and detection efficiency of the imaging platform, we assayed five bead populations at a rate of 0.35 m/sec. The bar chart compares the absolute fluorescence intensity of each bead population measured using the flow cytometer and the absolute intensity of the beads extracted from the vendor’s specifications. The table reports percentage of fluorescence intensity provided by the vendor and extracted data from the microfluidic cytometer for each bead population.
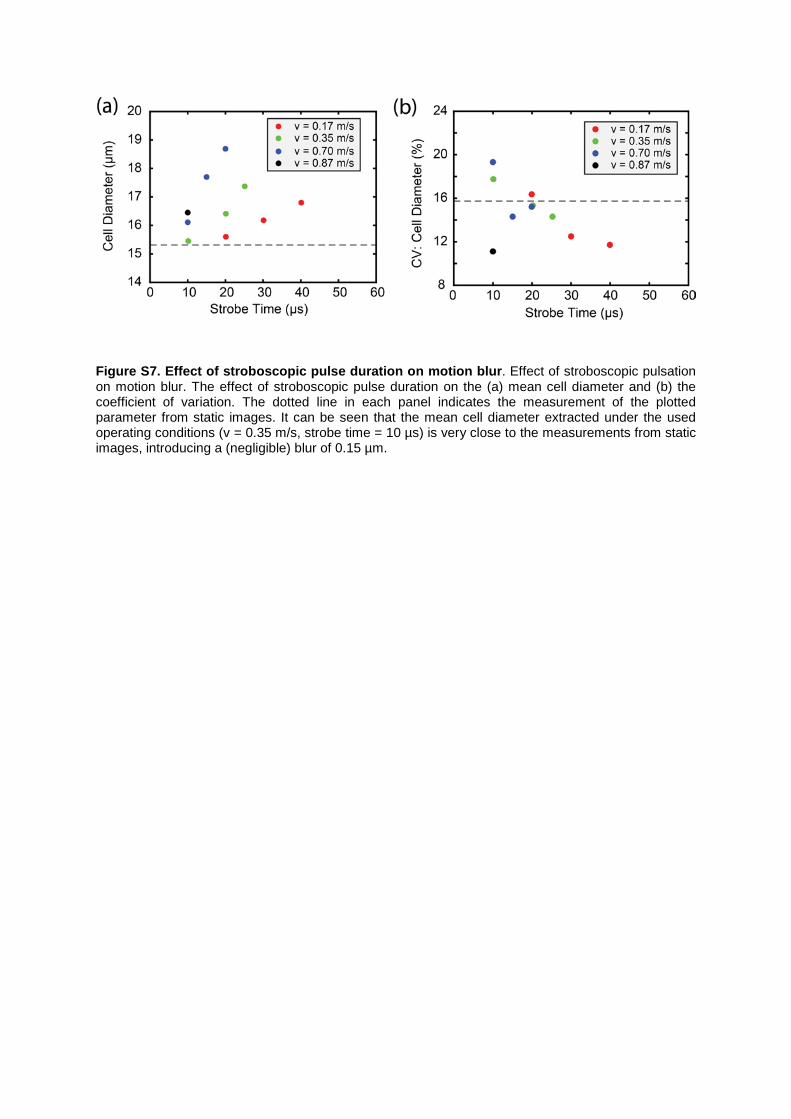
Figure S7. Effect of stroboscopic pulse duration on motion blur. Effect of stroboscopic pulsation on motion blur. The effect of stroboscopic pulse duration on the (a) mean cell diameter and (b) the coefficient of variation. The dotted line in each panel indicates the measurement of the plotted parameter from static images. It can be seen that the mean cell diameter extracted under the used operating conditions (v = 0.35 m/s, strobe time = 10 µs) is very close to the measurements from static images, introducing a (negligible) blur of 0.15 µm.
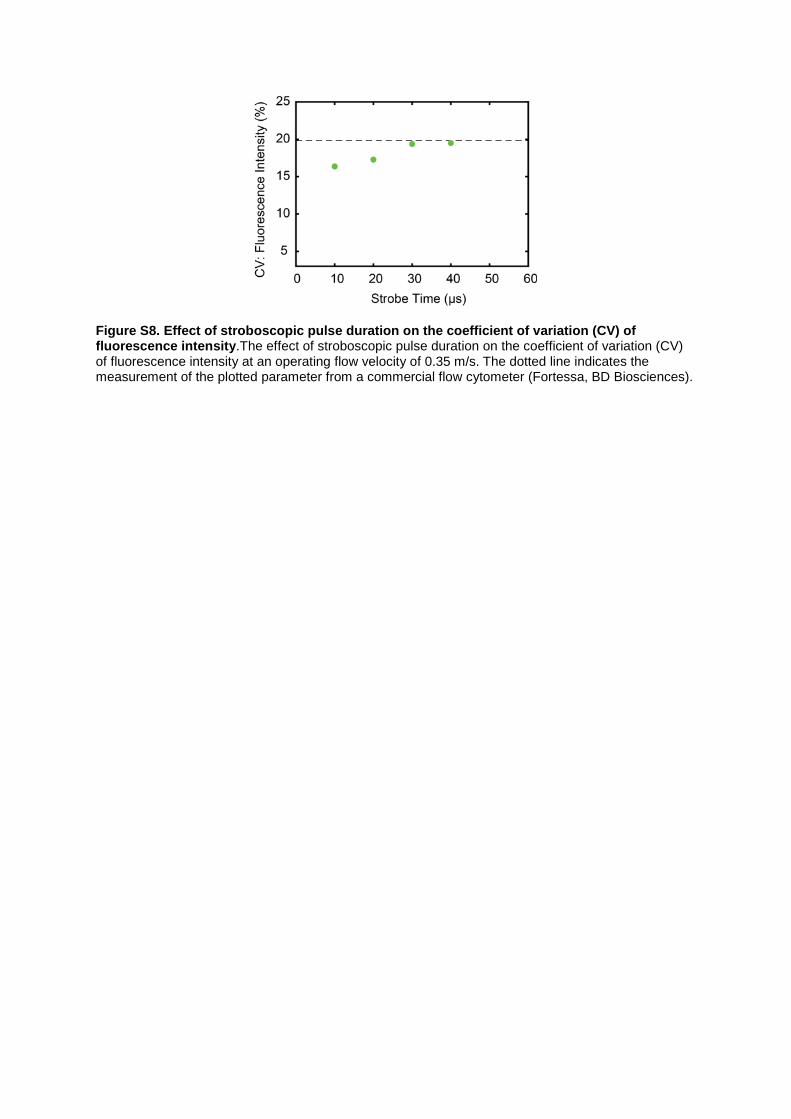
Figure S8. Effect of stroboscopic pulse duration on the coefficient of variation (CV) of fluorescence intensity.The effect of stroboscopic pulse duration on the coefficient of variation (CV) of fluorescence intensity at an operating flow velocity of 0.35 m/s. The dotted line indicates the measurement of the plotted parameter from a commercial flow cytometer (Fortessa, BD Biosciences).
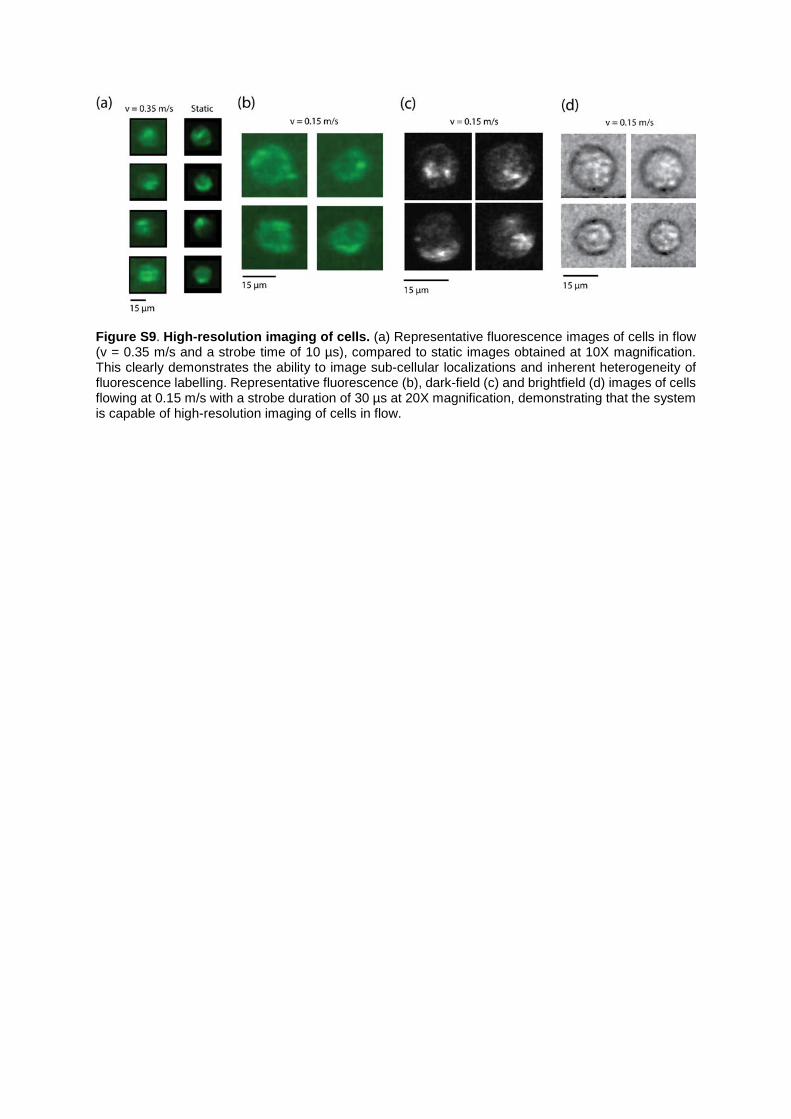
Figure S9. High-resolution imaging of cells. (a) Representative fluorescence images of cells in flow (v = 0.35 m/s and a strobe time of 10 µs), compared to static images obtained at 10X magnification. This clearly demonstrates the ability to image sub-cellular localizations and inherent heterogeneity of fluorescence labelling. Representative fluorescence (b), dark-field (c) and brightfield (d) images of cells flowing at 0.15 m/s with a strobe duration of 30 µs at 20X magnification, demonstrating that the system is capable of high-resolution imaging of cells in flow.
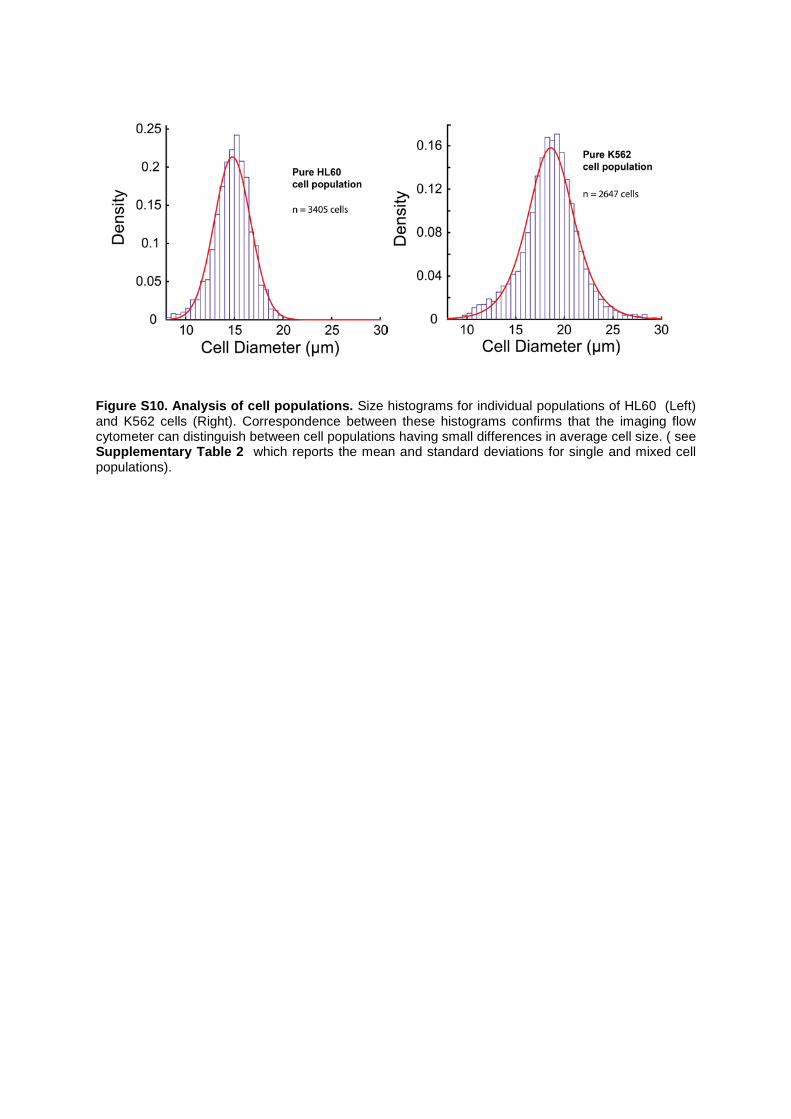
Figure S10. Analysis of cell populations. Size histograms for individual populations of HL60 (Left) and K562 cells (Right). Correspondence between these histograms confirms that the imaging flow cytometer can distinguish between cell populations having small differences in average cell size. ( see Supplementary Table 2 which reports the mean and standard deviations for single and mixed cell populations).
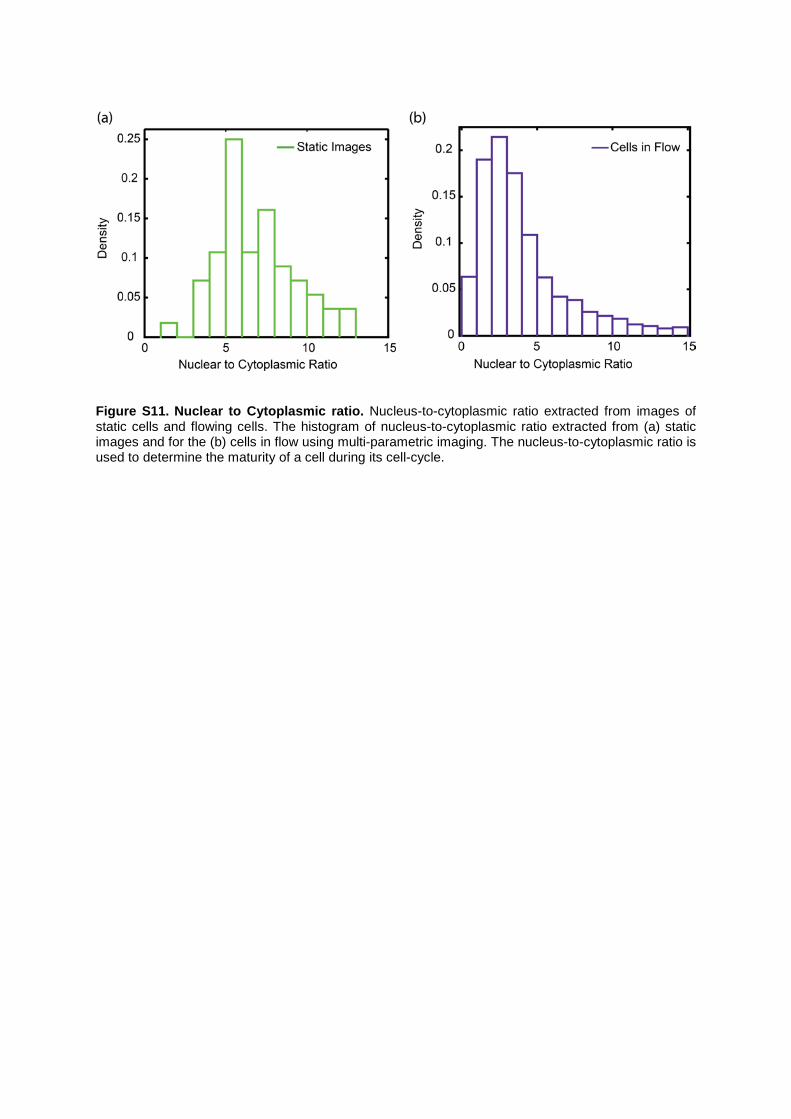
Figure S11. Nuclear to Cytoplasmic ratio. Nucleus-to-cytoplasmic ratio extracted from images of static cells and flowing cells. The histogram of nucleus-to-cytoplasmic ratio extracted from (a) static images and for the (b) cells in flow using multi-parametric imaging. The nucleus-to-cytoplasmic ratio is used to determine the maturity of a cell during its cell-cycle.
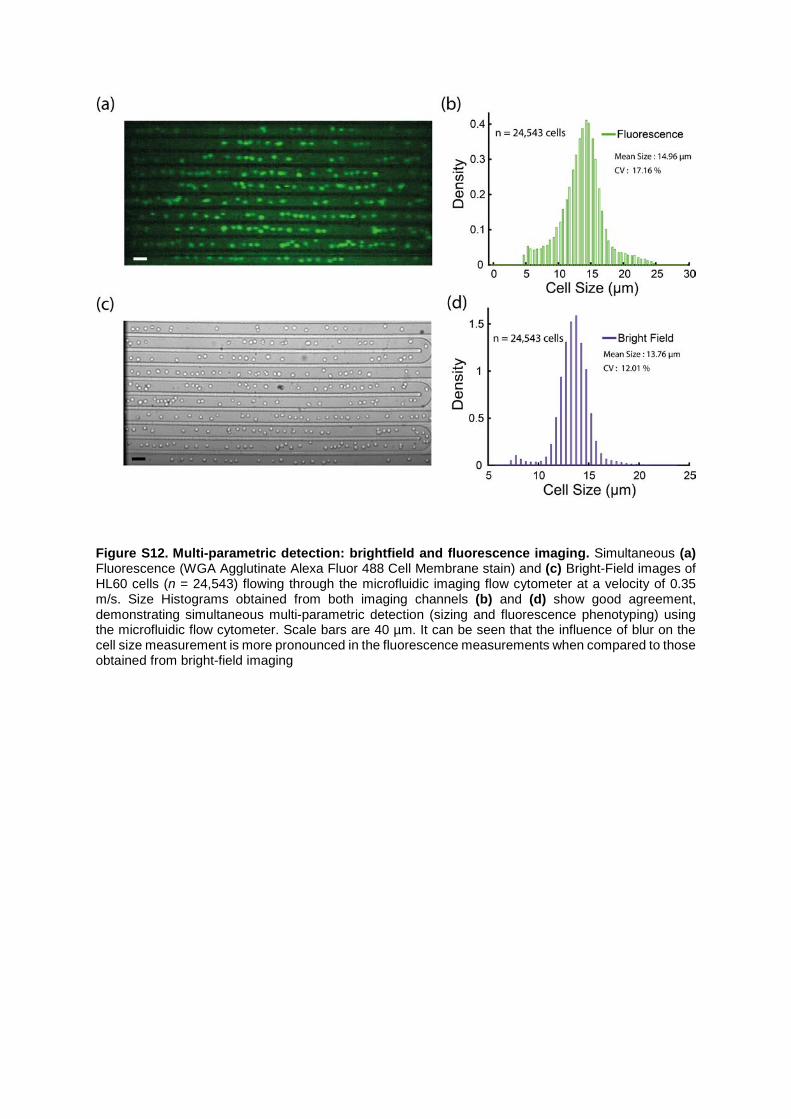
Figure S12. Multi-parametric detection: brightfield and fluorescence imaging. Simultaneous (a) Fluorescence (WGA Agglutinate Alexa Fluor 488 Cell Membrane stain) and (c) Bright-Field images of HL60 cells (n = 24,543) flowing through the microfluidic imaging flow cytometer at a velocity of 0.35 m/s. Size Histograms obtained from both imaging channels (b) and (d) show good agreement, demonstrating simultaneous multi-parametric detection (sizing and fluorescence phenotyping) using the microfluidic flow cytometer. Scale bars are 40 µm. It can be seen that the influence of blur on the cell size measurement is more pronounced in the fluorescence measurements when compared to those obtained from bright-field imaging
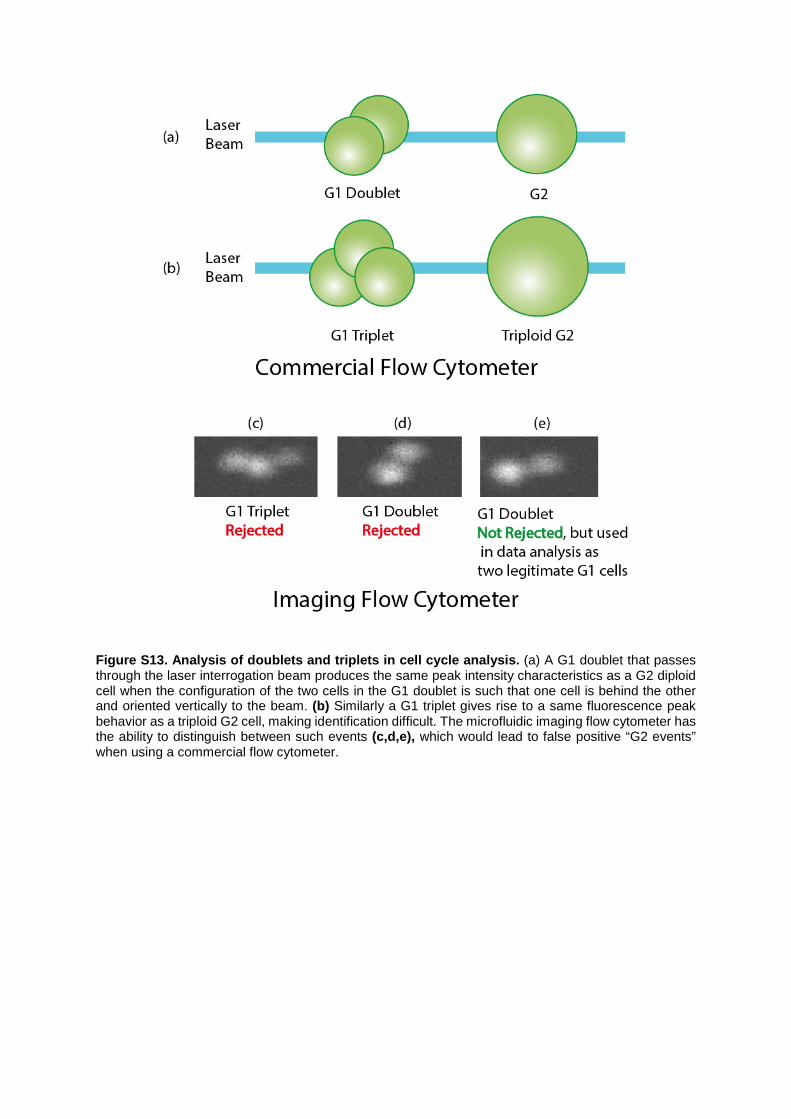
Figure S13. Analysis of doublets and triplets in cell cycle analysis. (a) A G1 doublet that passes through the laser interrogation beam produces the same peak intensity characteristics as a G2 diploid cell when the configuration of the two cells in the G1 doublet is such that one cell is behind the other and oriented vertically to the beam. (b) Similarly a G1 triplet gives rise to a same fluorescence peak behavior as a triploid G2 cell, making identification difficult. The microfluidic imaging flow cytometer has the ability to distinguish between such events (c,d,e), which would lead to false positive “G2 events” when using a commercial flow cytometer.
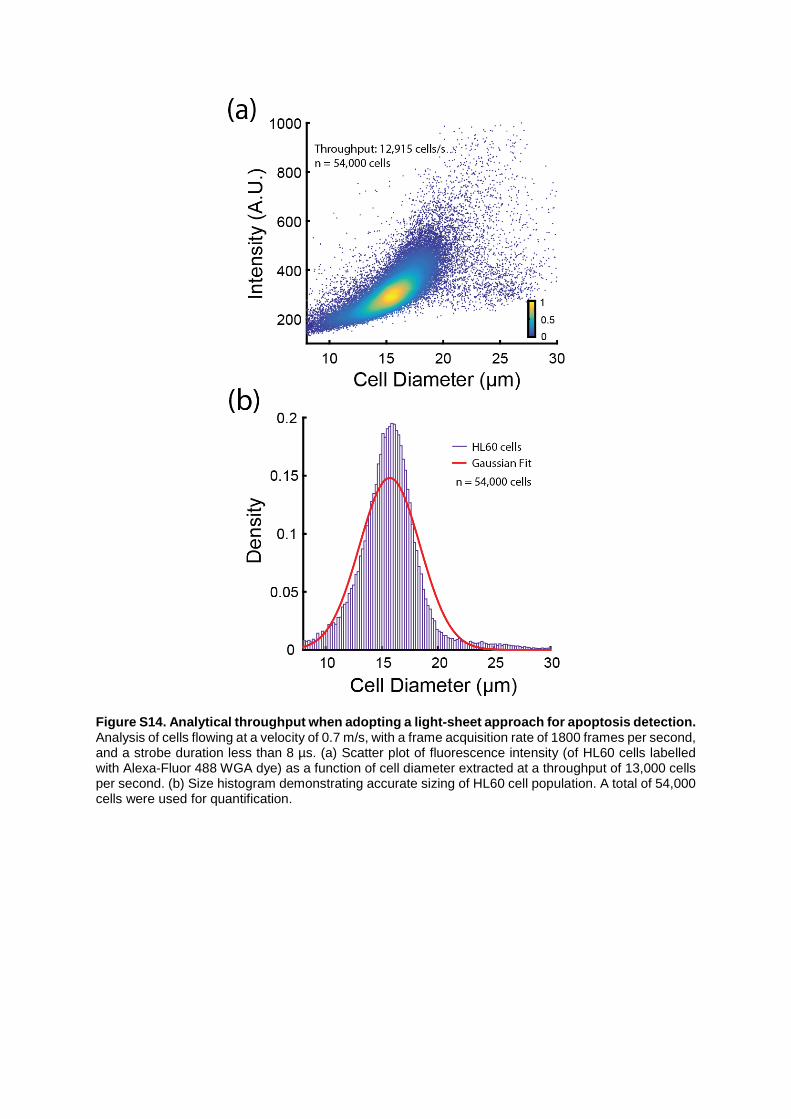
Figure S14. Analytical throughput when adopting a light-sheet approach for apoptosis detection. Analysis of cells flowing at a velocity of 0.7 m/s, with a frame acquisition rate of 1800 frames per second, and a strobe duration less than 8 µs. (a) Scatter plot of fluorescence intensity (of HL60 cells labelled with Alexa-Fluor 488 WGA dye) as a function of cell diameter extracted at a throughput of 13,000 cells per second. (b) Size histogram demonstrating accurate sizing of HL60 cell population. A total of 54,000 cells were used for quantification.
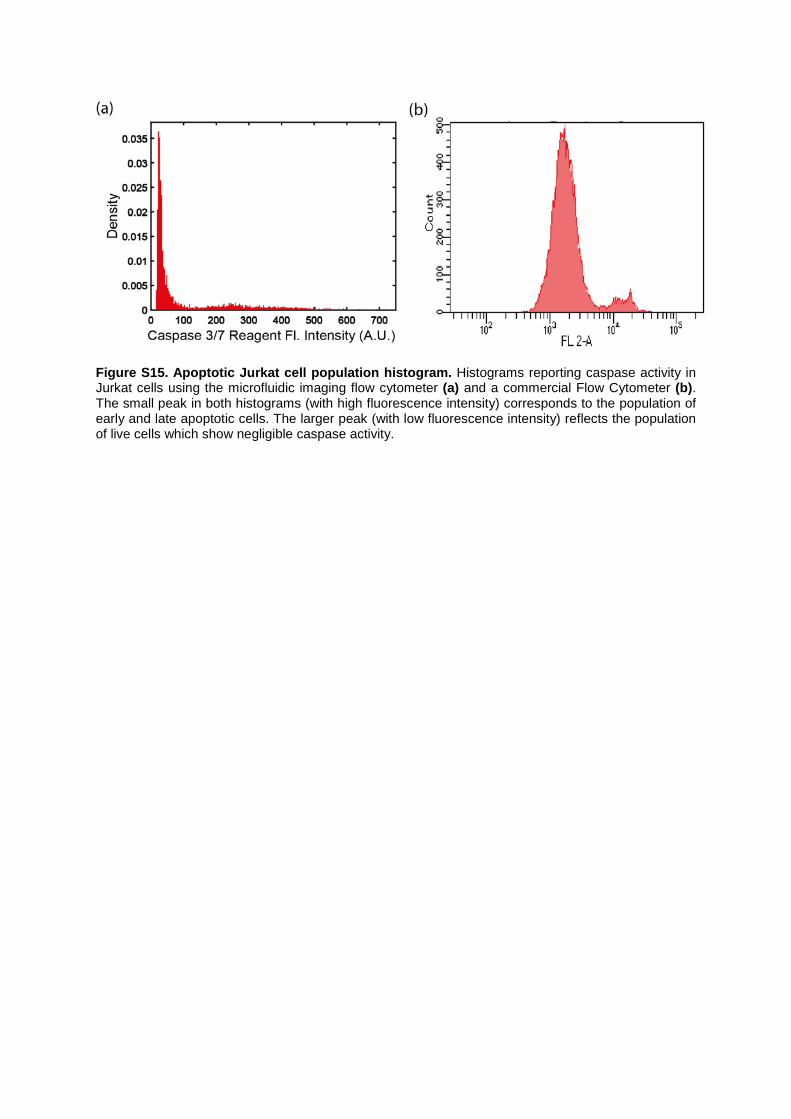
Figure S15. Apoptotic Jurkat cell population histogram. Histograms reporting caspase activity in Jurkat cells using the microfluidic imaging flow cytometer (a) and a commercial Flow Cytometer (b). The small peak in both histograms (with high fluorescence intensity) corresponds to the population of early and late apoptotic cells. The larger peak (with low fluorescence intensity) reflects the population of live cells which show negligible caspase activity.
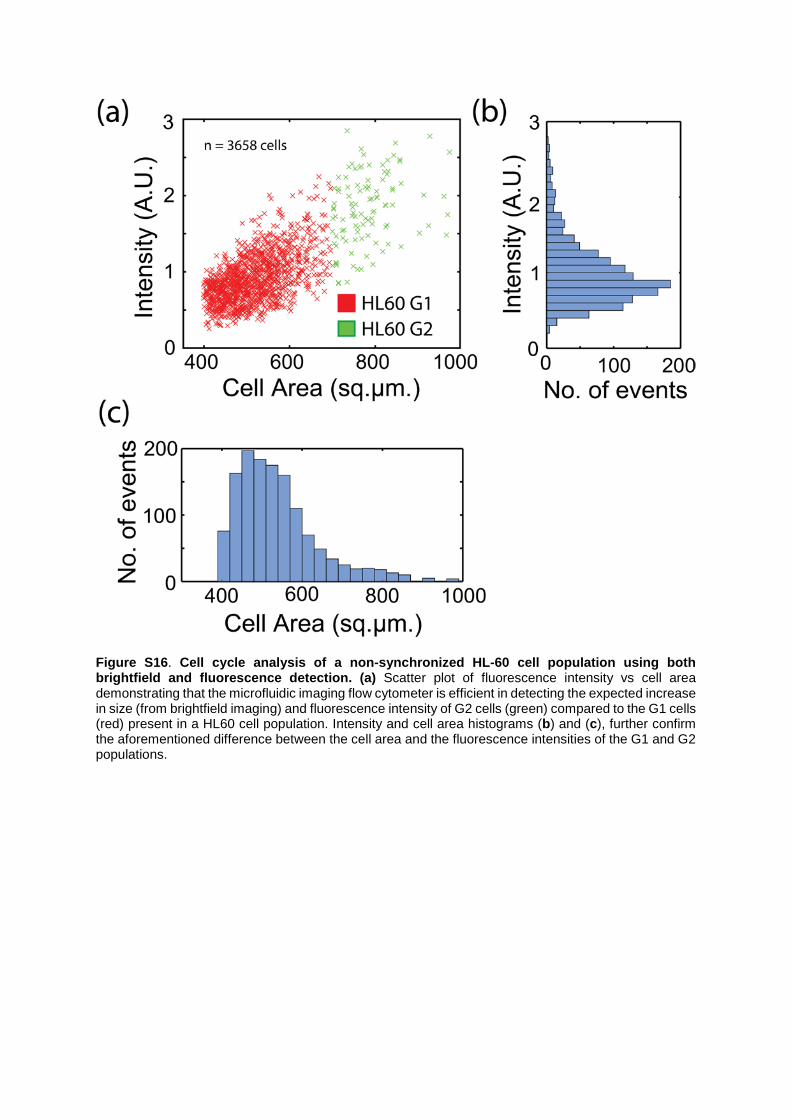
Figure S16. Cell cycle analysis of a non-synchronized HL-60 cell population using both brightfield and fluorescence detection. (a) Scatter plot of fluorescence intensity vs cell area demonstrating that the microfluidic imaging flow cytometer is efficient in detecting the expected increase in size (from brightfield imaging) and fluorescence intensity of G2 cells (green) compared to the G1 cells (red) present in a HL60 cell population. Intensity and cell area histograms (b) and (c), further confirm the aforementioned difference between the cell area and the fluorescence intensities of the G1 and G2 populations.
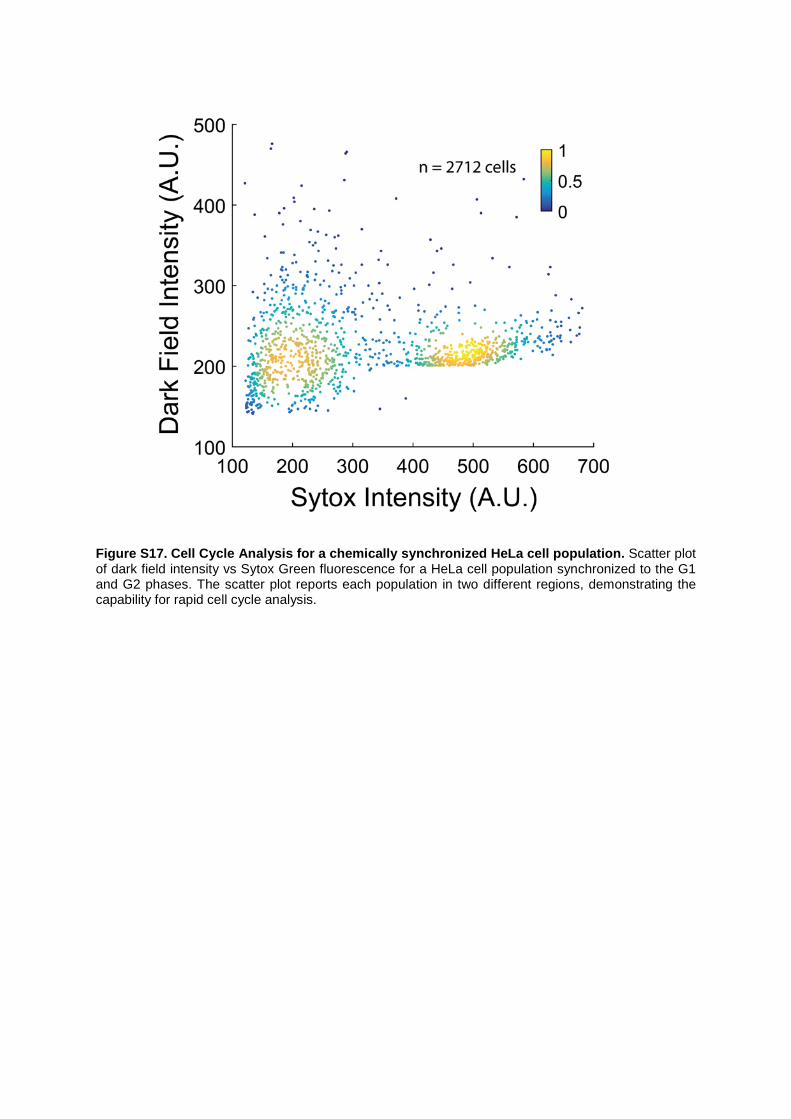
Figure S17. Cell Cycle Analysis for a chemically synchronized HeLa cell population. Scatter plot of dark field intensity vs Sytox Green fluorescence for a HeLa cell population synchronized to the G1 and G2 phases. The scatter plot reports each population in two different regions, demonstrating the capability for rapid cell cycle analysis.
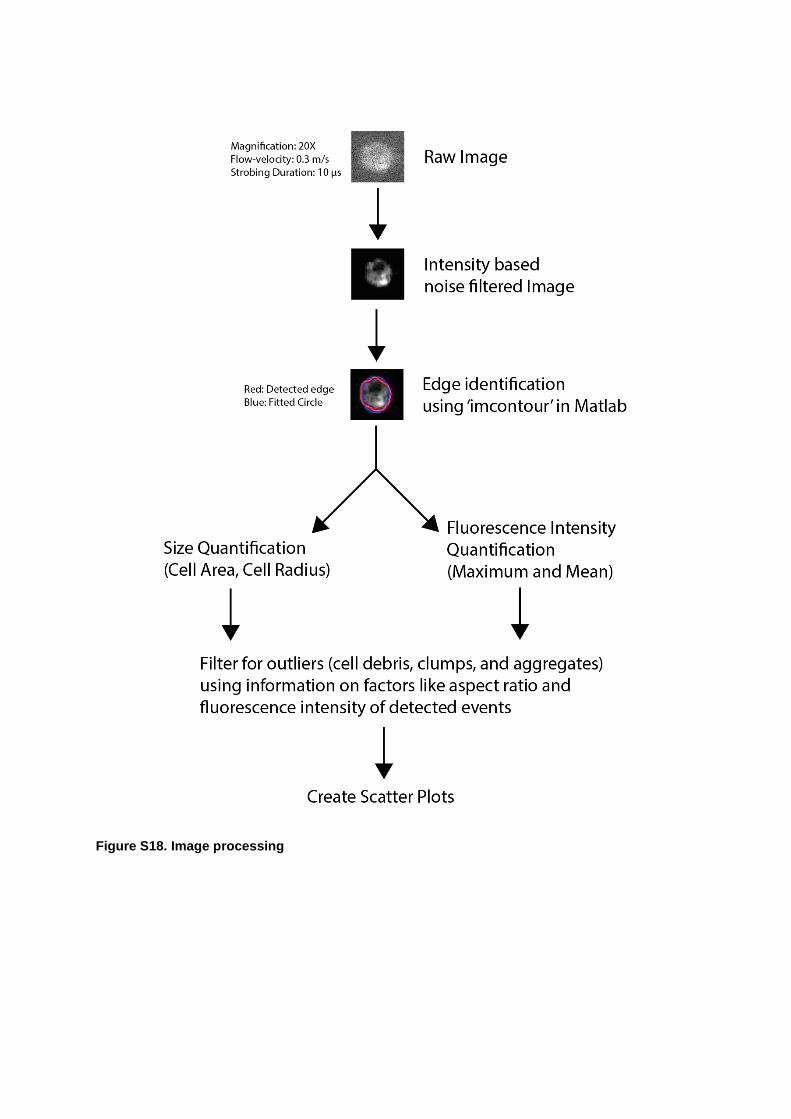
Figure S18. Image processing
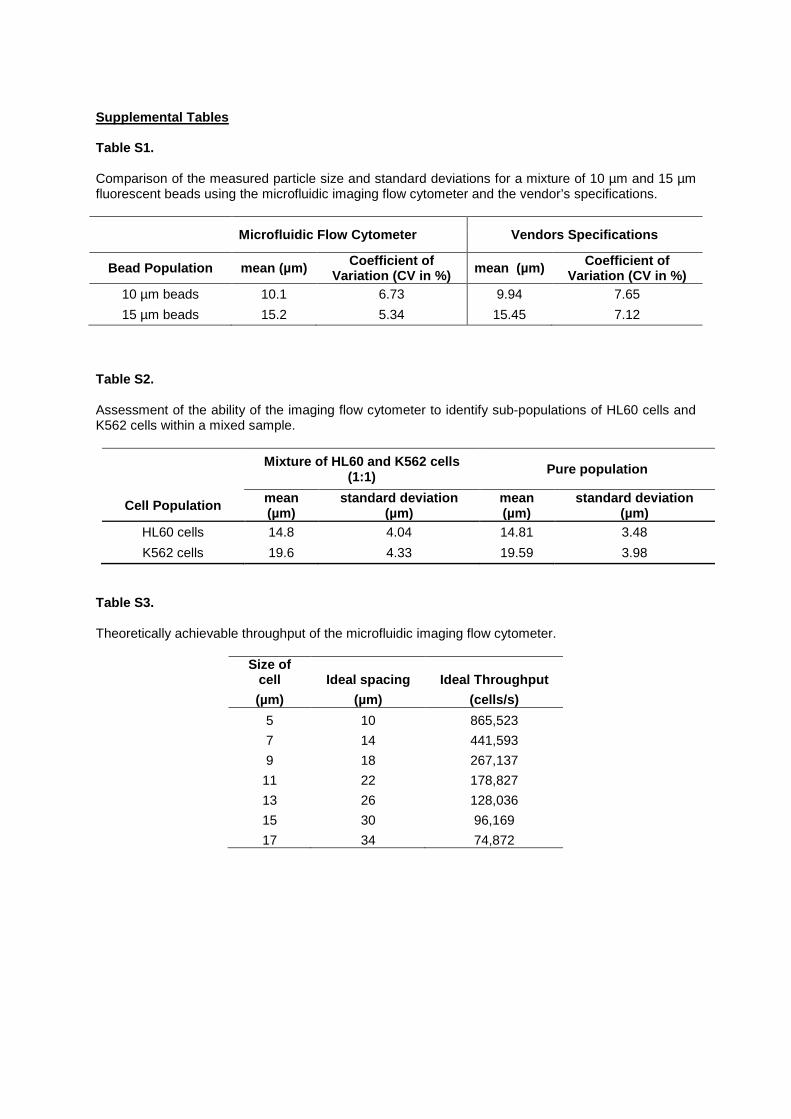
Supplemental Tables Table S1. Comparison of the measured particle size and standard deviations for a mixture of 10 µm and 15 µm fluorescent beads using the microfluidic imaging flow cytometer and the vendor’s specifications.
Microfluidic Flow Cytometer Vendors Specifications
Bead Population mean (µm) Coefficient of Variation (CV in %) mean (µm) Coefficient of
Variation (CV in %) 10 µm beads 10.1 6.73 9.94 7.65 15 µm beads 15.2 5.34 15.45 7.12
Table S2. Assessment of the ability of the imaging flow cytometer to identify sub-populations of HL60 cells and K562 cells within a mixed sample.
Mixture of HL60 and K562 cells (1:1) Pure population
Cell Population mean (µm)
standard deviation (µm)
mean (µm)
standard deviation (µm)
HL60 cells 14.8 4.04 14.81 3.48 K562 cells 19.6 4.33 19.59 3.98
Table S3. Theoretically achievable throughput of the microfluidic imaging flow cytometer.
Size of cell Ideal spacing Ideal Throughput (µm) (µm) (cells/s)
5 10 865,523 7 14 441,593 9 18 267,137 11 22 178,827 13 26 128,036 15 30 96,169 17 34 74,872
Supplemental Experimental Procedures
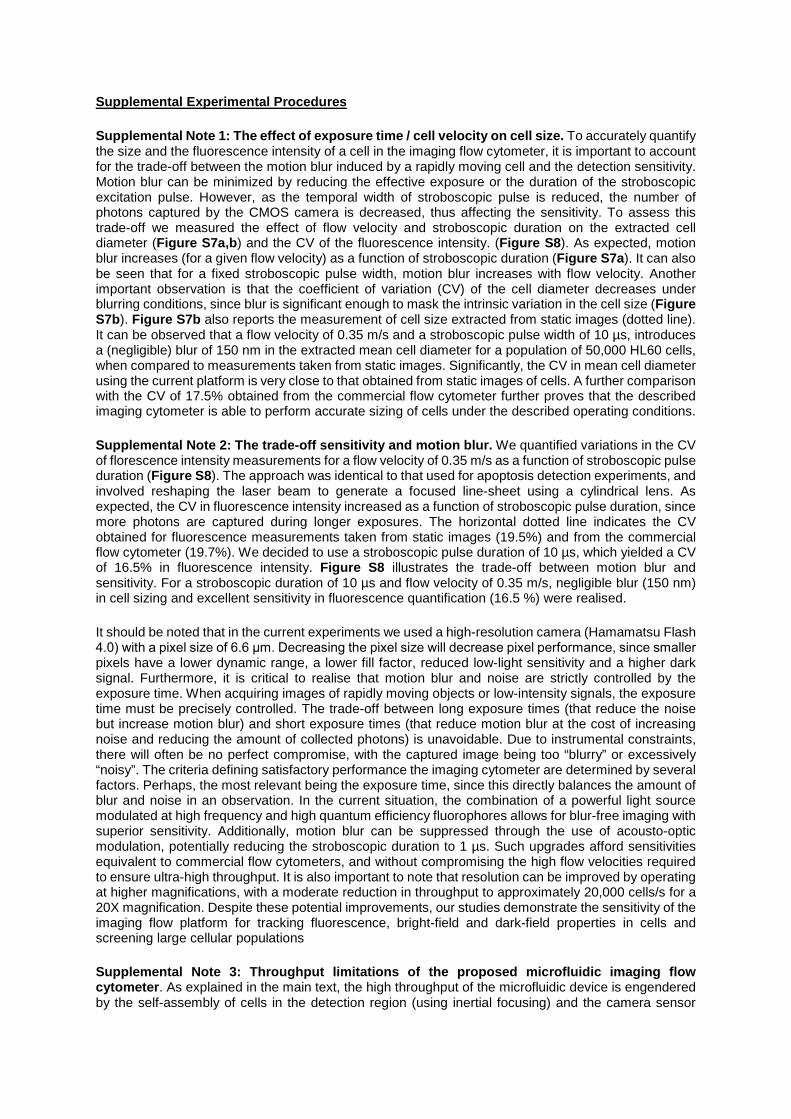
Supplemental Note 1: The effect of exposure time / cell velocity on cell size. To accurately quantify the size and the fluorescence intensity of a cell in the imaging flow cytometer, it is important to account for the trade-off between the motion blur induced by a rapidly moving cell and the detection sensitivity. Motion blur can be minimized by reducing the effective exposure or the duration of the stroboscopic excitation pulse. However, as the temporal width of stroboscopic pulse is reduced, the number of photons captured by the CMOS camera is decreased, thus affecting the sensitivity. To assess this trade-off we measured the effect of flow velocity and stroboscopic duration on the extracted cell diameter (Figure S7a,b) and the CV of the fluorescence intensity. (Figure S8). As expected, motion blur increases (for a given flow velocity) as a function of stroboscopic duration (Figure S7a). It can also be seen that for a fixed stroboscopic pulse width, motion blur increases with flow velocity. Another important observation is that the coefficient of variation (CV) of the cell diameter decreases under blurring conditions, since blur is significant enough to mask the intrinsic variation in the cell size (Figure S7b). Figure S7b also reports the measurement of cell size extracted from static images (dotted line). It can be observed that a flow velocity of 0.35 m/s and a stroboscopic pulse width of 10 µs, introduces a (negligible) blur of 150 nm in the extracted mean cell diameter for a population of 50,000 HL60 cells, when compared to measurements taken from static images. Significantly, the CV in mean cell diameter using the current platform is very close to that obtained from static images of cells. A further comparison with the CV of 17.5% obtained from the commercial flow cytometer further proves that the described imaging cytometer is able to perform accurate sizing of cells under the described operating conditions.
Supplemental Note 2: The trade-off sensitivity and motion blur. We quantified variations in the CV of florescence intensity measurements for a flow velocity of 0.35 m/s as a function of stroboscopic pulse duration (Figure S8). The approach was identical to that used for apoptosis detection experiments, and involved reshaping the laser beam to generate a focused line-sheet using a cylindrical lens. As expected, the CV in fluorescence intensity increased as a function of stroboscopic pulse duration, since more photons are captured during longer exposures. The horizontal dotted line indicates the CV obtained for fluorescence measurements taken from static images (19.5%) and from the commercial flow cytometer (19.7%). We decided to use a stroboscopic pulse duration of 10 µs, which yielded a CV of 16.5% in fluorescence intensity. Figure S8 illustrates the trade-off between motion blur and sensitivity. For a stroboscopic duration of 10 µs and flow velocity of 0.35 m/s, negligible blur (150 nm) in cell sizing and excellent sensitivity in fluorescence quantification (16.5 %) were realised.
It should be noted that in the current experiments we used a high-resolution camera (Hamamatsu Flash 4.0) with a pixel size of 6.6 μm. Decreasing the pixel size will decrease pixel performance, since smaller pixels have a lower dynamic range, a lower fill factor, reduced low-light sensitivity and a higher dark signal. Furthermore, it is critical to realise that motion blur and noise are strictly controlled by the exposure time. When acquiring images of rapidly moving objects or low-intensity signals, the exposure time must be precisely controlled. The trade-off between long exposure times (that reduce the noise but increase motion blur) and short exposure times (that reduce motion blur at the cost of increasing noise and reducing the amount of collected photons) is unavoidable. Due to instrumental constraints, there will often be no perfect compromise, with the captured image being too “blurry” or excessively “noisy”. The criteria defining satisfactory performance the imaging cytometer are determined by several factors. Perhaps, the most relevant being the exposure time, since this directly balances the amount of blur and noise in an observation. In the current situation, the combination of a powerful light source modulated at high frequency and high quantum efficiency fluorophores allows for blur-free imaging with superior sensitivity. Additionally, motion blur can be suppressed through the use of acousto-optic modulation, potentially reducing the stroboscopic duration to 1 µs. Such upgrades afford sensitivities equivalent to commercial flow cytometers, and without compromising the high flow velocities required to ensure ultra-high throughput. It is also important to note that resolution can be improved by operating at higher magnifications, with a moderate reduction in throughput to approximately 20,000 cells/s for a 20X magnification. Despite these potential improvements, our studies demonstrate the sensitivity of the imaging flow platform for tracking fluorescence, bright-field and dark-field properties in cells and screening large cellular populations
Supplemental Note 3: Throughput limitations of the proposed microfluidic imaging flow cytometer. As explained in the main text, the high throughput of the microfluidic device is engendered by the self-assembly of cells in the detection region (using inertial focusing) and the camera sensor
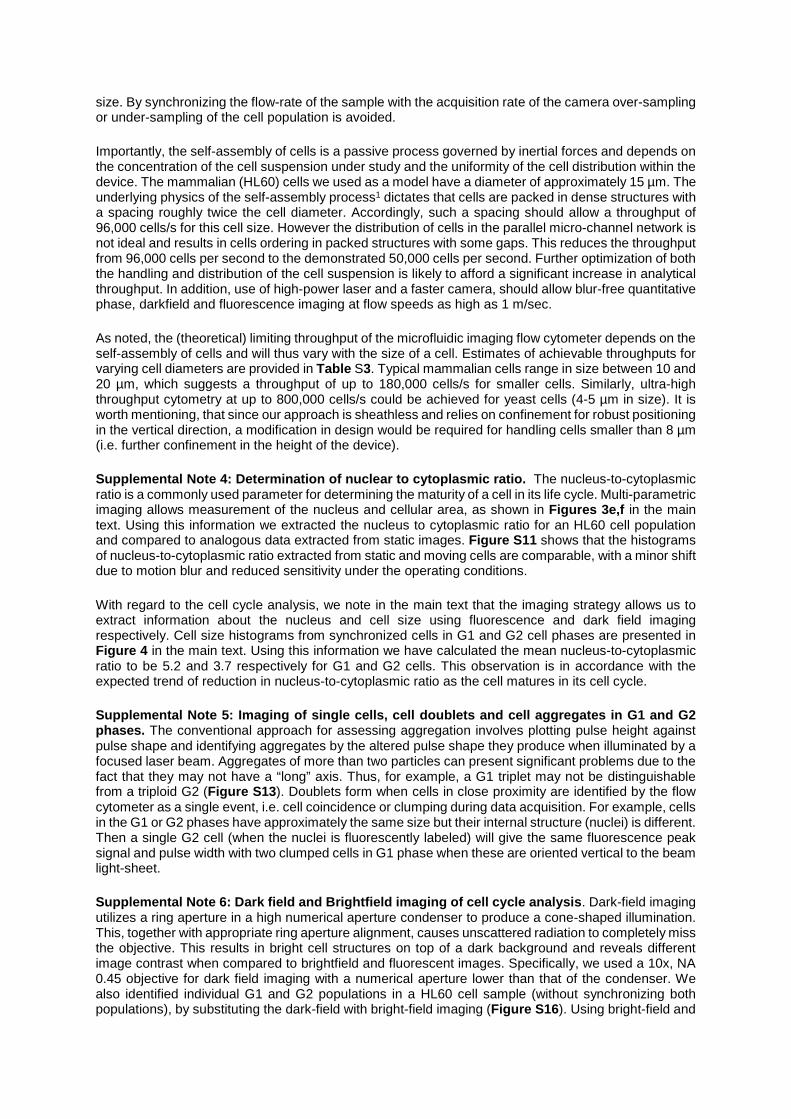
size. By synchronizing the flow-rate of the sample with the acquisition rate of the camera over-sampling or under-sampling of the cell population is avoided.
Importantly, the self-assembly of cells is a passive process governed by inertial forces and depends on the concentration of the cell suspension under study and the uniformity of the cell distribution within the device. The mammalian (HL60) cells we used as a model have a diameter of approximately 15 µm. The underlying physics of the self-assembly process1 dictates that cells are packed in dense structures with a spacing roughly twice the cell diameter. Accordingly, such a spacing should allow a throughput of 96,000 cells/s for this cell size. However the distribution of cells in the parallel micro-channel network is not ideal and results in cells ordering in packed structures with some gaps. This reduces the throughput from 96,000 cells per second to the demonstrated 50,000 cells per second. Further optimization of both the handling and distribution of the cell suspension is likely to afford a significant increase in analytical throughput. In addition, use of high-power laser and a faster camera, should allow blur-free quantitative phase, darkfield and fluorescence imaging at flow speeds as high as 1 m/sec.
As noted, the (theoretical) limiting throughput of the microfluidic imaging flow cytometer depends on the self-assembly of cells and will thus vary with the size of a cell. Estimates of achievable throughputs for varying cell diameters are provided in Table S3. Typical mammalian cells range in size between 10 and 20 µm, which suggests a throughput of up to 180,000 cells/s for smaller cells. Similarly, ultra-high throughput cytometry at up to 800,000 cells/s could be achieved for yeast cells (4-5 µm in size). It is worth mentioning, that since our approach is sheathless and relies on confinement for robust positioning in the vertical direction, a modification in design would be required for handling cells smaller than 8 µm (i.e. further confinement in the height of the device).
Supplemental Note 4: Determination of nuclear to cytoplasmic ratio. The nucleus-to-cytoplasmic ratio is a commonly used parameter for determining the maturity of a cell in its life cycle. Multi-parametric imaging allows measurement of the nucleus and cellular area, as shown in Figures 3e,f in the main text. Using this information we extracted the nucleus to cytoplasmic ratio for an HL60 cell population and compared to analogous data extracted from static images. Figure S11 shows that the histograms of nucleus-to-cytoplasmic ratio extracted from static and moving cells are comparable, with a minor shift due to motion blur and reduced sensitivity under the operating conditions.
With regard to the cell cycle analysis, we note in the main text that the imaging strategy allows us to extract information about the nucleus and cell size using fluorescence and dark field imaging respectively. Cell size histograms from synchronized cells in G1 and G2 cell phases are presented in Figure 4 in the main text. Using this information we have calculated the mean nucleus-to-cytoplasmic ratio to be 5.2 and 3.7 respectively for G1 and G2 cells. This observation is in accordance with the expected trend of reduction in nucleus-to-cytoplasmic ratio as the cell matures in its cell cycle.
Supplemental Note 5: Imaging of single cells, cell doublets and cell aggregates in G1 and G2 phases. The conventional approach for assessing aggregation involves plotting pulse height against pulse shape and identifying aggregates by the altered pulse shape they produce when illuminated by a focused laser beam. Aggregates of more than two particles can present significant problems due to the fact that they may not have a “long” axis. Thus, for example, a G1 triplet may not be distinguishable from a triploid G2 (Figure S13). Doublets form when cells in close proximity are identified by the flow cytometer as a single event, i.e. cell coincidence or clumping during data acquisition. For example, cells in the G1 or G2 phases have approximately the same size but their internal structure (nuclei) is different. Then a single G2 cell (when the nuclei is fluorescently labeled) will give the same fluorescence peak signal and pulse width with two clumped cells in G1 phase when these are oriented vertical to the beam light-sheet.
Supplemental Note 6: Dark field and Brightfield imaging of cell cycle analysis. Dark-field imaging utilizes a ring aperture in a high numerical aperture condenser to produce a cone-shaped illumination. This, together with appropriate ring aperture alignment, causes unscattered radiation to completely miss the objective. This results in bright cell structures on top of a dark background and reveals different image contrast when compared to brightfield and fluorescent images. Specifically, we used a 10x, NA 0.45 objective for dark field imaging with a numerical aperture lower than that of the condenser. We also identified individual G1 and G2 populations in a HL60 cell sample (without synchronizing both populations), by substituting the dark-field with bright-field imaging (Figure S16). Using bright-field and
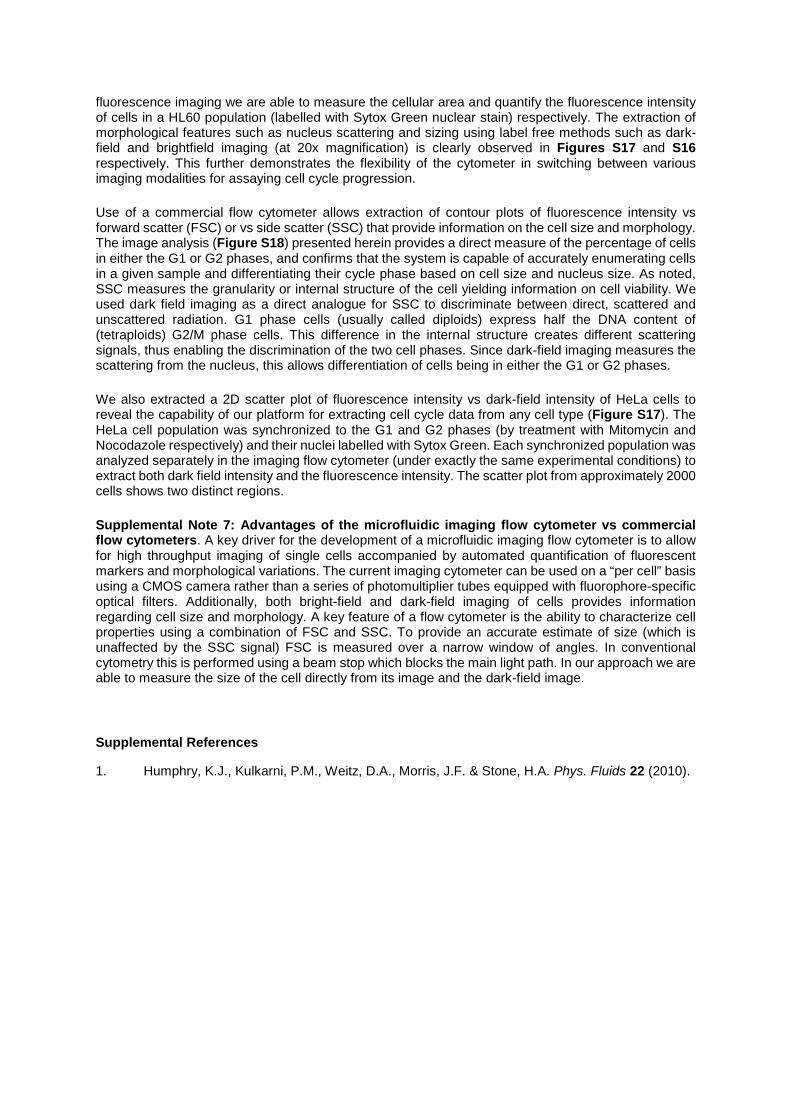
fluorescence imaging we are able to measure the cellular area and quantify the fluorescence intensity of cells in a HL60 population (labelled with Sytox Green nuclear stain) respectively. The extraction of morphological features such as nucleus scattering and sizing using label free methods such as dark-field and brightfield imaging (at 20x magnification) is clearly observed in Figures S17 and S16 respectively. This further demonstrates the flexibility of the cytometer in switching between various imaging modalities for assaying cell cycle progression.
Use of a commercial flow cytometer allows extraction of contour plots of fluorescence intensity vs forward scatter (FSC) or vs side scatter (SSC) that provide information on the cell size and morphology. The image analysis (Figure S18) presented herein provides a direct measure of the percentage of cells in either the G1 or G2 phases, and confirms that the system is capable of accurately enumerating cells in a given sample and differentiating their cycle phase based on cell size and nucleus size. As noted, SSC measures the granularity or internal structure of the cell yielding information on cell viability. We used dark field imaging as a direct analogue for SSC to discriminate between direct, scattered and unscattered radiation. G1 phase cells (usually called diploids) express half the DNA content of (tetraploids) G2/M phase cells. This difference in the internal structure creates different scattering signals, thus enabling the discrimination of the two cell phases. Since dark-field imaging measures the scattering from the nucleus, this allows differentiation of cells being in either the G1 or G2 phases.
We also extracted a 2D scatter plot of fluorescence intensity vs dark-field intensity of HeLa cells to reveal the capability of our platform for extracting cell cycle data from any cell type (Figure S17). The HeLa cell population was synchronized to the G1 and G2 phases (by treatment with Mitomycin and Nocodazole respectively) and their nuclei labelled with Sytox Green. Each synchronized population was analyzed separately in the imaging flow cytometer (under exactly the same experimental conditions) to extract both dark field intensity and the fluorescence intensity. The scatter plot from approximately 2000 cells shows two distinct regions.
Supplemental Note 7: Advantages of the microfluidic imaging flow cytometer vs commercial flow cytometers. A key driver for the development of a microfluidic imaging flow cytometer is to allow for high throughput imaging of single cells accompanied by automated quantification of fluorescent markers and morphological variations. The current imaging cytometer can be used on a “per cell” basis using a CMOS camera rather than a series of photomultiplier tubes equipped with fluorophore-specific optical filters. Additionally, both bright-field and dark-field imaging of cells provides information regarding cell size and morphology. A key feature of a flow cytometer is the ability to characterize cell properties using a combination of FSC and SSC. To provide an accurate estimate of size (which is unaffected by the SSC signal) FSC is measured over a narrow window of angles. In conventional cytometry this is performed using a beam stop which blocks the main light path. In our approach we are able to measure the size of the cell directly from its image and the dark-field image.
Supplemental References
1. Humphry, K.J., Kulkarni, P.M., Weitz, D.A., Morris, J.F. & Stone, H.A. Phys. Fluids 22 (2010).


