24
Chemical Analyses of Stream Sediment in the Tar Creek Basin of the Picher Mining Area, Northeast Oklahoma Open-File Report 88–469 U.S. Department of the Interior U.S. Geological Survey

Chemical Analyses of Stream Sediment in the Tar Creek Basin of the Picher Mining Area, Northeast Oklahoma
Open-File Report 88–469
U.S. Department of the InteriorU.S. Geological Survey

Cover credit: Drawing done by John S. Havens, U.S. Geological Survey.

Parkhurst, D.L., and others.—
Chemical Analyses of Stream
Sediment in the Tar Creek Basin of the Picher M
ining Area, Northeast Oklahom
a—USG
S/OFR 88–469Printed on recycled paper

Chemical Analyses of Stream Sediment in the Tar Creek Basin of the Picher Mining Area, Northeast Oklahoma
By David L. Parkhurst, Michael Doughten, and Paul P. Hearn
U.S. Department of the Interior U.S. Geological Survey
Open-File Report 88–469

U.S. Department of the InteriorDonald Paul Hodel, Secretary
U.S. Geological SurveyDallas L. Peck, Director
U.S. Geological Survey, Reston, Virginia: 1988For sale by U.S. Geological Survey, Information Services Box 25286, Denver Federal Center Denver, CO 80225
For more information about the USGS and its products: Telephone: 1-888-ASK-USGS World Wide Web: http://www.usgs.gov/
Any use of trade, product, or firm names in this publication is for descriptive purposes only and does not imply endorsement by the U.S. Government.
Although this report is in the public domain, permission must be secured from the individual copyright owners to repro-duce any copyrighted materials contained within this report.
Prepared by the U.S. Geological Survey in Oklahoma City, Oklahoma (http://ok.water.usgs.gov)
Suggested citation:Parkhurst, D.L., Doughten, Michael, and Hearn, P.P., 1988, Chemical analyses of stream sediment in the Tar Creek basin of the Picher mining area, northeast Oklahoma: U.S. Geological Survey Open-File Report 88–469, 13 p.

iii
Contents
Abstract 1Introduction 1
Purpose and scope 1Description of sampling sites 1Methods 2Description of data tables 2Reference cited 2Attachment 1 18
Explanation of the site-numbering system 18
Figures
1. Map showing locations of sampling sites. 32. Detailed map showing locations of sampling sites. 4
Tables
1. Sampling locations and sample descriptions. 52. Semiquantitative chemical analyses of sediment samples taken
in December 1983 and June 1984. 73. Quantitative chemical analyses of sediment samples taken
in December 1983 and June 1984. 154. Quantitative chemical analyses of sediment samples taken
in June 1985. 17

Chemical Analyses of Stream Sediment in the Tar Creek Basin of the Picher Mining Area, Northeast Oklahoma
By David L. Parkhurst, Michael Doughten, and Paul P. Hearn
Abstract
Chemical analyses are presented for 47 sediment samples from the Tar Creek drainage in the Picher mining area of northeast Oklahoma. The samples were taken in December 1983, June 1984, and June 1985. All of the samples were taken downstream from mine-water discharge points of abandoned lead and zinc mines. The 34 samples taken in December 1983 and June 1984 were analyzed semiquantitatively by emission spectrography for 64 elements and quantitatively for cadmium, copper, iron, manganese, nickel, lead, sulfur, zinc, and organic carbon. The 13 samples taken in June 1985 were analyzed quantitatively for aluminum, cadmium, cobalt, chromium, copper, iron, manganese, molybdenum, nickel, phosphorus, lead, sulfur, silicon, titanium, vanadium, zinc, and organic carbon.
Introduction
Lead and zinc were mined from the Picher field in northeast Oklahoma and southeast Kansas from about 1900 until the 1960s. The mines, which were from 100 to 500 feet below land surface, were dewatered by extensive pumpage during active mining. After mining ceased, mine dewatering was stopped and the mines subsequently filled with water. About 1980, mine water began discharging from a few mine shafts and air shafts into the Tar Creek basin. Mine water has discharged intermittently since that time. The stream sediments downstream from the mining area are characteristically red and yellow due to iron oxyhydroxide precipitates formed from the mine-water discharge.
Purpose and Scope
A study of the Picher mining area and Tar Creek was undertaken to determine the chemical evolution of mine water and the effects of mine-water discharge on the chemistry of surface water and surface-water sediments. The purpose of this report is to present chemical analyses of sediment samples collected during the study.
Description of Sampling Sites
Samples were taken from the sediment of Tar Creek and from three tributaries, which drain mine water to Tar Creek. Generally, the characteristic red-yellow iron precipitates were sampled. The precipitates had varied morphology, which ranged from a fine flocculated material to a hard crust which, in some stream reaches, covered the stream bottom. Some samples were taken from the sediment zone underlying the iron precipitates. Figures 1 and 2 show the sampling sites and table 1 lists the site locations by station number

2 Chemical Analyses of Stream Sediment in the Tar Creek Basin of the Picher Mining Area, Northeast Oklahoma
(latitude and longitude) and by a modified legal description (attachment 1). The table also includes a description of the sample location and a short description of the sample.
Methods
Sediment samples were collected in plastic containers from a very small area, generally 100 to 1,000 square centimeters. The samples were allowed to air dry for about 4 weeks and then were sent for analysis to the laboratory of the Geologic Division of the U.S. Geological Survey in Reston, Virginia.
Semiquantitative emission spectrography was performed on weighed quantities of samples which had been ground.
For quantitative analyses, 0.5 grams of sample were weighed, placed in Teflon beakers, and digested overnight and concentrated acids, 5 mL (milliliters) nitric, 2 mL perchloric, and 15 mL hydrofluoric, at approximately 175 °C. The samples were evaporated to dryness and the residue was dissolved in 2N hydrochloric acid to a volume of 50 mL.
Cobalt, chromium, copper, lead, manganese, nickel, vanadium, and zinc were determined by flame atomic absorption or Graphite Furnace Atomic Absorption (GFAA) on the digested samples. For iron and aluminum, it was necessary to dilute the digested samples before analyzing them by Inductively Coupled Argon Plasma Atomic-Emission Spectroscopy (ICAP-AES). Cadmium and molybdenum were determined by using an ion exchange separation followed by GFAA analysis of cadmium and ICAP-AES analysis of molybdenum. Phosphorus, silica, and titanium were determined by fusing 0.2 grams of sample with a lithium metaborate-tetraborate mixture (Shapiro, 1975). The fusion pellets were dissolved in dilute nitric acid and analyzed by ICAP-AES. Sulfur was analyzed by LECO Sulfur Analyzer.
Description of Data Tables
Semiquantitative emission spectrographic data for samples taken in December 1983 and June 1984 are listed in table 2. Quantitative analyses for samples taken in December 1983 and June 1984 are listed in table 3. Quantitative analyses for samples taken in June 1985 are listed in table 4.
Reference Cited
Shapiro, L., 1975, Rapid analysis of silicate, carbonate, and phosphate rocks: U.S. Geological Survey Bulletin 1401 [revised edition], p. 43-46.

Reference Cited 3
Figure 1. Locations of sampling sites. (Additional sites shown on detailed map.)

4 Chemical Analyses of Stream Sediment in the Tar Creek Basin of the Picher Mining Area, Northeast Oklahoma
Figure 2. Detailed map showing locations of sampling sites.

Reference Cited
5
Table 1. Sampling locations and sample descriptions.
[Station name: C, Creek; m, meters; nr, near; N, north; RR, railroad; trib, tributary. Sample description: µm, micrometers. Depth: cm, centimeters; surf., indicates sample from sediment surface.]
Sam-ple
num-ber
Station Date Legal description Station name Sample descriptionDepth(cm)
Labnumber
1 365230094514301 6/84 28N-23E-30 DBB 1 Tar C at Central Ave, Miami iron precipitate on rocks surf. D20-47
2 365230094514301 6/84 28N-23E-30 DBB 1 Tar C at Central Ave, Miami iron precipitate, organic matter surf. D20-48
3 365230094514301 6/84 28N-23E-30 DBB 1 Tar C at Central Ave, Miami iron precipitate, organic matter surf. D20-49
4 365230094514301 6/84 28N-23E-30 DBB 1 Tar C at Central Ave, Miami iron precipitate, black goo 0-5 D20-50
5 365230094514301 6/84 28N-23E-30 DBB 1 Tar C at Central Ave, Miami iron precipitate 10-15 D20-52
6 365359094520401 6/84 28N-23E-19 ABB 1 Tar C at 22nd Ave, Miami mud and sand 0-5 D16-43
7 365359094520401 6/84 28N-23E-19 ABB 1 Tar C at 22nd Ave, Miami sand and silt 5-10 D16-44
8 365359094520401 6/84 28N-23E-19 ABB 1 Tar C at 22nd Ave, Miami sand and silt 17-25 D16-46
9 365522094521301 6/84 28N-23E-07 CAA 1 Weir downstream from discharge crusted iron precipitate surf. D14-38
10 365533094522801 12/83 28N-23E-07 BBD 1 10 m downstream Cactus Collapse crusted iron precipitate surf. DP-1
11 365533094522801 12/83 28N-23E-07 BBD 1 10 m downstream Cactus Collapse yellow powder below crust 2-5 DP-2
12 365544094513201 6/84 28N-23E-05 CCC 1 Tar C nr Commerce layered iron precipitate, clay surf. D5-39
13 365637094511201 6/84 29N-23E-31 DCD 1 Tar C at Highway 66 layered iron precipitate surf. D10-36
14 365714094504401 12/83 29N-23E-32 BCA 1 Mine trib at Tar Creek layered iron precipitate surf. DP-5
15 365714094504401 6/84 29N-23E-32 BCA 1 Mine trib at Tar Creek iron precipitate 0-5 DRR-28
16 365714094504401 6/84 29N-23E-32 BCA 1 Mine trib at Tar Creek silt below iron precipitate 5-10 DRR-29
17 365714094504401 6/84 29N-23E-32 BCA 1 Mine trib at Tar Creek sand and silt below iron precipitate 10-15 DRR-30
18 365714094504401 6/84 29N-23E-32 BCA 1 Mine trib at Tar Creek hard, iron precipitate, black coating surf. DRR-32
19 365714094504401 6/85 29N-23E-32 BCA 1 Mine trib at Tar Creek iron precipitate surf. DRR-64
20 365714094504401 6/85 29N-23E-32 BCA 1 Mine trib at Tar Creek clay below iron precipitate 2-5 DRR-65
21 365715094504302 6/84 29N-23E-32 BBD 3 Outflow from mine trib pond iron precipitate and organic debris surf. DRR-25
22 365715094504302 6/84 29N-23E-32 BBD 3 Outflow from mine trib pond iron precipitate and organic debris surf. DRR-27
23 365715094504302 6/85 29N-23E-32 BBD 3 Outflow from mine trib pond iron precipitate surf DRR-62
24 365715094504302 6/85 29N-23E-32 BBD 3 Outflow from mine trib pond clay below iron precipitate 2-5 DRR-63
25 365715094504301 6/85 29N-23E-32 BBD 2 Mine trib pond iron precipitate surf. DRR-61

6
Chemical A
nalyses of Stream Sedim
ent in the Tar Creek Basin of the Picher M
ining Area, N
ortheast Oklahom
a
26 365716094504601 6/85 29N-23E-32 BBD 1 Tailings discharge pond <62 µm silt and clay fraction surf. DRR-66
27 365720094504001 6/85 29N-23E-32- BBD 4 Inflow to mine trib pond iron precipitate surf. DRR-59
28 365720094504001 6/85 29N-23E-32- BBD 4 Inflow to mine trib pond clay below iron precipitate 2-5 DRR-60
29 365720094503801 12/83 29N-23E-32 BAC 1 Mine trib south of RR culvert iron precipitate surf. DP-4
30 365720094503801 6/85 29N-23E-32 BAC 1 Mine trib south of RR culvert iron precipitate surf. DRR-57
31 365720094503801 6/85 29N-23E-32 BAC 1 Mine trib south of RR culvert clay below iron precipitate 2-5 DRR-58
32 365723094503520 6/84 29N-23E-32 BAB 20 Mine trib N of RR culvert floating iron precipitate surf. DRR-22
33 365723094503520 6/84 29N-23E-32 BAB 20 Mine trib N of RR culvert iron precipitate and organic debris surf. DRR-23
34 365723094503520 6/85 29N-23E-32 BAB 20 Mine trib N of RR culvert iron precipitate surf. DRR-56
35 365723094503501 12/83 29N-23E-32 BAB 1 Near RR borehole iron precipitate surf. DP-3
36 365723094503502 6/85 29N-23E-32 BAB 2 5 m from RR borehole iron precipitate surf. DRR-54
37 365723094503502 6/85 29N-23E-32 BAB 2 5 m from RR borehole clay below iron precipitate 2-5 DRR-55
38 365730094504014 6/84 29N-23E-29 CDC 14 Mine discharge at Tar Creek iron precipitate surf. D4-9
39 365730094504014 6/84 29N-23E-29 CDC 14 Mine discharge at Tar Creek iron precipitate surf. D4-16
40 365730094504013 6/84 29N-23E-29 CDC 13 10 m downstream from weir iron precipitate surf. D4-11
41 365730094504012 6/84 29N-23E-29 CDC 12 2 m downstream from weir iron precipitate surf. D4-18
42 365730094504011 6/84 29N-23E-29 CDC 6 Near weir efflorescence surf. D4-17
43 365730094504006 6/84 29N-23E-29 CDC 10 10 m from mine-discharge point iron precipitate and organic debris surf. D4-20
44 365730094504006 6/84 29N-23E-29 CDC 10 10 m from mine-discharge point soil zone below iron precipitate 8-12 D4-21
45 365730094504005 6/84 29N-23E-29 CDC 9 5 m from mine-discharge point iron precipitate surf. D4-12
46 365730094504004 6/84 29N-23E-29 CDC 8 4 m from mine-discharge point iron precipitate surf. D4-14
47 365730094504001 6/84 29N-23E-29 CDC 5 Near mine-discharge point iron precipitate surf. D4-7
Table 1. Sampling locations and sample descriptions.
[Station name: C, Creek; m, meters; nr, near; N, north; RR, railroad; trib, tributary. Sample description: µm, micrometers. Depth: cm, centimeters; surf., indicates sample from sediment surface.]
Sam-ple
num-ber
Station Date Legal description Station name Sample descriptionDepth(cm)
Labnumber

Reference Cited
7
Table 2. Semiquantitative chemical analyses of sediment samples taken in December 1983 and June 1984.
[The relative standard deviation for each reported concentration is plus 50 percent and minus 33 percent. --, denotes the occurrence of an unresolved interference; >, indicates concentration is greater than the giv-en value; <, indicates concentration is less than the given value. All samples had concentrations less than the detection limit for the following elements (concentrations in parts per million): Bi <10, In <10, Ir <15, Lu <15, Os <15, Pd <1, Pt <2.2, Re <10, Rh <2.2, Ru <2.2, Sb <68, Ta <320, Tb <32, Th <46, Tl <10, Tm <4.6, U <220, and W <15.]
Sam-ple
num-ber
Labnumber
Concentrations (in percent)
Aluminum Calcium Iron Potassium Magnesium Manganese Sodium Phosphorous Silicon Titanium
1 D20-47 0.79 0.290 >24.0 0.350 0.044 0.00760 2.2000 <0.068 5.40 0.0280
2 D20-48 0.33 0.090 >24.0 <0.150 0.017 0.00720 0.8900 <0.068 1.00 0.0071
3 D20-49 2.20 0.340 17.0 0.360 0.220 0.01100 0.5400 <0.068 26.00 0.1300
4 D20-50 2.60 0.380 16.0 0.490 0.220 0.01600 2.0000 <0.068 25.00 0.1000
5 D20-52 1.80 0.540 16.0 0.290 0.140 0.01700 1.5000 <0.068 19.00 0.0620
6 D16-43 5.40 0.990 9.6 0.860 0.310 0.10000 0.5400 <0.068 >34.00 0.3100
7 D16-44 5.30 1.500 4.7 0.740 0.320 0.08400 0.2900 0.120 >34.00 0.3600
8 D16-46 5.50 0.350 7.1 0.810 0.310 0.19000 0.2600 0.150 >34.00 0.3900
9 D14-38 0.37 0.150 >24.0 <0.150 0.015 0.00630 <0.0022 <0.068 0.44 0.0063
10 DP-1 0.25 0.090 >24.0 0.390 0.026 0.00170 0.2400 <0.068 25.00 0.0320
11 DP-2 0.61 0.043 19.0 6.400 0.046 0.00360 0.3800 <0.068 13.00 0.0370
12 D5-39 2.90 0.270 21.0 0.440 0.200 0.01400 0.9400 <0.068 25.00 0.1200
13 D10-36 0.21 0.390 6.5 <0.068 0.018 0.00520 1.2000 <0.068 0.95 0.0041
14 DP-5 0.49 0.088 >24.0 0.210 0.043 0.00140 0.3600 <0.068 17.00 <0.0032
15 DRR-28 0.10 0.098 >24.0 <0.150 0.015 0.00059 <0.0022 <0.068 0.76 0.0058
16 DRR-29 1.50 2.000 6.7 0.570 0.180 0.00280 0.1500 <0.068 >34.00 0.0600
17 DRR-30 2.70 8.200 1.7 0.440 1.600 0.01600 1.1000 0.150 >34.00 0.0880
18 DRR-32 0.18 0.960 >24.0 <0.150 0.013 0.00190 0.8300 <0.068 3.40 <0.0032
21 DRR-25 3.90 0.230 17.0 0.790 0.220 0.01100 0.3400 <0.068 31.00 0.2400
22 DRR-27 0.16 0.091 >24.0 <0.150 0.017 0.00060 0.1600 <0.068 2.40 0.0100
29 DP-4 0.14 0.100 >24.0 <0.150 0.015 0.00051 <0.0022 <0.068 0.59 0.0067
32 DRR-22 0.31 0.180 >24.0 <0.150 0.017 0.00110 0.2400 <0.068 2.30 0.0058
33 DRR-23 0.26 0.250 >24.0 <0.150 0.023 0.00100 0.3200 <0.068 2.80 0.0460
35 DP-3 0.58 0.840 >24.0 <0.068 0.025 0.00180 0.4600 3.700 4.10 0.0200
38 D4-9 0.90 0.290 >24.0 <0.150 0.037 0.00180 1.3000 <0.068 2.90 0.0100

8
Chemical A
nalyses of Stream Sedim
ent in the Tar Creek Basin of the Picher M
ining Area, N
ortheast Oklahom
a
39 D4-16 0.52 0.140 >24.0 <0.150 0.022 0.00088 0.5900 <0.068 2.30 0.0066
40 D4-11 0.86 0.780 >24.0 <0.150 0.045 0.00220 1.8000 <0.068 3.30 0.0082
41 D4-18 1.10 0.940 >24.0 <0.150 0.042 0.00330 2.8000 <0.068 0.73 0.0110
42 D4-17 0.22 13.000 4.1 0.150 0.300 0.00740 0.5300 0.170 2.70 0.0150
43 D4-20 0.98 0.790 >24.0 <0.150 0.033 0.00240 1.4000 <0.068 3.10 0.0074
44 D4-21 3.00 0.810 2.9 0.360 0.290 0.00580 0.5800 0.140 >34.00 0.0450
45 D4-12 1.90 0.530 >24.0 <0.150 0.051 0.00320 1.4000 3.200 7.70 0.0140
46 D4-14 1.70 0.760 >24.0 <0.150 0.039 0.00280 1.9000 1.400 2.40 0.0120
47 D4-7 0.83 0.360 >24.0 <0.150 0.019 0.002100 0.4800 >6.800 1.50 0.0110
Table 2. Semiquantitative chemical analyses of sediment samples taken in December 1983 and June 1984.—Continued
[The relative standard deviation for each reported concentration is plus 50 percent and minus 33 percent. --, denotes the occurrence of an unresolved interference; >, indicates concentration is greater than the giv-en value; <, indicates concentration is less than the given value. All samples had concentrations less than the detection limit for the following elements (concentrations in parts per million): Bi <10, In <10, Ir <15, Lu <15, Os <15, Pd <1, Pt <2.2, Re <10, Rh <2.2, Ru <2.2, Sb <68, Ta <320, Tb <32, Th <46, Tl <10, Tm <4.6, U <220, and W <15.]
Sam-ple
num-ber
Labnumber
Concentrations (in percent)
Aluminum Calcium Iron Potassium Magnesium Manganese Sodium Phosphorous Silicon Titanium

Reference Cited
9
Table 2. Semiquantitative chemical analyses of sediment samples taken in December 1983 and June 1984–Continued
[The relative standard deviation for each reported concentration is plus 50 percent and minus 33 percent. --, denotes the occurrence of an unresolved interference; >, indicates concentration is greater than the giv-en value; <, indicates concentration is less than the given value. All samples had concentrations less than the detection limit for the following elements (concentrations in parts per million): Bi <10, In <10, Ir <15, Lu <15, Os <15, Pd <1, Pt <2.2, Re <10, Rh <2.2, Ru <2.2, Sb <68, Ta <320, Tb <32, Th <46, Tl <10, Tm <4.6, U <220, and W <15.]
Sam-ple
num-ber
Labnumber
Concentrations (in percent)
Silver Arsenic Gold Boron Barium Beryllium Cadmium Cerium Cobalt Chromium Copper Dysprosium Erbium
1 D20-47 0.58 160 <6.8 <6.8 89.0 2.5 <32 <200 6.8 10.0 4.2 <22 <4.6
2 D20-48 0.55 <100 <6.8 <6.8 4.0 1.0 <32 <200 3.6 <10.0 3.5 <22 <4.6
3 D20-49 1.20 <100 <6.8 20.0 200.0 1.3 <32 <63 3.1 70.0 56.0 <22 <4.6
4 D20-50 0.33 <100 <6.8 22.0 140.0 2.0 <32 <63 11.0 43.0 42.0 <22 <4.6
5 D20-52 0.40 <100 <6.8 16.0 170.0 1.8 <32 <63 7.9 27.0 65.0 <22 <4.6
6 D16-43 0.34 <100 <6.8 48.0 330.0 2.4 <32 <200 23.0 86.0 26.0 <22 <4.6
7 D16-44 0.33 <100 <6.8 52.0 320.0 1.6 <32 <200 15.0 57.0 16.0 <22 <4.6
8 D16-46 0.35 110 <6.8 64.0 280.0 1.8 <32 <200 19.0 77.0 19.0 <22 <4.6
9 D14-38 0.53 <100 <6.8 <6.8 3.1 7.9 <32 <200 19.0 11.0 1.5 <22 <4.6
10 DP-1 0.37 <100 <6.8 11.0 20.0 <1.0 <32 <200 <1.0 33.0 4.5 <22 <4.6
11 DP-2 0.49 <100 <6.8 22.0 38.0 <1.0 <32 <43 <1.0 63.0 79.0 <22 <4.6
12 D5-39 0.21 110 <6.8 19.0 170.0 2.0 <32 <200 3.6 34.0 29.0 <22 <4.6
13 D10-36 <0.10 <100 <6.8 <6.8 25.0 3.9 69 <43 3.2 <1.0 6.8 <22 <4.6
14 DP-5 0.44 <100 <6.8 <6.8 11.0 <1.0 <32 <200 1.8 40.0 7.4 <22 <4.6
15 DRR-28 0.26 <100 <6.8 <6.8 <1.5 <1.0 <32 <200 <1.0 <10.0 <1.0 <22 <4.6
16 DRR-29 0.24 <100 <6.8 18.0 43.0 <1.0 <32 <43 <1.0 45.0 35.0 <22 <4.6
17 DRR-30 0.17 <100 <6.8 25.0 52.0 2.7 <32 <43 3.6 59.0 180.0 <22 <4.6
18 DRR-32 <0.10 <100 <6.8 <6.8 <1.5 <1.0 <32 <200 3.1 <10.0 4.0 <22 <4.6
21 DRR-25 0.38 <100 <6.8 42.0 190.0 <1.0 <32 63 2.9 51.0 15.0 <22 <4.6
22 DRR-27 0.27 <100 <6.8 <6.8 3.0 <1.0 <32 <200 1.0 <10.0 <1.0 <22 <4.6
29 DP-4 0.45 120 <6.8 <6.8 <1.5 <1.0 <32 <200 1.1 32.0 1.5 <22 <4.6
32 DRR-22 0.31 <100 <6.8 <6.8 <1.5 <1.0 <32 <200 1.5 75.0 <1.0 <22 <4.6
33 DRR-23 0.38 140 <6.8 <6.8 <1.5 <1.0 <32 <200 <1.0 <10.0 <1.0 <22 <4.6
35 DP-3 0.39 230 <6.8 <6.8 14.0 3.7 <32 <200 2.2 50.0 1.6 <22 <4.6
38 D4-9 0.26 160 <6.8 <6.8 <1.5 13.0 <32 <200 4.2 5.2 4.6 58 33.0

10
Chemical A
nalyses of Stream Sedim
ent in the Tar Creek Basin of the Picher M
ining Area, N
ortheast Oklahom
a
39 D4-16 0.22 150 <6.8 <6.8 1.6 5.0 <32 <200 1.7 3.9 3.2 51 28.0
40 D4-11 <0.10 190 <6.8 <6.8 <1.5 13.0 <32 <200 5.9 5.6 4.0 84 49.0
41 D4-18 0.50 290 <6.8 <6.8 <1.5 14.0 <32 <200 6.9 6.9 2.2 89 54.0
42 D4-17 <0.10 <100 <6.8 <3.2 15.0 2.9 <32 130 5.5 2.0 2.5 32 12.0
43 D4-20 0.24 140 <6.8 <6.8 3.0 21.0 43 <200 4.1 60.0 2.4 39 28.0
44 D4-21 0.17 <100 <6.8 22.0 38.0 2.7 <32 <43 2.3 43.0 51.0 28 5.3
45 D4-12 0.24 500 <6.8 <6.8 7.1 21.0 <32 250 3.4 46.0 30.0 99 53.0
46 D4-14 0.30 300 <6.8 <6.8 <1.5 21.0 <32 360 4.6 22.0 3.6 95 68.0
47 D4-7 0.39 130 <6.8 <6.8 21.0 16.0 <32 <200 1.2 <10.0 1.6 51 25.0
Table 2. Semiquantitative chemical analyses of sediment samples taken in December 1983 and June 1984–Continued
[The relative standard deviation for each reported concentration is plus 50 percent and minus 33 percent. --, denotes the occurrence of an unresolved interference; >, indicates concentration is greater than the giv-en value; <, indicates concentration is less than the given value. All samples had concentrations less than the detection limit for the following elements (concentrations in parts per million): Bi <10, In <10, Ir <15, Lu <15, Os <15, Pd <1, Pt <2.2, Re <10, Rh <2.2, Ru <2.2, Sb <68, Ta <320, Tb <32, Th <46, Tl <10, Tm <4.6, U <220, and W <15.]
Sam-ple
num-ber
Labnumber
Concentrations (in percent)
Silver Arsenic Gold Boron Barium Beryllium Cadmium Cerium Cobalt Chromium Copper Dysprosium Erbium

Reference Cited
11
Table 2. Semiquantitative chemical analyses of sediment samples taken in December 1983 and June 1984.–Continued
[The relative standard deviation for each reported concentration is plus 50 percent and minus 33 percent. --, denotes the occurrence of an unresolved interference; >, indicates concentration is greater than the giv-en value; <, indicates concentration is less than the given value. All samples had concentrations less than the detection limit for the following elements (concentrations in parts per million): Bi <10, In <10, Ir <15, Lu <15, Os <15, Pd <1, Pt <2.2, Re <10, Rh <2.2, Ru <2.2, Sb <68, Ta <320, Tb <32, Th <46, Tl <10, Tm <4.6, U <220, and W <15.]
Sam-ple
num-ber
Labnumber
Concentrations (in percent)
Europium Gallium Gadolinium Germanium Hafnium Holmium Lanthanum Lithium Manganese Molybdenum Niobium Neodymium
1 D20-47 <2.2 -- 64 12.0 <150 <6.8 48 -- 76.0 -- 9.9 56
2 D20-48 <2.2 -- 69 9.6 <15 <6.8 <10 -- 72.0 -- 9.0 <32
3 D20-49 <2.2 <1.5 <32 <4.6 <15 <6.8 33 -- 110.0 <1.0 <6.8 <32
4 D20-50 <2.2 <1.5 <32 <4.6 <15 <6.8 27 -- 160.0 <1.0 8.5 <32
5 D20-52 <2.2 <1.5 <32 <4.6 <15 <6.8 30 -- 170.0 <1.0 <6.8 <32
6 D16-43 <2.2 4.2 <32 <4.6 <150 <6.8 44 <68 1000.0 <1.0 14.0 51
7 D16-44 <2.2 4.3 <32 <4.6 <150 <6.8 37 -- 840.0 <1.0 10.0 <32
8 D16-46 <2.2 5.2 <32 <4.6 <150 <6.8 41 -- 1900.0 <1.0 18.0 36
9 D14-38 <2.2 -- <32 9.4 <15 <6.8 <10 -- 63.0 -- <6.8 <32
10 DP-1 <2.2 <1.5 <32 5.2 <150 <6.8 16 -- 17.0 -- 7.5 55
11 DP-2 <2.2 6.7 <32 7.7 <15 <6.8 <10 -- 36.0 2.7 8.1 <32
12 D5-39 <2.2 <1.5 57 7.4 <150 <6.8 44 -- 140.0 <1.0 7.1 <32
13 D10-36 <2.2 <1.5 <32 <4.6 <15 <6.8 30 <68 52.0 8.6 <6.8 86
14 DP-5 <2.2 -- <32 6.1 <150 <6.8 <10 -- 14.0 -- 8.9 <32
15 DRR-28 <2.2 <1.5 <32 <4.6 <15 <6.8 <10 -- 5.9 -- <6.8 <32
16 DRR-29 <2.2 <1.5 <32 <4.6 <150 <6.8 23 <68 28.0 <1.0 <6.8 <32
17 DRR-30 <2.2 4.8 <32 5.1 <15 <6.8 37 <68 160.0 2.4 8.0 <68
18 DRR-32 <2.2 -- <32 <4.6 <150 <6.8 17 -- 19.0 -- 6.9 <32
21 DRR-25 <2.2 2.1 <32 4.7 <15 <6.8 19 -- 110.0 <1.0 13.0 <32
22 DRR-27 <2.2 <1.5 <32 <4.6 <15 <6.8 13 -- 6.0 -- <6.8 59
29 DP-4 <2.2 -- <32 7.7 <150 <6.8 <10 -- 5.1 -- <6.8 <32
32 DRR-22 <2.2 <1.5 <32 11.0 <15 <6.8 24 -- 11.0 -- <6.8 <32
33 DRR-23 <2.2 -- <32 12.0 <15 16.0 <10 -- 10.0 -- <6.8 <32
35 DP-3 <2.2 <1.5 <32 7.8 <150 <6.8 31 -- 18.0 -- 7.5 50
38 D4-9 8.2 <1.5 51 19.0 <15 <6.8 44 -- 18.0 -- <6.8 220

12
Chemical A
nalyses of Stream Sedim
ent in the Tar Creek Basin of the Picher M
ining Area, N
ortheast Oklahom
a
39 D4-16 5.1 <1.5 44 16.0 <15 <6.8 35 -- 8.8 -- <6.8 180
40 D4-11 13.0 -- 75 24.0 <15 <6.8 68 -- 22.0 -- 8.8 320
41 D4-18 16.0 -- 94 30.0 <15 <6.8 78 -- 33.0 -- 12.0 360
42 D4-17 9.6 <1.5 <32 <4.6 <15 7.6 61 120 74.0 3.7 <6.8 180
43 D4-20 <2.2 <1.5 <32 25.0 <15 <6.8 33 -- 24.0 -- <6.8 110
44 D4-21 4.0 4.8 <32 6.8 <15 <6.8 24 <68 58.0 <1.0 <6.8 49
45 D4-12 23.0 <1.5 110 27.0 <15 25.0 98 -- 32.0 -- <6.8 440
46 D4-14 28.0 <1.5 140 39.0 <15 31.0 120 -- 28.0 -- <6.8 510
47 D4-7 6.9 <1.5 <32 <4.6 <15 14.0 59 -- 21.0 -- <6.8 170
Table 2. Semiquantitative chemical analyses of sediment samples taken in December 1983 and June 1984.–Continued
[The relative standard deviation for each reported concentration is plus 50 percent and minus 33 percent. --, denotes the occurrence of an unresolved interference; >, indicates concentration is greater than the giv-en value; <, indicates concentration is less than the given value. All samples had concentrations less than the detection limit for the following elements (concentrations in parts per million): Bi <10, In <10, Ir <15, Lu <15, Os <15, Pd <1, Pt <2.2, Re <10, Rh <2.2, Ru <2.2, Sb <68, Ta <320, Tb <32, Th <46, Tl <10, Tm <4.6, U <220, and W <15.]
Sam-ple
num-ber
Labnumber
Concentrations (in percent)
Europium Gallium Gadolinium Germanium Hafnium Holmium Lanthanum Lithium Manganese Molybdenum Niobium Neodymium

Reference Cited
13
Table 2. Semiquantitative chemical analyses of sediment samples taken in December 1983 and June 1984.–Continued
[The relative standard deviation for each reported concentration is plus 50 percent and minus 33 percent. --, denotes the occurrence of an unresolved interference; >, indicates concentration is greater than the giv-en value; <, indicates concentration is less than the given value. All samples had concentrations less than the detection limit for the following elements (concentrations in parts per million): Bi <10, In <10, Ir <15, Lu <15, Os <15, Pd <1, Pt <2.2, Re <10, Rh <2.2, Ru <2.2, Sb <68, Ta <320, Tb <32, Th <46, Tl <10, Tm <4.6, U <220, and W <15.]
Sam-ple
num-ber
Labnumber
Concentrations (in percent)
Nickel LeadPraseo-dymium
Scandium Samarium Tin Strontium Vanadium Yttrium Ytterbium Zinc Zirconium
1 D20-47 140.0 47 <100 <1.0 <10 <4.6 7.2 11.0 69.0 3.70 >10000 140.0
2 D20-48 52.0 53 <100 1.6 <10 -- 2.0 3.9 31.0 2.20 4600 <3.2
3 D20-49 48.0 350 130 2.1 <10 <4.6 16.0 23.0 25.0 2.10 3400 140.0
4 D20-50 110.0 330 <100 2.2 <10 <4.6 18.0 26.0 37.0 2.40 >10000 83.0
5 D20-52 74.0 330 <100 1.8 <10 <4.6 15.0 18.0 45.0 1.20 >10000 85.0
6 D16-43 72.0 250 <100 6.4 <10 <4.6 40.0 77.0 31.0 4.30 2600 240.0
7 D16-44 36.0 110 <100 5.4 <10 <4.6 47.0 61.0 21.0 3.70 870 250.0
8 D16-46 47.0 85 <100 6.0 <10 <4.6 46.0 69.0 23.0 4.10 590 320.0
9 D14-38 240.0 37 <100 2.3 <10 -- 4.4 3.3 73.0 <6.80 >10000 <3.2
10 DP-1 2.6 330 <100 <1.0 <32 <4.6 12.0 7.0 9.7 2.00 930 99.0
11 DP-2 8.3 >1000 <100 1.7 <10 <4.6 240.0 19.0 <1.5 <0.15 450 33.0
12 D5-39 36.0 280 <100 2.4 <10 <4.6 18.0 30.0 52.0 1.80 5400 82.0
13 D10-36 28.0 84 <100 1.3 <10 <4.6 5.9 2.4 100.0 3.50 >10000 3.5
14 DP-5 9.2 140 <100 <1.0 <10 -- 3.4 13.0 6.6 1.40 1700 22.0
15 DRR-28 4.3 41 <100 <1.0 <10 -- <1.0 5.1 2.6 1.40 530 7.3
16 DRR-29 11.0 350 <100 2.7 <10 <4.6 15.0 27.0 6.4 0.55 890 27.0
17 DRR-30 81.0 >1000 <100 5.1 <10 4.7 27.0 42.0 70.0 5.70 8800 50.0
18 DRR-32 30.0 79 <100 1.7 <10 -- 1.7 8.0 13.0 1.60 4600 4.9
21 DRR-25 19.0 130 <100 3.5 <10 <4.6 32.0 35.0 16.0 2.60 1000 190.0
22 DRR-27 4.7 36 <100 1.4 <10 -- 1.0 5.7 3.2 1.40 540 5.9
29 DP-4 4.8 84 <100 <1.0 <10 -- <1.0 8.1 9.1 1.30 630 <3.2
32 DRR-22 11.0 200 <100 1.8 <10 -- 1.6 180.0 22.0 1.40 980 3.7
33 DRR-23 9.5 190 <100 <1.0 <10 -- <1.0 14.0 32.0 1.90 1200 <3.2
35 DP-3 20.0 >1000 <100 <1.0 <10 <4.6 3.8 190.0 62.0 2.30 3100 73.0
38 D4-9 65.0 590 <100 1.5 <10 -- 3.4 50.0 170.0 6.60 >10000 3.5

14
Chemical A
nalyses of Stream Sedim
ent in the Tar Creek Basin of the Picher M
ining Area, N
ortheast Oklahom
a
39 D4-16 20.0 520 <100 <1.0 <10 -- 1.4 46.0 130.0 3.80 3600 3.2
40 D4-11 93.0 830 210 2.2 12 -- 3.9 56.0 250.0 7.60 >10000 <3.2
41 D4-18 120.0 >1000 <100 1.8 <10 -- 5.1 89.0 280.0 10.00 >10000 <3.2
42 D4-17 44.0 340 <100 1.4 <10 <4.6 390.0 33.0 98.0 3.90 3200 15.0
43 D4-20 69.0 670 <100 1.6 <10 -- 3.1 120.0 130.0 3.70 >10000 4.1
44 D4-21 48.0 440 <100 2.9 <10 <4.6 18.0 30.0 47.0 3.90 4600 15.0
45 D4-12 54.0 >1000 140 2.8 12 <4.6 <15.0 180.0 270.0 11.00 >10000 16.0
46 D4-14 75.0 >1000 160 <1.0 15 -- 3.4 160.0 530.0 14.00 >10000 <3.2
47 D4-7 7.1 >1000 <100 1.4 <10 <4.6 10.0 80.0 200.0 6.40 2800 <3.2
Table 2. Semiquantitative chemical analyses of sediment samples taken in December 1983 and June 1984.–Continued
[The relative standard deviation for each reported concentration is plus 50 percent and minus 33 percent. --, denotes the occurrence of an unresolved interference; >, indicates concentration is greater than the giv-en value; <, indicates concentration is less than the given value. All samples had concentrations less than the detection limit for the following elements (concentrations in parts per million): Bi <10, In <10, Ir <15, Lu <15, Os <15, Pd <1, Pt <2.2, Re <10, Rh <2.2, Ru <2.2, Sb <68, Ta <320, Tb <32, Th <46, Tl <10, Tm <4.6, U <220, and W <15.]
Sam-ple
num-ber
Labnumber
Concentrations (in percent)
Nickel LeadPraseo-dymium
Scandium Samarium Tin Strontium Vanadium Yttrium Ytterbium Zinc Zirconium

Reference Cited
15
Table 3. Quantitative chemical analyses of sediment samples taken in December 1983 and June 1984.
[--, indicates no analysis for this constituent; <, indicates concentration is less than the given value; ppm, parts per million]
Sam-ple
num-ber
Labnumber
Cadmium(ppm)
Copper(ppm)
Iron(percent
Manganese(ppm)
Nickel(ppm)
Lead(ppm)
Sulfur(percent)
Zinc(ppm)
Organiccarbon
(percent)
1 D20-47 12.00 3.3 41.9 47 99.0 <40 1.50 12000 1.10
2 D20-48 2.90 2.5 46.7 53 28.0 <40 2.20 4900 0.95
3 D20-49 32.00 64.0 13.3 96 52.0 460 0.78 3400 6.80
4 D20-50 33.00 35.0 13.5 160 120.0 320 0.54 11000 3.50
5 D20-52 42.00 43.0 17.1 260 110.0 460 0.95 10000 7.00
6 D16-43 11.00 16.0 7.6 760 41.0 270 0.14 2700 0.78
7 D16-44 4.90 7.9 2.9 460 31.0 59 0.05 820 0.58
8 D16-46 2.70 10.0 5.2 770 28.0 41 0.02 490 0.73
9 D14-38 11.00 2.1 50.9 71 280.0 <40 0.43 35000 0.57
10 DP-1 6.30 6.1 26.7 <10 1.4 350 3.30 980 0.23
11 DP-2 1.50 72.0 25.1 22 11.0 2600 8.90 480 0.65
12 D5-39 7.90 19.0 17.7 110 22.0 280 0.81 3900 3.00
13 D10-36 130.00 15.0 16.6 110 46.0 200 0.93 14000 27.60
14 DP-5 9.20 10.0 33.5 16 7.2 220 2.50 2500 0.95
15 DRR-28 0.58 <2 42.8 10 5.6 <40 4.10 710 0.59
16 DRR-29 3.10 25.0 6.2 18 14.0 490 1.50 950 0.60
17 DRR-30 15.00 190.0 1.4 100 49.0 1400 1.90 6300 0.49
18 DRR-32 0.58 4.2 46.1 19 36.0 86 3.00 4400 0.68
21 DRR-25 4.70 10.0 15.4 56 21.0 120 1.40 980 2.80
22 DRR-27 0.26 <2 41.7 <10 4.8 <40 4.00 590 1.20
29 DP-4 0.68 2.7 45.4 <10 3.7 110 3.80 700 0.64
32 DRR-22 0.51 41.0 40.7 13 11.0 270 3.20 1200 0.97
33 DRR-23 0.51 41.0 43.6 <10 9.9 280 2.20 1300 1.20
35 DP-3 8.10 3.1 35.0 24 32.0 2700 1.70 2800 1.50
38 D4-9 9.60 6.1 45.1 26 65.0 1200 2.00 10000 0.49

16
Chemical A
nalyses of Stream Sedim
ent in the Tar Creek Basin of the Picher M
ining Area, N
ortheast Oklahom
a
39 D4-16 2.90 7.0 43.4 14 43.0 1100 3.10 4400 0.67
40 D4-11 13.00 4.4 45.3 23 67.0 1300 2.00 11000 0.49
41 D4-18 32.00 3.1 44.9 29 85.0 1800 2.00 12000 1.60
42 D4-17 6.60 4.4 5.5 60 37.0 660 -- 3200 2.50
43 D4-20 26.00 4.8 39.2 30 67.0 1500 1.80 11000 2.50
44 D4-21 9.00 64.0 3.1 33 35.0 590 0.52 2600 5.10
45 D4-12 15.00 31.0 27.4 36 48.0 8700 1.00 8800 0.91
46 D4-14 14.00 5.3 36.6 33 73.0 6000 1.80 11000 0.45
47 D4-7 14.00 24.0 24.6 24 17.0 6800 0.76 2600 3.50
Table 3. Quantitative chemical analyses of sediment samples taken in December 1983 and June 1984.—Continued
[--, indicates no analysis for this constituent; <, indicates concentration is less than the given value; ppm, parts per million]
Sam-ple
num-ber
Labnumber
Cadmium(ppm)
Copper(ppm)
Iron(percent
Manganese(ppm)
Nickel(ppm)
Lead(ppm)
Sulfur(percent)
Zinc(ppm)
Organiccarbon
(percent)

Reference Cited
17
Table 4. Quantitative chemical analyses of sediment samples taken in June 1985.
[<, indicates concentration is less than the given value; ppm, parts per million; Al, aluminum, Cd, cadmium; Co, cobalt; Cr, chromium; Cu, copper; Fe, iron; Mo, molybdenum; Ni, nickel; P, phosphorus; Pb, lead; S, sulfur; Si, silicon; Ti, titanium; V, vanadium; Zn, zinc]
Sample number
Lab number
Al(ppm)
Cd(ppm)
Co(ppm)
Cr(ppm)
Cu(ppm)
Fe(percent)
Mn(ppm)
Mo(ppm)
Ni(ppm)
P(percent)
Pb(ppm)
S(percent)
Si(percent)
Ti(ppm)
V(ppm)
Zn(ppm)
Organiccarbon
(percent)
19 DRR-64 4700 3.8 <1 14 9.4 42.50 39 <1 17 0.051 130 3.00 5.1 360 10 2200 1.10
20 DRR-65 18000 18.0 4.6 44 150.0 3.90 95 <1 84 0.089 1400 0.63 35.1 820 31 6600 1.00
23 DRR-62 7000 3.0 1.8 24 5.0 37.00 35 2.0 12 0.056 140 2.70 8.1 790 13 1700 1.70
24 DRR-63 26000 5.9 3.6 47 25.0 1.40 61 <1 26 0.031 170 0.19 38.6 3100 54 1600 2.40
25 DRR-61 7400 7.4 2.9 17 5.4 44.30 54 3.4 21 0.081 180 3.00 5.4 640 13 3000 1.40
26 DRR-66 5500 18.0 1.7 36 86.0 0.69 180 1.2 24 0.041 1200 0.30 32.7 450 22 3200 0.20
27 DRR-59 16000 2.0 4.9 39 7.5 27.30 220 1.0 20 0.064 100 1.80 18.4 2100 28 1100 0.89
28 DRR-60 30000 4.6 4.4 47 16.0 3.80 120 <1 24 0.042 160 0.52 36.4 3800 57 1100 1.30
30 DRR-57 5600 15.0 5.9 14 5.5 47.10 60 14.0 50 0.150 420 2.40 3.6 450 18 6400 1.30
31 DRR-58 21000 15.0 5.0 43 21.0 18.30 110 1.3 24 0.081 380 0.62 25.4 2900 45 3700 2.00
34 DRR-56 22000 11.0 4.4 51 13.0 23.20 83 17.0 32 0.230 430 1.20 19.2 2400 54 3100 1.90
36 DRR-54 27000 3.7 6.0 46 5.9 7.80 190 8.5 26 0.170 250 0.39 33.5 3300 51 1500 1.30
37 DRR-55 29000 5.7 5.1 52 11.0 8.20 170 7.6 29 0.160 260 0.35 32.6 3400 57 1800 1.50
18 Chemical Analyses of Stream Sediment in the Tar Creek Basin of the Picher Mining Area, Northeast Oklahoma
Attachment 1
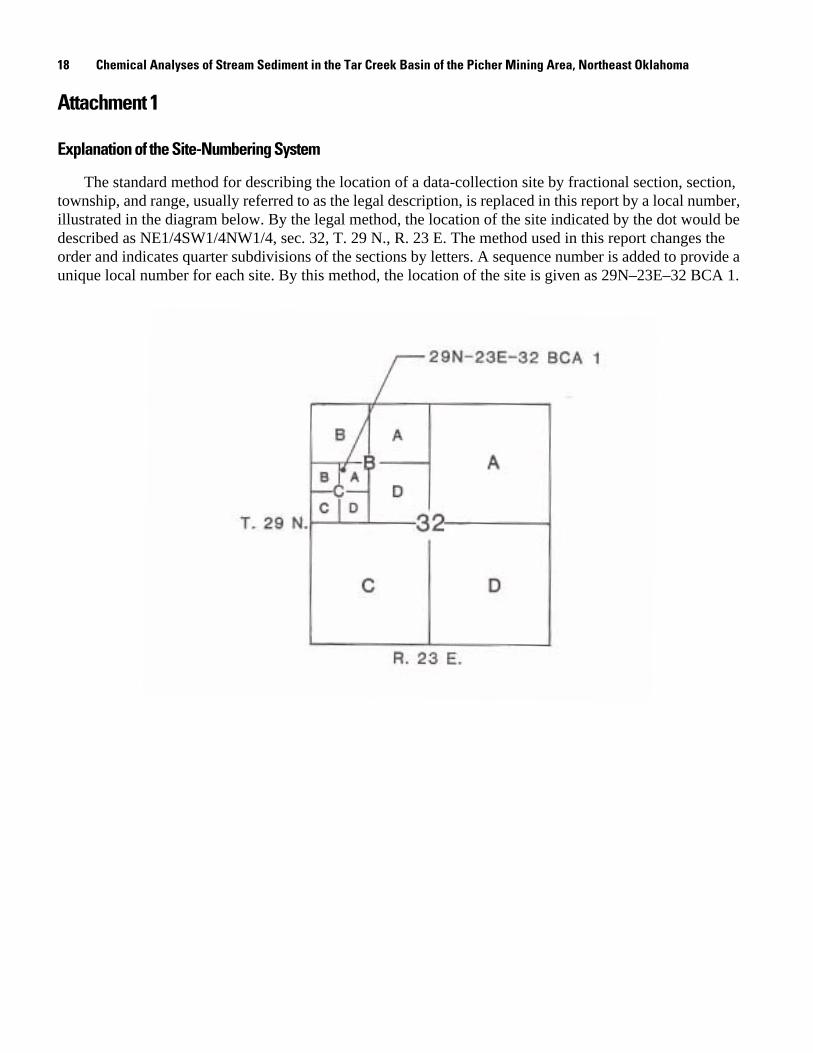
Explanation of the Site-Numbering System
The standard method for describing the location of a data-collection site by fractional section, section, township, and range, usually referred to as the legal description, is replaced in this report by a local number, illustrated in the diagram below. By the legal method, the location of the site indicated by the dot would be described as NE1/4SW1/4NW1/4, sec. 32, T. 29 N., R. 23 E. The method used in this report changes the order and indicates quarter subdivisions of the sections by letters. A sequence number is added to provide a unique local number for each site. By this method, the location of the site is given as 29N–23E–32 BCA 1.


