PREBIOTIC CHEMISTRY Chemical Analysis of a BMiller-Type^ Complex Prebiotic Broth Part II: Gas, Oil, Water and the Oil/Water-Interface Sabrina Scherer 1 & Eva Wollrab 1,2 & Luca Codutti 3 & Teresa Carlomagno 3 & Stefan Gomes da Costa 4 & Andreas Volkmer 4 & Amela Bronja 5 & Oliver J. Schmitz 5 & Albrecht Ott 1 Received: 23 August 2016 /Accepted: 2 November 2016 / Published online: 28 November 2016 # The Author(s) 2016. This article is published with open access at Springerlink.com Abstract We have analyzed the chemical variety obtained by Miller-Urey-type experiments using nuclear magnetic resonance (NMR) spectroscopy and coherent anti-Stokes Raman scattering (CARS) spectroscopy, gas chromatography followed by mass spectrometry (GC/ MS) and two-dimensional gas chromatography followed by mass spectrometry (GCxGC/MS). In the course of a running Miller-Urey-type experiment, a hydrophobic organic layer emerged besides the hydrophilic aqueous phase and the gaseous phase that were initially present. The gas phase mainly consisted of aromatic compounds and molecules containing C≡C or C≡N triple bonds. The hydrophilic phase contained at least a few thousands of different molecules, Orig Life Evol Biosph (2017) 47:381–403 DOI 10.1007/s11084-016-9528-8 Electronic supplementary material The online version of this article (doi:10.1007/s11084-016-9528-8) contains supplementary material, which is available to authorized users. * Sabrina Scherer [email protected]Albrecht Ott [email protected]1 Biologische Experimentalphysik, Universität des Saarlandes, Campus, Geb. B2 1, 66123 Saarbrücken, Germany 2 Present address: Laboratory of Microbial Morphogenesis and Growth, Institut Pasteur, 75724 ParisCedex 15, France 3 Centre of Biomolecular Drug Research, Leibniz University, Schneiderberg 38, 30167 Hannover, Germany 4 Coherent Raman Scattering Microscopy and Single-Molecule Spectroscopy Group, 3. Institute of Physics, University of Stuttgart, Pfaffenwaldring 57, 70569 Stuttgart, Germany 5 Applied Analytical Chemistry, University of Duisburg-Essen, Campus Essen, S05 T01 B35, Universitaetsstr. 5, 45141 Essen, Germany
Transcript
PREBIOTIC CHEMISTRY
Chemical Analysis of a BMiller-Type^Complex Prebiotic BrothPart II: Gas, Oil, Water and the Oil/Water-Interface
Sabrina Scherer1 & Eva Wollrab1,2 & Luca Codutti3 &
Teresa Carlomagno3 & Stefan Gomes da Costa4 &
Andreas Volkmer4 & Amela Bronja5 &
Oliver J. Schmitz5 & Albrecht Ott1
Received: 23 August 2016 /Accepted: 2 November 2016 /Published online: 28 November 2016# The Author(s) 2016. This article is published with open access at Springerlink.com
Abstract We have analyzed the chemical variety obtained by Miller-Urey-type experimentsusing nuclear magnetic resonance (NMR) spectroscopy and coherent anti-Stokes Ramanscattering (CARS) spectroscopy, gas chromatography followed by mass spectrometry (GC/MS) and two-dimensional gas chromatography followed by mass spectrometry (GCxGC/MS).In the course of a running Miller-Urey-type experiment, a hydrophobic organic layer emergedbesides the hydrophilic aqueous phase and the gaseous phase that were initially present. Thegas phase mainly consisted of aromatic compounds and molecules containing C≡C orC≡Ntriple bonds. The hydrophilic phase contained at least a few thousands of different molecules,
Orig Life Evol Biosph (2017) 47:381–403DOI 10.1007/s11084-016-9528-8
Electronic supplementary material The online version of this article (doi:10.1007/s11084-016-9528-8)contains supplementary material, which is available to authorized users.
1 Biologische Experimentalphysik, Universität des Saarlandes, Campus, Geb. B2 1,66123 Saarbrücken, Germany
2 Present address: Laboratory of Microbial Morphogenesis and Growth, Institut Pasteur, 75724ParisCedex 15, France
3 Centre of Biomolecular Drug Research, Leibniz University, Schneiderberg 38, 30167 Hannover,Germany
4 Coherent Raman Scattering Microscopy and Single-Molecule Spectroscopy Group, 3. Institute ofPhysics, University of Stuttgart, Pfaffenwaldring 57, 70569 Stuttgart, Germany
5 Applied Analytical Chemistry, University of Duisburg-Essen, Campus Essen, S05 T01 B35,Universitaetsstr. 5, 45141 Essen, Germany
primarily distributed in a range of 50 and 500 Da. The hydrophobic phase is characterized bycarbon-rich, oil-like compounds and their amphiphilic derivatives containing oxygen withtensioactive properties. The presence of a wide range of oxidized molecules hints to theavailability of oxygen radicals. We suggest that they intervene in the formation of alkylatedpolyethylene glycol (PEG) in the oil/water interface. CARS spectroscopy revealed distinctvibrational molecular signatures. In particular, characteristic spectral bands for cyanide com-pounds were observed if the broth was prepared with electric discharges in the gaseous phase.The characteristic spectral bands were absent if discharges were released onto the watersurface. NMR spectroscopy on the same set of samples independently confirmed the obser-vation. In addition, NMR spectroscopy revealed overall high chemical variability that suggestsstrong non-linearities due to interdependent, sequential reaction steps.
Keywords Origin of Life . Complex chemical mixture .Miller-Urey experiment . NMR .
In 1953, Miller and Urey synthesized organic compounds, including amino acids, from water,methane, ammonia, and hydrogen. This was a spectacular experiment that emulated theconditions on the early Earth (Miller 1953). Since then, many experiments related to theorigin of life were performed under various conditions (Miyakawa et al. 2002; Oró 1963;Schlesinger and Miller 1983; Fox 1995; Johnson et al. 2008). Besides amino acids, theformation of relevant precursors of biomolecules such as carboxylic acids, urea, and lipidswas observed (Dickerson 1979; Dose and Rauchfuss 1975; Lazcano and Bada 2003;McCollom et al. 1999). Here, we describe the chemical analysis of complex prebiotic brothin experiments of the Miller-Urey type. We used nuclear magnetic resonance (NMR) spec-troscopy, coherent anti-Stokes Raman scattering (CARS) spectroscopy, gas chromatography/mass spectrometry (GC/MS), and two-dimensional gas chromatography/mass spectrometry(GCxGC/MS). Different analytical methods were necessary to achieve a comprehensivepicture of the complex reaction mixture.
Non-invasive, chemical analysis techniques that are based on optical spectroscopy com-monly rely on probing the vibrational response of the molecular sample of interest. For theprebiotic broth in this work, we found conventional spontaneous Raman scattering spectros-copy impossible to perform because of the presence of strong and broad auto-fluorescencebackgrounds, which masked the observation of any vibrational signature bands. To circumventthis problem, next we used CARS spectroscopy (Volkmer 2005) where detection occurs atspectral frequencies on the anti-Stokes side of the excitation frequencies. Here, no one-photoninduced fluorescence background is detected. Moreover, the coherent driving and probing ofinduced molecular vibrations yield an enhancement of the Raman detection sensitivity byseveral orders of magnitude. The analysis of a CARS spectrum gives information aboutvibrational properties of all molecules inside the liquid sample probe volume, typically aboutone femtoliter.
We used NMR spectroscopy to investigate the degree of complexity of the studiedmolecular mixtures. NMR spectroscopy not only enables to determine functional groups ofthe substances under study but also provides information about chemical structures of
382 S. Scherer et al.
molecules and their molecular weights. The signal intensities directly correlate with theconcentration of the substances and even small molecules (<100 Da) are detectable. UnlikeCARS spectroscopy, NMR requires a high sample volume of the order of a milliliter.
During each Miller-Urey-type experiment, a very thin hydrophobic layer emerged on top ofthe water-based broth. It was not possible to withdraw the oil-like phase separately from theaqueous phase. We isolated the hydrophobic substances by extraction with an organic solvent.We analyzed the low concentrated samples using GC/MS and GCxGC/MS that are suitable forthe analysis of hydrophobic substances and require only a small sample volume in themicroliter range. The two-dimensionality of GCxGC/MS allows for a very high resolutionin separating substances, which produce overlapping peaks in GC/MS. The columns used inboth techniques exhibit little sensitivity to nitrogen containing compounds.
In (Wollrab et al. 2015), we previously described two types of polymer as part of a Miller-type broth, one based on a nitrogen-carbon, the other on an oxygen-carbon backbone. Thenitrogen containing homologous chain corresponds to HCN polymers that can form fromdiaminomaleonitrile (DAMN) tetramers in aqueous solutions in the presence of an unsaturatedcomplex matrix (Ruiz-Bermejo et al. 2012). The oxygen-based polymer was an amphiphilicpolyethylene glycol (PEG). Since PEG is a polyether, it is not clear how this polymer can formin an aqueous solution.
Methods
Experimental procedure
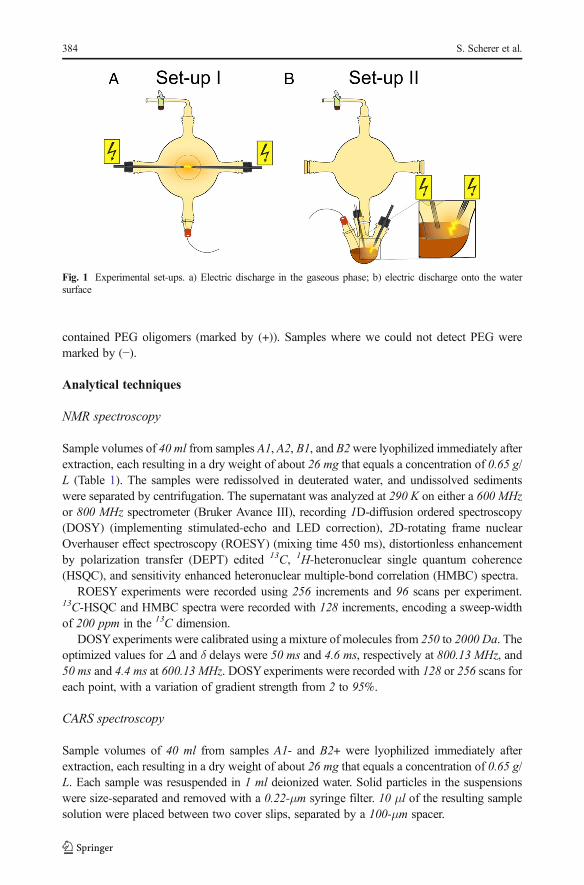
We used two different set-ups (Fig. 1) to perform Miller-Urey-type experiments. Set-up Iconsisted of only one 5 l- or 1 l-flask while set-up II was made of a 5 l-flask on top of a 1 l-vessel. The main difference between the two set-ups was the positioning of the electrodes. Inset-up I we had an electric discharge in the gaseous phase, whereas in set-up II we sparkeddirectly onto the water-surface. For sparking (~10 kV – 12 kV sawtooth, 20 Hz, ~ 20 W, directcurrent), we used a home-made high-voltage device (based upon a transformer from a cathoderay tube, max. 25 kV). For experiments, either set-up was filled with 200 ml ultrapure water(Sartorius stedim biotech, arium 611UV or GENO, Grünbeck) heated to 85 °C - 95 °C. Theinitial gas phase consisted of methane (purity 2.5, Praxair), ammonia (purity 3.8, Praxair), andwater vapor in a ratio of 7:2:1. The pressure in the closed system was about 1 atm, but variedslightly due to the reactions. Usually, the experiment ran for 2 to 4 days. Samples wereextracted and measured either at fixed points in time or in real-time. For storage, welyophilized the samples immediately after extraction.
We performed several runs to check for reproducibility (Table 1). We tried to keep the timebetween extraction and analysis as short as possible. A1, A2, A3 and A4 were produced in set-up I, B1 and B2 in set-up II. In experiments A2, A3 and A4, we extracted several samples atconsecutive time points and numbered them with increasing integers, as detailed in Table 1. InA3, we withdrew both gaseous and liquid samples simultaneously, which we labeled with thesubscripts Bgas^ and Bliquid^, respectively. To check the influence of different substances, weadded ethanolamine (HOC2H4NH2) in the course of B2, hydrogen peroxide (H2O2) before theextraction of A3_1, phosphoric acid between A3_1 and A3_2 and hydrogen peroxide betweenthe extractions of A4_2 and A4_3. We observed the formation of polyethylene glycol (PEG)during the experiments. Samples B1, B2, A2_2, A3_1liquid, A3_2liquid, A4_1 and A4_3
Chemical Analysis of a BMiller-type^ Complex Prebiotic Broth. Part II 383
contained PEG oligomers (marked by (+)). Samples where we could not detect PEG weremarked by (−).
Analytical techniques
NMR spectroscopy
Sample volumes of 40 ml from samples A1, A2, B1, and B2were lyophilized immediately afterextraction, each resulting in a dry weight of about 26 mg that equals a concentration of 0.65 g/L (Table 1). The samples were redissolved in deuterated water, and undissolved sedimentswere separated by centrifugation. The supernatant was analyzed at 290 K on either a 600 MHzor 800 MHz spectrometer (Bruker Avance III), recording 1D-diffusion ordered spectroscopy(DOSY) (implementing stimulated-echo and LED correction), 2D-rotating frame nuclearOverhauser effect spectroscopy (ROESY) (mixing time 450 ms), distortionless enhancementby polarization transfer (DEPT) edited 13C, 1H-heteronuclear single quantum coherence(HSQC), and sensitivity enhanced heteronuclear multiple-bond correlation (HMBC) spectra.
ROESY experiments were recorded using 256 increments and 96 scans per experiment.13C-HSQC and HMBC spectra were recorded with 128 increments, encoding a sweep-widthof 200 ppm in the 13C dimension.
DOSYexperiments were calibrated using a mixture of molecules from 250 to 2000 Da. Theoptimized values for Δ and δ delays were 50 ms and 4.6 ms, respectively at 800.13 MHz, and50 ms and 4.4 ms at 600.13 MHz. DOSYexperiments were recorded with 128 or 256 scans foreach point, with a variation of gradient strength from 2 to 95%.
CARS spectroscopy
Sample volumes of 40 ml from samples A1- and B2+ were lyophilized immediately afterextraction, each resulting in a dry weight of about 26 mg that equals a concentration of 0.65 g/L. Each sample was resuspended in 1 ml deionized water. Solid particles in the suspensionswere size-separated and removed with a 0.22-μm syringe filter. 10 μl of the resulting samplesolution were placed between two cover slips, separated by a 100-μm spacer.
Fig. 1 Experimental set-ups. a) Electric discharge in the gaseous phase; b) electric discharge onto the watersurface
384 S. Scherer et al.
Experiments were carried out using a home-built, multiplex-CARS microspectrometer(Gomes da Costa 2010): A mode-locked Ti:sapphire laser oscillator (Mira 900-P, CoherentInc.), providing a pulse train of 2.3-ps pulses at a repetition rate of 76 MHz and a wavelength
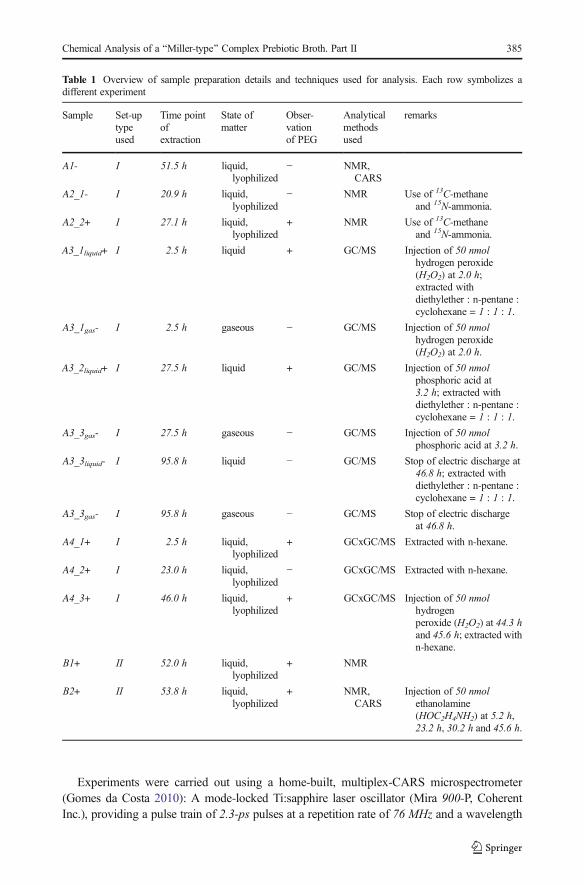
Table 1 Overview of sample preparation details and techniques used for analysis. Each row symbolizes adifferent experiment
Sample Set-uptypeused
Time pointofextraction
State ofmatter
Obser-vationof PEG
Analyticalmethodsused
remarks
A1- I 51.5 h liquid,lyophilized
− NMR,CARS
A2_1- I 20.9 h liquid,lyophilized
− NMR Use of 13C-methaneand 15N-ammonia.
A2_2+ I 27.1 h liquid,lyophilized
+ NMR Use of 13C-methaneand 15N-ammonia.
A3_1liquid+ I 2.5 h liquid + GC/MS Injection of 50 nmolhydrogen peroxide(H2O2) at 2.0 h;extracted withdiethylether : n-pentane :cyclohexane = 1 : 1 : 1.
A3_1gas- I 2.5 h gaseous − GC/MS Injection of 50 nmolhydrogen peroxide(H2O2) at 2.0 h.
A3_2liquid+ I 27.5 h liquid + GC/MS Injection of 50 nmolphosphoric acid at3.2 h; extracted withdiethylether : n-pentane :cyclohexane = 1 : 1 : 1.
A3_3gas- I 27.5 h gaseous − GC/MS Injection of 50 nmolphosphoric acid at 3.2 h.
A3_3liquid- I 95.8 h liquid − GC/MS Stop of electric discharge at46.8 h; extracted withdiethylether : n-pentane :cyclohexane = 1 : 1 : 1.
A3_3gas- I 95.8 h gaseous − GC/MS Stop of electric dischargeat 46.8 h.
A4_1+ I 2.5 h liquid,lyophilized
+ GCxGC/MS Extracted with n-hexane.
A4_2+ I 23.0 h liquid,lyophilized
− GCxGC/MS Extracted with n-hexane.
A4_3+ I 46.0 h liquid,lyophilized
+ GCxGC/MS Injection of 50 nmolhydrogenperoxide (H2O2) at 44.3 hand 45.6 h; extracted withn-hexane.
B1+ II 52.0 h liquid,lyophilized
+ NMR
B2+ II 53.8 h liquid,lyophilized
+ NMR,CARS
Injection of 50 nmolethanolamine(HOC2H4NH2) at 5.2 h,23.2 h, 30.2 h and 45.6 h.
Chemical Analysis of a BMiller-type^ Complex Prebiotic Broth. Part II 385
of 808 nm, was split into two parts. One part served as the pump pulses, while the other partwas coupled into a photonic crystal fibre (PCF: femtowhite800, NKT photonics) generating apicosecond supercontinuum. The long-wavelength part of the latter was used as Stokes-pulsesfor CARS. The pump and Stokes beams were separately controlled in size and collimation bytelescopes, and recombined on a dichroic mirror (zq 800 rdc, Chroma Technology). Thespatially and temporally overlapped pump and Stokes pulses were collinearly focused intothe sample using a 1.2-N.A. water immersion objective (UPLSAPO IR 60W, Olympus). Theaverage pump and Stokes powers in the focus amounted to respectively 60 mW and 13 mW.The generated CARS emission was par-focally collected in the forward-direction with anidentical objective and spectrally isolated from the excitation pulses with two short-pass filters(RU785SP, Semrock and FES800, Thorlabs). Spectrally resolved detection was performedusing an imaging spectrometer, consisting of a 150-mm monochromator (SP150, ActonResearch) and a liquid-N2 cooled CCD-array detector (Spec10, Roper Scientific). CARSspectra were recorded with total acquisition times of 50 s.
All raw spectra were first subjected to cosmic ray removal, detector dark-count subtraction,and corrected for broadband, intra-Stokes CARS contributions, independently recorded whenthe pump and Stokes pulses did not temporally overlap. Subsequently, CARS spectra takeninside the prebiotic broth sample solutions and in a reference sample of pure water werenormalized with nonresonant CARS spectra recorded under identical experimental conditionswhen focused into the glass cover slip. For each normalized CARS spectrum, the vibrationalphase spectrum was then retrieved by applying the maximum-entropy method (MEM), whichincluded polynomial error-phase estimation within a subset of vibrationally nonresonantspectral regions (Vartiainen 1992). By using the recovered MEM-phase spectrum, its error-phase estimation, and the corresponding normalized CARS spectrum, the imaginary part of thevibrationally resonant, third-order susceptibility spectrum was reconstructed, resulting in thefull characterization of the sample’s spectral Raman response, i.e., Im[χ(3)(ν)] . Finally, themeasured and reconstructed Im[χ(3)(ν)] spectra of pure water were subtracted fromthat of the prebiotic broth sample solutions according to its weighted amplitudecontribution at 3426 cm−1.
For an estimation of the number of vibrational modes inside our sample volume of 0.1femtoliter, which is given by the diffraction limited focus dimensions, we employed theIm[χ (3)(ν)] amplitude of the CH3-stretching peak intensity at 2940 cm−1. Using DMSO inaqueous solution as a reference, the observed peak intensities of the prebiotic brothsamples typically correspond to a range of 0.7 × 10⁶ to 20 × 106 of CH-stretching vibra-tional modes inside the probe volume. If the signal was due to DMSO with two CH3-stretching modes per molecule, this would indicate a molar concentration range of 10 to300 mM in the sample probed. For the complex mixture of diverse molecules withunknown number of CH-stretching bonds in the prebiotic broth samples, no absolutemolar concentrations can be provided.
GC/MS
GC/MS consisted of a Clarus 500 GC (Perkin Elmer), equipped with a Zebron ZB-FFAPcolumn (Phenomenex), and a quadrupole Clarus 500 MS (Perkin Elmer). The 15-m longcolumn had an inner diameter of 320 μm. The elapsed time during measurement was 32min.We applied a temperature gradient from 40 to 230°, increasing in a stepwise manner by 6° perminute. The spectra of the detected molecules were compared to the NIST database.
386 S. Scherer et al.
The gaseous samples (A3_1gas-, A3_2gas-, and A3_3gas-) were directly injected into the gaschromatograph. Hydrophobic substances were extracted from 1 ml liquid sample that includedthe oil-like layer in 1 ml of an 1:1:1-mixture of dethylether, n-pentane and cyclohexane(A3_1liquid+, A3_2liquid+, and A3_3liquid-).
By comparing the surface area of the peaks in the chromatogram, we determined theconcentrations of substances in the liquid phase relative to a reference (Appendix: Tab. 6, 7,and 8). We found the solvent cyclohexane most suitable to use as a reference. The estimatedconcentrations of the different molecules detected in the broth reached up to the millimolar range.
GCxGC/MS
The samples A4_1, A4_2, and A4_3 were analyzed with a comprehensive two-dimensional gaschromatograph coupled with a quadrupole mass spectrometer (GCxGC-EI-qMS). The lyoph-ilized samples were extracted with water and n-hexane (1:1). Afterwards the organic phase wasdiluted by a factor of 5 with n-hexane. A procedural blank was also prepared. The sampleswere introduced into the GCxGC at an injection temperature of 310 °C and a split-ratio of 1:5.The temperature program started from 60 °C (1 min hold time) with a gradient of 5 °C/min upto 200 °C, then with 3 °C/min up to 300 °C (1 min hold time). For the first dimension, a non-polar Phenomenex ZB-5MSi (30 m× 0.25 mm× 0.25 μm) column was used. The seconddimension separation was performed on a middle-polar Phenomenex ZB-50(2.5 m×0.1 mm×0.1 μm$) column. Helium was used as a carrier gas with a velocity of1.96 ml/min. The modulation time was set to 3.8 s. The interface temperature of the transferline was 310 °C. For the electron impact ionization the ion source temperature was set to200 °C, the electron energy was 70 eVand a scan range from 40 to 800 m/z was used. The datawere evaluated with the NIST/W9N08 databases.
By standard addition we determined the production of (1.26 ± 0.08)μg C17-linear alkaneand (1.66 ± 0.17) μg linear C19-alkane in 5 ml reaction product. That equals concentrations of(1.048 ± 0.067)μM and (1.236 ± 0.127)μM, respectively.
Results
NMR spectroscopy
A1- revealed a broad distribution of 1H resonances between 9.6 ppm and 0.5 ppm (Fig. 2). Themost intense signals were two singlets at 4.0 and 3.7 ppm. DOSY experiments showed auniform distribution of diffusion coefficients between −9 and −9.5 m2/s, which corresponds tomolecules of molecular weight (MW) in the range from 250 to 500 Da. DEPT edited HSQCshowed carbons in a span from 10 to 80 ppm corresponding to CH, CH2 and CH3 aliphaticgroups (alkanes, alkenes and alkynes with various substitutions including heteroatoms).Additional carbon resonances in the range from 110 to 140 ppm, correlating with 1Hs between8.3 and 5.8 suggested the presence of differently substituted alkene and aromatic moieties. Asignal at 13C (166.8 ppm) and 1H (8.0 ppm) suggested the presence of formamide groups; thegroup correlated with a carbon at 28.9 ppm in the HMBC spectrum, which was compatiblewith a N-methyl-formamide (Fig. 6). The HMBC spectrum showed correlation betweenaliphatic carbons and carbons between 115 and 125 ppm (alkenes, cyanides, cyanamides)and between 150 and 190 ppm (esters, amides, acids and heteroatom substituted alkenes).
Chemical Analysis of a BMiller-type^ Complex Prebiotic Broth. Part II 387
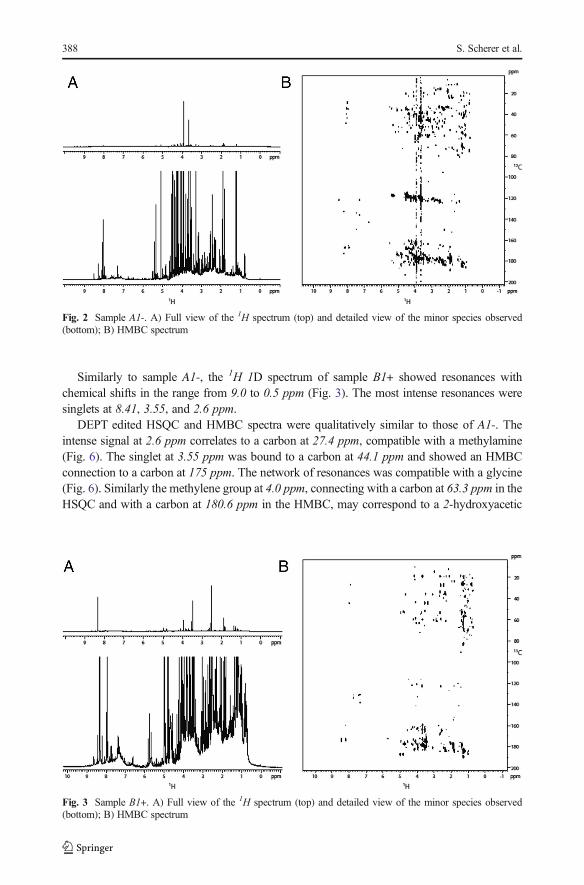
Similarly to sample A1-, the 1H 1D spectrum of sample B1+ showed resonances withchemical shifts in the range from 9.0 to 0.5 ppm (Fig. 3). The most intense resonances weresinglets at 8.41, 3.55, and 2.6 ppm.
DEPT edited HSQC and HMBC spectra were qualitatively similar to those of A1-. Theintense signal at 2.6 ppm correlates to a carbon at 27.4 ppm, compatible with a methylamine(Fig. 6). The singlet at 3.55 ppm was bound to a carbon at 44.1 ppm and showed an HMBCconnection to a carbon at 175 ppm. The network of resonances was compatible with a glycine(Fig. 6). Similarly the methylene group at 4.0 ppm, connecting with a carbon at 63.3 ppm in theHSQC and with a carbon at 180.6 ppm in the HMBC, may correspond to a 2-hydroxyacetic
Fig. 2 Sample A1-. A) Full view of the 1H spectrum (top) and detailed view of the minor species observed(bottom); B) HMBC spectrum
Fig. 3 Sample B1+. A) Full view of the 1H spectrum (top) and detailed view of the minor species observed(bottom); B) HMBC spectrum
388 S. Scherer et al.
acid (Fig. 6). Finally the resonance at 8.4 ppm directly connected with a 13C at 173.8 ppm canbe attributed to formamide (Fig. 6).
The 1H 1D spectrum of sample B2+ shows two intense resonances at 3.88 and 3.24 ppm(doublets of doublets) within a distribution of resonances between 0.0 and 9.4 ppm (Fig. 4). Asin the samples A1- and B1+, the DOSY experiment did not reveal the presence of polymers.The DEPTedited HSQC showed two very intense correlations at 44.2 (δ 1H 3.24) and 60.42 (δ1H 3.88) ppm together with a number of much less intense correlations including the oneassigned to the formamide derivative in sample B1+. The proton resonance 1H at 3.24 ppmcorrelated in the HMBC with a carbon at 164.4 ppm, allowing to hypothesize the presence of a(2-hydroxyethyl)urea molecule (Fig. 6).
The 1H 1D spectrum of sample A2_1- showed resonances between 0 and 9 ppm, as all theother samples (Fig. 5). The DEPT edited HSQC showed a majority of CH2 groups between 45and 80 ppm correlating with protons between 3.5 and 5.5 ppm. These corresponds toheteroatom-substituted alkanes and alkenes, and conjugated alkenes. In the aromatic regioncorresponding to 1H from 6.5 to 8.5 ppm and 13C from 120 to 140 ppm, we observed only twosignals. Additional CH groups were seen at 13C from 162 to 176 ppm and 1H from 7.8 to8.3 ppm. These correspond among others to substituted formic acid, formamide, andmethanimine.
The 15N, 1H-HSQC of sample A2_1- showed several peaks in the range from 130 to100 ppm (15N) and from 9 to 6.5 ppm (1H). This was compatible with the presence of amines,amides, and terminal azides (Loewenstein 1982; Forman 1963). A single resonance at 15N73.7 ppm and 1H 6.7 ppm could be ascribed to urea (Fig. 6).
The HMBC 13C spectrum showed that the majority of the CH3 groups correlated withquaternary carbons between 170 and 190 ppm (esters, amides, aldehydes). A second group ofconnections was between CH2 moieties ranging from 3.8 to 4.5 ppm and 13C atoms at around120 ppm. Here, we expected alkenes, isocyanate, and nitrile moieties.
Sample A2_2+ was similar to sample A2_1-. The 1H resonances at 4.3, 4.0, 3.9 and 1.1 ppmwere of higher relative intensity in A2_2+ as compared to A2_1-. The 1H resonances observed
Fig. 4 Sample B2+. A) Full view of the 1H spectrum (top) and detailed view of the minor species observed(bottom); B) HMBC spectrum
Chemical Analysis of a BMiller-type^ Complex Prebiotic Broth. Part II 389
at 4.3, 4.0, and 3.9 ppm were either methyl or methine groups and correlated with 13C carbonsat 50.3, 30.9, and 63.2 ppm, respectively. In the HMBC, the 1H at 4.3 ppm correlated with acarbon at 121.3 ppm. The 1H at 4.0 ppm correlated with a carbon at 53.6 ppm (CH2). The
1H at4.3 ppm correlated with a carbon at 121.3~ppm. The 1H at 4.0 ppm also correlated withcarbons at 53.6 (CH2 with
1H at 4.75 ppm), 73.9 (CH2 with1H at 3.8 ppm), 120.1, 163.2, and
186.9 ppm. The 1H at 3.9 ppm correlated with a carbon at 180.8 ppm. The 1H resonance at1.1 ppm was bound to a carbon at 32 ppm, and correlated in the HMBC to another carbon at72.5 ppm. The spin system was compatible with 2-propanol (Fig. 6). However the fact that thismolecule was not enriched in 13C (no 1JHC coupling) in 1D spectra indicated that the 2-propanol did not stem from a chemical reaction of the gases. Possible sources of 12C were thecleaning agent deconex (Borer Chemie AG), or the teflon used for sealing.
In the 13C HSQC spectra of sample A2_2+, we saw new CH2 moieties at 5.6 and 59.9 ppm(Fig. 5), compatible with ethylene glycol, the monomer of PEG (Fig. 6).
The comparison of the 1H 1D and the HMBC spectra of the different samples (Figs. 2, 3, 4,and 5), clearly indicates that the composition of the primordial broth varied strongly betweenthe different experiments. The variability occurred even between samples extracted from thesame experiment at different time points (Fig. 5).
Nevertheless, we detected many carbon moieties such as CH3, CH2, and CH in thealiphatic range. We observed a variety of molecules containing nitrogen moieties, for examplein form of amides or C≡N triple bonds. Furthermore, many C=O bonds were detectable,
Fig. 5 Left: comparison of the 1H spectra for samples A2_1- (black) and A2_2+ (red). Right: a detail of thecomparison between 13C-edited HSQC spectra. Methylene groups are depicted in black for sample A2_1- and inred for sample A2_2+. Methyl groups are colored in blue for both samples. The dashed square marks uniquemethylene groups observed in sample A2_2+
390 S. Scherer et al.
especially C-OH as for example in alcohol or C-O double bonds in aldehydes, or thecombination of both (acid moiety).
A commonality among the samples was that the molecules detected by NMR were locatedin a mass range between 250 and 500 Da. The primordial broth mainly consists of moleculesthat are small relative to biomolecules like proteins.
CARS spectroscopy
Figure 7 displays the Im[χ(3)(ν)] spectra of samples A1- and B2+ as obtained by CARSmeasurements. Very distinct vibrational features were observed in the prebiotic broth sampleA1- when compared to sample B2+.
The spectrum of sample A1- exhibited its most intense peak at 2940 cm−1 with shouldersappearing at 2890 and 2970 cm−1, assigned to the asymmetric CH2 stretching, symmetric CH3
stretching, and asymmetric CH3 stretching modes, respectively (Lin-Vien et al. 1991). Whilethe bands in the 2800–3000 cm−1 region are ubiquitous to most organic compounds, thecharacteristic band observed at 2250 with a shoulder at 2210 cm−1 clearly indicated thepresence of compounds that contained aliphatic (Raliphatic − C≡N) and aromatic(Raromatic−C≡N) triple bonds (Lin-Vien et al. 1991). In the so-called fingerprint region, thebroad feature at about 1600 cm−1 (marked by ⁎) originated from the residual water band due toincomplete subtraction of the Im[χ(3)(ν)] spectrum of pure water in that spectral range. The
Fig. 6 Molecules detected in samples A1-, B1+, B2+, A2_1-, and A2_2+
Chemical Analysis of a BMiller-type^ Complex Prebiotic Broth. Part II 391
peaks at 1440, 1005, and 880 cm−1were assigned to the scissoring mode of the CH2 groups, thecharacteristic ring-breathing mode of phenyl residues, and the stretching mode of aliphatic C-Nbonds, respectively (Lin-Vien et al. 1991). Alternatively, the 880-cm−1 band could alsocorrespond to the C-H wag vibrations of NH2-monosubstituted benzene (Lin-Vien et al. 1991).
The most prominent differences observed in the spectrum of sample B2+ with respect toA1- were the lack of any detectable compounds that contain C≡N triple bonds and CH2 groups,and the existence of an additional narrow peak at 970 cm−1. The latter was tentatively assignedto breathing modes of small aromatic rings containing both C and N atoms (Bernard et al.2006). This spectral feature pointed to a higher aromaticity of molecules in sample B2+ versusthose in sample A1-, which was consistent with the lack of signatures for both aliphatic CH2
groups and aliphatic (Raliphatic −C≡N) triple bonds. Similar vibrational spectral features hadbeen observed for tholins (Imanaka et al. 2004; Bernard et al. 2006).
GC/MS
The samples A3_1liquid/gas to A3_3liquid/gas were extracted at different time points during thesame experimental run. The results of the GC/MS analysis are shown in tables 3–8 (seeAppendix). In addition to the molecule name as well as molecular and structural formula, thehit ratio given by the NIST database, and the delay times of the GC are given. For suggestedmolecules with a low-percentage hit ratio, a second or even a third match is shown. We sawthat the quantity of different detected molecules in the gaseous samples diminished (from 40 to34 and 25 molecules) for samples A3_1gas-, A3_2gas-, and A3_3gas-, respectively, while thenumber increased (from 4 to 9 and 15 molecules) in the liquid samples for A3_1liquid+,A3_2liquid+, and A3_3liquid-, respectively. The ten most common molecular compounds of allgaseous and liquid samples are listed and compared in Table 2. For each sample the firstnumber gives the quantity of the molecular compound being part of the first molecule matchesin the NIST library. The numbers in brackets include second and third matches (Table 2). Byfar, the most frequent compounds were benzene rings, esters, and alkynes. In the gaseoussamples, the quantity of a particular compound was either almost constant (alkynes, alkanes,ethers) for samples A3_1gas- to A3_3gas-, or descending (benzene rings, esters, carbonyls,alkenes, hydroxyls). Nitriles and amines constituted an exception. Their occurrence rose fromA3_1gas- to A3_2gas- and fell from A3_2gas- to A3_3gas-. The quantity of one molecularcompound in the liquid samples was conversely either constant (alkenes, ethers, hydroxyls)
Fig. 7 Reconstructed Im[χ(3)(ν)]spectra of the primordial brothsamples A1- (black curve) and B2+(red curve) obtained from CARSspectroscopy experiments. Thespectra are offset by 0.02. See textfor peak assignments
392 S. Scherer et al.
from A3_1liquid+ to A3_3liquid- or ascending (benzene rings, esters, alkanes, carbonyls). Esterswere not detectable in A3_1liquid+ and A3_2liquid+, but they were found with 8 first matches inA3_3liquid-. Alkynes and amines were not detectable in the aqueous phase as first matches. Asin the gaseous samples, nitriles were primarily found in the second probe (A3_2liquid+).
In Figs. 8 and 9, molecules with special properties or highly reactive functional groups areshown. In the gaseous samples, molecules with two ketone groups in a symmetrical order andcompounds containing long carbon chains were detectable. In both phases, gaseous andliquid, we observed molecules with combinations of benzene rings and ester bonds aswell as highly reactive functional groups like oxiranes, isocyanates, peroxides, nitrocompounds, and nitrile groups.
Table 2 The first ten most common molecular compounds in samples A3_1liquid/gas to A3_3liquid/gas analyzedwith GC/MS in descending order of abundance. The number indicates how many times the moiety occurs in thebest matching molecule from the NIST database. The number in brackets indicates the number of occurences byincluding the second and third match
Chemical Analysis of a BMiller-type^ Complex Prebiotic Broth. Part II 393
GCxGC/MS
The samples A4_1 - A4_3were analyzed, and the resulting contour plots are shown in Figs. 10, 11,and 12. Each spot on the contour plot represents a single compound, for which a full mass spectrumis available. The x-axis represents the retention times on the 1st column, indicating the vaporpressure of the analytes. The y-axis shows the 2nd column retention times, indicating the polarity ofthe analytes. The spots are labelled with numbers, and homologues series are grouped togethermarked with arrows. Peak identification was based on mass spectral data from NIST/W9N08libraries. The mass spectral match factors of the proposed compounds are written in brackets nextto the compounds. The following description of the detected spots will assume only the spots
Fig. 8 Molecules with distinct properties or highly reactive groups as detected in A3_1liquid/gas to A3_3liquid/gasby GC/MS
394 S. Scherer et al.
occurring in samples A4_1 to A4_3 and not those occuring in the procedural blank (AppendixFig. 15). The procedural blank was taken by performing a liquid-liquid extraction with water andpure n-hexane. After shaking overnight, the organic phase was separated and diluted in a ratio of1:10 and 1:5. The image of the procedural blank is showing spots, which originate from columnbleeding, impurities in the solvent or contaminations during the extraction step. So these spots canbe automatically excluded in the sample images of the Miller-type experiments. Figure 10 shows
Fig. 9 Molecules with special properties or highly reactive groups as detected in A3_1liquid/gas to A3_3liquid/gas byGC/MS
Chemical Analysis of a BMiller-type^ Complex Prebiotic Broth. Part II 395
the result of the first sample A4_1+. Fig. 10b shows the blow-up of the marked region of interestdepicted in Fig. 10a, illustrating the spots more clearly. Spots numbered 1–3 were proposed to bebranched and linearC11-C13 fatty alcohols, whereas the spots 4–6were assigned to branchedC14-
(a) Complete
(b) Blow
contour plot
-up of the m
of Sample A4
arked region
_1+.
.
Fig 10 GCxGC/MS contour plot of Sample A4_1+ and blow-up of the marked region for a clearer demonstra-tion of the spots
396 S. Scherer et al.
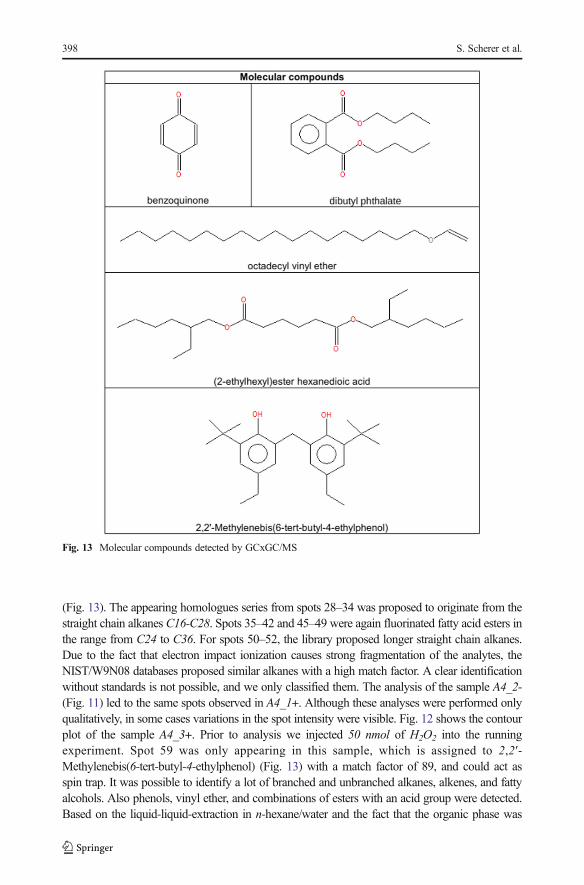
C19 alkanes. For the spots 9–10, the libraries suggestedmainlyC19-C20 alkenes, and for spots 11–13 branched C16-C18 fatty alcohols. Spots 21–27 were proposed as fluorinated fatty acid esters.The fluorine atoms most likely originate from the Teflon discs, which were used to seal theexperimental set-up. More polar substances like an alkylated benzoquinone (7) and also phenol (8)were found (Fig. 13). Analyzing sample A4_1+ (Fig. 10), the most intensive spots are dibutylphthalate (53), octadecyl vinyl ether (56), and bis(2-ethylhexyl)ester hexanedioic acid (57)
Fig. 11 GCxGC/MS contour plot of Sample A4_2-
Fig. 12 GCxGC/MS contour plot of Sample A4_3+
Chemical Analysis of a BMiller-type^ Complex Prebiotic Broth. Part II 397
(Fig. 13). The appearing homologues series from spots 28–34 was proposed to originate from thestraight chain alkanes C16-C28. Spots 35–42 and 45–49 were again fluorinated fatty acid esters inthe range from C24 to C36. For spots 50–52, the library proposed longer straight chain alkanes.Due to the fact that electron impact ionization causes strong fragmentation of the analytes, theNIST/W9N08 databases proposed similar alkanes with a high match factor. A clear identificationwithout standards is not possible, and we only classified them. The analysis of the sample A4_2-(Fig. 11) led to the same spots observed in A4_1+. Although these analyses were performed onlyqualitatively, in some cases variations in the spot intensity were visible. Fig. 12 shows the contourplot of the sample A4_3+. Prior to analysis we injected 50 nmol of H2O2 into the runningexperiment. Spot 59 was only appearing in this sample, which is assigned to 2,2′-Methylenebis(6-tert-butyl-4-ethylphenol) (Fig. 13) with a match factor of 89, and could act asspin trap. It was possible to identify a lot of branched and unbranched alkanes, alkenes, and fattyalcohols. Also phenols, vinyl ether, and combinations of esters with an acid group were detected.Based on the liquid-liquid-extraction in n-hexane/water and the fact that the organic phase was
Fig. 13 Molecular compounds detected by GCxGC/MS
398 S. Scherer et al.
analyzed, almost no compounds containing nitrogen were proposed from the databases, whichcould be due to the higher solubility of amines, amides, and other nitrogen containing compoundsin the hydrophilic phase in conjunction with the properties of the chosen column.
Discussion
Right after the beginning of the Miller-Urey-type experiment, the broth consists of a gaseousphase and an aqueous phase with an oil-layer on top . We analyzed the gaseous phase by GC/MS, the aqueous phase by LC/MS, NMR, and CARS spectroscopy and the oil phase by GC/MS and GCxGC/MS. We estimated the concentration of several reaction products of the liquidphase by CARS spectroscopy, GC/MS and GCxGC/MS. The molar concentrations of differentmolecules strongly varied, reaching up to millimolar levels.
NMR spectroscopy performed on samples from identical and different set-ups (Fig. 1),revealed a high variability among the sample composition of various experiments (Figs. 2, 3,4, and 5), although the starting conditions were as similar as possible. A potential reason forthis are sequential reactions where the pool of product molecules determines (likewisecatalytically) the next reaction step. Such reaction networks consisting of thousands ofsubstances easily become non-linear, a fortiori as catalysts participate. Non-linearities candrive the system to different compositions despite almost identical initial conditions. This isreminiscent of biological systems (Braun 2015).
NMR spectroscopy of liquid fractions of both types of set-up revealed the presence ofalkanes, alkenes, and alkynes as well as aliphatic carbons. Further, NMR spectroscopyexhibited a pronounced signature of C-O bonds as present in alcohols, acids, and ketones.Besides amines, compounds containing both amine and ketone bonds were detected. Amongthem amides (especially formamide), urea, and glycine molecules. They are known asimportant biorelevant precursor molecules (Bada and Lazcano 2003).
NMR spectroscopy also detected cyano compounds (and possibly isocyanate, and azidegroups). They are classed as pseudohalogens (Moss et al. 1995) because they are able tochemically act as halogens. Halogens are effective catalysts for many organic reactions.
CARS spectroscopy revealed distinct vibrational features of molecular moieties, dependingon the set-up used for sample preparation (Fig. 7). While characteristic spectral signatures fromC≡N triple-bonds and from aliphatic CH2 groups were observed if the broth was prepared withset-up I, the absence of both of these signatures and the observation of aromatic ring breathingmodes containing C and N moieties in samples prepared with set-up II point to a higheraromaticity in samples from set-up II. This dependence of chemical composition on samplepreparation was independently confirmed by NMR spectroscopy, performed in parallel on thesame set of samples.
Both NMR and CARS spectroscopies identified a lot of nitrogen compounds like amidesand C≡N triple bonds in samples prepared in set-up I. The absence of nitriles in samplesproduced in set-up II could be explained by the positioning of the electric discharge. Sparkingon the water surface locally increases the concentration of water vapor. The high concentrationof oxygen in the area of the electric discharge could increase the formation of oxygencontaining compounds compared to nitrogen containing molecules.
The results of NMR and CARS showed high variances in the composition of the reactionmixture dependent on the positioning of the electric discharge. Miller observed considerabledifferences in the chemical composition of the primordial broth, using an electric spark or a
Chemical Analysis of a BMiller-type^ Complex Prebiotic Broth. Part II 399
silent discharge, whereas changes of the gas mixture did not affect the chemical variety (Badaand Lazcano 2003).
The oil-like organic layer that formed on top of the water surface in the course of theexperiment primarily consisted of branched and linear alkanes, alkenes, fatty alcohols, esters,and ethers, as shown by GC/MS and GCxGC/MS. The number of carbon atoms per moleculevaries from 4 up to 28 and above. Benzene rings also represent a significant fraction. Manymolecules of the oil phase contained oxygen. Such compounds combine a hydrophobic and ahydrophilic part. They act as tensioactives. A significant volume of foam formed uponshaking, highlighting the presence of tensides. Q-Tof mass spectra of the foam showed PEGderivatives in high intensity compared to all other detected molecules. This indicates theamphiphilic character of the PEG-alkane polymers (Wollrab et al. 2015).
GC/MS of gaseous samples produced in set-up I showed a high quantity and importantdiversity of molecules especially at the beginning of the experiment. The most abundantmolecular compounds were benzene rings followed by alkynes, esters, and carbonyls(Table 2). The molecular variety of benzene rings, esters, and carbonyls gradually decreasedin the gas phase, while increasing in the liquid medium. It is likely that these compoundsincreasingly dissolved in the liquid fraction over time. The variety of alkenes, and hydroxylsdiminished with time in the gas phase, whereas they remained at a constant concentration inthe liquid phase. Alkynes, alkanes and ethers constituted a permanent fraction of the gaseousphase (Table 2). Molecules containing nitrogen groups like nitriles and amines constituted anexception since they appeared and disappeared over the experimental time course (Table 2).Among the detected molecular pool we found highly reactive and marginally stable functionalgroups like nitriles, epoxides, and a lot of diketones or polyphenols (Figs. 8 and 9). The ketonegroups in diketones and polyphenols were often arranged symmetrically. In this configurationthey are able to act as radical traps. Prominent examples are quinones which play an importantrole in biology (Creber et al. 1982). They can be produced by auto-oxidation of polyphenolsunder high pH-values (Gutierrez 2000; Nair et al. 2004). Polyphenols are well-knownantioxidants in phytochemistry (Scalbert et al. 2005). After formation, quinones are able toreduce to semiquinones and release superoxides (Gutierrez 2000; Nair et al. 2004). Due to thehighly alkaline conditions of the reaction mixture (pH-value between 9 and 11), diketones areable to attract dipolar and positively charged molecules and act as oxidizers.
Comparing the different techniques, first of all we note that the results from GC/MS andGCxGC/MS were very similar. They revealed not only carbon chains of different length andbenzene rings, but also complex molecules. As long as they primarily describe the oil-likephase, they can hardly be compared to the results of NMR and CARS, which were only able toanalyze the water-based fraction due to the small quantity of extracted hydrophobic com-pounds. The results from NMR and CARS spectroscopies partially vary, but they are notcontradictory. The concentration of molecular compounds in the primordial broth is generallyvery low, not exceeding the micromolar scale. Consequently, the chemical specification isperformed at the limit of sensitivity of the method used for analysis. Another possibleexplanation for observed differences is that the large molecular variety caused overlap ofseveral signals that made sometimes a clear identification of molecular compounds impossible.Under these conditions, the chemical analyses by NMR and CARS spectroscopies cancomplement each other.
We previously showed that different polymers arise in the reaction mixture. Mass spec-trometry revealed polyethylene glycol (PEG) derivatives, while NMR spectroscopy revealedpolymers containing a nitrogen-carbon backbone (Wollrab et al. 2015).
400 S. Scherer et al.
In highly alkaline solutions, HCN can produce the tetramer diaminomalonitrile (DAMN),and an interconnected ladder polymer (Völker 1960; Matthews and Minard 2006). In com-parison, the production of the here observed nitrogen-based polymer is not that preferential(Wollrab et al. 2015). In alkaline solutions, after the reaction of HCN molecules to the trimeraminomalonitrile, polyaddition of the trimer forms polyaminomalonitrile, which cumulativelyreacts with HCN to heteropolyamidines. In water, the trimers react to heteropolypeptides byreleasing NH3 and CO2 (Matthews and Moser 1966, 1967). The heteropolyamidines andheteropolypeptides are similar to the nitrogen-based polymer in our reaction mixture. Weassume related formation steps which are possibly directed by catalysts. As the polymerconsists of a nitrogen-carbon backbone, it is also located in the oil/water interface. There, itcan possibly participate as a template in the formation process of the PEG polymers.
The detected PEG derivatives are bound to carbon chains of approximately 12 carbonatoms (Wollrab et al. 2015). These tensides are soluble in the aqueous phase as well as in theoil phase. PEG is a well-known phase-transfer catalyst, capable of transporting positivelycharged molecules from the aqueous phase into the oil phase and vice versa (Kim et al. 2003b;Totten and Clinton 1988).
Neither NMR spectroscopy nor GC/MS and GCxGC/MS, showed strong distinctions in thechemical composition between samples containing PEG or not in the same set-up. Weconclude that only a few different molecules participate in the formation and degradation ofthe polymers. They are hard to identify among the large molecular pool.
The PEG polymers are not stable within the broth (Wollrab et al. 2015). It appeared that thepolymers were much more likely to appear in set-up II compared to set-up I. In set-up II, PEGwas detected in over 90% of the samples. In this set-up more oxygen radicals were produced,because of directly sparking onto the aqueous phase. We observed that after injection of H2O2,PEG polymers formed. Exemplarily, we listed samples A4_2- and A4_3+ (Table 1). Thepurpose of adding H2O2 was to test for the influence of a radical former on the reactionmixture. In the experiment radicals form during the sparking and they exhibit a short life time.Furthermore, GCxGC showed 2,2′-Methylenebis(6-tert-butyl-4-ethylphenol) which appearedin the hydrophobic phase in A4_3+. 2,2′-Methylenebis(6- tert-butyl-4-ethylphenol) is a poly-phenol (an antioxidant (Scalbert et al. 2005)) and strongly reminds of a reduced quinone. If aquinone or diketone is reduced, a superoxide gets released that oxidizes other molecules. Weunderstand that the addition of H2O2 shifted the system into a more oxidizing state where PEGderivatives formed.
Furthermore in set-up II, NMR and CARS spectroscopies did not detect clearsignals for cyanide compounds in the aqueous phase. Since the PEG polymers weremuch more stable in this set-up, this points towards cyanides promoting the degrada-tion of PEG polymers. Nitriles are strong reducing agents. Byproducts of reductionreactions induced by nitriles are for example amides that were highly present in theNMR spectra.
The amphiphilic PEG derivatives have to be located in the interface of the aqueous mediumand the oil-layer. This points towards interfacial catalysis. Under alkaline conditions and withrespect to the presence of oxygen radicals, it is very likely that nitrogen oxides are steadilypresent in the aqueous phase. Partially, they may gain a positive charge from dissolvedammonium cations in the water to form positively charged quaternary ammonia such as nitrocompounds (Fig. 9). Charge bearing hydrophobic molecules will accumulate and, at theinterface, attract OH- ions or OH∙ radicals. These aggressive oxygen components degradethe hydrophobic layer. As product molecules, PEG derivatives offer an energetically beneficial
Chemical Analysis of a BMiller-type^ Complex Prebiotic Broth. Part II 401
structure. In agreement with this idea, the relatively short hydrophobic tail is compatible withmarginal stability in the interface (Dose and Rauchfuss 1975).
In conclusion, in the Miller-Urey-type experiment a spontaneously forming oil/waterinterface offers the possibility of interfacial catalysis. The interface is likely to lead to theproduction of oxidized amphiphiles, among them PEG derivatives, through oxidizing andradical containing aqueous phase.
In future studies, CARS microspectroscopy could offer a powerful tool for the non-invasive, in-situ, chemical mapping (Volkmer 2010) of complex Miller-Urey-type samples.
Acknowledgements Financial support from the Saarland University and HSFP for conducting the research isgratefully acknowledged. A.V. acknowledges financial support by the European Commission’s 7th Frameworkprogram under grant agreement No. HEALTH-F5-2008-200820 (CARS EXPLORER), and is grateful to the 3.Physikalisches Institut and the Universität Stuttgart for infrastructural support
Open Access This article is distributed under the terms of the Creative Commons Attribution 4.0International License (http://creativecommons.org/licenses/by/4.0/), which permits unrestricted use, distri-bution, and reproduction in any medium, provided you give appropriate credit to the original author(s) and thesource, provide a link to the Creative Commons license, and indicate if changes were made.
References
Bada JL, Lazcano A (2003) Prebiotic soup-revisiting the Miller experiment. Science 300:745–746Bernard JM, Quirico E, Brissaud O, Montagnac G, Reynard B, McMillan P, Coll P, Nguyen MJ, Raulin F,
Schmitt B (2006) Reflectance spectra and chemical structure of Titan’s tholins: application to the analysis ofcassini–huygens observations. Icarus 185:301–307
Braun E (2015) The unforeseen challenge: from genotype-to-phenotype in cell populations. Rep Prog Phys 78:036602
Creber KAM, Ho TI, DepewMC, Weir D, Wan JKS (1982) Some physical and chemical aspects of spin trappingof organometallic radicals by quinones: optically active radical complexes. Can J Chem 60:1504–1511
Dickerson RE (1979) Chemische evolution und der ursprung des lebens. Spektr Wiss 9:99–115Dose K, Rauchfuss H (1975) Chemische evolution und der ursprung lebender systeme. Wissenschaftliche
Verlagsgesellschaft, StuttgartForman RA (1963) Nitrogen NMR chemical shifts in the Azide Ion. J Chem Phys 39:2393Fox SW (1995) Thermal synthesis of amino acids and the origin of life. GeochimCosmochimActa 59:1213–1214Gomes da Costa S (2010) Diploma thesis, 3. Institute of Physics, University of StuttgartGutierrez PL (2000) The metabolism of quinone-containing alkylating agents: free radical production and
Laboratory experiments of Titan tholin formed in cold plasma at various pressures: implications for nitrogen-containing polycyclic aromatic compounds in Titan haze. Icarus 168:344–366
Johnson AP, Cleaves HJ, Dworkin JP, Glavin DP, Lazcano A, Bada JL (2008) The Miller volcanic sparkdischarge experiment. Science 322:404
Kim YJ, Uyama H, Kobayashi S (2003) Regioselective synthesis of poly(phenylene) as a complex withpoly(ethylene glycol) by template polymerization of phenol in water. Macromolecules 36:5058–5060
Lazcano A, Bada JL (2003) The 1953 Stanley L. Miller experiment: fifty years of prebiotic organic chemistry.Origins Life Evol Biospheres 33:235–242
Lin-Vien D, Colthup NB, Fateley WG, Grasselli JG (1991) The handbook of infrared and raman characteristicfrequencies of organic molecules. Academic Press, San Diego
Loewenstein A (1982) NMR study of the Azide Ion. J Magn Reson 49:332–334Matthews CN, Minard RD (2006) Hydrogen cyanide polymers, comets and the origin of life. RSC Faraday
Discuss 133:393–401Matthews CN, Moser RE (1966) Prebiological protein synthesis. Proc Natl Acad Sci 56:1087–1094Matthews CN, Moser RE (1967) Peptide synthesis from hydrogen cyanide and water. Nature 215:1230–1234McCollom TM, Ritter G, Simoneit BR (1999) Lipid synthesis under hydrothermal conditions by Fischer-
Tropsch-type reactions. Origins Life Evol Biospheres 29:153–166
402 S. Scherer et al.
Miller SL (1953) A production of amino acids under possible primitive earth conditions. Science 117:528–529Miyakawa S, Yamanashi H, Kobayashi K, Cleaves HJ, Miller SL (2002) Prebiotic synthesis from CO atmo-
spheres: implications for the origins of life. Proc Natl Acad Sci 99:14628–14631Moss GP, Smith PAS, Tavernier D (1995) Glossary of class names of organic compounds and reactive
intermediates based on structure. IUPAC 67:1307–1375Nair U, Bartsch H, Nair J (2004) Alert for an epidemic of oral cancer due to use of the betel quid substitutes
gutkha and pan masala: a review of agents and causative mechanisms. Mutagenesis 19:251–262Oró J (1963) Synthesis of organic compounds by electric discharge. Nature 197:862–867Ruiz-Bermejo M, de la Fuente JL, Rogero C, Menor-Salván C, Osuna-Esteban S, Martín-Gago JA (2012) New
insights into the characterization of ‘insoluble black HCN polymers’. Chem Biodiversity 9:25–44Scalbert A, Johnson IT, Saltmarsh M (2005) Polyphenols: antioxidants and beyond. Am J Clin Nutr 81:215–217Schlesinger G, Miller SL (1983) Prebiotic synthesis in atmospheres containing CH4, CO, and CO2. J Mol Evol
19:376–382Totten GE, Clinton NA (1988) Poly(ethylene glycol) and derivatives as phase transfer catalysts and solvents for
organic reactions. J Macromol Sci-Part C 28:293–337Vartiainen EM (1992) Phase retrieval approach for coherent anti-Stokes Raman scattering spectrum analysis. J
Opt Soc Am B 9:1209–1214Völker T (1960) Polymere Blausäure. Angew Chem 11:379–384Volkmer A (2005) Vibrational imaging and microspectroscopies based on coherent anti-Stokes Raman scattering
microscopy. J Phys D Appl Phys 38:R59–R81Volkmer A (2010) Chapter 6: Coherent Raman scattering microscopy. In: Matousek P, Morris M (eds) Emerging
Biomedical and Pharmaceutical Applications of Raman Spectroscopy. Springer Verlag, BerlinWollrab E, Scherer S, Aubriet F, Carré V, Carlomagno T, Codutti L, Ott A (2015) Chemical analysis of a BMiller-
type^ complex prebiotic broth; part I: chemical diversity, oxygen and nitrogen based polymers. Orig LifeEvol Biosph 46:149–169
Chemical Analysis of a BMiller-type^ Complex Prebiotic Broth. Part II 403