Page 1
ORIGINAL PAPER
Chemical and Enzymatic Interesterification of a Blend of PalmStearin: Soybean Oil for Low trans-Margarine Formulation
Raquel Costales-Rodrıguez Æ Veronique Gibon ÆRoland Verhe Æ Wim De Greyt
Received: 20 October 2008 / Revised: 23 January 2009 / Accepted: 15 April 2009 / Published online: 30 May 2009
� AOCS 2009
Abstract A blend of palm stearin and soybean oil (70/30,
wt%) was modified by chemical interesterification (CIE)
and enzymatic interesterification (EIE), the latter batch-
wise (B-EIE) and in continuous (C-EIE). Better oil quality,
mainly in terms of acidity, free tocopherol and partial
acylglycerol content, was obtained after EIE. The clear
melting point after any interesterification process was
similar and about 9 �C lower as result of the modification
in the TAG profile, which approaches the calculated ran-
dom distribution. Interesterification changed the SFC pro-
file significantly. For the fully refined interesterified blends,
the SFC profile was similar and clearly different from the
starting blend. Interesterification decreased the content of
solids at temperatures[15 �C and increased the content of
solids at temperatures \15 �C. This increase was less
remarkable after C-EIE, suggesting that full randomization
was not achieved in the used conditions, probably caused
by a too short residence time of the oil in the enzymatic
bed. During B-EIE, variations in SFC with time, princi-
pally at low temperatures, were still observed although
the TAG composition was stable. At low temperatures,
the reaction rate calculated from SFC was very low,
confirming an important effect of the acyl migration on this
parameter.
Keywords Chemical interesterification � Batch-wise and
continuous packed bed enzymatic interesterification �‘‘Low trans’’ margarine formulation � Lipozyme� TL IM
Introduction
Interesterification as such or used in combination with dry
fractionation has received increasing interest lately as an
alternative to partial hydrogenation [1] for the production
of ‘‘low trans’’ hard fat suitable for shortenings, stick or
tub-type margarines and confectionary fat production [2].
In this context, palm stearin, a hard fraction obtained by
palm oil dry fractionation, is a suitable alternative. It is
added to improve tolerance to high temperatures, and for
crystal morphology and stability [3]. However, blending
with polyunsaturated soft oils (like sunflower, soybean or
rapeseed oils) remains necessary in order to impart plas-
ticity to the final interesterified product [4]. A wide range
of consumer table margarines and spreads, bakery marga-
rines and frying shortenings can be formulated by mixing
interesterified blends and native oils in adequate propor-
tions [5].
The solid fat content (SFC) profile is critical in the
evaluation of suitability for shortening or margarine for-
mulation: the values of SFC10 �C, SFC20 �C and SFC35 �C
are important as related to the rheological behavior of fats
at storage, packaging and utilization of bakery margarines,
respectively [5]. The SFC10 �C will determine the hardness
of the final product at refrigerator conditions. SFC10 �C and
SFC20 �C are important parameters for determining the
feasibility of the use of a blend in the production of bakery
R. Costales-Rodrıguez � V. Gibon (&) � W. De Greyt
Desmet Ballestra Group, R&D
Center, Hoogstraat 187, 1930 Zaventem, Belgium
e-mail: [email protected] ;
[email protected]
URL: http://www.desmetballestra.com
R. Verhe
Department of Organic Chemistry,
Faculty of Bioscience Engineering,
Ghent University, Coupure Links 653,
9000 Ghent, Belgium
123
J Am Oil Chem Soc (2009) 86:681–697
DOI 10.1007/s11746-009-1395-2
Page 2
margarines [6]. The SFC35 �C is particularly important in
margarine manufacture, since it is related to the extent
of melting in the mouth. In interesterified blends, this
parameter must be as low as possible to prevent a sandy
and coarse texture of the margarine [5].
Interesterification can be conducted chemically or
enzymatically. Chemical interesterification (CIE) is usually
random and produces complete positional randomization of
the acyl groups on the glycerol backbone [7]. Depending
from enzyme regioselectivity, enzymatic interesterification
(EIE) can be random or specific. Intermediate specificity
can also be obtained simply by adjusting the residence time
of the enzymatic process. Nevertheless, a full conversion
seems to be preferred: Zhang et al. [8] observed that
margarine storage stability increases with an increasing
conversion degree of the interesterified blend. Random
interesterification (CIE or EIE) is mainly used for the
production of commodity fats with the main purposes to
modify the overall melting properties, to increase com-
patibility within the solid phase (not achievable by simple
blending) and to enhance plasticity of the final product.
A regioselective enzyme is strictly required for specific
interesterification (EIE); in that case, acyl exchange is
limited to the sn-1,3 positions of the glycerol backbone.
Specific interesterification is mainly used in the production
of specialty fats (like cocoa butter equivalents, infant for-
mulation products, low calorie fats or easily absorbable
oils). Chemical interesterification is usually conducted
batch-wise, allowing the production of a large number of
(small) batches with a low degree of cross-contamination.
Technology has improved greatly over the last few dec-
ades: less catalyst consumption, less side reactions and less
oil losses can be guarantied. Enzymatic interesterification
is preferably conducted continuously by using immobilized
enzyme in a fixed bed configuration; this set-up is less
suitable in the case of many stock changes and is mainly
used for the production of larger batches of ‘‘bulk’’ oil.
However, enzymatic interesterification requires milder
reaction conditions compared to chemical interesterifica-
tion, leading to fewer side reactions, less post-treatment
and in consequence fewer oil losses.
EIE for the production of margarine fats is well
described in the literature. Studies have been carried out
on different blends (in % weight): palm stearin/coconut
oil and soybean oil/fully hydrogenated soybean oil, both
in different ratios [9], butterfat/rapeseed oil 70/30 [10],
palm stearin/palm kernel olein in different ratios [3, 11,
12], palm stearin/soybean oil 55/45 [6], palm stearin/
coconut oil 75/25 [7, 13] and 70/30 [8, 14, 15], palm
stearin/palm kernel oil/sunflower oil 55/25/20 [5], palm
stearin/sunflower oil 40/60 [4], high melting palm stearin
with different liquid oils (sunflower, soybean and rice
bran) 40/60 [16], palm stearin/mustard oil 70/30 [17], low
erucic rapeseed oil/tallow 60/40 [18], lard/high oleic
sunflower oil in different ratios [19]. Most of these studies
were done either batch-wise [3, 4, 9, 11, 12, 15, 16, 19],
or both batch-wise and continuously, the latter either in a
continuous packed bed reactor [5, 10] or in a continuous
fluidized-bed reactor [6]. Only few studies have been
carried out to compare the product quality after CIE and
EIE: Zhang et al. [7, 13] studied a blend of palm stearin
and coconut oil (75/25, wt%) in terms of TAG profile,
DAG content, residual acidity and SFC profile. Batch-EIE
was used to investigate parameters such as lipase load,
water content, temperature and reaction time, and to
examine the effect of these on product quality and reus-
ability of the enzyme. Two different enzymes were
investigated in terms of regioselectivity; final products
were compared with purely randomized blends from
chemical interesterification in terms of TAG compositions
and SFC profiles. Some years later, the same authors
[8, 14] investigated the storage stability of similar mar-
garines (based on interesterified palm stearin and coconut
oil (70/30, wt%), blended with sunflower oil in 50-50
ratio) produced by EIE and CIE. Physical and chemical
properties were monitored and compared. Margarine
produced from EIE fat had physical properties similar to
the margarine produced from the CIE fat in terms of
color, hardness, dropping point and crystal form. Sensory
panel evaluations did not show any clear difference
between the margarines However, the oxidative stability
of the enzymatically interesterified produced margarine
was better when stored at 25 �C; on the other hand, taste
and smell remained similar compared to chemically
interesterified produced margarine. Ledochowska and
Wilczyg9ska [18] compared oxidative stability of chemi-
cally and enzymatically interesterified fats based on a
blend of low erucic rapeseed oil and tallow (60/40, wt%).
Stability of the enzymatically interesterified product was
similar to the one of the native oil; in contrast, inferior
oxidative stability was observed for the chemically in-
teresterified product. All these studies clearly suggest that
EIE produced trans-free fats can meet industrial demands
for the production of margarine fats [8] and for this
reason can be used as alternatives to partially hydroge-
nated types [20].
In this paper, a blend of palm stearin and soybean oil
(70/30, wt.%) targeted for the production of hard stock used
in ‘‘low trans’’ stick margarine or puff pastry margarine
formulations was investigated. Solid fat content profile,
TAG distribution and corresponding calculated degree of
interesterification were used to monitor the conversion
during the batch-wise enzymatic reaction with Lipozyme�
TL IM. A continuous enzymatic process was implemented
under fixed bed conditions. A chemically interesterified
blend was chosen as reference for comparison of melting
682 J Am Oil Chem Soc (2009) 86:681–697
123
Page 3
properties (SFC profile, melting point) and product quality
(partial acylglycerol content, residual acidity, color and
tocopherol content) of the interesterified products, before
and after final deodorization.
Experimental Procedures
Materials
Refined, bleached, and deodorized palm stearin (PS) [clear
melting point (CMP) 55.5 �C, iodine value 34.8] was
obtained from Unimills, The Netherlands. RBD soybean oil
(SBO) was purchased in a local supermarket (O’Cool,
Belgium). Lipozyme� TL IM, a commercial, silica-gran-
ulated lipase from Thermomyces lanuginosa, which rear-
ranges the fatty acids with a certain sn-1,3 specificity, was
obtained from Novozymes A/S (Bagsvaerd, Denmark).
Sodium methoxide was provided by Degussa-Huls, Nie-
derkassel, Germany. All the chemicals and reagents used
for the analyses were of analytical grade.
Experimental Methods
Laboratory-Scale Batch Chemical Interesterification (CIE)
The fat blend (350 g) was dried while stirring under
vacuum for 60 min at 120 �C. After lowering the tem-
perature to 90 �C, 0.1% sodium methoxide (powder dis-
solved in oil) was added as the catalyst. Interesterification
was conducted under a vacuum at 90 �C for 30 min after
the appearance of the characteristic dark ‘brownish’ color.
After completion of the reaction, the vacuum was broken
and a 20% citric acid solution was added to inactivate the
catalyst, while the mixture was stirred for a further
15 min. Post-bleaching was performed with 0.75% of
activated bleaching earth (Tonsil 210 FF) under vacuum
for 30 min at 90 �C. Filtration was done over a preheated
Buchner filter.
Laboratory-Scale Batch Enzymatic Interesterification
(B-EIE)
Fresh Lipozyme� TL IM has an equilibrium water content
of approximately 5% (wt.%); to avoid by-products forma-
tion caused by hydrolysis of the fat, this content needs to
be reduced prior to carrying out the experiments. But
before water removal, the enzyme needs to be de-aerated.
De-aeration was performed by contacting the enzyme with
preheated liquid oil (70 �C) in a glass pear-shaped flask
(relative enzyme vs. oil quantity: 4% (wt.%)). The pear
was connected to the rotavapor and vacuum was applied to
the mixture, while agitating gently by swirling at 70 �C
until no air was released from the granules (approx.
20 min). The rotating rate was adjusted in order to guar-
antee a good suspension of the enzyme in the oil. The
agitation was stopped and the particles were allowed to
settle; the oil was removed by decanting.
Free water removal was carried out in a rotavapor at
70 �C. Three volumes of pre-heated liquid oil (600 g
each) were interesterified for 30 min at 70 �C to reduce
the water content of Lipozyme� TL IM (relative enzyme
vs. oil quantity: 4% (wt.%)), consuming this free water in
hydrolytic side reactions. After four oil pre-treatments,
most of the free water was removed. An enzymatic
rearrangement must contain a certain amount of water
because the reaction takes place at the water/oil boundary
phase and because the water is required for the mainte-
nance of an active hydrated state; however, too much
water will discourage the esterification and instead pro-
mote hydrolysis.
The Lipozyme� TL IM was quickly washed with the
blend to be studied in order to remove the liquid oil.
600 g of the blend was melted in an oven before use and
transferred into the reactor. When the oil blend reached
the set temperature (70 �C), the immobilized lipase was
added into the system at a dose of 4% of substrate to
start the reaction, and distributed evenly by an impeller
stirrer set at 200 rpm. Sampling was performed every
hour during a maximum period of 8 h; stirring was
stopped for 1 min before each sampling. The lipase was
allowed to fully settle to the bottom, where it remained
while products were withdrawn from the top of the
reactor and subsequently filtered over a Buchner filter
before analysis.
Laboratory-Scale Continuous Packed-Bed Enzymatic
Interesterification (C-EIE)
Prior to C-EIE, the immobilized enzyme was conditioned
by sending liquid oil through the columns, in order to
remove air and water (see above). FFA of the interesterified
liquid oil was followed and conditioning was stopped when
FFA was stable.
For the C-EIE reaction, a packed-bed reactor was used.
This reactor consists of two columns (length 20 cm; inner
diameter 2.5 cm) placed in series and each filled with
45 g immobilized enzyme, and submerged in a thermo-
stated water bath for temperature control. The blend was
pumped into the reactor at a specified flow rate of 300 g/h
which gives an oil flow rate/enzyme-ratio of 3.3 and a
residence time of 27 min through both columns. The
reaction temperature was 70 �C. The interesterified blend
was collected after 5 enzyme bed volumes, to avoid cross
contamination with the previous liquid oil used for
conditioning.
J Am Oil Chem Soc (2009) 86:681–697 683
123
Page 4
Batch Deodorization
CIE and EIE fats were deodorized at lab-scale under the
following conditions: 240 �C, 3 mbar, 1.5% sparge steam
and 60 min residence time.
Analytical Determinations
Fatty Acid Composition
Preparation of fatty acid methyl esters was done according
to the AOCS Official Method Ce 2-66 (alternate method
for fats and oils with acid value \2) [21]. GC determina-
tion was based on the AOCS Official Method Ce 1e-91
[21]. The FAME were separated on a 6890N gas chro-
matograph from Agilent Technologies, equipped with a
flame ionization detector and a BPX 70 capillary column
(60 m length 9 0.10 mm internal diameter) (Supelco,
Bellefonte, PN, USA). Initial column- temperature was set
at 60 �C and increased at a rate of 10 �C/min to 150 �C,
then further to 175 �C at 5 �C/min and held isothermally
for 45 min at 175 �C. Injector and detector were main-
tained at 250 �C. Helium was used as the carrier gas,
flowing at 0.3 mL/min. The flow rates of hydrogen and air
were, respectively, 30 and 400 mL/min. The injection
volume was 0.5 lL in hexane. Determination was carried
out in duplicate.
Color
Color was determined at 70 �C by means of an automatic
Lovibond PFX 880/P instrument mounted with a heater.
Solid Fat Content
The solid fat content (SFC) was analyzed using low field
pulsed Nuclear Magnetic Resonance (p-NMR) with a
Bruker Minispec mq 20 (Bruker, Germany), according to
the standard IUPAC method 2.150 [22]. Serial methods,
with and without tempering, were applied. Data were
reported as averages of two measurements.
Clear Melting Point
The clear melting point (CMP) was determined with a
Mettler FP 90 central processor and a Mettler FP81HT
capillary melting point unit, supplied by Mettler Toledo
and especially designed for it, connected to a recorder for
the registration of the melting curve. The procedure rec-
ommended by Mettler for edible oils and fats (heating
rate: 1 �C/min, starting temperature: at least 10–15 �C
below the expected melting point) was used. After
reaching the end temperature, the CMP resulted from the
interpolation on the recorded chart. Triplicate analyses
were performed.
Iodine Value
The iodine value (IV) was determined by the Wijs method
according to the AOCS Official recommended method Cd
1b-87 [21].
Free Tocopherol Content
The free tocopherol content was analyzed by HPLC
(Hewlett Packard 1050 Series Chromatograph equipped
with 4 modules (injector, Hewlett Packard 1100 Series
FLD-detector, online degasser and pump)), based on the
AOCS Official Method Ce 8-89 [21]. The column was an
Alltima Silica U 5 lm: 250 mm length 9 4.6 mm internal
diameter. A fluorescence detector was used and mobile
phase in the chromatographic system was hexane/isopro-
panol (9:1, v:v). The flow rate of the pump was set to be
constant at 1.5 mL/min. The injection volume was 20 lL.
The peaks in the experimental samples were identified by
comparison with elution times of standards. Determina-
tions were carried out in duplicate.
Free Fatty Acids Content
The free fatty acid (FFA) content of the oil samples was
determined according to the AOCS Official Method Ca
5a-40 [21]. An average molecular weight of 256 of the oil
blend was used for calculation. Data were reported as
averages of two measurements.
Partial Acylglycerol and Triacylglycerol Contents
Partial acylglycerol and triacylglycerol profiles were ana-
lyzed by reversed-phase HPLC (RP-HPLC), based on the
AOCS Official Method Ce 5b-89 [21]. Minor practical
adjustments to the flow rate and of the mobile phase
composition were made in order to improve acylglycerol
separation, in compliance with the above-mentioned offi-
cial method. All equipment—pump, column, auto-sampler
and detector—was supplied by Waters (Zellik, Belgium).
A 2-column Nova-Pak� C18 (4 lm, 3.9 9 150 mm) sys-
tem was used with acetonitrile-acetone (37.5:62.5, v:v) as
mobile phase at a flow rate of 1.2 mL/min. Samples were
dissolved in chloroform/methanol (5:5, v:v); a differential
refractometer was utilized for the detection. The chro-
matograms were processed using Empower Pro software,
with a generic Apex Track� method for integration.
The equivalent carbon number (ECN) was applied to
predict the elution order. ECN = CN-2(DB), where CN is
the total carbon number and DB is the total number of
684 J Am Oil Chem Soc (2009) 86:681–697
123
Page 5
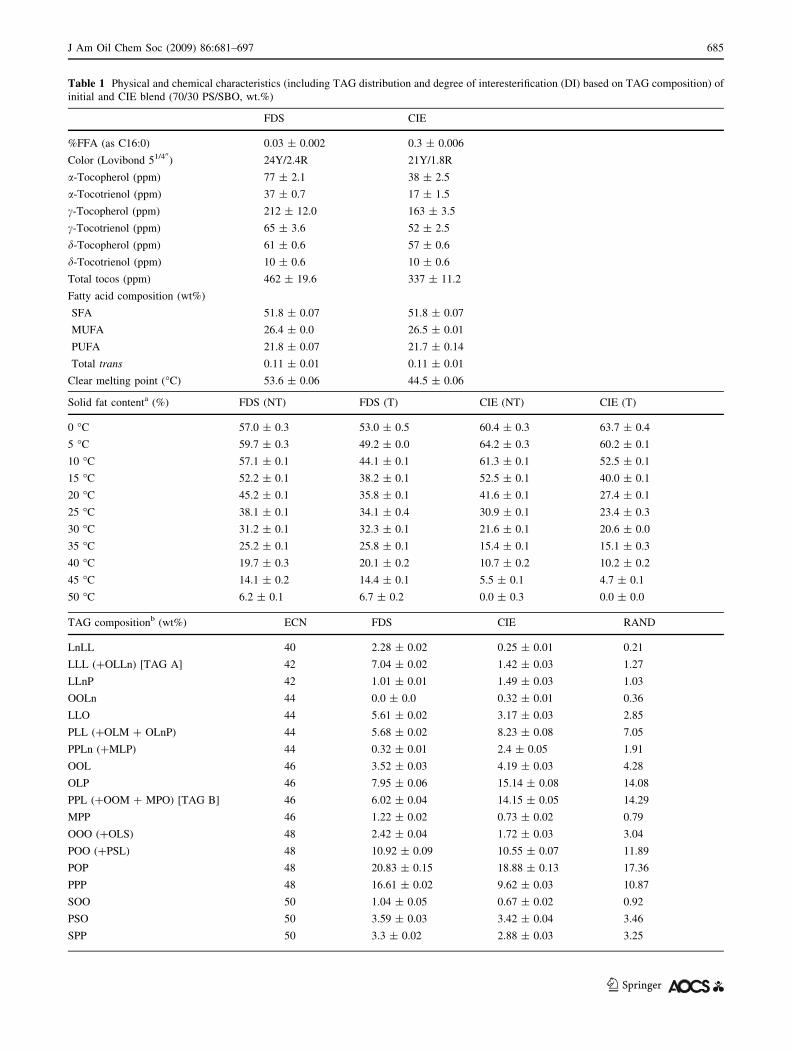
Table 1 Physical and chemical characteristics (including TAG distribution and degree of interesterification (DI) based on TAG composition) of
initial and CIE blend (70/30 PS/SBO, wt.%)
FDS CIE
%FFA (as C16:0) 0.03 ± 0.002 0.3 ± 0.006
Color (Lovibond 51/400) 24Y/2.4R 21Y/1.8R
a-Tocopherol (ppm) 77 ± 2.1 38 ± 2.5
a-Tocotrienol (ppm) 37 ± 0.7 17 ± 1.5
c-Tocopherol (ppm) 212 ± 12.0 163 ± 3.5
c-Tocotrienol (ppm) 65 ± 3.6 52 ± 2.5
d-Tocopherol (ppm) 61 ± 0.6 57 ± 0.6
d-Tocotrienol (ppm) 10 ± 0.6 10 ± 0.6
Total tocos (ppm) 462 ± 19.6 337 ± 11.2
Fatty acid composition (wt%)
SFA 51.8 ± 0.07 51.8 ± 0.07
MUFA 26.4 ± 0.0 26.5 ± 0.01
PUFA 21.8 ± 0.07 21.7 ± 0.14
Total trans 0.11 ± 0.01 0.11 ± 0.01
Clear melting point (�C) 53.6 ± 0.06 44.5 ± 0.06
Solid fat contenta (%) FDS (NT) FDS (T) CIE (NT) CIE (T)
0 �C 57.0 ± 0.3 53.0 ± 0.5 60.4 ± 0.3 63.7 ± 0.4
5 �C 59.7 ± 0.3 49.2 ± 0.0 64.2 ± 0.3 60.2 ± 0.1
10 �C 57.1 ± 0.1 44.1 ± 0.1 61.3 ± 0.1 52.5 ± 0.1
15 �C 52.2 ± 0.1 38.2 ± 0.1 52.5 ± 0.1 40.0 ± 0.1
20 �C 45.2 ± 0.1 35.8 ± 0.1 41.6 ± 0.1 27.4 ± 0.1
25 �C 38.1 ± 0.1 34.1 ± 0.4 30.9 ± 0.1 23.4 ± 0.3
30 �C 31.2 ± 0.1 32.3 ± 0.1 21.6 ± 0.1 20.6 ± 0.0
35 �C 25.2 ± 0.1 25.8 ± 0.1 15.4 ± 0.1 15.1 ± 0.3
40 �C 19.7 ± 0.3 20.1 ± 0.2 10.7 ± 0.2 10.2 ± 0.2
45 �C 14.1 ± 0.2 14.4 ± 0.1 5.5 ± 0.1 4.7 ± 0.1
50 �C 6.2 ± 0.1 6.7 ± 0.2 0.0 ± 0.3 0.0 ± 0.0
TAG compositionb (wt%) ECN FDS CIE RAND
LnLL 40 2.28 ± 0.02 0.25 ± 0.01 0.21
LLL (?OLLn) [TAG A] 42 7.04 ± 0.02 1.42 ± 0.03 1.27
LLnP 42 1.01 ± 0.01 1.49 ± 0.03 1.03
OOLn 44 0.0 ± 0.0 0.32 ± 0.01 0.36
LLO 44 5.61 ± 0.02 3.17 ± 0.03 2.85
PLL (?OLM ? OLnP) 44 5.68 ± 0.02 8.23 ± 0.08 7.05
PPLn (?MLP) 44 0.32 ± 0.01 2.4 ± 0.05 1.91
OOL 46 3.52 ± 0.03 4.19 ± 0.03 4.28
OLP 46 7.95 ± 0.06 15.14 ± 0.08 14.08
PPL (?OOM ? MPO) [TAG B] 46 6.02 ± 0.04 14.15 ± 0.05 14.29
MPP 46 1.22 ± 0.02 0.73 ± 0.02 0.79
OOO (?OLS) 48 2.42 ± 0.04 1.72 ± 0.03 3.04
POO (?PSL) 48 10.92 ± 0.09 10.55 ± 0.07 11.89
POP 48 20.83 ± 0.15 18.88 ± 0.13 17.36
PPP 48 16.61 ± 0.02 9.62 ± 0.03 10.87
SOO 50 1.04 ± 0.05 0.67 ± 0.02 0.92
PSO 50 3.59 ± 0.03 3.42 ± 0.04 3.46
SPP 50 3.3 ± 0.02 2.88 ± 0.03 3.25
J Am Oil Chem Soc (2009) 86:681–697 685
123
Page 6
double bonds on the fatty acids. Individual peaks were
identified by comparing the retention time with that of
references. The values are the means of 3 analyses,
reported with standard deviations.
Evaluation Methods of Interesterification Degree
Two methods were used to evaluate the degree of inter-
esterification (DI): the first based on the TAG composition
and the second on the SFC profile.
The method based on TAG composition consists in
comparing the theoretical random TAG composition with
the experimentally determined TAG compositions before
and after interesterification. Theoretical random TAG
composition was calculated based on FA composition
(mol%) of the fat blend by applying the law of probability
(assuming 100% randomization) (Desmet Ballestra Internal
Programme). DI was calculated as described in the
following Eq. 1:
DI (%) ¼ 100 � ½ðA=BÞFDS � ðA=BÞCIE or EIE��
½ðA=BÞFDS � ðA=BÞRAND�
where DI is the degree of interesterification, A is the TAG
or group of TAG that decreases the most during inter-
esterification, B is the TAG or group of TAG that increases
the most during interesterification, FDS is the feedstock,
Table 1 continued
TAG compositionb (wt%) ECN FDS CIE RAND
SOS (?PArO) 52 0.27 ± 0.01 0.24 ± 0.01 0.47
PPAr (?SSP) 52 0.37 ± 0.06 0.54 ± 0.08 0.61
SSS 21.5 ± 0.12 13.77 ± 0.16 15.52
SUS 31.03 ± 0.24 39.09 ± 0.28 37.49
SUU 26.6 ± 0.23 36.08 ± 0.28 34.97
UUU 20.87 ± 0.13 11.07 ± 0.14 12.01
Partial acylglycerols (%) 3.6 ± 0.05 5.1 ± 0.08 /
DI based on TAG composition (%) 0.0 98.9 100
FDS feedstock, CIE chemically interesterified blend, RAND theoretical random triacylglycerol composition, calculated from the fatty acid
composition, ECN equivalent carbon number, SSS tri-saturated triacylglycerols, SUS di-saturated triacylglycerols, SUU di-unsaturated triacyl-
glycerols, UUU tri-unsaturated triacylglycerols, [TAG A] TAG or group of TAG that decreases the most during interesterification, [TAG B] TAG
or group of TAG that increases the most during interesterification, M myristic acid, L linoleic acid, Ln linolenic acid, P palmitic acid, S stearic
acid, O oleic acid, Ar arachidic acida Determined by NMR according to IUPAC serial method 2.150: NT non tempered method and T tempered methodb Between brackets, TAG possibly formed during interesterification
Fig. 1 Solid fat content profiles (T tempered and NT non tempered
serial method) of PS/SBO blend (70/30, wt%) before and after
chemical interesterification (CIE). FDS feedstock
Table 2 Groups of TAGs (%) before and after CIE (%)
FDS CIE
Group 1
([10%)
PPP POP
POP PPP
POO POO
PPL
OLP
Group 2
(5–10%)
PPL PLL
OLP
PLL
LLO
LLL
Group 3
(\5%)
PSO, OOL, PPAr, LnLL,
OOO, SOO, MPP,
LLnP, PPLn, SOS,
SPP and OOLn.
PSO, OOL, PPAr, LnLL,
OOO, SOO, MPP,
LLnP, PPLn, SOS,
SPP, OOLn, LLL
and LLO
686 J Am Oil Chem Soc (2009) 86:681–697
123
Page 7
Ta
ble
3P
hy
sica
lan
dch
emic
alch
arac
teri
stic
s(i
ncl
ud
ing
TA
Gd
istr
ibu
tio
nan
dd
egre
eo
fin
tere
ster
ifica
tio
n(D
I)b
ased
on
TA
Gco
mp
osi
tio
n)
of
init
ial
and
B-E
IEb
len
ds
(70
/30
PS
/SB
O,
wt%
)
FD
SB
-EIE
1h
2h
3h
%F
FA
(as
C1
6:0
)0
.03
±0
.00
2/
//
Co
lor
(Lo
vib
on
d5
1/400)
24
Y/2
.4R
//
/
a-T
oco
ph
ero
l(p
pm
)7
7±
2.1
76
±0
.97
4±
1.3
73
±2
.0
a-T
oco
trie
no
l(p
pm
)3
7±
0.7
37
±3
.63
8±
4.2
38
±5
.5
c-T
oco
ph
ero
l(p
pm
)2
12
±1
2.0
21
2±
7.2
20
8±
7.8
19
9±
9.4
c-T
oco
trie
no
l(p
pm
)6
5±
3.6
62
±2
.76
1±
2.4
62
±2
.0
d-T
oco
ph
ero
l(p
pm
)6
1±
0.6
62
±0
.36
0±
2.2
58
±1
.2
d-T
oco
trie
no
l(p
pm
)1
0±
0.6
9±
0.2
9±
0.5
9±
0.5
To
tal
toco
s(p
pm
)4
62
±1
9.6
45
8±
14
.94
50
±1
8.4
43
9±
20
.6
Fat
tyac
idco
mp
osi
tio
n(w
t%)
SF
A5
1.8
±0
.07
//
/
MU
FA
26
.4±
0.0
PU
FA
21
.8±
0.0
7
To
tal
tra
ns
0.1
1±
0.0
1
Cle
arm
elti
ng
po
int
(�C
)5
3.6
±0
.06
50
.7±
0.0
74
4.8
±0
.04
4.4
±0
.07
So
lid
fat
con
ten
ta(%
)K
k(h
-1)
FD
S(N
T)
FD
S(T
)1
h(N
T)
1h
(T)
2h
(NT
)2
h(T
)3
h(N
T)
3h
(T)
0�C
0.2
15
7.0
±0
.35
3.0
±0
.55
5.0
±0
.35
1.8
±0
.25
3.9
±0
.15
5.7
±0
.35
3.8
±0
.35
9.0
±0
.1
5�C
0.2
45
9.7
±0
.34
9.2
±0
.05
9.7
±0
.14
8.0
±0
.15
9.5
±0
.35
2.0
±0
.16
0.0
±0
.35
5.4
±0
.2
10
�C0
.26
57
.1±
0.1
44
.1±
0.1
57
.8±
0.1
40
.6±
0.1
57
.9±
0.1
47
.0±
0.1
58
.5±
0.0
48
.5±
0.2
15
�C/
52
.2±
0.1
38
.2±
0.1
50
.4±
0.1
33
.9±
0.1
49
.1±
0.1
39
.3±
0.2
50
.0±
0.0
40
.4±
0.0
20
�C/
45
.2±
0.1
35
.8±
0.1
42
.1±
0.5
28
.8±
0.2
39
.7±
0.3
29
.3±
0.1
40
.8±
0.0
30
.2±
0.1
25
�C1
.60
38
.1±
0.1
34
.1±
0.4
32
.4±
0.1
26
.7±
0.3
30
.1±
0.1
26
.0±
0.3
30
.6±
0.3
25
.4±
0.2
30
�C1
.19
31
.2±
0.1
32
.3±
0.1
24
.6±
0.2
25
.0±
0.1
22
.0±
0.1
23
.1±
0.2
22
.4±
0.2
22
.3±
0.2
35
�C0
.98
25
.2±
0.1
25
.8±
0.1
18
.7±
0.0
19
.2±
0.2
16
.4±
0.1
16
.4±
0.3
15
.2±
0.2
19
.1±
0.3
40
�C1
.37
19
.7±
0.3
20
.1±
0.2
13
.6±
0.1
12
.8±
0.1
10
.4±
0.2
11
.1±
0.1
10
.5±
0.4
10
.4±
0.1
45
�C1
.24
14
.1±
0.2
14
.4±
0.1
8.6
±0
.17
.7±
0.1
6.1
±0
.36
.2±
0.1
5.7
±0
.35
.6±
0.1
50
�C/
6.2
±0
.16
.7±
0.2
0.0
±0
.01
.4±
0.2
0.0
±0
.00
.1±
0.1
0.0
±0
.00
.5±
0.1
TA
Gco
mp
osi
tio
nb
(wt%
)F
DS
B-E
IE
1h
2h
3h
Ln
LL
2.2
8±
0.0
21
.15
±0
.02
0.6
3±
0.0
10
.43
±0
.02
LL
L(?
OL
Ln
)[T
AG
A]
7.0
4±
0.0
23
.89
±0
.01
2.5
±0
.01
1.8
9±
0.0
1
LL
nP
1.0
1±
0.0
11
.44
±0
.02
1.5
3±
0.0
11
.59
±0
.01
OO
Ln
0.0
±0
.00
.13
±0
.01
0.2
2±
0.0
10
.26
±0
.01
LL
O5
.61
±0
.02
4.2
±0
.02
3.6
±0
.01
3.2
9±
0.0
1
J Am Oil Chem Soc (2009) 86:681–697 687
123
Page 8
Ta
ble
3co
nti
nu
ed
TA
Gco
mp
osi
tio
nb
(wt%
)F
DS
B-E
IE
1h
2h
3h
PL
L(?
OL
M?
OL
nP
)5
.68
±0
.02
7.4
9±
0.0
28
.25
±0
.01
8.3
7±
0.0
1
PP
Ln
(?M
LP
)0
.32
±0
.01
1.3
2±
0.0
11
.96
±0
.01
2.1
4±
0.0
1
OO
L3
.52
±0
.03
3.6
9±
0.0
23
.96
±0
.01
3.8
8±
0.0
1
OL
P7
.95
±0
.06
11
.89
±0
.04
13
.9±
0.0
51
4.7
5±
0.0
2
PP
L(?
OO
M?
MP
O)
[TA
GB
]6
.02
±0
.04
10
.47
±0
.05
12
.65
±0
.08
13
.84
±0
.06
MP
P1
.22
±0
.02
0.8
8±
0.0
30
.8±
0.0
10
.61
±0
.01
OO
O(?
OL
S)
2.4
2±
0.0
41
.89
±0
.02
1.7
6±
0.0
11
.56
±0
.02
PO
O(?
PS
L)
10
.92
±0
.09
10
.9±
0.0
81
0.7
4±
0.0
81
0.5
3±
0.0
6
PO
P2
0.8
3±
0.1
52
0.2
6±
0.1
31
9.6
4±
0.1
19
.62
±0
.13
PP
P1
6.6
1±
0.0
21
2.3
7±
0.0
91
0.2
9±
0.0
79
.72
±0
.09
SO
O1
.04
±0
.05
0.8
3±
0.0
20
.71
±0
.01
0.6
5±
0.0
1
PS
O3
.59
±0
.03
3.6
7±
0.0
23
.55
±0
.04
3.6
2±
0.0
4
SP
P3
.3±
0.0
22
.88
±0
.02
2.6
6±
0.0
22
.68
±0
.02
SO
S(?
PA
rO)
0.2
7±
0.0
10
.26
±0
.02
0.2
5±
0.0
10
.26
±0
.01
PP
Ar
(?S
SP
)0
.37
±0
.06
0.3
9±
0.0
10
.39
±0
.11
0.3
1±
0.1
SS
S2
1.5
±0
.12
16
.52
±0
.15
14
.14
±0
.21
13
.32
±0
.22
SU
S3
1.0
3±
0.2
43
5.9
8±
0.2
33
8.0
5±
0.2
43
9.4
8±
0.2
5
SU
U2
6.6
±0
.23
32
.55
±0
.18
35
.13
±0
.16
35
.89
±0
.11
UU
U2
0.8
7±
0.1
31
4.9
5±
0.1
12
.67
±0
.06
11
.31
±0
.08
Par
tial
acy
lgly
cero
ls(%
)3
.6±
0.0
54
.5±
0.0
54
.0±
0.0
84
.6±
0.0
6
DI
bas
edo
nT
AG
com
po
siti
on
(%)
0.0
73
.88
9.9
95
.6
B-E
IE
4h
5h
6h
7h
8h
%F
FA
(as
C1
6:0
)/
//
//
Co
lor
(Lo
vib
on
d5
1/400)
//
//
29
Y/2
.7R
a-T
oco
ph
ero
l(p
pm
)7
3±
1.8
71
±0
.77
1±
1.0
71
±1
.27
2±
2.5
a-T
oco
trie
no
l(p
pm
)3
7±
4.8
37
±4
.63
7±
5.6
36
±4
.63
7±
5.7
c-T
oco
ph
ero
l(p
pm
)2
03
±8
.21
99
±7
.91
98
±9
.31
97
±8
.22
00
±7
.8
c-T
oco
trie
no
l(p
pm
)6
2±
2.7
62
±2
.66
0±
3.4
60
±2
.46
0±
3.6
d-T
oco
ph
ero
l(p
pm
)5
8±
0.8
57
±3
.95
5±
3.4
55
±1
.85
5±
2.5
d-T
oco
trie
no
l(p
pm
)9
±0
.39
±0
.49
±0
.58
±0
.88
±2
.1
To
tal
toco
ls(p
pm
)4
42
±1
8.6
43
5±
20
.14
30
±2
3.2
42
7±
19
.04
32
±2
4.2
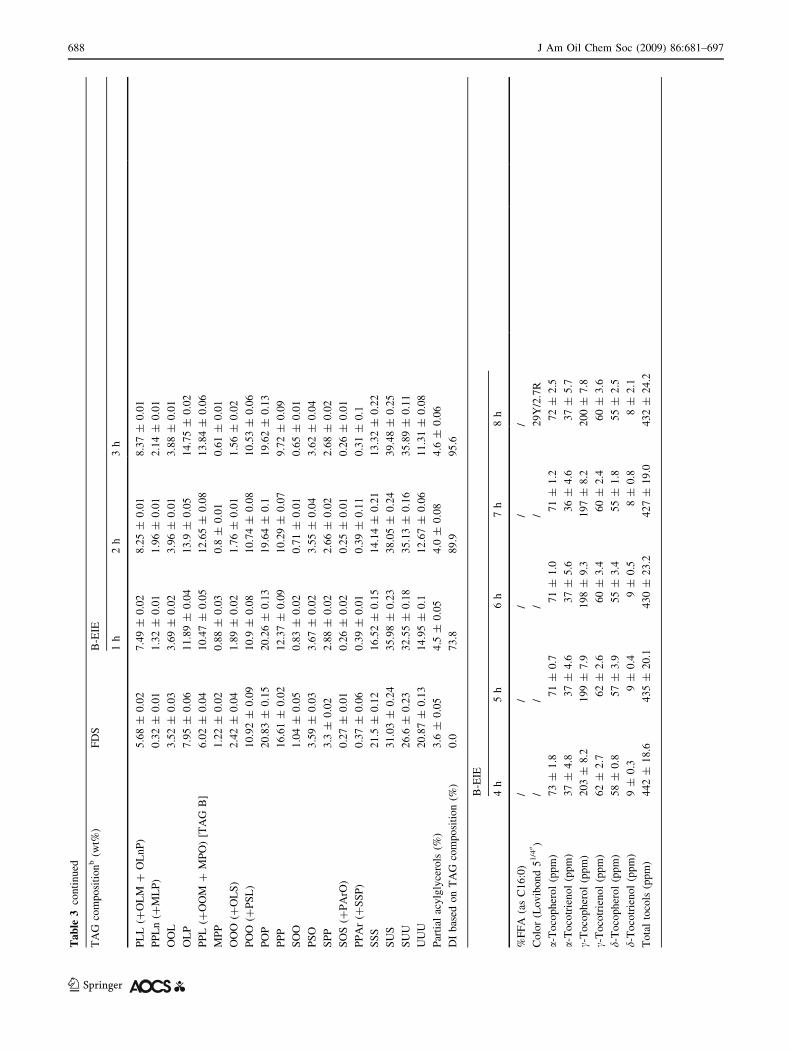
688 J Am Oil Chem Soc (2009) 86:681–697
123
Page 9
Ta
ble
3co
nti
nu
ed
B-E
IE
4h
5h
6h
7h
8h
Fat
tyac
idco
mp
osi
tio
n(w
t%)
SF
A/
//
/5
1.5
±0
.14
MU
FA
26
.4±
0.0
1
PU
FA
22
.0±
0.0
7
To
tal
tra
ns
0.1
1±
0.0
Cle
arm
elti
ng
po
int
(�C
)4
4.2
±0
.07
44
.2±
0.0
74
4.2
±0
.04
4.1
±0
.04
4.4
±0
.07
So
lid
fat
con
ten
ta(%
)K
k(h
-1)
4h
(NT
)4
h(T
)5
h(N
T)
5h
(T)
6h
(NT
)6
h(T
)7
h(N
T)
7h
(T)
8h
(NT
)8
h(T
)
0�C
0.2
15
5.2
±0
.26
0.3
±0
.35
6.7
±0
.26
1.2
±0
.55
6.0
±0
.36
2.1
±0
.35
7.4
±0
.46
1.7
±0
.35
7.8
±0
.26
2.5
±0
.1
5�C
0.2
46
1.5
±0
.25
6.5
±0
.16
2.9
±0
.25
8.4
±0
.16
2.4
±0
.55
8.4
±0
.16
2.9
±0
.45
9.0
±0
.16
3.2
±0
.25
7.9
±0
.1
10
�C0
.26
59
.5±
0.2
50
.0±
0.1
60
.6±
0.1
51
.4±
0.1
60
.7±
0.1
51
.2±
0.1
60
.9±
0.1
51
.7±
0.1
60
.8±
0.1
50
.9±
0.1
15
�C/
51
.2±
0.1
40
.2±
0.0
51
.8±
0.1
41
.5±
0.1
51
.5±
0.2
40
.2±
0.0
52
.1±
0.2
40
.7±
0.0
52
.4±
0.1
39
.2±
0.0
20
�C/
42
.0±
0.0
28
.7±
0.1
42
.8±
0.2
30
.7±
0.2
41
.4±
0.0
29
.8±
0.1
42
.0±
0.1
29
.7±
0.1
42
.8±
0.1
27
.9±
0.1
25
�C1
.60
31
.7±
0.0
24
.6±
0.4
32
.4±
0.1
25
.7±
0.3
31
.0±
0.1
25
.1±
0.1
31
.7±
0.1
25
.6±
0.3
32
.1±
0.1
24
.0±
0.0
30
�C1
.19
22
.5±
0.1
21
.3±
0.1
23
.1±
0.1
22
.5±
0.1
22
.0±
0.1
22
.0±
0.2
22
.4±
0.2
22
.2±
0.2
22
.7±
0.0
21
.6±
0.3
35
�C0
.98
15
.4±
0.1
15
.1±
0.1
15
.4±
0.2
15
.5±
0.2
15
.3±
0.0
15
.9±
0.3
15
.2±
0.1
15
.5±
0.2
15
.9±
0.1
15
.5±
0.4
40
�C1
.37
10
.7±
0.5
10
.1±
0.1
9.9
±0
.31
0.2
±0
.21
0.5
±0
.51
0.3
±0
.21
0.4
±0
.19
.9±
0.1
10
.3±
0.1
10
.6±
0.1
45
�C1
.24
5.3
±0
.04
.7±
0.2
5.1
±0
.15
.1±
0.1
5.1
±0
.45
.3±
0.2
5.1
±0
.25
.4±
0.3
5.4
±0
.05
.1±
0.2
50
�C/
0.0
±0
.00
.0±
0.1
0.0
±0
.40
.0±
0.0
0.0
±0
.20
.0±
0.1
0.0
±0
.30
.1±
0.1
0.0
±0
.10
.3±
0.0
TA
Gco
mp
osi
tio
nb
(wt%
)B
-EIE
4h
5h
6h
7h
8h
RA
ND
Ln
LL
0.3
3±
0.0
20
.29
±0
.01
0.2
7±
0.0
20
.29
±0
.02
0.2
6±
0.0
20
.21
LL
L(?
OL
Ln
)[T
AG
A]
1.6
±0
.02
1.4
9±
0.0
11
.51
±0
.02
1.4
7±
0.0
21
.5±
0.0
21
.27
LL
nP
1.5
6±
0.0
51
.59
±0
.03
1.5
4±
0.0
21
.5±
0.0
31
.53
±0
.02
1.0
3
OO
Ln
0.2
8±
0.0
20
.32
±0
.02
0.3
1±
0.0
10
.29
±0
.02
0.2
9±
0.0
20
.36
LL
O3
.16
±0
.01
3.1
8±
0.0
23
.19
±0
.02
3.1
7±
0.0
13
.22
±0
.01
2.8
5
PL
L(?
OL
M?
OL
nP
)8
.38
±0
.05
8.4
5±
0.0
38
.33
±0
.02
8.2
2±
0.0
38
.35
±0
.02
7.0
5
PP
Ln
(?M
LP
)2
.2±
0.0
22
.4±
0.0
42
.41
±0
.01
2.4
7±
0.0
12
.4±
0.0
11
.91
OO
L4
.02
±0
.01
4.1
8±
0.0
24
.2±
0.0
24
.27
±0
.02
4.2
8±
0.0
24
.28
OL
P1
5.0
5±
0.1
15
.23
±0
.09
15
.16
±0
.08
15
.1±
0.0
61
5.4
2±
0.0
41
4.0
8
PP
L(?
OO
M?
MP
O)
[TA
GB
]1
4.2
4±
0.0
81
4.2
7±
0.0
81
4.3
3±
0.0
71
4.3
1±
0.0
91
4.2
9±
0.0
81
4.2
9
MP
P0
.66
±0
.01
0.7
4±
0.0
10
.66
±0
.01
0.7
7±
0.0
10
.69
±0
.01
0.7
9
OO
O(?
OL
S)
1.6
±0
.04
1.7
2±
0.0
31
.6±
0.0
81
.73
±0
.02
1.6
6±
0.0
23
.04
PO
O(?
PS
L)
10
.52
±0
.14
10
.58
±0
.13
10
.39
±0
.09
10
.48
±0
.12
10
.53
±0
.09
11
.89
PO
P1
9.3
2±
0.1
11
8.9
9±
0.1
31
9.0
6±
0.1
18
.97
±0
.13
18
.76
±0
.24
17
.36
PP
P9
.55
±0
.01
9.2
9±
0.0
19
.46
±0
.01
9.5
2±
0.0
19
.37
±0
.01
10
.87
J Am Oil Chem Soc (2009) 86:681–697 689
123
Page 10
CIE is the chemically interesterified blend, EIE is the
enzymatically interesterified blend, and RAND is the the-
oretical random TAG composition.
During B-EIE, the degree of interesterification was also
calculated with regards to % SFC at different temperatures
[23] as defined by Eq. 2:
DIð%Þ ¼ 100 � ½ðSFC0 � SFCÞ=¼ ðSFC0 � SFC1Þ� ð2Þ
where DI is the conversion degree, SFC0 is the SFC at
time 0 (in the FDS), SFC is the SFC at batch reaction
time t and SFC? is the SFC at the equilibrium stage
(after CIE).
Reaction rate k was derived from both approaches (TAG
and SFC) following Eq. 3:
DIð%Þ ¼ 100 � ð1� e�ktÞ ð3Þ
Results and Discussion
Chemical Interesterification (CIE)
A blend of palm stearin and soybean oil (70/30, wt.%) was
chemically interesterified according to what is described in
‘‘Experimental Procedures’’.
The initial blend and the chemically interesterified
product were analyzed and compared for fatty acid com-
position, triacylglycerol distribution, clear melting point,
solid fat content profile (tempered and non tempered
methods), acidity, diacylglycerol content, free tocopherols
and color (Table 1).
Fatty acid composition of the initial blend was about
52% saturated, 26% mono-unsaturated and 22% poly-
unsaturated; the composition was not affected by the
interesterification process neither the trans content which
remained around 0.1%.
TAGs of the blend were classified into three main
groups (Table 2). The main TAG components (POP, PPP
and POO) were arbitrarily put in group 1 ([10% wt.%);
group 2 (5–10% wt%) was made of OLP, LLL, PPL, PLL
and LLO and group 3 ([5% wt.%) of PSO, OOL, PPAr,
LnLL, OOO, SOO, MPP, LLnP, PPLn, SOS, SPP and
OOLn.
Within group 1, POO was practically untouched after
CIE while PPP was seriously decreased; POP was only
decreased by less than 10%. POP, PPP and POO still
belonged to the same group after CIE.
In group 2, PPL, OLP and PLL were increased while
LLL and LLO were decreased. PPL and OLP went up as
part of group 1 while LLL and LLO went down to group
3; PLL stayed in group 2. All the TAG components
classified in group 3 stayed in this group after CIE. PPL
[TAG B] (that was moving up to group 1) and LLL [TAG
A] (that was moving down to group 3) were observed toTa
ble
3co
nti
nu
ed
TA
Gco
mp
osi
tio
nb
(wt%
)B
-EIE
4h
5h
6h
7h
8h
RA
ND
SO
O0
.66
±0
.04
0.6
7±
0.0
20
.67
±0
.03
0.6
8±
0.0
20
.72
±0
.01
0.9
2
PS
O3
.53
±0
.03
3.4
±0
.04
3.5
3±
0.0
43
.45
±0
.04
3.4
7±
0.0
83
.46
SP
P2
.63
±0
.01
2.5
9±
0.0
12
.74
±0
.01
2.6
5±
0.0
12
.64
±0
.01
3.2
5
SO
S(?
PA
rO)
0.3
1±
0.0
0.2
4±
0.0
10
.28
±0
.02
0.2
3±
0.0
10
.27
±0
.01
0.4
7
PP
Ar
(?S
SP
)0
.35
±0
.10
.39
±0
.09
0.3
3±
0.0
80
.41
±0
.04
0.3
3±
0.0
20
.61
SS
S1
3.1
9±
0.1
31
3.0
1±
0.1
21
3.1
9±
0.1
11
3.3
5±
0.0
71
3.0
3±
0.0
51
5.5
2
SU
S3
9.6
6±
0.2
43
9.3
±0
.33
9.6
1±
0.2
43
9.4
3±
0.2
83
9.1
9±
0.4
23
7.4
9
SU
U3
6.1
7±
0.2
93
6.5
2±
0.3
36
.09
±0
.24
35
.98
±0
.26
36
.55
±0
.18
34
.97
UU
U1
0.9
9±
0.1
31
1.1
8±
0.1
11
1.0
8±
0.1
71
1.2
2±
0.1
11
1.2
1±
0.1
11
2.0
1
Par
tial
acy
lgly
cero
ls(%
)4
.8±
0.0
74
.0±
0.0
45
.0±
0.0
74
.7±
0.0
64
.3±
0.0
4/
DI
bas
edo
nT
AG
com
po
siti
on
(%)
97
.89
8.6
98
.59
8.7
98
.51
00
FD
Sfe
edst
ock
,R
AN
Dth
eore
tica
lra
nd
om
tria
cylg
lyce
rol
com
po
siti
on
,ca
lcu
late
dfr
om
the
fatt
yac
idco
mp
osi
tio
n,
[TA
GA
]T
AG
or
gro
up
of
TA
Gth
atd
ecre
ases
the
mo
std
uri
ng
inte
rest
erifi
cati
on
,[T
AG
B]
TA
Go
rg
rou
po
fT
AG
that
incr
ease
sth
em
ost
du
rin
gin
tere
ster
ifica
tio
n,
SS
Str
i-sa
tura
ted
tria
cylg
lyce
rols
,S
US
di-
satu
rate
dtr
iacy
lgly
cero
ls,
SU
Ud
i-u
nsa
tura
ted
tria
cylg
lyce
rols
,U
UU
tri-
un
satu
rate
dtr
iacy
lgly
cero
ls,
B-E
IEb
atch
enzy
mat
ical
lyin
tere
ster
ified
ble
nd
,k
reac
tio
nra
teb
ased
on
%S
FC
atd
iffe
ren
tte
mp
erat
ure
s
690 J Am Oil Chem Soc (2009) 86:681–697
123
Page 11
be the most varying TAG components during the chem-
ical interesterification process. They were followed and
compared with the theoretical composition (RAND, sup-
posed to be fully randomized) by using the composition
of the initial blend (FDS) as reference in order to calcu-
late the degree of interesterification (DI). The oil was
assumed to be fully randomized with a DI close to 100%
(98.9%). The main result of modification of TAG profile
consecutive to CIE was a decrease in the clear melting
point of the final product of about 9 �C (from 53.6 to
44.5 �C).
The solid fat content profile (non-tempered method) of
the interesterified product was higher than the one of the
initial blend but only below 15 �C; at higher temperatures,
the interesterified product was softer (3–4% in SFC). The
same behavior was observed by using the tempered
method but to a larger extent (8–11% in SFC) (Fig. 1).
Similar results were observed in other studies [13, 24].
According to Zhang et al. [13], in a blend of palm stearin/
coconut oil, SFC was effectively decreased within the
temperature range of 35–40 �C and increased at tempera-
tures lower than 30 �C. Ahmadi et al. [24] indicated that
the SFC of CIE blends was higher compared to the non
interesterified samples at low temperatures (0–40 �C) and
lower at high temperatures (20–70 �C), in blends of high-
oleic sunflower and fully hydrogenated canola oils. Other
studies reported a decrease in SFC upon interesterification
[1, 5, 18, 20].
The acidity (expressed in C16:0) of the CIE product
went up to 0.3% and the observed partial acylglycerol
content was significantly increased. No soaps were
detected.
The free tocopherol content of the chemically inter-
esterified oil was highly affected as the result of esteri-
fication of the hydroxyl group; it is interesting to note
that mainly alpha and gamma tocopherols and tocotrie-
nols seem to be esterified while delta components are
protected. Decrease of alpha (the most biologically
active) and gamma (the most antioxidant) tocopherols
and tocotrienols at the benefit of esterified analogues are
both detrimental for the oxidative stability of the final
product.
The color of the chemically interesterified oil was
slightly decreased as the result of the bleaching.
Batch Enzymatic Interesterification (B-EIE)
Sampling was carried out every hour and the main quality
parameters (triacylglycerol distribution, fatty acid compo-
sition, clear melting point, solid fat content profile, acidity,
partial acylglycerol content, free tocopherols and color)
were evaluated and compared with the initial blend
(Table 3).
Variation of TAG distribution (EIE) was followed and
compared with the theoretical composition (RAND, sup-
posed to be fully randomized) by using the composition of
the initial blend (FDS) as reference. PPL [TAG B] that was
increasing the most during the CIE (see above) and LLL
[TAG A] that was decreasing the most during CIE (see
above) were taken into consideration to calculate the
degree of interesterification (DI) with respect of time. This
DI was increasing substantially during the first 4 h and
reached equilibrium at around 100% during the next 4 h. In
this final period, the degree of interesterification (and hence
the TAG distribution) became very close to the value cal-
culated for CIE meaning that a complete random redistri-
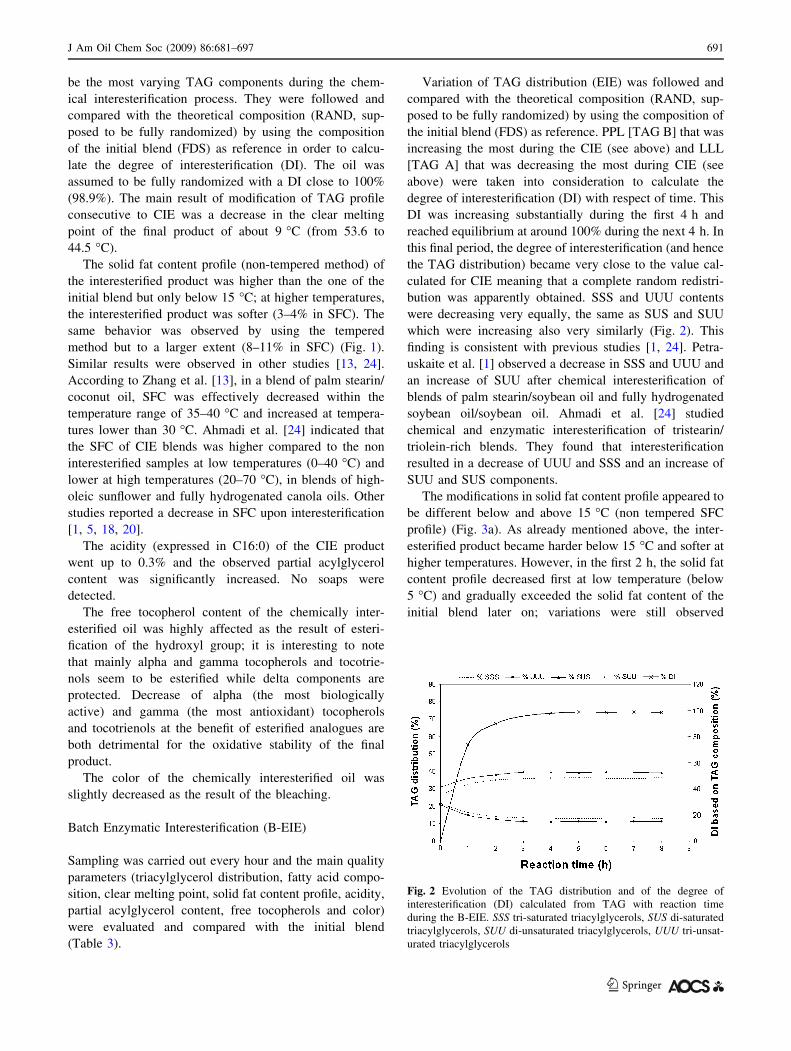
bution was apparently obtained. SSS and UUU contents
were decreasing very equally, the same as SUS and SUU
which were increasing also very similarly (Fig. 2). This
finding is consistent with previous studies [1, 24]. Petra-
uskaite et al. [1] observed a decrease in SSS and UUU and
an increase of SUU after chemical interesterification of
blends of palm stearin/soybean oil and fully hydrogenated
soybean oil/soybean oil. Ahmadi et al. [24] studied
chemical and enzymatic interesterification of tristearin/
triolein-rich blends. They found that interesterification
resulted in a decrease of UUU and SSS and an increase of
SUU and SUS components.
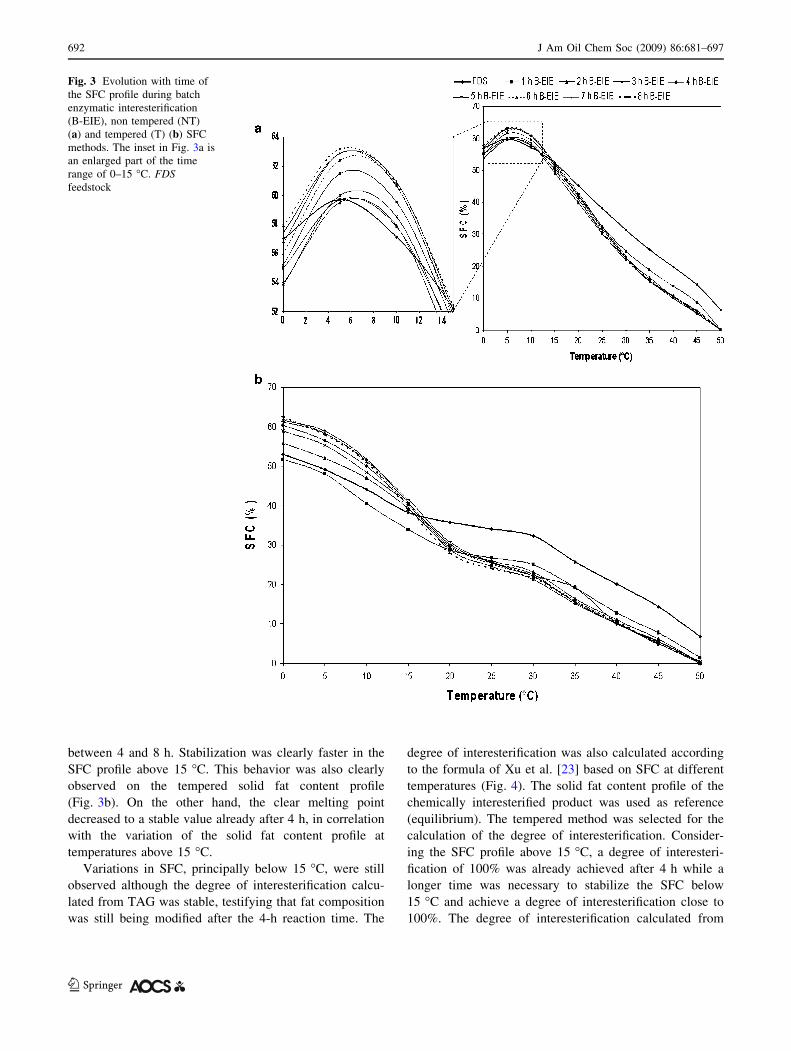
The modifications in solid fat content profile appeared to
be different below and above 15 �C (non tempered SFC
profile) (Fig. 3a). As already mentioned above, the inter-
esterified product became harder below 15 �C and softer at
higher temperatures. However, in the first 2 h, the solid fat
content profile decreased first at low temperature (below
5 �C) and gradually exceeded the solid fat content of the
initial blend later on; variations were still observed
Fig. 2 Evolution of the TAG distribution and of the degree of
interesterification (DI) calculated from TAG with reaction time
during the B-EIE. SSS tri-saturated triacylglycerols, SUS di-saturated
triacylglycerols, SUU di-unsaturated triacylglycerols, UUU tri-unsat-
urated triacylglycerols
J Am Oil Chem Soc (2009) 86:681–697 691
123
Page 12
between 4 and 8 h. Stabilization was clearly faster in the
SFC profile above 15 �C. This behavior was also clearly
observed on the tempered solid fat content profile
(Fig. 3b). On the other hand, the clear melting point
decreased to a stable value already after 4 h, in correlation
with the variation of the solid fat content profile at
temperatures above 15 �C.
Variations in SFC, principally below 15 �C, were still
observed although the degree of interesterification calcu-
lated from TAG was stable, testifying that fat composition
was still being modified after the 4-h reaction time. The
degree of interesterification was also calculated according
to the formula of Xu et al. [23] based on SFC at different
temperatures (Fig. 4). The solid fat content profile of the
chemically interesterified product was used as reference
(equilibrium). The tempered method was selected for the
calculation of the degree of interesterification. Consider-
ing the SFC profile above 15 �C, a degree of interesteri-
fication of 100% was already achieved after 4 h while a
longer time was necessary to stabilize the SFC below
15 �C and achieve a degree of interesterification close to
100%. The degree of interesterification calculated from
Fig. 3 Evolution with time of
the SFC profile during batch
enzymatic interesterification
(B-EIE), non tempered (NT)
(a) and tempered (T) (b) SFC
methods. The inset in Fig. 3a is
an enlarged part of the time
range of 0–15 �C. FDSfeedstock
692 J Am Oil Chem Soc (2009) 86:681–697
123
Page 13
Table 4 Physical and chemical characteristics (including TAG distribution and degree of interesterification (DI) based on TAG composition) of
initial and C-EIE blend (70/30 PS/SBO, wt%)
FDS C-EIE
%FFA (as C16:0) 0.03 ± 0.002 0.2 ± 0.005
Color (Lovibond 51/400) 24Y/2.4R 26Y/2.5R
a-Tocopherol (ppm) 77 ± 2.1 78 ± 0.9
a-Tocotrienol (ppm) 37 ± 0.7 37 ± 0.3
c-Tocopherol (ppm) 212 ± 12.0 210 ± 3.6
c-Tocotrienol (ppm) 65 ± 3.6 61 ± 4.4
d-Tocopherol (ppm) 61 ± 0.6 59 ± 2.7
d-Tocotrienol (ppm) 10 ± 0.6 9 ± 4.4
Total tocos (ppm) 462 ± 19.6 454 ± 16.3
Fatty acid composition (wt%)
SFA 51.8 ± 0.07 50.7 ± 0.14
MUFA 26.4 ± 0.0 26.5 ± 0.01
PUFA 21.8 ± 0.07 22.6 ± 0.07
Total trans 0.11 ± 0.01 0.10 ± 0.0
Clear melting point (�C) 53.6 ± 0.06 44.3 ± 0.07
Solid fat contenta (%) FDS (NT) FDS (T) C-EIE (NT) C-EIE (T)
0 �C 57.0 ± 0.3 53.0 ± 0.5 52.9 ± 0.3 61.8 ± 0.1
5 �C 59.7 ± 0.3 49.2 ± 0.0 60.6 ± 0.3 58.1 ± 0.1
10 �C 57.1 ± 0.1 44.1 ± 0.1 58.7 ± 0.1 50.9 ± 0.0
15 �C 52.2 ± 0.1 38.2 ± 0.1 50.9 ± 0.2 41.4 ± 0.0
20 �C 45.2 ± 0.1 35.8 ± 0.1 41.8 ± 0.1 29.7 ± 0.1
25 �C 38.1 ± 0.1 34.1 ± 0.4 31.8 ± 0.1 23.8 ± 0.3
30 �C 31.2 ± 0.1 32.3 ± 0.1 22.6 ± 0.1 21.0 ± 0.1
35 �C 25.2 ± 0.1 25.8 ± 0.1 15.0 ± 0.1 15.5 ± 0.1
40 �C 19.7 ± 0.3 20.1 ± 0.2 10.6 ± 0.1 10.3 ± 0.1
Fig. 4 Evolution of the degree
of interesterification (DI) with
time during B-EIE based on
TAG composition and %SFC at
different temperature (tempered
method). For all the curves
plotted, the probability value
(P) was lower than 0.05
J Am Oil Chem Soc (2009) 86:681–697 693
123
Page 14
TAG followed closely the one calculated from SFC above
15 �C. After a 4-h reaction time, equilibrium based on
%SFC below 15 �C was not achieved while it was not
reflected by the TAG distribution but well on the SCF
profile above 15 �C. Modifications in the SFC profile still
observable after 4 h reaction time below 15 �C could be
attributed to intramolecular rearrangements (acyl migra-
tion) occurring within the SUS/SUU fraction, considering
that SUS/SUU components mainly contribute to the low
temperature SFC profile. Total SUS/SUU fraction not
increasing anymore after 4 h; position isomers would be
formed during this last period not reflected in the TAG
profile. Interesterification should not be evaluated
exclusively in terms of the changes occurring in particular
TAGs.
The reaction rate is calculated based on %SFC at dif-
ferent temperatures confirmed the fact that the effect of
acyl migration was sensitive at low temperature SFC
(Table 3) where the reaction rate was lower (about 0.2–
0.3 h-1). This reaction rate increased at higher tempera-
ture SFC (1.2–1.6 h-1), with a maximum of 1.6 h-1 at
25 �C.
A lower amount of partial acylglycerols was formed at
the end of B-EIE compared to CIE. This amount only
depends on the quantity of water initially present in the
system.
Table 4 continued
Solid fat contenta (%) FDS (NT) FDS (T) C-EIE (NT) C-EIE (T)
45 �C 14.1 ± 0.2 14.4 ± 0.1 5.2 ± 0.1 5.2 ± 0.2
50 �C 6.2 ± 0.1 6.7 ± 0.2 0.0 ± 0.2 0.1 ± 0.1
TAG compositionb (wt%) ECN FDS C-EIE RAND
LnLL 40 2.28 ± 0.02 0.31 ± 0.01 0.21
LLL (?OLLn) [TAG A] 42 7.04 ± 0.02 1.64 ± 0.02 1.27
LLnP 42 1.01 ± 0.01 1.62 ± 0.03 1.03
OOLn 44 0.0 ± 0.0 0.34 ± 0.02 0.36
LLO 44 5.61 ± 0.02 3.43 ± 0.05 2.85
PLL (?OLM ? OLnP) 44 5.68 ± 0.02 8.74 ± 0.03 7.05
PPLn (?MLP) 44 0.32 ± 0.01 2.56 ± 0.01 1.91
OOL 46 3.52 ± 0.03 4.38 ± 0.02 4.28
OLP 46 7.95 ± 0.06 15.24 ± 0.05 14.08
PPL (?OOM ? MPO) [TAG B] 46 6.02 ± 0.04 14.12 ± 0.09 14.29
MPP 46 1.22 ± 0.02 0.78 ± 0.02 0.79
OOO (?OLS) 48 2.42 ± 0.04 1.8 ± 0.03 3.04
POO (?PSL) 48 10.92 ± 0.09 10.57 ± 0.08 11.89
POP 48 20.83 ± 0.15 18.51 ± 0.12 17.36
PPP 48 16.61 ± 0.02 8.92 ± 0.03 10.87
SOO 50 1.04 ± 0.05 0.66 ± 0.02 0.92
PSO 50 3.59 ± 0.03 3.25 ± 0.03 3.46
SPP 50 3.3 ± 0.02 2.47 ± 0.02 3.25
SOS (PArO) 52 0.27 ± 0.01 0.23 ± 0.01 0.47
PPAr (?SSP) 52 0.37 ± 0.06 0.44 ± 0.04 0.61
SSS 21.5 ± 0.12 12.61 ± 0.11 15.52
SUS 31.03 ± 0.24 38.67 ± 0.26 37.49
SUU 26.6 ± 0.23 36.83 ± 0.21 34.97
UUU 20.87 ± 0.13 11.9 ± 0.15 12.01
Partial acylglycerols (%) 3.6 ± 0.05 3.6 ± 0.06 /
DI based on TAG composition (%) 0.0 97.5 100
FDS feedstock, RAND theoretical random triacylglycerol composition, calculated from the fatty acid composition, ECN equivalent carbon
number, SSS tri-saturated triacylglycerols, SUS di-saturated triacylglycerols, SUU di-unsaturated triacylglycerols, UUU tri-unsaturated triacyl-
glycerols, [TAG A] TAG or group of TAG that decreases the most during interesterification, [TAG B] TAG or group of TAG that increases the
most during interesterification, C-EIE continuous enzymatically interesterified blend
694 J Am Oil Chem Soc (2009) 86:681–697
123
Page 15
Unlike chemical interesterification, the free tocopherol
content of the interesterified oil was not greatly affected by
the enzymatic treatment. This preservation is highly ben-
eficial for the oxidative stability and vitamin properties of
the oil.
At the end of the batch enzymatic interesterification,
the color expressed in Lovibond was similar to the one of
the feedstock. No bleaching was necessary to restore the
color.
Continuous Enzymatic Interesterification (C-EIE)
Continuous enzymatic interesterification was conducted at
300 g/h, which is an acceptable flow rate with respect to
industrial applications. In such conditions, the degree of
interesterification calculated from TAG was close to 100%
(97.5%). Quality parameters were also evaluated and
compared with the initial blend (Table 4).
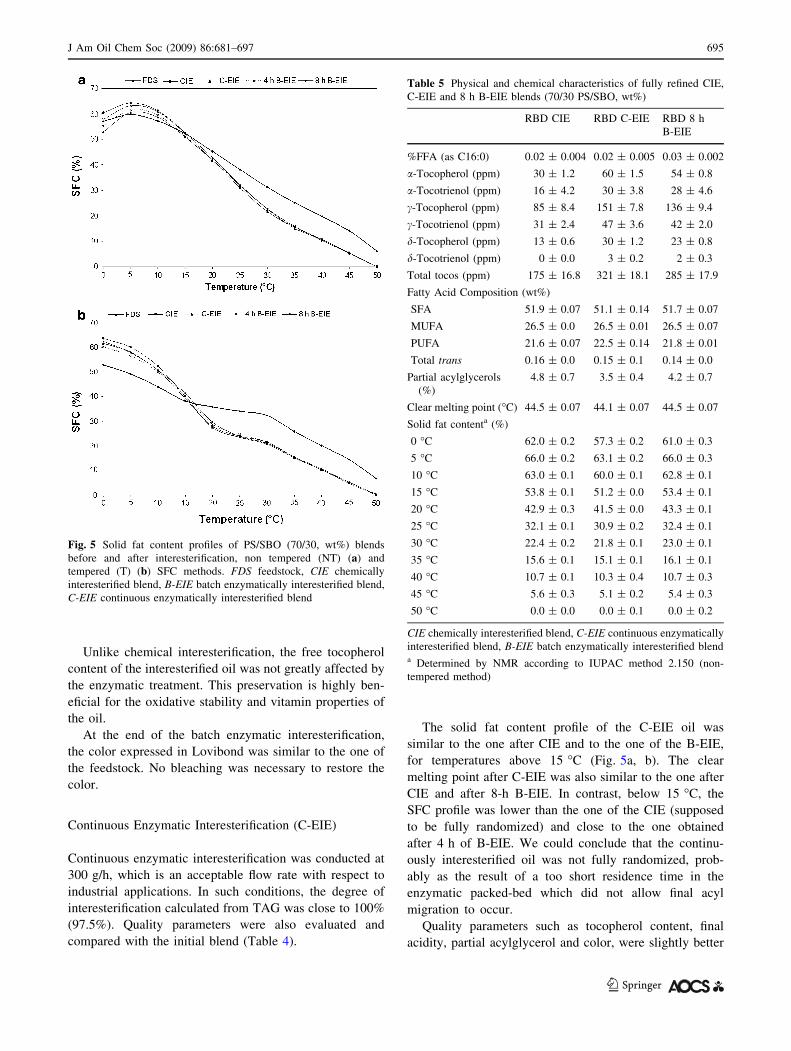
The solid fat content profile of the C-EIE oil was
similar to the one after CIE and to the one of the B-EIE,
for temperatures above 15 �C (Fig. 5a, b). The clear
melting point after C-EIE was also similar to the one after
CIE and after 8-h B-EIE. In contrast, below 15 �C, the
SFC profile was lower than the one of the CIE (supposed
to be fully randomized) and close to the one obtained
after 4 h of B-EIE. We could conclude that the continu-
ously interesterified oil was not fully randomized, prob-
ably as the result of a too short residence time in the
enzymatic packed-bed which did not allow final acyl
migration to occur.
Quality parameters such as tocopherol content, final
acidity, partial acylglycerol and color, were slightly better
Fig. 5 Solid fat content profiles of PS/SBO (70/30, wt%) blends
before and after interesterification, non tempered (NT) (a) and
tempered (T) (b) SFC methods. FDS feedstock, CIE chemically
interesterified blend, B-EIE batch enzymatically interesterified blend,
C-EIE continuous enzymatically interesterified blend
Table 5 Physical and chemical characteristics of fully refined CIE,
C-EIE and 8 h B-EIE blends (70/30 PS/SBO, wt%)
RBD CIE RBD C-EIE RBD 8 h
B-EIE
%FFA (as C16:0) 0.02 ± 0.004 0.02 ± 0.005 0.03 ± 0.002
a-Tocopherol (ppm) 30 ± 1.2 60 ± 1.5 54 ± 0.8
a-Tocotrienol (ppm) 16 ± 4.2 30 ± 3.8 28 ± 4.6
c-Tocopherol (ppm) 85 ± 8.4 151 ± 7.8 136 ± 9.4
c-Tocotrienol (ppm) 31 ± 2.4 47 ± 3.6 42 ± 2.0
d-Tocopherol (ppm) 13 ± 0.6 30 ± 1.2 23 ± 0.8
d-Tocotrienol (ppm) 0 ± 0.0 3 ± 0.2 2 ± 0.3
Total tocos (ppm) 175 ± 16.8 321 ± 18.1 285 ± 17.9
Fatty Acid Composition (wt%)
SFA 51.9 ± 0.07 51.1 ± 0.14 51.7 ± 0.07
MUFA 26.5 ± 0.0 26.5 ± 0.01 26.5 ± 0.07
PUFA 21.6 ± 0.07 22.5 ± 0.14 21.8 ± 0.01
Total trans 0.16 ± 0.0 0.15 ± 0.1 0.14 ± 0.0
Partial acylglycerols
(%)
4.8 ± 0.7 3.5 ± 0.4 4.2 ± 0.7
Clear melting point (�C) 44.5 ± 0.07 44.1 ± 0.07 44.5 ± 0.07
Solid fat contenta (%)
0 �C 62.0 ± 0.2 57.3 ± 0.2 61.0 ± 0.3
5 �C 66.0 ± 0.2 63.1 ± 0.2 66.0 ± 0.3
10 �C 63.0 ± 0.1 60.0 ± 0.1 62.8 ± 0.1
15 �C 53.8 ± 0.1 51.2 ± 0.0 53.4 ± 0.1
20 �C 42.9 ± 0.3 41.5 ± 0.0 43.3 ± 0.1
25 �C 32.1 ± 0.1 30.9 ± 0.2 32.4 ± 0.1
30 �C 22.4 ± 0.2 21.8 ± 0.1 23.0 ± 0.1
35 �C 15.6 ± 0.1 15.1 ± 0.1 16.1 ± 0.1
40 �C 10.7 ± 0.1 10.3 ± 0.4 10.7 ± 0.3
45 �C 5.6 ± 0.3 5.1 ± 0.2 5.4 ± 0.3
50 �C 0.0 ± 0.0 0.0 ± 0.1 0.0 ± 0.2
CIE chemically interesterified blend, C-EIE continuous enzymatically
interesterified blend, B-EIE batch enzymatically interesterified blenda Determined by NMR according to IUPAC method 2.150 (non-
tempered method)
J Am Oil Chem Soc (2009) 86:681–697 695
123
Page 16
during the C-EIE than during the B-EIE, because of the
shorter oil–enzyme contact time in the continuous fixed
bed process compared to the batch reaction. This justifies
the industrial employ of continuous operation in EIE. After
any of those enzymatic processes, the resulting oil pre-
sented better quality parameters compared to the chemi-
cally interesterified oil.
If we consider products issued from oil hydrolysis (FFA
and partial acylglycerols), lower contents were found after
C-EIE compared to CIE. The percentage of these hydro-
lytic products is an important quality criterion, because
they cause low yield of the final product since, as volatile
compounds, they will be removed during deodorization.
Ledochowska and Wilczyg9ska [18] showed that the pres-
ence of a non-TAG fraction in the interesterification
products lowers their resistance to oxidation, because of
their pro-oxidative properties, contribute to the deteriora-
tion of product quality by rancidity [25]. Moreover, low
content of DAG shows earlier crystallization onset, faster
and improved crystallization rate, higher SFC which
enables the addition of more liquid oil, improved post
hardening process and better baking performance [26]. It is
then important to keep this non-TAG fraction as low as
possible. On the other hand, it was shown that DAG [26]
can be regarded as beneficial since they can stabilize
b-polymorphic crystals in margarine-containing hydroge-
nated rapeseed and soybean oils.
Refining of Interesterified Blends
CIE, B-EIE (8 h) and C-EIE oils were deodorized
according to the procedure described above. Interesterified
products were compared (Table 5).
The free fatty acid content was lowered and reverted to
normal values.
A slight increase in the trans-fatty acids during post-
deodorization was observed, from 0.11% in the feedstock
to 0.14–0.15%, which is acceptable after deodorization.
No significant reduction of partial acylglycerols was
observed, assuming that mainly DAGs were formed during
the interesterification process.
Degradation of free tocopherols after post-deodorization
was more pronounced with CIE compared to the deodor-
ized EIE. Risk of oxidative damage after EIE is less than
after CIE, which is in accordance with Chu et al. [3]
observations.
In terms of SFC profile (non tempered method), the
removal of FFA during deodorization made the intereste-
rified fat slightly harder at low temperature, whatever the
interesterification process.
Besides the better quality of the EIE with regard to the
CIE, the fats produced by lipase-catalyzed continuous
interesterification are slightly different from the chemically
randomized products, mainly at low temperature SFC
(Fig. 6).
Fig. 6 Solid fat content profiles
of interesterified PS/SBO (70/
30, wt.%) blends before and
after deodorization (non
tempered SFC method). The
inset is an enlarged part of the
time range of 0–15 �C. CIEchemically interesterified blend,
B-EIE batch enzymatically
interesterified blend, C-EIEcontinuous enzymatically
interesterified blend
696 J Am Oil Chem Soc (2009) 86:681–697
123
Page 17
Acknowledgments The author thanks Novozymes for the gift of the
enzyme.
References
1. Petrauskaite V, De Greyt W, Kellens M, Huyghebaert A (1998)
Physical and chemical properties of trans-free fats produced by
chemical interesterification of vegetable oil blends. J Am Oil
Chem Soc 75:489–493
2. Rønne TH, Pedersen LS, Xu X (2005) Triglyceride Selectivity of
Immobilized Thermomyces lanuginosa Lipase in Interesterifica-
tion. J Am Oil Chem Soc 82:737–743
3. Chu BS, Ghazali HM, Lai OM, Che Man YB, Yusof S, Tee SB,
Yusoff MSA (2001) Comparison of lipase-transesterified blend
with some commercial solid frying shortenings in Malaysia. J Am
Oil Chem Soc 78:1213–1219
4. Lai OM, Ghazali HM, Chong CL (1998) Effect of enzymatic
transesterification on the melting points of palm stearin–sun-
flower oil mixtures. J Am Oil Chem Soc 75:881–886
5. Osorio NM, Da Fonseca MMR, Ferreira-Dias S (2006) Opera-
tional stability of Thermomyces lanuginosa lipase during inter-
esterification of fat in continuous packed-bed reactors. Eur J
Lipid Sci Technol 108:545–553
6. Osorio NM, Gusmao JH, Da Fonseca MM, Ferreira-Dias S
(2005) Lipase-catalysed interesterification of palm stearin with
soybean oil in a continuous fluidised-bed reactor. Eur J Lipid Sci
Technol 107:455–463
7. Zhang H, Xu X, Mu H, Nilsson J, Adler-Nissen J, Høy CE (2000)
Lipozyme IM-catalyzed interesterification for the production of
margarine fats in a 1-kg scale stirred tank reactor. Eur J Lipid Sci
Technol 102:411–418
8. Zhang H, Jacobsen C, Adler-Nissen J (2005) Storage stability
study of margarines produced from enzymatically interesterified
fats compared to margarines produced by conventional methods
I. Physical properties. Eur J Lipid Sci Technol 107:530–539
9. Zhang H, Pedersen LS, Kristensen D, Adler-Nissen J, Holm HC
(2004) Modification of margarine fats by enzymatic interesterifi-
cation: evaluation of a solid-fat-content-based exponential model
with two groups of oil blends. J Am Oil Chem Soc 81:653–657
10. Rønne TH, Yang T, Mu H, Jacobsen C, Xu X (2005) Enzymatic
interesterification of butterfat with rapeseed oil in a continuous
packed bed reactor. J Agric Food Chem 53:5617–5624
11. Zainal Z, Yussof MSA (1999) Enzymatic interesterification of
palm stearin and palm kernel olein. J Am Oil Chem Soc 76:1003–
1008
12. Lai OM, Ghazali HM, Chong CL (1998) Physical properties
of Pseudomonas and Rhizomucor miehei lipase-catalyzed
transesterified blends of palm stearin: palm kernel olein. J Am Oil
Chem Soc 75:953–959
13. Zhang H, Xu X, Nilsson J, Mu H, Adler-Nissen J, Høy CE (2001)
Production of margarine fats by enzymatic interesterification with
silica-granulated Thermomyces lanuginosa lipase in a large-scale
study. J Am Oil Chem Soc 78:57–64
14. Zhang H, Jacobsen C, Pedersen LS, Christensen MW, Adler-
Nissen J (2006) Storage stability study of margarines produced
from enzymatically interesterified fats compared to those pre-
pared by conventional methods—chemical properties. Eur J Lipid
Sci Technol 108:227–238
15. Chang T, Lai X, Zhang H, Søndergaard I, Xu X (2005) Monitoring
lipase-catalyzed interesterification for bulky fat modification with
FT-IR/NIR spectroscopy. J Agric Food Chem 53:9841–9847
16. Ghosh S, Bhattacharyya DK (1997) Utilization of high-melting
palm stearin in lipase-catalyzed interesterification with liquid
oils. J Am Oil Chem Soc 74:589–592
17. Sil Roy S, Bhattacharyya DK (1993) Distinction between enzy-
matically and chemically catalyzed interesterification. J Am Oil
Chem Soc 70:1293–1294
18. Ledochowska E, Wilczyg9ska E (1998) Comparison of the oxi-
dative stability of chemically and enzymatically interesterified
fats. Fett/Lipid 100:343–348
19. Seriburi V, Akoh CC (1998) Enzymatic interesterificaction of
lard and high-oleic sunflower oil with Candida antarctica lipase
to produce plastic fats. J Am Oil Chem Soc 75:1339–1345
20. Lee JH, Akoh CC, Lee KT (2008) Physical properties of trans-free bakery shortening produced by lipase-catalyzed interesteri-
fication. J Am Oil Chem Soc 85:1–11
21. Firestone D (1997) Official methods and recommended practices
of the American Oil Chemists’ Society, 5th edn. AOCS Press,
Champaign, Method Ca 5a-40, Cd 1b-87, Ce 1e-91, Ce 2-66,
Ce 5b-89, Ce 8-89
22. IUPAC (1987) Standard methods for the analysis of oils, fats and
derivatives, 7th edn. Blackwell Scientific Publications, Oxford
23. Xu X, Guo Z, Zhang H, Vikbjerg AF, Damstrup ML (2006)
Chemical and enzymatic interesterification of lipids for use in
food. In: Gunstone FD (ed) Modifying lipids for use in food.
Woodhead Publishing Limited, Cambridge, pp 234–272
24. Ahmadi L, Wright AJ, Marangoni AG (2008) Chemical and
enzymatic interesterification of tristearin/triolein-rich blends:
chemical composition, solid fat content and thermal properties.
Eur J Lipid Sci Technol 110:1014–1024
25. Abigor RD, Marmer WN, Foglia TA, Jones KC, DiCiccio RJ,
Ashby R, Uadia PO (2003) Production of cocoa butter-like fats
by the lipase-catalyzed interesterification of palm oil and
hydrogenated soybean oil. J Am Oil Chem Soc 80:1193–1196
26. Kristensen CJ, Wassell P (2006) Diglycerides in palm oil—
influence on crystallization behaviour in production of puff pastry
margarine. Poster presented by Danisco
J Am Oil Chem Soc (2009) 86:681–697 697
123