1
Chemical and Physical Analysis of the Cape Fear
Estuary
The Cape Fear River
• The Cape Fear River (CFR), the most industrialized of all North Carolina’s rivers, winds for over 200 miles through the heart of the piedmont, crosses the coastal plains, and empties into the Atlantic Ocean just south of us near Southport.
What we measured
• Meteorology• Flow• Temperature• Salinity• Turbidity• Light Attenuation
• Chlorophyll • Dissolved Organic
Carbon• Dissolved Oxygen• pH• Nutrients
0M183.54M239.89M35
13.79M4217.24M5421.02M6124.54HB
Miles from seaStation
2
Raymond Gephart
• MS Chemistry
Turbidity/Meteorology
Turbidity meter
October Winds
0
2
4
6
8
10
12
14
16
18
1 3 5 7 9 11 13 15 17 19 21 23 25 27 29 31
Day
Win
d Sp
eed
(mph
)
September Winds
0
2
4
6
8
10
12
14
16
18
1 3 5 7 9 11 13 15 17 19 21 23 25 27 29
Day
Win
d Sp
eed
(mph
)
*
*
October Precipitation
00.20.40.60.8
11.21.41.61.8
2
1 3 5 7 9 11 13 15 17 19 21 23 25 27 29 31
Day
Pre
cipi
tatio
n (in
ches
)
September Precipitation
00.20.40.60.8
11.21.41.61.8
2
1 3 5 7 9 11 13 15 17 19 21 23 25 27 29
Day
Pre
cipi
tatio
n (in
ches
)
*
*
* = cruise
^ = trace precipitation
^ ^
^ ^
^
Turbidity - Cruise 1
0
50
100
150
200
250
M18 M23 M35 M42 M54 M63 HBStation
Turb
idity
(ntu
)
SurfaceDeep
3
Turbidity - Cruise 2
0
50
100
150
200
250
M18 M23 M35 M42 M54 M63 HBStation
Turb
idity
(ntu
)
SurfaceDeep
Surface Turbidity
0
20
40
60
80
100
120
140
M18 M23 M35 M42 M54 M63 HB
Station
Turb
idity
(ntu
)
20042002-2003 Average
Deep Turbidity
0
20
40
60
80
100
120
140
M18 M23 M35 M42 M54 M63 HB
Station
Turb
idity
(ntu
)
20042002-2003 Average
Conclusions
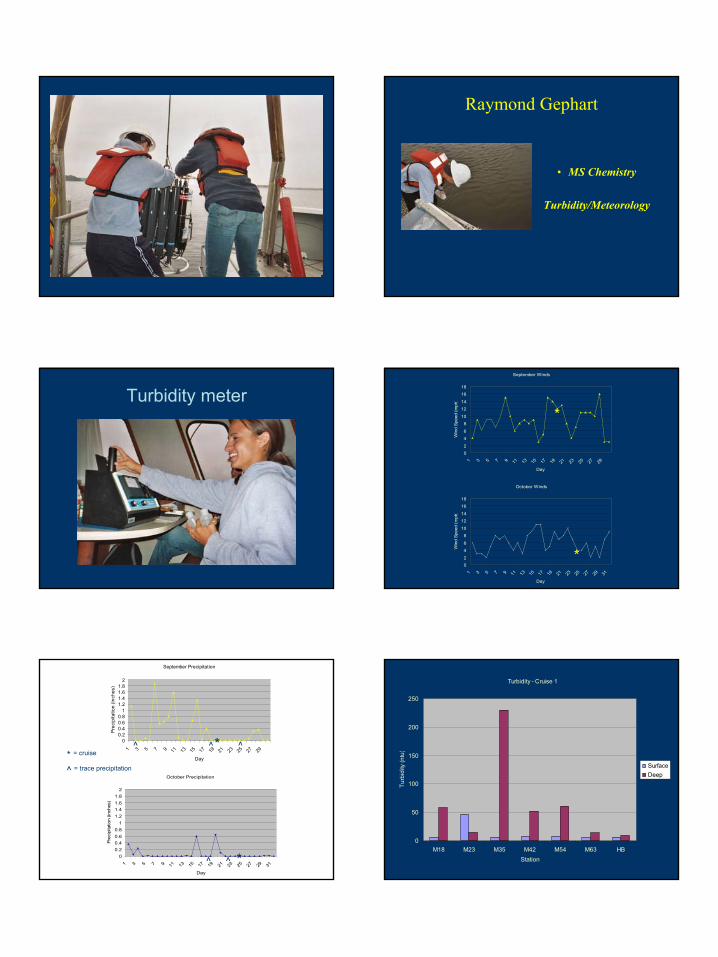
• Cruise 1 had higher turbidity than Cruise 2 which could be a result of the faster winds and greater precipitation before the cruises.
• The deep turbidity was higher than the surface turbidity.
• This year’s turbidity was higher, especially for the deep water, than the average from the past couple years.
CTD Data • The CTD measures temperature, conductivity and pressure.
• The salinity was calculated from the temperature and conductivity measurements, using the practical salinity scale from 1978.
4
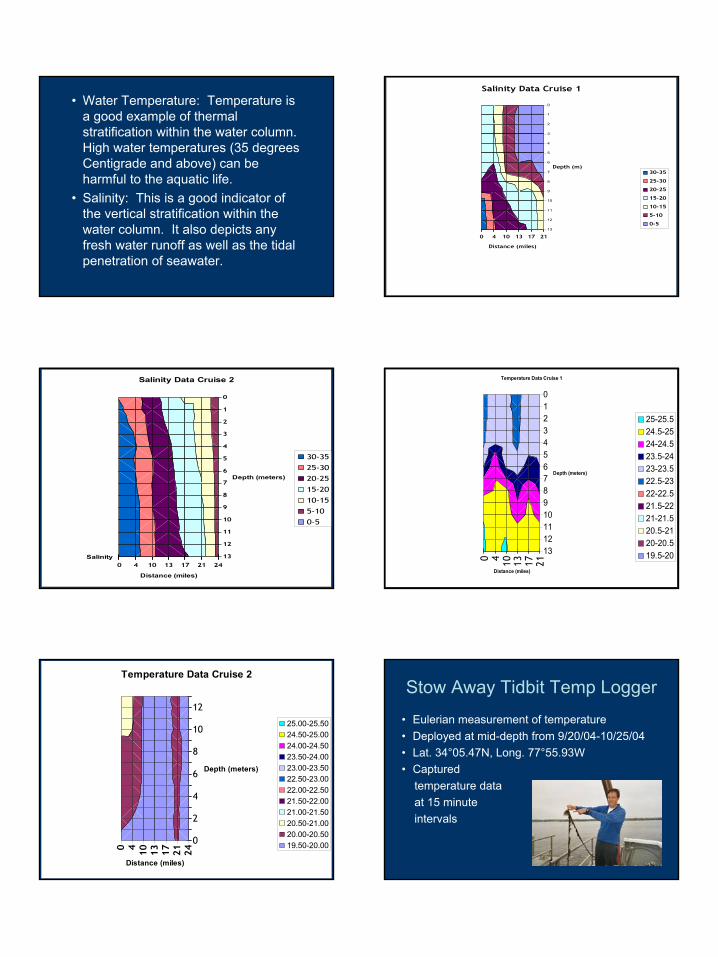
• Water Temperature: Temperature is a good example of thermal stratification within the water column. High water temperatures (35 degrees Centigrade and above) can be harmful to the aquatic life.
• Salinity: This is a good indicator of the vertical stratification within the water column. It also depicts any fresh water runoff as well as the tidal penetration of seawater.
0 4 10 13 17 21
0
1
2
3
4
5
6
7
8
9
10
11
12
13
Distance (miles)
Depth (m)
Salinity Data Cruise 1
30-35
25-30
20-25
15-20
10-15
5-10
0-5
0 4 10 13 17 21 24
0
1
2
3
4
5
6
7
8
9
10
11
12
13Salinity
Distance (miles)
Depth (meters)
Salinity Data Cruise 2
30-35
25-30
20-25
15-20
10-15
5-10
0-5
0 4 10 13 17 21
012345678910111213
Distance (miles)
Depth (meters)
Temperature Data Cruise 1
25-25.524.5-2524-24.523.5-2423-23.522.5-2322-22.521.5-2221-21.520.5-2120-20.519.5-20
0 4 10 13 17 21 24
0
2
4
6
8
10
12
Distance (miles)
Depth (meters)
Temperature Data Cruise 2
25.00-25.5024.50-25.0024.00-24.5023.50-24.0023.00-23.5022.50-23.0022.00-22.5021.50-22.0021.00-21.5020.50-21.0020.00-20.5019.50-20.00
Stow Away Tidbit Temp Logger
• Eulerian measurement of temperature• Deployed at mid-depth from 9/20/04-10/25/04• Lat. 34°05.47N, Long. 77°55.93W• Captured
temperature data at 15 minute intervals
5
Daily Temp Flux
21
21.5
22
22.5
23
23.5
24
24.5
9/21/2
004 0
:03
9/21/2
004 1
:18
9/21/2
004 2
:33
9/21/2
004 3
:48
9/21/2
004 5
:03
9/21/2
004 6
:18
9/21/2
004 7
:33
9/21/2
004 8
:48
9/21/2
004 1
0:03
9/21/2
004 1
1:18
9/21/2
004 1
2:33
9/21/2
004 1
3:48
9/21/2
004 1
5:03
9/21/2
004 1
6:18
9/21/2
004 1
7:33
9/21/2
004 1
8:48
9/21/2
004 2
0:03
9/21/2
004 2
1:18
9/21/2
004 2
2:33
9/21/2
004 2
3:48
Time
Tem
p
Daily Temp Changes
12
13
14
15
16
17
18
19
20
21
22
23
24
25
26
27
9/21/2
004
9/23/2
004
9/25/2
004
9/27/2
004
9/29/2
004
10/1/
2004
10/3/
2004
10/5/
2004
10/7/
2004
10/9/
2004
10/11
/2004
10/13
/2004
10/15
/2004
10/17
/2004
10/19
/2004
10/21
/2004
10/23
/2004
Date
Tem
p
Min
Max
Ave
daily AVG of Air Temperature
Average Temp
20
21
22
23
24
25
26
27
28
2002 LCFRP (5yr ave) 2004
Tem
p
Sept Oct
Conclusions• Temperature changes with tides under
stratified conditions
• Daily flux with air temperatures
• September 2004 cooler than previous years possibly due to storm events involving rain and high winds leading to evaporative cooling
ADCPAcoustic Doppler Current Profiler
• Measures velocity based on Doppler shifting of the sound scatter of particles in the water
• Assumes particles move at same velocity as the water
• Averages velocities of regularly spaced depth cells
6
Discharge
• Calculated by integrating the flow across the section of the river
Q = integral (v dx dz)
10-25-04 Data
Coastal Ocean Research and Monitoring Program (CORMP) http://152.20.21.7/stream.php
0 . 0 0
5 0 0 0 . 0 0
10 0 0 0 . 0 015 0 0 0 . 0 0
2 0 0 0 0 . 0 0
2 5 0 0 0 . 0 0
3 0 0 0 0 . 0 03 5 0 0 0 . 0 0
4 0 0 0 0 . 0 0
4 5 0 0 0 . 0 0
9/1/04
9/7/04
9/13/0
4
9/19/0
4
9/25/0
4
10/1/
04
10/7/
04
10/13
/04
10/19
/04
10/25
/04
10/31
/04
Dis
char
ge (f
t3/s
)CORMP Cruise#2
Cape Fear River Discharge at the Mouth
0
5000
10000
15000
20000
25000
30000
35000
40000
45000
1999 2000 2001 2002 2003 2004
Dis
char
ge (f
t3 /s)
Sept
Oct
Coastal Ocean Research and Monitoring Program (CORMP) http://152.20.21.7/stream.php
Conclusions
• Uniform velocity with depth
• Discharge varies with rain events
• Higher tidal discharge due to base flow + freshwater inputs
7
pH
Why Measure pH– Fundamental solution property– Useful in Characterization– Has direct impact on chemical and biological
properties
How Measure pH
• Measure using a pH meter
• Typical pH: Fresh H2O = 5.5-7.0Salt H2O = 7.8-8.2
• On the cruises the pH was between 6.45 and 8.06
Cruise 1
0
0.05
0.1
0.15
0.2
0.25
0.3
0.35
0.4
0 5 10 15 20Salinity
[H+]
(uM
)
Cruise 2
0
0.01
0.02
0.03
0.04
0.05
0.06
0 5 10 15 20 25 30 35
Salinity
[H+]
(uM
) 0
2
4
6
8
10
M18 M23 M35 M42 M54 M64 HBStation
pHSep-04
Oct-04
01,02,03 Average
Conclusion
• The differences between the pH:– Cruise 1 much lower pH than cruise 2 or
earlier data
• Why? Rainfall affecting salinity during first cruise– Just had rain from hurricane– Not much rain during October
Conclusion 2
• Salinity and pH were negatively correlated during cruise 2 and cruise 1 because as the salinity increases high pH seawater is added to the system
8
Dissolved Oxygen (DO)
• Why Measure DO– Important marker of biological activity– Easy measurement, allow for
characterization of H2O type and health
• How Measure DO– Measure using YSI
• In-Situ, lowered over side of boat
DO Controls• Biological Controls of DO
– Production from photosynthesis:• CO2+ H2O CH2O+ O2
– Utilization in respiration and oxidation• CH2+ O2 CO2+ H2O
• Physical Controls on DO:– Salinity, Temp., Dissolved Organic Carbon
(DOC)
Cruise 1
y = -0.0588x + 106.7R2 = 0.9151
0
10
20
30
40
50
60
70
80
90
100
0 100 200 300 400 500 600 700 800 900 1000
DOC (uM C)
Per
cent
Oxy
gen
Satu
ratio
n(%
)
Cruise 2
y = -0.0309x + 89.275R2 = 0.8296
0
20
40
60
80
100
0 200 400 600 800 1000 1200 1400
DOC (uM C)
Perc
ent O
xyge
n Sa
tura
tion
0
1
2
3
4
5
6
7
8
M18 M23 M35 M42 M54 M61 HBStation
DO
(mg/
L)2004 Cruise 12004 Cruise 201,02,03 Average
Conclusion
• DO is controlled by dissolved organic carbon content of Cape Fear – As DOC increases, % saturation decreases
• This is b/c much of the O2 is used up in oxidation of the added organic matter
Chlorophyll in the Cape Fear River
9
Introduction• Photosynthetic pigment
present in chloroplastsCO2 + H2O ↔ (CH2O) + O2
• Structure is a porphyrinring, which is the light absorbing portion
• In addition, there is a non polar phytal chain which anchors it to the cell membrane.
Importance
• Estimate of phytoplankton biomass
• Taxonomic distinction for algae based on distribution between different pigments
• 3 types of chlorophyll: a, b, and c• Each absorbs different wavelengths of
light
Methods
• Obtain water sample• Pass determined quantity through a filter• Freeze until further analysis
• Add acetone to extract chl a
• Measure fluorescence
QuestionsIs cruise 1 different than cruise 2?
0
2
4
6
8
HB m61 m54 m42 m35 m23 m18
Site Identification
Chl
orop
hyll
a C
once
ntra
tions
(ug/
L) Cruise 1 Top
Cruise 2 Top
0
2
4
6
8
HB m61 m54 m42 m35 m23 m18
Site Identification
Chl
orop
hyll
Con
cent
ratio
n(u
g/L) Cruise 1 Bottom
Cruise 2 Bottom
10
Is the top different than the bottom?
0
2
4
6
8
HB m61 m54 m42 m35 m23 m18
Site Identification
Chl
orph
yll a
Con
cent
ratio
n (u
g/L) Top Cruise 2
BottomCruise 2
0
2
4
6
8
HB m61 m54 m42 m35 m23 m18
Site Identification
Chl
orop
hyll
a Con
cent
ratio
ns
(ug/
L) Top Cruise 1Bottom Cruise 1
Is there similarity to other years?
0
2
4
6
8
10
12
14
16
HB m61 m54 m42 m35 m23 m18
2001
2002
2003
2004
Results• Greater chlorophyll levels measured at depth,
especially for Cruise 1
• Top values for Cruise 1 are lower than top for Cruise 2
• Bottom values for Cruise 1 are mostly greater than bottom for Cruise 2
• Data this year generally falls within range of other years. Although, scatter in data especially at end members.
Results
• Chlorophyll levels appear to be directly related to turbidity levels
• No relation to salinity levels
• No clear correlation with nutrient levels or light penetration (Kd)
Chlorophyll vs. Turbidity
0
10
20
30
40
50
60
70
0 1 2 3 4 5 6 7 8
Chlorophyll a Concentration (ug/L)
Turb
idity
(NTU
)
Conclusions• The Cape Fear River is a very dark river, therefore,
expect to see low chlorophyll levels
• Chlorophyll data ranged from 0.88 to 6.80 ug/L. Normal chlorophyll values for the Cape Fear ranges from 0.7-15 ug/L
• Chlorophyll in the Cape Fear system is directly related to turbidity
• It is suggested that the Cape Fear River has low chlorophyll levels because it is a light limited system
11
Dissolved Organic Carbon
Dissolved Organic Matter (DOM)
– CDOM: chromophoric dissolved organic matter– DON: dissolved organic nitrogen– DOC: dissolved organic carbon– TDN(total dissolved N) =DON+DIN(dissolved inorganic N)
Sources of DOC
– River input (0.2*1015g C yr-1)– Atmospheric deposition (0.09*1015g C yr-1)– Porewater diffusion (0.02-0.17*1015 g C yr-1)– Biological production
• Sloppy feeding• Excretion and cell lysis• Release from fecal matter
Instrumentation
• DOC was measured using the high temperature catalytic oxidation (HTCO) method with NDIR detection on a Shimadzu TOC-5050A carbon analyzer.
• TDN will be calculated as the sum of DIN and DON, which will be measured with a linked Shimadzu TOC-5050/Antek 9000N system.
Methods
• Utilized high temperature catalytic oxidation (HTCO)
– Converts DOC into CO2 quantified IR– Converts TDN NOx + O3 NO2
*
• Chemiluminescent decay
Cruise 2 - DOC
0200400600800
1000
M18 M23 M35 M42 M54 M61 HB
Station
Con
cent
ratio
n(u
M) Surface
Bottom
Cruise 1 DOC
0
500
1000
1500
M18 M23 M35 M42 M54 M61 HB
Station
Con
cent
ratio
n(u
M)
Surface
Bottom
12
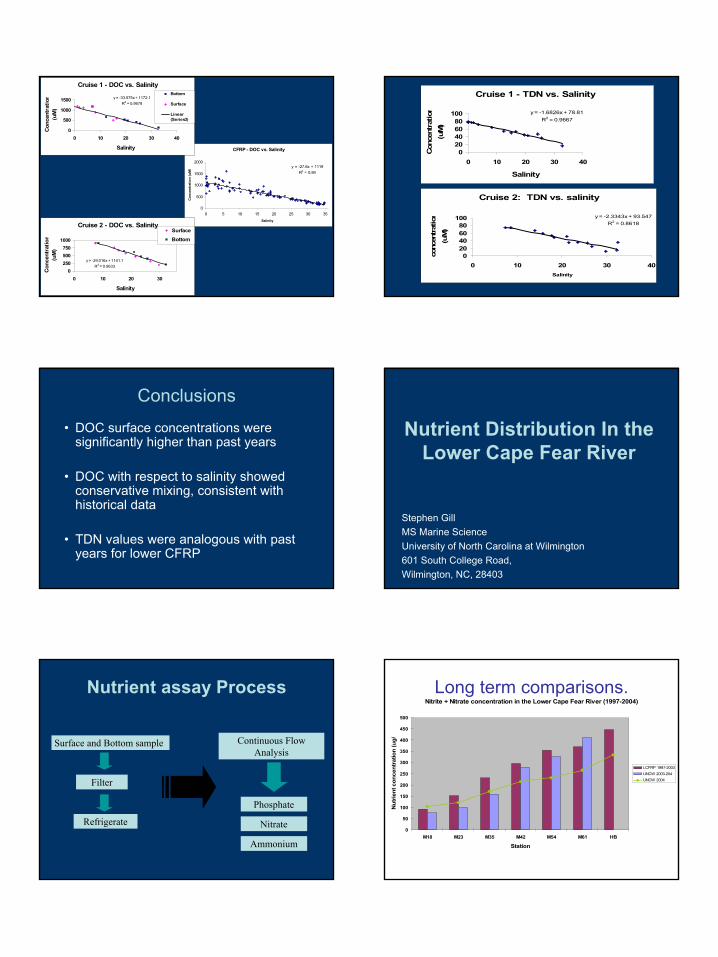
CFRP - DOC vs. Salinity
y = -27.6x + 1119R2 = 0.84
0
500
1000
1500
2000
0 5 10 15 20 25 30 35Salinity
Con
cent
ratio
n (u
M)
Cruise 2 - DOC vs. Salinity
y = -29.016x + 1141.1R2 = 0.9633
0250500750
1000
0 10 20 30
Salinity
Con
cent
ratio
n(u
M)
Surface
Bottom
Cruise 1 - DOC vs. Salinity
y = -33.575x + 1172.1R2 = 0.9678
0
500
1000
1500
0 10 20 30 40
Salinity
Con
cent
ratio
n(u
M)
Bottom
Surface
Linear(Series3)
Cruise 1 - TDN vs. Salinity
y = -1.6826x + 78.81R2 = 0.9667
020406080
100
0 10 20 30 40
Salinity
Con
cent
ratio
n(u
M)
Cruise 2: TDN vs. salinity
y = -2.3343x + 93.547R2 = 0.8618
020406080
100
0 10 20 30 40Salinity
conc
entr
atio
n(u
M)
Conclusions
• DOC surface concentrations were significantly higher than past years
• DOC with respect to salinity showed conservative mixing, consistent with historical data
• TDN values were analogous with past years for lower CFRP
Nutrient Distribution In the Lower Cape Fear River
Stephen GillMS Marine ScienceUniversity of North Carolina at Wilmington601 South College Road,Wilmington, NC, 28403
Nutrient assay Process
Surface and Bottom sample
Filter
Refrigerate
Continuous Flow Analysis
Nitrate
Phosphate
Ammonium
Long term comparisons.Nitrite + Nitrate concentration in the Lower Cape Fear River (1997-2004)
0
50
100
150
200
250
300
350
400
450
500
M18 M23 M35 M42 M54 M61 HB
Station
Nut
rient
con
cent
ratio
n (u
g/
LCFRP 1997-2003UNCW 2003-204UNCW 2004
13
Physical Controls - Conservative mixing
Nitrate + Nitrite concentrations with respect to salinity in the lower Cape Fear River.
y = -1.3522x + 44.063R2 = 0.9946
0
5
10
15
20
25
30
35
40
0 5 10 15 20 25 30 35
Salinity
NN
con
cent
ratio
n (u
mol
/l)
Oct. surfaceOct. bottom
Nov. surfaceNov. bottom
Linear (Nov. surface)
Physical Controls Physical Controls -- Conservative mixingConservative mixingPhosphate concentrations with respect to Salinity in the Lower Cape Fear River.
y = -0.0564x + 1.8996R2 = 0.9968
0
0.5
1
1.5
2
2.5
3
3.5
0 5 10 15 20 25 30 35
Salinity
P co
ncen
trat
ion
(um
ol/l)
Oct. surfaceOct. bottom
Nov. surfaceNov. bottom
Linear (Nov. surface)
Physical Controls - Conservative mixing
Ammonium concentrations with respect to saliniy in the Lower Cape Fear River
0
2
4
6
8
10
12
14
0 5 10 15 20 25 30 35
Salinity
P co
ncen
tratio
n (u
mol
/l
Oct. surfaceOct. bottomNov. surface
Nov. bottom
Cruise 1Nutrient concentration in the Lower Cape Fear River (Oct. 2004).
0
2
4
6
8
10
12
14
16
18
M18 M23 M35 M42 M54 M61 HB
Station
Nut
rient
con
cent
ratio
n (u
mol
/l)
N+N surfaceN+N bottomP surface
P bottomA surfaceA bottom
Cruise 2Nutrient concentration in the Lower Cape Fear River (Nov 2004).
0
5
10
15
20
25
30
35
40
M18 M23 M35 M42 M54 M61 HB
Station
Nut
rient
con
cent
ratio
n (u
mol
/l)
N+N surfaceN+N bottomP surface
P bottomA surfaceA bottom
Conclusions• Cruise Averages consistent with long term
data.
• Individual cruises highly variable (Analogous to seasonality).
• Nutrient distribution explained in terms of salinity.
• Nutrient peaks correlate to turbidity maxima.
14
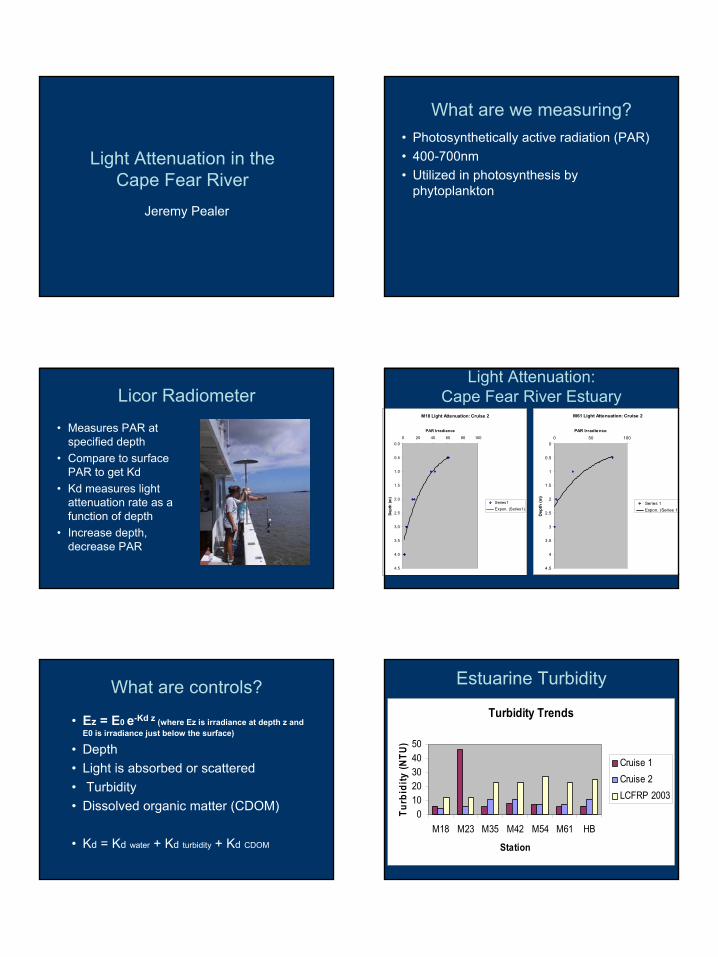
Light Attenuation in the Cape Fear River
Jeremy Pealer
What are we measuring?• Photosynthetically active radiation (PAR)• 400-700nm• Utilized in photosynthesis by
phytoplankton
Licor Radiometer
• Measures PAR at specified depth
• Compare to surface PAR to get Kd
• Kd measures light attenuation rate as a function of depth
• Increase depth, decrease PAR
Light Attenuation:Cape Fear River Estuary
M18 Light Attenuation: Cruise 2
0.0
0.5
1.0
1.5
2.0
2.5
3.0
3.5
4.0
4.5
0 20 40 60 80 100
PAR Irradiance
Dept
h (m
)
Series1Expon. (Series1)
M61 Light Attenuation: Cruise 2
0
0.5
1
1.5
2
2.5
3
3.5
4
4.5
0 50 100
PAR Irradience
Dep
th (m
)
Series 1Expon. (Series 1)
What are controls?
• Ez = E0 e-Kd z (where Ez is irradiance at depth z and E0 is irradiance just below the surface)
• Depth• Light is absorbed or scattered• Turbidity• Dissolved organic matter (CDOM)
• Kd = Kd water + Kd turbidity + Kd CDOM
Estuarine Turbidity
Turbidity Trends
01020304050
M18 M23 M35 M42 M54 M61 HB
Station
Turb
idity
(NTU
)
Cruise 1Cruise 2LCFRP 2003
15
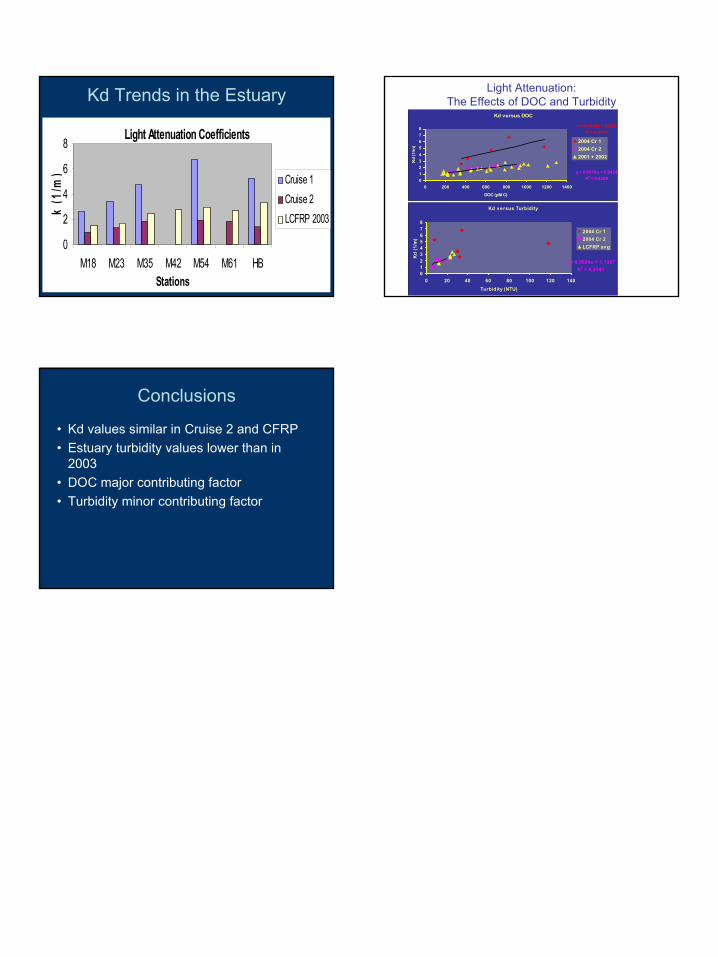
Kd Trends in the Estuary
Light Attenuation Coefficients
0
2
4
6
8
M18 M23 M35 M42 M54 M61 HBStations
k (1
/m) Cruise 1
Cruise 2LCFRP 2003
Light Attenuation:The Effects of DOC and Turbidity
Kd versus Turbidity
y = 0.0604x + 1.1397R2 = 0.3141
012345678
0 20 40 60 80 100 120 140Turbidity (NTU)
Kd
(1/m
)
2004 Cr 12004 Cr 2LCFRP avg
Kd versus DOC
y = 0.0018x + 0.8424R2 = 0.8268
y = 0.0036x + 2.062R2 = 0.5519
012345678
0 200 400 600 800 1000 1200 1400
DOC (µM C)
Kd
(1/m
)
2004 Cr 12004 Cr 22001 + 2002
Conclusions
• Kd values similar in Cruise 2 and CFRP• Estuary turbidity values lower than in
2003• DOC major contributing factor • Turbidity minor contributing factor