Page 1
CHEMICAL AND RHEOLOGICAL PROPERTIES OF YOGHURT PRODUCED BY LACTIC ACID CULTURES ISOLATED FROM TRADITIONAL
TURKISH YOGHURT
A THESIS SUBMITTED TO THE GRADUATE SCHOOL OF NATURAL AND APPLIED SCIENCES
OF MIDDLE EAST TECHNICAL UNIVERSITY
BY
SEZEN DĐNÇEL
IN PARTIAL FULFILLMENT OF THE REQUIREMENTS FOR
THE DEGREE OF MASTER OF SCIENCE IN
FOOD ENGINEERING
JUNE 2012
Page 2
Approval of the thesis:
CHEMICAL AND RHEOLOGICAL PROPERTIES OF YOGHURT PRODUCED BY LACTIC ACID CULTURES ISOLATED FROM
TRADITIONAL TURKISH YOGHURT
submitted by SEZEN DĐNÇEL in partial fulfillment of the requirements for the degree of Master of Science in Food Engineering Department, Middle East Technical University by, Prof. Dr. Canan Özgen ___________________ Dean, Graduate School of Natural and Applied Sciences Prof. Dr. Alev Bayındırlı ___________________ Head of Department, Food Engineering Prof. Dr. G. Candan Gürakan Gültekin ___________________ Supervisor, Food Engineering Dept., METU Examining Committee Members: Prof. Dr. Faruk Bozoğlu ___________________ Food Engineering Dept., METU Prof. Dr. G. Candan Gürakan Gültekin ___________________ Food Engineering Dept., METU Assoc. Prof. Dr. Behiç Mert ___________________ Food Engineering Dept., METU Assoc. Prof. Dr. Ayşegül Çetin Gözen ___________________ Biology Dept., METU Dr. Neslihan Altay Dede ___________________ Food Engineering Dept., Selçuk University
Date: June 28th, 2012
Page 3
iii
I hereby declare that all information in this document has been obtained and presented in accordance with academic rules and ethical conduct. I also declare that, as required by these rules and conduct, I have fully cited and referenced all material and results that are not original to this work.
Name, Last name: Sezen Dinçel
Signature:
Page 4
iv
ABSTRACT
CHEMICAL AND RHEOLOGICAL PROPERTIES OF YOGHURT
PRODUCED BY LACTIC ACID CULTURES ISOLATED FROM
TRADITIONAL TURKISH YOGHURT
Dinçel, Sezen
M.Sc., Department of Food Engineering
Supervisor: Prof. Dr. G. Candan Gürakan
Co-Superivsor: Assoc. Prof. Dr. Behiç Mert
June 2012, 140 pages
Yoghurt is a fermented milk product which is produced by Streptococcus
thermophilus and Lactobacillus delbrueckii spp. bulgaricus. The production of
yoghurt has started in Middle East and spread all over the world. The aim of this
study is to select the culture combination which is appropriate to Turkish taste and
have the best yoghurt characteristics by means of post-acidification and whey
separation properties, texture of gel formation, exopolysaccharide and acetaldehyde
content; and to observe the effect of freeze-drying of cultures on these yoghurt
properties.
Page 5
v
At the first part of this study, six L.delbrueckii spp. bulgaricus isolates and six
S.thermophilus isolates were used with different combinations to produce 36 yoghurt
samples. These isolates were selected among a strain collection which contains 111
L.delbrueckii spp. bulgaricus and 56 S.thermophilus isolates which were isolated
from traditional Turkish yoghurt according to their acidification activity and
acetaldehyde production properties. In addition, two commercial S.thermophilus
isolates and one commercial L.delbrueckii spp. bulgaricus isolate were used to
produce two commercial yoghurt samples. 38 yoghurt samples were examined in
terms of pH and total titratable acidity changes during 21-day storage, syneresis and
hardness. According to these three analyses, six yoghurt samples were chosen, which
give the best results, for the determination of exopolysaccharide and acetaldehyde
content. In addition, two yoghurt samples produced by commercial cultures and one
sample, which gives average results in experiments, were also examined for these
compounds to provide a good comparison.
In the second part of the study the amount of exopolysaccharide and acetaldehyde of
nine yoghurt samples were determined. In addition, sensory analysis was conducted
to see consumer perception. According to the results, one culture combination was
obtained as the best combination which produces the appropriate yoghurt to Turkish
taste with the closest chemical analysis results to the commercial samples.
In the last part, freeze drying process was examined if this has a significant effect on
the selected LAB combination as well as yoghurt produced by using this.
Keywords: Yoghurt, starter culture, exopolysaccharide, acetaldehyde, texture analysis
Page 6
vi
ÖZ
GELENEKSEL TÜRK YOĞURTLARINDAN ĐZOLE EDĐLEN LAKTĐK
KÜLTÜRLER TARAFINDAN YAPILAN YOĞURTLARIN KĐMYASAL VE
FĐZYOLOJĐK ÖZELLĐKLERĐ
Dinçel, Sezen
Yüksek Lisans, Gıda Mühendisliği Bölümü
Tez Yöneticisi: Prof. Dr. G. Candan Gürakan
Ortak Tez Yöneticisi: Doç. Dr. Behiç Mert
Haziran 2012, 140 sayfa
Yoğurt, Streptococcus thermophilus ve Lactobacillus bulgaricus tarafından üretilen
fermente bir süt ürünüdür. Yoğurt üretimi Orta Doğu’da başlamış ve buradan tüm
dünyaya yayılmıştır. Bu çalışmada, Türk damak tadına en uygun ve aynı zamanda
post-acidifikasyon, serum ayrılması, yapısal özellikler, ekzopolisakkarit ve
asetaldehit içeriği açısından en iyi özelliklere sahip yoğurdu üreten kültür
kombinasyonunu seçmek ve liyofilizasyonun bu yoğurt kültürleri ve özellikleri
üzerindeki etkisini görmek amaçlanmıştır.
Page 7
vii
Bu çalışmanın ilk bölümünde, altı L.delbrueckii spp. bulgaricus ve altı
S.thermophilus izolatı kullanılarak çeşitli kombinasyonlar oluşturulmuş ve 36 yoğurt
örneği üretilmiştir. Bu izolatlar, geleneksel Türk yoğurtlarından izole edilen 111
L.delbrueckii spp. bulgaricus ve 56 S.thermophilus izolatı arasından asidifikasyon
aktiviteleri ve asetaldehit üretme özelliklerine göre seçilmiştir. Ek olarak, 2 tane ticari
S.thermophilus ve 1 tane de L.delbrueckii spp. bulgaricus izolatı 2 tane ticari yoğurt
örneği üretmek üzere kullanılmıştır. 38 yoğurt örneği 21 günlük depolama boyunca
oluşan pH ve titrasyon asitliği değişikliği, serum ayrılması ve sertlik özellikleri
yönünden incelenmiştir. Sonuç olarak, en iyi sonuçları veren altı yoğurt örneği
ekzopolisakkarit ve asetaldehit miktarının belirlenmesi analizlerinde kullanılmak için
seçilmiştir. Ek olarak, ticari kültürler kullanılarak üretilen iki yoğurt örneği ve
testlerde ortalama sonuçlar veren bir örnek de karşılaştırma yapılabilmesi için bu
maddeler yönünden incelenmiştir.
Çalışmanın ikinci bölümünde, dokuz yoğurt örneğinin ekzopolisakkarit miktarı ve
asetaldehit miktarları belirlenmiştir. Ek olarak, tüketici beğenisini ölçmek için
duyusal analiz yapılmıştır. Sonuçlara göre, Türk damak tadına en uygun ve kimyasal
analizleri ticari yoğurt örneklerine en yakın olan bir kültür kombinasyonu
liyofilizasyon işlemi için seçilmiştir.
Son bölümde, liyofilizasyon işleminin seçilen laktik asit bakteri kombinasyonunun ve
bu kültürle üretilen yoğurdun üzerindeki etkisi incelenmiştir.
Anahtar Kelimeler: Yoğurt, starter kültür, ekzopolisakkarit, asetaldehit, yapısal analiz
Page 9
ix
ACKNOWLEDGEMENTS
Many persons have contributed either directly or indirectly to my thesis, I would like
to mention them and show my gratitude.
I would like to thank my supervisor Prof. Dr. G. Candan Gürakan for her all kinds of
support and advice and also I would like to thank my co-supervisor Assoc. Prof. Dr.
Behiç Mert for his guidance and help.
I want to express my thanks to reviewers of my thesis. Thanks to Dr. Neslihan Altay
Dede for her valuable suggestions and guidance through my research.
I would also thank Atatürk Orman Çiftliği for providing milk during all experiments.
My special thanks go to Dr. Cem Baltacıoğlu for his guidance and patience. I also
want to thank my friends; Hande Baltacıoğlu, Şükran Gizem Aygün, Gülçin Kültür,
Onur Yüce and Elif Yıldız for their help, friendship and accompany.
Lastly, I want to express my deepest gratitude to my parents Bilge and Süleyman
Dinçel and my sister Selvi Dinçel for their support, confidence, patience and love.
Page 10
x
TABLE OF CONTENT
ABSTRACT…………………………………………..…………………….………..iv
ÖZ…………………………………………………….………………….….……….vi
ACKNOWLEDGEMENTS........................................................................................ix
TABLE OF CONTENTS……………………………………...……….………….....x
LIST OF TABLES……………………………………………..…………………...xiv
LIST OF FIGURES……………………………………………….……….……….xvi
CHAPTERS
1. INTRODUCTION……………………………………....………………………..1
1.1 Milk………………………………………………………..………………..…1
1.2 Fermentation and Fermented Milk Products..…………………….…………..3
1.3 Yoghurt……………………………………………………………..…..……..5
1.4 Economical Aspects……………………………………………………....…...5
1.5 Yoghurt Manufacturing……………………………………………..……...…7
1.6 Components of Yoghurt and Effects on Health………………....……..……11
1.6.1 Total Solid Content……………………………………..….……..….13
1.6.2 Lactose…………………………………………………..……...........14
1.6.3 Proteins…………………………………………………...………….15
1.6.4 Lipids…………………………………………………..………….....18
1.6.5 Lactic Acid……………………………………………………...........20
1.6.6 Vitamins and Minerals…………………………………………….....21
1.7 Yoghurt Starter Culture………………………...……………………..……..24
1.7.1 Streptococcus thermophilus……………….………………………....26
1.7.2 Lactobacillus delbrueckii ssp.bulgaricus……….………………..…..27
1.7.3 The Use of Starter Cultures in Dairy Industry…………..……..……28
1.7.3.1 Preservation Techniques of Starter Cultures………………….....32
Page 11
xi
1.7.3.2 Propagation of Starter Cultures……………………………….....34
1.7.3.3 Phage Problems in Dairy Industry……………………………....36
1.8 Texture…………………………………………………………………....….38
1.8.1 Exopolysaccharides……………………………………………….....38
1.8.2 Effects of EPS on Rheological Properties of Yoghurt………............40
1.9 Aroma Compounds…………………………………………………..………42
1.9.1 Flavor Formation in Yoghurt…………………………………......….45
1.10 Aim of the Study….…..……………………………………………..……..48
2. MATERIALS AND METHODS………….………………………………...….50
2.1 Materials………………………………………………………………….….50
2.1.1 Lactic Acid Bacteria Strains ……………………………………..….50
2.1.2 Growth media and temperature…………………………..………….52
2.2 Methods………………………………………………………………..…….53
2.2.1 Cultivation………………………………………………………...…53
2.2.2 Yoghurt Production……………………………………………….....54
2.2.3 pH and Titratable Acidity Determination……..……………………..57
2.2.4 Whey Separation…………………………………..………………....58
2.2.5 Texture Analysis………………………………………..…………....58
2.2.6 Selection of Yoghurt Samples for Chemical and Sensory
Analysis…………………………………………….……….……….58
2.2.7 EPS Content Determination…………………………….…………...59
2.2.8 Acetaldehyde Content Determination…………………….………...61
2.2.9 Sensory Analysis……………………………………………….……62
2.2.10 Freeze Dried Culture Preparation……….…………………………...62
3. RESULTS AND DISCUSSION……………………….……………………….64
3.1 Experimental Design…………………………………….…………………..64
3.1.1 Physico-Chemical and Rheological Properties
Determination.....................................................................................66
Page 12
xii
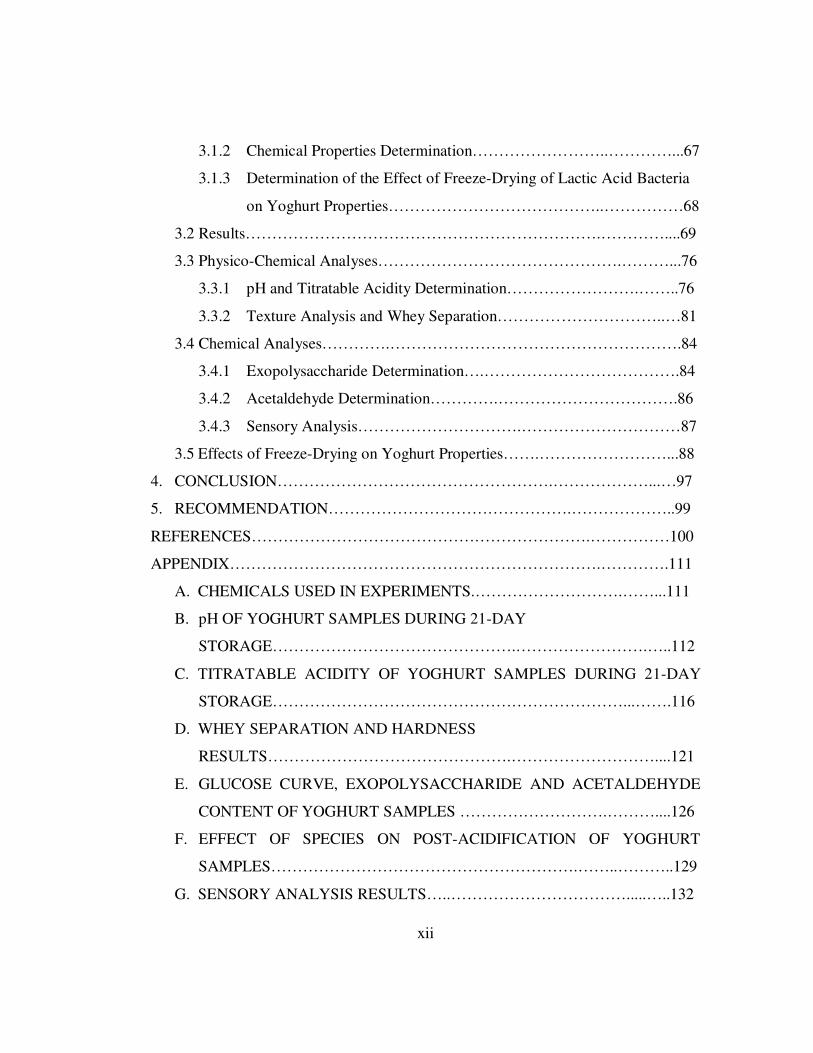
3.1.2 Chemical Properties Determination……………………..…………...67
3.1.3 Determination of the Effect of Freeze-Drying of Lactic Acid Bacteria
on Yoghurt Properties…………………………………..……………68
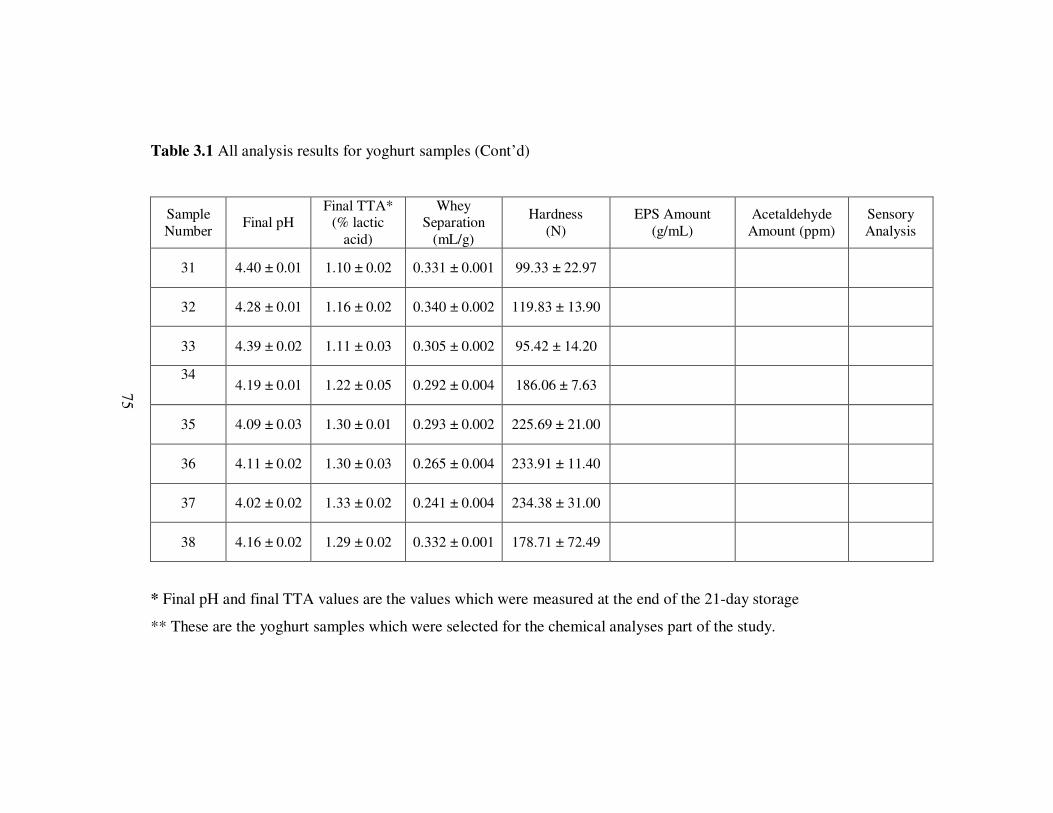
3.2 Results………………………………………………………….…………....69
3.3 Physico-Chemical Analyses……………………………………….………...76
3.3.1 pH and Titratable Acidity Determination…………………….……..76
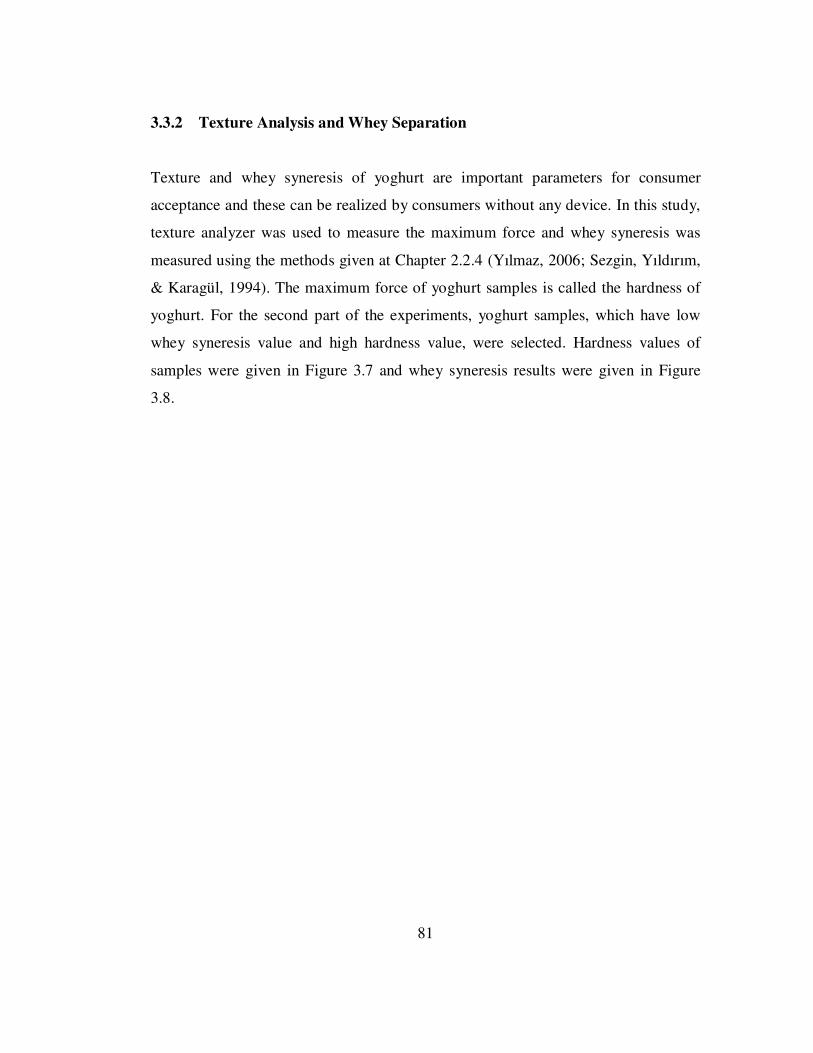
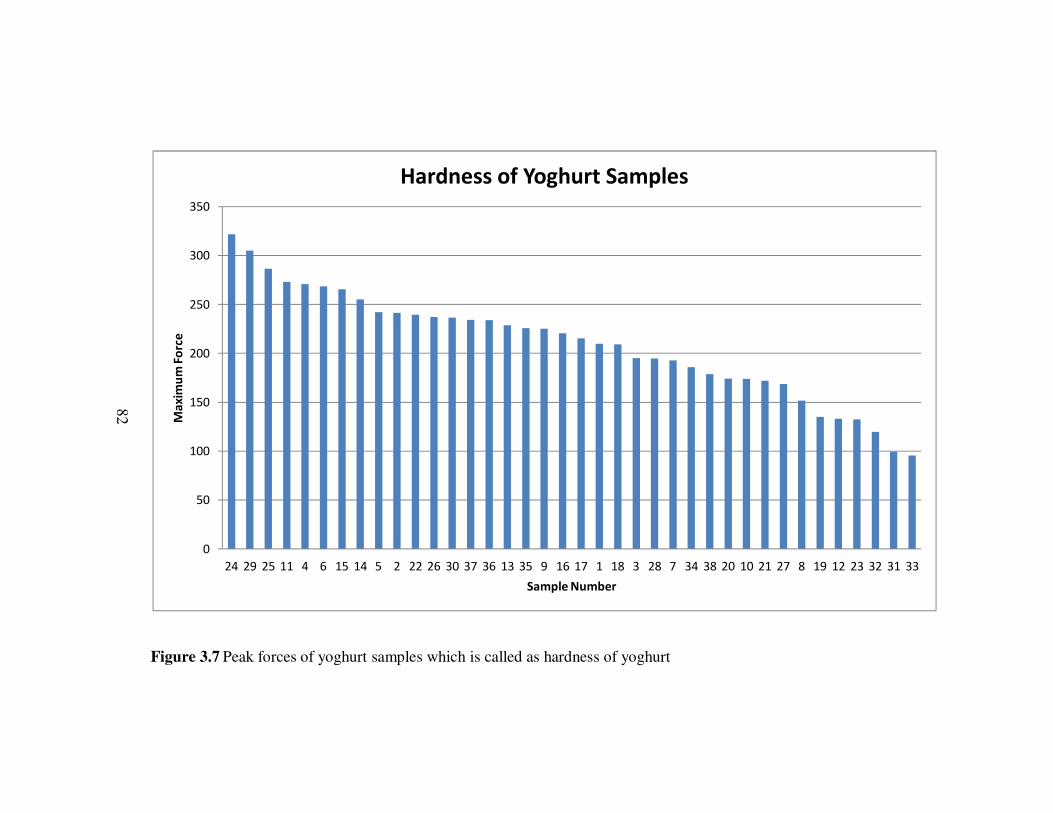
3.3.2 Texture Analysis and Whey Separation…………………………..…81
3.4 Chemical Analyses………….……………………………………………….84
3.4.1 Exopolysaccharide Determination….……………………………….84
3.4.2 Acetaldehyde Determination………….…………………………….86
3.4.3 Sensory Analysis………………………….…………………………87
3.5 Effects of Freeze-Drying on Yoghurt Properties…….……………………...88
4. CONCLUSION…………………………………………….………………...…97
5. RECOMMENDATION……………………………………….………………..99
REFERENCES……………………………………………………….……………100
APPENDIX…………………………………………………………….………….111
A. CHEMICALS USED IN EXPERIMENTS.……………………….……...111
B. pH OF YOGHURT SAMPLES DURING 21-DAY
STORAGE……………………………………….…………………….…..112
C. TITRATABLE ACIDITY OF YOGHURT SAMPLES DURING 21-DAY
STORAGE…………………………………………………………...…….116
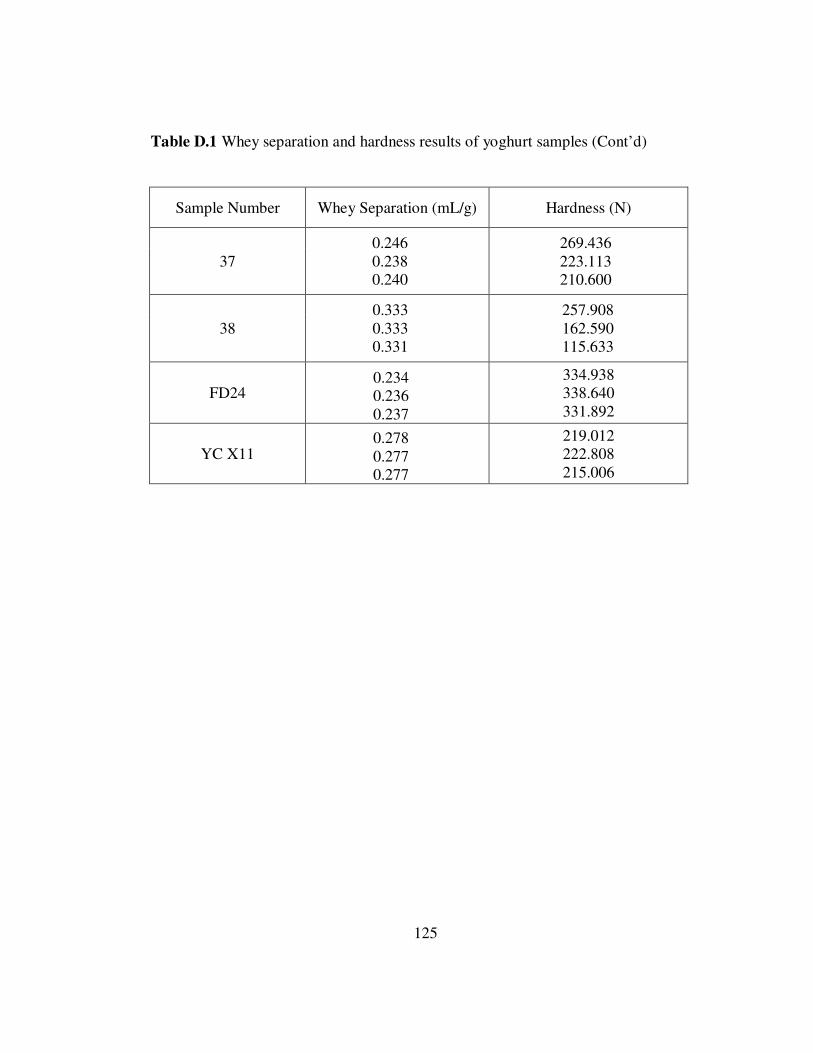
D. WHEY SEPARATION AND HARDNESS
RESULTS……………………………………….………………………....121
E. GLUCOSE CURVE, EXOPOLYSACCHARIDE AND ACETALDEHYDE
CONTENT OF YOGHURT SAMPLES ……………………….………....126
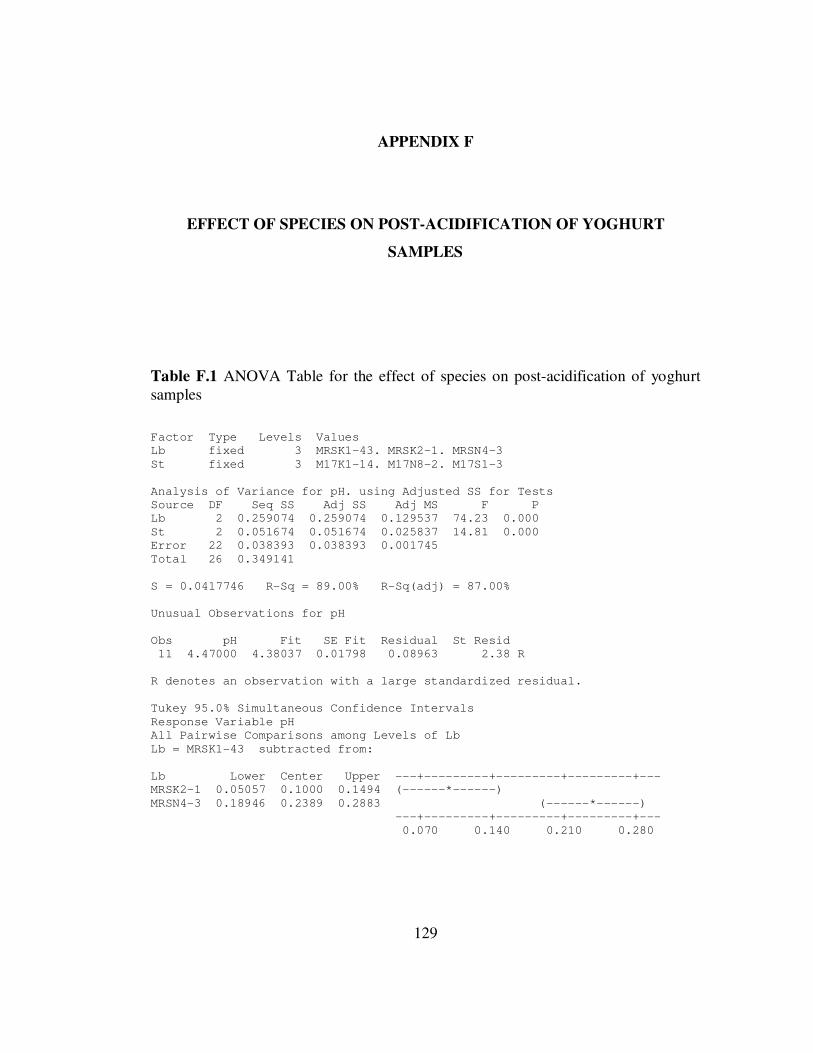
F. EFFECT OF SPECIES ON POST-ACIDIFICATION OF YOGHURT
SAMPLES………………………………………………….……..………..129
G. SENSORY ANALYSIS RESULTS…..…………………………….....…..132
Page 13
xiii
H. EFFECT OF EPS CONTENT ON HARDNESS OF YOGHURT
SAMPLES……………………………………………….……......………..137
I. PHOTOS OF YOGHURT SAMPLES..………………………..……….…138
J. ACIDIFICATION ACTIVITY AND ACETALDEHYDE PRODUCTION
PROPERTIES OF SELECTED L.DELBRUECKĐĐ SPP. BULGARICUS AND
S.THERMOPHILUS STRAINS…………………………………………....139
Page 14
xiv
LIST OF TABLES
TABLES
Table 1.1 Composition of milk from different sources …………………..…………..2
Table 1.2 Daily requirements supplied from one liter of milk......................................3
Table 1.3 Number of dairy houses, annually................................................................6
Table 1.4 Yearly increase of dairy production.............................................................6
Table 1.5 Content of full-fat and non-fat milk and yoghurt (100 g)..........................12
Table 1.6 Free amino acid content of cow’s milk and yoghurt (mg per 100 mL)…..17
Table 1.7 Volatile fatty acids content of raw milk and full-fat yoghurt ……............19
Table 1.8 Vitamin content of milk and yoghurt (in 100 g).........................................23
Table 1.9 Yoghurt starter culture producers and starter culture systems....................31
Table 1.10 Aroma compound content of yoghurt produced by using different
mammalian milk……………….………………………………………………….…44
Table 1.11 Production of carbonyl compounds (µg/g) by yoghurt starter
cultures…………………………………………..…………………………………...45
Table 2.1 Classification of S.thermophilus strains according to acidification
activity……………………………………………………………………………….51
Table 2.2 Classification of L.delbrueckii spp. bulgaricus strains according to
acidification activity………………………………………………………………....51
Table 2.3 Lactic acid bacteria strains used for yoghurt sample preparation….……..52
Table 2.4 Yoghurt sample numbers and S.thermophilus and L.delbrueckii spp.
bulgaricus strains used for production of yoghurt samples………………………….55
Table 2.5 Selected yoghurt samples for chemical and sensory analysis…………….59
Table 3.1 All analysis results for yoghurt samples………………………………….72
Page 15
xv
Table 3.2 Physico-chemical properties of yoghurt samples produced by freeze-dried
cultures……………………………………………………………………...……….89
Table 3.3 Chemical properties of yoghurt samples produced by freeze-dried
cultures…………………………………………………………………………........89
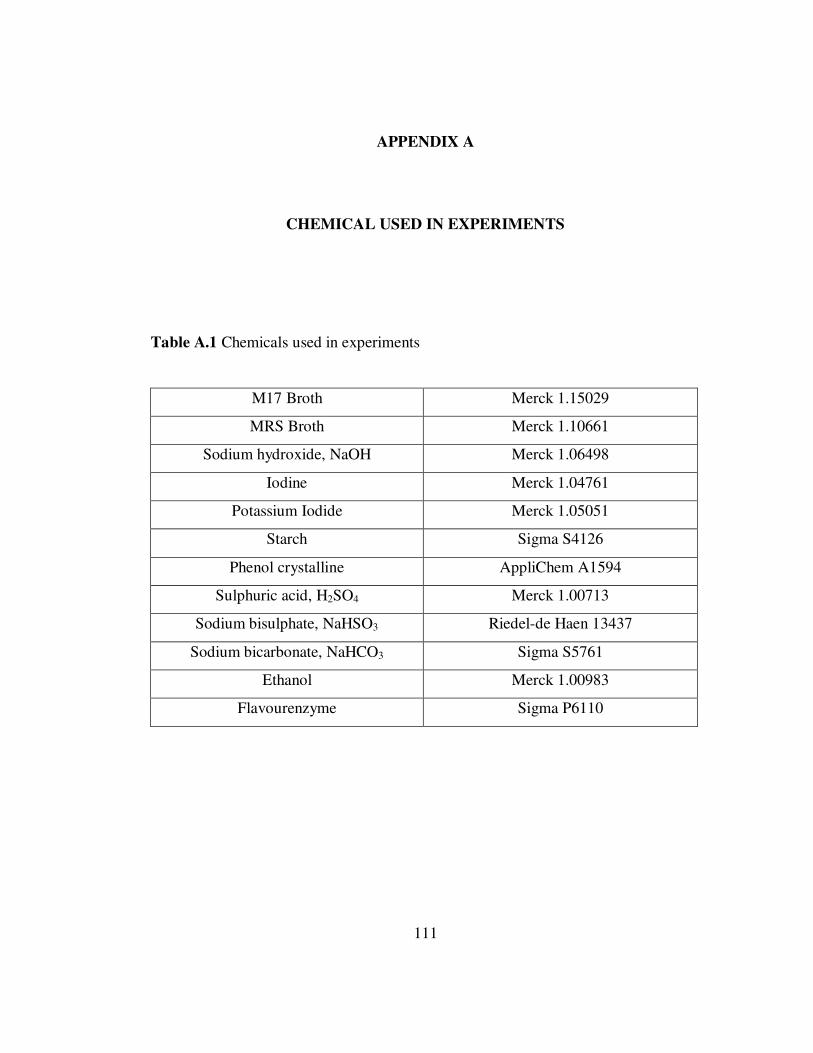
Table A.1 Chemicals used in experiments………………………………………....111
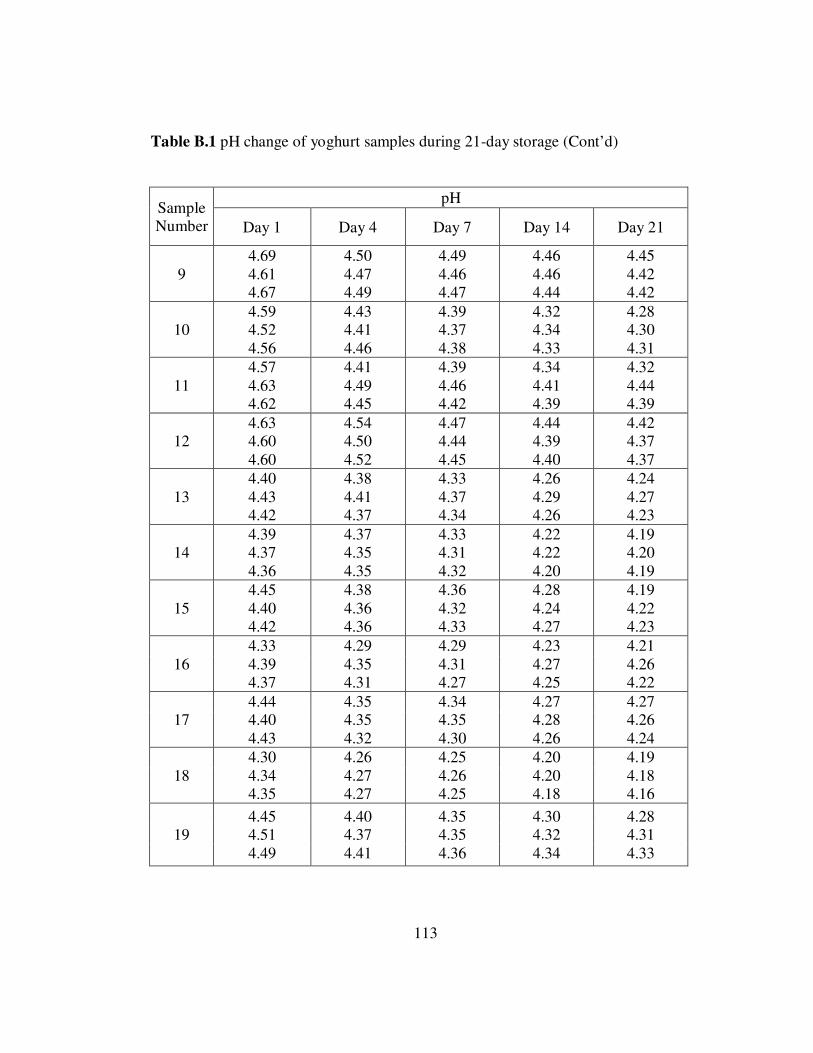
Table B.1 pH change of yoghurt samples during 21-day storage……………..…...112
Table C.1 Titratable acidity of yoghurt samples during 21-day storage……..........116
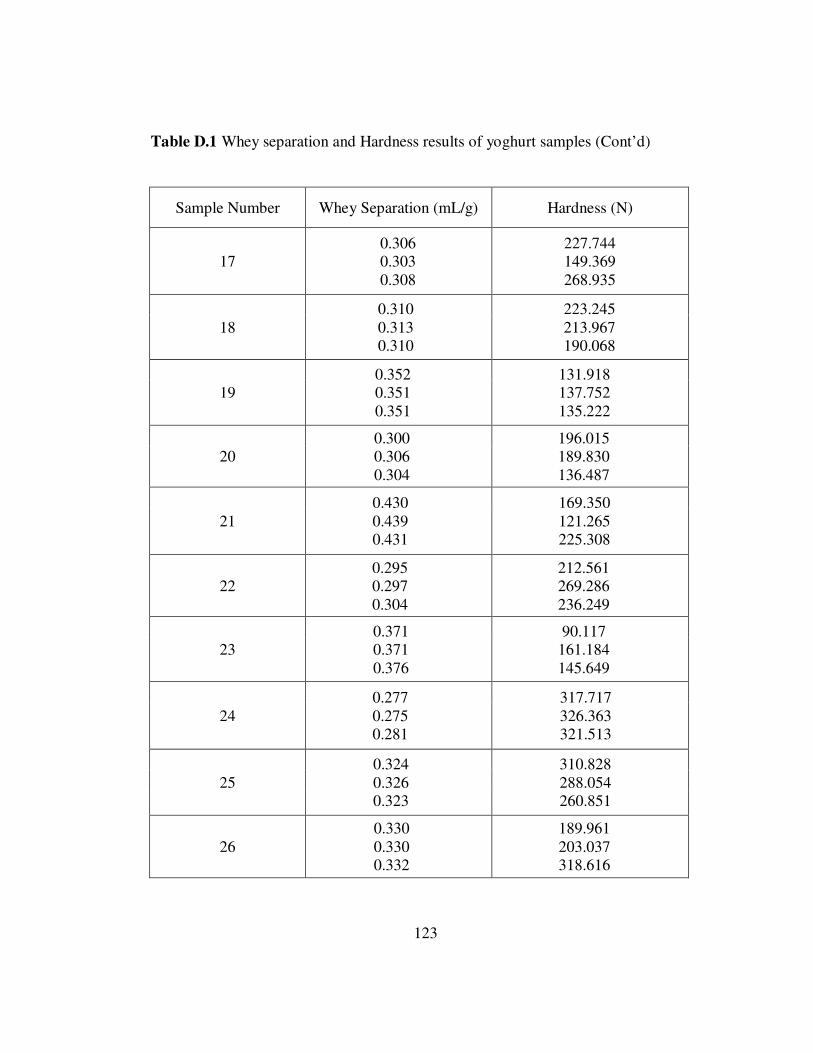
Table D.1 Whey separation and hardness results of yoghurt samples…..……........121
Table E.1 Exopolysaccharide and acetaldehyde content of yoghurt samples……..127
Table F.1 ANOVA Table for the effect of species on post-acidification of yoghurt
samples……………………………………………………………………………..129
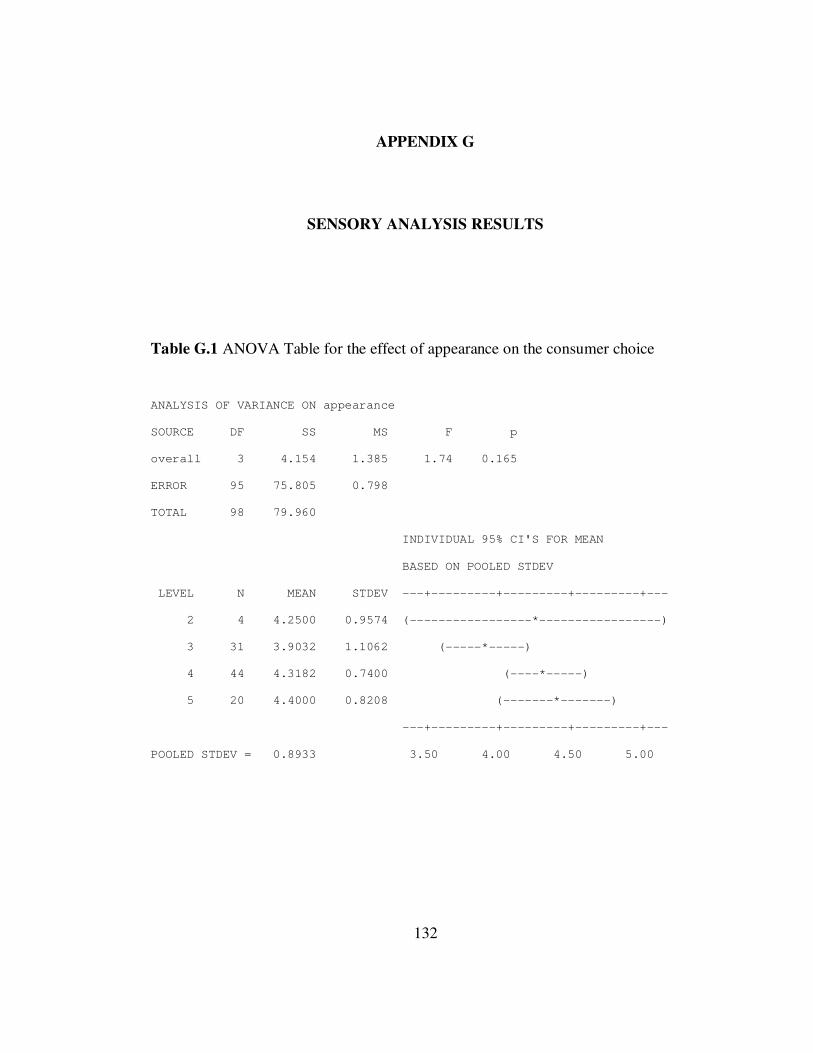
Table G.1 ANOVA Table for the effect of appearance on the consumer
choice.........................................................................................................................132
Table G.2 ANOVA Table for the effect of odor on the consumer choice………....134
Table G.3 ANOVA Table for the effect of flavor on the consumer choice..……....135
Table H.1 ANOVA Table for the effect of EPS content on hardness of yoghurt
samples………………………………………………………………………….….137
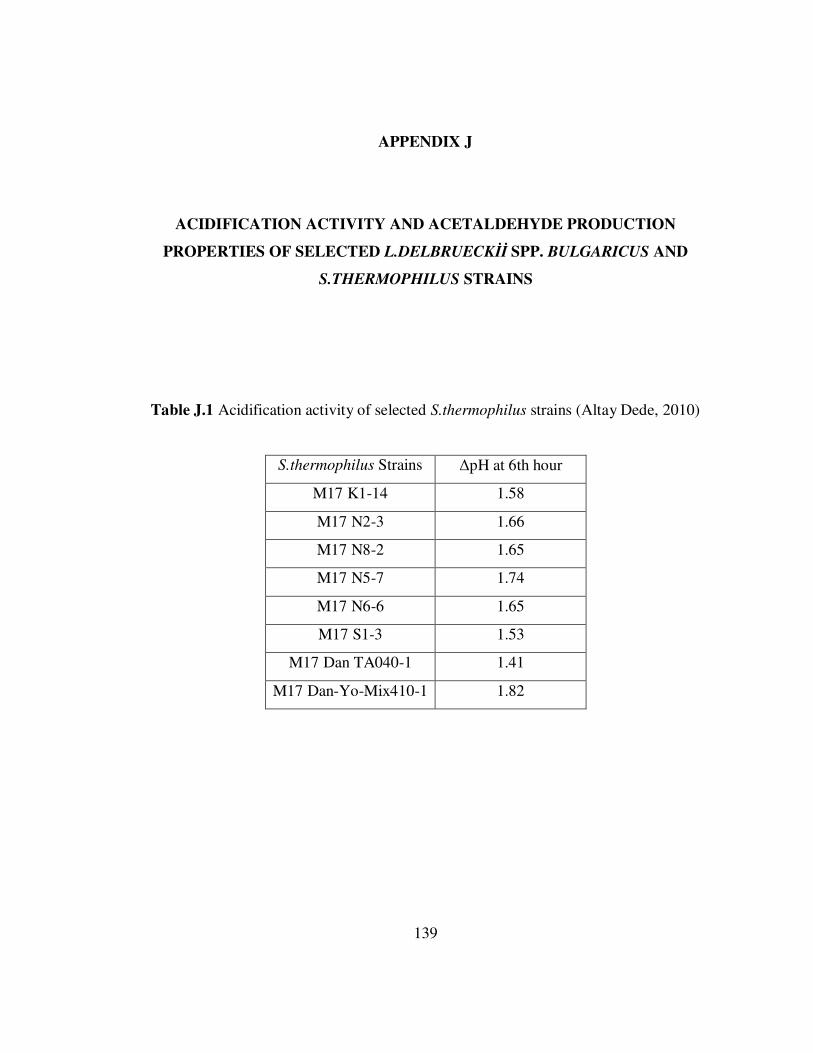
Table J.1 Acidification activity of selected S.thermophilus strains………..….…..139
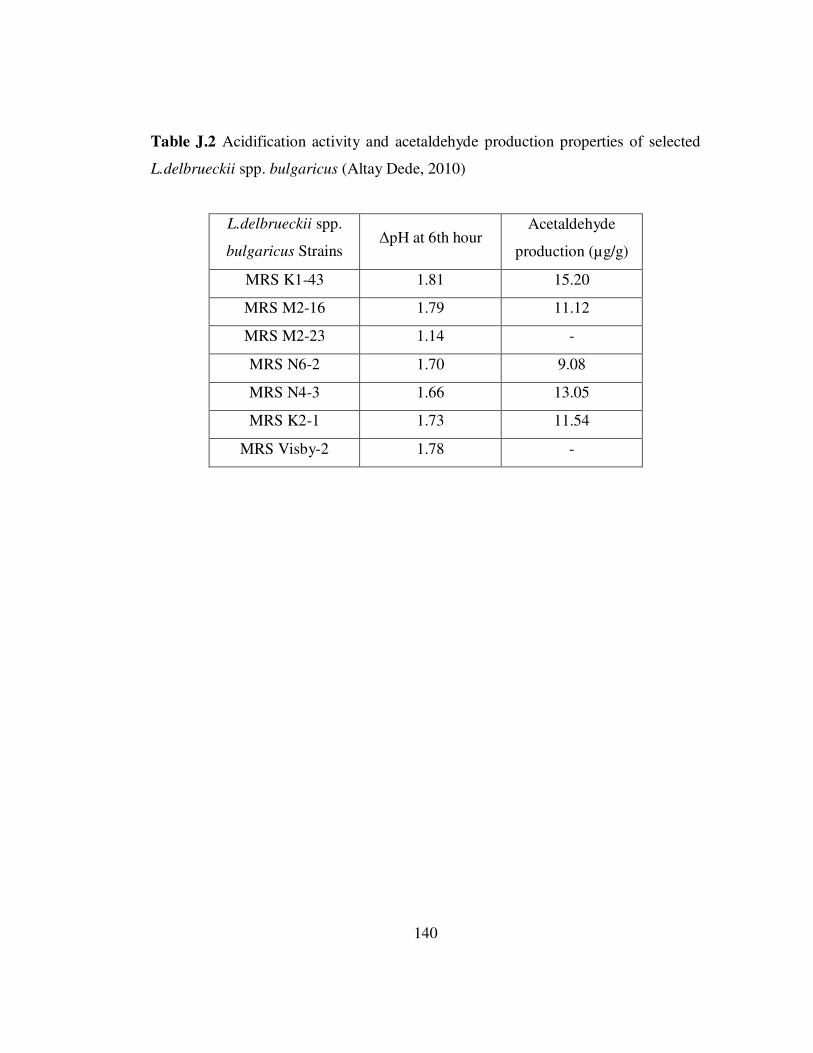
Table J.2 Acidification activity and acetaldehyde production properties of selected
L.delbrueckii spp. bulgaricus……………………………………………………....140
Page 16
xvi
LIST OF FIGURES
FIGURES
Figure 1.1 Classification of fermented milk….............................................................4
Figure 1.2 Flow chart of set yoghurt and stirred yoghurt production……………......7
Figure 1.3 Single and mixed strain yoghurt cultures propagation at 40⁰C in skimmed
milk with 2% inoculation ……………………………………………………………26
Figure 1.4 Electron micrograph of Streptococcus thermophilus by Robert Hutkins,
University of Nebraska…………………………………….……….………………..27
Figure 1.5 Electron micrograph of Lactobacillus delbrueckii spp. bulgaricus
University of Wisconsin …………………………………………………………….28
Figure 1.6 Use of starter culture systems………...……………………………….....29
Figure 1.7 Lactose metabolism of S. thermophilus which results in production of
EPS…………………………………………………………………………………..40
Figure 1.8 Different pathways of pyruvate……………………………….………...43
Figure 1.9 Acetaldehyde production pathways………...………………………...…46
Figure 1.10 Two major pathways to produce acetaldehyde in yoghurt………..…...47
Figure 3.1 Determination of pH and titratable acidity, whey separation and textural
properties of yoghurt samples and comparison with yoghurt samples produced by
commercial strains………………………………………………………………..….66
Figure 3.2 Determination of chemical properties and consumer acceptance of yoghurt
samples and comparison with yoghurt samples produced by commercial
strains……………………………………………………………………………..….67
Page 17
xvii
Figure 3.3 Determination of the effect of freeze-drying of LAB on yoghurt properties
and comparison of these properties with a yoghurt sample produced by using a
commercial freeze-dried culture……………..……………………………………....68
Figure 3.4 pH values of yoghurt samples at the end of the storage period which was
21. day…………………………………………..…………………………...……….77
Figure 3.5 Total titratable acidity (TTA) values of yoghurt samples at the end of the
storage period which was 21.day……………………….……………………...…….78
Figure 3.6 Effect of L.delbrueckii spp. bulgaricus and S.thermophilus strains on pH
value………………………………………………………………………………….80
Figure 3.7 Peak forces of yoghurt samples which is called as hardness of
yoghurt………………………………………………………..……..……………….82
Figure 3.8 Separation of whey from yoghurt samples………………….……….…..83
Figure 3.9 Exopolysaccharide content of yoghurt samples……….………………...84
Figure 3.10 Comparison of hardness and EPS content of yoghurt….………………85
Figure 3.11 Acetaldehyde amount of yoghurt samples………………….………….87
Figure 3.12 Total scores of yoghurt samples……….……………….………………88
Figure 3.13 pH values of yoghurt samples at the end of the 21-day storage….……91
Figure 3.14 Total titratable acidity results of yoghurt samples at the end of the 21-
day storage…………………………………………………………………………...92
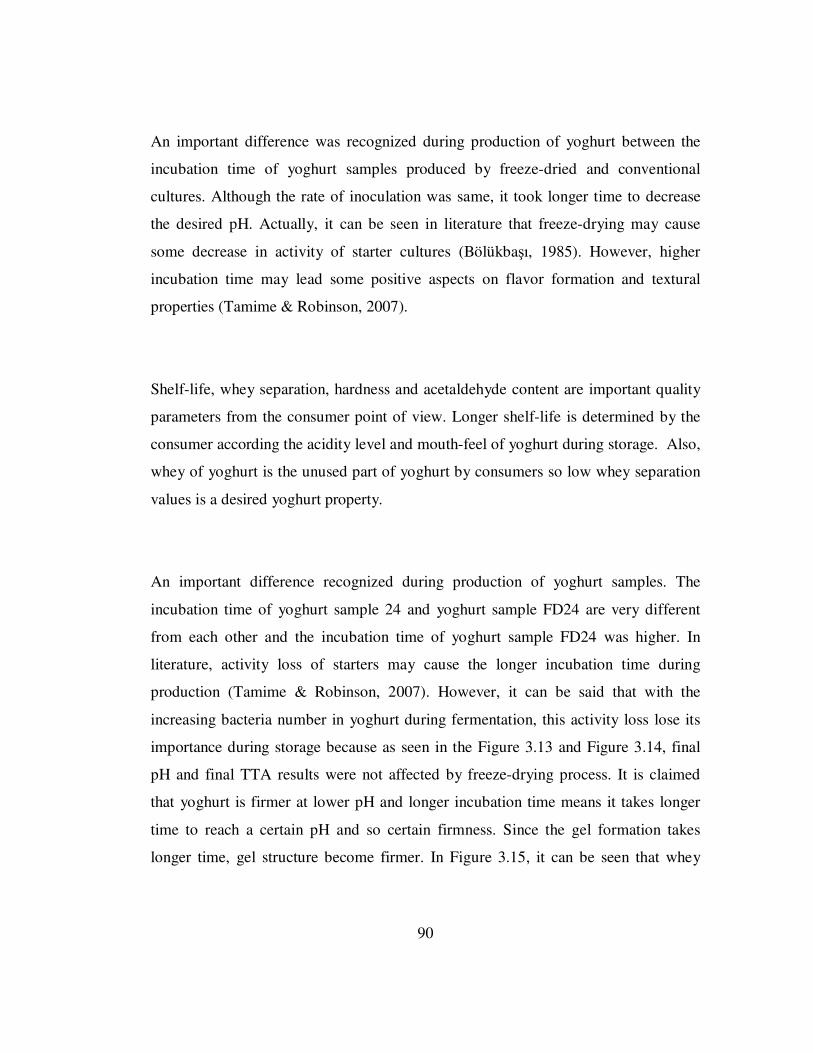
Figure 3.15 Syneresis results of yoghurt samples……………………………...........93
Figure 3.16 Hardness of yogurt samples and effect of freeze-drying on textural
properties…………………………………………………………………….........…94
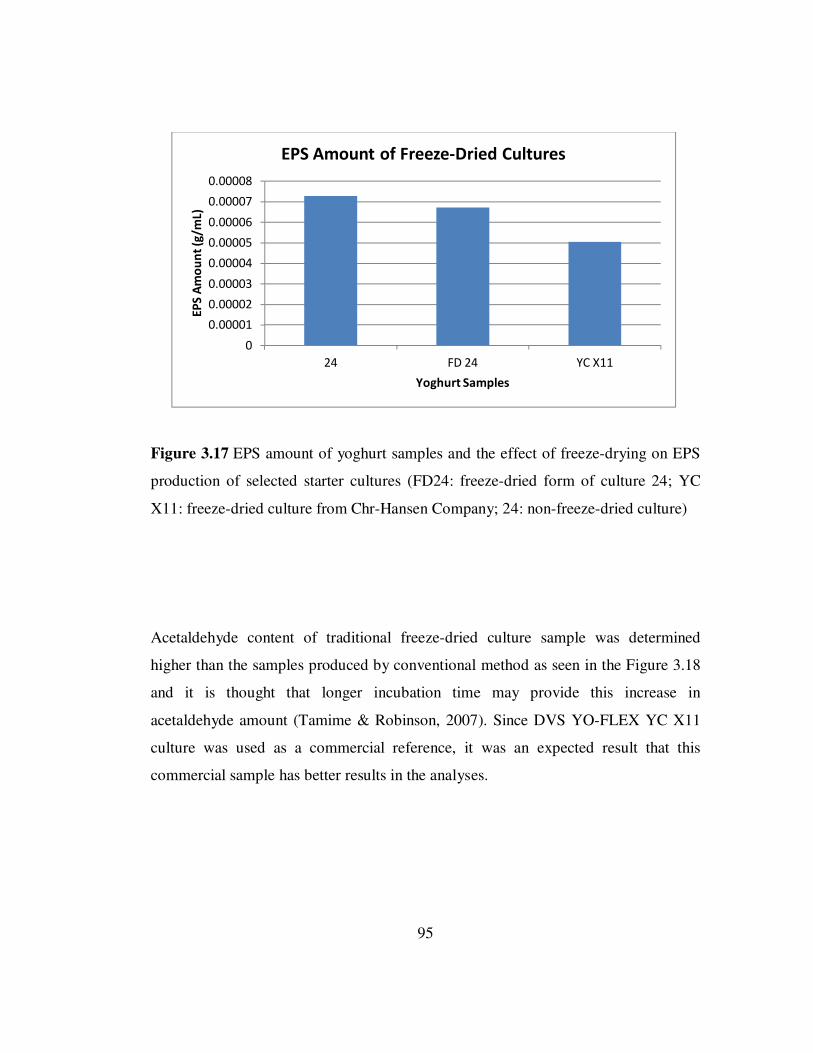
Figure 3.17 EPS amount of yoghurt samples and the effect of freeze-drying on EPS
production of selected starter cultures…………………………………………….…95
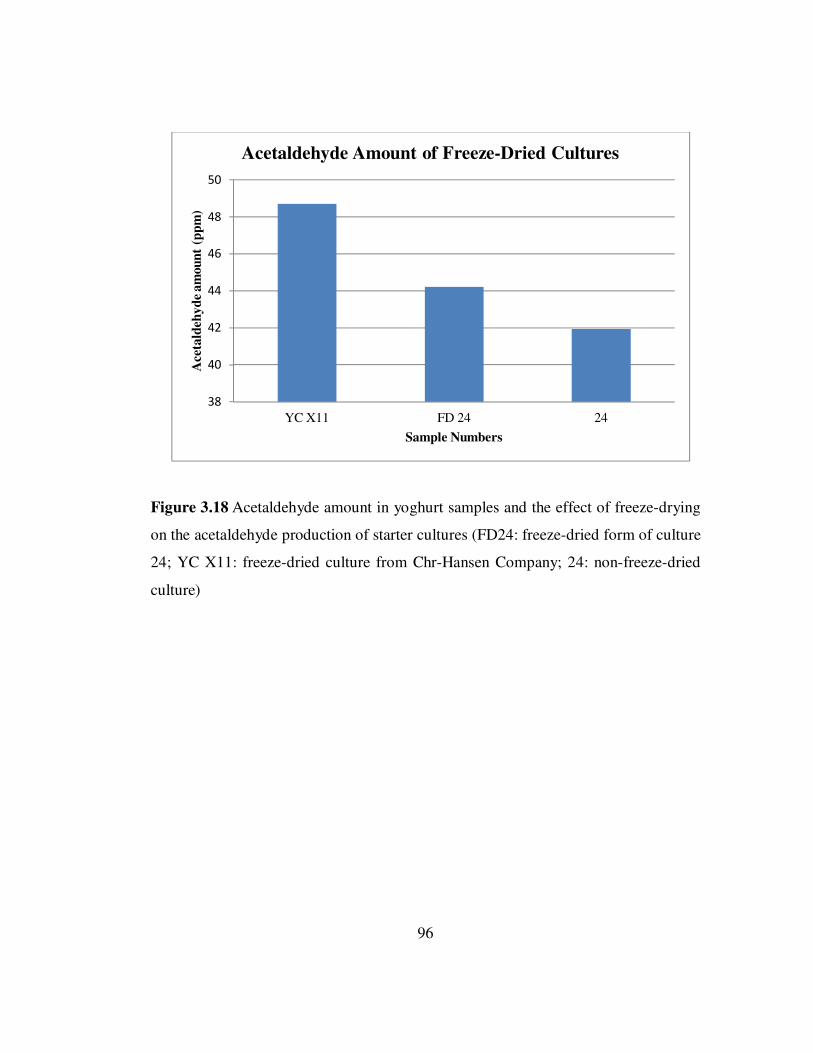
Figure 3.18 Acetaldehyde amount in yoghurt samples and the effect of freeze-drying
on the acetaldehyde production of starter cultures…………………………………..96
Figure E.1 Glucose curve used in EPS quantification……………….…….........…126
Figure G. 1 Sensory analysis questionnaire…………………………………..……136
Page 18
1
CHAPTER I
INTRODUCTION
1.1 Milk
Milk is one of the most valuable and natural food materials. It is a white opaque
liquid produced by the mammary glands of mammals to feed the newly born before
they are able to digest other types of food. According to evidence, animal milk has
been used as a food material since around 5000 BC (McGee, 2004).
The basic components of milk are water, fat, lactose, protein, mineral substances,
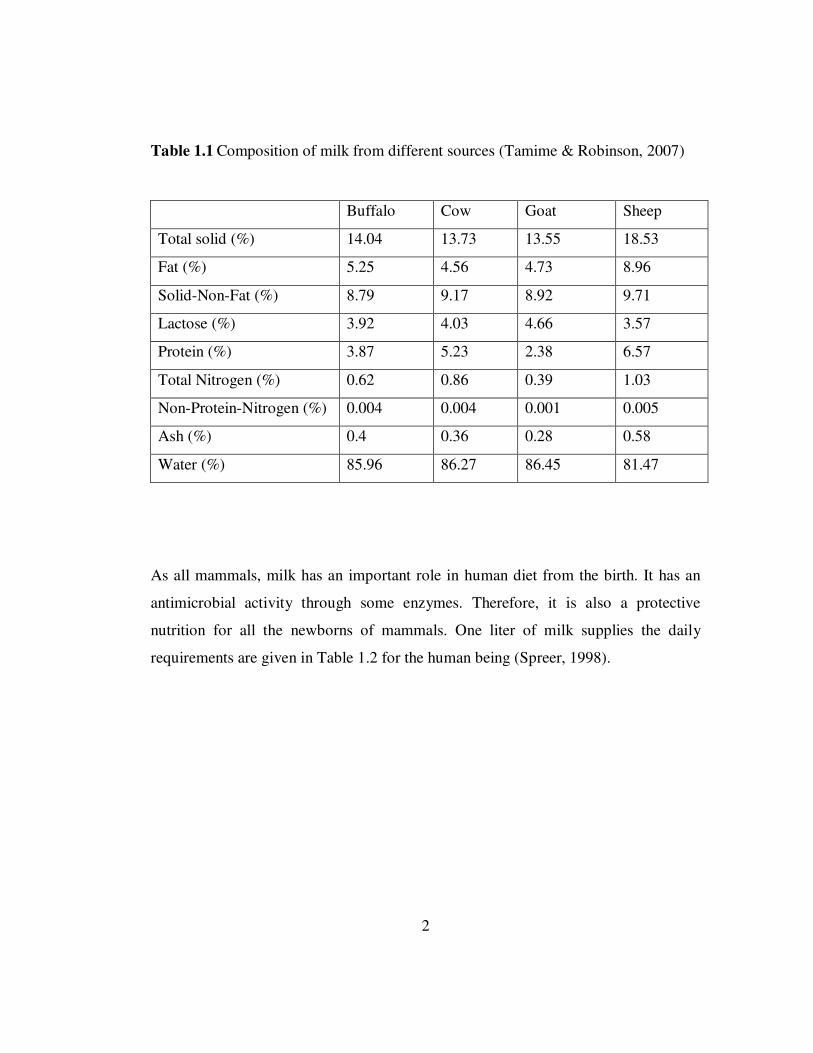
organic acids and vitamins. Milk is collected from different sources; namely, cow,
buffalo, goat, yak, sheep, horse and camel so milk may have different compositions
depending on the source and the compositions are given in Table 1.1. In addition, the
source and content of milk affect the pH. Milk has a pH ranging from 6.3 to 6.9
(Kanwal, Ahmed, & Mirza, 2004).
Page 19
2
Table 1.1 Composition of milk from different sources (Tamime & Robinson, 2007)
Buffalo Cow Goat Sheep
Total solid (%) 14.04 13.73 13.55 18.53
Fat (%) 5.25 4.56 4.73 8.96
Solid-Non-Fat (%) 8.79 9.17 8.92 9.71
Lactose (%) 3.92 4.03 4.66 3.57
Protein (%) 3.87 5.23 2.38 6.57
Total Nitrogen (%) 0.62 0.86 0.39 1.03
Non-Protein-Nitrogen (%) 0.004 0.004 0.001 0.005
Ash (%) 0.4 0.36 0.28 0.58
Water (%) 85.96 86.27 86.45 81.47
As all mammals, milk has an important role in human diet from the birth. It has an
antimicrobial activity through some enzymes. Therefore, it is also a protective
nutrition for all the newborns of mammals. One liter of milk supplies the daily
requirements are given in Table 1.2 for the human being (Spreer, 1998).
Page 20
3
Table 1.2 Daily requirements supplied from one liter of milk (Spreer, 1998)
Nutrients and Energy Percent of daily requirement (%)
Calcium 100
Phosphorus 67
Vitamin A 30
Vitamin B1 27
Vitamin B2 66
Vitamin C 19
Protein 49
Iron 3
Energy 20
Milk is processed to produce lots of products. These processes are generally used to
make shelf-life longer. Yoghurt, cheese, butter, milk powder, cream, kefir can be
counted among the milk products.
1.2 Fermentation and Fermented Milk Products
Fermentation is a method used for thousands of years to provide longer shelf life to
perishable foods and also different flavor. It is known that fermented foods have been
made since Neolithic times. The first examples of fermented foods are wine, bread
and cheese. In East Asian regions, yoghurt and other fermented milk products,
traditional alcoholic beverages, vinegar and pickles followed these examples
Page 21
4
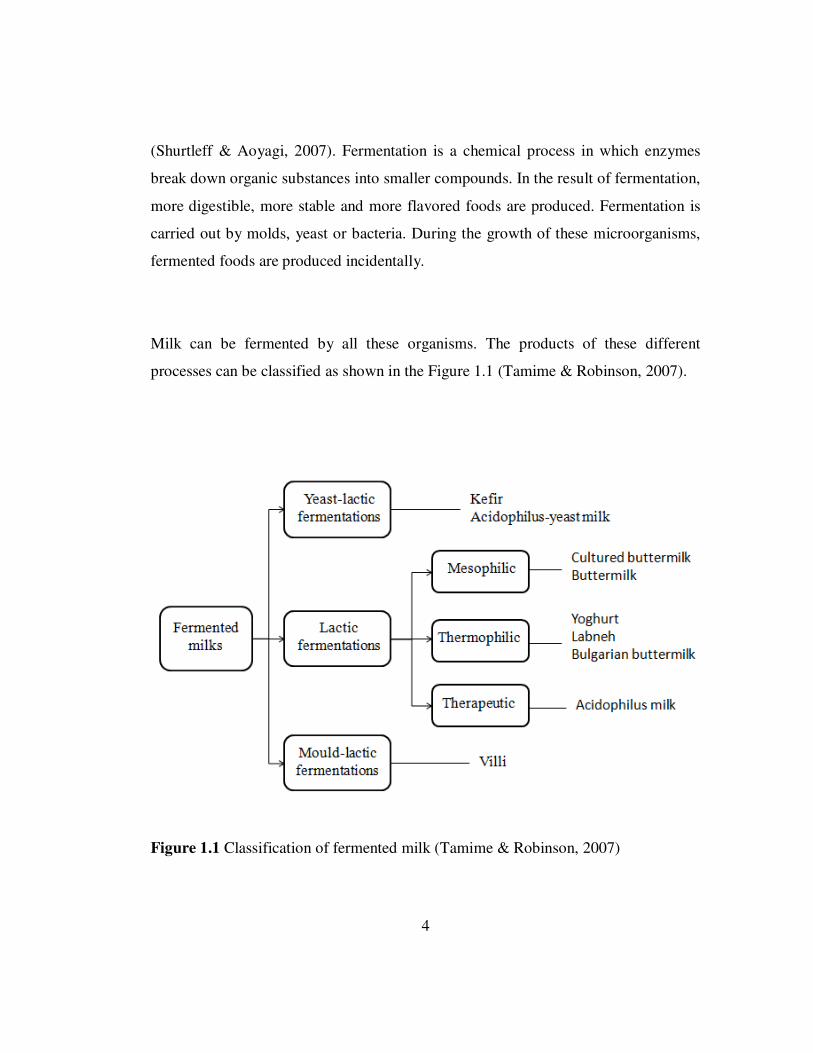
(Shurtleff & Aoyagi, 2007). Fermentation is a chemical process in which enzymes
break down organic substances into smaller compounds. In the result of fermentation,
more digestible, more stable and more flavored foods are produced. Fermentation is
carried out by molds, yeast or bacteria. During the growth of these microorganisms,
fermented foods are produced incidentally.
Milk can be fermented by all these organisms. The products of these different
processes can be classified as shown in the Figure 1.1 (Tamime & Robinson, 2007).
Figure 1.1 Classification of fermented milk (Tamime & Robinson, 2007)
Page 22
5
1.3 Yoghurt
Yoghurt is possibly the oldest fermented milk product (Harper & Hall, 1981). It is
obtained from lactic fermentation of milk by Streptococcus thermophilus and
Lactobacillus delbrueckii spp. bulgaricus. It is thought that the origin of yoghurt was
Middle East (Tamime & Robinson, 2007).
Yoghurt has characteristics between cultured milk and semi-soft cheese (Webb &
Whittier, 1970). Texture of yoghurt mostly depends on the strains of lactic acid
culture and content of the milk.
Yoghurt, similar to milk, is an excellent source of protein, calcium, phosphorus,
riboflavin, thiamin, vitamin B12, folate, niacin, magnesium and zinc. Since lactose in
milk is converted into lactic acid during fermentation, lactose intolerant people can
consume yoghurt without any adverse effect. In addition, yoghurt consumption
causes a small increase of stomach pH and this reduces the risk of the pathogen
passage and the effects of low gastric juice secretion problem.
1.4 Economical Aspects
Traditional product demand decreased by improvement in cooling technology.
However, worldwide yoghurt consumption statistics show significant increase
between 1975-2000 (Akın, 2006). In Turkey, 45% of raw milk is processed in urban
areas, 40% is processed in small size dairy houses without technological machinery
Page 23
6
and only 25% is processed in modern factories according to regulations and hygienic
conditions. In European Union, this ratio is about 90-95% (Akın, 2006).
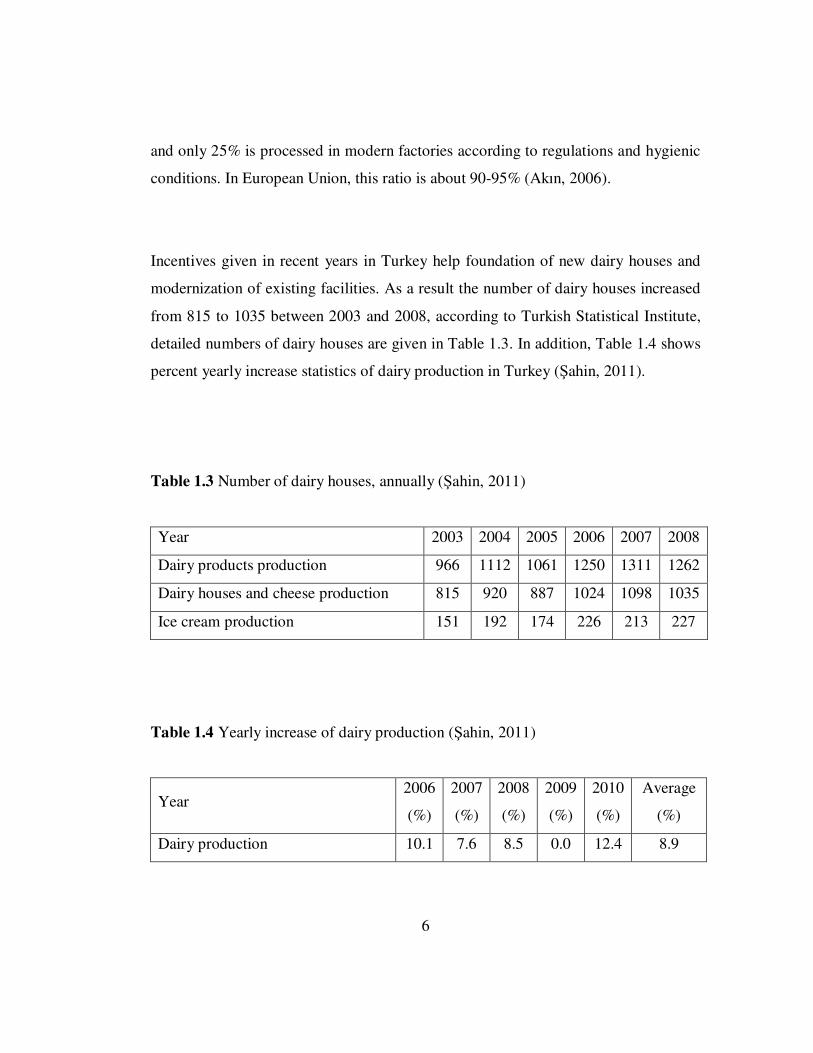
Incentives given in recent years in Turkey help foundation of new dairy houses and
modernization of existing facilities. As a result the number of dairy houses increased
from 815 to 1035 between 2003 and 2008, according to Turkish Statistical Institute,
detailed numbers of dairy houses are given in Table 1.3. In addition, Table 1.4 shows
percent yearly increase statistics of dairy production in Turkey (Şahin, 2011).
Table 1.3 Number of dairy houses, annually (Şahin, 2011)
Year 2003 2004 2005 2006 2007 2008
Dairy products production 966 1112 1061 1250 1311 1262
Dairy houses and cheese production 815 920 887 1024 1098 1035
Ice cream production 151 192 174 226 213 227
Table 1.4 Yearly increase of dairy production (Şahin, 2011)
Year 2006
(%)
2007
(%)
2008
(%)
2009
(%)
2010
(%)
Average
(%)
Dairy production 10.1 7.6 8.5 0.0 12.4 8.9
Page 24
7
1.5 Yoghurt Manufacturing
In industry, yoghurt generally produced in two types, namely, set yoghurt and stirred
yoghurt. Flow chart for each yoghurt production is given in Figure 1.2 (Walstra,
Wouters, & Geurts, 2006).
Figure 1.2 Flow chart of set yoghurt and stirred yoghurt production (Walstra, Wouters, & Geurts, 2006)
Page 25
8
Set yoghurt is made of concentrated milk. It is firstly packaged and then incubated.
After fermentation, a firm gel is obtained and maintained. However, stirred yoghurt is
made generally non-concentrated milk and fermented in bulk. The formed gel after
fermentation is stirred to get smooth and pourable yoghurt. In addition, between these
two yoghurts there is a microbiological difference because there are only certain
strains that can reach the correct consistency and thickness after stirring. The
disadvantage of stirred yoghurt is that, at low temperature aroma compounds in
yoghurt is produced less amount. Therefore, incubation temperature and time should
be designed the same as set yoghurt (Walstra, Wouters, & Geurts, 2006).
According to Tamime and Robinson (2007) and Turkish Standard (TS 10935/ April
1993), yoghurt manufacturing can be described as follow. In addition to yoghurt
manufacturing rules, Turkish Standard 10935 also determines the content of yoghurt.
According to TS 10935, the use of any other materials than milk, milk powder, milk
fat and starter culture during yoghurt production are forbidden.
Standardization: In industry, fat content and non-fat-solid content of milk are
standardized for a good and standard quality yoghurt production. Minimum fat
content for normal yoghurt is 3%, for low-fat yoghurt is 1.5% and for non-fat yoghurt
is lower than 1.5%. In addition, non-fat-solid content should be minimum 12% in
commercial yoghurt (TS 1330/February 1999). To maintain required fat content,
cream is removed or added to the milk (Tamime & Robinson, 2007). Non-fat solid
content can be adjusted in several ways. One of the most used methods is evaporation
in which water is removed from milk under pressure so total solid content of milk
increases. The other way is adding skim milk powder to the milk. Also, membrane
Page 26
9
filtration methods or condensed milk addition are other ways to increase the non-fat-
solid content (TS 10935/April 1993).
Homogenization: It is applied to prevent separation of fat from the milk, especially
during fermentation (Tamime & Robinson, 2007). Also, it is a good process for
mixing the milk content after standardization step. Homogenization causes some
chemical changes in milk. First, due to the reduced fat globule size casein micelles
adsorbs fat and suspended matter volume increases and this increases the viscosity.
Then, due to increase in total fat surface area, lipolysis increases. Also, cream line
formation is prevented because of the prevention of fat separation from milk.
Additionally, homogenized milk is seen whiter because small fat globules reflect and
scatter the light. However, foaming is a disadvantage of homogenization. During
homogenization, phospholipids are transferred to the skimmed milk part and this
cause foaming while pumping to the fermentation tanks (Walstra, Wouters, & Geurts,
2006).
Heat treatment: Heat treatment is applied to kill pathogenic organisms in raw milk.
Different time temperature relations can be used according to raw material, product
and process requirements. In yoghurt production, pasteurization is made at 80-85⁰C
for 20-30 minutes or 90-95⁰C for 3-5 minutes (TS 10935/April 1993). This process is
called high pasteurization and destroys all vegetative cells but bacterial spores
remain. Whey proteins are denatured and most enzymes are inactivated except
bacterial proteinases and lipases. According to researches, pasteurization improves
gel formation. Since in heated milk casein micelles form a chain matrix and maintain
a good distribution of protein all over the yoghurt, aqueous phase is stuck in this
Page 27
10
matrix. Therefore, syneresis is not likely and coagulation is firmer than unheated milk
(Tamime & Robinson, 2007).
Inoculation: After pasteurisation, milk is cooled to 42-45⁰C. Mixed culture, which
contains S.thermophilus and L.delbrueckii subsp. bulgaricus with a ratio 1:1, is used
for inoculation. Inoculation rate can vary from 0.5% to 4% (v/v).
Incubation: After inoculation, milk is hold at 42-45⁰C that is the optimum growth
condition for S.thermophilus and L.delbrueckii subsp. bulgaricus mixed culture.
Fermentation is terminated when pH reaches to 4.5-4.6. Fermentation time depends
on inoculation rate and incubation temperature. There are two types of fermentation.
First one is overnight incubation which is done at 30⁰C for 16-18 hours (Tamime &
Robinson, 2007). Second fermentation is done at higher temperature and lower time
(e.g. at 42⁰C for 4-5 hours). This type of fermentation is the commonly used one in
industry because of short production time.
Cooling and storage: In industry multi-stage cooling system is used for yoghurt
process (Tamime & Law, 2001) (White, 1995). Multi-stage cooling is described in
four steps. First step is shock cooling which is cooling from 42⁰C to 30⁰C. In second
stage, called dysgentical stage, product is cooled to 20⁰C. Third stage is lact-less
phase in which product is cooled to 14.5⁰C. Finally, in holding phase, product is kept
at 2-4⁰C until transportation and then consumption. However, according to Tamime
and Law. (2001), in industrial use, the steps of multi-stage cooling are not separated
sharply and some stages are combined.
Page 28
11
1.6 Components of Yoghurt and Effects on Health
The constituents of food materials are used for the determination of their nutritional
values. Since milk is a very valuable and complete food, yoghurt becomes nutritive
food stuff. Although the composition of milk does not significantly change during
fermentation, lots of components chemically change and it is considered that these
changes give certain beneficial effects to yoghurt (Walstra, Wouters, & Geurts,
2006). Table 1.5 shows the components of full-fat milk and yoghurt and non-fat milk
and yoghurt (Akın, 2006).
Page 29
12
Table 1.5 Content of full-fat and non-fat milk and yoghurt (100 g) (Akın, 2006)
Components Unit Full-fat
milk
Full-fat
yoghurt
Non-fat
milk
Non-fat
yoghurt
Energy Kcal 68 70 35 39
Protein G 3.3 3.8 3.5 4.4
Fat G 3.8 3.8 0.1 0.1
Carbohydrates G 4.7 4.6 4.8 4.9
Lactic acid G 0 0.8 0 1.0
Potassium mg 157 157 150 187
Calcium mg 120 120 123 143
Phosphorus mg 92 92 97 109
Magnesium mg 12 12 14 14
Sodium mg 48 48 53 57
Iodine mg 0.46 0.46 0.45 0.44
Chlorine mg 102 102 100 121
Vitamin A µg 30 29 - 0.8
Vitamin B2 µg 180 180 170 180
Niacin µg 90 90 90-100 92
Pantothenic acid µg 350 350 280 360
Vitamin B6 µg 46 46 50 47
Biotin µg 3.5 3.5 1.5 3.6
Folic acid µg 0.29-6.88 1.0 - 0.5
Vitamin B12 µg 0.42 0.09 0.3 0.43
Vitamin C mg 1.7 1.0 0.23-2 1-2.5
Page 30
13
1.6.1 Total Solid Content
Total solid content expresses the amount of lactose, other carbohydrates, fat, proteins
and minerals in milk. Minimum solids-not-fat (SNF) content depends on legal
standards. Existing legal standards require 8.2 - 8.6 % SNF content (TS 1330, 1999).
This minimum limit is applied to protect the consumers’ rights. This is approximately
same with the SNF content of milk. From producer point of view, total solid content
of yoghurt has an important role on consistency and viscosity of yoghurt.
According to Tamime’s research in 1977, increasing total solid content in yoghurt
from 12 % to 20 % maintains the higher consistency and viscosity values. Since this
increase is less between 16 % and 20 % solid content, generally up to 16 % solid
content is used for yoghurt production (Tamime & Robinson, 2007). On the other
hand, if total solid content is above 25 %, because of less amount of available water
content, propagation of some starter cultures strains might reduce (Patel &
Chakraborty, 1985). Optimum total solid content for yoghurt starter cultures, S.
thermophilus and L. delbrueckii subsp. bulgaricus, are 12 % and 14 %, respectively
(Al-Dabbagh & Allan, 1989).
There are different ways to increase the total solid content of yoghurt milk and these
can be listed as below (Akın, 2006):
• Boiling of milk
• Milk concentration by vacuum evaporation
Page 31
14
• Membrane filtration (ultra-filtration, reverse-osmosis)
• Milk powder addition
• Whey concentrate or whey powder addition
• Whey protein concentrate or whey protein powder addition
• Casein addition
• Non-milk-protein addition
• Stabilizer or emulsifier addition
1.6.2 Lactose
In yoghurt, there are many types of monosaccharide and disaccharide but in trace
amount. However, lactose content is very high even after fermentation since the main
sugar in milk is lactose. Lactose content in milk, which is 4.8%, decreases to 2.5-
2.6% in yoghurt. It cannot be allowed hydrolysis of all lactose in milk by lactic acid
bacteria because as an end product of hydrolysis, lactic acid is produced and
decreases the pH of yoghurt to the unacceptable levels (Walstra, Wouters, & Geurts,
2006). However, remaining lactose in yoghurt does not show the same
discomfortability with the lactose in milk on people who are lactose-intolerant or
lactose maldigestor.
Lactose intolerance can be described as the inability of human to metabolize lactose.
At birth, babies can secrete β-galactosidase enzyme and break down lactose into
glucose and galactose. Since milk consumption decreases after childhood, secretion
of this enzyme gets slower or stops. Therefore some problems rise after consumption
in milk, such as abdominal bloating, cramp and diarrhea. Although, yoghurt consists
Page 32
15
high amount of lactose, it does not cause problems in lactose-intolerant. Different
researches showed that after ingestion of yoghurt lactic acid bacteria continue to
metabolize lactose (Gallagher, Molleson, & Caldwell, 1974). The researchers who
have worked on surviving of lactic acid bacteria until small intestine, showed that the
yoghurt curd protect strains from gastric digestion so lactic acid bacteria can survive
and break down lactose until small intestine (Pochart, Dewit, Desjeux, & Bourlioux,
1989). In addition to that, in small intestine, lactic acid bacteria cells autolysis and
lactase in the cell is released into small intestine and helps the digestion of lactose
(Martini, Bollweg, Lewitt, & Savaiano, 1987).
1.6.3 Proteins
Milk is a valuable dietary source also from the point of view of proteins. Milk
includes caseins (α-La), whey proteins (β-Lg) and essential amino acids (Tamime &
Robinson, 2007). The difference between protein amounts of milk and yoghurt is
caused by standardization because in this step milk is condensed to increase the total
solid content. In addition to that, milk protein digestibility increases because of
proteolytic activity of starter cultures during fermentation (Breslaw & Kleyn, 1973).
Thus, daily protein requirement can be provided by yoghurt with fewer amounts than
milk as, 200-250 ml yoghurt per / day (Altschul, 1965).
Proteolysis ability, rate and type of substrate strictly depend on the strains of starter
cultures. For example, while enzymes of L.delbrueckii spp. bulgaricus show the
proteolytic activities on casein molecules, enzymes of S.thermophilus work on the
Page 33
16
intermediate products produced during casein hydrolysis (Poznanski, Lenoir, &
Mocquot, 1965).
Proteolytic activity maintains some advantages to yoghurt. Firstly, some amounts of
free amino acids, which are given in Table 1.6, formed during fermentation are used
for growth of starter cultures (Tamime & Deeth, 1980). Secondly, as mentioned
before, protein digestibility increases by means of protein degradation by enzymes
(McLaughlan, Anderson, Widdowson, & Coombs, 1981). In addition, some people
have an allergy against milk proteins and protein degradation caused by fermentation
and heat treatment prior to fermentation may decrease these reactions (Akın, 2006).
Page 34
17
Table 1.6 Free amino acid content of cow’s milk and yoghurt (mg per 100 mL) (Tamime & Deeth, 1980)
Amino acid Milk Yoghurt
Alanine 0.16-0.64 1.17-3.80
Arginine 0.16-0.96 0.70-1.39
Aspartic acid 0.23-0.52 0.70-1.20
Glycine 0.30-0.53 0.28-0.45
Glutamic acid 1.48-3.90 4.80-7.06
Histidine 0.11 0.80-1.70
Isoleucine 0.06-0.15 0.15-0.40
Leucine 0.06-0.26 0.70-1.82
Lysine 0.22-0.94 0.80-1.11
Methionine 0.05 0.08-0.20
Phenylalanine 0.05-0.13 0.17-0.61
Proline 0.12 5.40-7.05
Serine 0.08-1.35 1.50-2.90
Threonine 0.05-0.26 0.24-0.70
Tryptophan Tr* 0.2
Tyrosine 0.06-0.14 0.18-0.61
Valine 0.10-0.25 0.90-1.86
Total 3.29-10.31 18.77-33.06
* Tr: Trace
Page 35
18
1.6.4 Lipids
Lipids are the most valuable energy source by providing 9 kcal / gram and required
for a balanced diet. In addition to being an energy source, lipids are used in the body
in two ways (Tamime & Robinson, 2007):
• storage fat; composed of saturated fatty acids and used as protector for vital
organs
• structural fat; with proteins forms essential membranes in animal cells
A research conducted with 54 voluntaries shows that consumption of yoghurt in diet
may help decrease serum cholesterol (Hepner, Fried, Jeor, Fusett, & Morin, 1979).
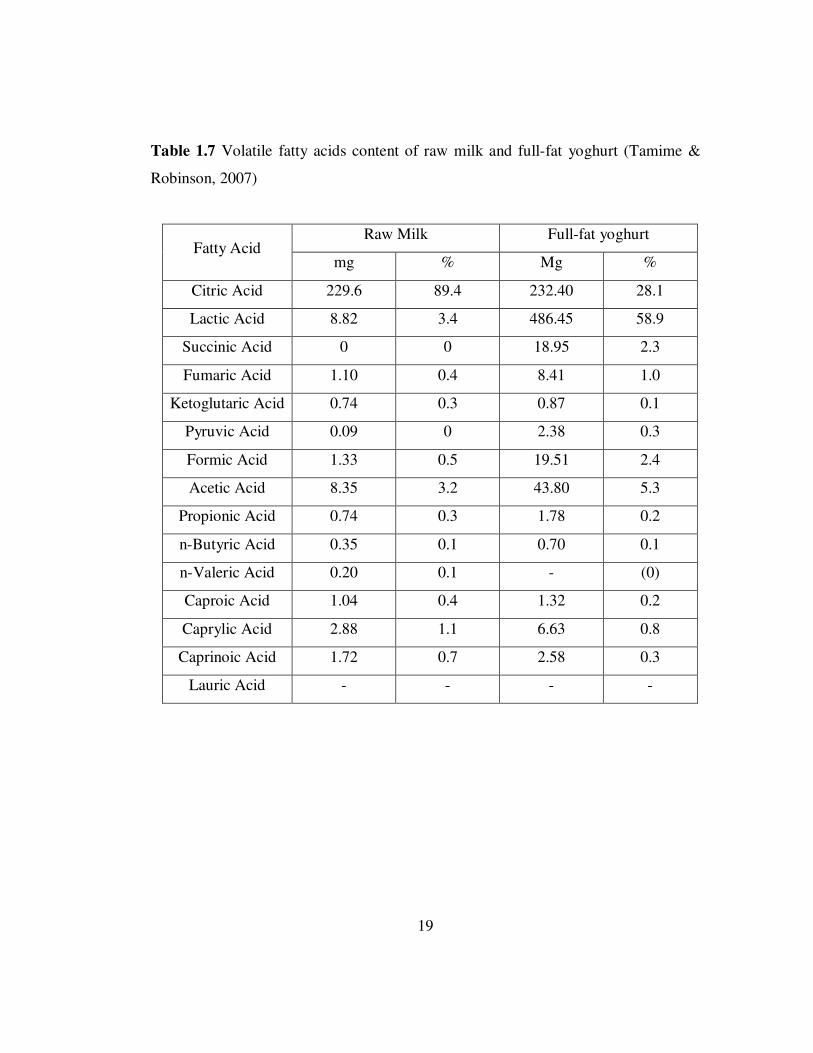
Milk fats are composed of more than 400 different fatty acids which are in the form
of glycerides (Patton & Jense, 1974). These different types of fatty acids contain also
the volatile ones which are shown in Table 1.7 (Yukuchi, Goto, & Okonogi, 1992).
During fermentation and storage, volatile fatty acids in yoghurt show a significant
increase. The level of this increase depends on the used strains, temperature of heat
treatment, incubation temperature and time. Researches claim that L.delbrueckii spp.
bulgaricus strains produce more volatile fatty acids than S.thermophilus strains
during yoghurt fermentation (Tamime & Robinson, 2007). Although these volatile
fatty acids are very small amounts in yoghurt to have nutritional value, these are very
important role in organoleptic properties of yoghurt and so in consumer acceptance.
Page 36
19
Table 1.7 Volatile fatty acids content of raw milk and full-fat yoghurt (Tamime &
Robinson, 2007)
Fatty Acid Raw Milk Full-fat yoghurt
mg % Mg %
Citric Acid 229.6 89.4 232.40 28.1
Lactic Acid 8.82 3.4 486.45 58.9
Succinic Acid 0 0 18.95 2.3
Fumaric Acid 1.10 0.4 8.41 1.0
Ketoglutaric Acid 0.74 0.3 0.87 0.1
Pyruvic Acid 0.09 0 2.38 0.3
Formic Acid 1.33 0.5 19.51 2.4
Acetic Acid 8.35 3.2 43.80 5.3
Propionic Acid 0.74 0.3 1.78 0.2
n-Butyric Acid 0.35 0.1 0.70 0.1
n-Valeric Acid 0.20 0.1 - (0)
Caproic Acid 1.04 0.4 1.32 0.2
Caprylic Acid 2.88 1.1 6.63 0.8
Caprinoic Acid 1.72 0.7 2.58 0.3
Lauric Acid - - - -
Page 37
20
1.6.5 Lactic Acid
S.thermophilus and L.delbrueckii spp. bulgaricus and L.acidophilus are the bacteria
which can catabolise lactose into mainly lactic acid. This reaction can be simplified
into following equation:
C12H22O11 + H2O 4 C3H6O3
Lactose Water Lactic acid
Lactic acid is an important factor for yoghurt production. First of all, it reduces the
pH level of milk to 4.6-4.7. During this decrease, lactic acid converts the colloidal
calcium-phosphate bridges, which maintain the stability of casein micelles, to the
soluble fractions. When these fractions start to diffuse out of the casein micelles,
micelles coagulate and yoghurt gel formation occurs. About pH 5.0 the gel formation
starts and gel firmness reaches the maximum at 4.6 - 4.7 (Tamime & Robinson,
2007). Gel firmness increases with high heat treatment and time in cold storage (Lee
& Lucey, 2003). This formation is also called acid gelation. Loosening of gel network
may be caused by low temperature heat treatment, high incubation temperature and
low inoculation rate. Loosening can be described as whey syneresis on gel surface.
Acid gelation can be shown as follows (Dyachenko, Chemistry of Milk, 1971):
Page 38
21
Ca-caseinate-phosphate complex + lactic acid casein complex
+
Ca-lactate
+
Ca-phosphate
Secondly, lactic acid is required for characteristic yoghurt taste. It gives acidic taste
and helps contribution of aroma compound. Lactic acid can be found in different
forms as L(+), D(-) or DL(±) which are called as isomers. Production of these
isomers during fermentation depends on the strain of lactic acid bacteria (LAB) used.
It is claimed that S.thermophilus is a L(+) lactic acid producer and L.delbrueckii spp.
bulgaricus is a D(-) lactic acid producer (Tamime & Robinson, 2007).
L(+) and D(-) lactic acid content of yoghurt are generally 45-60% and 40-55%,
respectively and the ratio of L(+):D(-) determines the quality of yoghurt with respect
to flavor. For example, L(+):D(-) ratio should be small for a sharp and acidic yoghurt.
1.6.6 Vitamins and Minerals
Vitamins are used as co-factors in metabolic reactions. Fermented milk products can
be thought as vitamin source like milk. However, vitamin contents of fermented milk
products are variable because some LAB strains need especially vitamin B for growth
and some can synthesis this by itself. Thus, yoghurt produced by different strains
include vitamins in different compositions according to the strains (Akın, 2006).
Page 39
22
Smid et al. (2001) , Lin and Young (2000a) (2000b) said that L.delbrueckii spp.
bulgaricus uses riboflavin, folic acid and vitamin B12 in yoghurt for growth so causes
reduction in amounts of these and some strains of S.thermophilus can be assumed as
folic acid producer.
In addition, sensibility of vitamins against the processing conditions like heat
treatment, incubation temperature, time and storage conditions makes the yoghurt
content determination more difficult (Rao & Shahani, 1987). Approximate vitamin
content of yoghurt and comparison of this with milk are given in Table 1.8 (Deeth &
Tamime, 1981).
Page 40
23
Table 1.8 Vitamin content of milk and yoghurt (in 100 g) (Deeth & Tamime, 1981)
Vitamin Milk Yoghurt
Whole Skimmed Full Fat Low Fat
Retinol (µg) 52 1 28 8
Carotene (µg) 21 Tr* 21 5
Thiamin (B1) (µg) 30 40 60 50
Riboflavin (B2) (µg) 170 170 270 250
Pyridoxine (B6) (µg) 60 60 100 90
Cyanocobalamine (B12) (µg) 0.4 0.4 0.2 0.2
Vitamin C (mg) 1 1 1 1
Vitamin D (µg) 0.03 Tr* 0.04 0.01
Vitamin E (µg) 90 Tr* 50 10
Folic acid (µg) 6 5 18 17
Nicotinic acid (µg) 100 100 200 100
Pantothenic acid (µg) 350 320 500 450
Biotin (µg) 1.9 1.9 2.6 2.9
Choline (mg) 12.1 4.8 - 0.6
* Tr: Trace
Since minerals are resistant to processing conditions unlike vitamins, mineral content
does not change during production of yoghurt from milk. Although there are lots of
minerals in yoghurt, calcium and phosphorus are the most important ones for bones.
Milk and fermented milk products are main sources of these elements. Also, yoghurt
is not only the main calcium source for lactose-intolerant people but also its calcium
Page 41
24
can be better absorbed (McKinley, 2005). Researches show that phosphorus,
magnesium and zinc are also absorbed easily from yoghurt (Butriss, 1997). Although
there are different data on calcium content and iron absorption relationship, most of
the researches show that changes in the calcium content of diets have only a small
influence on iron absorption (Lynch, 2000). However, calcium and iron may be taken
at different times of the day as a precaution.
1.7 Yoghurt Starter Cultures
Lactic acid bacteria (LAB) are Gram (+), non-sporulating, catalase-negative, acid-
tolerant, facultative anaerobic, fermentative bacteria (Mozzi, Raya, & Vignolo, 2010).
LAB produce lactic acid from fermentation of carbohydrates and give some
organoleptic, rheological and nutritive properties to the end product (Leroy & de
Vuyst, 2004). In addition to use in fermentation process, they are commonly found in
gastrointestinal and genitourinary tract of human and animals where they have
important role on health such as immunomodulation, intestinal integrity and pathogen
resistance (Vaughan, Heilig, Ben-Amor, & de Vos, 2005).
Dairy starter cultures are LAB added in milk to produce the selected fermented
product. They can produce cheese, fermented milk, cream butter and yoghurt. They
generally classified according to their optimum growth temperature, namely,
mesophilic and thermophilic cultures. Mesophilic cultures have an optimum growth
temperature about 30⁰C. Thermophilic cultures have an optimum growth temperature
about 42⁰C. The most used thermophilic cultures are Streptococcus thermophilus,
Lactobacillus delbrueckii and Lactobacillus helveticus. In yoghurt production,
Page 42
25
Streptococcus thermophilus (S.thermophilus), Lactobacillus delbrueckii spp.
bulgaricus (L.delbrueckii spp. bulgaricus) are used as starter cultures (Mozzi, Raya,
& Vignolo, 2010).
These two cultures are used in combination for yoghurt production because there is a
symbiotic relationship between them and this symbiotic relationship can be seen in
Figure 1.3. In fact, in milk, peptides and amino acid amount is less than required
amount to grow these two organisms. However, L.delbrueckii spp. bulgaricus
releases amino acids like valine, glycine and histidine by the help of its proteolytic
activity. Therefore, L.delbrueckii spp. bulgaricus forms a medium which is
appropriate for the growth of S.thermophilus. Then, S.thermophilus promotes the
growth of L.delbrueckii spp. bulgaricus by producing CO2 and pyruate (Salminen,
von Wright, & Ouwehand, 2004) (Tamime & Robinson, 2007).
During fermentation process, these two bacteria show different growth curve. At the
beginning, S.thermophilus shows a fast growth by the help of L.delbrueckii spp.
bulgaricus but its number decreases as it has low acid production ability and it dies
faster in improving milk acidity. On the contrary, L.delbrueckii spp. bulgaricus
shows an increase in number at high acidity level. Finally, as a result of these two
bacteria’s activity, pH of milk decreases from 6.3 – 6.5 to below 4.6. As a result of
this pH decrease, protein molecules precipitate at isoelectric point that is called
protein coagulation in other words, yoghurt. The activities of these bacteria not only
conduct yoghurt formation but also affect the taste, aroma and texture of yoghurt by
producing especially acetaldehyde, diacetone, acetone, acetic, capric and caprylic
acids, volatile fatty acids and exopolysaccharides.
Page 43
26
Figure 1.3 Single and mixed strain yoghurt cultures propagation at 40⁰C in skimmed
milk with 2% inoculation (Tamime & Robinson, 2007)
1.7.1 Streptococcus thermophilus
S.thermophilus is the only streptococcal species which is associated with food
technology. It is a Gram (+) cocci which is shown in the Figure 1.4 (Doe Joint
Genome Institute). Also, it is a non-motile and facultative anaerobe bacterium.
S.thermophilus is a homofermentative bacterium and a member of alpha-hemolytic
group of viridians. S.thermophilus does not produce endospores and does not have
cytochrome, oxidase, and catalase enzymes. Although, in earlier times,
S.thermophilus was considered as a subspecies of Streptococcus salivarius due to
great DNA-DNA homology values, these are grouped as two different species
Page 44
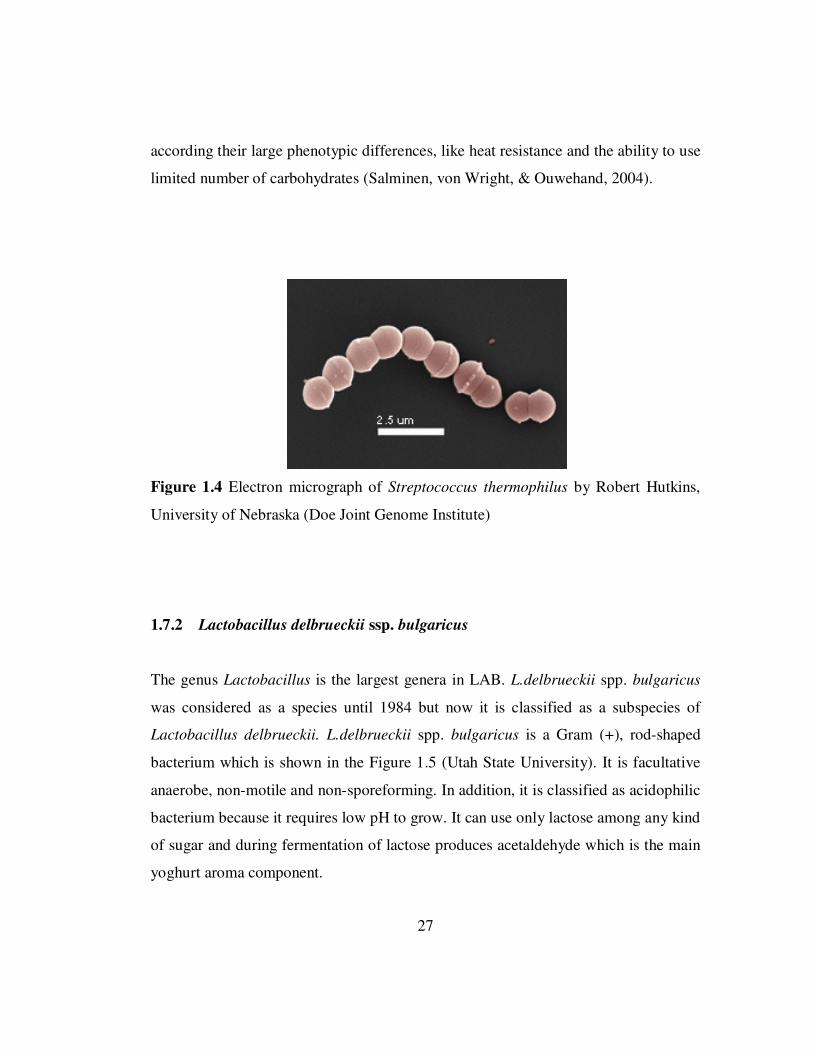
27
according their large phenotypic differences, like heat resistance and the ability to use
limited number of carbohydrates (Salminen, von Wright, & Ouwehand, 2004).
Figure 1.4 Electron micrograph of Streptococcus thermophilus by Robert Hutkins,
University of Nebraska (Doe Joint Genome Institute)
1.7.2 Lactobacillus delbrueckii ssp. bulgaricus
The genus Lactobacillus is the largest genera in LAB. L.delbrueckii spp. bulgaricus
was considered as a species until 1984 but now it is classified as a subspecies of
Lactobacillus delbrueckii. L.delbrueckii spp. bulgaricus is a Gram (+), rod-shaped
bacterium which is shown in the Figure 1.5 (Utah State University). It is facultative
anaerobe, non-motile and non-sporeforming. In addition, it is classified as acidophilic
bacterium because it requires low pH to grow. It can use only lactose among any kind
of sugar and during fermentation of lactose produces acetaldehyde which is the main
yoghurt aroma component.
Page 45
28
Figure 1.5 Electron micrograph of Lactobacillus delbrueckii spp. bulgaricus (Utah
State University)
1.7.3 The Use of Starter Cultures in Dairy Industry
Starter cultures are the most important factors, which can affect the characteristics of
final product, for fermented milk production. Thus, commercial manufacturers
provide variety of starter culture mixtures with various characteristics by using some
production techniques in different forms according to their usage and storage
conditions.
The starter cultures are preserved in small quantities which are called stock cultures
and they are used in dairy production plant according to their starter culture
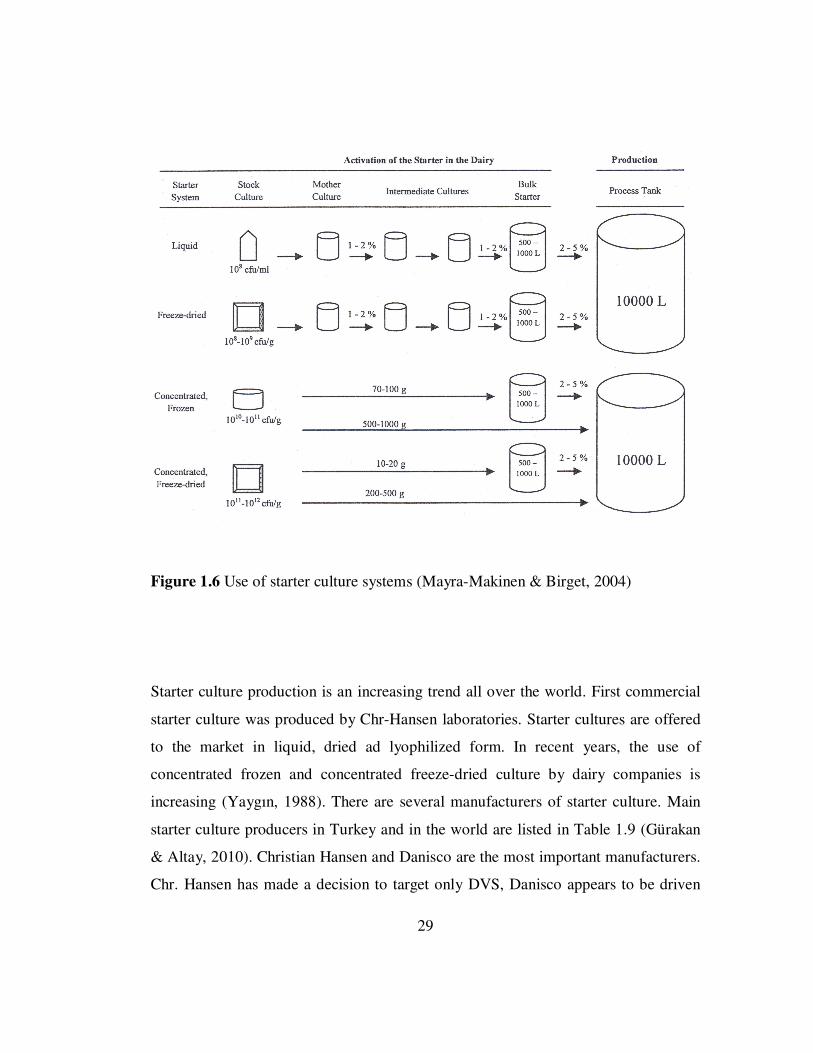
concentration. Figure 1.6 shows the different starter culture systems and their uses.
Page 46
29
Figure 1.6 Use of starter culture systems (Mayra-Makinen & Birget, 2004)
Starter culture production is an increasing trend all over the world. First commercial
starter culture was produced by Chr-Hansen laboratories. Starter cultures are offered
to the market in liquid, dried ad lyophilized form. In recent years, the use of
concentrated frozen and concentrated freeze-dried culture by dairy companies is
increasing (Yaygın, 1988). There are several manufacturers of starter culture. Main
starter culture producers in Turkey and in the world are listed in Table 1.9 (Gürakan
& Altay, 2010). Christian Hansen and Danisco are the most important manufacturers.
Chr. Hansen has made a decision to target only DVS, Danisco appears to be driven
Page 47
30
by both the bulk starter and DVS markets but is applying its new technologies and
strain development toward the DVS market. In Turkey, starter culture production is a
new working area because academic researches and the relationship between industry
and university is not enough for the development on this area. Thus, yoghurt
production in Turkey depends on the starter culture production of foreign companies
and these cultures may not be appropriate to Turkish taste. However, two companies
had started to produce commercial starter culture, in recent years, in Turkey.
Page 48
31
Table 1.9 Yoghurt starter culture producers and starter culture systems
Producer Country Starter System
Chr Hansen Denmark DVS1
Danisco Denmark DVS2
DSM Netherlands DVS – BS3
Sacco Italy DVS – BS4
CSL Italy DVS5
BioSource Flavors, Inc. USA Frozen, freeze-dried6
CSK Food Enrichment Netherlands DVS7
Maysa Turkey DVS – BS8
Intermak Turkey Liquid, frozen, freeze-dried9
DVS: direct-vat-set; BS: bulk starter culture(not concentrated) frozen and/or freeze-
dried; Liquid, frozen, freeze-dried: not specified whether concentrated or
unconcentrated (1: (Chr. Hansen, 2012); 2: (Danisco Inc., 2012); 3: (DSM, 2012); 4:
(Clerici Sacco International, 2012); 5: (CSL, 2012); 6: (BioSource Flavors Inc.,
2012); 7: (CSK Food Enrichment, 2012); 8: (Maysa Dairy&Food Ingredients, 2012);
9: (Intermak-Best Food, 2012))
Page 49
32
1.7.3.1 Preservation Techniques of Starter Cultures
Starter cultures should be preserved to prevent any contamination or starter failure.
Starter cultures can be preserved by using one of the techniques given below
(Tamime & Robinson, 2007):
• Liquid starters
• Frozen starters
• Dried starters
Liquid starters can be produced in different growth media. In a sterile growth media
is inoculated with 2 % starter culture and incubated at 42⁰C for 3-4 h. Then, it can be
stored at refrigeration temperature. Storage time can vary from one week to 12
months depending on the chemical components of growth media (Tamime &
Robinson, 2007). A successive subculturing is a hard process while using this type of
starters. Trained personnel are required in the laboratory because liquid starters can
easily induce mutant strains.
Frozen starters are produced by inoculation of sterile milk with starters and frozen to
- 20⁰C or - 40⁰C / - 80⁰C or - 196⁰C which are called freezing, deep freezing and
ultra-low temperature freezing, respectively (Akın, 2006). Storage at low temperature
may damage starter cultures; especially L.delbrueckii spp. bulgaricus is sensitive to
freezing process. Glycerol is a cryogenic compound and is required for storage at -
20⁰C. It is proved that when freezing temperature decreases, survival rate of
Page 50
33
microorganism increases (Tsvetkov & Shishkova, 1982; Akın, 2006; Tamime &
Robinson, 2007).
In dairy industry, dried starters are incrementally used. These can be done in 3 ways:
• Vacuum-drying
• Spray-drying
• Freeze-drying
Vacuum and spray drying are not used at this moment because they are old
technology and survival rate is low with these methods. Thus, freeze-drying becomes
the most common method. There are 3 advantages of freeze-dried cultures. Firstly,
maintaining liquid cultures from freeze-dried cultures for inoculation is faster and
easier. Secondly, shelf-life of cultures increases and finally, delivery of cultures can
be done even by post. Until 1980s, freeze-dried cultures, also, were required
propagation steps before fermentation. Amen and Cabau (1984), (1986) patented a
method to produce active cultures. In this method, starters inoculated in a nutritive
medium, generally milk with 16-25 % total solid content, with addition of
neutralizing agent and then freeze-dried. Later, it was started to freeze-dry of
concentrated cultures to be used in direct inoculation without any propagation steps
(Tamime & Robinson, 2007). These cultures are called direct-to-vat set (DVS) or
direct-to-vat inoculation (DVI) and there are lots of advantages for dairy
manufacturers.
Page 51
34
DVS may contain up to 1013 cfu/mL. DVS can be found in frozen or freeze-dried
form. The cultures need no activation or other treatment prior to use and offer a
number of advantages in terms of flexibility of use, consistent performance,
possibility of using customized culture blends, and no investment in bulk starter
equipment. Since these are not required propagation step, need for specialized
hygiene precautions and trained personnel decreases. In addition, because these
cultures are prepared outside of a dairy plant, bacteriophage contamination risk
reduces (Carminati, Giraffa, Quiberoni, Binetti, Suarez, & Reinheimer, 2010).
1.7.3.2 Propagation of Starter Cultures
Industrial production of starter cultures is conducted by batch fermentations and this
process can be divided some general steps as listed below (Mayra-Makinen & Birget,
2004):
- Preparation of inoculum
- Preparation of media
- Fermentation at constant pH
- Harvesting the culture
- Adding the cryoprotectant
- Freezing
- Freeze-drying
- Packaging and storage
Page 52
35
There are some factors that affect fermentation and survival rate during freezing and
drying. Growth medium is one of the most important ones (Altay Dede, 2010).
Researches show that milk solids are necessary for synthesis of required enzymes
during fermentations. In addition to skimmed milk, whey enriched by yeast extract
can be used as growth medium. Also, addition of calcium into growth medium
maintain higher survival rate for L.delbrueckii spp. bulgaricus (Tamime & Robinson,
2007).
pH level of growth medium and temperature during fermentation are other important
factors. Yoghurt LAB are thermophilic cultures so fermentation temperature should
be around 42⁰C for high cell concentration. Medium pH should be stabilized at the
optimum pH of strain by using neutralizer. Optimum pH level is determined as 5.4-
5.6 for L.delbrueckii spp. bulgaricus and 6.5 for S.thermophilus (Mayra-Makinen &
Birget, 2004) (Beal, Louvet, & Corrieu, 1989). Ammonium hydroxide is the most
used neutralizer because in experiments, using ammonium hydroxide results higher
yields of bacteria (Tamime & Robinson, 2007).
Most of LAB can be preserved by freezing and drying but L.delbrueckii spp.
bulgaricus and L.helveticus are sensitive to these processes so harvesting time
become important to prevent damaging of cells and loss of activity (Wright &
Klaenhammer, 1983). If L.delbrueckii spp. bulgaricus and S.lactis supp. cremoris are
harvested at the beginning of stationary phase during fermentation and
S.thermophilus cells are harvested at the end of exponential phase, cells can be less
damaged during freezing and drying (Akın, 2006). Concentration of cells can be done
by using centrifugal separation at constant temperature between 5⁰C and 15⁰C
Page 53
36
depending on strain (Porubcan & Sellars, 1979) (Salminen, von Wright, &
Ouwehand, 2004).
Cryoprotective agents and freezing temperature are also important factors for survival
rate. For high survival rate of culture during freeze-drying, freezing temperature
should be between -20⁰C and -30⁰C and drying temperature should be between -10⁰C
and -30⁰C (Akın, 2006). Mannitol can be used as a cryoprotective agent for freeze-
drying of S.thermophilus and lactose and glycerol can be used for freeze-drying of
L.delbrueckii spp. bulgaricus (Tamime & Robinson, 2007).
Preserved cultures show higher survival rate when they are stored at 5-10⁰C than
stored at room temperature (Nikolova, 1975). Also, preserved cultures are sensitive to
oxygen so vacuum packaging recommended.
1.7.3.3 Phage Problems in Dairy Industry
Starter cultures are used in the production of fermented milk products. Final product
characteristics are affected by not only the processing parameters, like, raw material
quality, pasteurization temperature, etc. but also the starter culture properties. Thus,
used starter cultures are selected according their productivity and bacteriophage
resistant properties.
Page 54
37
Although the use of commercial starter culture provides the standardization in
product, it brings about the phage problem. Researches are focused on the source of
the phage problem; whether phage contamination is originated from raw milk or the
lysogenic strains (Acar Soykut & Tunail, 2009). Kaleli and Tunail (2001) and
Kahraman (2006) were examined the rural and commercial strains and lysogeny was
not encountered in these strains. On the other hand, because of the stability of phages
at pasteurization conditions, it is thought that the source of phage contamination is
raw milk.
To prevent the product loss due to phages, many precautions can be applied, for
example, use of phage inhibitory medium, separation of culture preparation
department from plant environment, improvement of sanitation procedures and the
use of DVS cultures. However, these precautions can reduce phage propagation,
cannot eliminate. Therefore, it is preferred the use of strains which are resistant to
dominant phages in the environment. Starter culture producers help the manufacturers
by offering rotation program but because of not having rural cultures in producers’
culture collections, rotation program does not work to prevent the phage problem.
To overcome the phage problem and make the rotation program useful, dairy
manufacturers should isolate the rural phages from their plants and determine the
rural cultures which are resistant to these phages and use these resistant strains for the
fermented milk production (Acar Soykut & Tunail, 2009).
Page 55
38
1.8 Texture
1.8.1 Exopolysaccharides
Exopolysaccharides (EPS) are long-chain saccharides which are produced from sugar
in milk or growth environment by many strains of LAB. These can be loosely
attached to the cell wall and form a capsule structure which are capsular
exopolysaccharides or can be secreted to environment which are ropy
exopolysaccharides (Mayo, Aleksandrzak-Piekarczyk, Fernandez, Kowalczyk,
Alvarez-Martin, & Bardowski, 2010).
EPS can be classified into two groups as homopolysaccharides and
heteropolysaccharides. Homopolysaccharides consist of one type of monosaccharide
like α-D-glucans, β-D-glucans, fructans, etc. and generally produced by Leuconostoc
mesenteroides ssp. mesenteroides, Streptococcus mutans, Streptococcus sobrinus and
Streptococcus sangius (Milci & Yaygın, 2005). Heteropolysaccharides which are
composed of either linear or branched repeating units of different types of
monosaccharide like D-glucose, D-galactose and D-rhamnose produced by
Lactococcus lactis spp. lactis Lactobacillus delbrueckii spp. bulgaricus and
Streptococcus thermophilus (Broadbent, McMahon, Oberg, & Welker, 2001).
Researches show that the amount of EPS production is affected by many factors such
as incubation temperature, incubation time, growth medium, acidity of growth
medium and type of strain (Tamime & Robinson, 2007; Akın, 2006). It was
determined that the amount of EPS produced by L.acidophilus at 37-42⁰C for 24
Page 56
39
hours incubation is higher than that by the same strain at 30⁰C (Mozzi, Oliver, De
Giori, & De Valdez, 1995). Another important factor is pH level of the medium.
Researches show that 6.5 pH is required for optimum EPS production by
L.delbrueckii spp. bulgaricus (Duboc & Mollet, 2001). Amount of EPS synthesis was
given by Cerning et al. (1990) as 80 mg / 100 ml when EPS-producer L.delbrueckii
spp. bulgaricus and EPS-producer S.thermophilus were used.
Biosynthesis of EPS in LAB has four main steps starting with sugar transport into
cytoplasm, synthesis of sugar-1P, polymerization of repeating unit precursors and
lastly EPS transport outside the cell (Mayo, Aleksandrzak-Piekarczyk, Fernandez,
Kowalczyk, Alvarez-Martin, & Bardowski, 2010). In Figure 1.7, EPS production by
lactose metabolism of S.thermophilus is shown, where all four steps of EPS
biosynthesis can be seen (Tamime & Robinson, 2007).
Page 57
40
Figure 1.7 Lactose metabolism of S. thermophilus which results in production of EPS
(Tamime & Robinson, 2007)
1.8.2 Effects of EPS on Rheological Properties of Yoghurt
Exopolysaccharides change the rheological properties of dairy products in a positive
way due to their viscosity increasing, texture improving, water binding, stabilizing
and emulsifying properties (Milci & Yaygın, 2005).
In yoghurt production, loose texture and serum separation are the main physical
problems which can be solved by addition of some additives. Since consumers prefer
Page 58
41
natural products and also additive use is forbidden by Turkish Standards which are
TS 1330/February 2009 and TS 10935/ April 1993, EPS-producer starter cultures are
used in fermentation of milk products (Ruas-Madiedo, Hugenholtz, & Zoon, 2002).
In addition, exopolysaccharides have a positive impact on texture, stability, flavor
and aroma of the final product.
Experiments show that there is not a significant correlation between viscosity of
product and exopolysaccharide amount (Ruas-Madiedo, Hugenholtz, & Zoon, 2002).
However, the amount of these molecules, their molecular weights, radius, chemical
compositions and linkages strengths are very effective on the viscosity (Broadbent,
McMahon, Oberg, & Welker, 2001). In recent years, it was found that yoghurt
produced by EPS-producer starters have high viscosity values than yoghurt produced
by non-EPS-producer starters (Hassan, Corredig, & Frank, 2001).
Page 59
42
1.9 Aroma Compounds
Flavor compounds contribute the aroma to yoghurt and these flavor compounds can
be examined into four main categories which is given below and also Figure 1.8
shows that the acetaldehyde and other aroma compounds production from pyruvate
(Walstra, Wouters, & Geurts, 2006).
1. Non-volatile acids; lactic acid, pyruvic acid, oxalic acid and succinic acid
2. Volatile acids; formic acid, acetic acid, propionic acid and butyric acid
3. Carbonyl compounds; acetaldehyde, acetone, acetoin and diacetyl
4. Miscellaneous compounds; some amino acids or compounds formed due to
thermal degradation of protein, fat and lactose (Tamime & Robinson, 2007).
Page 60
43
Figure 1.8 Different pathways of pyruvate. (1a) acetaldehyde dehydrogenase, (1b)
alcohol dehydrogenase, (2) acetolactate synthase, (3) pyruvate formate lyase, (4)
pyruvate dehydrogenase, (5) pyruvate oxidase, (6) pyruvate decarboxylase and (7)
acetate kinase. Dashed arrow denotes a nonezymatic reaction (Walstra, Wouters, &
Geurts, 2006; Axelsson, 2004).
Page 61
44
Aroma compounds content of yoghurt depends on mainly two factors. One of them is
the source of the milk which is used for yoghurt production. Table 1.10 shows that
acetaldehyde, acetone and ethanol content of yoghurt produced by different
mammalian milks. The other reason is the yoghurt starter cultures and their form of
use. Yoghurt starter cultures are examined separately and in mixed form for their
flavor compounds production capabilities. Table 1.11 shows the production of
carbonyl compounds during fermentation process.
Table 1.10 Aroma compound content of yoghurt produced by using different
mammalian milk (Tamime & Robinson, 2007)
Milk Acetaldehyde Acetone Ethanol
Cow 4-26 3-25 19-365
Sheep 7-30 5-30 10-255
Goat 5-19 3-40 25-355
Buffalo 6-28 5-30 5-195
Page 62
45
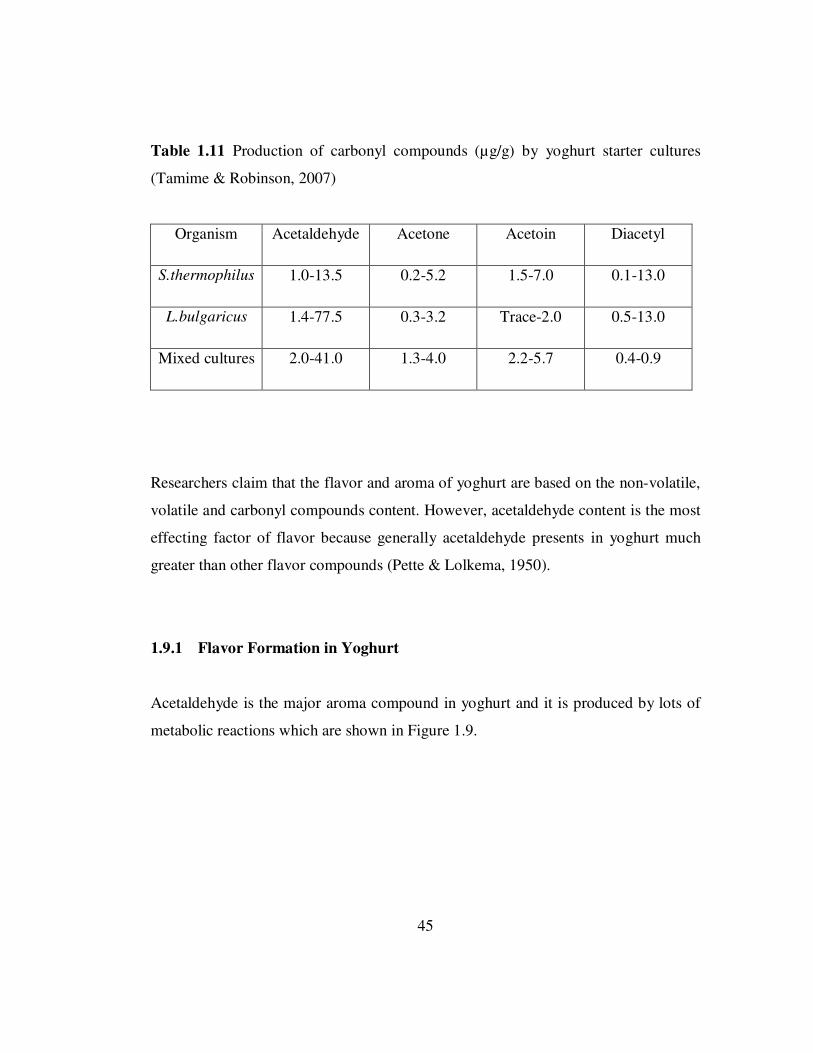
Table 1.11 Production of carbonyl compounds (µg/g) by yoghurt starter cultures
(Tamime & Robinson, 2007)
Organism Acetaldehyde Acetone Acetoin Diacetyl
S.thermophilus 1.0-13.5 0.2-5.2 1.5-7.0 0.1-13.0
L.bulgaricus 1.4-77.5 0.3-3.2 Trace-2.0 0.5-13.0
Mixed cultures 2.0-41.0 1.3-4.0 2.2-5.7 0.4-0.9
Researchers claim that the flavor and aroma of yoghurt are based on the non-volatile,
volatile and carbonyl compounds content. However, acetaldehyde content is the most
effecting factor of flavor because generally acetaldehyde presents in yoghurt much
greater than other flavor compounds (Pette & Lolkema, 1950).
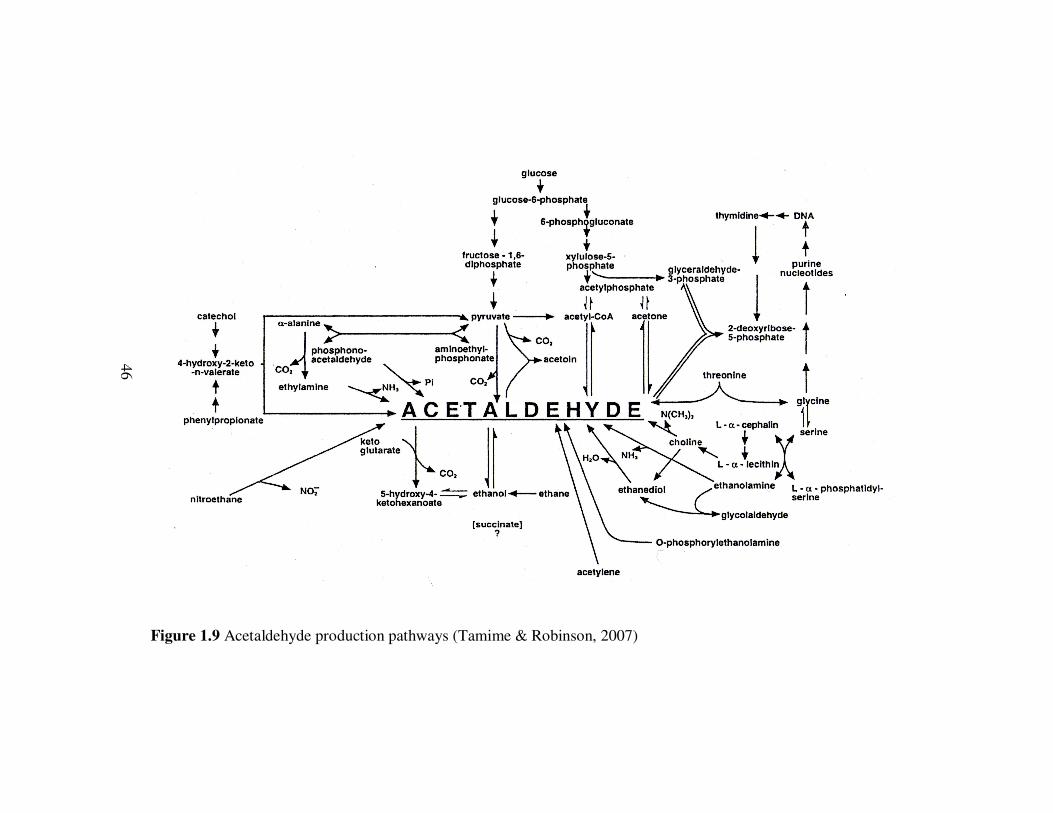
1.9.1 Flavor Formation in Yoghurt
Acetaldehyde is the major aroma compound in yoghurt and it is produced by lots of
metabolic reactions which are shown in Figure 1.9.
Page 63
46
Figure 1.9 Acetaldehyde production pathways (Tamime & Robinson, 2007)
46
Page 64
47
However, the high proportion of total acetaldehyde is produced by using mainly two
metabolic pathways. Figure 1.10 explains briefly these two pathways.
Lactose Milk proteins
β-galactosidase
Glucose
Glycolysis Peptides
Pyruvate
Dehydrogenase
Acetyl CoA Threonin (+ methionin)
Dehydrogenase Aldoase
Acetaldehyde
(+ glycin)
Figure 1.10 Two major pathways to produce acetaldehyde in yoghurt (Walstra, Wouters, & Geurts, 2006)
First one is Embden-Meyerhof-Parnas pathway, lactic acid bacteria that have no
alcohol dehydrogenase enzyme because in the presence of this enzyme acetaldehyde
produced from pyruvate can be broken down into ethanol (Walstra, Wouters, &
Geurts, 2006). Second one is proteolysis that the production of acetaldehyde from
Page 65
48
free amino acid, threonine with the activity of threonine aldolase enzyme by
L.delbrueckii spp. bulgaricus and S.thermophilus. The chemical reaction is:
threonine aldolase
threonine acetaldehyde + glycine
Walstra et al. (2006) claims that acetaldehyde amount produced by proteolysis is
much higher than produced by carbohydrate metabolism. Organisms, L.delbrueckii
spp. bulgaricus and S.thermophilus, both have threonine aldolase activity. Researches
show that S.thermophilus threonine aldolase activity decreases by the temperature rise
from 30⁰C to 42⁰C but the activity of this enzyme of L.delbrueckii spp. bulgaricus
remains at the same level (Zourari, Accolas, & Desmazeaud, 1992). Therefore, it can
be said that acetaldehyde production mainly depends on L.delbrueckii spp. bulgaricus
strains because yoghurt fermentation temperature changes between 40 and 45⁰C
(Tamime & Robinson, 2007).
1.10 Aim of the Study
Yoghurt is a fermented milk product which is originated from Middle East but then, it
has been started to be consumed all over the world with an increasing trend. Yoghurt
is produced as a result of the symbiotic growth of Lactobacillus delbrueckii spp.
bulgaricus and Streptococcus thermophilus. Each strain of L.delbrueckii spp.
bulgaricus and S.thermophilus has different capabilities for the production of lactic
acid, carbon dioxide, diacetyl and acetaldehyde which give different flavor and
texture characteristics to yoghurt. The amounts of these components determine the
quality of yoghurt and consumer acceptance.
Page 66
49
In this study, 6 L.delbrueckii ssp. bulgaricus and 6 S.thermophilus strains which were
isolated from Turkish traditional yoghurts by Neslihan Altay Dede (2010) were used
to produce yoghurt samples with different characteristics. Also, 2 commercial
S.thermophilus strains and one L.delbrueckii ssp. bulgaricus strain was used for the
production of two commercial yoghurt samples for comparison with the traditional
ones. These strains were selected according to their acidification activity and
acetaldehyde production properties. In order to determine the bacterial combination
which produces the most appropriate yoghurt to Turkish taste, pH and titratable
acidity change during storage, whey separation, exopolysaccharide and acetaldehyde
content were determined. Also, texture and sensory analyses has been performed. The
culture combination which have the best results in these analyses, was freeze dried
and these freeze dried culture was used in yoghurt production. Another yoghurt
sample was produced using commercial freeze-dried culture. Finally, these two
samples were analyzed and compared with each other and the sample produced by
conventional method to observe the effect of freeze drying on starter cultures and
their yoghurt production properties.
Page 67
50
CHAPTER II
MATERIALS AND METHODS
2.1 Materials
2.1.1 Lactic Acid Bacteria Strains
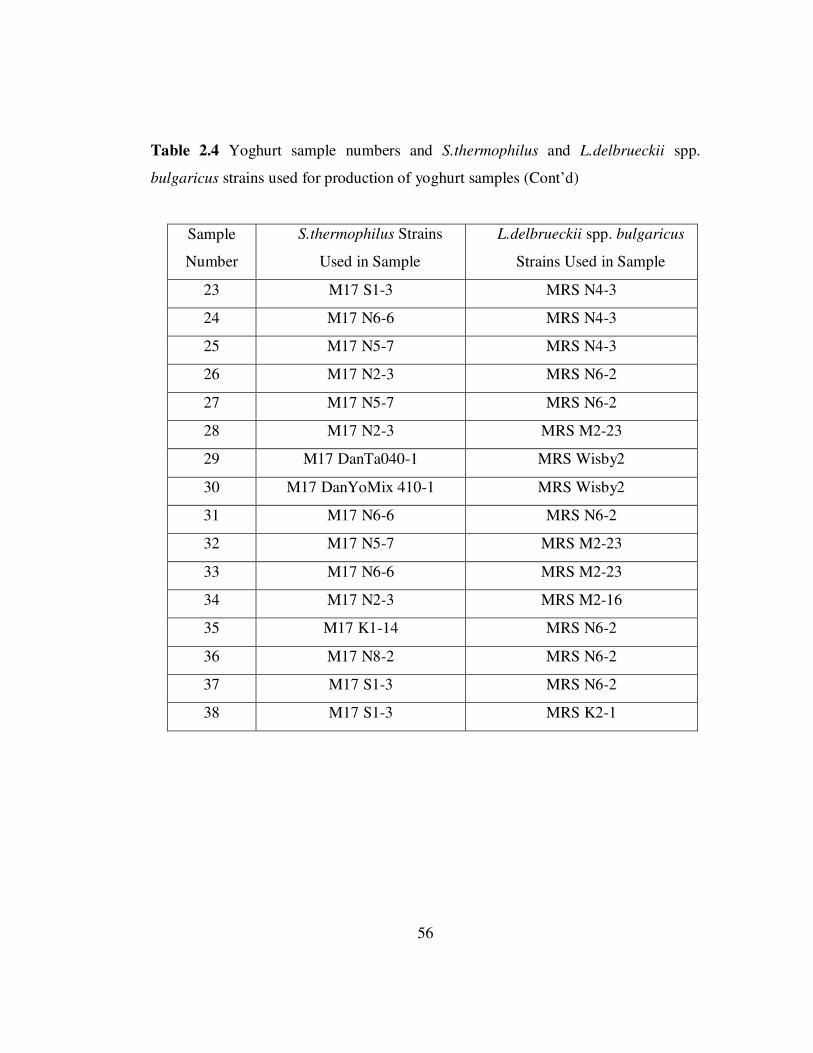
Eight S.thermophilus and seven L.delbrueckii spp. bulgaricus strains were used for
yoghurt sample preparation. Two commercial S.thermophilus strains, one isolated
from Danisco Yo-Mix 410 (M17 Dan-Yo-Mix410-1) and one isolated from Danisco
TA 040 (M17 Dan TA040-1) were used as controls. One L.delbrueckii spp.
bulgaricus strain isolated from Visby Visbyvac B1000 (MRS Visby-2) was also used
as commercial control for yoghurt samples production. These cultures were selected
among strains which were isolated from traditional and commercial cultures by
Neslihan Altay Dede (2010). Strains were selected according to their acidification
activity and acetaldehyde production properties. Acidification activity is calculated
with the following equation and acidification activity is classified as in the Table 2.1
and Table 2.2.
∆pH=pHat time zero – pHat any time
Page 68
51
Table 2.1 Classification of S.thermophilus strains according to acidification activity
∆pH<1.3 1.3<∆pH<1.4 1.4<∆pH
Fair Medium Good
Table 2.2 Classification of L.delbrueckii spp. bulgaricus strains according to
acidification activity
∆pH<1.4 1.4<∆pH<1.5 1.5<∆pH
Fair Medium Good
According to Altay Dede (2010), acidification activity of L.delbrueckii spp.
bulgaricus strains should be higher than 1.5 and acidification activity of
S.thermophilus strains should be higher than 1.4 to be classified as good strain. In
addition, acetaldehyde production properties of L.delbrueckii spp. bulgaricus strains
should be as high as possible for a good flavor formation. All strains used in this
study were listed in Table 2.3. Acidification activity and acetaldehyde production
properties of used strains in this study were given in Appendix J.
Page 69
52
Table 2.3 Lactic acid bacteria strains used for yoghurt sample preparation
S.thermophilus Strains Source of
Strains
L.delbrueckii spp.
bulgaricus Strains
Source of
Strains
M17 K1-14
METU_FDE
Culture
Collection*
MRS K1-43
METU_FDE
Culture
Collection*
M17 N2-3 MRS M2-16
M17 N8-2 MRS M2-23
M17 N5-7 MRS N6-2
M17 N6-6 MRS N4-3
M17 S1-3 MRS K2-1
M17 Dan TA040-1 Danisco MRS Visby-2 Visby
M17 Dan-Yo-Mix410-1
* METU_FDE Culture Collection: Middle East Technical University Food
Engineering Department culture collection contains S.thermophilus and L.delbrueckii
spp. bulgaricus strains which were isolated by Neslihan Altay Dede (2010).
2.1.2 Growth media and temperature
M17 broth (Merck) was used as a growth media of S.thermophilus strains after
adjusting the pH of media to 6.8±0.1 at 25⁰C which was originally 7.2±0.2 at 25⁰C
and sterilized at 121⁰C for 15 minutes (pHmeter, Hanna instruments HI 221, EU).
L.delbrueckii spp. bulgaricus strains were grown in MRS broth (Merck) with 5.7±0.2
pH value at 25⁰C which was sterilized at 121⁰C for 15 minutes. S.thermophilus and
Page 70
53
L.delbrueckii spp. bulgaricus isolates were incubated at 42⁰C for overnight unless
otherwise noted.
2.2 Methods
2.2.1 Cultivation
During these experiment, cultures, stored at -80⁰C with glycerol solution, were used.
For activation of starter cultures, serial inoculations were conducted. The propagation
step to produce the cultures used in yoghurt production was explained below:
1. Inoculate 10 mL of MRS or M17 broth (according to bacteria) by using
the stock culture which is stored -80⁰C with an inoculation rate 1% (CL
HetoFrig -80, Heto, Denmark).
2. Incubate the broth at 42⁰C overnight (Genlab INC/160, UK).
3. Inoculate a second 10 mL of MRS or M17 broth (according to bacteria)
by using first broth and incubate at 42⁰C overnight.
4. Inoculate 50 mL of MRS or M17 broth by using second broth and
incubate at 42⁰C overnight.
5. Take the broth in a falcon and centrifuge it to obtain pellet at 2000 rpm
for 15 minutes (Thermo Electron IEC Centra CL2, US).
6. Remove the supernatant and add 10 mL of distilled sterile water to the
pellet and centrifuge at 2000 rpm for 15 min.
7. Repeat step 6 until the pellet becomes clear.
Page 71
54
8. Add 10 mL sterile distilled water and mix with vortex (Fisons Whirly-
mixer, England).
9. Pipette 0.9 mL sterile distilled water in an eppendorf tube and add 0.1 mL
of culture, use 1 mL of distilled water as a blank solution
10. Read absorbance at 600 nm wavelength (Specord 50, Analytikjena,
Germany)
11. Adjust the optical density (OD) value to 2 at 600 nm by adding or
removing sterile distilled water.
2.2.2 Yoghurt Production
Yoghurt samples were produced using standardized milk taken from Atatürk Orman
Çiftliği Milk Factory. Standardized milk of AOÇ has 3±0.1% fat and 16±0.3% total
solid content. Yoghurt sample numbers and S.thermophilus and L.delbrueckii spp.
bulgaricus strains used for the production of samples were listed in Table 2.4.
Samples were produced for each culture combination by following the steps given
below:
1. Inoculate 1000 mL of standardized milk at 42⁰C with an inoculation rate
of 4%. For inoculation, use the culture with adjusted OD.
2. Mix with magnetic stirrer for 10 minutes and pour sterile glass vessel as
100 mL (VELP Scientifica ARE, EU).
3. Incubate at 42⁰C until pH values reach to 4.6 - 4.7.
4. After incubation, immediately store sample at 4⁰C for 24 hours.
Page 72
55
Table 2.4 Yoghurt sample numbers and S.thermophilus and L.delbrueckii spp.
bulgaricus strains used for production of yoghurt samples
Sample
Number
S.thermophilus Strains
Used in Sample
L.delbrueckii spp. bulgaricus
Strains Used in Sample
1 M17 N8-2 MRS M2-16
2 M17 S1-3 MRS M2-23
3 M17 K1-14 MRS K1-43
4 M17 N8-2 MRS M2-23
5 M17 S1-3 MRS K1-43
6 M17 K1-14 MRS M2-16
7 M17 N8-2 MRS K1-43
8 M17 K1-14 MRS N4-3
9 M17 K1-14 MRS M2-23
10 M17 N8-2 MRS K2-1
11 M17 N5-7 MRS K2-1
12 M17 N8-2 MRS N4-3
13 M17 K1-14 MRS K2-1
14 M17 N2-3 MRS K2-1
15 M17 N6-6 MRS K2-1
16 M17 N5-7 MRS K1-43
17 M17 N6-6 MRS K1-43
18 M17 N2-3 MRS K1-43
19 M17 N5-7 MRS M2-16
20 M17 N6-6 MRS M2-16
21 M17 S1-3 MRS M2-16
22 M17 N2-3 MRS N4-3
Page 73
56
Table 2.4 Yoghurt sample numbers and S.thermophilus and L.delbrueckii spp.
bulgaricus strains used for production of yoghurt samples (Cont’d)
Sample
Number
S.thermophilus Strains
Used in Sample
L.delbrueckii spp. bulgaricus
Strains Used in Sample
23 M17 S1-3 MRS N4-3
24 M17 N6-6 MRS N4-3
25 M17 N5-7 MRS N4-3
26 M17 N2-3 MRS N6-2
27 M17 N5-7 MRS N6-2
28 M17 N2-3 MRS M2-23
29 M17 DanTa040-1 MRS Wisby2
30 M17 DanYoMix 410-1 MRS Wisby2
31 M17 N6-6 MRS N6-2
32 M17 N5-7 MRS M2-23
33 M17 N6-6 MRS M2-23
34 M17 N2-3 MRS M2-16
35 M17 K1-14 MRS N6-2
36 M17 N8-2 MRS N6-2
37 M17 S1-3 MRS N6-2
38 M17 S1-3 MRS K2-1
Page 74
57
2.2.3 pH and Titratable Acidity Determination
pH and titratable acidity of yoghurt samples were measured at 1., 4., 7., 14. and 21.
days of storage. Titratable acidity of yoghurt samples was determined according to
Yoghurt Standard of Turkish Standards Institution (TS 1330/February 1999) and the
procedure was given below. pH results and total titratable acidity results were given
in Appendix B and Appendix C, respectively.
1. Weight 10 grams of yoghurt samples into a 100 mL erlenmeyer flask
(Precisa BJ1000C, Switzerland).
2. Add 10 mL distilled water at 40⁰C into the flask and mix with a glass bar
until a smooth mixture reached.
3. Add 0.5 mL phenolphthalein solution.
4. Titrate with 0.1 N NaOH solution until 30 second-stable pink color
maintained.
5. Calculate titratable acidity in yoghurt using the following equation.
� =� × � × 0,09
× 100
Where;
A: titratable acidity, wt % lactic acid
V: used 0.1 N NaOH solution during titration, mL
m: weight of sample used in titration, g
N: Normality of used NaOH solution in titration
Page 75
58
2.2.4 Whey Separation
25 grams of yoghurt samples were weighted on a filter paper and stored at 4⁰C for 2
hours to collect separated whey. Collected whey were measured in mL and divided
by sample weight (Yılmaz, 2006) (Sezgin, Yıldırım, & Karagül, 1994). The results
were given in Appendix D.
2.2.5 Texture Analysis
For texture analysis, three parallels, which were fermented from 100 mL of milk,
were prepared for each sample. At first day of storage, the maximum forces were
measured by using the cylindrical probe with a diameter 36 mm (Stable Micro
Systems, TA.XT plus Texture Analyzer, UK). The hardness values of samples were
given in Appendix D.
2.2.6 Selection of Yoghurt Samples for Chemical and Sensory Analysis
Nine yoghurt samples were selected for exopolysaccharides determination,
acetaldehyde determination and sensory analysis. Yoghurt samples were analyzed
according to their final pH, titratable acidity, whey separation and textural properties.
By using these outcomes, samples which gave the best results for all the analysis,
were chosen for further experiments. Samples, which had a pH score below 4.1 and
had the highest seven titratable acidity score at the end of the storage time, were
omitted even if these have high texture or whey separation scores. According to these
selection criteria six yoghurt samples were selected. In addition, two yoghurt
samples, which were made by using commercial cultures, and one yoghurt sample,
Page 76
59
which was among the worst ones for each criteria, were analyzed for comparison.
Yoghurt samples and culture mixtures were given in Table 2.5.
Table 2.5 Selected yoghurt samples for chemical and sensory analysis
Sample
Number
S.thermophilus Strains
Used in Sample
L.delbrueckii spp. bulgaricus
Strains Used in Sample
6 M17 K1-14 MRS M2-16
9 M17 K1-14 MRS M2-23
11 M17 N5-7 MRS K2-1
15 M17 N6-6 MRS K2-1
24 M17 N6-6 MRS N4-3
25 M17 N5-7 MRS N4-3
27 M17 N5-7 MRS N6-2
29 M17 DanTa040-1 MRS Wisby2
30 M17 DanYoMix 410-1 MRS Wisby2
2.2.7 EPS Content Determination
The EPS assay, which was revised by Goh et al. (2005), was applied to determine the
EPS amount in samples. The protocol was given below. Glucose standard curve at
485 nm and results were given in Appendix E.
Page 77
60
1. Swirl to mix culture medium in bottle to ensure homogeneity.
2. Adjust the pH of the sample to pH 7 with 0.1N NaOH.
3. Add 100 µL of filter-sterilized Flavourenzyme (10% w/w) to 10 mL of
sample.
4. Incubate the sample at 50⁰C in a shaker for 4 hours (Infors HT,
Aerotron, Switzerland).
5. Vortex the sample for approximately 15 seconds.
6. Pipette 2.9 mL of distilled water and 7 mL of chilled absolute ethanol
in the falcon tube.
7. Pipette 100 µL of culture medium into the falcon tube.
8. Leave the sample overnight at 4⁰C.
9. Centrifuge sample at 27.000g, 4⁰C for 40 minutes. Ensure tubes are
balanced within ±0.1g before centrifuging.
10. After centrifugation, carefully decant supernatant (pour away for
pellet).
11. Invert the tubes on a piece of paper towel for approximately 10
minutes.
12. Pipette 3 mL of distilled water to re-suspend the pellet in falcon tube.
13. Pipette 7 mL of chilled 99.7% ethanol into falcon tube.
14. Repeat step 8-10.
15. Re-suspend the pellet in 1 mL of distilled water.
16. Transfer the sample to an eppendorf tube.
17. Prepare a blank sample using distilled water 1 mL.
18. Add 1 mL of 5% (w/v) phenol solution to the sample and mix using a
vortex (15 seconds).
19. Add 5 mL of concentrated sulphuric acid directly to the sample.
20. Mix the sample thoroughly using a vortex.
21. Leave the sample to stand for 30 minutes.
Page 78
61
22. Read absorbance at 485nm. Use the blank as the reference sample.
23. Obtain the amount of EPS from the glucose standard curve.
24. Amount of EPS is multiplied by 10 to account for the dilution factor.
25. Amount of EPS = EPS of the test sample – EPS of control sample
2.2.8 Acetaldehyde Content Determination
Acetaldehyde contents of samples were determined by Lees and Jago method (Lees
& Jago, 1969). Procedure was given below (Yılmaz, 2006). Results were given in
Appendix E.
1. Mix the sample to ensure homogeneity.
2. Weight 10 g of sample into a volumetric flask.
3. Add 30 mL of distilled water to the flask.
4. Distillate the mixture until gathering of 10 mL distillate.
5. Add 1 mL 0.25 M NaHSO3.
6. Adjust the pH of the mixture to pH 9 with 0.1 N NaOH solution.
7. Cover the flask and leave for 15 minutes in a dark place.
8. Add 1 mL of 1% starch solution and titrate with 0.1 N iodine solution
until reached a purple color.
9. Add 1 g NaHCO3 and mix.
10. When the mixture becomes clear titrate with 0.005 N iodine solution
until reached a purple color.
11. Amount of used 0.005 N iodine solution is used to determine the
acetaldehyde amount using following equation.
Page 79
62
� =44 × � × �
× 1000
Where;
A= Acetaldehyde amount, ppm
V= Used 0,005 N iodine solution during titration, mL
N= Normality of used iodine solution in titration
m = Sample weight, gram
2.2.9 Sensory Analysis
To find out the sensorial characteristics of yoghurt and consumer acceptance, sensory
analysis was conducted. 9 different yoghurts were tried and scored by 11 participants.
Samples were rated in terms of appearance, odor and flavor. Also, participants gave a
score for overall acceptance of samples. A 5-degree scale was used for rating. Results
were evaluated by using One-way ANOVA. Then, Tukey’s test was used to see that
whether a significant difference between samples. For all ANOVA applications
confidence interval “CI” was taken as 95% (i.e; α=0.05). Calculations and results
were given in Appendix G.
2.2.10 Freeze Dried Culture Preparation
The best combination of isolates of S.thermophilus and L.delbrueckii spp. bulgaricus
were determined by chemical and physical experiments and they were prepared as
Page 80
63
freeze dried culture to see the effect of freeze drying of strains on yoghurt properties.
Freeze drying procedure was given below:
1. Inoculate 10 mL of growth medium (M17 broth for S.thermophilus
strain “M17 N6-6”; MRS broth for L.delbrueckii spp. bulgaricus strain
“MRS N4-3”) with a ratio of 1% by using stock cultures and incubate
at 42⁰C for 24 hours.
2. Repeat the step for once for each organism.
3. Inoculate 200 mL of medium and incubate at 42⁰C for 14 hours.
4. Transfer the medium into falcon tubes and centrifuge at 5000 rpm for
45 minutes and remove supernatant.
5. Prepare suspension media with 11% non-fat milk solid and 15%
sodium glycerophosphate.
6. Resuspend the pellet to 2% of original volume by using suspension
media.
7. Transfer the cultures into an agar plate and spread it
8. Put the agar plates into the freeze-dryer and dried at -50⁰C under 0.05
Torr vacuum for 18 hours (Heto FD8, Denmark).
Page 81
64
CHAPTER III
RESULTS AND DISCUSSION
3.1 Experimental Design
This study was divided into three parts. First part includes the determination of
physico-chemical and rheological properties. To observe the physico-chemical and
rheological properties of yoghurt samples, change in pH and total titratable acidity
during storage, whey separation and hardness values of yoghurt samples are
determined (Fadela, Abderrahim, & Ahmed, 2009; Amatayakul, Halmos, Sherkat, &
Shah, 2006).
Second part is the determination of chemical properties of yoghurt samples and
consumer acceptance. Chemical properties of yoghurt can be determined by
analyzing exopolysaccharide and acetaldehyde content of yoghurt samples
(Amatayakul, Halmos, Sherkat, & Shah, 2006; Gündoğdu, Çakmakçı, & Dağdemir,
2009). Sensory analysis is conducted for the determination of consumer acceptance
(Gündoğdu, Çakmakçı, & Dağdemir, 2009; Obi, Henshaw, & Atanda, 2010).
Third part is the determination of the effect of freeze-drying of lactic acid bacteria on
yoghurt properties. In this study, 7 L.delbrueckii spp. bulgaricus strains and 8
Page 82
65
S.thermophilus strains were used to produce yoghurt samples. These strains were
selected from a collection which contains 111 L.delbrueckii spp. bulgaricus and 56
S.thermophilus isolates. These strains were isolated from traditional Turkish yoghurt
and commercial cultures by Neslihan Altay Dede (2010). L.delbrueckii spp.
bulgaricus strains were selected according to acidification activity and acetaldehyde
production properties and S.thermophilus strains were selected according to
acidification activity. The results of acidification activity and acetaldehyde
production analyses were given in Appendix J.
Page 83
66
3.1.1 Physico-Chemical and Rheological Properties Determination
L.delbrueckii spp. bulgaricus (111) S.thermophilus (56)
Acidification activity Acidification activity
Acetaldehyde production Altay Dede,
2010,
L.delbrueckii spp. bulgaricus (6) S.thermophilus (6) Ph.D thesis
+
Commercial Commercial
L.delbrueckii spp. bulgaricus (1) S.thermophilus (2)
Yoghurt samples (38)
pH determination
TTA determination
Whey separation
Texture analysis
Yoghurt samples (9)
(Yoghurt sample 6, 9, 11, 15, 24, 25, 27, 29, 30)
(Isolated strains’ yoghurt samples (7) + Commercial strains’ yoghurt samples (2))
Figure 3.1 Determination of pH and titratable acidity, whey separation and textural
properties of yoghurt samples and comparison with yoghurt samples produced by
commercial strains. Numbers given in the parenthesis were the numbers of strains or
numbers of yoghurt samples which were studied and selected.
Page 84
67
Six L.delbrueckii spp. bulgaricus strains and six S.thermophilus strains were selected
according to their acidification activity and acetaldehyde production characteristics
which were determined by Neslihan Altay (Altay Dede, 2010). In addition, one
L.delbrueckii spp. bulgaricus strain and two S.thermophilus strains, which were
isolated from commercial mixed cultures, were selected for using in the production of
2 commercial yoghurt samples. 38 yoghurt samples were produced by using these 15
strains and pH and titratable acidity determination, whey separation and texture
analysis were conducted. According to these results, 9 yoghurt samples were selected
for further experiments. Two of these samples were the samples produced by
commercial cultures and one of these was a sample which has average yoghurt
characteristics, to provide a good comparison with commercials and average one.
3.1.2 Chemical Properties Determination
Yoghurt samples (9)
Exopolysaccharides determination
Acetaldehyde determination
Sensory analysis
Yoghurt sample (1)
(Yoghurt sample 24)
Figure 3.2 Determination of chemical properties and consumer acceptance of yoghurt
samples and comparison with yoghurt samples produced by commercial strains.
Page 85
68
Nine selected yoghurt samples were produced again and exopolysaccharides
determination, acetaldehyde determination and sensory analysis were done to select
the sample which have the best properties and which is accepted by the consumers.
According to the results, strains used in the production of yoghurt sample 24 were
selected for freeze-drying process because this sample had comparable results in all
experiments with the samples which were produced by using commercial starter
cultures.
3.1.3 Determination of the Effect of Freeze-Drying of Lactic Acid Bacteria on
Yoghurt Properties
Yoghurt sample done by freeze-dried selected culture (1)
(Yoghurt sample FD24)
+
Yoghurt sample done by commercial freeze-dried culture (1)
(Yoghurt sample YC X11)
pH and titratable acidity determination
Whey separation
Texture analysis
Exopolysaccharides determination
Acetaldehyde determination
Figure 3.3 Determination of the effect of freeze-drying of LAB on yoghurt properties
and comparison of these properties with a yoghurt sample produced by using a
commercial freeze-dried culture.
Page 86
69
Strains of selected yoghurt sample were freeze-dried to see the effect of freeze-drying
process on the yoghurt. Yoghurt sample was produced by freeze-dried selected
culture and yoghurt properties, which were pH and titratable acidity, whey separation,
texture analysis, exopolysaccharide content and acetaldehyde amount were
determined again to compare with yoghurt which was produced by a commercial
freeze-dried culture. This commercial yoghurt was also studied with respect to these
properties. To produce the commercial yoghurt sample, DVS YO-FLEX YC X11
culture of CHR-Hansen Company was used.
3.2 Results
All analyses results were given in Table 3.1. Thirty-eight yoghurt samples were
analyzed for pH and total titratable acidity change during storage, whey separation
and hardness. Yoghurt samples which gave the best results for each analysis were
selected for chemical analyses.
As seen in Table 3.1, Yoghurt samples 8, 9, 11, 12, 31 and 33 gave the highest final
pH value at the end of the storage time which means these yoghurt samples have
longer shelf-life than the others. In addition to that acceptable yoghurt pH level is
between 4.6-4.1 (Walstra, Wouters, & Geurts, 2006). According to this, yoghurt
samples 2, 3, 4, 5, 26, 35, 36 and 37 were omitted.
Also, titratable acidity is an important parameter for shelf-life determination.
According to the table, yoghurt samples 6, 7, 8, 9, 11, 12, 22 and 23 were the yoghurt
samples with the lowest titratable acidity results and these were selected for further
Page 87
70
chemical analyses. Yoghurt samples 13, 14, 26, 35, 36, 37 and 38 were omitted
because they have the highest titratable acidity results.
Whey separation is an important quality parameter for consumers because when
syneresis occurs in yoghurt it is thought that it is because of the low textural
properties of yoghurt. According to whey separation analysis results, yoghurt samples
4, 6, 9, 15, 24, 36 and 37 have the lowest syneresis values and this may have a
positive effect on consumer acceptance. Therefore, yoghurt samples 1, 2, 3, 7, 8, 21
and 23 were omitted due to the high syneresis value.
Finally, hardness of yoghurt samples were measured by using texture analyzer
because texture of yoghurt is the second important factor which affects the consumer
choice after taste of yoghurt. According to hardness values, yoghurt samples 4, 6, 11,
14, 15, 24, 25 and 29 were selected as the hardest yoghurt samples. Since texture is
an important quality parameter, yoghurt samples 8, 12, 23, 31, 32 and 33, which have
the lowest hardness values, were omitted.
As conclusion, after selecting and omitting of yoghurt samples for chemical analyses
according to the results, 9 yoghurt samples, which are yoghurt samples 6, 9, 11, 15,
24 and 25, were selected for chemical analyses. To maintain a good comparison
between traditional and commercial cultures’ yoghurt, yoghurt samples 29 and 30
were also analyzed. In addition, to observe the difference between yoghurt samples
which have good and poor physico-chemical and textural properties, yoghurt sample
27 which has average or poor results for each analysis was also analyzed in chemical
analyses.
Page 88
71
In chemical analyses part of the study, exopolysaccharide and acetaldehyde content
determination were conducted. According to the acetaldehyde content analysis
results, yoghurt samples 24 and 25 were the closest ones to yoghurt samples 29 and
30 which are the yoghurt samples produced by commercial strain combinations. In
addition, in EPS content analysis, yoghurt sample 24 was found as the closest one to
yoghurt samples 29 and 30.
In sensory analysis, 9 yoghurt samples were rated by 11 participants due to
appearance, odor and flavor. According to overall scores, yoghurt sample 24 was
found as the most preferred one among all 9 yoghurt samples.
In the last part of this study, strains of selected yoghurt sample (yoghurt sample 24)
were freeze-dried separately and these freeze-dried cultures were used to produce
yoghurt sample FD24. Yoghurt sample FD24 was analyzed to compare the results
with yoghurt sample 24. Also, to compare yoghurt sample FD24 with a commercial
yoghurt sample, DVS YO-FLEX YC X11 culture of CHR-Hansen Company was
used.
Page 89
72
Table 3.1 All analysis results for yoghurt samples
Sample Number
Final pH* Final TTA*
(% lactic acid)
Whey Separation
(mL/g)
Hardness (N)
EPS Amount (g/mL)
Acetaldehyde Amount (ppm)
Sensory Analysis
1 4.17 ± 0.02 1.11 ± 0.03 0.362 ± 0.003 209.84 ± 51.49
2 4.06 ± 0.02 1.18 ± 0.03 0.372 ± 0.002 241.59 ± 24.92
4.08 ± 0.02 1.18 ± 0.01 0.354 ± 0.003 195.15 ± 16.33
4 4.10 ± 0.02 1.12 ± 0.02 0.280 ± 0.003 270.65 ± 19.25
5 4.11 ± 0.02 1.17 ± 0.05 0.333 ± 0.003 242.13 ± 6.92
6** 4.20 ± 0.01 1.09 ± 0.03 0.205 ± 0.003 268.47 ± 72.85 5.50x10⁻⁵ ± 4x10⁻⁶ 30.68 ± 0.32 4.0
7 4.21 ± 0.01 1.08 ± 0.03 0.377 ± 0.007 192.71 ± 9.20
8 4.43 ± 0.35 1.10 ± 0.01 0.380 ± 0.003 151.55 ± 27.82
9** 4.43 ± 0.02 1.00 ± 0.04 0.283 ± 0.002 225.05 ± 40.73 3.68 x10⁻⁵ ± 6x10⁻⁶ 29.13 ± 0.50 3.27
10 4.30 ± 0.02 1.15 ± 0.04 0.310 ± 0.004 173.91 ± 13.56
72
3
Page 90
73
Table 3.1 All analysis results for yoghurt samples (Cont’d)
Sample Number
Final pH Final TTA*
(% lactic acid)
Whey Separation
(mL/g)
Hardness (N)
EPS Amount (g/mL)
Acetaldehyde Amount (ppm)
Sensory Analysis
11** 4.38 ± 0.06 1.05 ± 0.02 0.302 ± 0.002 272.97 ± 7.08 3.51 x10⁻⁵± 4x10⁻⁶ 28.74 ± 3.00 3.91
12 4.39 ± 0.03 1.04 ± 0.05 0.335 ± 0.003 132.95 ± 40.08
13 4.25 ± 0.02 1.38 ± 0.07 0.327 ± 0.002 228.74 ± 10.12
14 4.19 ± 0.01 1.29 ± 0.02 0.316 ± 0.001 255.09 ± 17.74
15** 4.21 ± 0.02 1.27 ± 0.02 0.278 ± 0.002 265.56 ± 6.44 5.20 x10⁻⁵± 7x10⁻⁶ 31.87 ± 3.24 3.82
16 4.23 ± 0.03 1.27 ± 0.03 0.323 ± 0.001 220.69 ± 43.65
17 4.26 ± 0.02 1.27 ± 0.04 0.306 ± 0.003 215.35 ± 60.74
18 4.18 ± 0.02 1.23 ± 0.01 0.311 ± 0.002 209.09 ± 17.12
19 4.31 ± 0.03 1.14 ± 0.01 0.351 ± 0.001 134.96 ± 2.93
20 4.24 ± 0.03 1.14 ± 0.05 0.303 ± 0.003 174.11 ± 32.73
73
15**
Page 91
74
Table 3.1 All analysis results for yoghurt samples (Cont’d)
Sample Number
Final pH Final TTA*
(% lactic acid)
Whey Separation
(mL/g)
Hardness (N)
EPS Amount (g/mL)
Acetaldehyde Amount (ppm)
Sensory Analysis
21 4.17 ± 0.02 1.18 ± 0.04 0.433 ± 0.005 171.97 ± 52.07
22 4.30 ± 0.02 1.06 ± 0.02 0.299 ± 0.005 239.37 ± 28.49
23 4.30 ± 0.02 1.09 ± 0.01 0.373 ± 0.003 132.32 ± 37.36
24** 4.31 ± 0.01 1.10 ± 0.01 0.278 ± 0.003 321.86 ± 4.33 7.27 x10⁻⁵± 4x10⁻⁶ 42.69 ± 8.12 4.18
25** 4.31 ± 0.02 1.10 ± 0.05 0.324 ± 0.002 286.58 ± 25.02 3.51 x10⁻⁵± 4x10⁻⁶ 39.29 ± 2.76 4.09
26 4.10 ± 0.01 1.30 ± 0.07 0.331 ± 0.001 237.20 ± 70.81
27** 4.15 ± 0.01 1.20 ± 0.03 0.340 ± 0.002 168.68 ± 7.98 3.47 x10⁻⁵± 4x10⁻⁶ 24.52 ± 1.70 3.0
28 4.17 ± 0.03 1.17 ± 0.04 0.305 ± 0.004 194.72 ± 8.51
29** 4.22 ± 0.01 1.17 ± 0.01 0.292 ± 0.002 305.00 ± 50.15 8.35 x10⁻⁵± 7x10⁻⁶ 41.97 ± 2.94 4.09
30** 4.27 ± 0.01 1.14 ± 0.02 0.292 ± 0.003 236.69 ± 31.15 7.74 x10⁻⁵± 9x10⁻⁶ 45.97 ± 3.25 3.91
74
Page 92
75
Table 3.1 All analysis results for yoghurt samples (Cont’d)
Sample Number
Final pH Final TTA*
(% lactic acid)
Whey Separation
(mL/g)
Hardness (N)
EPS Amount (g/mL)
Acetaldehyde Amount (ppm)
Sensory Analysis
31 4.40 ± 0.01 1.10 ± 0.02 0.331 ± 0.001 99.33 ± 22.97
32 4.28 ± 0.01 1.16 ± 0.02 0.340 ± 0.002 119.83 ± 13.90
33 4.39 ± 0.02 1.11 ± 0.03 0.305 ± 0.002 95.42 ± 14.20
34 4.19 ± 0.01 1.22 ± 0.05 0.292 ± 0.004 186.06 ± 7.63
35 4.09 ± 0.03 1.30 ± 0.01 0.293 ± 0.002 225.69 ± 21.00
36 4.11 ± 0.02 1.30 ± 0.03 0.265 ± 0.004 233.91 ± 11.40
37 4.02 ± 0.02 1.33 ± 0.02 0.241 ± 0.004 234.38 ± 31.00
38 4.16 ± 0.02 1.29 ± 0.02 0.332 ± 0.001 178.71 ± 72.49
* Final pH and final TTA values are the values which were measured at the end of the 21-day storage
** These are the yoghurt samples which were selected for the chemical analyses part of the study.
75
Page 93
76
3.3 Physico-Chemical Analyses
3.3.1 pH and Titratable Acidity Determination
Acidity is the most typical characteristic of yoghurt which is affecting consumer
acceptance because that gives the taste to yoghurt and also determines the shelf-life of
product. Since this characteristics have a crucial importance for both producer and
consumer, determination of pH and titratable acidity was one of the most important
aspects of this study. 38 yoghurt samples were studied during storage at 4⁰C for 21
days and measurements were conducted according Chapter 2.2.2. According to
Walstra et al. (2006), preferred yoghurt acidity for consumption is between 4.6 and
4.1. Therefore, these measurements were used to select the sample which has longer
shelf-life. Final pH values of sample were given in Figure 3.4. As seen in the Figure
3.4, six yoghurt samples were below the pH of 4.1 and these were eliminated for the
second part of the study which was the determination of chemical properties and
consumer acceptance part.
Total titratable acidity (TTA) of yoghurt is one of the quality control tests of yoghurt
and should be appropriate to the limits stated in Turkish Codex as between 0.80-1.60
% lactic acid (TS 1330/February 1999). pH and TTA of yoghurt samples increase
with the production of lactic acid which is related with the growth of lactic acid
bacteria. Therefore, in this study, 7 yoghurt samples with the highest TTA values at
the end of the storage period which was 21. day were omitted among the samples
selected for second part of study even if there were in the acceptable limits with
respect to final TTA. Total titratable acidity values of 38 samples were given in
Figure 3.5.
Page 94
77
Figure 3.4 pH values of yoghurt samples at the end of the storage period which was 21. day
3.8
3.9
4
4.1
4.2
4.3
4.4
4.5
8 9 31 33 12 11 24 25 19 23 22 10 32 30 17 13 20 16 29 7 15 6 14 34 18 1 21 28 38 27 5 36 4 26 35 3 2 37
pH
Yoghurt Sample Number
Final pH of Yoghurt Samples
77
Page 95
78
Figure 3.5 Total titratable acidity (TTA) values of yoghurt samples at the end of the storage period which was 21.day
0
0.2
0.4
0.6
0.8
1
1.2
1.4
1.6
9 12 11 22 7 6 23 8 25 24 31 33 1 4 19 20 30 10 32 29 5 28 2 21 3 27 34 18 16 17 15 38 14 36 26 35 37 13
To
tal T
itra
tab
le A
cid
ity
( w
t %
lact
ic a
cid
)
Yoghurt Sample Number
Final TTA of Yoghurt Samples
78
Page 96
79
Industrial starters have a small ratio of L.delbrueckii spp. bulgaricus compared to
S.thermophilus and due to this ratio, enable the production of yoghurt with less
potential of post-acidification (Donkora, 2006). L.delbrueckii spp. bulgaricus seems
to be responsible for post-acidification of yoghurt. In addition, the results of this
study showed that final acidity level of yoghurt depends on L.delbrueckii spp.
bulgaricus strain in the culture. As seen in the Figure 3.6, final pH acidity levels of
yoghurt samples are related with the used L.delbrueckii spp. bulgaricus strain. Figure
3.6 shows that final pH of yogurt samples produced by using 3 different L.delbrueckii
spp. bulgaricus strains which are MRS N4-3, MRS K1-43 and MRS K2-1 and 3
different S.thermophilus strains which are M17 N8-2, M17 K1-14 and M17 S1-3. In
the figure, group 1 shows the final pH of yoghurt samples produced by using
L.delbrueckii spp. bulgaricus MRS N4-3 and 3 S.thermophilus strains and the
average final pH of group 1 was found as 4.37±0.06. Group 2 shows the final pH of
yoghurt samples produced by using L.delbrueckii spp. bulgaricus MRS K1-43 and 3
S.thermophilus strains and the average final pH of group 2 was found as 4.13±0.06.
Finally, group 3 shows the final pH of yoghurt samples produced by using
L.delbrueckii spp. bulgaricus MRS K2-1 and 3 S.thermophilus strains and the
average final pH of group 3 was found as 4.24±0.07. Although final pH of yoghurt
samples are affected by the S.thermophilus strains, final pH of yoghurt samples in the
same group are very close to each other. However, the average final pH of groups are
very different from each other. It can be concluded that L.delbrueckii spp. bulgaricus
strains were much more effective on final pH of yoghurt samples. In addition to that
graphic, two-way ANOVA test and Tukey test were conducted as statistical analysis.
According to two-way ANOVA table both L.delbrueckii spp. bulgaricus and
S.thermophilus strains significantly affect the final pH value of samples. However,
Tukey test results showed that L.delbrueckii spp. bulgaricus strains are significantly
different to each other. Therefore, it can be said that L.delbrueckii spp. bulgaricus is
responsible from post-acidification of yoghurt. The results of statistical analysis were
given in Appendix F.
Page 97
80
Figure 3.6 Effect of L.delbrueckii spp. bulgaricus and S.thermophilus strains on pH value. Group 1; yoghurt produced by using L.delbrueckii spp. bulgaricus strain “MRS N4-3”, group 2; yoghurt produced by using L.delbrueckii spp. bulgaricus strain “MRS K1-43”, group 3; yoghurt produced by using L.delbrueckii spp. bulgaricus strain “MRS K2-1”. Yoghurt sample numbers are given at the top of the columns.
3.90
4.00
4.10
4.20
4.30
4.40
4.50
Group 1 Group 2 Group 3
pH
Val
ueComparison of Effect of LAB on Final pH of Yoghurt
Samples
S.thermophilus M17 N8-2
S.thermophilus M17 K1-14
S.thermophilus M17 S1-3
12 8
23
7
35
10
13
38
80
Page 98
81
3.3.2 Texture Analysis and Whey Separation
Texture and whey syneresis of yoghurt are important parameters for consumer
acceptance and these can be realized by consumers without any device. In this study,
texture analyzer was used to measure the maximum force and whey syneresis was
measured using the methods given at Chapter 2.2.4 (Yılmaz, 2006; Sezgin, Yıldırım,
& Karagül, 1994). The maximum force of yoghurt samples is called the hardness of
yoghurt. For the second part of the experiments, yoghurt samples, which have low
whey syneresis value and high hardness value, were selected. Hardness values of
samples were given in Figure 3.7 and whey syneresis results were given in Figure
3.8.
Page 99
82
Figure 3.7 Peak forces of yoghurt samples which is called as hardness of yoghurt
0
50
100
150
200
250
300
350
24 29 25 11 4 6 15 14 5 2 22 26 30 37 36 13 35 9 16 17 1 18 3 28 7 34 38 20 10 21 27 8 19 12 23 32 31 33
Ma
xim
um
Fo
rce
Sample Number
Hardness of Yoghurt Samples
82
Page 100
83
Figure 3.8 Separation of whey from yoghurt samples
0
0.05
0.1
0.15
0.2
0.25
0.3
0.35
0.4
0.45
0.5
6 37 36 15 24 4 9 29 30 34 35 22 11 20 28 33 17 10 18 14 16 25 13 26 31 38 5 12 27 32 19 3 1 2 23 7 8 21
Se
rum
vo
lum
e (
mL/
g)
Sample Number
Whey Separation of Yoghurt Samples
83
Page 101
84
3.4 Chemical Analyses
3.4.1 Exopolysaccharide Determination
Exopolysaccharide content of samples were determined according to Chapter 2.2.7
and Figure 3.9 shows the results.
Figure 3.9 Exopolysaccharide content of yoghurt samples
0
0.00001
0.00002
0.00003
0.00004
0.00005
0.00006
0.00007
0.00008
0.00009
29 30 24 6 15 9 11 25 27
EP
S a
mo
un
t (g
/mL)
Yoghurt Sample Number
Exopolysaccharide Content of Samples
Page 102
85
In literature, there is a controversy about the effect of exopolysaccharide content of
yoghurt on hardness value of yoghurt. In some researches, it is shown that there is no
significant effect of EPS content on the hardness of yoghurt (Marshall & Rawson,
1999; Ruas-Madiedo, Hugenholtz, & Zoon, 2002). However, some researchers claim
that viscosity and texture of yoghurt is positively affected by the EPS content
(Folkenberg, Dejmek, Skriver, Guldager, & Ipsen, 2006) (Duboc & Mollet, 2001). In
this study, hardness and EPS content of yoghurt samples were measured and
statistical analysis was conducted. According to one-way ANOVA results given in
Appendix H, EPS level of yoghurt samples are not significantly effective on hardness
of yoghurt (p>0.05). In Figure 3.10, hardness and EPS content of yoghurt sample
were given and it can be seen that even though EPS amount is low in yoghurt sample,
hardness value can be high. Yoghurt sample 11 and 25 has high hardness value but as
seen in Figure 3.10, although their EPS amounts are relatively low.
Figure 3.10 Comparison of hardness and EPS content of yoghurt
0
0.00002
0.00004
0.00006
0.00008
0.0001
24 29 25 11 6 15 30 9 270
50
100
150
200
250
300
350
Sample Number
Max
. For
ce
Hardness and EPS Content of Yoghurt Samples
Hardness
EPS content
EP
S c
on
ten
t
Page 103
86
3.4.2 Acetaldehyde Determination
Acetaldehyde is the major aroma compound which gives the characteristic flavor of
yoghurt and importance of acetaldehyde content on flavor characteristics in
fermented milk was clearly demonstrated (Law, 1981) (Bottazzi & Vescovo, 1969)
(Lees & Jago, 1969) (Schmidt, Davidson, & Bates, 1983). Another study on
acetaldehyde content of yoghurt samples produced by Turkish yoghurt isolates was
conducted by Çelik, E. S. (2007). Acetaldehyde contents of 20 yoghurt samples in
Çelik’s study were changing between 13.442±2.69 and 25.444±0.59 mg/L. In this
study, acetaldehyde contents of yoghurt samples were measured and calculated
according to Chapter 2.2.8. Acetaldehyde amounts in yoghurt samples produced by
traditional cultures were varying between 24.25±1.63 and 41.93±3.02 ppm as shown
in the Figure 3.11. Acetaldehyde contents of yoghurt samples produced by
commercial strains were determined as 41.83±2.93 and 45.40±2.47 ppm. The highest
acetaldehyde content was found in one of the commercial culture yoghurt but the
second one was found sample number 24 which was produced by using traditional
cultures.
Page 104
87
Figure 3.11 Acetaldehyde amount of yoghurt samples
3.4.3 Sensory Analysis
The most important parameter in all food industry is the consumer acceptance.
Therefore, sensory analysis was carried out in this study to select the most accepted
yoghurt sample for freeze-drying process. 9 different yoghurts were tried and scored
by 11 participants. Yoghurt samples were rated in terms of appearance, odor and
flavor. According to the results, overall acceptance of samples were significantly
affected by odor and flavor (p<0.05). Figure 3.12 shows the overall scores of the
yoghurt samples and as seen in the figure the highest score was given to the sample
24 which was produced by using traditional cultures. Sensory analysis questionnaire
and statistical analysis results of yoghurt samples were given in Appendix G.
05
101520253035404550
30 24 29 25 15 6 9 11 27
Ace
tald
ehyd
e A
mou
nt
(pp
m)
Yoghurt Sample Number
Acetaldehyde Amount of Yoghurt Samples
Page 105
88
Figure 3.12 Total scores of yoghurt samples
3.5 Effects of Freeze-Drying on Yoghurt Properties
In order to observe the effect of using freeze-dried starter cultures on yoghurt
properties, selected culture combination was freeze-dried and yoghurt samples were
produced by using this freeze-dried culture. pH and TTA change during storage,
whey syneresis, EPS and acetaldehyde content of these yoghurt samples were
determined and then compared with that of yoghurt samples prepared using
commercial freeze-dried culture and non-freze-dried culture. The results of physico-
chemical and chemical analyses were given in Table 3.2 and Table 3.3.
0
0.5
1
1.5
2
2.5
3
3.5
4
4.5
24 25 29 6 11 30 15 9 27
Sco
res
Yoghurt Sample Number
Total Scores of Yoghurt Samples
Page 106
89
Table 3.2 Physico-chemical properties of yoghurt samples produced by freeze-dried
cultures
Yoghurt
Sample Final pH
Final TTA
(% lactic acid)
Whey
Separation
(mL/g)
Hardness
(N)
FD24 4.28 ± 0.02 1.11 ± 0.01 0.236 ± 0.002 334.94 ± 3.42
YCX11 4.25 ± 0.02 1.15 ± 0.01 0.277 ± 0.001 218.94 ± 3.90
24 4.31 ± 0.01 1.10 ± 0.01 0.278 ± 0.003 321.86 ± 4.33
Table 3.3 Chemical properties of yoghurt samples produced by freeze-dried cultures
Yoghurt
Sample EPS Amount (g/mL) Acetaldehyde Amount (ppm)
FD24 6.72 x10⁻⁵± 7x10⁻⁶ 44.99 ± 3.73
YCX11 5.06 x10⁻⁵± 2x10⁻⁶ 48.40 ± 0.65
24 7.27 x10⁻⁵± 4x10⁻⁶ 42.69 ± 8.12
To produce the commercial yoghurt sample for comparison, DVS YO-FLEX YC X11
culture of CHR-Hansen Company was used. This culture is offered to the market as a
structure culture which means that hardness of yoghurt produced by this culture is
high.
Page 107
90
An important difference was recognized during production of yoghurt between the
incubation time of yoghurt samples produced by freeze-dried and conventional
cultures. Although the rate of inoculation was same, it took longer time to decrease
the desired pH. Actually, it can be seen in literature that freeze-drying may cause
some decrease in activity of starter cultures (Bölükbaşı, 1985). However, higher
incubation time may lead some positive aspects on flavor formation and textural
properties (Tamime & Robinson, 2007).
Shelf-life, whey separation, hardness and acetaldehyde content are important quality
parameters from the consumer point of view. Longer shelf-life is determined by the
consumer according the acidity level and mouth-feel of yoghurt during storage. Also,
whey of yoghurt is the unused part of yoghurt by consumers so low whey separation
values is a desired yoghurt property.
An important difference recognized during production of yoghurt samples. The
incubation time of yoghurt sample 24 and yoghurt sample FD24 are very different
from each other and the incubation time of yoghurt sample FD24 was higher. In
literature, activity loss of starters may cause the longer incubation time during
production (Tamime & Robinson, 2007). However, it can be said that with the
increasing bacteria number in yoghurt during fermentation, this activity loss lose its
importance during storage because as seen in the Figure 3.13 and Figure 3.14, final
pH and final TTA results were not affected by freeze-drying process. It is claimed
that yoghurt is firmer at lower pH and longer incubation time means it takes longer
time to reach a certain pH and so certain firmness. Since the gel formation takes
longer time, gel structure become firmer. In Figure 3.15, it can be seen that whey
Page 108
91
syneresis values are much lower in the samples produced by freeze-dried cultures
rather than by conventional ones depending on the firm gel structure.
Figure 3.13 pH values of yoghurt samples at the end of the 21-day storage (FD24:
freeze-dried form of culture 24; YC X11: freeze-dried culture from Chr-Hansen
Company; 24: non-freeze-dried culture)
4.2
4.22
4.24
4.26
4.28
4.3
4.32
24 FD24 YC X11
pH
Sample Number
Final pH of Yoghurt Samples
Page 109
92
Figure 3.14 Total titratable acidity results of yoghurt samples at the end of the 21-
day storage (FD24: freeze-dried form of culture 24; YC X11: freeze-dried culture
from Chr-Hansen Company; 24: non-freeze-dried culture)
1.07
1.08
1.09
1.1
1.11
1.12
1.13
1.14
1.15
1.16
24 FD24 YCX11
TT
A (
% l
act
ic a
cid
)
Yoghurt Samples
Final TTA of Yoghurt Samples
Page 110
93
Figure 3.15 Syneresis results of yoghurt samples (FD24: freeze-dried form of culture
24; YC X11: freeze-dried culture from Chr-Hansen Company; 24: non-freeze-dried
culture)
In Figure 3.16, it can be seen that hardness of yoghurt samples produced by freeze-
dried cultures rather than conventional method have higher hardness value. Although
DVS YO-FLEX YC X11 culture is classified as a texture culture, the hardness value
of this sample was measured lower than the traditional culture samples, both
produced by conventional and freeze-dried ones. Exopolysaccharide content of
yoghurt samples were determined and it was seen that freeze-drying process
decreases the EPS production rate in yoghurt. Freeze-drying process may cause the
loss of plasmid (Bouzar, Cerning, & Desmazeaud, 1997). Therefore, EPS production
rate, depending on the enzymes which are encoded in plasmids, may decrease in
freeze-dried yoghurt samples. Figure 3.17 shows EPS content of yoghurt samples.
0.21
0.22
0.23
0.24
0.25
0.26
0.27
0.28
0.29
24 YC X11 FD24
Wh
ey s
epar
ated
(m
L/g
)
Sample Number
Syneresis of Yoghurt Samples
Page 111
94
Figure 3.16 Hardness of yogurt samples and effect of freeze-drying on textural
properties (FD24: freeze-dried form of culture 24; YC X11: freeze-dried culture from
Chr-Hansen Company; 24: non-freeze-dried culture)
0
50
100
150
200
250
300
350
400
FD24 24 YC X11
Max
imum
For
ce
Sample Number
Hardness of Yoghurt Samples
Page 112
95
Figure 3.17 EPS amount of yoghurt samples and the effect of freeze-drying on EPS
production of selected starter cultures (FD24: freeze-dried form of culture 24; YC
X11: freeze-dried culture from Chr-Hansen Company; 24: non-freeze-dried culture)
Acetaldehyde content of traditional freeze-dried culture sample was determined
higher than the samples produced by conventional method as seen in the Figure 3.18
and it is thought that longer incubation time may provide this increase in
acetaldehyde amount (Tamime & Robinson, 2007). Since DVS YO-FLEX YC X11
culture was used as a commercial reference, it was an expected result that this
commercial sample has better results in the analyses.
0
0.00001
0.00002
0.00003
0.00004
0.00005
0.00006
0.00007
0.00008
24 FD 24 YC X11
EP
S A
mo
un
t (g
/mL)
Yoghurt Samples
EPS Amount of Freeze-Dried Cultures
Page 113
96
Figure 3.18 Acetaldehyde amount in yoghurt samples and the effect of freeze-drying
on the acetaldehyde production of starter cultures (FD24: freeze-dried form of culture
24; YC X11: freeze-dried culture from Chr-Hansen Company; 24: non-freeze-dried
culture)
38
40
42
44
46
48
50
YC X11 FD 24 24
Ace
tald
ehyd
e am
oun
t (p
pm
)
Sample Numbers
Acetaldehyde Amount of Freeze-Dried Cultures
Page 114
97
CHAPTER IV
CONCLUSION
Yoghurt is a dairy product which is consumed all over the world with an increasing
trend. It is produced as a result of the activity of S.thermophilus and L.delbrueckii
spp. bulgaricus. In this study, 7 L.delrueckii spp. bulgaricus isolates, one of these
isolated from commercial culture mixtures, and 8 S.thermophilus isolates, two of
these isolated from commercial culture mixtures, were used to determine the yoghurt
properties produced by these cultures. These cultures were isolated by Neslihan Altay
Dede (2010) and selected as the strains having the best technological properties,
namely, acidification activity and acetaldehyde production. Therefore, these strains
were used in 38 different combination and 38 yoghurt samples were produced and
examined in mainly three steps.
First step was the determination of pH and total titratable acidity (TTA) during 21-
day storage, syneresis determination and texture analysis of 38 yoghurt samples. pH
and TTA measurements are important to determine the shelf life of samples. Also,
whey separation and textural properties are important by the consumer point of view
to see the quality of yoghurt. At the end of the first step 9 yoghurt samples were
chosen in total, two of these produced by commercial strains and one of these as the
yoghurt sample, poor in quality.
Page 115
98
In second step, 9 yoghurt samples were examined with respect to exopolysaccharide
content, acetaldehyde content and consumer perception. At the end of the second step
one yoghurt sample which had the best results in experiments and took the best scores
from panelists was chosen for the third step experiments.
Finally in last step, the strains of culture mixture which produce the best yoghurt
sample were freeze-dried. Two yoghurt samples were produced, one produced by
using freeze-dried form of selected mixture and one produced by using commercial
freeze-dried culture. All experiments were repeated for these two samples to see
difference between the technological properties of these samples and also these
results were compared with the data of selected mixture data before freeze-dried.
Properties of the yoghurt sample made by freeze-dried culture was very close to that
of yoghurt sample made by non-freeze-dried one so it can be said that freeze-drying
process was successful and freeze-drying conditions were appropriate for the isolates.
After the third step, it can be said that one culture mixture was selected which has the
ability of producing yoghurt as well as compete with the commercial cultures.
At the end of all experiments, it can be seen that the selected culture mixture has the
ability to produce high quality yoghurt which is comparable with the commercial
freeze-dried cultures.
Page 116
99
CHAPTER V
RECOMMENDATION
Further studies can be carried on different freeze-drying conditions for the selected
strains to minimize the adverse effects of freeze-drying process on strains because
freeze-drying conditions may change from strain to strain. Bulk production of freeze-
dried culture can be carried on. Freeze-drying of strains in high amount decrease the
death rate during drying process, i.e., working with high amounts may increase the
yield of culture production. Also, pilot-plant scale production can be done to see the
problems during working with high amounts of cultures and yoghurt.
Page 117
100
REFERENCES
Acar Soykut, E., & Tunail, N. (2009). Thermophilic Phages That Cause Failure in
Dairy Industry. Gıda , 34(2): 107-113.
Akın, N. (2006). Modern Yoğurt Bilimi ve Teknolojisi. Konya: Selçuk Üniversitesi.
Al-Dabbagh, W., & Allan, M. (1989). Influence of concentration of non-fat dried
milk solids (NFDM) on growth and acid production of Lactobacillus bulgaricus and
Streptococcus thermophilus. Asian Journal of Dairy Research , 8:115-121.
Altay Dede, N. (2010). Characterization of lactobacillus delbrueckii subspecies
bulgaricus and streptococcus thermophilus as lactic cultures isolated from
traditional Turkish yogurts and subtyping of streptococcus thermophilus using crispr
analysis and mlst. Ankara: METU.
Altschul, A. (1965). Proteins: Their Chemistry and Politics. New York: Basic Books.
Amatayakul, T., Halmos, A., Sherkat, F., & Shah, N. P. (2006). Physical
characteristics of yoghurts made using exopolysaccharide-producing starter cultures
and varying casein to whey protein ratios. International Dairy Journal , 16: 40-51.
Amen, J., & Cabau, M. (1984). Patent No. EU 065 895 B1. European Patent
Application.
Amen, J., & Cabau, M. (1986). Patent No. F2 554 125. French Patent Application.
Page 118
101
Axelsson, L. (2004). Lactic Acid Bacteria: Classification adn Physiology. In S.
Salminen, A. von Wright, & A. Ouwehand, Lactic Acid Bacteria Microbiological and
Functional Aspects, Third Edition, Revised and Expanded (pp. 1-66). New York:
Marcel Dekker.
Beal, C., Louvet, P., & Corrieu, G. (1989). Influence of controlled pH and
temperature on the growth and acidification of pure cultures of Streptococcus
thermophilus 404 and Lactobacillus bulgaricus 398. Applied Microbiology and
Biotechnology , 32:148-154.
BioSource Flavors Inc. (2012). Retrieved May 19, 2012, from
http://www.biosourceflavors.com
Bottazzi, V., & Vescovo, M. (1969). Carbon compounds produced by yoghurt
bacteria. Netherland Milk Dairy Journal , 23: 71.
Bouzar, F., Cerning, J., & Desmazeaud, M. (1997). Exopolysaccharide production
and texture-promoting abilities of mixed-strain starter cultures in yoghurt production.
Journal of Dairy Science , 80: 2310-2317.
Bölükbaşı, U. (1985). Preparation and Freeze-Drying Preservation of Lactic Starter
Cultures. Ankara: METU.
Breslaw, E., & Kleyn, D. (1973). In Vitro Digestibility of Protein in Yoghurt at
Various Stages of Processing. Journal of Food Science, 38 , 1016-1021.
Breslaw, E., & Kleyn, D. (1973). In Vitro Digestibility of Protein in Yoghurt at
Various Stages of Processing. Journal of Food Science, 38 , 1016-1021.
Broadbent, J., McMahon, D., Oberg, C., & Welker, D. (2001). Use of
exopolysaccharide-producing cultures to improve the functionality of low fat cheese.
International Dairy Journal , 11:433-439.
Page 119
102
Butriss, J. (1997). Nutritional properties of fermented milk products. International
Journal of Dairy Technology , 50, 21-27.
Carminati, D., Giraffa, G., Quiberoni, A., Binetti, A., Suarez, V., & Reinheimer, J.
(2010). Advances and Trends in Starter Cultures for Dairy Fermentations. In F.
Mozzi, R. Raya, & G. Vignolo, Biotechnology of Lactic Acid Bacteria: Novel
Applications (pp. 177-192). Ames,Iowa: Blackwell.
Cerning, J., Bouillanne, C., Landon, M., & Desmazeaud, M. (1990). Comparison of
exocellular polysaccharde production by thermophilic lactic acid bacteria. Sciences
des Aliments,10 , 443-451.
Chr. Hansen. (2012). Retrieved May 19, 2012, from http://www.chr-hansen.com
Clerici Sacco International. (2012). Retrieved May 19, 2012, from
http://www.saccosrl.it
CSK Food Enrichment. (2012). Retrieved May 19, 2012, from
http://www.cskfood.com
CSL. (2012). Retrieved May 19, 2012, from http://www.csl.it
Çelik, E. (2007). Determination of Aroma Compounds and Exopolysaccharides
Formation by Lactic Acid Bacteria Isolated From Traditional Yoghurts. Izmir: Izmir
Institute of Technology.
Danisco Inc. (2012). Retrieved May 19, 2012, from http://www.danisco.com
Deeth, H., & Tamime, A. (1981). Yoghurt: nutritive and therapeutic aspects. Journal
of Food Protection 44 , 78-86.
Doe Joint Genome Institute. (n.d.). Retrieved January 11, 2012, from
http://genome.jgi-psf.org/strth/strth.home.html
Page 120
103
Donkora, O. H. (2006). Effect of acidification on the activity of probiotics.
International Dairy Journal , 16:1181–1189.
DSM. (2012). Retrieved May 19, 2012, from http://www.dsm.com
Duboc, P., & Mollet, B. (2001). Applications of exopolysaccharides in the dairy
industry. International Dairy Journal , 11:759-768.
Dyachenko, P. (1971). Chemistry of Milk. Tallinn, Estonia: Ministry of Meat and
Milk Industry.
Fadela, C., Abderrahim, C., & Ahmed, B. (2009). Sensorial and Physico-Chemical
Characteristics of Yoghurt Manufactured with Ewe's and Skim Milk. World Journal
of Dairy & Food Sciences , 4(2): 136-140.
Folkenberg, D., Dejmek, P., Skriver, A., Guldager, H., & Ipsen, R. (2006). Sensory
and rheological screening of exopolysaccharide-producing strains of bacterial yoghurt
cultures. International Dairy Journal , 16 (2): 111-118.
Gallagher, C., Molleson, A., & Caldwell, J. (1974). Lactose intolerance and
fermented dairy products. Journal of American Dietetics Association , 65,418.
Goh, K., Haisman, D., Archer, R., & Singh, H. (2005). Evaluation and modification
of existing methods for the qualification of exopolysaccharides in milk-based media.
Food Research International 38 , 605-613.
Gündoğdu, E., Çakmakçı, S., & Dağdemir, E. (2009). The Effect of Garlic (Allium
sativum L.) on Some Quality Properties and Shelf-Life of Set and Stirred Yoghurt.
Turkish Journal of Veterinary&Animal Sciences , 33 (1): 27-35.
Page 121
104
Gürakan, G., & Altay, N. (2010). Yoghurt Microbiology and Biochemistry. In F.
Yıldız, Development and Manufacture of Yoghurt and Other Functional Dairy
Products (pp. 97-121). Boca Raton, FL: CRC Press, Taylor and Francis Group.
Harper, W., & Hall, C. (1981). Dairy Technology and Engineering. Connecticut: The
Avi Publishing Company.
Hassan, A., Corredig, M., & Frank, J. (2001). Viscoelastic Properties of Yoghurt
Made with Ropy and non-Ropy Exopolysaccharides Producing Cultures.
Milchwissenchaft , 56(12):684-687.
Hepner, G., Fried, R., Jeor, S., Fusett, L., & Morin, R. (1979). Hypocholesterolemic
effect of yogurt and milk. American Journal of Clinical Nutrition 32(1) , 19-24.
Kahraman, E. (2006). Streptococcus salivarius subsp. thermophilus and L.delbrueckii
subsp. bulgaricus suşlarında lizogeninin araştırılması . Ankara: Ankara University.
Kaleli, D., & Tunail, N. (2001). Streptococcus salivarius spp. thermophilus virulent
fajlarının izolasyonu ve yoğurt starter kültürleri üzerine litik etkilerinin belirlenmesi.
XII. Biyoteknoloji Kongresi, (p. 236). Ayvalık.
Kanwal, R., Ahmed, T., & Mirza, B. (2004). Comparative Analysis of Quality of
Milk Collected from Buffalo, Cow, Goat and Sheep of Rawalpindi/Islamabad Region
in Pakistan. Asian Journal of Plant Sciences 3 , 300-305.
Law, B. A. (1981). The formation of aroma and flavor compounds in fermented dairy
products. Dairy Science Abstracts , 43: 143.
Lee, W., & Lucey, J. (2003). Rheological properties, whey separation, and
microstructure in set-style yogurt: effects of heating temperature and gelation
temperature. Journal of Texture Studies , 34, 515-536.
Page 122
105
Lees, G., & Jago, G. (1969). Methods for the Estimation of Acetaldehyde in Cultured
Dairy Products. Australian Journal of Dairy Technology , 71:3203-3213.
Leroy, F., & de Vuyst, L. (2004). Lactic acid bacteria as functional starter cultures for
the food fermentation industry. Trends Food Science Technology 15 , 67-78.
Lin, M., & Young, C. (2000a). Folate levels in cultures of lactic acid bacteria.
International Dairy Journal , 10, 409-413.
Lin, M., & Young, C. (2000b). Biosynthesis of Folates by Streptococcus
thermophilus and Lactobacillus delbruekii ssp. bulgaricus. Journal of Food and Drug
Analysis , 8, 195-199.
Lynch, S. (2000). The effect of calcium on iron absorption. Nutrition Research
Reviews , 13, 141-158.
Marshall, V. M., & Rawson, H. (1999). Effects of exopolysaccharide-producing
strains of thermophilic lactic acid bacteria on the texture of stirred yoghurt.
International Journal of Food Science & Technology , 34 (2): 137-143.
Martini, M., Bollweg, G., Lewitt, M., & Savaiano, D. (1987). American Journal of
Clinical Nutrition , 45,432.
Mayo, B., Aleksandrzak-Piekarczyk, T., Fernandez, M., Kowalczyk, M., Alvarez-
Martin, P., & Bardowski, J. (2010). Updates in the Metabolism of Lactic Acid
Bacteria. In F. Mozzi, R. R. Raya, & G. M. Vignolo, Biotechnology of Lactic Acid
Bacteria: Novel Applications (pp. 3-34). Ames,Iowa: Wiley-Blackwell.
Mayra-Makinen, A., & Birget, M. (2004). Industial Use of Lactic Acid Bacteria. In S.
Salminen, A. von Wrigth, & A. Ouwehand, Lactic Acid Bacteria Microbiological and
Functional Aspects, Third Edition, Revised and Expanded (pp. 175-198). New York:
Marcel Dekker.
Page 123
106
Maysa Dairy&Food Ingredients. (2012). Retrieved May 19, 2012, from
http://www.maysagida.com
McGee, H. (2004). On Food and Cooking: The science of Lore of the Kitchen. New
York: Simon&Schuster.
McKinley, M. (2005). The nutrition and health benefits of yoghurt. International
Journal of Dairy Technology , 58, 1-12.
McLaughlan, P., Anderson, K., Widdowson, E., & Coombs, R. (1981). Effect of heat
on the anaphylactic-sensitising capacity of cows' milk, gots' milk, and various infant
formulae fed to guinea-pigs. Archives of Disease in Childhood 56 , 165-171.
Milci, S., & Yaygın, H. (2005). Exopolysaccharides Produced by Lactic Acid
Bacteria and Their Functionality in Dairy Products. Journal of Food , 30(2):123-129.
Mozzi, F., Oliver, G., De Giori, G., & De Valdez, G. (1995). Influence of temperature
on the production of exopolysaccharides by thermophillic lactic acid bacteria.
Milchwissenschaft , 50(2):80-82.
Mozzi, F., Raya, R. R., & Vignolo, G. M. (2010). Biotechnology of Lactic Acid
Bacteria: Novel Applications. Ames,Iowa: Wiley-Blackwell.
Nikolova, N. (1975). The properties of lyophilized cultures of lactic acid bacteria in
sour milk. Dairy Science Abstracts , 414.
Obi, T. E., Henshaw, F. O., & Atanda, O. O. (2010). Quality Evaluation of Plain-
Stirred Probiotic Yoghurt Produced from Skim and Whole milk Powder during
Refrigerated Storage. Electronic Journal of Environmental, Agricultural and Food
Chemistry , 9 (7): 1203-1213.
Page 124
107
Patel, R., & Chakraborty, B. (1985). Factors affecting the consistency and sensory
properties of Shrikhand. Egyptian Journal of Dairy Science , 13, 73-78.
Patton, S., & Jense, R. (1974). Lipid metabolism and membrane functions of the
mammary gland. Progress in the Chemistry of Fats and Other Lipids 14 , 163-170.
Pette, J., & Lolkema, H. (1950). Yoghurt. III. Acid production and aroma formation
in yoghurt. Netherlands Milk and Dairy Journal , 4, 261-273.
Pochart, P., Dewit, O., Desjeux, J., & Bourlioux, P. (1989). American Journal of
Clinical Nutrition , 49, 828.
Porubcan, R., & Sellars, R. (1979). Lactic Starter Cultures Concentrates. In H.
Peppler, & D. Perlman, Microbial Technology: Microbial Processes (p. 59). New
York: Academic Press.
Poznanski, S., Lenoir, J., & Mocquot, G. (1965). Proteolysis of casein by the intracel-
lular enzymes of certain bacteria. Le Lait 45 , 3.
Rao, D., & Shahani, K. (1987). Vitamin content of cultured dairy products. Cultured
Dairy Products Journal 22(1) , 6-10.
Ruas-Madiedo, P., Hugenholtz, J., & Zoon, P. (2002). An overview of the
functionality of exopolysaccharides produced by lactic acid bacteria. International
Dairy Journal , 12:163-171.
Salminen, S., von Wright, A., & Ouwehand, A. (2004). Lactic Acid Bacteria
Microbiological and Functional Aspects. New York: Marcel Dekker.
Page 125
108
Schmidt, R. H., Davidson, S. M., & Bates, R. P. (1983). Acetaldehyde Determination
in Fermented Food Products by Direct 2,4-Dinitrophenylhydrazine Derivatization,
Extraction and High Performae Liquid Chromatography. Journal of Food Science ,
48: 1556-1557.
Sezgin, E., Yıldırım, Z., & Karagül, Y. (1994). L.acidophilus ve B.bifidium
Kullanılarak Yapılan Bazı Fermente Süt Ürünleri Üzerine Araştırmalar. Ankara:
Tübitak Veterinerlik ve Hayvancılık Araştırma Grubu, Proje No: VHAG-953.
Shurtleff, W., & Aoyagi, A. (2007). History of Soybeans and Soyfoods: 1100 B.C. to
the 1980s. . California: Soyinfo Center.
Smid, E., Starrenburg, M., Mireau, I., Sybesma, W., & Hugenholtz, J. (2001).
Increase of folate levels in fermented foods. Innovations in Food Technology ,
February/March, 13-15.
Spreer, E. (1998). Milk and Dairy Product Technology. New York: Marcel Dekker.
Şahin, A. (2011, June 17). Federation of Food&Drink Industry Association of
Turkey. Retrieved November 26, 2011, from http://www.tgdf.org.tr/turkce/
tgdf_envanter/TGDF_envanter2010.pdf
Tamime, A., & Deeth, H. (1980). Yogurt: Technology and Biochemistry. Journal of
Food Protection , 43, 939-977.
Tamime, A., & Law, B. (2001). In Mechanisation and Automation in Dairy
Technology. Sheffield: Sheffield Academic Press.
Tamime, A., & Robinson, R. (2007). Tamime and Robinson's Yoghurt Science and
Technology. Cambridge: Woodhead Publishing Limited.
Page 126
109
Tsvetkov, T., & Shishkova, I. (1982). Studies on the Effects of Low Temperatures on
Lactic Acid Bacteria. Cryobiology , 19: 211-214.
Turkish Standard, TS 1330/February 1999. Yoghurt. Ankara: Turkish Standard
Institution.
Turkish Standard, TS 10935/April 1993. Rules of Yoghurt Manufacture. Ankara:
Turkish Standards Institution.
Utah State University. (n.d.). Retrieved January 11, 2012, from
http://bioweb.usu.edu/microscopy/Research.htm
Vaughan, E., Heilig, H., Ben-Amor, K., & de Vos, W. (2005). Diversity, vitality and
activities of intestinal lactic acid bacteria and bifidobacteria assessed by molecular
approaches. FEMS Microbiology Reviews 29 , 477-490.
Walstra, P., Wouters, J., & Geurts, T. (2006). Dairy science and Technology. Boca
Raton: Taylor&Francis Group.
Webb, B., & Whittier, E. (1970). Byproducts from milk. Connecticut: The Avi
Publishing Company.
White, C. (1995). Manufacture of high quality yoghurt. Cultured Dairy Products
Journal, 30(2) , 18-26.
Wright, C., & Klaenhammer, T. (1983). Influence of Calcium and Manganese on
Dechaining of Lactobacillus bulgaricus. Applied and Environmental Microbiology ,
46; 785-792.
Yaygın, H. (1988). Süt Endüstrisinde Konsantre Dondurulmuş Starter Kültür
Kullanımı. Gıda , 13(2); 93-98.
Page 127
110
Yılmaz, L. (2006). Yoğurt ve Benzeri Fermente Ürünleri Üretiminde Farklı
Probiyotik Kültür Kombinasyonlarının Kullanımı. Bursa: Uludağ Üniversitesi.
Yukuchi, H., Goto, T., & Okonogi, S. (1992). The Nutritional and Physiological
Value of Fermented Milks and Lactic Milk Drinks. In Y. Nakazawa, & A. Hosona,
Functions of Fermented Milk: Challenges for the Health Sciences (pp. 217-245).
London: Elsevier Science.
Zourari, A., Accolas, J., & Desmazeaud, M. (1992). Metabolism and biochemical
characteristics of yogurt bacteria. A review. Lait , 1-34.
Page 128
111
APPENDIX A
CHEMICAL USED IN EXPERIMENTS
Table A.1 Chemicals used in experiments
M17 Broth Merck 1.15029
MRS Broth Merck 1.10661
Sodium hydroxide, NaOH Merck 1.06498
Iodine Merck 1.04761
Potassium Iodide Merck 1.05051
Starch Sigma S4126
Phenol crystalline AppliChem A1594
Sulphuric acid, H2SO4 Merck 1.00713
Sodium bisulphate, NaHSO3 Riedel-de Haen 13437
Sodium bicarbonate, NaHCO3 Sigma S5761
Ethanol Merck 1.00983
Flavourenzyme Sigma P6110
Page 129
112
APPENDIX B
pH OF YOGHURT SAMPLES DURING 21-DAY STORAGE
Table B.1 pH change of yoghurt samples during 21-day storage
Sample Number
pH
Day 1 Day 4 Day 7 Day 14 Day 21
1 4.48 4.41 4.49
4.27 4.24 4.26
4.18 4.20 4.23
4.18 4.20 4.21
4.16 4.17 4.19
2 4.43 4.38 4.40
4.32 4.30 4.30
4.25 4.22 4.23
4.16 4.11 4.11
4.08 4.04 4.07
3 4.51 4.50 4.54
4.43 4.44 4.44
4.29 4.29 4.30
4.15 4.13 4.13
4.08 4.07 4.10
4 4.54 4.52 4.54
4.46 4.45 4.41
4.34 4.34 4.30
4.19 4.17 4.16
4.11 4.08 4.10
5 4.43 4.41 4.48
4.22 4.21 4.26
4.17 4.20 4.22
4.13 4.19 4.18
4.09 4.11 4.13
6 4.54 4.58 4.52
4.33 4.31 4.25
4.26 4.31 4.24
4.22 4.24 4.24
4.20 4.21 4.20
7 4.43 4.44 4.49
4.27 4.28 4.31
4.25 4.24 4.27
4.22 4.22 4.26
4.22 4.20 4.22
8 4.64 4.68 4.65
4.49 4.51 4.52
4.45 4.50 4.48
4.44 4.48 4.42
4.43 4.47 4.40
Page 130
113
Table B.1 pH change of yoghurt samples during 21-day storage (Cont’d)
Sample Number
pH
Day 1 Day 4 Day 7 Day 14 Day 21
9 4.69 4.61 4.67
4.50 4.47 4.49
4.49 4.46 4.47
4.46 4.46 4.44
4.45 4.42 4.42
10 4.59 4.52 4.56
4.43 4.41 4.46
4.39 4.37 4.38
4.32 4.34 4.33
4.28 4.30 4.31
11 4.57 4.63 4.62
4.41 4.49 4.45
4.39 4.46 4.42
4.34 4.41 4.39
4.32 4.44 4.39
12 4.63 4.60 4.60
4.54 4.50 4.52
4.47 4.44 4.45
4.44 4.39 4.40
4.42 4.37 4.37
13 4.40 4.43 4.42
4.38 4.41 4.37
4.33 4.37 4.34
4.26 4.29 4.26
4.24 4.27 4.23
14 4.39 4.37 4.36
4.37 4.35 4.35
4.33 4.31 4.32
4.22 4.22 4.20
4.19 4.20 4.19
15 4.45 4.40 4.42
4.38 4.36 4.36
4.36 4.32 4.33
4.28 4.24 4.27
4.19 4.22 4.23
16 4.33 4.39 4.37
4.29 4.35 4.31
4.29 4.31 4.27
4.23 4.27 4.25
4.21 4.26 4.22
17 4.44 4.40 4.43
4.35 4.35 4.32
4.34 4.35 4.30
4.27 4.28 4.26
4.27 4.26 4.24
18 4.30 4.34 4.35
4.26 4.27 4.27
4.25 4.26 4.25
4.20 4.20 4.18
4.19 4.18 4.16
19 4.45 4.51 4.49
4.40 4.37 4.41
4.35 4.35 4.36
4.30 4.32 4.34
4.28 4.31 4.33
Page 131
114
Table B.1 pH change of yoghurt samples during 21-day storage (Cont’d)
Sample Number
pH
Day 1 Day 4 Day 7 Day 14 Day 21
20 4.50 4.46 4.47
4.37 4.32 4.35
4.34 4.27 4.30
4.33 4.25 4.29
4.27 4.21 4.23
21 4.40 4.39 4.40
4.32 4.32 4.31
4.29 4.29 4.30
4.21 4.24 4.23
4.15 4.17 4.19
22 4.43 4.47 4.43
4.39 4.40 4.40
4.36 4.36 4.35
4.33 4.31 4.30
4.31 4.31 4.28
23 4.46 4.42 4.45
4.40 4.36 4.39
4.39 4.34 4.37
4.35 4.31 4.32
4.33 4.29 4.29
24 4.47 4.44 4.46
4.42 4.41 4.41
4.37 4.36 4.35
4.34 4.35 4.34
4.31 4.32 4.31
25 4.47 4.41 4.45
4.42 4.37 4.39
4.40 4.34 4.35
4.35 4.31 4.31
4.33 4.29 4.30
26 4.46 4.44 4.47
4.33 4.27 4.29
4.24 4.17 4.21
4.15 4.16 4.15
4.10 4.09 4.10
27 4.51 4.51 4.55
4.37 4.38 4.41
4.21 4.20 4.25
4.17 4.18 4.17
4.15 4.16 4.15
28 4.53 4.52 4.50
4.43 4.38 4.40
4.25 4.21 4.21
4.21 4.19 4.18
4.20 4.15 4.16
29 4.47 4.52 4.53
4.41 4.44 4.43
4.35 4.36 4.33
4.26 4.25 4.26
4.22 4.23 4.21
30 4.54 4.57 4.55
4.45 4.47 4.49
4.41 4.40 4.42
4.36 4.37 4.36
4.28 4.26 4.26
Page 132
115
Table B.1 pH change of yoghurt samples during 21-day storage (Cont’d)
Sample Number
pH
Day 1 Day 4 Day 7 Day 14 Day 21
31 4.53 4.55 4.55
4.49 4.50 4.48
4.45 4.48 4.45
4.42 4.44 4.43
4.40 4.41 4.40
32 4.45 4.46 4.50
4.40 4.40 4.43
4.38 4.34 4.37
4.35 4.32 4.33
4.29 4.28 4.28
33 4.52 4.56 4.55
4.48 4.50 4.51
4.44 4.42 4.48
4.40 4.41 4.43
4.41 4.38 4.39
34 4.47 4.48 4.42
4.43 4.43 4.39
4.34 4.33 4.33
4.25 4.25 4.28
4.20 4.18 4.20
35 4.53 4.47 4.52
4.42 4.40 4.40
4.27 4.25 4.27
4.22 4.18 4.17
4.08 4.12 4.07
36 4.55 4.51 4.51
4.42 4.43 4.40
4.28 4.25 4.26
4.22 4.21 4.18
4.13 4.10 4.09
37 4.45 4.40 4.37
4.30 4.27 4.28
4.18 4.17 4.17
4.09 4.13 4.12
4.02 4.00 4.03
38 4.40 4.44 4.44
4.33 4.32 4.35
4.24 4.26 4.29
4.22 4.20 4.24
4.18 4.16 4.15
FD24 4.52 4.54 4.54
4.45 4.47 4.42
4.35 4.35 4.39
4.30 4.30 4.33
4.27 4.27 4.30
YCX11 4.49 4.46 4.50
4.42 4.40 4.39
4.35 4.36 4.33
4.31 4.29 4.30
4.25 4.24 4.25
Page 133
116
APPENDIX C
TITRATABLE ACIDITY OF YOGHURT SAMPLES DURING 21-DAY
STORAGE
Table C.1 Titratable acidity of yoghurt samples during 21-day storage
Sample Number
Titratable Acidity (% lactic acid)
Day 1 Day 4 Day 7 Day 14 Day 21
1 0.992 0.989 0.987
1.057 1.060 1.059
1.071 1.070 1.070
1.082 1.079 1.080
1.114 1.119 1.112
2 1.001 1.007 1.006
1.036 1.035 1.035
1.068 1.066 1.068
1.118 1.115 1.119
1.175 1.181 1.180
3
0.980 0.976 0.980
1.012 1.010 1.014
1.048 1.053 1.050
1.111 1.113 1.110
1.181 1.182 1.180
4
0.967 0.971 0.967
0.996 0.996 0.998
1.021 1.029 1.022
1.096 1.103 1.097
1.120 1.124 1.122
5 1.008 1.007 1.005
1.089 1.093 1.086
1.135 1.138 1.130
1.149 1.147 1.147
1.172 1.180 1.172
6 0.946 0.943 0.946
1.040 1.038 1.043
1.078 1.081 1.079
1.081 1.084 1.083
1.094 1.090 1.095
Page 134
117
Table C.1 Titratable acidity of yoghurt samples during 21-day storage (Cont’d)
Sample
Number
Titratable Acidity (% lactic acid)
Day 1 Day 4 Day 7 Day 14 Day 21
7 0.997 1.005 0.999
1.036 1.043 1.038
1.053 1.059 1.053
1.073 1.076 1.075
1.085 1.088 1.082
8 0.858 0.863 0.860
0.885 0.890 0.887
0.951 0.948 0.955
1.003 1.006 1.000
1.098 1.096 1.099
9 0.796 0.799 0.796
0.903 0.903 0.906
0.944 0.949 0.941
0.955 0.950 0.958
1.000 1.008 1.004
10 0.874 0.874 0.877
0.893 0.891 0.892
0.940 0.941 0.939
1.053 1.058 1.053
1.154 1.148 1.154
11 0.824 0.822 0.825
0.843 0.849 0.847
0.938 0.942 0.941
0.980 0.981 0.981
1.049 1.052 1.053
12 0.871 0.869 0.870
0.893 0.897 0.896
0.923 0.920 0.921
1.022 1.022 1.020
1.041 1.050 1.044
13 0.978 0.984 0.979
1.051 1.055 1.052
1.122 1.124 1.124
1.190 1.187 1.188
1.383 1.392 1.379
14 0.906 0.901 0.902
1.051 1.043 1.047
1.092 1.096 1.095
1.106 1.115 1.108
1.287 1.290 1.288
15 0.963 0.968 0.961
1.067 1.071 1.065
1.091 1.090 1.090
1.132 1.134 1.136
1.273 1.272 1.276
Page 135
118
Table C.1 Titratable acidity of yoghurt samples during 21-day storage (Cont’d)
Sample Number
Titratable Acidity (% lactic acid)
Day 1 Day 4 Day 7 Day 14 Day 21
16 0.947 0.940 0.948
1.085 1.091 1.084
1.125 1.135 1.129
1.131 1.132 1.131
1.265 1.269 1.271
17 0.959 0.952 0.955
1.078 1.076 1.080
1.110 1.109 1.110
1.153 1.148 1.152
1.269 1.276 1.272
18 0.944 0.942 0.944
1.074 1.073 1.076
1.087 1.095 1.091
1.117 1.123 1.118
1.228 1.231 1.229
19 1.004 0.996 1.005
1.034 1.040 1.037
1.044 1.050 1.042
1.114 1.107 1.112
1.139 1.137 1.139
20 0.982 0.982 0.986
1.003 1.002 1.008
1.051 1.054 1.053
1.053 1.053 1.057
1.140 1.131 1.138
21 0.952 0.955 0.952
1.045 1.044 1.047
1.054 1.052 1.057
1.118 1.124 1.119
1.181 1.175 1.182
22 0.959 0.965 0.958
1.005 1.001 0.997
1.030 1.028 1.029
1.037 1.044 1.040
1.063 1.064 1.061
23 0.975 0.980 0.978
1.009 1.007 1.005
1.033 1.038 1.032
1.068 1.069 1.065
1.097 1.096 1.095
24 0.998 1.004 0.996
1.001 1.001 1.002
1.019 1.023 1.022
1.032 1.037 1.035
1.100 1.103 1.102
Page 136
119
Table C.1 Titratable acidity of yoghurt samples during 21-day storage (Cont’d)
Sample Number
Titratable Acidity (% lactic acid)
Day 1 Day 4 Day 7 Day 14 Day 21
25 0.967 0.972 0.967
1.049 1.053 1.049
1.057 1.051 1.058
1.079 1.083 1.081
1.098 1.105 1.097
26 0.973 0.970 0.971
1.011 1.010 1.017
1.049 1.050 1.053
1.199 1.199 1.200
1.302 1.305 1.292
27 0.918 0.914 0.918
0.953 0.957 0.955
1.089 1.087 1.084
1.125 1.120 1.130
1.205 1.202 1.207
28 0.973 0.975 0.974
1.076 1.082 1.079
1.074 1.079 1.072
1.158 1.163 1.160
1.175 1.171 1.179
29 0.942 0.946 0.942
1.035 1.038 1.037
1.078 1.084 1.081
1.149 1.153 1.150
1.169 1.170 1.169
30 0.932 0.934 0.932
0.973 0.977 0.977
1.038 1.032 1.036
1.078 1.083 1.079
1.140 1.144 1.142
31 0.857 0.851 0.854
0.905 0.906 0.904
1.011 1.013 1.013
1.061 1.059 1.060
1.105 1.103 1.102
32 0.954 0.949 0.947
0.999 1.001 1.000
1.096 1.103 1.095
1.130 1.130 1.130
1.158 1.158 1.154
33 0.897 0.890 0.893
0.978 0.983 0.980
1.036 1.046 1.041
1.074 1.083 1.079
1.111 1.105 1.107
Page 137
120
Table C.1 Titratable acidity of yoghurt samples during 21-day storage (Cont’d)
Sample Number
Titratable Acidity (% lactic acid)
Day 1 Day 4 Day 7 Day 14 Day 21
34 1.041 1.045 1.039
1.082 1.077 1.085
1.141 1.142 1.143
1.194 1.186 1.191
1.217 1.226 1.224
35 0.996 1.002 0.999
1.031 1.040 1.033
1.134 1.138 1.132
1.191 1.192 1.190
1.304 1.304 1.302
36 0.950 0.956 0.952
1.051 1.048 1.055
1.124 1.117 1.125
1.149 1.147 1.148
1.301 1.307 1.305
37 1.011 1.016 1.014
1.100 1.101 1.100
1.160 1.160 1.162
1.197 1.205 1.200
1.334 1.337 1.333
38 1.010 1.012 1.010
1.048 1.053 1.049
1.110 1.111 1.111
1.173 1.177 1.173
1.286 1.290 1.288
FD24 0.913 0.911 0.913
0.982 0.985 0.987
1.027 1.032 1.030
1.047 1.053 1.047
1.108 1.115 1.110
YCX11 0.930 0.937 0.935
1.018 1.021 1.018
1.068 1.070 1.067
1.119 1.116 1.115
1.146 1.156 1.150
Page 138
121
APPENDIX D
WHEY SEPARATION AND HARDNESS RESULTS
Table D.1 Whey separation and hardness results of yoghurt samples
Sample Number Whey Separation (mL/g) Hardness (N)
1 0.361 0.359 0.365
176.098 269.104 184.323
2 0.373 0.374 0.370
270.369 227.276 227.135
3 0.353 0.357 0.352
208.506 200.000 176.942
4 0.279 0.284 0.278
278.946 248.647 284.359
5 0.331 0.336 0.331
242.109 249.069 235.220
6 0.203 0.209 0.204
259.543 345.378 200.492
7 0.375 0.384 0.371
202.460 191.494 184.183
Page 139
122
Table D.1 Whey separation and Hardness results of yoghurt samples (Cont’d)
Sample Number Whey Separation (mL/g) Hardness (N)
8 0.382 0.382 0.377
182.483 128.567 143.610
9 0.281 0.284 0.283
267.276 221.863 186.011
10 0.312 0.313 0.306
158.934 185.365 177.422
11 0.300 0.303 0.304
270.762 280.884 267.248
12 0.332 0.335 0.338
94.405 174.399 130.044
13 0.328 0.328 0.325
218.684 228.596 238.929
14 0.315 0.316 0.316
266.264 234.633 264.366
15
0.278 0.279 0.276
272.660 263.944 260.078
16 0.323 0.323 0.322
247.426 170.316 244.333
Page 140
123
Table D.1 Whey separation and Hardness results of yoghurt samples (Cont’d)
Sample Number Whey Separation (mL/g) Hardness (N)
17 0.306 0.303 0.308
227.744 149.369 268.935
18 0.310 0.313 0.310
223.245 213.967 190.068
19 0.352 0.351 0.351
131.918 137.752 135.222
20 0.300 0.306 0.304
196.015 189.830 136.487
21 0.430 0.439 0.431
169.350 121.265 225.308
22 0.295 0.297 0.304
212.561 269.286 236.249
23 0.371 0.371 0.376
90.117 161.184 145.649
24 0.277 0.275 0.281
317.717 326.363 321.513
25 0.324 0.326 0.323
310.828 288.054 260.851
26 0.330 0.330 0.332
189.961 203.037 318.616
Page 141
124
Table D.1 Whey separation and hardness results of yoghurt samples (Cont’d)
Sample Number Whey Separation (mL/g) Hardness (N)
27 0.341 0.342 0.338
176.533 168.940 160.574
28 0.307 0.308 0.301
192.351 204.162 187.641
29 0.290 0.294 0.291
328.670 338.934 247.399
30 0.295 0.293 0.289
207.888 232.424 269.755
31 0.332 0.332 0.330
121.306 101.205 75.482
32 0.332 0.332 0.330
108.374 115.824 135.292
33 0.307 0.303 0.304
102.611 104.579 79.067
34 0.287 0.295 0.292
190.744 190.182 177.250
35 0.293 0.292 0.295
210.319 249.613 217.138
36 0.264 0.261 0.269
225.151 246.802 229.791
Page 142
125
Table D.1 Whey separation and hardness results of yoghurt samples (Cont’d)
Sample Number Whey Separation (mL/g) Hardness (N)
37 0.246 0.238 0.240
269.436 223.113 210.600
38 0.333 0.333 0.331
257.908 162.590 115.633
FD24 0.234 0.236 0.237
334.938 338.640 331.892
YC X11 0.278 0.277 0.277
219.012 222.808 215.006
Page 143
126
APPENDIX E
GLUCOSE CURVE, EXOPOLYSACCHARIDE AND ACETALDEHYDE
CONTENT OF YOGHURT SAMPLES
Figure E.1 Glucose curve used in EPS quantification
y = 0.0002x
R² = 0.9977
0
0.00005
0.0001
0.00015
0.0002
0.00025
0 0.2 0.4 0.6 0.8 1 1.2
Glu
cose
am
ou
nt
g/m
L
Optical Density
Glucose Standard Curve at 485 nm
Page 144
127
Table E.1 Exopolysaccharide and acetaldehyde content of yoghurt samples
Sample Number EPS Content (g/mL) Acetaldehyde Content (ppm)
6 0.0000504 0.0000580 0.0000567
30.708 30.345 30.986
9 0.0000308 0.0000362 0.0000434
29.194 29.587 28.598
11 0.0000390 0.0000316 0.0000347
30.584 25.287 30.375
15 0.0000444 0.0000529 0.0000586
29.333 35.518 30.755
24 0.0000684 0.0000772 0.0000726
49.953 33.911 44.211
25 0.0000308 0.0000350 0.0000382
42.463 37.931 37.465
27 0.0000222 0.0000392 0.0000306
25.882 22.617 25.071
29 0.0000896 0.0000766 0.0000843
44.767 38.900 42.230
30 0.0000769 0.0000680 0.0000874
64.390 58.278 59.404
FD24 0.0000667 0.0000604 0.0000744
47.685 40.741 46.550
Page 145
128
Table E.1 Exopolysaccharide and acetaldehyde content of yoghurt samples (Cont’d)
Sample Number EPS Content (g/mL) Acetaldehyde Content (ppm)
YCX11 0.0000526 0.0000484 0.0000507
48.32856 49.07856 47.77887
Page 146
129
APPENDIX F
EFFECT OF SPECIES ON POST-ACIDIFICATION OF YOGHURT
SAMPLES
Table F.1 ANOVA Table for the effect of species on post-acidification of yoghurt samples
Factor Type Levels Values
Lb fixed 3 MRSK1-43. MRSK2-1. MRSN4-3
St fixed 3 M17K1-14. M17N8-2. M17S1-3
Analysis of Variance for pH. using Adjusted SS for Tests
Source DF Seq SS Adj SS Adj MS F P
Lb 2 0.259074 0.259074 0.129537 74.23 0.000
St 2 0.051674 0.051674 0.025837 14.81 0.000
Error 22 0.038393 0.038393 0.001745
Total 26 0.349141
S = 0.0417746 R-Sq = 89.00% R-Sq(adj) = 87.00%
Unusual Observations for pH
Obs pH Fit SE Fit Residual St Resid
11 4.47000 4.38037 0.01798 0.08963 2.38 R
R denotes an observation with a large standardized residual.
Tukey 95.0% Simultaneous Confidence Intervals
Response Variable pH
All Pairwise Comparisons among Levels of Lb
Lb = MRSK1-43 subtracted from:
Lb Lower Center Upper ---+---------+---------+---------+---
MRSK2-1 0.05057 0.1000 0.1494 (------*------)
MRSN4-3 0.18946 0.2389 0.2883 (------*------)
---+---------+---------+---------+---
0.070 0.140 0.210 0.280
Page 147
130
Table F.1 ANOVA Table for the effect of species on post-acidification of yoghurt
samples (Cont’d)
Lb = MRSK2-1 subtracted from:
Lb Lower Center Upper ---+---------+---------+---------+---
MRSN4-3 0.08946 0.1389 0.1883 (------*------)
---+---------+---------+---------+---
0.070 0.140 0.210 0.280
Tukey Simultaneous Tests
Response Variable pH
All Pairwise Comparisons among Levels of Lb
Lb = MRSK1-43 subtracted from:
Difference SE of Adjusted
Lb of Means Difference T-Value P-Value
MRSK2-1 0.1000 0.01969 5.078 0.0001
MRSN4-3 0.2389 0.01969 12.131 0.0000
Lb = MRSK2-1 subtracted from:
Difference SE of Adjusted
Lb of Means Difference T-Value P-Value
MRSN4-3 0.1389 0.01969 7.053 0.0000
Tukey 95.0% Simultaneous Confidence Intervals
Response Variable pH
All Pairwise Comparisons among Levels of St
St = M17K1-14 subtracted from:
St Lower Center Upper --+---------+---------+---------+----
M17N8-2 -0.0050 0.04444 0.09388 (------*------)
M17S1-3 -0.1117 -0.06222 -0.01279 (------*------)
--+---------+---------+---------+----
-0.140 -0.070 0.000 0.070
St = M17N8-2 subtracted from:
St Lower Center Upper --+---------+---------+---------+----
M17S1-3 -0.1561 -0.1067 -0.05723 (------*------)
--+---------+---------+---------+----
-0.140 -0.070 0.000 0.070
Page 148
131
Table F.1 ANOVA Table for the effect of species on post-acidification of yoghurt
samples (Cont’d)
Tukey Simultaneous Tests
Response Variable pH
All Pairwise Comparisons among Levels of St
St = M17K1-14 subtracted from:
Difference SE of Adjusted
St of Means Difference T-Value P-Value
M17N8-2 0.04444 0.01969 2.257 0.0836
M17S1-3 -0.06222 0.01969 -3.160 0.0121
St = M17N8-2 subtracted from:
Difference SE of Adjusted
St of Means Difference T-Value P-Value
M17S1-3 -0.1067 0.01969 -5.417 0.0001
Page 149
132
APPENDIX G
SENSORY ANALYSIS RESULTS
Table G.1 ANOVA Table for the effect of appearance on the consumer choice
ANALYSIS OF VARIANCE ON appearance
SOURCE DF SS MS F p
overall 3 4.154 1.385 1.74 0.165
ERROR 95 75.805 0.798
TOTAL 98 79.960
INDIVIDUAL 95% CI'S FOR MEAN
BASED ON POOLED STDEV
LEVEL N MEAN STDEV ---+---------+---------+---------+---
2 4 4.2500 0.9574 (-----------------*-----------------)
3 31 3.9032 1.1062 (-----*-----)
4 44 4.3182 0.7400 (----*-----)
5 20 4.4000 0.8208 (-------*-------)
---+---------+---------+---------+---
POOLED STDEV = 0.8933 3.50 4.00 4.50 5.00
Page 150
133
Table G.1 ANOVA Table for the effect of appearance on the consumer choice (Cont’d)
Tukey's pairwise comparisons
Family error rate = 0.0500
Individual error rate = 0.0104
Critical value = 3.70
Intervals for (column level mean) - (row level mean)
2 3 4
3 -0.8949
1.5884
4 -1.2887 -0.9630
1.1523 0.1331
5 -1.4301 -1.1671 -0.7121
1.1301 0.1735 0.5484
Page 151
134
Table G.2 ANOVA Table for the effect of odor on the consumer choice
ANALYSIS OF VARIANCE ON odor
SOURCE DF SS MS F p
overall 3 32.012 10.671 18.22 0.000
ERROR 95 55.624 0.586
TOTAL 98 87.636
INDIVIDUAL 95% CI'S FOR MEAN
BASED ON POOLED STDEV
LEVEL N MEAN STDEV -+---------+---------+---------+-----
2 4 3.5000 1.2910 (----------*----------)
3 31 3.3548 0.9504 (---*---)
4 44 4.2273 0.7108 (--*---)
5 20 4.9000 0.3078 (----*----)
-+---------+---------+---------+-----
POOLED STDEV = 0.7652 2.80 3.50 4.20 4.90
Tukey's pairwise comparisons
Family error rate = 0.0500
Individual error rate = 0.0104
Critical value = 3.70
Intervals for (column level mean) - (row level mean)
2 3 4
3 -0.9184
1.2088
4 -1.7728 -1.3419
0.3182 -0.4030
5 -2.4965 -2.1193 -1.2126
-0.3035 -0.9710 -0.1328
Page 152
135
Table G.3 ANOVA Table for the effect of flavor on the consumer choice
ANALYSIS OF VARIANCE ON flavor
SOURCE DF SS MS F p
overall 3 13.969 4.656 5.66 0.001
ERROR 95 78.213 0.823
TOTAL 98 92.182
INDIVIDUAL 95% CI'S FOR MEAN
BASED ON POOLED STDEV
LEVEL N MEAN STDEV -+---------+---------+---------+-----
2 4 3.2500 1.5000 (--------------*--------------)
3 31 3.2581 1.0945 (----*-----)
4 44 3.9773 0.7621 (---*----)
5 20 4.1500 0.7452 (------*------)
-+---------+---------+---------+-----
POOLED STDEV = 0.9074 2.40 3.00 3.60 4.20
Tukey's pairwise comparisons
Family error rate = 0.0500
Individual error rate = 0.0104
Critical value = 3.70
Intervals for (column level mean) - (row level mean)
2 3 4
3 -1.2693
1.2531
4 -1.9670 -1.2759
0.5125 -0.1626
5 -2.2002 -1.5728 -0.8129
0.4002 -0.2111 0.4675
Page 153
136
Sample 6 Sample 11 Sample 15 Sample 24 Sample 25 Sample 27 Sample 29 Sample 30
Appearance
Odor
Flavor
Overall
5- Very good 4- Good 3- Normal 2- Bad 1- Very bad
Figure G.1 Sensory analysis questionnaire
136
Page 154
137
APPENDIX H
EFFECT OF EPS CONTENT ON HARDNESS OF YOGHURT SAMPLES
Table H.1 ANOVA Table for the effect of EPS content on hardness of yoghurt
samples
Source DF SS MS F P
EPS content 24 72068 3003 5.02 0.179
Error 2 1197 598
Total 26 73264
S = 24.46 R-Sq = 98.37% R-Sq(adj) = 78.77%
Individual 95% CIs For Mean Based on
Pooled StDev
Level N Mean StDev ----+---------+---------+---------+-----
0.111 1 176.53 * (----------*---------)
0.154 3 282.2 24.46 (-----*-----)
0.158 1 280.88 * (---------*----------)
0.173 1 260.08 * (----------*----------)
0.177 1 260.85 * (---------*----------)
0.186 1 247.40 * (----------*---------)
0.191 1 288.05 * (----------*---------)
0.195 1 270.76 * (---------*----------)
0.196 1 168.94 * (----------*---------)
0.217 1 221.86 * (---------*----------)
0.222 1 272.66 * (---------*----------)
0.252 1 259.54 * (----------*---------)
0.258 1 267.25 * (----------*---------)
0.271 1 321.51 * (---------*----------)
0.290 1 345.38 * (----------*---------)
0.293 1 263.94 * (---------*----------)
0.340 1 207.89 * (----------*---------)
0.342 1 317.72 * (----------*---------)
0.364 1 200.49 * (---------*----------)
0.383 1 338.93 * (----------*---------)
0.386 1 326.36 * (----------*---------)
0.389 1 160.57 * (---------*----------)
0.416 1 186.01 * (----------*---------)
0.437 1 232.42 * (---------*----------)
0.448 1 328.67 * (----------*---------)
----+---------+---------+---------+-----
100 200 300 400
Pooled StDev = 24.46
Page 155
138
APPENDIX I
PHOTOS OF YOGHURT SAMPLES
Page 156
139
APPENDIX J
ACIDIFICATION ACTIVITY AND ACETALDEHYDE PRODUCTION
PROPERTIES OF SELECTED L.DELBRUECKĐĐ SPP. BULGARICUS AND
S.THERMOPHILUS STRAINS
Table J.1 Acidification activity of selected S.thermophilus strains (Altay Dede, 2010)
S.thermophilus Strains ∆pH at 6th hour
M17 K1-14 1.58
M17 N2-3 1.66
M17 N8-2 1.65
M17 N5-7 1.74
M17 N6-6 1.65
M17 S1-3 1.53
M17 Dan TA040-1 1.41
M17 Dan-Yo-Mix410-1 1.82
Page 157
140
Table J.2 Acidification activity and acetaldehyde production properties of selected
L.delbrueckii spp. bulgaricus (Altay Dede, 2010)
L.delbrueckii spp.
bulgaricus Strains ∆pH at 6th hour
Acetaldehyde
production (µg/g)
MRS K1-43 1.81 15.20
MRS M2-16 1.79 11.12
MRS M2-23 1.14 -
MRS N6-2 1.70 9.08
MRS N4-3 1.66 13.05
MRS K2-1 1.73 11.54
MRS Visby-2 1.78 -